patterns of diversification amongst tropical regions
TRANSCRIPT

ORIGINAL RESEARCH ARTICLEpublished: 03 December 2014
doi: 10.3389/fgene.2014.00362
Patterns of diversification amongst tropical regionscompared: a case study in SapotaceaeKate E. Armstrong1,2,3*, Graham N. Stone2, James A. Nicholls2, Eugenio Valderrama2,3,
Arne A. Anderberg4, Jenny Smedmark5, Laurent Gautier6, Yamama Naciri6, Richard Milne7 and
James E. Richardson3,8
1 The New York Botanical Garden, Bronx, NY, USA2 Institute of Evolutionary Biology, University of Edinburgh, Edinburgh, Scotland3 Royal Botanic Garden Edinburgh, Edinburgh, Scotland4 Naturhistoriska Riksmuseet, Stockholm, Sweden5 University Museum of Bergen, Bergen, Norway6 Conservatoire et Jardin botaniques, Genève, Switzerland7 Institute of Molecular Plant Sciences, University of Edinburgh, Edinburgh, Scotland8 Laboratorio de Botánica y Sistemática, Universidad de los Andes, Bogotá DC, Colombia
Edited by:
Marshall Abrams, University ofAlabama at Birmingham, USA
Reviewed by:
Marcial Escudero, Doñana BiologicalStation - Consejo Superior deInvestigaciones Científicas, SpainZe-Long Nie, Chinese Academy ofSciences, China
*Correspondence:
Kate E. Armstrong, The New YorkBotanical Garden, 2900 SouthernBoulevard, Bronx, NY 10458, USAe-mail: [email protected]
Species diversity is unequally distributed across the globe, with the greatest concentrationoccurring in the tropics. Even within the tropics, there are significant differences in thenumbers of taxa found in each continental region. Manilkara is a pantropical genus oftrees in the Sapotaceae comprising c. 78 species. Its distribution allows for biogeographicinvestigation and testing of whether rates of diversification differ amongst tropicalregions. The age and geographical origin of Manilkara are inferred to determine whetherGondwanan break-up, boreotropical migration or long distance dispersal have shapedits current disjunct distribution. Diversification rates through time are also analyzed todetermine whether the timing and tempo of speciation on each continent coincides withgeoclimatic events. Bayesian analyses of nuclear (ITS) and plastid (rpl32-trnL, rps16-trnK ,and trnS-trnFM) sequences were used to reconstruct a species level phylogeny ofManilkara and related genera in the tribe Mimusopeae. Analyses of the nuclear data usinga fossil-calibrated relaxed molecular clock indicate that Manilkara evolved 32–29 millionyears ago (Mya) in Africa. Lineages within the genus dispersed to the Neotropics 26–18Mya and to Asia 28–15 Mya. Higher speciation rates are found in the Neotropical Manilkaraclade than in either African or Asian clades. Dating of regional diversification correlateswith known palaeoclimatic events. In South America, the divergence between Atlanticcoastal forest and Amazonian clades coincides with the formation of drier Cerrado andCaatinga habitats between them. In Africa diversification coincides with Tertiary cycles ofaridification and uplift of the east African plateaux. In Southeast Asia dispersal may havebeen limited by the relatively recent emergence of land in New Guinea and islands furthereast c. 10 Mya.
Keywords: Sapotaceae, Manilkara, pantropical, biogeography, diversification rates
INTRODUCTIONBiodiversity is unevenly distributed across the globe and is mostintensely concentrated in the tropics, particularly in wet tropicalforests, which are the most species-rich biomes on the planet.Even within the tropics, there are significant differences in thefloristic composition and the numbers of taxa found in each of thecontinental regions. It is estimated that there are c. 27,000 speciesof flowering plants in tropical Africa (Lebrun, 2001; Lebrunand Stork, 2003), compared with c. 90,000 for South America(Thomas, 1999) and c. 50,000 for Southeast Asia (Whitmore,1998). This uneven species diversity raises the fundamental ques-tion of how variation in the pattern and tempo of speciationand extinction among continents might have driven observedpatterns. Differences in diversity have been attributed to higher
extinction rates in Africa (Richards, 1973) and faster diversifica-tion in the Neotropics (Gentry, 1982). Dated molecular phylo-genies suggest speciation in response to recent climatic changes(such as aridification, e.g., Couvreur et al., 2008; Simon et al.,2009) or geological phenomena (such as mountain uplift in theNeotropics, e.g., Richardson et al., 2001; Hughes and Eastwood,2006).
Intercontinental disjunctions in distribution between tropicalregions of Africa, Asia and South America have been attributedto Gondwanan break-up (Raven and Axelrod, 1974), and/orthe degradation of the boreotropical flora (e.g., Malpighiacaeae,Davis et al., 2002b; Meliaceae, Muellner et al., 2006; Moraceae,Zerega et al., 2005). However, current studies have shown thatmany tropical groups are of more recent origin (e.g., Begonia,
www.frontiersin.org December 2014 | Volume 5 | Article 362 | 1

Armstrong et al. Diversification amongst tropical regions compared
Thomas et al., 2012), and that long distance dispersal has beenan important factor in determining the composition of moderntropical floras (Pennington et al., 2006; Christenhusz and Chase,2013). While long-distance dispersal could have occurred at anytime, it was generally believed to be the only viable explanationfor tropical intercontinental disjunctions younger than c. 33 Mya(although see Zhou et al., 2012).
Pantropically distributed taxa are excellent models for study-ing the evolution of tropical forests and regional variation indiversification rates between continents. Manilkara is a genusof trees in the Sapotaceae comprising c. 78 species distributedthroughout the tropics (30 in South and Central America, 35in Africa and 13 in Southeast Asia). This even spread and rel-atively low number of species across major tropical regionsmakes Manilkara an excellent candidate for comparison ofregional diversification patterns and testing of hypotheses forthe genesis of pantropical distributions. Here a near species-level dated phylogeny of Manilkara is presented. If the distri-bution of the genus can be explained by Gondwanan breakup, the timing of phylogenetic splits would be expected toreflect that break up 165–70 Mya (McLoughlin, 2001). Similarlyif splits resulted from the degradation of the boreotropi-cal flora, they would be expected to occur as temperaturescooled following the Early Eocene Climatic Optimum/Paleocene–Eocene Thermal Maximum (EECO/PETM), 50–55 Mya (Zachoset al., 2001). Additionally, a boreotropical origin should leavea phylogeographic signature in the form of southern lin-eages being nested within more northern ones. Therefore,lineages in South America or to the east of Wallace’s Linewould be nested within Laurasian lineages, resulting in thepattern one would expect from a retreat of the boreotropi-cal flora from the Northern Hemisphere. The onset of glacia-tion from 33 Mya induced further global cooling (Zachoset al., 2001) and the disintegration of the boreotropical flora.Therefore, ages of splits younger than c. 33 Mya would mostlikely be explained by long distance dispersal. The predictionadvanced by Gentry (1982) that diversification rates in theNeotropics have been higher than in other tropical regions is alsotested.
MATERIALS AND METHODSDNA EXTRACTION, PCR, SEQUENCING, AND ALIGNMENTEvolutionary relationships were reconstructed using nuclear(ITS) and plastid (rpl32-trnL, rps16-trnK, and trnS-trnFM)sequences. Divergence times were calculated using an ITS datasetwith 171 accessions of Sapotaceae. In total 53 of the global totalof 79 Manilkara species (67%) were included in the analysis.The dataset includes representatives of the tribe Mimusopeae aswell as multiple representatives of the tribes Isonandreae andSideroxyleae, which also belong to the subfamily Sapotoideae,in order to accommodate calibration of fossils related to thosegroups. The tree was rooted using Sarcosperma, shown in pre-vious studies to be sister to the rest of the family (Anderbergand Swenson, 2003). The plastid dataset comprised 95 acces-sions of subtribe Manilkarinae, as well as outgroups in sub-tribe Mimusopinae, plus Northia, Inhambanella, Eberhardtia,and Sarcosperma, which provided the root for the tree. See
Supplementary Table 1 for the list of taxa with voucher specimeninformation and GenBank accession numbers.
Total DNA was extracted from herbarium specimens and sil-ica gel-dried leaf samples using the Qiagen Plant DNeasy Mini Kitfollowing the manufacturer’s instructions. Amplifications of theITS region were performed using the ITS5p/ITS8p/ITS2g/ITS3p(Möller and Cronk, 1997) and ITS1/ITS4 (White et al., 1990)primer pairs. Polymerase chain reaction (PCR) was carried outin 25-µL volume reactions containing 1 µL of genomic DNA,5.75 µL sterile distilled water, 2.5 µL 2 mM dNTPs, 2.5 µL 10xNH4 reaction buffer, 1.25 µL 25 mM MgCl2, 0.75 µL of each10 µM primer, 10 µL 5 M betaine, 0.25 µL BSA and 0.25 µL of5 u/µL Biotaq DNA polymerase buffer. The thermal cycling pro-file consisted of 5 min denaturation at 95◦C, followed by 35 cyclesof 30 s at 95◦C for denaturation, 50◦C for 30 s for annealingand 72◦C for 1 min and 30 s for extension with a final exten-sion period of 8 min at 72◦C on a Tetrad2 BioRad DNA Engine.Extraction from herbarium specimens often yielded low amountsof degraded DNA and required nested PCR to amplify quan-tities sufficient for sequencing. In nested PCR the ITS5/ITS8primer pair was used in the first reaction. 1 µl of this PCRproduct was then used in a second PCR with the ITS1/ITS4primer pair and the same thermocycling profile. Further inter-nal primers, ITS2g and ITS3p, were used in place of ITS1 andITS4 when amplification using the latter primers was unsuccess-ful. Plastid markers were amplified using rpl32-trnL (Shaw et al.,2007), rps16-trnK (Shaw et al., 2007), and trnS-trnFM (Demesureet al., 1995) primer pairs as well as Manilkara-specific inter-nal primers designed for this study (Supplementary Table 2).PCR was carried out in 25 µL volume reactions containing 1 µLof genomic DNA, 15.25 µL sterile distilled water, 2.5 µL 2 mMdNTPs, 2.5 µL 10x NH4 reaction buffer, 1.25 µL 25 mM MgCl2,0.75 µL of each 10 µM primer, 0.8 µL BSA and 0.2 µL of 5 u/µLBiotaq DNA polymerase buffer. All plastid regions were amplifiedusing the rpl16 program of Shaw et al. (2005). Nested PCR wasalso performed on selected accessions using self-designed internalprimers (Supplementary Table 2). PCR products were purifiedusing Exo-SAP (GE Healthcare) according to the manufacturer’sinstructions.
Sequencing PCRs were carried out using the BigDyeTerminator v. 3.1 Cycle Sequencing Kit (Applied Biosystems) andwere purified and sequenced on an ABI 3730 sequencer at theUniversity of Edinburgh’s GenePool facility. Forward and reversesequences were assembled into contiguous sequences (contigs)and edited using the alignment software Sequencher ver. 4.7.Edited contigs were assembled and aligned by eye in MacCladever. 4.08 (Maddison and Maddison, 2008) and later in BioEditver. 7.0.5 (Hall, 2005).
Potentially informative indels in the plastid dataset were codedaccording to the simple indel coding method of Simmons andOchoterena (2000). Ambiguous alignment regions 113–118 and380–459 in rps16-trnK were excluded. Indel events in ITS wereso frequent that their coding as additional characters was deemedto be too ambiguous. Gaps were treated as missing data and allcharacters were equally weighted.
The ITS dataset was partitioned into three segments: ITS1(372 bp), 5.8 s (167 bp), and ITS2 (339 bp). Plastid regions and
Frontiers in Genetics | Evolutionary and Population Genetics December 2014 | Volume 5 | Article 362 | 2

Armstrong et al. Diversification amongst tropical regions compared
their indels were retained as separate partitions: rpl32-trnL(1130 bp + 26 indels), rps16-trnK (1134 bp + 21 indels), andtrnS-trnFM (999 bp + 13 indels).
PHYLOGENETIC ANALYSISBayesian analyses were carried out using MrBayes 3.1(Huelsenbeck and Ronquist, 2001). Two independent runsof four Metropolis Coupled Monte Carlo Markov Chains(MCMCMC) each (three heated and one cold) were run witha temperature setting of 0.10 for 8,000,000 generations, whichwas found to provide sufficient mixing between chains andconvergence between runs. Trees were sampled every 8000generations and a 10% burn-in was removed from the sampledset of trees leaving a final sample of 900 trees, which were used toproduce a majority rule consensus tree. Convergence of modelswas determined to have occurred when the standard deviationof split frequencies for two runs reached 0.01 (Ronquist et al.,2005). Appropriate burn-in and model convergence were checkedby visual confirmation of parameter convergence of traces inTracer v.1.5 (Rambaut and Drummond, 2009). Clade supportvalues are posterior probabilities (pp); pp values of 100–95% aretaken to indicate strong support, values of 94–90% moderatesupport, and values between 89 and 55% weak support for nodes,respectively. The output tree files were visualized in FigTreev.1.3.1. The majority rule consensus tree was used to determinethe monophyly of key clades used to define calibration points inthe dating analysis.
Plastid data were not included in the subsequent BEAST anal-ysis because they were not informative enough to discern betweenalternative hypotheses and because fewer taxa were sampled.Additionally, hard incongruence was demonstrated between thetopologies reconstructed in MrBayes from the nuclear and plastiddatasets (see Supplementary Material Section on chloroplast cap-ture, and Supplementary Figure 1). Therefore, the two datasetswere not combined and only nuclear data was used for divergencetime analysis.
FOSSIL CALIBRATIONSideroxyleae pollen from the Ypresian (47.8–56 Mya) of England(Gruas-Cavagnetto, 1976) was used to constrain the minimumage of the Sideroxyleae stem node (node B in Figure 1). A lognormal prior was used to constrain the age of this node (off-set: 52.2 Ma, mean: 0.001). A mean of 0.001 was chosen so that95% of the probability is contained in an interval between themidpoint and the upper boundary of the Ypresian (52.2–55.6Mya). A Mid-Eocene (37.2–48.6 Mya) Tetracolporpollenites pollengrain from the Isle of Wight was used to constrain the mini-mum age of the node for the tribe Mimusopeae. This pollen grainwas described by Harley (1991) and determined to closely resem-ble Tieghemella heckelii (a monotypic genus in the Mimusopeae).Harley suggested (pers. comm. 2010) that it would be appropri-ate to err on the side of caution with the identification and usethe fossil to constrain the age of the tribe Mimusopeae ratherthan the genus itself. This fossil was, therefore, used to constrainthe age of the crown node of Mimusopeae (node D in Figure 1:offset: 42.9 Mya, mean: 0.095). A mean of 0.095 was chosen sothat 95% of the probability was contained in an interval between
the midpoint (42.9) and the upper boundary of the mid Eocene(42.9–48.6 Mya). The final calibration point is based on a seriesof Oligocene (23–33.9 Mya) fossil leaves from Ethiopia (Jacobset al., 2005). Pan described these specimens as Sapoteae sp. andsuggested possible placement in either Manilkara or Tieghemella(pers. comm. 2010) based on the occurrence of stoma surroundedby fimbricate periclinal rings, a character present in these gen-era, but absent from the related genera Autranella and Mimusops.Although they are both members of the Tribe Mimusopeae,Manilkara and Tieghemella are not sister taxa, and placing the fos-sil at the node of the most recent common ancestor (the entireTribe Mimusopeae) seemed illogical for such a young date, whena 45 Mya fossil pollen grain of cf. Tieghemella was a better fit forthe same node. Instead, the fossil was alternatively placed at theManilkara crown node (node Q in Figure 1) and on the node ofthe split between Tieghemella and Autranella (node I in Figure 1),in order to determine whether placement on either genus made asignificant difference to age estimates using a prior age estimatewith an offset of 28 Mya, mean: 0.1. A mean of 0.1 was cho-sen so that 95% of the probability was contained in an intervalbetween the midpoint and the upper boundary of the Oligoceneat (28-33.9 Mya).
DATING ANALYSISThe software package BEAST v.1.7.5 (Drummond and Rambaut,2007) was used to analyze divergence times in the ITS dataset. Anxml input file was created in BEAUti v.1.7.5. Substitution mod-els were unlinked across partitions, but clock models and treetopologies were kept on the linked default setting. Four taxon setsper analysis were generated in order to define nodes for placementof fossil calibration points. They were based on known mono-phyletic clades from previous analyses and were constrained to bemonophyletic.
The GTR + I + G model was applied to each partition. Themean substitution rate was not fixed and base frequencies wereestimated. Following support for a molecular clock in these datausing MrBayes, an uncorrelated log-normal model was selected toallow for relaxed clock rates and rate heterogeneity between lin-eages. A speciation: birth-death process tree prior was used witha randomly generated starting tree. The most recent commonancestor (MRCA) node age priors were set to define calibrationpoints using taxon sets. All other priors were left at default settingsthat were either uniform or gamma-distributed. Posterior distri-butions for each parameter were estimated using MCMCMC runfor 40,000,000 generations, with parameters logged every 5000generations, giving 8000 samples per run. The BEAUti xml filewas executed in BEAST v.1.7.5. Two separate analyses were runand the output log files were reviewed in Tracer v.1.5 (Rambautand Drummond, 2009) to check for convergence between runsand adequate effective sampling sizes (ESS) of >200 (Drummondet al., 2007). The tree files from the two runs were combinedin LogCombiner v.1.7.5 (Drummond and Rambaut, 2007) witha conservative burn-in of 4000 generations. The combined treefiles were input into TreeAnnotator v.1.5.3 (Drummond andRambaut, 2007). The Maximum Clade Credibility (MCC) treewas selected with mean node heights; this option summarizesthe tree node height statistics from the posterior sample with
www.frontiersin.org December 2014 | Volume 5 | Article 362 | 3

Armstrong et al. Diversification amongst tropical regions compared
21
Labourdonnaisia madagascariensis
Manilkara suarezensis
Manilkara sansibarensis
Vitellariopsis cuneata
Manilkara letouzei
Labramia ankaranaensis
Letestua durissima
Manilkara littoralis
Manilkara valenzuelana
Manilkara lososiana
Manilkara paraensis
Manilkara mochisia (a)
Mimusops lecomtei
Manilkara subsericea
Autranella congolensis
Manilkara vitiensis
Manilkara bidentata (a)
Manilkara obovata (b)
Manilkara zenkeri
Manilkara bidentata (c)
Manilkara capuronii
Manilkara discolor
Manilkara bella
Manilkara mayarensis
Manilkara salzmanni
Manilkara perrieri
Labourdonnaisia revolutaFaucherea manongarivensis
Manilkara multinervis
Manilkara welwitschii
Baillonella toxisperma
Manilkara hoshinoi
Manilkara rufula
Eberhardtia tonkinensis
Manilkara decrescens
Labramia mayottensis
Faucherea sp
Manilkara cavalcantei (b)
Manilkara sp 2
Sarcosperma laurinum
Manilkara pelligriniana
Mimusops obovata
Manilkara jamiqui
Mimusops caffra
Manilkara longifolia
Mimusops kummel
Manilkara dawei
Mimusops membranacea
Manilkara concolor
Faucherea parvifolia
Manilkara maxima
Manilkara huberi (a)
Mimusops zeyheri
Tieghemella heckelii
Manilkara bidentata (b)
Manilkara gonavensis
Manilkara mabokeensis
Manilkara udoido
Faucherea thouvenotii
Vitellaria paradoxa
Manilkara elata
Manilkara sideroxylon
Manilkara koechlinii
Vitellariopsis dispar
Manilkara sahafarensisManilkara butugi (b)
Manilkara chicle
Manilkara smithiana
Manilkara staminodella
Manilkara pleeana
Manilkara triflora
Labramia costata
Manilkara inundata
Manilkara zapota
Manilkara fouillayana
Mimusops perrieri
Manilkara lacera (a)
Capurodendron androyenseNorthia seychellana
Manilkara bovinii
Mimusops comorensis
Manilkara bequaertii
Labramia louvelii
Manilkara huberi (b)
Mimusops coriaceaMimusops sp
Labourdonnaisia calophylloides
Manilkara fasciculata
Manilkara hexandra
Manilkara dissecta
Manilkara sp 1Manilkara kauki
Vitellariopsis marginata
Eberhardtia aurata
Manilkara cuneifolia
Manilkara cavalcantei (a)
Mimusops elengi
Vitellariopsis kirkii
29
26
6
18
107
27 5
6
30
15
28
4
10
22
15
43
32
62
31
39
9
8
10
15
35
10
23
12
6
3126
Isonandreae & Inhambanella
Xantolis/EnglerophytumSideroxyleae
LO
N
P
T2
T1
T3
U2
U1
J3J2
J1
X3
X1
X2
Y1
Y2
M
X4
D
A
AfricaMadagascar
Sahul shelf (Malesia east of Wallace’s Line & Pacific Islands)
East Asia (including Indochina)Sunda shelf (Malesia west of Wallace’s Line)
South Asia
North America (Central America & Caribbean)South America
Middle EastSeychelles
97%
99%
97%
96%
99%
97%
99%
99%
91%
81%
71%
86%
99%
96%
52%
C
E
F
H
I
J
G
K
W
X
Y
V
R
S
U
T
2
051015202530354045505560657075 MYA
Cretaceous Paleocene Eocene Oligocene Miocene Plio Ple
26-18 Ma16-15 Ma 27-23 Ma 6 Ma
28-15 Ma9-4 Ma
4 Ma
22-9 Ma
5 Ma
32-30 Ma
Q
B
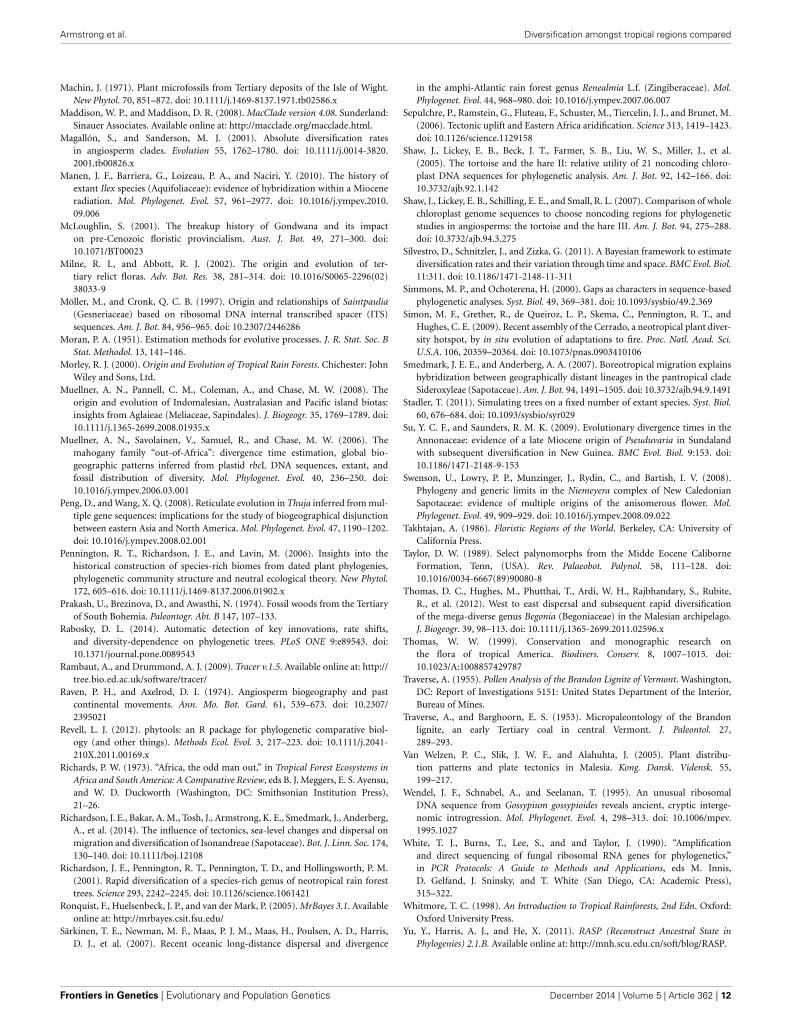
FIGURE 1 | Maximum clade credibility chronogram of the ITS dataset.
Dashed lines indicate branches which lead to nodes with a posteriorprobability of <0.95. Mean ages are given for profiled nodes. Node barsindicate 95% HPD age ranges. Lettered nodes are discussed in the text.Stars indicate the placement of fossils. Lineages are colored according totheir distribution: Yellow, Africa; Green, Madagascar; Blue, Asia; Pink,South America; Orange, Central America and the Caribbean. Geological
epochs are indicated in a scale at the bottom of the chronogram.Outgroups have been reduced to gray bars at the base of thechronogram. Ten regions were coded in the ancestral area reconstructionas illustrated in the map and legend. Pie charts represent the percentagelikelihood of the ancestral state at the selected node. Map inset depictsthe timing and direction of long-distance dispersal events reflected in thechronogram.
Frontiers in Genetics | Evolutionary and Population Genetics December 2014 | Volume 5 | Article 362 | 4

Armstrong et al. Diversification amongst tropical regions compared
the maximum sum of posterior probabilities. The output file wasvisualized in FigTree v.1.3.1.
ANCESTRAL AREA RECONSTRUCTION IN RASPAncestral area states were reconstructed in RASP (ReconstructAncestral State in Phylogenies; http://mnh.scu.edu.cn/soft/blog/RASP) software that implements Bayesian Binary MCMC (BBM)time-events curve analysis (Yu et al., 2011) and allows multiplestates to be assigned to terminals. BBM suggests possible ances-tral ranges at each node and also calculates probabilities of eachancestral range at nodes. The analysis was performed using theMCC tree generated in BEAST as an input file, with 5,000,000cycles, 10 chains, sampling every 100 cycles, with a temperaturesetting of 0.1 and with the maximum number of areas set to fourfor all nodes. The root node was defined a priori as Asian; becausethe Asian taxa Sarcosperma and Eberhardtia form a grade withinwhich the rest of the family is nested, this is the most likely statefor the crown node of the family.
Areas are coded according to continent, based predominantlyon tectonic plate margins and then on floristic regions (Figure 1).In Southeast Asia, the Sahul and Sunda Shelves (which mark theboundary between continental Asia and Australia-New Guinea)were coded as separate states within the Malesia floristic region,which stretches from the Isthmus of Kra on the Malay Peninsulato Fiji (Takhtajan, 1986; Van Welzen et al., 2005). East Asia isdefined as being east of the Himalayas and south as far as theMalay Peninsula, with a predominantly Indo-Chinese flora. SouthAsia is delineated by the margin of the Indian subcontinent.The countries of Iran, Turkey and the Arabian Peninsula sup-port a drier Irano-Turanian flora (Takhtajan, 1986) and were,therefore, designated as being part of the Middle-Eastern region.The remaining regions (the Seychelles, Madagascar, Africa andNorth and South America) are all on separate continental tec-tonic plates and are floristically unique from one another (seeSupplementary Table 1 for species-specific area codes).
DIVERSIFICATION RATE METHODSA separate ITS lineage through time (LTT) plot dataset (here-after referred to as ITS LTT) was used to compare diversifica-tion rates within Manilkara. Because the genus was found tobe paraphyletic, with the Southeast Asian M. fasciculata clade(P in Figure 1) being more closely related to Labourdonnaisiaand Faucherea, this small clade was excluded, leaving only themonophyletic lineage of Manilkara s.s. (clade Q in Figure 1)for analysis. Additionally, only one individual per species wasincluded. The simple diversification rate estimators of Kendall(1949) and Moran (1951) were calculated for the African,Neotropical and Asian clades, where the speciation rate lnSR =[ln(N)−ln(N0)]/T (N = standing diversity, N0 = initial diversity,here taken as = 1, and T = inferred clade age). This is a pure-birthmodel of diversification with a constant rate and no extinc-tion (Magallón and Sanderson, 2001). Another model that doesnot assume constant rates of speciation and extinction throughtime within lineages was applied using BAMM (Bayesian Analysisof Macroevolutionary Mixtures; Rabosky, 2014). BAMM usesa reversible-jump Markov Chain Monte Carlo to explore shiftsbetween macroevolutionary regimes, assuming they occur across
the branches of a phylogenetic tree under a compound Poissonprocess. Each regime consists of a time-varying speciation rate(modeled with an exponential change function) and a constantrate of extinction. The BAMM analysis used the BEAST MCCtree, but because not all species were sampled, it was necessaryto specify to which lineage each of the missing taxa belonged (i.e.,to which species it was most closely related based on morpho-logical similarity). The results of the analysis with adjustments toaccount for missing taxa were not different from those assum-ing complete taxon sampling. Two MCMC simulations were runwith 5,000,000 generations, sampling every 1000, and discardingthe first 10% as burn-in. Appropriate priors for the ITS LTT phy-logeny, convergence of the runs and effective sampling size wereeach estimated using the BAMMtools (Rabosky, 2014) package inR (R development team).
LTT plots were generated using phytools (Revell, 2012) in Rfor 1000 trees sampled through the post-burn-in (20%) poste-rior distribution generated by BEAST (see above for details). Themedian and 95% highest posterior density (HPD) were estimatedfor the ages of each number of lineages in each plot. To com-pare the observed LTT plots with the predictions of a model withconstant diversification rates, 1000 trees were simulated usingthe mean speciation and extinction rates estimated by BAMMin TreeSim (Stadler, 2011). Simulations used the age of the mostrecent common ancestor of each of the 1000 observed trees andthe current number of species per plot. LTT plots were drawnfor the trees including all species of Manilkara s.s. and to exam-ine region-specific patterns for pruned lineages that included onlythose species from each of Africa, the Neotropics and Asia.
RESULTSNODE AGESMean ages with 95% HPD confidence intervals for key nodesare reported in Table 1. The MCC tree from the BEAST analysis(Figure 1) resolves the mean crown age of the tribe Mimusopeaeas 43 Mya (HPD 44–42 Mya; node D), in the Mid Eocene. Themean age of subtribe Manilkarinae is estimated to be 32 Mya(HPD 36–29 Mya; node K) and the genus Manilkara is resolvedas 29 Mya (HPD 32–28 Mya; node Q), both having originatedduring the Oligocene. Results also reveal that cladogenesis andinter-continental dispersal (see below and Figures 1, 3) withinManilkara occurred from the Oligocene through the Miocene—and most intensively from the mid-late Miocene.
ANCESTRAL AREA RECONSTRUCTION AND INTERCONTINENTALDISPERSAL EVENTSAncestral area inferences and likelihood support are given inTable 1 and Figure 1, which also indicates the age and direc-tion of inferred dispersal events. The tribe Mimusopeae, sub-tribe Manilkarinae and the genera Manilkara, Labramia, andFaucherea/Labourdonnaisia are all inferred to have African ances-try (Figure 1).
Following its origin in Africa during the Oligocene 32Mya (HPD 36–29; node K) and subsequent diversification 29Mya (HPD 32–28 Mya; node Q), Manilkara s.s. spread vialong distance dispersal to Madagascar twice, Asia once andthe Neotropics once during the Oligocene–Miocene. Both the
www.frontiersin.org December 2014 | Volume 5 | Article 362 | 5

Armstrong et al. Diversification amongst tropical regions compared
Table 1 | Summary of clade support values, node ages and ancestral areas from Figure 1.
Node Posterior Clade Mean age and Ancestral Area Epoch
probability 95% HPD in Mya (likelihood %)
A 1 Sapotaceae 107 (126−88) East Asia 99 Cretaceous
B 1 Sideroxyleae 62 (73−52) Africa 58 Cretaceous-Paleocene
C 0.99 Isonandreae/Inhambanella/Mimusopeae 52 (58−48) Africa 99 Paleocene-Eocene
D 1 Mimusopeae 43 (44−42) Africa 99 Eocene
E 0.99 Baillonella/Vitellaria/Vitellariopsis 31 (39−23) Africa 99 Eocene-Oligocene
F 0.99 Vitellariopsis 2 (4−0.5) Africa 99 Pliocene
G 0.85 Mimusopeae subclade 1 39 (43−35) Africa 99 Eocene
H 0.67 Mimusops/ Tieghemella/Autranella 35 (40−30) Africa 99 Eocene-Oligocene
I 0.68 Tieghemella/Autranella 31 (38−23) Africa 99 Eocene-Oligocene
J 0.99 Mimusops 22 (28−17) Africa 97 Miocene
K 0.99 Manilkarinae 32 (36−29) Africa 96 Eocene-Oligocene
L 0.44 Labr./Fauch./Labourd./ sm. Asian Manilkara 30 (35−26) Madagascar 81 Eocene-Oligocene
M 0.99 Labramia 6 (10−3) Madagascar 99 Miocene-Pliocene
N 0.92 Faucherea/Labourdonnaisia/Manilkara 28 (33−23) Madagascar 91 Oligocene
O 0.99 Faucherea/Labourdonnaisia 10 (14−7) Madagascar 99 Miocene-Pliocene
P 0.99 Small Asian Manilkara 15 (20−10) Sahul Shelf 90 Miocene
Q 1 Manilkara s.s. 29 (32−28) Africa 96 Oligocene
R 0.98 Manilkara s.s. subclade 1 26 (30−22) Africa 86 Oligocene-Miocene
S 0.99 Neotropical Manilkara 18 (22−14) South America 71 Miocene
T 0.90 Central American and Caribbean Manilkara 15 (20−13) North America 95 Miocene
U 0.99 South American Manilkara s.s. 12 (16−9) South America 93 Miocene
V 0.77 Small African Manilkara 21 (27−15) Africa 97 Oligocene
W 0.99 Manilkara s.s. subclade 2 27 (30−23) Africa 97 Oligocene
X 0.99 Large African Manilkara 15 (18−11) Africa 99 Miocene
Y 0.99 Asian Manilkara s.s. 23 (27−19) Sahul Shelf 52 Oligocene-Miocene
Faucherea/Labourdonnaisia/Manilkara clade (N) (28 Mya; HPD33–23 Mya) and the genus Mimusops (clade J) (22 Mya; HPD28–17 Mya) also exhibit a similar pattern, having originated inAfrica and later dispersed to both Madagascar and Asia duringthe Miocene.
Long-distance dispersal from Africa to Madagascar and thesurrounding islands has occurred on multiple occasions in thetribe Mimusopeae: twice in Manilkara s.s. (X3 and X4, 8–4 Mya);at least once for the clade comprising Labramia, Faucherea, andLabourdonnaisia between 32 Mya (HPD 36–29; node K) and 30Mya (HPD 35–26 Mya; node L); and twice in Mimusops between22 Mya (HPD 28–17 Mya; node J) and 9 Mya (HPD 13–5 Mya;node J1), as well as 5 Mya (HPD 2–6 Mya; node J3).
The Neotropical Manilkara clade (S) is also derived from anAfrican ancestor, which dispersed to South America during theOligocene–Miocene between 26 Mya (HPD 30–22 Mya; node R)and 18 Mya (HPD 22–14 Mya; node S). From South America,further dispersal occurred to Central America 16–15 Mya andthroughout the Caribbean islands starting from 15 to 10 Mya.
Asia was reached by three independent dispersal events withinthe tribe Mimusopeae. Manilkara s.s. reached Asia from Africabetween 27 Mya (HPD 30–23 Mya; node W) and 23 Mya (HPD27–19 Mya; node Y), while Mimusops did the same 8–6 Mya(node J2). The Manilkara fasciculata clade reached Asia fromMadagascar between 28 (HPD 33–23 Mya; node N) and 15 Mya(HPD 20–10 Mya; node P).
DIVERSIFICATION RATESNet diversification rates (lnSR) differed somewhat betweenregions, ranging from a lowest mean value of 0.06 (0.05–0.07) forthe Asian lineage, through 0.10 (0.09–0.10) for the African lineageto a maximum of 0.15 (0.12–0.19) for the Neotropical lineage.Despite sampling models with up to five different macroevolu-tionary regimes, BAMM analysis selected models without shiftsbetween macroevolutionary regimes along the Manilkara s.s. phy-logeny, with the highest posterior probability obtained for zeroshifts models, i.e., a single, constantly varying net diversificationrate throughout the history of the genus (Figure 2). Bayes Factorcomparison, following the criteria of Kass and Raftery (1995)provided unsubstantial support (1.68) for the zero shifts mod-els over the models including shifts between macroevolutionaryregimes.
LTT plots are presented in Figure 3, for all regions (Figure 3D)and for the pruned African, Asian and Neotropical lineages(Figures 3A–C respectively). The figure shows both observedrates, and rates predicted for the same numbers of lineagesevolving under a constant net diversification rate process (i.e.,constant speciation and extinction rates, estimated using BAMMfor the genus s.s.). None of the observed LTT patterns divergesignificantly from those predicted assuming a constant diversi-fication rate. The analyses including all Manilkara s.s. lineages(Figure 3D) and only the Neotropical lineage (Figure 3C) bothshow a good fit between observed patterns and those predicted
Frontiers in Genetics | Evolutionary and Population Genetics December 2014 | Volume 5 | Article 362 | 6

Armstrong et al. Diversification amongst tropical regions compared
0 1 2 3 4 5
# Shifts between macroevolutionary regimes
Pos
terio
r pro
babi
lity
0.0
0.2
0.4
0.6
0.8
1.0
FIGURE 2 | Posterior probability of models with different number of
shifts between macroevolutionary regimes considered in BAMM. Thebest models for Manilkara s.s. indicate no significant shifts in diversification.
under a constant diversification rate. In contrast, African lineages(Figure 3A) show a trend toward reduced diversification ratesfrom 25 to 12 Mya, followed by an increase in diversification ratesto levels matching those in the Neotropics from 12 Mya to thepresent. The Asian lineage shows low and decreasing diversifica-tion rates toward the present. While the Asian pattern is derivedfrom just eight species, and thus any observed pattern must beinterpreted with caution, it is striking that Asia produced no newlineages during the last 7 Mya, at a time when Africa and theNeotropics were both showing rapid diversification.
DISCUSSIONORIGIN OF MANILKARAThe tribe Mimusopeae evolved ∼52 Mya (HPD 58–48 Mya; nodeC) and began to diversify 43 Mya (HPD 44–32 Mya; node D)during the Eocene when global climates were warmer and wetterand a megathermal flora occupied the northern hemisphere. Thisage estimate also coincides with the first occurrence of putativeMimusopeae fossils recorded from North America and Europe,e.g., Tetracolporpollenites brevis (Taylor, 1989), and Manilkarapollen (Frederiksen, 1980) in addition to the Tetracolporpollenitessp., pollen grain (Harley, 1991), used in this study, which givefurther weight to the hypothesis that the tribe Mimusopeaewas present in the boreotropics and may have originated there.Previous studies (Smedmark and Anderberg, 2007) implicate thebreak-up of the boreotropics in creating intercontinental disjunc-tions in the tribe Sideroxyleae and data from the present studyare consistent with this hypothesis. Smedmark and Anderberg’s(2007) estimate for the age of Sideroxyleae was 68 Mya and inthis study the crown node age is reconstructed as being 62 Mya(HPD 73–52 Mya; node B).
The subtribe Manilkarinae evolved 39 Mya (HPD 43–35Mya; node G), consistent with the hypothesis that it arose lateduring the existence of the boreotropics. Diversification began
32 Mya (HPD 36–29 Mya; node K), around the time thatglobal cooling and the widening Atlantic were breaking up theboreotropics. Hence migration toward the equator as the cli-mate in the northern hemisphere cooled might have causedor promoted diversification. This transition from the northernhemisphere to equatorial latitudes is also reflected in the putativeManilkarinae fossil record, where during the Oligocene, there isstill a strong representation of northern fossils [e.g., Isle of Wight,UK (Machin, 1971), Vermont, USA (Traverse and Barghoorn,1953; Traverse, 1955) and Czechoslovakia (Prakash et al., 1974)],but fossils also begin to appear in Africa (e.g., Sapoteae sp.leaves in Ethiopia, Jacobs et al., 2005). Further cooling and arid-ification during the Oligocene coincides with diversification ofManilkarinae into genera and may have been a causal factor in thisdiversification. Alternatively, Manilkarinae may have originatedin Africa, as suggested by the ancestral area analysis. However,the analysis cannot account for southward climate shifts and themodern absence of the group from higher latitudes.
Manilkara is nested within a grade of other representativesof the tribe Mimusopeae, which is predominantly composedof African taxa (Mimusops, Tieghemella, Autranella, Baillonella,Vitellaria, and Vitellariopsis) and this suggests that the genus mayhave had its origin there. In the ancestral area reconstruction bothManilkara and the subtribe Manilkarinae are resolved as having a96% likelihood of an African origin, and the tribe Mimusopeae isreconstructed as having a 99% likelihood of originating in Africa.As such, there is very strong support for an African ancestry forthe genus Manilkara, the subtribe Manilkarinae and the tribeMimusopeae.
THE ORIGIN OF MANILKARA’S PANTROPICAL DISTRIBUTIONIntercontinental disjunctions in Manilkara are too young (27–4Mya) to have been caused by Gondwanan break-up, which wouldhave had to occur before 70 Mya. Manilkara is also too young forits pantropical distribution to be the result of migration throughthe boreotropics, which would have had to occur between 65 and45 Mya, after which the climate would have been too cool for trop-ical taxa to cross the North Atlantic Land Bridge, even thoughthis might have persisted until ∼33 MYA (Milne and Abbott,2002). The most likely period for migration of tropical taxa bythis route was during the PETM/EECO, 55–50 Mya (Zachos et al.,2001). Furthermore, a boreotropical origin should leave a phy-logeographic signature in the form of southern lineages beingnested within more northern ones. However, South Americanlineages are not nested within Central American lineages, andneither are those southeast of Wallace’s line nested within thoseto the northwest. With these vicariance-based explanations notsupported, Manilkara’s disjunct pantropical distribution couldonly have resulted from long-distance dispersal from Africa toMadagascar, Asia and the Neotropics. This has been demon-strated for numerous other groups distributed across the tropics,e.g., Begonia (Thomas et al., 2012) and Renealmia (Särkinen et al.,2007).
Manilkara has fleshy, sweet fruit ranging in size from 1.5 to10 cm, which are consumed by a wide variety of animals. Withseeds that are too bulky for wind dispersion, it is more likelythat long distance dispersal could have been achieved through
www.frontiersin.org December 2014 | Volume 5 | Article 362 | 7

Armstrong et al. Diversification amongst tropical regions compared
12
510
2050
Time
N
Africa
25 20 15 10 5 0
12
510
2050
Time
N
Asia
35 30 15 10 5 0
12
510
2050
Time
N
Neotropics
35 30 10 5 0
12
510
2050
Time
N
All lineages
35 25 20 15 10 5 0
Num
ber o
f lin
eage
s
Time (Million years before present)
A B
C D
FIGURE 3 | LTT plots for lineages that included only those species
from each of Africa (A), Asia (B), the Neotropics (C), and all species
of Manilkara s.s. (D). Each plot shows the median and 95% HPD of theages for each number of lineages in solid and dashed lines, respectively.The lines for observed trees are shown in blue and for the trees
simulated under a constant diversification process in red. The thinnerblue lines correspond to each of the 1000 observed trees. The 95%HPD intervals show major overlap in all plots but non-significant patternssuggest lower diversification rates in part of the histories of African andAsian lineages.
transport in the gut-contents of birds or by transoceanic rafting inlarge mats of vegetation. Houle’s (1998) study demonstrated thatduring the Miocene, intercontinental rafting could have occurredin less than 2 weeks on the North and South Equatorial currents.
REGIONAL DIVERSIFICATION IN MANILKARAWithin the Neotropics, Manilkara first colonized South America,as indicated in the reconstruction of the ancestral distributionof clade S. The South American clade (U) is divided into twosubclades, which correspond to contrasting regional ecologies,with one clade (U1) comprised of Amazonian species and theother (U2) of Atlantic coastal forest species. The only incon-sistency in this geographic pattern is the second accession ofManilkara cavalcantei (b), an Amazonian species that the analysisplaces in the Atlantic coastal forest clade. However, in the plas-tid tree (Supplementary Figure 1) this accession is resolved in astrongly supported (0.99 pp) Amazonian clade with M. bidentata,M. huberi, and M. paraensis. The phylogenetic split between thesetwo regions occurred during the Mid-Miocene (12–10 Mya),when the Andes were being elevated (Gregory-Wodzicki, 2000;Graham, 2009) and drainage systems in the Amazon basin beganto shift eastwards.
Atlantic coastal species in clade U2 and Amazonian speciesin clade U1 are geographically separated by the dry biomes of
the Cerrado and the Caatinga, as well as the higher relief of theBrazilian shield. Simon et al. (2009) and Fritsch et al. (2004)found that the origin of dry-adapted Cerrado Leguminosae andMelastomataceae lineages span the Late Miocene to the Pliocene(from 9.8 to 0.4 Mya), broadly coinciding with the expansion ofC4 grass-dominated savanna biomes. However, it is likely that adry environment would have been present just prior to this timeto allow for adaptation of these groups to the new biome. Suchtiming is exhibited by the Microlicieae (Melastomataceae), wherethe crown node is 9.8 Mya, and the stem node is 17 Mya (Fritschet al., 2004). Manihot (Euphorbiacae) species of this biome beganto diversify from 6.6 Mya (Chacón et al., 2008). Likewise, a phy-logenetic study of Coursetia (Leguminosae) (Lavin, 2006) revealsthat species which inhabit the dry forest of the Brazilian Caatingaare 5–10 My old. This suggests that the Cerrado and Caatingacould have been in existence, at least in part, by the time the SouthAmerican Manilkara subclades U1 and U2 diverged ca.12 Mya,and their development may have driven the geographical split inthis South American lineage of Manilkara.
The Central American/Caribbean clade (T) originated fol-lowing dispersal from South America 16–15 Ma, and then splitgeographically into a Central American subclade (T1, 6 Ma), anda Caribbean subclade (T2, 11 Ma). The only exception to thisgeographical structure is the single Central American species,
Frontiers in Genetics | Evolutionary and Population Genetics December 2014 | Volume 5 | Article 362 | 8

Armstrong et al. Diversification amongst tropical regions compared
M. chicle (T3), which is nested in the Caribbean clade, suggest-ing a Pliocene dispersal (2 Ma) back to the continent. Theseage estimates place the New World spread of Manilkara prior tothe estimated age of the closing of the Isthmus of Panama ∼3.5Ma (Coates and Obando, 1996), although recent studies (Farriset al., 2011) indicate that the Isthmus may have closed much ear-lier, in which case Manilkara may have taken an overland route.Overwater dispersal between Central and South America has beendemonstrated in numerous other plant taxa (Cody et al., 2010).
African Manilkara species are resolved in two clades, both ofwhich are Oligo-Miocene in age. The main African/Madagascanclade (X) is estimated to be 15 My old (HPD 18–11 Mya), andthe smaller clade (V) is 21 My old (HPD 27–15 Mya). Africahas been affected by widespread aridification during the Tertiary(Coetzee, 1993; Morley, 2000). The response by Manilkara tothis changing climate could have been migration, adaptationor extinction. A study of the rain forest genera Isolona andMonodora (Annonaceae) found that throughout climatic cycles,taxa remained in remnant pockets of wet forest (Couvreur et al.,2008). They are, therefore, an example of a group that migratedor changed its distribution to track wetter climates. Another studyof the genus Acridocarpus (Malpighiaceae) (Davis et al., 2002a)indicated an east African dry forest adapted lineage nested withina wet forest lineage. The dry adapted lineage was dated to peri-ods of Oligo-Miocene aridification, and is, therefore, an exampleof a wet forest lineage, which has adapted to changing envi-ronmental conditions rather than becoming restricted to areasof favorable climate. The timing of diversification and evolu-tion of dry-adapted species vs. wet-restricted species in the threeAfrican Manilkara clades suggests a combination of both scenar-ios. The split between the African clades occurred between 29Mya (HPD 32–28 Mya; node Q) and 26 Mya (HPD 30–22 Mya;node R), during a period of dramatic continent-wide cooling,which fragmented the Eocene coast to coast rain forest, poten-tially isolating the three lineages. A second wave of diversificationwithin the main African/Madagascan clade (X) coincides with theMid-Miocene climatic optimum 17–15 Mya, when global temper-atures warmed (Zachos et al., 2001). During the same period thecollision of the African and Eurasian plates closed the Tethys Sea,instigating further aridification. The resulting drier and warmerclimates caused the spread of savannas and the retraction of rainforest, as evidenced by an increase in grass pollen during thisperiod (Morley, 2000; Jacobs, 2004). Nonetheless, cladogenesisin the main African/Madagascan clade (X) gained pace from theMid-Miocene onwards. In particular, a third wave of diversifica-tion from rain forest into drier shrubland environments in easternand southern Africa occurred subsequent to the main uplift of theTanganyikan plateau in the East African Rift System ca. 10 Mya,which had a significant impact on further regional aridification(Lovett and Wasser, 1993; Sepulchre et al., 2006) (Table 1).
Clade X is predominantly composed of Guineo-Congolianrain forest species. This is almost exclusively the case in subcladeX1, aside from the Madagascan taxa, which are also rain forestspecies. However, within subclade X2, there is a transition fromwet to dry environments. The sole Madagascan taxon in this lin-eage (M. sahafarensis) is a dry, deciduous forest species. The fourdry, eastern-southern African taxa in subclade X2 (M. discolor,
M. sansibarensis, M. butugi, M. cuneifolia) all evolved between 8and 5 Mya subsequent to the main uplift of the East African RiftSystem. The ancestor of the smaller African clade composed ofM. mochisia and M. concolor also diversified into these two dry-adapted eastern/southern species at the same time 6 Mya (HPD10–2 Mya). Hence, some African Manilkara lineages adapted to adrying climate, while others remained in their ancestral rain foresthabitat.
Within the main Asian clade of the plastid phylogeny (Yc1,Supplementary Figure 1), the Indian species Manilkara rox-burghiana is sister to the other species and the two Fijian speciesare among the most derived, consistent with the hypothesis thatthe founding dispersal event was from Africa to India with sub-sequent spread eastward into Malesia. However, ancestral areareconstruction of the ITS data (node Y, Figure 1) suggests thatmigration within Asia was from east to west (Sahul Shelf to SundaShelf) 23 Mya (HPD 27–19 Mya). Dated phylogenies also indi-cate that many other angiosperm groups have crossed Wallace’sLine from the late Miocene onwards: Pseuduvaria (Annonaceae)(Su and Saunders, 2009), Aglaieae (Meliaceae) (Muellner et al.,2008), at least four separate lineages of Begonia (Begoniaceae)(Thomas et al., 2012) and Cyrtandra (Gesneriaceae) (Cronk et al.,2005). In Sapotaceae four lineages of Isonandreae have migratedfrom west to east across Wallace’s Line (Richardson et al., 2014),whereas evidence from the tribe Chrysophylloideae suggestsrecent movement in the opposite direction, from Sahul to SundaShelf (Swenson et al., 2008). The two youngest (9 Mya) Asianspecies (M. vitiensis and M. smithiana) are both Fijian. The old-est land available for colonization in Fiji is between 14 and 5 Mya(Johnson, 1991; Heads, 2006) hence, the age of these two Fijiantaxa coincides with the first emergence of land in the archipelago.
DIVERSIFICATION RATES OF MANILKARA IN DIFFERENT PARTS OF THETROPICSThe BAMM analysis did not support significant rate variationamong lineages or regions in Manilkara s.s. Despite apparent vari-ation in regional patterns revealed by LTT plots (Figure 3), thedata most strongly support a model with a single net diversifica-tion rate throughout the genus. Trends within the data for specificregions only suggest departure from a constant rate model in Asiaand Africa. Given that observed patterns do not exceed the 95%confidence intervals for the constant rate model for either region,these trends must be considered with caution. This is particularlytrue for Asia, for which the pattern was derived from only eightspecies. Because sensitivity and statistical power of methods fordetection of shifts in diversification rates may correlate positivelywith the number of species in the clade (Silvestro et al., 2011),rate shifts in clades with a small number of species (as in Asia forManilkara s.s.) may not have been detected by the methods usedhere (a potential type two error). A simulation study would berequired to examine the impact of taxon number on type twoerror rates in these analyses. Similarly, small numbers of taxamay be more likely to generate apparent trends through stochas-tic effects, and these could also generate the apparent two-phasepattern of low, and then rapid, diversification in African lineages.
Taken at face value, net diversification rates and LTT plotsboth suggest a trend for more rapid diversification in Neotropical
www.frontiersin.org December 2014 | Volume 5 | Article 362 | 9

Armstrong et al. Diversification amongst tropical regions compared
and African lineages than in Asian ones. The timing of rapidNeotropical diversification falls within the time frame of Andeanuplift (i.e., from the late Miocene onwards), proposed as a diver-sification engine in many taxa (e.g., Richardson et al., 2001).However, because many South American Manilkara speciesare native to the Atlantic Forest, on the opposite side of thecontinent from the Andes, Andean uplift may be consideredunlikely to directly explain high diversification rates region-wide.Interestingly, the rapid diversification of the African lineage coin-cided with periods of regional aridification. The slowest diversi-fication rate, in the Southeast Asian lineage, includes species thatare mostly to the east of Wallace’s Line. This may be explainedby the fact that the mountainous topography of much of thisregion (dominated by New Guinea) limits the habitat available forlineages such as Manilkara that are largely restricted to lowlandrain forest that covers a greater area of Africa or the Neotropics.Although there is no statistical support for significant diversifica-tion rate variation in Manilkara s.s., the causes highlighted hereshould have similar impacts on other lowland rainforest taxa—aprediction that can be tested in future studies utilizing phylo-genies of more species rich taxa and meta-analyses of multipleunrelated lineages.
AUTHOR CONTRIBUTIONSThis paper is a result of Kate E. Armstrong’s Ph.D. thesisresearch at the Royal Botanic Garden Edinburgh and Universityof Edinburgh. Kate E. Armstrong and James E. Richardson con-ceived the study and Kate E. Armstrong carried out the researchand wrote the manuscript apart from the diversification rate anal-ysis, which was conducted and written by Eugenio Valderrama.James E. Richardson, Graham N. Stone, and Richard Milnesupervised the Ph.D. project. Graham N. Stone and James E.Richardson edited the manuscript. James A. Nicholls assistedwith phylogenetic analyses. Arne A. Anderberg, Jenny Smedmark,Laurent Gautier, and Yamama Naciri contributed DNA sequencedata to the study. All authors have reviewed the manuscript.
ACKNOWLEDGMENTSThis doctoral research was made possible through a scholar-ship from the Torrance Bequest at the University of Edinburgh.Grants for fieldwork from the Royal Geographical Society, theCarnegie Trust, the Systematics Association, and the DavisExpedition Fund are also gratefully acknowledged. D. NdiadeBourobou (CENAREST, IRAF) is thanked for a DNA aliquot ofBaillonella toxisperma, and Jerome Chave (CNRS) is thanked forITS sequences of Manilkara bidentata and M. huberi. Thanks tomembers of the Stone Lab at the University of Edinburgh forcomments on an earlier draft of the manuscript.
SUPPLEMENTARY MATERIALThe Supplementary Material for this article can be foundonline at: http://www.frontiersin.org/journal/10.3389/fgene.2014.00362/abstract
INCONGRUENCE BETWEEN NUCLEAR AND PLASTID TREESPhylogenies generated with nuclear (Figure 1) and plastid data(Supplementary Figure 1) showed high topological congruence.However, there are a couple examples of hard incongruence
(strongly supported clades which conflict in their placementbetween the two datasets), both of which have biogeographicimplications. The first is in the placement of the two Asian speciesManilkara hexandra and M. littoralis, and the two African speciesM. mochisia and M. concolor. In the ITS phylogeny M. hexan-dra and M. littoralis are resolved in the Asian clade Y, while M.mochisia and M. concolor are resolved in the small African cladeV. In contrast, in the plastid phylogeny, these four species form astrongly supported clade (posterior probability 1), marked � inSupplementary Figure 1.
A second hard incongruence is apparent in the placementof the three taxa Manilkara yangambensis, M. triflora, and M.suarezensis. In the plastid phylogeny these form a monophyleticclade Z (Supplementary Figure 1). In contrast, in the ITS anal-ysis, the Brazilian M. triflora was poorly resolved at the baseof clade T, whereas the Madagascan M. suarezensis was resolvedwithin the main African clade (X). The Congolese speciesM. yangambiensis was not included in the ITS analysis due todifficulties in amplifying its DNA from herbarium specimens.
These discrepancies between the nuclear and plastid trees maybe the result of either ancestral polymorphism with incompletelineage sorting or chloroplast capture (introgression) followingdispersal.
EVIDENCE FOR CHLOROPLAST CAPTURE?In the dated nuclear phylogeny, the Asian species M. hexandra(Sri Lanka) and M. littoralis (Myanmar) (clade Y1) are placedwith other Asian species (clade Y2), whereas in the plastid phy-logeny, they are resolved in clade � with two African species M.mochisia (Zambia) and M. concolor (South Africa) (from cladeV in ITS). This suggests hybridization of taxa across the IndianOcean possibly resulting in chloroplast capture. Intercontinentalchloroplast capture may also be implicated in the case of cladeZ, which is resolved in the plastid analyses but not in the ITSanalyses and is composed of M. suarezensis (Madagascar), M. tri-flora (Brazil), and M. yangambiensis (Congo). The ITS analysisdid not include M. yangambiensis, but placed M. triflora withother Neotropical species in clade S, and M. suarezensis with otherMadagascan species within a larger clade of African species (cladeX). Therefore, ITS resolved at least two of the clade Z species withspecies from the same landmass, but cpDNA did not, and resolvedthem together instead. Clade Z is strongly supported (pp 0.99) inthe plastid analysis. Assuming that the correct species level rela-tionships are resolved, clade Z presents a case of long distancedispersal and chloroplast capture more remarkable than the cladeV/Y1 scenario, because it involves species from three landmasses,and hence two dispersal events.
Hybridization and chloroplast capture across long dis-tances such as ocean barriers has been indicated previously inSapotaceae. The species Chrysophyllum cuneifolium is inferredto have originated from an intercontinental hybridization eventwhere the chloroplast is South American and the nuclear genomeis African (Särkinen et al., 2007). Likewise, the Pacific genusNesoluma is hypothesized to have arisen as a result of inter-continental hybridization in the boreotropical region during theEocene (Smedmark and Anderberg, 2007). Nesoluma presentsthe opposite pattern to Chrysophyllum, where the chloroplast is
Frontiers in Genetics | Evolutionary and Population Genetics December 2014 | Volume 5 | Article 362 | 10

Armstrong et al. Diversification amongst tropical regions compared
African and the nuclear genome is Neotropical. Hybridizationbetween New and Old World lineages has also been demon-strated in the pantropical genus Gossypium (Malvaceae; Wendelet al., 1995) and intercontinental chloroplast capture is hypoth-esized to have also occurred in Thuja (Cupressaceae; Peng andWang, 2008). Additionally, both hybridization and introgressionevents are inferred to have occurred between distantly relatedspecies in Ilex (Aquifoliaceae; Manen et al., 2010). What isabundantly clear is that long distance dispersal has played acrucial role in the establishment of the modern distribution ofManilkara.
Supplementary Figure 1 | Bayesian majority rule consensus tree of the
chloroplast dataset. Posterior probability values are indicated above
branches. Nodes with letters/symbols are discussed in the text.
Supplementary Figure 2 | Phylogenetic tree used in the BAMM analysis
showing the nodes for which a proportion of sampled species was
calculated, as shown in Supplementary Table 3.
Supplementary Table 1 | Herbarium specimen data, GenBank accession
number and ancestral area coding for taxa included in the analyses.
Accessions of newly generated sequences are emboldened.
Supplementary Table 2 | Chloroplast primers designed for this study.
Supplementary Table 3 | Lineage specific correction used to take into
account incomplete taxon sampling in the BAMM analysis. The
unsampled species were assigned to the more recent node including
the species with the most similar morphology. The proportion of
sampled over total taxa was calculated for the nodes shown in
Supplementary Figure 2.
REFERENCESAnderberg, A. A., and Swenson, U. (2003). Evolutionary lineages in Sapotaceae
(Ericales): a cladistic analysis based on ndhF sequence data. Int. J. Plant Sci. 164,763–773. doi: 10.1086/376818
Chacón, J., Madriñán, S., Tohme, J., Ebouck, D., and Rodríguez, F. (2008).Phylogenetic patterns in the genus Manihot (Euphorbiaceae) inferred fromanalyses of nuclear and chloroplast DNA regions. Mol. Phylogenet. Evol. 49,260–267. doi: 10.1016/j.ympev.2008.07.015
Christenhusz, M. J. M., and Chase, M. W. (2013). Biogeographical patternsof plants in the Neotropics – dispersal rather than plate tectonics is mostexplanatory. Bot. J. Linn. Soc. 171, 277–286. doi: 10.1111/j.1095-8339.2012.01301.x
Coates, A. G., and Obando, J. A. (1996). “The geologic evolution of the CentralAmerican isthmus,” in Evolution and Environment in Tropical America, eds J. B.C. Jackson, A. F. Budd, and A. G. Coates (Chicago, IL: University of ChicagoPress), 21–56.
Cody, S., Richardson, J. E., Rull, V., Ellis, C., and Pennington, R. T. (2010).The great American biotic interchange revisited. Ecography 33, 1–7.194. doi:10.1111/j.1600-0587.2010.06327
Coetzee, J. A. (1993). “African Flora since the terminal Jurassic,” in BiologicalRelationships between Africa and South America, ed P. Goldblatt (New Haven,CT: Yale University Press), 37–61.
Couvreur, T. L. P., Chatrou, L. W., Sosef, M. S., and Richardson, J. E.(2008). Molecular phylogenetics reveal multiple tertiary vicariance ori-gins of the African rain forest trees. BMC Biol. 6:54. doi: 10.1186/1741-7007-6-54
Cronk, Q. C. B., Kiehn, M., Wagner, W. L., and Smith, J. F. (2005). Evolution ofCyrtandra (Gesneriaceae) in the Pacific Ocean: the origin of a supertramp clade.Am. J. Bot. 92, 1017–1024. doi: 10.3732/ajb.92.6.1017
Davis, C. C., Bell, C. D., Fritsch, P. W., and Matthews, S. (2002a). Phylogenyof Acridocarpus-Brachylophon (Malpighiaceae): implications for Tertiary trop-ical floras and Afroasian biogeography. Evolution 56, 2395–2405. doi:10.1111/j.0014-3820.2002.tb00165.x
Davis, C. C., Bell, C. D., Matthews, S., and Donoghue, M. J. (2002b). Laurasianmigration explains Gondwanan disjunctions: evidence from Malpighiaceae.Proc. Natl. Acad. Sci. U.S.A. 99, 6833–6837. doi: 10.1073/pnas.102175899
Demesure, B., Sodzi, N., and Petit, R. J. (1995). A set of universal primers foramplification of polymorphic noncoding regions of mitochondrial and chloro-plast DNA in plants. Mol. Ecol. 4, 129–131. doi: 10.1111/j.1365-294X.1995.tb00201.x
Drummond, A. J., Ho, S. Y. W., Rawlence, N., and Rambaut, A. (2007). BeastManual: A Rough Guide to BEAST 1.4. Available online at: http://beast.bio.ed.
ac.uk.Drummond, A. J., and Rambaut, A. (2007). BEAST: Bayesian evolutionary analysis
by sampling trees. BMC Evol. Biol. 7:214. doi: 10.1186/1471-2148-7-214Farris, D. W., Jaramillo, C., Bayona, G., Restrepo-Moreno, S. A., Montes, C.,
Cardona, A., et al. (2011). Fracturing of the Panamanian Isthmus during initialcollision with South America. Geology 39, 1007–1010. doi: 10.1130/G32237.1
Frederiksen, N. O. (1980). Mid-Tertiary climate of Southeastern United-States—the sporomorph evidence. J. Paleontol. 54, 728–739.
Fritsch, P. W., Almeda, F., Renner, S. S., Martins, A. B., and Cruz, B. C. (2004).Phylogeny and circumscription of the near-endemic Brazilian tribe Microlicieae(Melastomataceae). Am. J. Bot. 91, 1105–1114. doi: 10.3732/ajb.91.7.1105
Gentry, A. H. (1982). Floristic diversity: phytogeographical connections betweenCentral and South America, Pleistocene climatic fluctuations, or an accident ofthe Andean orogeny? Ann. Mo. Bot. Gard. 69, 557–593. doi: 10.2307/2399084
Graham, A. (2009). The Andes: a geological overview from a biological perspective.Ann. Mo. Bot. Gard. 96, 371–385. doi: 10.3417/2007146
Gregory-Wodzicki, K. M. (2000). Uplift history of the Central and NorthernAndes: a review. Geol. Soc. Am. Bull. 112, 1091–1105. doi: 10.1130/0016-7606(2000)112<1091:UHOTCA>2.0.CO;2
Gruas-Cavagnetto, C. (1976). Etude palynologique du Paleogene du sud del’Angleterre. Cah. Micropal. 1, 1–49.
Hall, T. (2005). BioEdit version 7.0.5. Carlsbad, CA: Ibis Therapeutics. Availableonline at: http://www.mbio.ncsu.edu/bioedit/bioedit.html.
Harley, M. M. (1991). The pollen morphology of the Sapotaceae. Kew Bull. 46, 379.doi: 10.2307/4110538
Heads, M. (2006). Seed plants of Fiji: an ecological analysis. Biol. J. Linn. Soc. 89,407–431. doi: 10.1111/j.1095-8312.2006.00682.x
Houle, A. (1998). Floating islands: a mode of long distance dispersal for small andmedium-sized terrestrial vertebrates. Divers. Distrib. 4, 201–216.
Huelsenbeck, J. P., and Ronquist, F. (2001). MrBayes. Bayesian inference ofphylogenetic trees. Bioinformatics 17, 754–755. doi: 10.1093/bioinformatics/17.8.754
Hughes, C., and Eastwood, R. (2006). Island radiation on a continental scale: excep-tional rates of plant diversification after uplift of the Andes. Proc. Natl. Acad. Sci.U.S.A. 103, 10334–10339. doi: 10.1073/pnas.0601928103
Jacobs, B. F. (2004). Palaeobotanical studies from tropical Africa: relevance to theevolution of forest, woodland and savannah biomes. Philos. Trans. R. Soc. Lond.B 359, 1573–1583. doi: 10.1098/rstb.2004.1533
Jacobs, B. F., Tabor, N., Feseha, M., Pan, A., Kappelman, J., Rasmussen,T., et al. (2005). Oligocene terrestrial strata of northwestern Ethiopia:a preliminary report on paleoenvironments and paleontology. Palaeontol.Electron. 8, 1–19. Available online at: http://www.fpl.fs.fed.us/documnts/pdf2005/fpl_2005_jacobs001.pdf
Johnson, H. (1991). Petroleum geology of Fiji. Mar. Geol. 98, 2–4. doi:10.1016/0025-3227(91)90109-H
Kass, R. E., and Raftery, A. E. (1995). Bayes factors. J. Am. Stat. Assoc. 90, 773–795.doi: 10.1080/01621459.1995.10476572
Kendall, D. G. (1949). Stochastic processes and population growth. J. R. Stat. Soc. BStat. Methodol. 11, 230–264.
Lavin, M. (2006). “Floristic and geographical stability of discontinuous season-ally dry tropical forests explains patterns of plant phylogeny and endemism,” inNeotropical Savannas and Seasonally Dry Forests: Plant Diversity, Biogeography,and Conservation, eds R. T. Pennington, G. P. Lewis, and J. A. Ratter (BocaRaton, FL: CRC Press), 433–447.
Lebrun, J. P. (2001). Introduction á la Flore d’Afrique. Paris: Cirad, Ibis Press.Lebrun, J. P., and Stork, A. L. (2003). Tropical African flowering Plants: Ecology and
Distribution, Vol. 1. Annonaceae-Balanitaceae. Geneva: Conservatoire et Jardinbotaniques de la Ville de Geneve.
Lovett, J., and Wasser, S. (1993). Biogeography and Ecology of the Rainforests ofEastern Africa. Cambridge: Cambridge University Press.
www.frontiersin.org December 2014 | Volume 5 | Article 362 | 11
Armstrong et al. Diversification amongst tropical regions compared
Machin, J. (1971). Plant microfossils from Tertiary deposits of the Isle of Wight.New Phytol. 70, 851–872. doi: 10.1111/j.1469-8137.1971.tb02586.x
Maddison, W. P., and Maddison, D. R. (2008). MacClade version 4.08. Sunderland:Sinauer Associates. Available online at: http://macclade.org/macclade.html.
Magallón, S., and Sanderson, M. J. (2001). Absolute diversification ratesin angiosperm clades. Evolution 55, 1762–1780. doi: 10.1111/j.0014-3820.2001.tb00826.x
Manen, J. F., Barriera, G., Loizeau, P. A., and Naciri, Y. (2010). The history ofextant Ilex species (Aquifoliaceae): evidence of hybridization within a Mioceneradiation. Mol. Phylogenet. Evol. 57, 961–2977. doi: 10.1016/j.ympev.2010.09.006
McLoughlin, S. (2001). The breakup history of Gondwana and its impacton pre-Cenozoic floristic provincialism. Aust. J. Bot. 49, 271–300. doi:10.1071/BT00023
Milne, R. I., and Abbott, R. J. (2002). The origin and evolution of ter-tiary relict floras. Adv. Bot. Res. 38, 281–314. doi: 10.1016/S0065-2296(02)38033-9
Möller, M., and Cronk, Q. C. B. (1997). Origin and relationships of Saintpaulia(Gesneriaceae) based on ribosomal DNA internal transcribed spacer (ITS)sequences. Am. J. Bot. 84, 956–965. doi: 10.2307/2446286
Moran, P. A. (1951). Estimation methods for evolutive processes. J. R. Stat. Soc. BStat. Methodol. 13, 141–146.
Morley, R. J. (2000). Origin and Evolution of Tropical Rain Forests. Chichester: JohnWiley and Sons, Ltd.
Muellner, A. N., Pannell, C. M., Coleman, A., and Chase, M. W. (2008). Theorigin and evolution of Indomalesian, Australasian and Pacific island biotas:insights from Aglaieae (Meliaceae, Sapindales). J. Biogeogr. 35, 1769–1789. doi:10.1111/j.1365-2699.2008.01935.x
Muellner, A. N., Savolainen, V., Samuel, R., and Chase, M. W. (2006). Themahogany family “out-of-Africa”: divergence time estimation, global bio-geographic patterns inferred from plastid rbcL DNA sequences, extant, andfossil distribution of diversity. Mol. Phylogenet. Evol. 40, 236–250. doi:10.1016/j.ympev.2006.03.001
Peng, D., and Wang, X. Q. (2008). Reticulate evolution in Thuja inferred from mul-tiple gene sequences: implications for the study of biogeographical disjunctionbetween eastern Asia and North America. Mol. Phylogenet. Evol. 47, 1190–1202.doi: 10.1016/j.ympev.2008.02.001
Pennington, R. T., Richardson, J. E., and Lavin, M. (2006). Insights into thehistorical construction of species-rich biomes from dated plant phylogenies,phylogenetic community structure and neutral ecological theory. New Phytol.172, 605–616. doi: 10.1111/j.1469-8137.2006.01902.x
Prakash, U., Brezinova, D., and Awasthi, N. (1974). Fossil woods from the Tertiaryof South Bohemia. Paleontogr. Abt. B 147, 107–133.
Rabosky, D. L. (2014). Automatic detection of key innovations, rate shifts,and diversity-dependence on phylogenetic trees. PLoS ONE 9:e89543. doi:10.1371/journal.pone.0089543
Rambaut, A., and Drummond, A. J. (2009). Tracer v.1.5. Available online at: http://tree.bio.ed.ac.uk/software/tracer/
Raven, P. H., and Axelrod, D. I. (1974). Angiosperm biogeography and pastcontinental movements. Ann. Mo. Bot. Gard. 61, 539–673. doi: 10.2307/2395021
Revell, L. J. (2012). phytools: an R package for phylogenetic comparative biol-ogy (and other things). Methods Ecol. Evol. 3, 217–223. doi: 10.1111/j.2041-210X.2011.00169.x
Richards, P. W. (1973). “Africa, the odd man out,” in Tropical Forest Ecosystems inAfrica and South America: A Comparative Review, eds B. J. Meggers, E. S. Ayensu,and W. D. Duckworth (Washington, DC: Smithsonian Institution Press),21–26.
Richardson, J. E., Bakar, A. M., Tosh, J., Armstrong, K. E., Smedmark, J., Anderberg,A., et al. (2014). The influence of tectonics, sea-level changes and dispersal onmigration and diversification of Isonandreae (Sapotaceae). Bot. J. Linn. Soc. 174,130–140. doi: 10.1111/boj.12108
Richardson, J. E., Pennington, R. T., Pennington, T. D., and Hollingsworth, P. M.(2001). Rapid diversification of a species-rich genus of neotropical rain foresttrees. Science 293, 2242–2245. doi: 10.1126/science.1061421
Ronquist, F., Huelsenbeck, J. P., and van der Mark, P. (2005). MrBayes 3.1. Availableonline at: http://mrbayes.csit.fsu.edu/
Särkinen, T. E., Newman, M. F., Maas, P. J. M., Maas, H., Poulsen, A. D., Harris,D. J., et al. (2007). Recent oceanic long-distance dispersal and divergence
in the amphi-Atlantic rain forest genus Renealmia L.f. (Zingiberaceae). Mol.Phylogenet. Evol. 44, 968–980. doi: 10.1016/j.ympev.2007.06.007
Sepulchre, P., Ramstein, G., Fluteau, F., Schuster, M., Tiercelin, J. J., and Brunet, M.(2006). Tectonic uplift and Eastern Africa aridification. Science 313, 1419–1423.doi: 10.1126/science.1129158
Shaw, J., Lickey, E. B., Beck, J. T., Farmer, S. B., Liu, W. S., Miller, J., et al.(2005). The tortoise and the hare II: relative utility of 21 noncoding chloro-plast DNA sequences for phylogenetic analysis. Am. J. Bot. 92, 142–166. doi:10.3732/ajb.92.1.142
Shaw, J., Lickey, E. B., Schilling, E. E., and Small, R. L. (2007). Comparison of wholechloroplast genome sequences to choose noncoding regions for phylogeneticstudies in angiosperms: the tortoise and the hare III. Am. J. Bot. 94, 275–288.doi: 10.3732/ajb.94.3.275
Silvestro, D., Schnitzler, J., and Zizka, G. (2011). A Bayesian framework to estimatediversification rates and their variation through time and space. BMC Evol. Biol.11:311. doi: 10.1186/1471-2148-11-311
Simmons, M. P., and Ochoterena, H. (2000). Gaps as characters in sequence-basedphylogenetic analyses. Syst. Biol. 49, 369–381. doi: 10.1093/sysbio/49.2.369
Simon, M. F., Grether, R., de Queiroz, L. P., Skema, C., Pennington, R. T., andHughes, C. E. (2009). Recent assembly of the Cerrado, a neotropical plant diver-sity hotspot, by in situ evolution of adaptations to fire. Proc. Natl. Acad. Sci.U.S.A. 106, 20359–20364. doi: 10.1073/pnas.0903410106
Smedmark, J. E. E., and Anderberg, A. A. (2007). Boreotropical migration explainshybridization between geographically distant lineages in the pantropical cladeSideroxyleae (Sapotaceae). Am. J. Bot. 94, 1491–1505. doi: 10.3732/ajb.94.9.1491
Stadler, T. (2011). Simulating trees on a fixed number of extant species. Syst. Biol.60, 676–684. doi: 10.1093/sysbio/syr029
Su, Y. C. F., and Saunders, R. M. K. (2009). Evolutionary divergence times in theAnnonaceae: evidence of a late Miocene origin of Pseuduvaria in Sundalandwith subsequent diversification in New Guinea. BMC Evol. Biol. 9:153. doi:10.1186/1471-2148-9-153
Swenson, U., Lowry, P. P., Munzinger, J., Rydin, C., and Bartish, I. V. (2008).Phylogeny and generic limits in the Niemeyera complex of New CaledonianSapotaceae: evidence of multiple origins of the anisomerous flower. Mol.Phylogenet. Evol. 49, 909–929. doi: 10.1016/j.ympev.2008.09.022
Takhtajan, A. (1986). Floristic Regions of the World. Berkeley, CA: University ofCalifornia Press.
Taylor, D. W. (1989). Select palynomorphs from the Midde Eocene CaliborneFormation, Tenn, (USA). Rev. Palaeobot. Palynol. 58, 111–128. doi:10.1016/0034-6667(89)90080-8
Thomas, D. C., Hughes, M., Phutthai, T., Ardi, W. H., Rajbhandary, S., Rubite,R., et al. (2012). West to east dispersal and subsequent rapid diversificationof the mega-diverse genus Begonia (Begoniaceae) in the Malesian archipelago.J. Biogeogr. 39, 98–113. doi: 10.1111/j.1365-2699.2011.02596.x
Thomas, W. W. (1999). Conservation and monographic research onthe flora of tropical America. Biodivers. Conserv. 8, 1007–1015. doi:10.1023/A:1008857429787
Traverse, A. (1955). Pollen Analysis of the Brandon Lignite of Vermont. Washington,DC: Report of Investigations 5151: United States Department of the Interior,Bureau of Mines.
Traverse, A., and Barghoorn, E. S. (1953). Micropaleontology of the Brandonlignite, an early Tertiary coal in central Vermont. J. Paleontol. 27,289–293.
Van Welzen, P. C., Slik, J. W. F., and Alahuhta, J. (2005). Plant distribu-tion patterns and plate tectonics in Malesia. Kong. Dansk. Vidensk. 55,199–217.
Wendel, J. F., Schnabel, A., and Seelanan, T. (1995). An unusual ribosomalDNA sequence from Gossypium gossypioides reveals ancient, cryptic interge-nomic introgression. Mol. Phylogenet. Evol. 4, 298–313. doi: 10.1006/mpev.1995.1027
White, T. J., Burns, T., Lee, S., and and Taylor, J. (1990). “Amplificationand direct sequencing of fungal ribosomal RNA genes for phylogenetics,”in PCR Protocols: A Guide to Methods and Applications, eds M. Innis,D. Gelfand, J. Sninsky, and T. White (San Diego, CA: Academic Press),315–322.
Whitmore, T. C. (1998). An Introduction to Tropical Rainforests, 2nd Edn. Oxford:Oxford University Press.
Yu, Y., Harris, A. J., and He, X. (2011). RASP (Reconstruct Ancestral State inPhylogenies) 2.1.B. Available online at: http://mnh.scu.edu.cn/soft/blog/RASP.
Frontiers in Genetics | Evolutionary and Population Genetics December 2014 | Volume 5 | Article 362 | 12

Armstrong et al. Diversification amongst tropical regions compared
Zachos, J. C., Pagani, M., Sloan, L., Thomas, E., and Billups, K. (2001). Trends,rhythms, and aberrations in global climate 65 Ma to present. Science 292,686–693. doi: 10.1126/science.1059412
Zerega, N. J. C., Clement, W. L., Datwyler, S. H., and Weiblen, G.D. (2005). Biogeography and divergence times in the mulberry family(Moraceae). Mol. Phylogenet. Evol. 37, 402–416. doi: 10.1016/j.ympev.2005.07.004
Zhou, L., Su, Y. C. F., Thomas, D. C., and Saunders, R. M. K. (2012). ‘Out-of-Africa’dispersal of tropical floras during the Miocene climatic optimum: evidencefrom Uvaria (Annonaceae). J. Biogeogr. 39, 322–335. doi: 10.1111/j.1365-2699.2011.02598.x
Conflict of Interest Statement: The authors declare that the research was con-ducted in the absence of any commercial or financial relationships that could beconstrued as a potential conflict of interest.
Received: 18 July 2014; accepted: 29 September 2014; published online: 03 December2014.Citation: Armstrong KE, Stone GN, Nicholls JA, Valderrama E, Anderberg AA,Smedmark J, Gautier L, Naciri Y, Milne R and Richardson JE (2014) Patterns of diver-sification amongst tropical regions compared: a case study in Sapotaceae. Front. Genet.5:362. doi: 10.3389/fgene.2014.00362This article was submitted to Evolutionary and Population Genetics, a section of thejournal Frontiers in Genetics.Copyright © 2014 Armstrong, Stone, Nicholls, Valderrama, Anderberg, Smedmark,Gautier, Naciri, Milne and Richardson. This is an open-access article distributed underthe terms of the Creative Commons Attribution License (CC BY). The use, distributionor reproduction in other forums is permitted, provided the original author(s) or licen-sor are credited and that the original publication in this journal is cited, in accordancewith accepted academic practice. No use, distribution or reproduction is permittedwhich does not comply with these terms.
www.frontiersin.org December 2014 | Volume 5 | Article 362 | 13