patterns of decline in enrolment & its implications for ...patterns of decline in enrolment...
TRANSCRIPT

Patterns of Decline in Enrolment & its Implications for
Universal Secondary Education in India: An In- depth Analysis of U-DISE 2016-17 Data
Arun C MehtaProfessor & Head
Department of Educational Management Information System National Institute of Educational Planning and Administration, New Delhi
www.niepa.ac.in
Enrolment in Grade I: 2012-13 to 2016-17
2012-13 2013-14 2014-15 2015-16 2016-17
In M
illi
on
23.00
24.00
25.00
26.00
27.00
28.00
29.00
28.67
27.1626.90
27.17
25.29
Enrolment in Grade V: 2012-13 to 2016-17
2012-13 2013-14 2014-15 2015-16 2016-17
23.50
24.00
24.50
25.00
25.50
26.00
In M
illi
on
25.2625.38
25.45
25.05
24.22
9.4110.78
11.43
12.16
10.98
0.00
2.00
4.00
6.00
8.00
10.00
12.00
14.00
2012-13 2013-14 2014-15 2015-16 2016-17
In M
illio
n
Enrolment in Grade XII: 2012-13 to 2016-17
Patterns of Decline in Enrolment: Analysis of U-DISE 2016-17 Data
CONTENTS
Introduction ..............................................................................................................................1 Distribution of Schools ..........................................................................................................................1 Ratio of Upper Primary to Secondary Schools/Sections ......................................................................4 Schools by Location ............................................................................................................................. 8 Schools by Management ........................................................................................................................9 Facilities in Schools ............................................................................................................................. 11 •Single-Classroom&Single-TeacherSchools .................................................................................. 11 •SchoolswithBuilding ..................................................................................................................... 16 •SchoolswithToilet .......................................................................................................................... 16 •DrinkingWater,Electricity,Ramp,Laboratory&OtherFacilities ................................................. 17 •BoundaryWall&PlaygroundFacility ............................................................................................. 18 •HeadMaster’sRoom,Computer&InternetConnection ................................................................. 18Pupil-Teacher&Student-ClassroomRatio ............................................................................................ 19Enrolment-basedIndicators .................................................................................................................. 27 •ShareofGirls’Enrolment ................................................................................................................ 27 •EnrolmentinSecondary&HigherSecondaryClasses ................................................................... 29 •SecondaryEnrolment:GradesIX&X ............................................................................................ 30 •GradeIXEnrolment ........................................................................................................................ 31 •GradeXEnrolment .......................................................................................................................... 32 •ChangeinHigherSecondaryEnrolment ......................................................................................... 36 •GradeXIEnrolment ........................................................................................................................ 38 •GradeXIIEnrolment ....................................................................................................................... 39 •EnrolmentinPrimary&UpperPrimaryClasses ............................................................................ 41 •ChangeinPrimaryEnrolment ......................................................................................................... 43 •ChangeinUpperPrimaryEnrolment .............................................................................................. 46 •TotalEnrolmentatSchoolLevel:GradesItoXII ........................................................................... 46 •Muslim,SC&STShareinEnrolment ............................................................................................ 50 •CWSNStudents ............................................................................................................................. 52 •EnrolmentinGradeI,V,VI,VIII,IXandX ................................................................................... 56 •GradeVEnrolment .......................................................................................................................... 59 •FlowRates&IndicatorsofInternalEfficiency:PrimaryLevel ...................................................... 62 •Transition&RetentionRate ............................................................................................................ 65 •GradeVIEnrolment ........................................................................................................................ 67 •GradeVIIIEnrolment ...................................................................................................................... 70 •TransitionRatefromElementarytoSecondaryLevel .................................................................... 73 •EnrolmentRatio ............................................................................................................................. 76Gross&NetAttendanceRate ............................................................................................................... 79NumberofSchoolsshowingDeclineinEnrolment ............................................................................. 81ConcludingObservations ...................................................................................................................... 84
ii
LIST OF TABLES
Table1 :NumberofSchoolsCoveredunderDISE:2016-17 ..............................................................................3 Table2 :RatioofUpperPrimarytoSecondarySchools/Sections:2012-13to2016-17 ................................... 6Table3 :RatioofUpperPrimarytoSecondarySchools/Sections&SecondarytoHigher SecondarySchools/Sections:2016-17 ................................................................................................ 7 Table4 :PercentageofSchoolsbyManagement:2012-13to2016-17 ............................................................. 9Table5 :PercentageofSecondarySchools/SectionsbyManagement:2016-17 ............................................... 11Table6 :PercentageofHigherSecondarySchools/SectionsbyManagement:2016-17 ................................... 12Table7 :PercentageofSchools(AllSecondary&HigherSecondarySchools)byBasic Facilities:2016-17 ............................................................................................................................... 14Table8 :RegularTeachersatSecondary&HigherSecondaryLevelsofEducation:2016-17 ......................... 21Table9 :TeachersbyEducational&ProfessionalQualification:2016-17 ........................................................ 22Table10 :PercentageofGirl’sEnrolment:2012-13to2016-17 ......................................................................... 25Table11 :RatioofBoys’toGirls’Enrolment:2012-13to2016-17 .................................................................... 25Table12 :TotalEnrolmentatSecondary&HigherSecondaryLevelsofEducation:2016-17.......................... 26Table13 :EnrolmentatSecondary&HigherSecondaryLevelsofEducation: 2012-13to2016-17 ............................................................................................................................. 27Table14 :State-specificDeclineinEnrolmentatSecondaryLevel(GradesIX&X)of Education:2015-16to2016-17 ........................................................................................................... 27Table15 :EnrolmentinGradeIX:2012-13to2016-17 ...................................................................................... 29Table16 :EnrolmentinGradeX:2012-13to2016-17 ........................................................................................ 31Table17 :ChangeinGradeXEnrolment:2015-16to2016-17 ........................................................................... 32Table18 :HigherSecondaryEnrolment:GradesXItoXII ................................................................................. 34Table19 :State-specificDeclineinEnrolmentatSecondary&HigherSecondaryLevelsof Education:2015-16to2016-17,ClassesIXtoXII ............................................................................. 35Table20 :EnrolmentinGradeXI,2012-13to2015-16 ...................................................................................... 36Table21 :State-specificDeclineinGradeXIEnrolment:2015-16to2016-17 .................................................. 37Table22 :EnrolmentinGradeXII,202-13to2016-17 ....................................................................................... 40Table23 :State-specificDeclineinGradeXIIEnrolment:2016-17 ................................................................... 41Table24 :EnrolmentatPrimary,UpperPrimary&ElementaryLevelsofEducation:2012-13to2016-17 ...... 41Table25 :PercentageChangeinEnrolmentover2012-13,SchoolEducation .................................................... 42Table26 :State-specificDeclineinEnrolmentatPrimaryLevelofEducation:2015-16to2016-17 ................. 44Table27 :State-specificDeclineinEnrolmentatUpperPrimaryLevelofEducation: 2015-16to2016-17 ............................................................................................................................. 45Table28 :State-specificDeclineinTotalEnrolment(GradesItoXII):2015-16to2016-17 ............................. 47Table29 :State-specificDeclineinEnrolmentatDifferentLevelsofSchoolEducation: 2015-16to2016-17 ............................................................................................................................. 48Table30 :State-specificPercentagetototalDeclineinEnrolment:2015-16to2016-17 ................................... 49Table31 :ShareofScheduledCastesEnrolmenttoTotalADDEnrolment, 2012-13to2016-17 ............................................................................................................................ 52Table32 :ShareofScheduledTribesEnrolmenttoTotalEnrolment,2012-13to2016-17 ............................... 52Table33 :PercentageofMuslimMinorityEnrolmenttoTotalEnrolment:2012-13to2016-17 ........................ 52Table34 :ScheduledCastes,ScheduledTribes&MuslimEnrolment,2012-13&2016-17 .............................. 53Table35 :TotalCWSNEnrolment(ClassesItoXII),2012-13to2016-17 ........................................................ 53Table36 :EnrolmentbyCastesatSecondary&HigherSecondaryLevelsofEducation:2016-17 ................... 54Table37 :EnrolmentGradeI ............................................................................................................................... 56Table38 :DeclineinGradeIEnrolmentinTop12States*:2015-16to2016-17 ............................................... 58Table39 :EnrolmentGradeV .............................................................................................................................. 59Table40:DeclineinGradeVEnrolmentinTop12States*:2015-16to2016-17 ............................................... 60Table41:InternalEfficiencyofPrimaryEducationSystem:Cohort2015-16* .................................................. 61Table42:TransitionRateatDifferentLevelsofSchoolEducation,2011-12to2015-16 .................................... 62Table43:TransitionRateatDifferentLevelsofEducation:Cohort2015-16 ...................................................... 63Table44:EnrolmentGradeVI,2012-13to2016-17 ............................................................................................ 64
iii

Patterns of Decline in Enrolment: Analysis of U-DISE 2016-17 Dataiv
Table45:Enrolment,2012-13to2016-17 ............................................................................................................ 66Table46:FlowRatesatPrimary&UpperPrimaryLevelsofEducation:2015-16 ............................................. 67Table47:TransitionRateandRatioofGirl’stoBoy’sEnrolment:2016-17 ....................................................... 68Table48:EnrolmentRatioatDifferentLevelsofEducation,201213,2015-16and2016-17 ............................ 69Table49:Gross&NetEnrolmentRatioatPrimaryandUpperPrimaryLevels:2016-17 .................................. 73Table50:Gross&NetEnrolmentRatioatSecondary&HigherSecondaryLevels:2016-17 ............................ 74Table51:Age-specificEnrolmentRatioatDifferentLevelsofEducation:2016-17 ........................................... 75Table52:NSSOGrossandNetAttendanceRates,1995to2014 ........................................................................ 80Table53:NumberofSchoolsbyCategoryshowingDeclineinenrolmentin2016-17 ....................................... 80Table54:State-specificPercentageofSchoolsShowingDeclineinEnrolmentin2016-17 overthePreviousYear ......................................................................................................................... 82
LIST OF FIGURES
Figure1:RatioofUpperPrimarytoSecondarySchools/Sections:2012-13to2016-17 ..................................... 8Figure2:PercentageSchoolsManagedbyGovernmentManagements:2012-13to2016-17 ............................. 16Figure3:PercentageSchoolsManagedbyPrivateUnaidedManagements:2012-13to2016-17 ....................... 17Figure4:RatioofBoy’stoGirl’sEnrolment:2012-13to2016-17 ...................................................................... 25Figure5:EnrolmentinGradeIX:2012-13to2016-17 ....................................................................................... 28Figure6:EnrolmentinGradeX:2012-13to2016-17 ........................................................................................ 30Figure7:EnrolmentinGradeXI:2012-13to2016-17 ....................................................................................... 33Figure8:EnrolmentinGradeXII:2012-13to2016-17 ...................................................................................... 38Figure9:EnrolmentatDifferentLevelsofEducation:2012-13to2016-17 ........................................................ 42Figure10:EnrolmentatPrimaryLevel:2005-06to2016-17 .............................................................................. 42Figure11:PercentageofMuslimEnrolmenttoTotalEnrolment:2013-14to2016-17 ....................................... 50Figure12:EnrolmentinGradeI:2012-13to2016-17 ......................................................................................... 57Figure13:Grade-wiseEnrolment ......................................................................................................................... 57Figure14:EnrolmentinGradeV:2012-13to2016-17 ....................................................................................... 60Figure15:TransitionRate:2011-12to2015-16 ................................................................................................... 61Figure16:TransitionRateatPrimarytoUpperPrimaryLevel:2011-12to2015-16 .......................................... 62Figure17:EnrolmentinGradeVI:2012-13to2016-17 ...................................................................................... 65Figure18:EnrolmentinGradeVIII:2012-13to2016-17................................................................................... 65Figure19:Grade-wiseDrop-outRate:2015-16 ................................................................................................... 66Figure20:GERatPrimary&UpperPrimaryLevel:2005-06to2016-17 .......................................................... 69Figure21:GrossAdmissionRate:1995to2014 .................................................................................................. 81Figure22:NetAdmissionRate:1995to2014 ...................................................................................................... 81
LIST OF MAPS
Map1:RatioofUpperPrimarytoSecondarySchools/Sections .......................................................................... 5Map2:PercentageofSingle-ClassroomSchoolsAllSecondary&HigherSecondarySchools ......................... 13Map3:PercentageofSchoolswithComputerAllSecondary&HigherSecondarySchools .............................. 19Map4:PercentageofProfessionallyQualifiedTeachers:SecondaryLevel ........................................................ 23Map5:PercentageofProfessionallyQualifiedTeachers:HigherSecondaryLevel ............................................ 24Map6:PercentageofMuslimEnrolment:SecondaryLevel ................................................................................ 51Map7:RatioofGirlstoBoysEnrolment:Secondary&HigherSecondary ........................................................ 55Map8:GrossEnrolmentRatioatSecondaryLevel ............................................................................................. 71 Map9:GrossEnrolmentRatioatHigherSecondaryLevel ................................................................................. 72Map10:NumberofSchoolsShowingDeclineinEnrolmentGovernment&AidedManagements .................. 83
iv

IntroductionNumerous efforts have been made in the pastdecade to strengthen educational management information system in India amongst which,Unified District Information System for Education (U-DISE, launched as DISE in 1994-95) jointlydevelopedbytheNational Institute of Educational Planning & Administration (NIEPA), Ministry of Human Resource Development (MHRD) andUNICEFisthemostprominentone.Overaperiodof time, quality of U-DISE data has improvedsignificantlybutstillthereareafewareasofconcernwith regard to coverage, consistency, quality &reliability,sharing,dissemination&utilizationofdata(Mehta,1993,1996,1997&2017).Tofurtherimprovethequalityofdata,collectionofdetailedstudent data on 35 parameters in-sync with theU-DISE was launched during 2016-17 U-DISEdatacollection.Infuture,U-DISEenrolmenttableswereplannedtobegeneratedbasedonindividualstudentdatawhich shallhelp in identifying fakeandduplicateenrolment,aswellas,over-reportingofenrolment.Maybebecauseofthis,steepdeclineinenrolmentisobservedin2016-17overthesamein2015-16.Ofthetotaldecline(71.50millioninClasses I toXII), the share of Elementary level(Classes I to VIII) was 68.29 million (95.51percent).DeclineinthePrimaryClassesisofthetune of 53.14millionwhich is 77.82 percent oftotal decline in enrolment in Elementary Classes. BoththedistrictElementary(underSSA),aswellas,SecondaryEducation(underRMSA)plansarebeenexclusivelyformulatedbasedontheU-DISEdata.Fromtheyear2018-19,itisproposedtohaveonly one School Education Plan under Samagra Shiksha (MHRD, 2018) which shall also beexclusivelybasedontheU-DISEdata.In2012-13,thescopeofU-DISEwasextendedtoentireschooleducationcoveringgradesfromItoXII.Withthe
latest U-DISE data now available for 2016-17,dataforboththeElementaryandSecondarylevelsof education is available over a period of fiveyears i.e. 2012-13 to 2016-17. In 2016-17 (30th September 2016 as Date of Reference),U-DISEobtained information from 701 districts (662districtsin2012-13)spreadover7,448CDBlocksinaround82,641Clusters(around10to25schoolsperCluster) fromall the36States&UTsof theCountry.ThisnoteisexclusivelybasedonU-DISE2016-17 data (available in the public domain atwww.udise.in) and confines only to SecondaryandHigherSecondarylevelsofeducation(Mehta,2002, 2003 & 2013) [For details, see ReporterModule(hundredsofreportscanbegeneratedatalllevelsbyusingthismodule)andState Report Cards, 2016-17availableatwww.udise.in.
Distribution of SchoolsSince the inception, comprehensive informationon number of schools covered under DISE isavailable by School Category. Since 2012-13,DISE is popularly known as Unified-DISE,the year in which single Data Capture Formatwas introduced to collect information from allschools imparting school education irrespectiveof category, management and type of school(MHRD,2013).2012-13wasalsotheyearduringwhich the U-DISE acquired the status of theOfficial Statistics.During2016-17,U-DISEcouldreachtomorethan1.5millionschools(15,35,610schools, 84.47 percent in rural areas & 71.72percentGovernmentmanagedschools)impartingschooleducationofwhichabout2,60,525schoolsare imparting Secondary and Higher Secondaryeducation compared to 2,28,914 schools (70.37percentinruralareas)in2012-13.Inthefirstyearofunification,asmanyas15,00,768schoolswere
1: Professor & Head, Department of Educational Management Information System, NIEPA, New Delhi – 110016Note: Views expressed are personal and may not be attributed to NIEPA or any other organization.
Patterns of Decline in Enrolment & its Implications for Universal Secondary Education in India: An In-depth Analysis of U-DISE 2016-17 Data
Arun C. Mehta1
DraftNottobeQuoted
Patterns of Decline in Enrolment: Analysis of U-DISE 2016-17 Data2
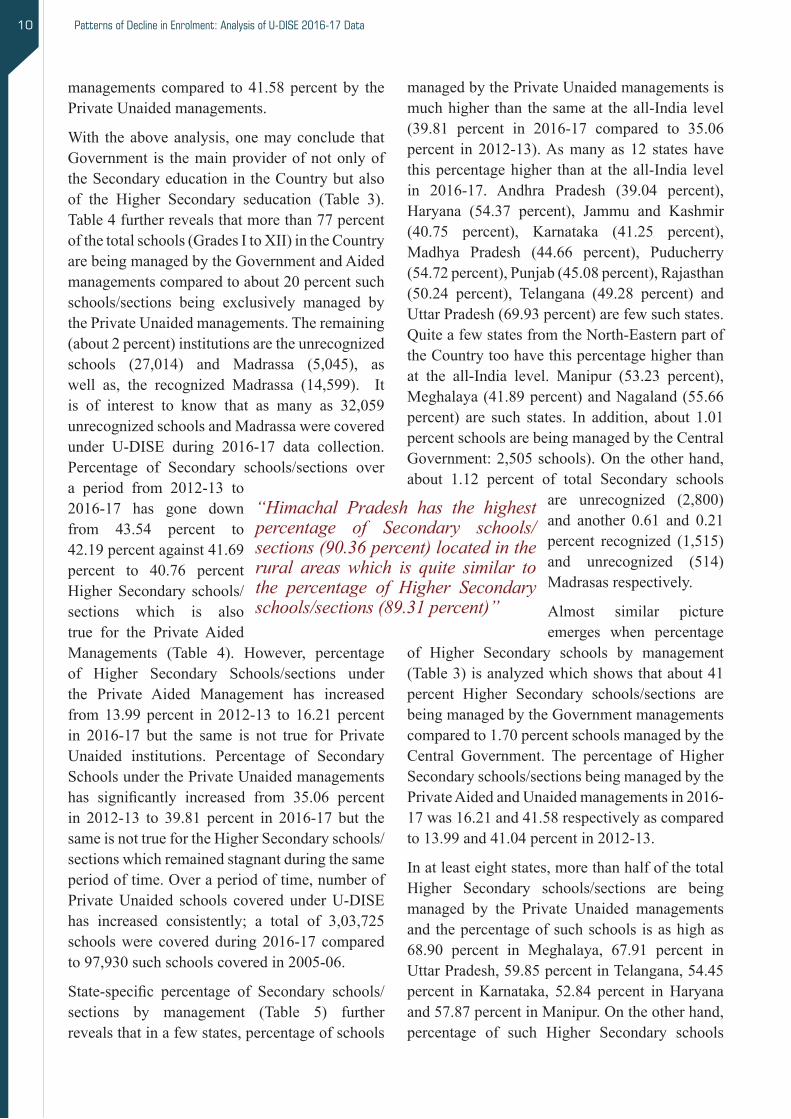
coveredunderU-DISE.Ofthetotal260.5thousandschools,69.55percentarelocatedintheruralareasand about 42.19 (Secondary) and 40.76 (HigherSecondary) percent schools/sections are beingmanagedbytheGovernment.Anadditional,16.07and16.21percentoftotalSecondaryandHigherSecondary schools/sections are being managed by theGovernmentAidedmanagements.
Distributionofschoolsfurtherrevealsthatofthetotal 2,60,525 Secondary and Higher Secondaryschools covered under DISE, 18.63 percent arePrimarywithUpperPrimaryandSecondaryandHigher Secondary schools compared to 12.89percentUpperPrimarywithSecondaryandHigherSecondary, 22.86 percent Primary with UpperPrimary and Secondary, 19.54 percent UpperPrimarywithSecondary,13.03percentSecondaryonly, 8.66 and 4.39 percent are respectivelySecondary with Higher Secondary and HigherSecondary only schools. Of the total Secondary andHigher Secondary schools, a little less thanoneineveryfiveschoolsarePrimarywithUpperPrimary and Secondary schools followed byUpper Primary and Secondary Schools (19.54percent). A perusal of state-wise number ofschoolsbycategoryfurtherrevealsthatofthetotal159and2,087SecondaryandHigherSecondaryschools/sectionsrespectivelyintheCapitalCityofChandigarh andDelhi, about 56 percent schoolsare PrimarywithUpper Primary and SecondaryandHigherSecondaryschoolswhichisthehighestamongst all the states compared to 1.44 percent suchschoolsinAndhraPradeshwhichisthelowestacrosstheCountry.LikeAndhraPradesh,Assam(2.87 percent), Goa (2.53 percent), Karnataka(3.79percent),Meghalaya(2.15percent),Odisha(1.58 percent) and Telangana (1.74 percent) toohave only a few Primary with Upper Primaryand Secondary and Higher Secondary schools.Majority of schools in Andhra Pradesh (82.46percent)areUpperPrimaryandSecondaryschoolsand the state has not reported any independent Higher Secondary school which is quite similarto the same in Delhi. Chandigarh has only three types of schools: Primary with Upper Primaryand Secondary and Higher Secondary schools(55.97 percent), Upper Primary with Secondary
and Higher Secondary schools (3.14 percent)andPrimarywithUpperPrimaryandSecondaryschools(40.88percent)andhasnotreportedanyothertypeofschool.AlookattheUpperPrimarywith Secondary and Higher Secondary schoolsrevealsthatthepercentageofsuchschoolsisthehighest inWest Bengal (61.72 percent) and thelowest0.35percent,inKarnataka.Morethanhalf(53.72percent)ofthetotalSecondaryandHigherSecondary schools in Karnataka are Secondaryonly schools. Further, it has been observed thatof the total 2,60,525 Secondary and HigherSecondaryschoolsintheCountry,thepercentageof Higher Secondary schools is as low as 4.39.However, a few states have a higher percentagethan the same at the all-India level, such statesare:Assam (9.36 percent), Goa (18.87 percent),Gujarat(6.58percent),Karnataka(16.31percent),Odisha (10.70 percent) and Telangana (12.77percent).ComparedtoHigherSecondarySchools,percentage of Secondary to total schools is a bit highat13.03percent.Meghalaya(63.29percent)andMizoram (79.80 percent) havemuch higherpercentage of such schools than the same at the all-Indialevel.
Allcategoriesofschools togetherfurtherrevealsthat as many as 2,49,089 Secondary (2,18,857in 2012-13) and 1,16,125 Higher Secondary(1,22,368 in 2012-13) schools/sections havebeen covered under U-DISE in 2016-17 (Table1).There are sevencategoriesofSecondary andHigher Secondary schools in India. There is nosingle pattern of schools across the Country but the majority of states have more Primary withUpper Primary and Secondary schools compared toothertypeofschoolcategories.Ashasalreadybeen observed above that the year 2012-13wasthefirstyearofunificationofDISE(withSEMIS)whenoneDataCaptureFormat,onesoftwareandonedataentrycenterwasusedacrosstheCountry.
During2012-13to2016-17,numberofSecondaryschools shows an increase of 30,432 schools(13.90percent)ascomparedto31,611Secondaryand Higher Secondary schools/sections (13.81percent). State-specific number of schoolsreveals thatRajasthanhas thehighestnumberof

Implications for Universal Secondary Education in India 3
Table 1: Number of Schools Covered under DISE : 2016-17
State/UT
Number of Schools Density of Schools per 10 Sq. Km. Schools by Type
Secondary Higher Secondary
All Schools
All Schools Located in Rural
Areas
Second-ary
Higher Secondary
Schools Locat-ed in Rural Areas
Second-ary
Higher Second-
ary
GirlsA&NIslands 113 63 113 85 0.14 0.08 75.22 0.88 1.59
AndhraPradesh 12063 358 12063 8153 0.74 0.02 67.59 8.02 22.63
ArunachalPradesh 449 158 451 314 0.05 0.02 69.62 3.34 0.00Assam 8369 2144 9233 7603 1.07 0.27 82.35 9.01 4.80
Bihar 7748 4119 8116 6932 0.82 0.44 85.41 8.92 10.59
Chandigarh 159 94 159 13 13.95 8.25 8.18 1.89 3.19
Chhattisgarh 6524 3987 6538 4783 0.48 0.29 73.16 4.22 5.57
D&NHaveli 44 21 45 33 0.90 0.43 73.33 0.00 0.00
Daman&Diu 41 24 43 25 3.66 2.14 58.14 7.32 8.33
Delhi 2086 1719 2087 74 14.06 11.58 3.55 17.31 18.85
Goa 417 115 514 359 1.13 0.31 69.84 1.44 2.61
Gujarat 10723 6997 11478 7375 0.55 0.36 64.25 5.13 5.99
Haryana 7831 4478 7833 5617 1.77 1.01 71.71 6.03 6.68
HimachalPradesh 3962 2367 3970 3585 0.71 0.43 90.30 1.39 1.99J&K 4238 1069 4241 3151 0.19 0.05 74.30 3.73 7.39Jharkhand 4639 1520 4905 3927 0.58 0.19 80.06 12.37 21.71
Karnataka 15708 4766 18769 10100 0.82 0.25 53.81 4.40 6.48
Kerala 4705 2980 4770 3581 1.21 0.77 75.07 4.02 4.63
Lakshadweep 15 13 15 13 4.69 4.06 86.67 0.00 0.00
Madhya Pradesh 16264 8513 16272 9898 0.53 0.28 60.83 4.78 6.46
Maharashtra 23484 9089 25737 16206 0.76 0.30 62.97 3.29 3.21
Manipur 1054 216 1118 825 0.47 0.10 73.79 2.09 3.24
Meghalaya 1449 311 1629 1298 0.65 0.14 79.68 2.48 7.40
Mizoram 648 164 812 394 0.31 0.08 48.52 0.31 0.00
Nagaland 724 172 743 470 0.44 0.10 63.26 0.28 1.74
Odisha 9873 1519 11056 9592 0.63 0.10 86.76 9.18 9.28
Puducherry 371 173 376 176 6.60 3.08 46.81 6.20 8.67
Punjab 9298 4994 9474 6113 1.85 0.99 64.52 3.68 6.63
Rajasthan 28534 17300 28534 21109 0.83 0.51 73.98 1.84 1.92
Sikkim 230 87 230 201 0.32 0.12 87.39 1.74 3.45
Tamil Nadu 12893 7206 12911 8089 0.99 0.55 62.65 7.42 10.64
Telangana 12280 2249 14077 7804 1.10 0.20 55.44 7.94 11.47
Tripura 1043 420 1043 857 0.99 0.40 82.17 1.82 3.33
Uttar Pradesh 27189 17386 27218 21891 1.12 0.71 80.43 7.25 9.02
Uttaranchal 3575 2265 3593 2998 0.67 0.42 83.44 7.08 7.81
WestBengal 10346 7069 10359 7543 1.17 0.80 72.82 17.61 15.32
All India,
2016-17 249089 116125 260525 181187 0.76 0.35 69.55 6.09 7.20
2012-13 218857 122368 228914 - 0.67 0.37 70.37 5.62 5.76
Source:AlltablesinthisreportarebasedonU-DISEdatawhichisavailableathttp://www.udise.in

Patterns of Decline in Enrolment: Analysis of U-DISE 2016-17 Data4
Upper Primary schools/sections has improvedsignificantly and now for every two sets ofPrimary schools, there is at least one UpperPrimary school/section (Table 2).However, stillinafewstates this ratio iswellabove2:1;suchstatesareWestBengal (4.09), Jharkhand (2.31),Meghalaya(2.44)andManipur(2.37).Thesamemay not necessarily be true for the Ratio of Upper PrimarytoSecondaryschools/sections(Tables2&3).
The ratio of Upper Primary to Secondary schools/sections reveals that there is an average oneSecondary school/section for every set of 2.52Upper Primary schools/sections compared to one Higher Secondary schools for every set of 2.15Secondaryschools/sectionsin2016-17(Table2).Asitlooksthataccessisnotamajorissue;howeverthe ratio is treated as an alternate indicator and is used only in the absence of detailed habitation-specific informationonavailabilityof schoolingfacilitieswith regard to population and distancewhich is latest available from the 8th All India School Education Survey (AISES): 2009-10conductedby theNCERT.Acursory lookat theAISESdatarevealsthat91.21percentofthetotalhabitationshavehadPrimaryschoolingfacilitieswithinadistanceof1kmandanother66.30percenthabitationshadthefacilitywithinthehabitationin2009-10whichcatertheneedofabout85percentpopulation those who reside in the rural India.On theotherhand, about88percenthabitationshad Upper Primary schooling facility within adistance of 3 km from the habitation comparedto26percenthadthesamewithinthehabitationitself. Compared to Primary and Upper Primary schooling facility, percentage habitation havinggot access to Secondary and Higher Secondaryschoolingfacilityisobservedtobeabitlow.About80 percent habitations had Secondary schooling facilitywithinadistanceof5kmcomparedto75percent habitations having got access toHigherSecondaryschoolingfacilitywithinadistanceof8kmin2009-10.Only8and3percentofthetotalhabitations in the Country had Secondary and HigherSecondaryschoolingfacilityrespectivelywithinthehabitationin2009-10(AISES,NCERT,2016).Alternatively, availability of schools can
SecondaryandHigherSecondaryschools/sections(28,534schools)andLakshadweep,thelowest(15schools,Table1).Rajasthanwith28,534schoolshas 10.95 percent of total schools in the Country whichmeansthatoneineverytenSecondaryandHigher Secondary schools/sections is located inRajasthan. On the one hand, a few states, suchasKarnataka (18,769 schools),Madhya Pradesh(16,272 schools), Maharashtra (25,737 schools),AndhraPradesh(12,063schools),Gujarat(11,478schools), Odisha (11,056 schools), Tamil Nadu(12,911 schools), Telangana (14,077 schools),WestBengal (10,359schools)andUttarPradesh(22,194 schools), have more than 10 thousandschools/sectionsimpartingSecondaryandHigherSecondarySchools(Table1).Ontheotherhand,few states such asAndaman& Nicobar Islands(113schools),Dadra&NagarHaveli(45schools),Daman and Diu (43 schools) and Sikkim (230schools) have only a fewSecondary andHigherSecondary schools/section which is obviousbecauseofitssize.Distributionofschools/sectionsin2016-17further reveals thatof the total260.5thousand schools, 24,90,89 are Secondary andremaining1,16,125areHigherSecondaryschools/sections. Rajasthan (28,534 schools) has thehighest number of Secondary schools/sections and Uttar Pradesh,with 17,386 schools/sections, hasthehighestnumberofschoolsthatimpartHigherSecondary education in 2016-17.Distribution ofSecondaryschools/sectionsfurtherrevealsthatasmany as ten states havemore than 10 thousandsuchschoolscomparedto9stateswhichhave100or lower number of Secondary schools/sections.Lakshadweep(15schools)hasthelowestnumberof Secondary schools followed by Daman andDiu (41 schools), Dadra and Nagar Haveli (44schools), Andaman and Nicobar Islands (113schools)etc.Almostsimilarpatternisobservedincaseofstate-specificnumberofHigherSecondaryschools/sections.
Ratio of Upper Primary to Secondary Schools/Sections
Availability of schools can be judged byanalyzingtheratioofnumberofschoolsbytypes.Over a period of time, the Ratio of Primary to

INDIARatio of Upper Primary to Secondary
Schools/Sections
U-DISE 2016-17
RATIO OF PRIMARY TO UPPER
PRIMARY SCHOOLS/SECTIONS
Map 1
(ALL INDIA: 1.15)
CHANDIGARH1.19
JAMMU & KASHMIR3.30
HIMACHAL PRADESH1.73
PUNJAB1.56
RAJASTHAN2.29
MADHYA PRADESH3.40 CHHATTISGARH
2.79
JHARKHAND4.25
WEST BENGAL1.88
BIHAR4.82
SIKKIM2.52
MEGHALAYA2.73
ASSAM2.12
NAGALAND2.12
ARUNACHAL PRADESH3.82
MANIPUR1.85
MIZORAM2.38TRIPURA
2.22
ODISHA3.31
MAHARASHTRA2.20
DAMAN & DIU1.51
GUJARAT3.05
DADRA & NAGAR HAVELI
3.36
A R A B I A N S E A
GOA1.18
B AY O F B E N G A L
KERALA1.73
KARNATAKA2.25
ANDHRA PRADESH1.85
TELANGANA1.61
PUDUCHERRY1.20
LAKSHADWEEP1.60
TAMIL NADU1.75
AND
AMAN
AND
NICO
BAR ISLAND
S
1.71
DELHI1.44
UTTARAKHAND2.34
UTTAR PRADESH3.48
HARYANA1.63
1.19 - 2.50
2.51 - 3.00
3.01 - 3.50
3.51 - 4.82
Note: Map not to scale Disclaimer: The boundaries and the names used in the maps are only a visual representation and do not determine the legal boundary position.

Patterns of Decline in Enrolment: Analysis of U-DISE 2016-17 Data6
alsobeviewed innumberofSchoolsper10SqKm(Table1)whichrevealsthatonlyoneschoolislocatedwithinadistanceof10kmwhichistrueforbothSecondaryaswellasHigherSecondaryschools/sections. DISE 2016-17, further revealsthat thereisonly0.76Secondary(0.67in2012-13) and 0.37 Higher Secondary (0.36 in 2012-13)schoolper10sq.km.Comparedtothehighnumber of schools per sq. km. in Chandigarh,Delhi, Lakshadweep and Puducherry, all otherstateshadamuchlowernumberofsuchschoolsin2016-17.
Intheabsenceofhabitation&populationspecificdata beyond 2009-10, there is no option but toanalyze ratio of schools/sections by types aspresented above.At this point of time, it is not
Table 2: Ratio of Upper Primary to Secondary Schools/Sections: 2012-13 to 2016-17
Year Ratio of Primary to Upper Primary Schools/Sections
Ratio of Upper Primary to Secondary Schools/Sections
Ratio of Secondary to Higher Secondary Schools/Sections
2012-13 2.06 2.64 1.79
2013-14 2.04 2.60 2.19
2014-15 2.02 2.56 2.14
2015-16 1.99 2.54 2.12
2016-17 1.97 2.52 2.15
Source : Visualization Module (http://udise.schooleduinfo.in), NIEPA, New Delhi.
clear whether NCERT would conduct NinthAISESornotandifyes,whatwouldbethedateof reference of such survey.On the other hand,U-DISE2016-17isavailableinthepublicdomainand states have already closed the entire datacollectionprocessofU-DISE2017-18,with30th September 2017 as its date of reference. It is learnt that theU-DISEfrom2018-19willbemanagedby the Department of School Education & Literacy(notNIEPA)withsupportfromtheNICfor which an online portal (U-DISE+) is beingdeveloped. Entire data collection processwhichused to be launched on 30th September each year isyet tobe initiated.Year2018-19DistrictPlans under newly launched Samagra Shiksha basedon theU-DISE2017-18has alreadybeenappraisedandmoneyapprovedanddispersedbythe ProjectApproval Board (PAB) of Samagra Shiksha.For thepastmanyyears,currentyear’splansunderSSAandRMSAarebeingdeveloped
byusingcurrentyears’U-DISEdata.U-DISEhascompletelyeradicatedthetime-laginavailabilityof educational statistics and information is made available on all parameters which arerequired for efficient formulation of plans at allthedisaggregated levelssuchas,school,cluster,block,district,stateandthenationallevels.
State-specificratioofUpperPrimarytoSecondaryschools/sections (Table3) further reveals that inmanystates,thesameisabovethreeandinstates,suchasJharkhand(4.25)andBihar(4.82),isevenabove four but the same in case of the ratio ofSecondarytoHigherSecondaryschools/sectionsin these states is lower than three.All schoolstogether,atall-Indialevelfurtherrevealsthatforevery 2.52Secondary school/section, there is at
leastoneUpperPrimaryschool/section.Asmanyasninestates,thisratioin2016-17waswellabove3.On the other hand, in smaller states the ratioof Upper Primary to Secondary schools/section is observed to be well below two. Chandigarh(1.19),DamanandDiu(1.51),Delhi(1.44),Goa(1.18)andPuduchery(1.20)arefewsuchstates.In other states, Kerala with 1.73, Tamil Nadu,1.75andWestBengal(1.88),thereisatleastoneSecondary school/section for every two sets ofUpper Primary schools/sections.Almost similarsituation is observedwith regard to the ratio ofSecondarytoHigherSecondaryschools/sectionswhichwas2.15attheall-Indialevelin2016-17.InOdisha,theratiowasashighas6.50followedby 5.46 in Telangana, 4.88 inManipur, 4.66 inMeghalaya,4.21inNagaland,3.90inAssam,3.96inJammuandKashmir,3.30inKarnatakaetc.Thelowest ratio of Secondary to Higher Secondaryschools/sections is observed in Lakshadweep

Implications for Universal Secondary Education in India 7
Table 3: Ratio of Upper Primary to Secondary Schools/Sections & Secondary to Higher Secondary Schools/Sections: 2016-17
State/UT
Ratio of Upper
Primary to Secondary Schools / Sections
Ratio of Secondary to Higher Secondary Schools / Sections
Student-Classroom Ratio Pupil-Teacher Ratio
Secondary Higher Secondary
All Schools Secondary Higher
SecondaryAll
Schools
A&NIslands 1.71 1.79 29 30 29 13 15 14
AndhraPradesh 1.85 4.72* 34 0 33 19 0 19
ArunachalPradesh 3.82 2.84 39 49 42 21 30 23
Assam 2.12 3.90 40 53 42 14 20 15
Bihar 4.82 1.88 98 66 86 69 44 64
Chandigarh 1.19 1.69 42 46 44 12 25 18
Chhattisgarh 2.79 1.64 46 34 40 30 27 30
D&NHaveli 3.36 2.10 48 48 48 27 27 27
Daman&Diu 1.51 1.71 39 36 37 15 20 18
Delhi 1.44 1.21 44 34 39 31 20 25
Goa 1.18 3.63 34 38 36 13 19 15
Gujarat 3.05 1.53 45 38 42 34 27 31
Haryana 1.63 1.75 33 30 32 15 14 18
HimachalPradesh 1.73 1.67 27 26 26 16 13 14
Jammu&Kashmir 3.30 3.96 23 43 29 13 26 17
Jharkhand 4.25 3.05 54 64 55 56 67 58
Karnataka 2.25 3.30 38 38 26 17 - 13
Kerala 1.73 1.58 35 35 38 16 21 18
Lakshadweep 1.60 1.15 29 37 32 7 9 9
Madhya Pradesh 3.40 1.91 49 38 44 35 38 36
Maharashtra 2.20 2.58 46 63 52 25 45 31
Manipur 1.85 4.88 27 43 32 11 17 13
Meghalaya 2.73 4.66 30 46 34 11 19 13
Mizoram 2.38 3.95 22 39 27 8 14 10
Nagaland 2.12 4.21 28 44 32 11 20 13
Odisha 3.31 6.50 50 58 51 20 40 23
Puducherry 1.20 2.14 31 34 32 10 16 13
Punjab 1.56 1.86 31 35 32 16 24 19
Rajasthan 2.29 1.65 35 34 35 21 28 24
Sikkim 2.52 2.64 36 29 33 16 14 15
Tamil Nadu 1.75 1.79 37 35 36 21 25 23
Telangana 1.61 5.46 30 29 29 22 40 26
Tripura 2.22 2.48 52 42 48 25 10 18
Uttar Pradesh 3.48 1.56 47 58 50 54 91 65
Uttaranchal 2.34 1.58 37 39 37 16 24 19
WestBengal 1.88 1.46 67 52 61 38 56 44
All States 1.15 1.49 44 43 43 27 33 29
*:2015-16Source:AlltablesinthisreportarebasedonU-DISEdatawhichisavailableathttp://www.udise.in.

Patterns of Decline in Enrolment: Analysis of U-DISE 2016-17 Data8
3.55and3.43whichisbecauseofthefactthatonly2.50percentoftotalDelhi’spopulationresideintheruralareas(2011Census).However,totalruralareainDelhiis53.81percentofthetotal1,484SqKm.Ashasalreadybeenmentioned,percentageofSecondaryschools/sections(8.18percent)andHigherSecondary(9.57percent)schools/sectionsisalsolowinChandigarh.HimachalPradeshhasthe highest percentage of Secondary schools/sections(90.36percent)locatedintheruralareaswhichisquitesimilartothepercentageofHigherSecondary schools/sections (89.31 percent).In India we have four categories of HigherSecondaryschools/sectionswhichvaryfromstateto state. They are Primary with Upper Primaryand Secondary and Higher Secondary, UpperPrimarywith Secondary andHigher Secondary,Secondary with Higher Secondary and HigherSecondary/JuniorCollege.Ontheotherhand,wehavesixcategoriesofSecondaryschoolsofwhich
theotherstateshavepercentageofschoolsintheruralareasinasingledigit.Asmanyastenstateshavepercentageofsuchschoolsintheruralareas80 percent and above. However, it is HimachalPradesh which has got the highest percentageof Secondary and Higher Secondary schools/sectionslocatedintheruralareas(90.30percent)whichmeansthat9outofeverytensuchschoolsarelocatedintheruralareaswhichisalsotrueforindividualSecondary(90.36percent)andHigherSecondary (89.31 percent) schools/sections.Percentage of Secondary andHigher Secondaryschools/sectionsinDelhiistoolowrespectivelyat
Schools by Location
Majority of Secondary and Higher Secondaryschools are located in the rural areas. Table 1 revealsthateveryseventhSecondaryandHigherSecondary school/section in the Country is located in the rural areas. All schools together furtherreveals that 69.55 percent of the total schools(2,60,525 schools) are located in the rural areas(1,81.187 schools). State-specificpercentageofSecondaryandHigherSecondaryschoolsfurtherreveals that the same is as low as 3.55 percentin case ofDelhi compared to above 85 percentsuch schools in Bihar (Table 1). In Karnataka,percentage of schools in the rural areas is 53.81 whichislowerthanthesameinmanyotherstatesandnationalaverage(69.55percent).LikeDelhi,quiteafewotherstatestoohavealowpercentageof such schools in the rural areas. The percentage inChandigarhisaslowas8.18percent.Noneof
(1.5) followed by Delhi (1.21), Chandigarh(1.69)etc.(Table3).Inaddition,agoodnumberofschoolswereopenedunderRMSA.Uptotheyear2015-16,asmanyas11,599newSecondaryschoolswereapprovedundertheflagshipRMSAoutofwhich10,082schoolsarefunctionalwhichhad a total of 972 thousand enrolment as on 15th June2015.Overall onegets the impression thatschoolingfacilities,barringafewstates,isnotamajorareaofconcernandschoolsarebyandlargefairly available across the Country. However,theremaybeotherareasofconcernfewofwhicharediscussedinthefollowingsections.
Patterns of Decline in Enrolment: Analysis of U-DISE 2016-17 Data
8
Figure 1
In the absence of habitation&populationspecificdatabeyond2009-10,thereisnooptionbutto
analyzeratioofschools/sections bytypesaspresentedabove.Atthispointoftime,itisnotclear
whether NCERT would conduct Ninth AISES or not and if yes, what would be the date of
referenceofsuchsurvey.Ontheotherhand,U-DISE 2016-17 is already available in the public
domain and states have already closed the entire data collection process of U-DISE 2017-18,
with30th September 2017 as its date of reference. It is learnt that the U-DISE from 2018-19will
be managed by the Department of School Education & Literacy (notNIEPA)withsupportfrom
the NIC forwhichanonlineportal(U-DISE+)isbeingdeveloped.Entiredatacollectionprocess
which used to be launched on 30th September each year is yet to be initiated. Year 2018-19
DistrictPlansundernewlylaunchedSamagra Shiksha based on the U-DISE 2017-18 has already
been appraised andmoney approved and dispersed by the Project Approval Board (PAB) of
Samagra Shiksha. For the past many years, current year’s plans under SSA and RMSA are being
developedbyusingcurrentyears’ U-DISE data. U-DISE has completely eradicated the time-lag
inavailabilityofeducationalstatistics andinformationismadeavailableonallparameterswhich
are required for efficient formulation of plans at all the disaggregated levels such as, school,
cluster,block,district,stateandthenationallevels.
State-specific ratio of Upper Primary to Secondary schools/sections (Table3)furtherrevealsthat
in many states, the same is abovethree and in states, suchasJharkhand(4.25)andBihar(4.82),
is even above four but the same in case of the ratio of Secondary to Higher Secondary
schools/sections in these statesislowerthanthree.Allschoolstogether,atall-Indialevelfurther
2.45
2.5
2.55
2.6
2.65
2012-13 2013-14 2014-15 2015-16 2016-17
2.64
2.60
2.56
2.54
2.52Ra
tio
Ratio of Upper Primary to Secondary Schools/Sections: 2012-13 to 2016-17
Figure 1

Implications for Universal Secondary Education in India 9
themajority of schools are either Primary withUpper Primary and Secondary (22.86 percent)followed by Upper Primary with Secondary(19.54percent),PrimarywithUpperPrimaryandSecondaryandHigherSecondary(18.63percent)schools/sections etc.
Majority of schools in India are co-educational.However,itisofinteresttoknowthatnumberofgirl’sschoolsingeneralandthatoftheSecondaryand Higher Secondary schools in particularpresented in Table 1 reveals that of the totalSecondary and Higher Secondary schools, thepercentageofgirls’schoolsis6.09(5.62percentin 2012-13) and 5.76 (7.20 percent in 2012-13)as against most of the other schools which areco-educationalinnature.However,percentageofgirlsschoolsbothinthecaseofSecondaryaswellasHigherSecondaryschoolsinafewstates,suchas,Bihar,Delhi,Jharkhand,PuducherryandWestBengalismuchhigherthaninmostoftheotherstates.Ontheotherhand,inafewstatessuchas,Andaman and Nicobar Islands, Goa, Mizoramand Nagaland, there are only a few Secondaryschools exclusively forGirl’s.Dadra andNagarHaveliandLakshadweepdidn’treportanyGirl’sschoolwhichistrueforbothSecondary,aswellas for Higher Secondary schools. However, ina good number of states, percentage of Girl’sHigher Secondary schools is much above thesameattheall-Indialevel(7.20percent).AndhraPradesh (22.63 percent), Bihar (10.59 percent),Delhi(28.85percent),Jharkhand(21.71percent),Tamil Nadu (10.64 percent), Telangana (11.47percent)andWestBengal(15.21percent)arefewsuch states.
Schools by ManagementThe Secondary and Higher Secondary schoolstogetherhavea totalenrolmentof61.45millioncompared to 3.60 million teachers. Of the total enrolment, the share of the rural areas is 68.05percent compared to 61.48 percent teachers. Of the total enrolment, Secondary level constitute38.82 million (63.17 percent) and HigherSecondary level, 22.63 million (36.83 percent).Distribution of Secondary schools/sections by management further reveals that 34.43 percentschools are being managed by the Department of EducationfollowedbyLocalBody(4.26percent),Tribal & Social Welfare Department (2.19percent) and Other Government managements(0.30percent).AlltheGovernmentmanagementstogetherhaveashareofabout42percentof thetotal schools/sections that impart Secondary educationintheCountry.Inaddition,about16.07percent Secondary schools are being managed by the Private Aided managements comparedto 39.81 percent Private Unaided managements(Tables4&5).So far as theHigherSecondaryschools/sections are concerned about 36.74 percent are being managed by the Department of Education followed by 1.59 percent by theTribal and Social Welfare Departments, 0.39percent by the Local Body and 0.34 percentby other Government Departments. With anadditionalshareof1.70percentofthetotalHigherSecondary schools/sections being managed by the CentralGovernment,theshareofallGovernmentmanagements constitute as high as 40.76 percent. About 16.21percentHigherSecondary schools/sectionsarebeingmanagedbythePrivateAdded
Table 4: Percentage of Schools by Management: 2012-13 to 2016-17
Year
%age Schools Managed by Government
Managements
%age Schools Managed by Private Aided Managements
%age Schools Managed by Private Unaided Managements
All Schools(I to XII)*
Secondary Schools
Higher Secondary
Secondary Schools
Higher Secondary
Secondary Schools
Higher Sec-ondary
Govt. includ-ing Aided
Private Unaided
2012-13 43.54 41.69 17.32 13.99 35.06 41.04 - -
2013-14 42.84 35.83 17.27 15.36 37.49 40.21 - -
2014-15 42.77 39.86 16.68 16.72 38.84 42.07 78.46 19.00
2015-16 42.26 40.60 16.58 16.48 39.48 41.43 78.07 19.38
2016-17 42.19 40.76 16.07 16.21 39.81 41.58 77.19 19.78
*Note: Total may not add to 100 because of unrecognised institutions and no response, if any.
Patterns of Decline in Enrolment: Analysis of U-DISE 2016-17 Data10
managedbythePrivateUnaidedmanagementsismuchhigher than thesameat theall-India level(39.81 percent in 2016-17 compared to 35.06percent in2012-13).Asmany as12 states havethispercentagehigher thanat theall-India levelin 2016-17. Andhra Pradesh (39.04 percent),Haryana (54.37 percent), Jammu and Kashmir(40.75 percent), Karnataka (41.25 percent),Madhya Pradesh (44.66 percent), Puducherry(54.72percent),Punjab(45.08percent),Rajasthan(50.24 percent), Telangana (49.28 percent) andUttarPradesh(69.93percent)arefewsuchstates.QuiteafewstatesfromtheNorth-EasternpartoftheCountrytoohavethispercentagehigherthanat the all-India level. Manipur (53.23 percent),Meghalaya(41.89percent)andNagaland(55.66percent) are such states. In addition, about 1.01percent schools are being managed by the Central Government:2,505schools).Ontheotherhand,about 1.12 percent of total Secondary schools
are unrecognized (2,800)and another 0.61 and 0.21 percent recognized (1,515)and unrecognized (514)Madrasasrespectively.
Almost similar picture emerges when percentage
of Higher Secondary schools by management(Table3)isanalyzedwhichshowsthatabout41percent Higher Secondary schools/sections arebeingmanagedbytheGovernmentmanagementscompared to 1.70 percent schools managed by the Central Government. The percentage of HigherSecondary schools/sections being managed by the PrivateAidedandUnaidedmanagementsin2016-17was16.21and41.58respectivelyascomparedto13.99and41.04percentin2012-13.
Inatleasteightstates,morethanhalfofthetotalHigher Secondary schools/sections are beingmanaged by the Private Unaided managementsand the percentage of such schools is as high as 68.90 percent in Meghalaya, 67.91 percent inUttarPradesh,59.85percentinTelangana,54.45percent inKarnataka, 52.84 percent inHaryanaand57.87percentinManipur.Ontheotherhand,percentage of such Higher Secondary schools
managements compared to 41.58 percent by the PrivateUnaidedmanagements.
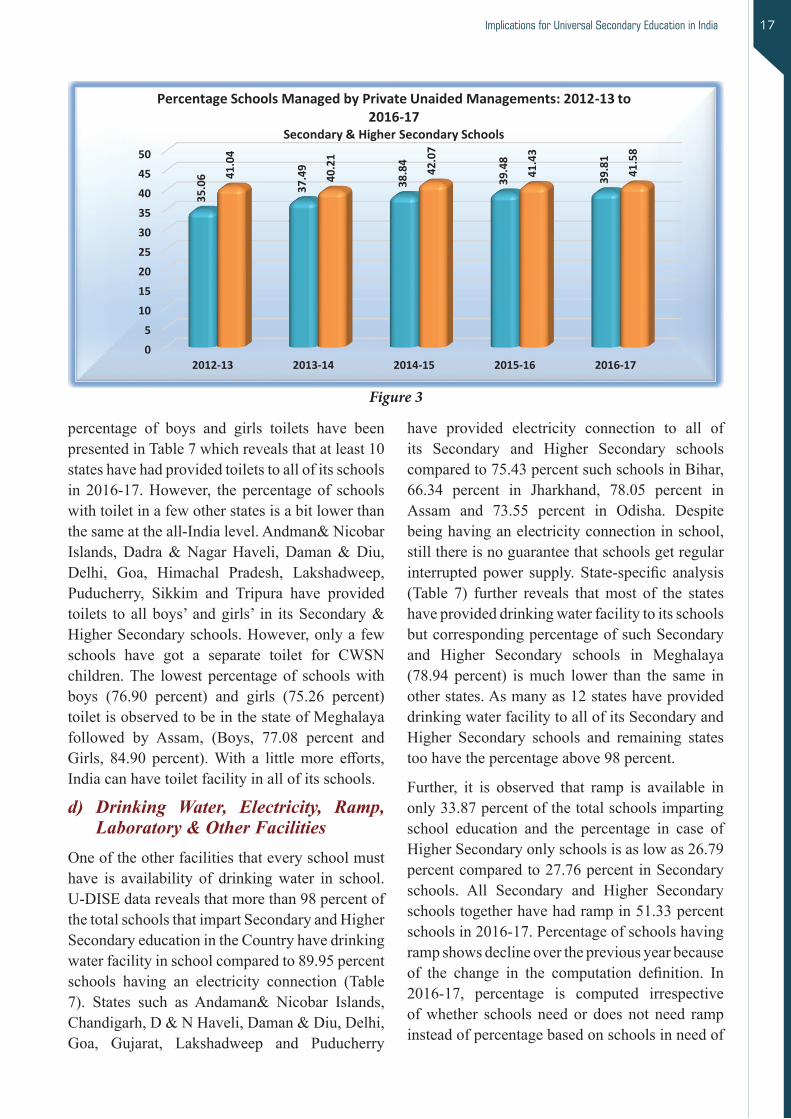
With theaboveanalysis,onemayconclude thatGovernment is themainproviderofnotonlyofthe Secondary education in the Country but also of the Higher Secondary seducation (Table 3). Table4furtherrevealsthatmorethan77percentofthetotalschools(GradesItoXII)intheCountryarebeingmanagedbytheGovernmentandAidedmanagements compared to about 20 percent such schools/sections being exclusively managed bythePrivateUnaidedmanagements.Theremaining(about2percent)institutionsaretheunrecognizedschools (27,014) and Madrassa (5,045), aswell as, the recognized Madrassa (14,599). Itis of interest to know that as many as 32,059unrecognizedschoolsandMadrassawerecoveredunder U-DISE during 2016-17 data collection.Percentage of Secondary schools/sections overa period from 2012-13 to2016-17 has gone downfrom 43.54 percent to 42.19 percent against 41.69 percent to 40.76 percent Higher Secondary schools/sections which is alsotrue for the Private AidedManagements (Table 4). However, percentageof Higher Secondary Schools/sections underthe Private Aided Management has increasedfrom13.99percent in 2012-13 to 16.21percentin 2016-17 but the same is not true for PrivateUnaided institutions. Percentage of Secondary SchoolsunderthePrivateUnaidedmanagementshas significantly increased from 35.06 percentin 2012-13 to 39.81 percent in 2016-17 but thesameisnottruefortheHigherSecondaryschools/sectionswhichremainedstagnantduringthesameperiodoftime.Overaperiodoftime,numberofPrivateUnaided schools covered underU-DISEhas increased consistently; a total of 3,03,725schoolswere coveredduring2016-17comparedto97,930suchschoolscoveredin2005-06.
State-specific percentage of Secondary schools/sections by management (Table 5) furtherrevealsthatinafewstates,percentageofschools
“Himachal Pradesh has the highest percentage of Secondary schools/sections (90.36 percent) located in the rural areas which is quite similar to the percentage of Higher Secondary schools/sections (89.31 percent)”
Implications for Universal Secondary Education in India 11
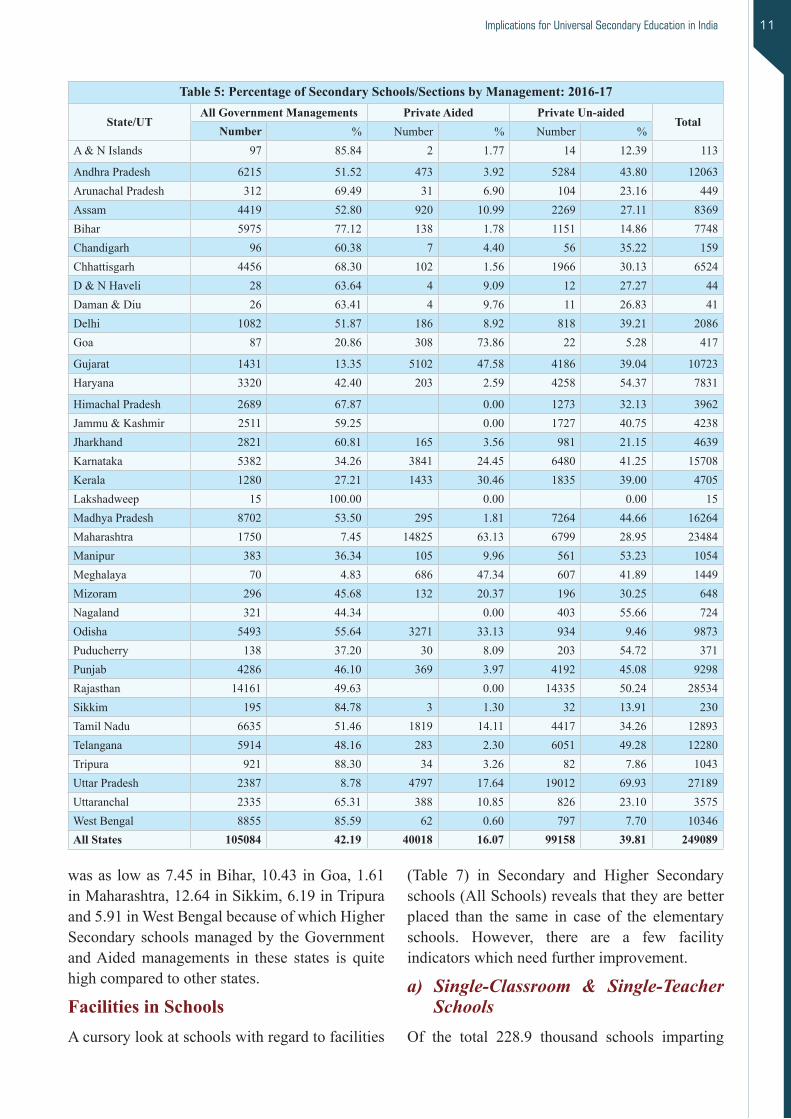
Table 5: Percentage of Secondary Schools/Sections by Management: 2016-17
State/UTAll Government Managements Private Aided Private Un-aided
TotalNumber % Number % Number %
A&NIslands 97 85.84 2 1.77 14 12.39 113
AndhraPradesh 6215 51.52 473 3.92 5284 43.80 12063ArunachalPradesh 312 69.49 31 6.90 104 23.16 449Assam 4419 52.80 920 10.99 2269 27.11 8369Bihar 5975 77.12 138 1.78 1151 14.86 7748Chandigarh 96 60.38 7 4.40 56 35.22 159Chhattisgarh 4456 68.30 102 1.56 1966 30.13 6524D&NHaveli 28 63.64 4 9.09 12 27.27 44Daman&Diu 26 63.41 4 9.76 11 26.83 41Delhi 1082 51.87 186 8.92 818 39.21 2086Goa 87 20.86 308 73.86 22 5.28 417
Gujarat 1431 13.35 5102 47.58 4186 39.04 10723Haryana 3320 42.40 203 2.59 4258 54.37 7831
HimachalPradesh 2689 67.87 0.00 1273 32.13 3962Jammu&Kashmir 2511 59.25 0.00 1727 40.75 4238Jharkhand 2821 60.81 165 3.56 981 21.15 4639Karnataka 5382 34.26 3841 24.45 6480 41.25 15708Kerala 1280 27.21 1433 30.46 1835 39.00 4705Lakshadweep 15 100.00 0.00 0.00 15Madhya Pradesh 8702 53.50 295 1.81 7264 44.66 16264Maharashtra 1750 7.45 14825 63.13 6799 28.95 23484Manipur 383 36.34 105 9.96 561 53.23 1054Meghalaya 70 4.83 686 47.34 607 41.89 1449Mizoram 296 45.68 132 20.37 196 30.25 648Nagaland 321 44.34 0.00 403 55.66 724Odisha 5493 55.64 3271 33.13 934 9.46 9873Puducherry 138 37.20 30 8.09 203 54.72 371Punjab 4286 46.10 369 3.97 4192 45.08 9298Rajasthan 14161 49.63 0.00 14335 50.24 28534Sikkim 195 84.78 3 1.30 32 13.91 230Tamil Nadu 6635 51.46 1819 14.11 4417 34.26 12893Telangana 5914 48.16 283 2.30 6051 49.28 12280Tripura 921 88.30 34 3.26 82 7.86 1043Uttar Pradesh 2387 8.78 4797 17.64 19012 69.93 27189Uttaranchal 2335 65.31 388 10.85 826 23.10 3575WestBengal 8855 85.59 62 0.60 797 7.70 10346All States 105084 42.19 40018 16.07 99158 39.81 249089
wasas lowas7.45 inBihar,10.43 inGoa,1.61inMaharashtra,12.64inSikkim,6.19inTripuraand5.91inWestBengalbecauseofwhichHigherSecondaryschoolsmanagedby theGovernmentandAidedmanagements in these states is quitehigh compared to other states.
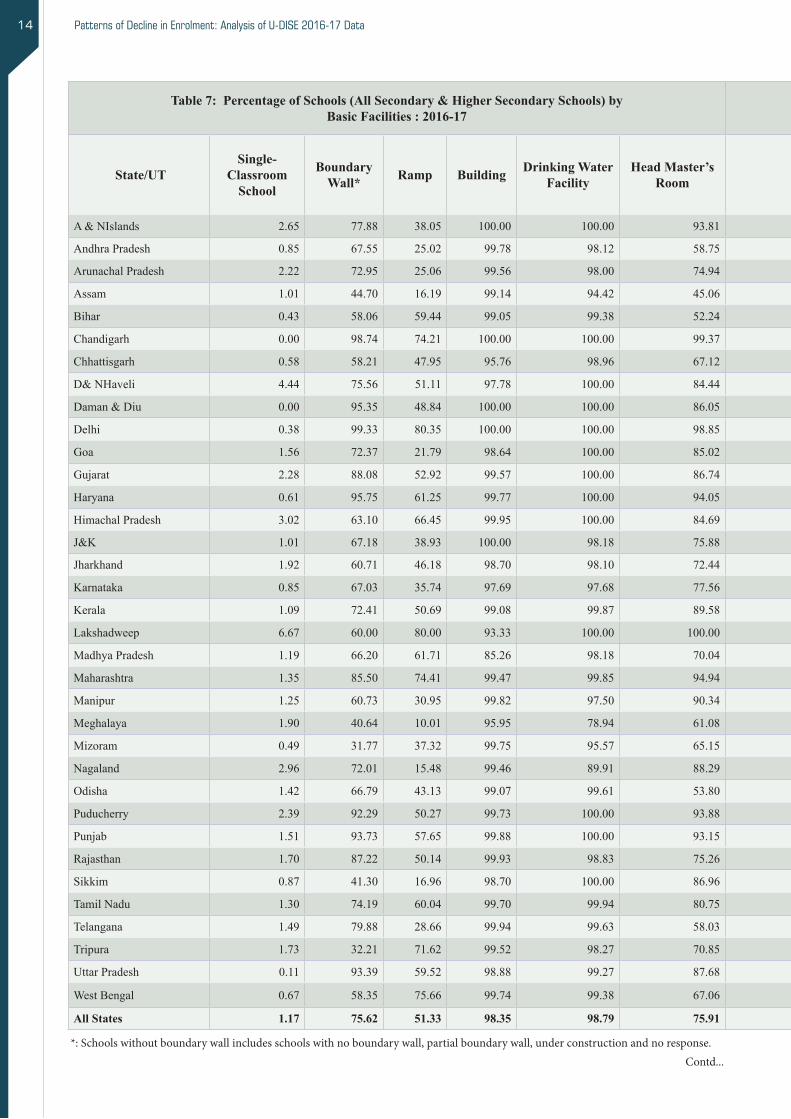
Facilities in SchoolsAcursorylookatschoolswithregardtofacilities
(Table 7) in Secondary and Higher Secondaryschools(AllSchools)revealsthattheyarebetterplaced than the same in case of the elementary schools. However, there are a few facilityindicatorswhichneedfurtherimprovement.
a) Single-Classroom & Single-Teacher SchoolsOf the total 228.9 thousand schools imparting

Patterns of Decline in Enrolment: Analysis of U-DISE 2016-17 Data12
Table 6: Percentage of Higher Secondary Schools/Sections by Management: 2016-17
State/UTAll Government Managements Private Aided Private Un-aided
TotalNumber % Number % Number %
A&NIslands 54 85.71 2 3.17 7 11.11 63
AndhraPradesh 326 91.06 2 0.56 28 7.82 358ArunachalPradesh 120 75.95 9 5.70 26 16.46 158Assam 1168 54.48 258 12.03 535 24.95 2144Bihar 3491 84.75 60 1.46 307 7.45 4119Chandigarh 45 47.87 7 7.45 42 44.68 94Chhattisgarh 2544 63.81 96 2.41 1347 33.78 3987D&NHaveli 15 71.43 0 0.00 6 28.57 21Daman&Diu 14 58.33 3 12.50 7 29.17 24Delhi 964 56.08 163 9.48 592 34.44 1719Goa 17 14.78 86 74.78 12 10.43 115
Gujarat 550 7.86 3148 44.99 3296 47.11 6997Haryana 1937 43.26 155 3.46 2366 52.84 4478
HimachalPradesh 1759 74.31 - 0.00 608 25.69 2367Jammu&Kashmir 668 62.49 - 0.00 401 37.51 1069Jharkhand 986 64.87 50 3.29 431 28.36 1520Karnataka 1417 29.73 752 15.78 2595 54.45 4766Kerala 1000 33.56 951 31.91 989 33.19 2980Lakshadweep 13 100.00 - 0.00 4303 33100.00 13Madhya Pradesh 3959 46.51 250 2.94 2769 32.53 8513Maharashtra 434 4.78 5873 64.62 146 1.61 9089Manipur 65 30.09 5 2.31 125 57.87 216Meghalaya 40 12.86 124 39.87 - 0.00 311Mizoram 25 15.24 20 12.20 113 68.90 164Nagaland 54 31.40 - 0.00 118 68.60 172Odisha 330 21.72 568 37.39 507 33.38 1519Puducherry 66 38.15 11 6.36 96 55.49 173Punjab 2338 46.82 287 5.75 2163 43.31 4994Rajasthan 9892 57.18 - 0.00 7395 42.75 17300Sikkim 74 85.06 2 2.30 11 12.64 87Tamil Nadu 3231 44.84 1196 16.60 2774 38.50 7206Telangana 866 38.51 36 1.60 1346 59.85 2249Tripura 362 86.19 29 6.90 26 6.19 420Uttar Pradesh 928 5.34 4306 24.77 11807 67.91 17386Uttaranchal 1360 60.04 324 14.30 577 25.47 2265WestBengal 6223 88.03 47 0.66 418 5.91 7069All States 47335 40.76 18820 16.21 48289 41.58 116125
Secondary and Higher Secondary education,only 1.17 percent schools are single-classroomschool but the percentage of such schools in a few states is a bit higher than at the all-Indialevel.Ontheotherhand,Daman&Diuistheonlystatewhichhasreportedthattherewasnosingle-classroomschoolin2016-17.Smallerstates,suchasLakshadweep (6.67percent),Dadra&NagarHaveli(4.44percent),Nagaland(2.96percent)etc
havereportedslightlyahigherpercentageofsuchschools than in other states.Though bothBiharand Uttar Pradesh have negligible percentageof single-classroom schools but Gujarat (2.28percent), Himachal Pradesh (3.02 percent),Jharkhand (1.92 percent) and Rajasthan (1.70percent)haveslightlyahigherpercentageofsuchschools. It may also be observed that becauseof SSA interventions, percentage of elementary
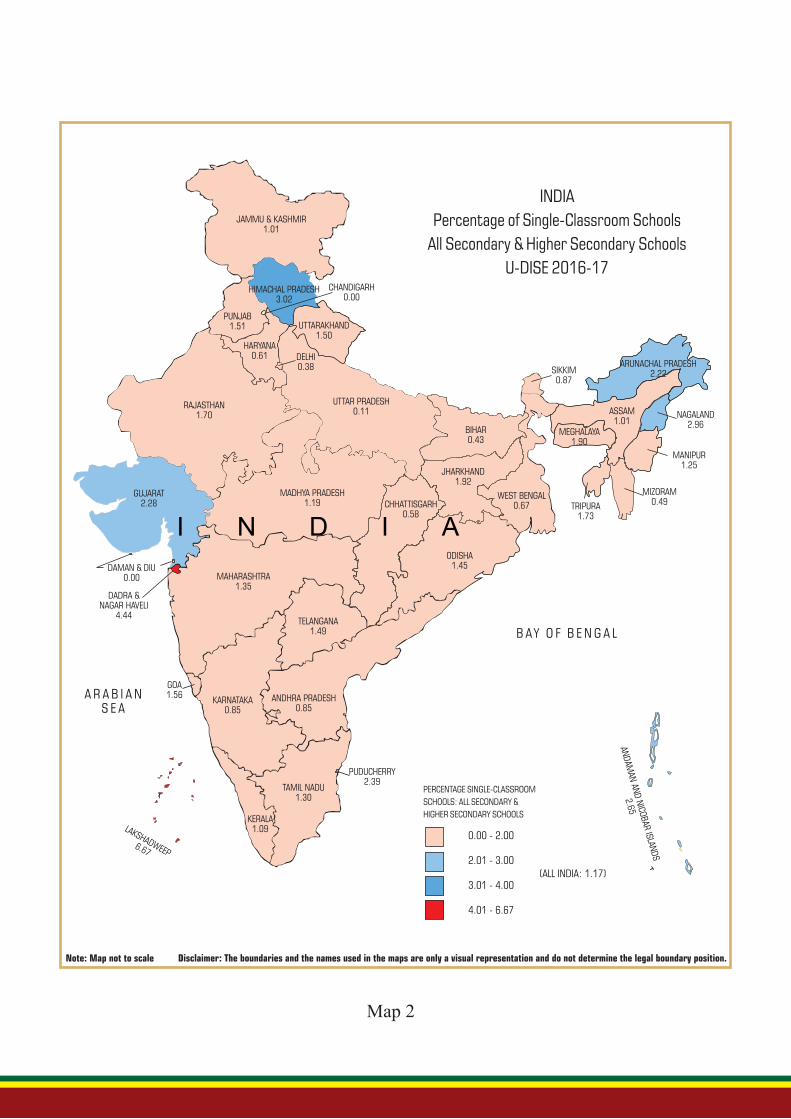
Map 2
(ALL INDIA: 1.17)
CHANDIGARH0.00
JAMMU & KASHMIR1.01
HIMACHAL PRADESH3.02
PUNJAB1.51
RAJASTHAN1.70
MADHYA PRADESH1.19 CHHATTISGARH
0.58
JHARKHAND1.92
WEST BENGAL0.67
BIHAR0.43
SIKKIM0.87
MEGHALAYA1.90
ASSAM1.01
NAGALAND2.96
ARUNACHAL PRADESH2.22
MANIPUR1.25
MIZORAM0.49TRIPURA
1.73
ODISHA1.45
MAHARASHTRA1.35
DAMAN & DIU0.00
GUJARAT2.28
DADRA & NAGAR HAVELI
4.44
A R A B I A N S E A
GOA1.56
B AY O F B E N G A L
KERALA1.09
KARNATAKA0.85
ANDHRA PRADESH0.85
TELANGANA1.49
PUDUCHERRY2.39
LAKSHADWEEP6.67
TAMIL NADU1.30
AND
AMAN
AND
NICO
BAR ISLAND
S
2.65
DELHI0.38
UTTARAKHAND1.50
UTTAR PRADESH0.11
HARYANA0.61
0.00 - 2.00
2.01 - 3.00
3.01 - 4.00
4.01 - 6.67
Note: Map not to scale Disclaimer: The boundaries and the names used in the maps are only a visual representation and do not determine the legal boundary position.
INDIA
Percentage of Single-Classroom Schools
All Secondary & Higher Secondary Schools
U-DISE 2016-17
PERCENTAGE SINGLE-CLASSROOM
SCHOOLS: ALL SECONDARY &
HIGHER SECONDARY SCHOOLS
Patterns of Decline in Enrolment: Analysis of U-DISE 2016-17 Data14
Table 7: Percentage of Schools (All Secondary & Higher Secondary Schools) by Basic Facilities : 2016-17
Table 7: Percentage of Schools (All Secondary & Higher Secondary Schools) by Basic Facilities : 2016-17
State/UTSingle-
Classroom School
Boundary Wall* Ramp Building Drinking Water
FacilityHead Master’s
RoomElectricity Connection Computer Computer
& InternetLibrary Facility
Play-ground Facility
Boys' Toilet Girls' Toilet State/UT
A&NIslands 2.65 77.88 38.05 100.00 100.00 93.81 100.00 95.58 60.18 100.00 71.68 100.00 100.00 A&NIslands
AndhraPradesh 0.85 67.55 25.02 99.78 98.12 58.75 96.67 77.16 34.88 94.43 82.06 99.91 99.95 AndhraPradesh
ArunachalPradesh 2.22 72.95 25.06 99.56 98.00 74.94 80.71 85.59 34.37 69.40 75.39 98.62 99.56 ArunachalPradesh
Assam 1.01 44.70 16.19 99.14 94.42 45.06 78.05 50.41 12.60 71.82 65.15 77.08 84.90 Assam
Bihar 0.43 58.06 59.44 99.05 99.38 52.24 75.43 34.28 10.42 88.79 73.13 97.31 98.44 Bihar
Chandigarh 0.00 98.74 74.21 100.00 100.00 99.37 100.00 100.00 100.00 100.00 97.48 100.00 100.00 Chandigarh
Chhattisgarh 0.58 58.21 47.95 95.76 98.96 67.12 91.73 48.41 19.78 94.19 70.20 98.87 99.00 Chhattisgarh
D&NHaveli 4.44 75.56 51.11 97.78 100.00 84.44 100.00 97.78 86.67 95.56 77.78 100.00 100.00 D&NHaveli
Daman&Diu 0.00 95.35 48.84 100.00 100.00 86.05 100.00 97.67 93.02 100.00 69.77 100.00 100.00 Daman&Diu
Delhi 0.38 99.33 80.35 100.00 100.00 98.85 99.95 92.76 90.42 99.66 91.57 100.00 100.00 Delhi
Goa 1.56 72.37 21.79 98.64 100.00 85.02 100.00 98.64 92.02 99.22 67.70 100.00 100.00 Goa
Gujarat 2.28 88.08 52.92 99.57 100.00 86.74 100.00 86.61 63.84 89.01 89.09 99.88 99.86 Gujarat
Haryana 0.61 95.75 61.25 99.77 100.00 94.05 99.67 94.73 72.07 98.84 91.65 99.39 99.79 Haryana
HimachalPradesh 3.02 63.10 66.45 99.95 100.00 84.69 99.12 82.64 53.15 98.79 94.99 100.00 100.00 HimachalPradesh
J&K 1.01 67.18 38.93 100.00 98.18 75.88 86.25 63.73 21.53 92.17 77.34 98.87 99.59 J&K
Jharkhand 1.92 60.71 46.18 98.70 98.10 72.44 66.34 46.85 27.32 90.95 72.97 97.76 98.41 Jharkhand
Karnataka 0.85 67.03 35.74 97.69 97.68 77.56 96.20 68.16 29.94 95.60 83.57 96.67 96.86 Karnataka
Kerala 1.09 72.41 50.69 99.08 99.87 89.58 98.72 98.30 92.96 98.70 89.14 99.74 99.72 Kerala
Lakshadweep 6.67 60.00 80.00 93.33 100.00 100.00 100.00 100.00 93.33 100.00 73.33 100.00 100.00 Lakshadweep
Madhya Pradesh 1.19 66.20 61.71 85.26 98.18 70.04 77.19 52.56 34.37 89.61 76.81 95.19 95.84 Madhya Pradesh
Maharashtra 1.35 85.50 74.41 99.47 99.85 94.94 96.34 94.25 62.89 97.51 96.18 99.59 99.78 Maharashtra
Manipur 1.25 60.73 30.95 99.82 97.50 90.34 84.97 82.83 27.10 82.11 75.85 99.54 99.46 Manipur
Meghalaya 1.90 40.64 10.01 95.95 78.94 61.08 70.90 42.36 16.64 35.54 56.78 76.90 75.26 Meghalaya
Mizoram 0.49 31.77 37.32 99.75 95.57 65.15 90.02 52.59 20.20 47.17 30.17 98.40 99.14 Mizoram
Nagaland 2.96 72.01 15.48 99.46 89.91 88.29 83.85 91.25 31.36 65.55 62.85 99.59 99.60 Nagaland
Odisha 1.42 66.79 43.13 99.07 99.61 53.80 73.55 51.01 21.23 95.06 65.43 94.48 97.04 Odisha
Puducherry 2.39 92.29 50.27 99.73 100.00 93.88 100.00 100.00 90.69 100.00 87.77 100.00 100.00 Puducherry
Punjab 1.51 93.73 57.65 99.88 100.00 93.15 99.98 98.60 86.27 98.70 98.54 99.70 99.93 Punjab
Rajasthan 1.70 87.22 50.14 99.93 98.83 75.26 91.93 64.83 40.06 90.46 71.72 99.82 99.86 Rajasthan
Sikkim 0.87 41.30 16.96 98.70 100.00 86.96 96.96 95.65 42.17 93.91 84.35 100.00 100.00 Sikkim
Tamil Nadu 1.30 74.19 60.04 99.70 99.94 80.75 99.95 88.21 79.21 99.54 84.99 99.98 99.99 Tamil Nadu
Telangana 1.49 79.88 28.66 99.94 99.63 58.03 96.70 74.53 30.96 91.10 76.86 98.46 99.44 Telangana
Tripura 1.73 32.21 71.62 99.52 98.27 70.85 84.08 54.65 9.59 63.37 82.45 100.00 100.00 Tripura
Uttar Pradesh 0.11 93.39 59.52 98.88 99.27 87.68 78.07 37.82 17.26 76.27 59.91 99.49 99.56 Uttar Pradesh
WestBengal 0.67 58.35 75.66 99.74 99.38 67.06 96.17 71.49 42.33 94.19 64.55 99.12 99.59 WestBengal
All States 1.17 75.62 51.33 98.35 98.79 75.91 89.95 68.67 41.43 90.59 77.70 97.81 98.39 All States
*: Schools without boundary wall includes schools with no boundary wall, partial boundary wall, under construction and no response.Contd...

Implications for Universal Secondary Education in India 15
Table 7: Percentage of Schools (All Secondary & Higher Secondary Schools) by Basic Facilities : 2016-17
Table 7: Percentage of Schools (All Secondary & Higher Secondary Schools) by Basic Facilities : 2016-17
State/UTSingle-
Classroom School
Boundary Wall* Ramp Building Drinking Water
FacilityHead Master’s
RoomElectricity Connection Computer Computer
& InternetLibrary Facility
Play-ground Facility
Boys' Toilet Girls' Toilet State/UT
A&NIslands 2.65 77.88 38.05 100.00 100.00 93.81 100.00 95.58 60.18 100.00 71.68 100.00 100.00 A&NIslands
AndhraPradesh 0.85 67.55 25.02 99.78 98.12 58.75 96.67 77.16 34.88 94.43 82.06 99.91 99.95 AndhraPradesh
ArunachalPradesh 2.22 72.95 25.06 99.56 98.00 74.94 80.71 85.59 34.37 69.40 75.39 98.62 99.56 ArunachalPradesh
Assam 1.01 44.70 16.19 99.14 94.42 45.06 78.05 50.41 12.60 71.82 65.15 77.08 84.90 Assam
Bihar 0.43 58.06 59.44 99.05 99.38 52.24 75.43 34.28 10.42 88.79 73.13 97.31 98.44 Bihar
Chandigarh 0.00 98.74 74.21 100.00 100.00 99.37 100.00 100.00 100.00 100.00 97.48 100.00 100.00 Chandigarh
Chhattisgarh 0.58 58.21 47.95 95.76 98.96 67.12 91.73 48.41 19.78 94.19 70.20 98.87 99.00 Chhattisgarh
D&NHaveli 4.44 75.56 51.11 97.78 100.00 84.44 100.00 97.78 86.67 95.56 77.78 100.00 100.00 D&NHaveli
Daman&Diu 0.00 95.35 48.84 100.00 100.00 86.05 100.00 97.67 93.02 100.00 69.77 100.00 100.00 Daman&Diu
Delhi 0.38 99.33 80.35 100.00 100.00 98.85 99.95 92.76 90.42 99.66 91.57 100.00 100.00 Delhi
Goa 1.56 72.37 21.79 98.64 100.00 85.02 100.00 98.64 92.02 99.22 67.70 100.00 100.00 Goa
Gujarat 2.28 88.08 52.92 99.57 100.00 86.74 100.00 86.61 63.84 89.01 89.09 99.88 99.86 Gujarat
Haryana 0.61 95.75 61.25 99.77 100.00 94.05 99.67 94.73 72.07 98.84 91.65 99.39 99.79 Haryana
HimachalPradesh 3.02 63.10 66.45 99.95 100.00 84.69 99.12 82.64 53.15 98.79 94.99 100.00 100.00 HimachalPradesh
J&K 1.01 67.18 38.93 100.00 98.18 75.88 86.25 63.73 21.53 92.17 77.34 98.87 99.59 J&K
Jharkhand 1.92 60.71 46.18 98.70 98.10 72.44 66.34 46.85 27.32 90.95 72.97 97.76 98.41 Jharkhand
Karnataka 0.85 67.03 35.74 97.69 97.68 77.56 96.20 68.16 29.94 95.60 83.57 96.67 96.86 Karnataka
Kerala 1.09 72.41 50.69 99.08 99.87 89.58 98.72 98.30 92.96 98.70 89.14 99.74 99.72 Kerala
Lakshadweep 6.67 60.00 80.00 93.33 100.00 100.00 100.00 100.00 93.33 100.00 73.33 100.00 100.00 Lakshadweep
Madhya Pradesh 1.19 66.20 61.71 85.26 98.18 70.04 77.19 52.56 34.37 89.61 76.81 95.19 95.84 Madhya Pradesh
Maharashtra 1.35 85.50 74.41 99.47 99.85 94.94 96.34 94.25 62.89 97.51 96.18 99.59 99.78 Maharashtra
Manipur 1.25 60.73 30.95 99.82 97.50 90.34 84.97 82.83 27.10 82.11 75.85 99.54 99.46 Manipur
Meghalaya 1.90 40.64 10.01 95.95 78.94 61.08 70.90 42.36 16.64 35.54 56.78 76.90 75.26 Meghalaya
Mizoram 0.49 31.77 37.32 99.75 95.57 65.15 90.02 52.59 20.20 47.17 30.17 98.40 99.14 Mizoram
Nagaland 2.96 72.01 15.48 99.46 89.91 88.29 83.85 91.25 31.36 65.55 62.85 99.59 99.60 Nagaland
Odisha 1.42 66.79 43.13 99.07 99.61 53.80 73.55 51.01 21.23 95.06 65.43 94.48 97.04 Odisha
Puducherry 2.39 92.29 50.27 99.73 100.00 93.88 100.00 100.00 90.69 100.00 87.77 100.00 100.00 Puducherry
Punjab 1.51 93.73 57.65 99.88 100.00 93.15 99.98 98.60 86.27 98.70 98.54 99.70 99.93 Punjab
Rajasthan 1.70 87.22 50.14 99.93 98.83 75.26 91.93 64.83 40.06 90.46 71.72 99.82 99.86 Rajasthan
Sikkim 0.87 41.30 16.96 98.70 100.00 86.96 96.96 95.65 42.17 93.91 84.35 100.00 100.00 Sikkim
Tamil Nadu 1.30 74.19 60.04 99.70 99.94 80.75 99.95 88.21 79.21 99.54 84.99 99.98 99.99 Tamil Nadu
Telangana 1.49 79.88 28.66 99.94 99.63 58.03 96.70 74.53 30.96 91.10 76.86 98.46 99.44 Telangana
Tripura 1.73 32.21 71.62 99.52 98.27 70.85 84.08 54.65 9.59 63.37 82.45 100.00 100.00 Tripura
Uttar Pradesh 0.11 93.39 59.52 98.88 99.27 87.68 78.07 37.82 17.26 76.27 59.91 99.49 99.56 Uttar Pradesh
WestBengal 0.67 58.35 75.66 99.74 99.38 67.06 96.17 71.49 42.33 94.19 64.55 99.12 99.59 WestBengal
All States 1.17 75.62 51.33 98.35 98.79 75.91 89.95 68.67 41.43 90.59 77.70 97.81 98.39 All States
*: Schools without boundary wall includes schools with no boundary wall, partial boundary wall, under construction and no response.

Patterns of Decline in Enrolment: Analysis of U-DISE 2016-17 Data16
at theState level. It ishoped that all thevacantsanctionedpositionsofteacherswouldbefilled-up quickly to ensure smooth teaching-learningtransaction across the Country.
b) Schools with BuildingOn the one hand a few Secondary and HigherSecondary schoolshaveonlyoneclassroom,onthe other hand, a few of such schools even donot a school building; however percentage ofsuchschoolsislow.About98percentofthetotalSecondary and Higher Secondary schools havehad a school building in 2016-17. Most of thestateshaveprovidedbuildingtoallofitsschoolsimparting Secondary and Higher Secondaryeducation. However, a few states, such asChhattisgarh(95.76percent),Goa(98.64percent),Karnataka (97.69 percent) and Lakshadweep
(93.33percent)areyettoprovideschoolbuildingto all of its Secondary and Higher Secondaryschools.Ontheotherhand,AndmanandNicobarIslands,Chandigarh,DamanandDiu,DelhiandJammu and Kashmir have provided building toallofitsschoolsimpartingSecondaryandHigherSecondary schools.
c) Schools with ToiletPercentageofschoolswithtoiletsingeneralandgirl’stoiletinparticularhasincreasedimpressivelyacross the Country after the Prime Minister’sannouncement in August 2014. State-specific
schoolshavingsingle-classroomhavecomedownsignificantly over a period of time.All schoolstogether(1to12)haveonly3.49percentsingle-classroomschoolsin2016-17butintheabsoluteterms,thenumberofsuchschoolsisashighas54thousand.
In addition, to single-classroom schools, therewereabout7.03percentsingle-teacherschoolsin2016-17(1,07,953schools)whichbyallmeansisconsideredhigh.InareplytoParliamentQuestiononJuly2018,MinisterofState(HRD)statedthatoveronemillionposts(ason31stMarch2017)ofteachers at the elementary and secondary levelsofeducationarelyingvacantacrosstheCountry.TheParliamentwas also informed that out of atotalof51,03,539sanctionedpostsofteachersatthe elementary level, about 17.64 percent posts
(9,00,316teacherspositions)arelyingvacantwithUttarPradeshtopsthelistattheelementaryleveland Jammu andKashmir at the secondary levelwiththemaximumnumberofvacancies(reportedby Press Trust of India,July30,2017).InBihartoo, about 34.42 percent of the total 5,92,514sanctioned posts were lying vacant. It may berecalled that over amillion contractual teachersareteachinginelementaryclasses.Inmanystates,only contractual teachershavebeen recruited intherecentpastandregularteachershavenotbeenadequately appointed.Even requisite number ofapplicants couldn’t qualify Teachers EligibilityTest (TET) both at the Central/CBSE and also
Patterns of Decline in Enrolment: Analysis of U-DISE 2016-17 Data
15
is much higher than the same at the all-Indialevel(39.81 percent in 2016-17 compared to 35.06
percent in 2012-13).As manyas12stateshavethispercentagehigherthanattheall-Indialevelin
2016-17.AndhraPradesh(39.04percent),Haryana(54.37percent),JammuandKashmir(40.75
percent),Karnataka(41.25percent),MadhyaPradesh(44.66percent),Puducherry(54.72percent),
Punjab(45.08percent),Rajasthan(50.24percent),Telangana(49.28percent)andUttar Pradesh
(69.93percent)arefewsuchstates.QuiteafewstatesfromtheNorth-Eastern part of the Country
too havethispercentagehigherthanattheall-Indialevel.Manipur(53.23 percent),
Figure 2
Meghalaya(41.89percent) and Nagaland(55.66 percent)aresuchstates. In addition, about 1.01
percentschoolsarebeingmanagedbytheCentralGovernment 2,505schools). Ontheotherhand,
about 1.12 percent of total Secondary schoolsareunrecognized(2,800)and another 0.61 and 0.21
percent recognized(1,515)andunrecognized(514)Madrasas respectively.
AlmostsimilarpictureemergeswhenpercentageofHigherSecondaryschoolsbymanagement
(Table3)isanalyzedwhichshowsthatabout41percentHigherSecondaryschools/sectionsare
beingmanagedbytheGovernmentmanagementscomparedto1.70percentschoolsmanagedby
theCentralGovernment.ThepercentageofHigherSecondaryschools/sections being managed by
thePrivateAided andUnaidedmanagements in 2016-17was 16.21 and41.58 respectively as
compared to 13.99 and 41.04 percent in 2012-13.
0
10
20
30
40
50
2012-13 2013-14 2014-15 2015-16 2016-17
43.5
4
42.8
4
42.7
7
42.2
6
42.1
9
41.6
9
35.8
3
39.8
6
40.6
40.7
6
Percentage Schools Managed by Government Managements: 2012-13 to 2016-17 Secondary & Higher Secondary Schools
Figure 2
Implications for Universal Secondary Education in India 17
have provided electricity connection to all ofits Secondary and Higher Secondary schoolscomparedto75.43percentsuchschoolsinBihar,66.34 percent in Jharkhand, 78.05 percent inAssam and 73.55 percent in Odisha. Despitebeinghavinganelectricityconnectioninschool,still there is no guarantee that schools get regular interruptedpower supply.State-specific analysis(Table 7) further reveals thatmost of the stateshaveprovideddrinkingwaterfacilitytoitsschoolsbut corresponding percentage of such Secondary and Higher Secondary schools in Meghalaya(78.94 percent) ismuch lower than the same inotherstates.Asmanyas12stateshaveprovideddrinkingwaterfacilitytoallofitsSecondaryandHigher Secondary schools and remaining statestoohavethepercentageabove98percent.
Further, it is observed that ramp is available inonly 33.87 percent of the total schools imparting school education and the percentage in case of HigherSecondaryonlyschoolsisaslowas26.79percent compared to 27.76 percent in Secondary schools. All Secondary and Higher Secondaryschoolstogetherhavehadrampin51.33percentschoolsin2016-17.Percentageofschoolshavingrampshowsdeclineoverthepreviousyearbecauseof the change in the computation definition. In2016-17, percentage is computed irrespectiveofwhether schools needor does not need rampinstead of percentage based on schools in need of
percentage of boys and girls toilets have beenpresentedinTable7whichrevealsthatatleast10stateshavehadprovidedtoiletstoallofitsschoolsin2016-17.However, thepercentageof schoolswithtoiletinafewotherstatesisabitlowerthanthesameattheall-Indialevel.Andman&NicobarIslands,Dadra&NagarHaveli,Daman&Diu,Delhi, Goa, Himachal Pradesh, Lakshadweep,Puducherry, Sikkim and Tripura have providedtoilets toallboys’andgirls’ in itsSecondary&HigherSecondaryschools.However,onlyafewschools have got a separate toilet for CWSNchildren.The lowest percentageof schoolswithboys (76.90 percent) and girls (75.26 percent)toiletisobservedtobeinthestateofMeghalayafollowed by Assam, (Boys, 77.08 percent andGirls, 84.90 percent).With a littlemore efforts,Indiacanhavetoiletfacilityinallofitsschools.
d) Drinking Water, Electricity, Ramp, Laboratory & Other FacilitiesOneoftheotherfacilitiesthateveryschoolmusthave is availability of drinkingwater in school.U-DISEdatarevealsthatmorethan98percentofthetotalschoolsthatimpartSecondaryandHigherSecondaryeducationintheCountryhavedrinkingwaterfacilityinschoolcomparedto89.95percentschools having an electricity connection (Table7). States such as Andaman& Nicobar Islands,Chandigarh,D&NHaveli,Daman&Diu,Delhi,Goa, Gujarat, Lakshadweep and Puducherry
Patterns of Decline in Enrolment: Analysis of U-DISE 2016-17 Data
16
Figure 3
Inat leasteightstates,morethanhalfofthetotalHigher Secondary schools/sections are being
managedbythePrivateUnaidedmanagementsandthepercentageofsuchschoolsisashighas
68.90 percent in Meghalaya,67.91percentinUttarPradesh,59.85percentinTelangana,54.45
percentinKarnataka,52.84percentinHaryana and 57.87 percent in Manipur. Ontheotherhand,
percentage of such HigherSecondaryschoolswasaslowas7.45inBihar,10.43inGoa,1.61in
Maharashtra,12.64inSikkim,6.19 in Tripura and 5.91 in WestBengalbecauseofwhichHigher
Secondary schools managed bytheGovernmentandAidedmanagementsinthesestatesisquite
high compared to other states.
Facilities in Schools
Acursorylookatschoolswithregardtofacilities(Table6)inSecondaryandHigherSecondary
schools (AllSchools)revealsthattheyarebetterplacedthanthesameincaseofthe elementary
schools.However,thereareafewfacility indicatorswhichneedfurtherimprovement.
05
101520253035404550
2012-13 2013-14 2014-15 2015-16 2016-17
35.0
6
37.4
9
38.8
4
39.4
8
39.8
1
41.0
4
40.2
1
42.0
7
41.4
3
41.5
8
Percentage Schools Managed by Private Unaided Managements: 2012-13 to 2016-17
Secondary & Higher Secondary Schools
Figure 3

Patterns of Decline in Enrolment: Analysis of U-DISE 2016-17 Data18
availableinschoolbutthesameisavailableonlyin case of 78 percent Secondary and 80 percent HigherSecondaryschools(Table7).Allschools(15,35,610 schools) together have playgroundfacility only in case of 61.98 percent schools.
f) Head Master’s Room, Computer & Internet ConnectionDistributionofSecondaryandHigherSecondaryschoolsbyfacilitiesfurtherrevealsthatonlyfewschools have LaboratoryAssistant compared to75.91 percent schools having separate room forHead Master. Lakshadweep has provided HeadMaster’s room to all its Secondary and HigherSecondary schools. Percentage of schools withseparate HM’s room is also high in case ofChandigarhandDelhiastheyhaveprovidedthesame tomost of its schools in 2016-17.On theotherhand,Assam,Bihar,Chhattisgarh,Odisha,
Uttarakhand, West BengaletcareyettoprovideseparateHM’s room to themajorityof its schools imparting Secondary and HigherSecondary education.
So far as the Secondary and Higher Secondary schoolshavinggotaccesstocomputer
is concerned, the percentage of such schools isas low as 68.67 percent. However, Chandigarh,LakshadweepandPuducherryaretheonlystatesthosewhohaveprovidedcomputers toallof itsschools. On the other hand, the percentage ofschoolswithcomputersisaslowas34.28percentinBihar,46.85percentinJharkhand,52.56percentinMadhyaPradesh,51.01percentinOdishaand37.82percentinUttarPradesh.Havingprovidedcomputers need not necessary mean that schools have also got access to the internet connectionas the percentage of Secondary and HigherSecondaryschoolsthosewhohavegotaccesstocomputers has got the internet access only in case of 41.43 percent schools. Chandigarh is the only stateintheCountrywhichhadprovidedcomputerwithinternetfacilitytoitsallschools.Percentageof Secondary and Higher Secondary schoolswith computer and internet is as low as 10.42
ramp and having the same in school during thepreviousyear.
All schools together shows that 82.96 percenthave had Library in 2016-17 but many stand-aloneSecondary(79.83percent),SecondarywithHigherSecondary(90.70percent)andindependentHigher Secondary (85.94 percent) schoolsreported not having library facility in school in2016-17.About91percentSecondaryandHigherSecondary schools/sections had a library in school in2016-17butmajorityofsuchschoolsdoesn’thave full-time Librarian in school.As many as14stateshavelibraryincaseof80percentoftheSecondaryandHigherSecondaryschoolsbutthesame is not true forArunachal Pradesh,Assam,other states from the North Eastern Region and Uttar Pradesh, as a good number of schools inthesestatesareyettobeprovidedLibraryfacilitytoallofitsschools(Table7).
e) Boundary Wall & Playground Facility Quite similar to the situation at elementary level, notall the Secondary and Higher Secondary schools/sections in the Country have had boundary wall asthe percentage of such schools in 2016-17withboundarywasonly75.62.Noneof thestatehasreportedtohaveboundarywallinitsallschoolsin2016-17.However,ChandigarhUThasprovidedboundarywalltoits98.74SecondaryandHigherSecondary schools compared to 44.70 percent in Assam, 60.71 percent in Jharkhand, 41.30percent in Sikkim etc. Bihar (58.06 percent)too is yet to provide boundarywall to its largenumber of Secondary and Higher Secondaryschools compared to which Uttar Pradesh hasreasonably a higher percentage of such schools with boundarywall (93.39 percent) in 2016-17.ComparedtoSecondaryschools(84.34percent),more Higher Secondary(89.63 percent) schoolshaveboundarywallwhichismuchhigherthanthetotalnumberofschools(GradesItoXII)havingboundarywall(65.33percent).Playgroundisoneoftheotherimportantfacilitieswhichshouldbe
“U-DISE data reveals that more than 98 percent of the total schools that impart Secondary and Higher Secondary education in the Country have drinking water facility in school compared to 89.95 percent schools having an electricity connection”

Map 3
(ALL INDIA: 68.67)
CHANDIGARH100.00
JAMMU & KASHMIR63.73
HIMACHAL PRADESH82.64
PUNJAB98.60
RAJASTHAN64.83
MADHYA PRADESH52.56 CHHATTISGARH
48.41
JHARKHAND46.85
WEST BENGAL71.49
BIHAR34.28
SIKKIM95.65
MEGHALAYA42.36
ASSAM50.41
NAGALAND91.25
ARUNACHAL PRADESH85.59
MANIPUR82.83
MIZORAM52.59TRIPURA
54.65
ODISHA51.01
MAHARASHTRA94.25
DAMAN & DIU97.67
GUJARAT88.61
DADRA & NAGAR HAVELI
97.78
A R A B I A N S E A
GOA98.64
B AY O F B E N G A L
KERALA98.30
KARNATAKA68.16
ANDHRA PRADESH77.16
TELANGANA74.53
PUDUCHERRY100.00
LAKSHADWEEP100
TAMIL NADU88.21
AND
AMAN
AND
NICO
BAR ISLAND
S
95.58
DELHI92.76
UTTARAKHAND81.35
UTTAR PRADESH37.82
HARYANA94.73
34.41 - 50.00
50.01 - 70.00
70.01 - 90.00
90.01 - 100.00
Note: Map not to scale Disclaimer: The boundaries and the names used in the maps are only a visual representation and do not determine the legal boundary position.
PERCENTAGE OF SCHOOLS WITH
COMPUTER: ALL SECONDARY &
HIGHER SECONDARY SCHOOLS
INDIAPercentage of Schools with Computer
All Secondary & Higher Secondary Schools
U-DISE 2016-17

Patterns of Decline in Enrolment: Analysis of U-DISE 2016-17 Data20
of planners. Since theU-DISE data is availableby schools, SCR may be analysed school-wisewhichshalleventuallyhelpinidentifyingschoolswith the high SCR. Since RMSAwas confinedonly to Government schools and that too onlySecondaryschools,improvementinSCRmaynotbereflectedunlessalltheSecondaryandHigherSecondaryschools/sectionsarecoveredundertheprogrammeslike,Samagra Shiksha.
On the other hand, Pupil-Teacher Ratio (PTR)revealsthatonanaverageateacheristeaching27studentsinSecondaryand33studentsinHigherSecondaryclassesbutthereareafewschooltypes,suchasSecondarywithHigherSecondarywhereateacherisstillteaching47studentswhichisalsothe highest amongst six categories of secondary schools.Ontheotherhand,PrimarywithUpperPrimary & Secondary and Upper Primary withSecondary schools have the lowest PTR of 20studentsperteacher.Barringafewstates,byandlarge pupil-teacher ratio both at the Secondaryand Higher Secondary levels of education in2016-17was observed to be comfortable.Bihar(Secondary 69 students per teacher), Jharkhand(54and61studentsperteacheratSecondaryandHigherSecondary levels) andUttarPradesh (53and 90 students per teacher at Secondary and Higher Secondary levels) are a few such states.Inviewofthelargenumberofstudentsinaclass,itmightbedifficult for a teacher tomanage theaffairs in the class. Compared to the Secondarylevel, barring a few states, Higher Secondaryclasses have however a fewer students.As hasalready been reported that the same is alarmingly highinBihar(64studentsperteacher),Jharkhand(58students)andUttarPradesh(65students).InsmallerstatesandinstatesfromtheNorth-EasternRegionoftheCountry,Pupil-TeacherRatiobothattheSecondaryandHigherSecondarylevelsofeducationisquitecomfortablewhichwithafewexceptions is also true for the same at the Primary andUpperPrimarylevelsofeducation.Analysispresentedabovereveals thatwithregardtobothstudents per classroom and students per teacher schoolsarenowmorecomfortablethanthesameafewyearsback.
percentinBiharand17.26percentincaseofthemostpopulousstateoftheCountry,namelyUttarPradeshwhich incidentally also has the highestnumber of schools across the Country.
Pupil-Teacher & Student-ClassroomRatioPupil-TeacherRatio(PTR)andStudent-ClassroomRatio(SCR)arethenextsetofindicatorswhichhavebeenanalysed(Table3).SCRatSecondarylevel reveals that as many as 44 students (54studentsin2012-13)sitinoneclassroomwhichisashighas52and65respectivelyinthecaseofUpperPrimarywithSecondary&HigherSecondaryandSecondary&Higher Secondary schools.At theHigherSecondary level, irrespectiveofaschooltype, the same is as a high as 48 students perclassroomincaseof theSecondarywithHigherSecondary and lowest 37 students per class incaseof the integratedHigherSecondaryschools(GradesItoXII).Further,SCRattheSecondaryand Higher Secondary level indicates that asmany as 44 and 43 students sit in one classroom respectively. In many states, such as Bihar (98studentsinSecondaryand66studentsinHigherSecondary),Jharkhand(54and64students),UttarPradesh(47and58students)andWestBengal(67and52 students), SCR is very high.The lowestSCR, however is observed in Mizoram (22studentsperclassroom)incaseofSecondaryand26studentsperclassroominHimachalPradeshatHigherSecondarylevelofeducation.Inasmanyas5states,SCRatSecondary level isabove50students per classroom compared to 6 states at the HigherSecondarylevelofeducation.Ontheotherhand, 8 states had a low SCR (30 or below) atSecondarylevelcomparedto4statesattheHigherSecondarylevelofeducation.SCRatSecondaryandHigherSecondarylevelstogetherrevealsthatinafewstates,thesameisashighas86studentsperclassroominBihar,61studentsperclassroominWestBengaland55studentsperclassroominthestateofJharkhandallwhichrevealsthatdespitethe improvement in the recent past, the same isstill a bit higher than the prescribed norms. The highSCRmayhaveadverseimpactonteaching-learning process and need immediate attention
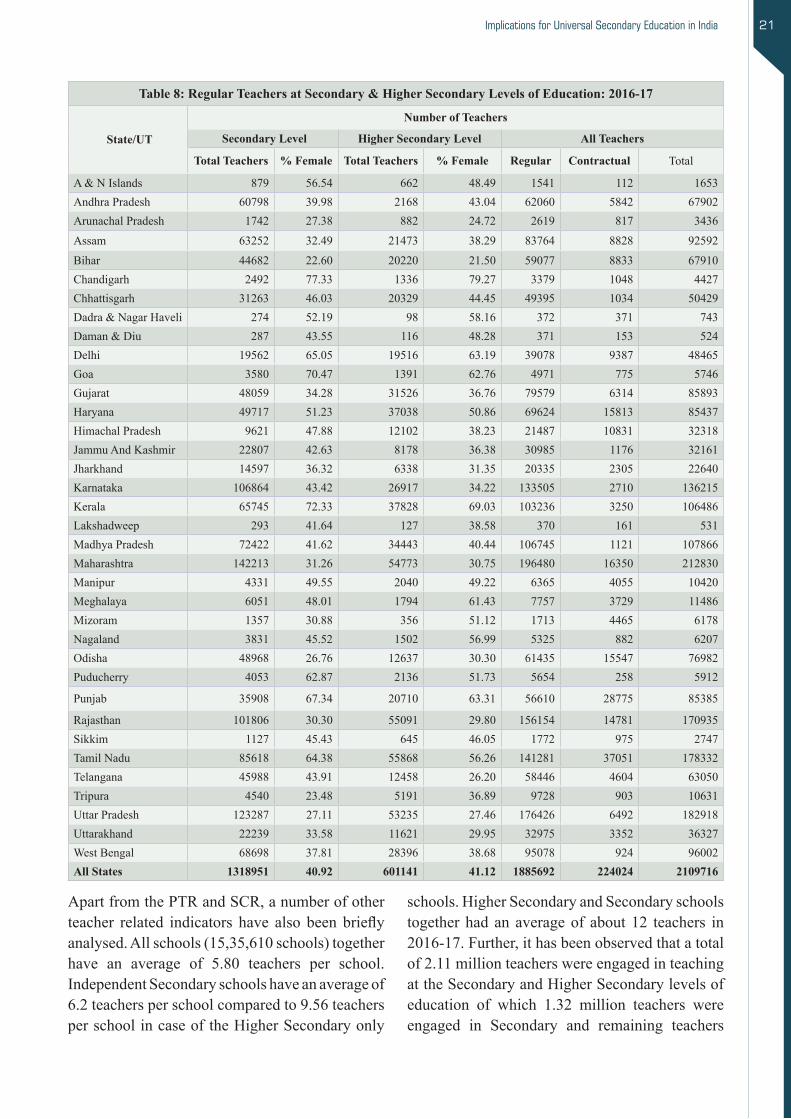
Implications for Universal Secondary Education in India 21
schools.HigherSecondaryandSecondaryschoolstogetherhadan averageof about12 teachers in2016-17.Further,ithasbeenobservedthatatotalof2.11millionteacherswereengagedinteachingattheSecondaryandHigherSecondarylevelsofeducation of which 1.32 million teachers wereengaged in Secondary and remaining teachers
ApartfromthePTRandSCR,anumberofotherteacher related indicators have also been brieflyanalysed.Allschools(15,35,610schools)togetherhave an average of 5.80 teachers per school.IndependentSecondaryschoolshaveanaverageof6.2 teachers per school compared to 9.56 teachers perschoolincaseoftheHigherSecondaryonly
Table 8: Regular Teachers at Secondary & Higher Secondary Levels of Education: 2016-17
State/UT
Number of Teachers
Secondary Level Higher Secondary Level All Teachers
Total Teachers % Female Total Teachers % Female Regular Contractual Total
A&NIslands 879 56.54 662 48.49 1541 112 1653AndhraPradesh 60798 39.98 2168 43.04 62060 5842 67902ArunachalPradesh 1742 27.38 882 24.72 2619 817 3436Assam 63252 32.49 21473 38.29 83764 8828 92592Bihar 44682 22.60 20220 21.50 59077 8833 67910Chandigarh 2492 77.33 1336 79.27 3379 1048 4427Chhattisgarh 31263 46.03 20329 44.45 49395 1034 50429Dadra&NagarHaveli 274 52.19 98 58.16 372 371 743Daman&Diu 287 43.55 116 48.28 371 153 524Delhi 19562 65.05 19516 63.19 39078 9387 48465Goa 3580 70.47 1391 62.76 4971 775 5746Gujarat 48059 34.28 31526 36.76 79579 6314 85893Haryana 49717 51.23 37038 50.86 69624 15813 85437HimachalPradesh 9621 47.88 12102 38.23 21487 10831 32318JammuAndKashmir 22807 42.63 8178 36.38 30985 1176 32161Jharkhand 14597 36.32 6338 31.35 20335 2305 22640Karnataka 106864 43.42 26917 34.22 133505 2710 136215Kerala 65745 72.33 37828 69.03 103236 3250 106486Lakshadweep 293 41.64 127 38.58 370 161 531Madhya Pradesh 72422 41.62 34443 40.44 106745 1121 107866Maharashtra 142213 31.26 54773 30.75 196480 16350 212830Manipur 4331 49.55 2040 49.22 6365 4055 10420Meghalaya 6051 48.01 1794 61.43 7757 3729 11486Mizoram 1357 30.88 356 51.12 1713 4465 6178Nagaland 3831 45.52 1502 56.99 5325 882 6207Odisha 48968 26.76 12637 30.30 61435 15547 76982Puducherry 4053 62.87 2136 51.73 5654 258 5912
Punjab 35908 67.34 20710 63.31 56610 28775 85385
Rajasthan 101806 30.30 55091 29.80 156154 14781 170935Sikkim 1127 45.43 645 46.05 1772 975 2747Tamil Nadu 85618 64.38 55868 56.26 141281 37051 178332Telangana 45988 43.91 12458 26.20 58446 4604 63050Tripura 4540 23.48 5191 36.89 9728 903 10631Uttar Pradesh 123287 27.11 53235 27.46 176426 6492 182918Uttarakhand 22239 33.58 11621 29.95 32975 3352 36327WestBengal 68698 37.81 28396 38.68 95078 924 96002All States 1318951 40.92 601141 41.12 1885692 224024 2109716
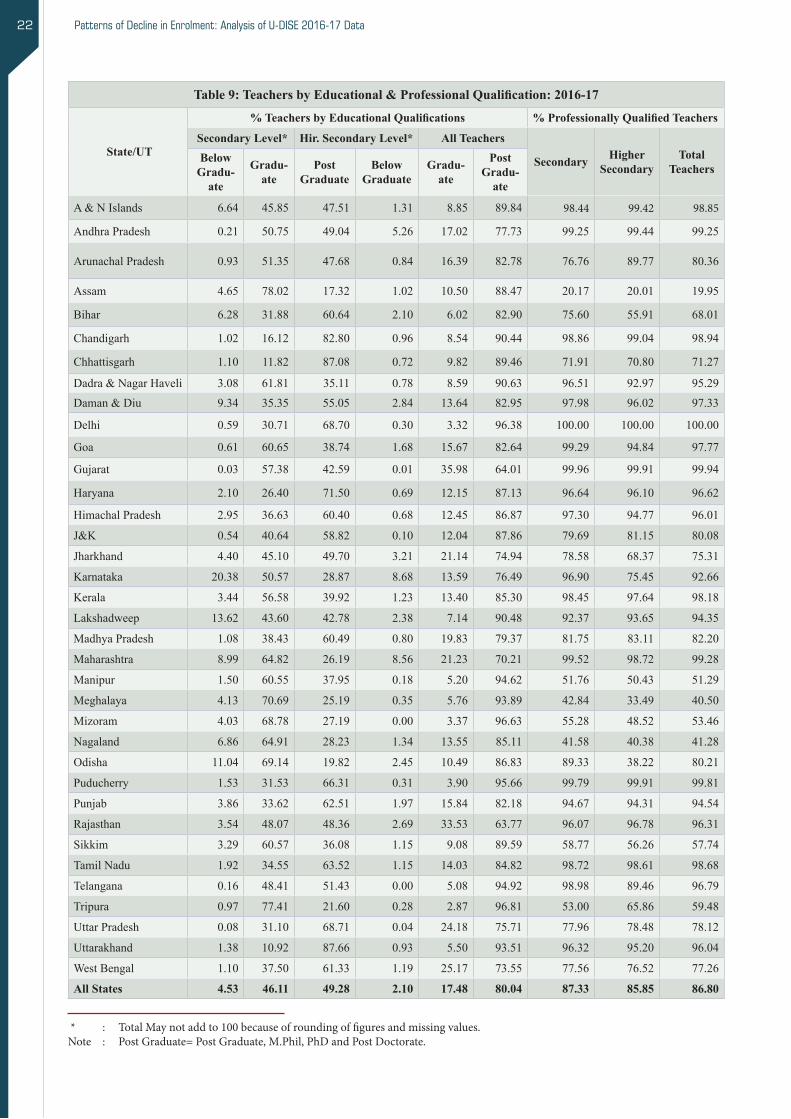
Patterns of Decline in Enrolment: Analysis of U-DISE 2016-17 Data22
Table 9: Teachers by Educational & Professional Qualification: 2016-17
State/UT
% Teachers by Educational Qualifications % Professionally Qualified Teachers
Secondary Level* Hir. Secondary Level* All Teachers
Secondary Higher Secondary
Total Teachers
Below Gradu-
ate
Gradu-ate
Post Graduate
Below Graduate
Gradu-ate
Post Gradu-
ate
A&NIslands 6.64 45.85 47.51 1.31 8.85 89.84 98.44 99.42 98.85
AndhraPradesh 0.21 50.75 49.04 5.26 17.02 77.73 99.25 99.44 99.25
ArunachalPradesh 0.93 51.35 47.68 0.84 16.39 82.78 76.76 89.77 80.36
Assam 4.65 78.02 17.32 1.02 10.50 88.47 20.17 20.01 19.95
Bihar 6.28 31.88 60.64 2.10 6.02 82.90 75.60 55.91 68.01
Chandigarh 1.02 16.12 82.80 0.96 8.54 90.44 98.86 99.04 98.94
Chhattisgarh 1.10 11.82 87.08 0.72 9.82 89.46 71.91 70.80 71.27
Dadra&NagarHaveli 3.08 61.81 35.11 0.78 8.59 90.63 96.51 92.97 95.29Daman&Diu 9.34 35.35 55.05 2.84 13.64 82.95 97.98 96.02 97.33
Delhi 0.59 30.71 68.70 0.30 3.32 96.38 100.00 100.00 100.00
Goa 0.61 60.65 38.74 1.68 15.67 82.64 99.29 94.84 97.77
Gujarat 0.03 57.38 42.59 0.01 35.98 64.01 99.96 99.91 99.94
Haryana 2.10 26.40 71.50 0.69 12.15 87.13 96.64 96.10 96.62
HimachalPradesh 2.95 36.63 60.40 0.68 12.45 86.87 97.30 94.77 96.01
J&K 0.54 40.64 58.82 0.10 12.04 87.86 79.69 81.15 80.08
Jharkhand 4.40 45.10 49.70 3.21 21.14 74.94 78.58 68.37 75.31
Karnataka 20.38 50.57 28.87 8.68 13.59 76.49 96.90 75.45 92.66
Kerala 3.44 56.58 39.92 1.23 13.40 85.30 98.45 97.64 98.18
Lakshadweep 13.62 43.60 42.78 2.38 7.14 90.48 92.37 93.65 94.35
Madhya Pradesh 1.08 38.43 60.49 0.80 19.83 79.37 81.75 83.11 82.20
Maharashtra 8.99 64.82 26.19 8.56 21.23 70.21 99.52 98.72 99.28
Manipur 1.50 60.55 37.95 0.18 5.20 94.62 51.76 50.43 51.29
Meghalaya 4.13 70.69 25.19 0.35 5.76 93.89 42.84 33.49 40.50
Mizoram 4.03 68.78 27.19 0.00 3.37 96.63 55.28 48.52 53.46
Nagaland 6.86 64.91 28.23 1.34 13.55 85.11 41.58 40.38 41.28
Odisha 11.04 69.14 19.82 2.45 10.49 86.83 89.33 38.22 80.21
Puducherry 1.53 31.53 66.31 0.31 3.90 95.66 99.79 99.91 99.81
Punjab 3.86 33.62 62.51 1.97 15.84 82.18 94.67 94.31 94.54
Rajasthan 3.54 48.07 48.36 2.69 33.53 63.77 96.07 96.78 96.31
Sikkim 3.29 60.57 36.08 1.15 9.08 89.59 58.77 56.26 57.74
Tamil Nadu 1.92 34.55 63.52 1.15 14.03 84.82 98.72 98.61 98.68
Telangana 0.16 48.41 51.43 0.00 5.08 94.92 98.98 89.46 96.79
Tripura 0.97 77.41 21.60 0.28 2.87 96.81 53.00 65.86 59.48
Uttar Pradesh 0.08 31.10 68.71 0.04 24.18 75.71 77.96 78.48 78.12
Uttarakhand 1.38 10.92 87.66 0.93 5.50 93.51 96.32 95.20 96.04
WestBengal 1.10 37.50 61.33 1.19 25.17 73.55 77.56 76.52 77.26
All States 4.53 46.11 49.28 2.10 17.48 80.04 87.33 85.85 86.80
* : Total May not add to 100 because of rounding of figures and missing values.Note : Post Graduate= Post Graduate, M.Phil, PhD and Post Doctorate.

Map 4
(ALL INDIA: 87.33)
CHANDIGARH97.86
JAMMU & KASHMIR79.69
HIMACHAL PRADESH97.30
PUNJAB94.67
RAJASTHAN96.67
MADHYA PRADESH81.75 CHHATTISGARH
71.91
JHARKHAND78.58
WEST BENGAL77.56
BIHAR75.60
SIKKIM58.77
MEGHALAYA42.84
ASSAM20.17
NAGALAND41.58
ARUNACHAL PRADESH76.76
MANIPUR51.76
MIZORAM55.28TRIPURA
53.00
ODISHA89.33
MAHARASHTRA99.52
DAMAN & DIU97.98
GUJARAT99.96
DADRA & NAGAR HAVELI
96.51
A R A B I A N S E A
GOA99.29
B AY O F B E N G A L
KERALA98.45
KARNATAKA96.90
ANDHRA PRADESH99.25
TELANGANA98.98
PUDUCHERRY99.79
LAKSHADWEEP92..37
TAMIL NADU98.72
AND
AMAN
AND
NICO
BAR ISLAND
S
98.44
DELHI100.00
UTTARAKHAND96.32
UTTAR PRADESH77.96
HARYANA96.64
20.17 - 50.00
50.01 - 70.00
70.01 - 90.00
90.01 - 100.00
Note: Map not to scale Disclaimer: The boundaries and the names used in the maps are only a visual representation and do not determine the legal boundary position.
PERCENTAGE OF PROFESSIONALLY
QUALIFIED TEACHERS:
SECONDARY LEVEL
INDIA
Percentage of Professionally
Qualified Teachers: Secondary Level
U-DISE 2016-17
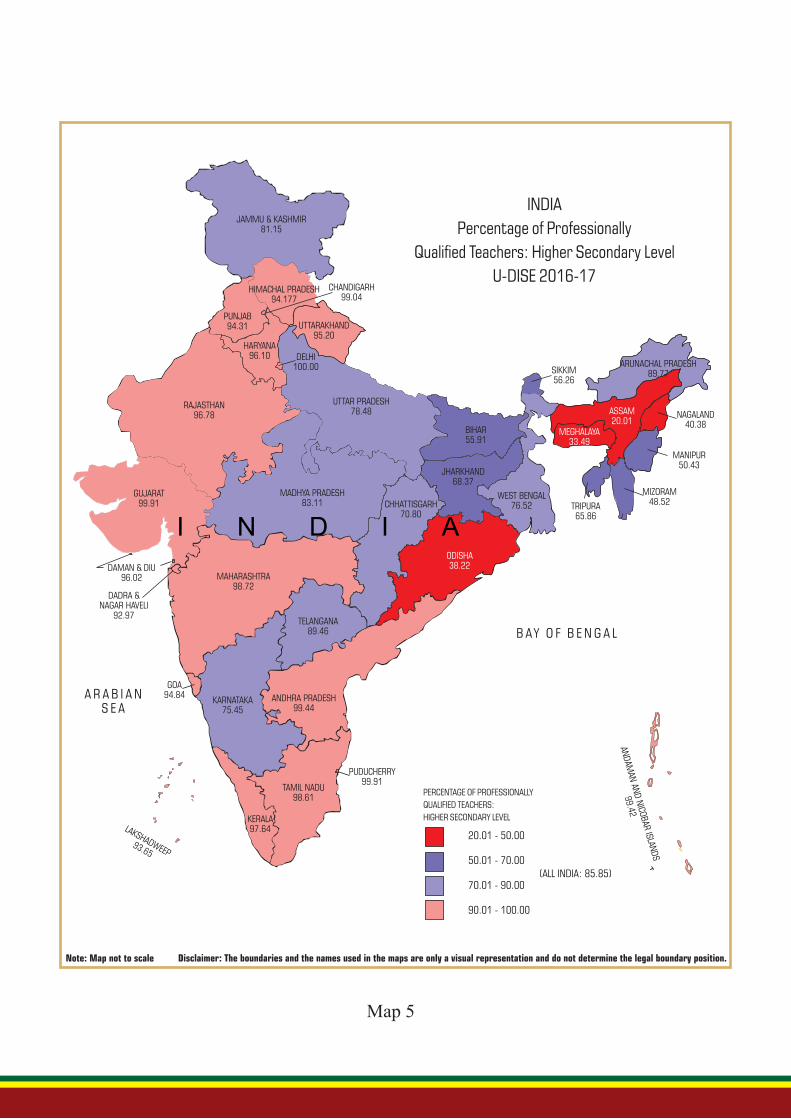
Map 5
(ALL INDIA: 85.85)
CHANDIGARH99.04
JAMMU & KASHMIR81.15
HIMACHAL PRADESH94.177
PUNJAB94.31
RAJASTHAN96.78
MADHYA PRADESH83.11 CHHATTISGARH
70.80
JHARKHAND68.37
WEST BENGAL76.52
BIHAR55.91
SIKKIM56.26
MEGHALAYA33.49
ASSAM20.01
NAGALAND40.38
ARUNACHAL PRADESH89.77
MANIPUR50.43
MIZORAM48.52TRIPURA
65.86
ODISHA38.22
MAHARASHTRA98.72
DAMAN & DIU96.02
GUJARAT99.91
DADRA & NAGAR HAVELI
92.97
A R A B I A N S E A
GOA94.84
B AY O F B E N G A L
KERALA97.64
KARNATAKA75.45
ANDHRA PRADESH99.44
TELANGANA89.46
PUDUCHERRY99.91
LAKSHADWEEP93.65
TAMIL NADU98.61
AND
AMAN
AND
NICO
BAR ISLAND
S
99.42
DELHI100.00
UTTARAKHAND95.20
UTTAR PRADESH78.48
HARYANA96.10
20.01 - 50.00
50.01 - 70.00
70.01 - 90.00
90.01 - 100.00
Note: Map not to scale Disclaimer: The boundaries and the names used in the maps are only a visual representation and do not determine the legal boundary position.
PERCENTAGE OF PROFESSIONALLY
QUALIFIED TEACHERS:
HIGHER SECONDARY LEVEL
INDIA
Percentage of Professionally
Qualified Teachers: Higher Secondary Level
U-DISE 2016-17
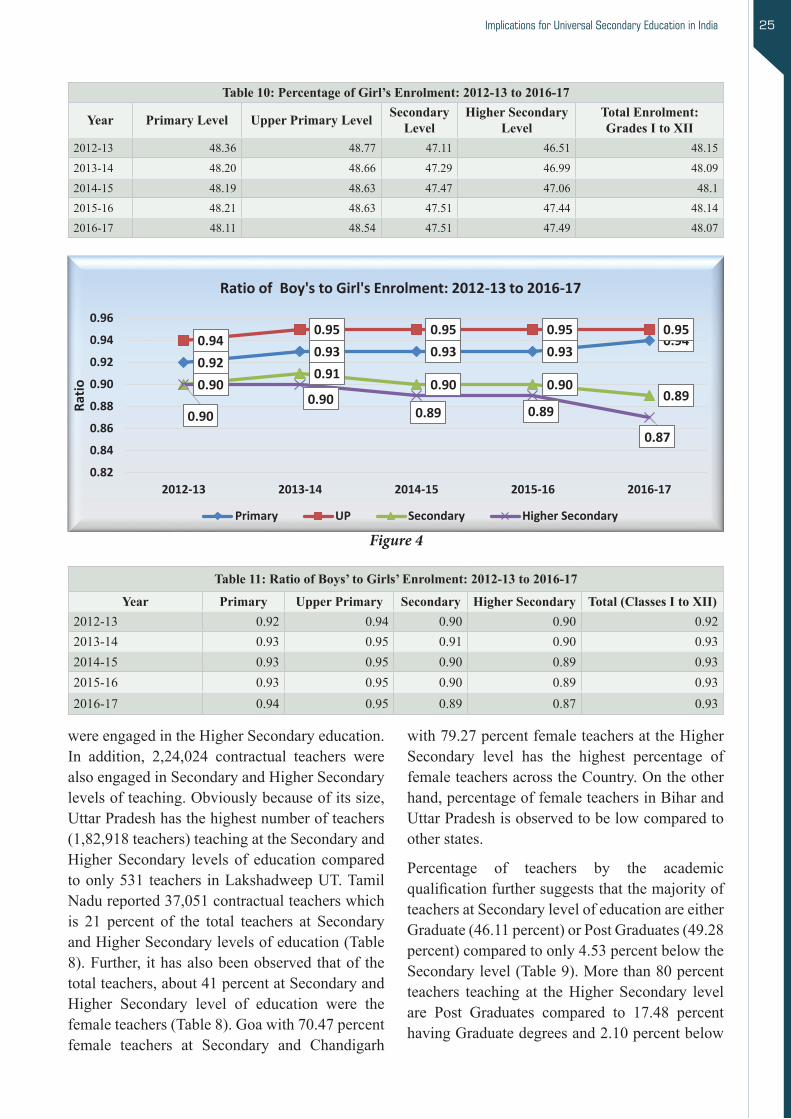
Implications for Universal Secondary Education in India 25
Patterns of Decline in Enrolment: Analysis of U-DISE 2016-17 Data
29
Figure 4
Table 11: Ratio of Boys’ to Girls’ Enrolment: 2012-13 to 2016-17 Year Primary Upper
Primary Secondary Higher Secondary
Total (Classes I to XII)
2012-13 0.92 0.94 0.90 0.90 0.92 2013-14 0.93 0.95 0.91 0.90 0.93 2014-15 0.93 0.95 0.90 0.89 0.93 2015-16 0.93 0.95 0.90 0.89 0.93 2016-17 0.94 0.95 0.89 0.87 0.93
0.920.93 0.93 0.93
0.940.940.95 0.95 0.95 0.95
0.900.91
0.90 0.900.89
0.900.90
0.89 0.89
0.87
0.820.840.860.880.900.920.940.96
2012-13 2013-14 2014-15 2015-16 2016-17
Ratio
Ratio of Boy's to Girl's Enrolment: 2012-13 to 2016-17
Primary UP Secondary Higher Secondary
with79.27percentfemaleteachersattheHigherSecondary level has the highest percentage offemale teachers across the Country. On the other hand,percentageoffemaleteachersinBiharandUttarPradeshisobservedtobelowcomparedtoother states.
Percentage of teachers by the academic qualificationfurthersuggeststhatthemajorityofteachersatSecondarylevelofeducationareeitherGraduate(46.11percent)orPostGraduates(49.28percent)comparedtoonly4.53percentbelowtheSecondarylevel(Table9).Morethan80percentteachers teaching at theHigher Secondary levelare Post Graduates compared to 17.48 percenthavingGraduatedegreesand2.10percentbelow
wereengagedintheHigherSecondaryeducation.In addition, 2,24,024 contractual teachers werealsoengagedinSecondaryandHigherSecondarylevelsofteaching.Obviouslybecauseofitssize,Uttar Pradesh has the highest number of teachers (1,82,918teachers)teachingattheSecondaryandHigherSecondary levelsof educationcomparedtoonly531 teachers inLakshadweepUT.TamilNadureported37,051contractualteacherswhichis 21 percent of the total teachers at Secondary andHigherSecondarylevelsofeducation(Table8).Further, ithasalsobeenobservedthatof thetotalteachers,about41percentatSecondaryandHigher Secondary level of education were thefemaleteachers(Table8).Goawith70.47percentfemale teachers at Secondary and Chandigarh
Table 11: Ratio of Boys’ to Girls’ Enrolment: 2012-13 to 2016-17
Year Primary Upper Primary Secondary Higher Secondary Total (Classes I to XII)2012-13 0.92 0.94 0.90 0.90 0.922013-14 0.93 0.95 0.91 0.90 0.932014-15 0.93 0.95 0.90 0.89 0.932015-16 0.93 0.95 0.90 0.89 0.932016-17 0.94 0.95 0.89 0.87 0.93
Table 10: Percentage of Girl’s Enrolment: 2012-13 to 2016-17
Year Primary Level Upper Primary Level Secondary Level
Higher Secondary Level
Total Enrolment: Grades I to XII
2012-13 48.36 48.77 47.11 46.51 48.15
2013-14 48.20 48.66 47.29 46.99 48.09
2014-15 48.19 48.63 47.47 47.06 48.1
2015-16 48.21 48.63 47.51 47.44 48.14
2016-17 48.11 48.54 47.51 47.49 48.07
Figure 4
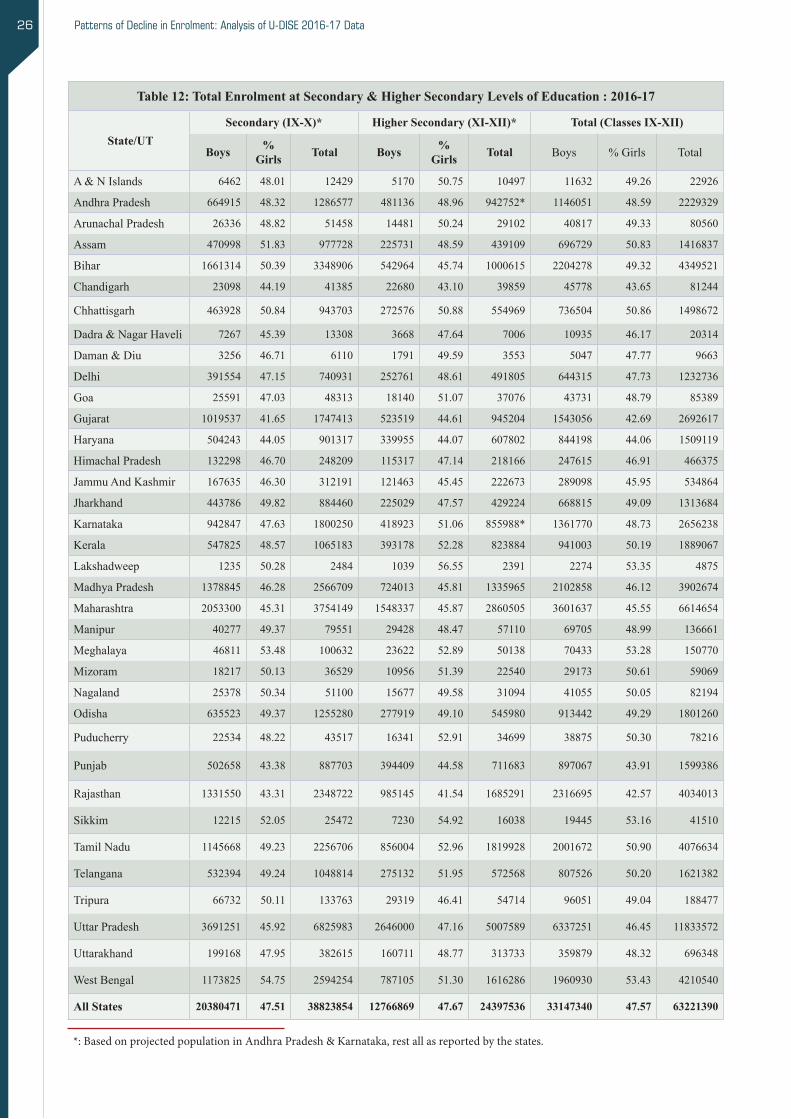
Patterns of Decline in Enrolment: Analysis of U-DISE 2016-17 Data26
Table 12: Total Enrolment at Secondary & Higher Secondary Levels of Education : 2016-17
State/UTSecondary (IX-X)* Higher Secondary (XI-XII)* Total (Classes IX-XII)
Boys % Girls Total Boys %
Girls Total Boys %Girls Total
A&NIslands 6462 48.01 12429 5170 50.75 10497 11632 49.26 22926
AndhraPradesh 664915 48.32 1286577 481136 48.96 942752* 1146051 48.59 2229329
ArunachalPradesh 26336 48.82 51458 14481 50.24 29102 40817 49.33 80560
Assam 470998 51.83 977728 225731 48.59 439109 696729 50.83 1416837
Bihar 1661314 50.39 3348906 542964 45.74 1000615 2204278 49.32 4349521
Chandigarh 23098 44.19 41385 22680 43.10 39859 45778 43.65 81244
Chhattisgarh 463928 50.84 943703 272576 50.88 554969 736504 50.86 1498672
Dadra&NagarHaveli 7267 45.39 13308 3668 47.64 7006 10935 46.17 20314
Daman&Diu 3256 46.71 6110 1791 49.59 3553 5047 47.77 9663
Delhi 391554 47.15 740931 252761 48.61 491805 644315 47.73 1232736
Goa 25591 47.03 48313 18140 51.07 37076 43731 48.79 85389
Gujarat 1019537 41.65 1747413 523519 44.61 945204 1543056 42.69 2692617
Haryana 504243 44.05 901317 339955 44.07 607802 844198 44.06 1509119
HimachalPradesh 132298 46.70 248209 115317 47.14 218166 247615 46.91 466375
JammuAndKashmir 167635 46.30 312191 121463 45.45 222673 289098 45.95 534864
Jharkhand 443786 49.82 884460 225029 47.57 429224 668815 49.09 1313684
Karnataka 942847 47.63 1800250 418923 51.06 855988* 1361770 48.73 2656238
Kerala 547825 48.57 1065183 393178 52.28 823884 941003 50.19 1889067
Lakshadweep 1235 50.28 2484 1039 56.55 2391 2274 53.35 4875
Madhya Pradesh 1378845 46.28 2566709 724013 45.81 1335965 2102858 46.12 3902674
Maharashtra 2053300 45.31 3754149 1548337 45.87 2860505 3601637 45.55 6614654
Manipur 40277 49.37 79551 29428 48.47 57110 69705 48.99 136661
Meghalaya 46811 53.48 100632 23622 52.89 50138 70433 53.28 150770
Mizoram 18217 50.13 36529 10956 51.39 22540 29173 50.61 59069
Nagaland 25378 50.34 51100 15677 49.58 31094 41055 50.05 82194
Odisha 635523 49.37 1255280 277919 49.10 545980 913442 49.29 1801260
Puducherry 22534 48.22 43517 16341 52.91 34699 38875 50.30 78216
Punjab 502658 43.38 887703 394409 44.58 711683 897067 43.91 1599386
Rajasthan 1331550 43.31 2348722 985145 41.54 1685291 2316695 42.57 4034013
Sikkim 12215 52.05 25472 7230 54.92 16038 19445 53.16 41510
Tamil Nadu 1145668 49.23 2256706 856004 52.96 1819928 2001672 50.90 4076634
Telangana 532394 49.24 1048814 275132 51.95 572568 807526 50.20 1621382
Tripura 66732 50.11 133763 29319 46.41 54714 96051 49.04 188477
Uttar Pradesh 3691251 45.92 6825983 2646000 47.16 5007589 6337251 46.45 11833572
Uttarakhand 199168 47.95 382615 160711 48.77 313733 359879 48.32 696348
WestBengal 1173825 54.75 2594254 787105 51.30 1616286 1960930 53.43 4210540
All States 20380471 47.51 38823854 12766869 47.67 24397536 33147340 47.57 63221390
*: Based on projected population in Andhra Pradesh & Karnataka, rest all as reported by the states.

Implications for Universal Secondary Education in India 27
all-Indialevel(86.80percent).
Enrolment-based IndicatorsShare of Girls’ EnrolmentIn addition to indicators presented above avariety of enrolment based indictors have alsobeen analysed which has got direct relevancein achieving the goal of Universal SecondaryEducation. One such indicator is the percentage of girls’ enrolment which is 47.51 percent inSecondary Classes as compared to 47.67 percent
the Secondary level. However, percentage ofsuch teachers in the states of Gujarat (64.01percent) and Rajasthan (63.77 percent) ismuchlowerthanthesameat theall-Indialevel(80.04percent).Further,itisobservedthatthemajorityofteachersteachingatSecondary(87.33percent)andHigher Secondary (85.85 percent) level areprofessionally qualified but percentage of suchteachers in Assam (19.95 percent), Nagaland(41.28 percent), Sikkim (57.74 percent) andTripura(59.48percent)ismuchlowerthanatthe
Table 13: Enrolment at Secondary & Higher Secondary Levels of Education: 2012-13 to 2016-17
Year Secondary Change in Enrolment
Higher Sec-ondary
Change in Enrolment
Total Enrolment: Classes I to XII
Change in Enrolment
2012-13 34640103 - 19923782 - 254274234 -2013-14 37296683 2656580 22314314 2390532 256154824 18805902014-15 38301599 1004916 23501798 1187484 257543001 13881772015-16 39145052 843453 24735397 1233599 260596960 30539592016-17 38823854 -321198 24397536** -337861 253108405** -7488555*
*: Steep decline is due to incomplete data provided by a couple of states in 2016-17. **: Including projected enrolment in Andhra Pradesh and Karnataka else decline may be in the tune of 92,60,643 in case of the total enrolment in 2016-17.
Table 14: State-specific Decline in Enrolment at Secondary Level (Grades IX & X) of Education: 2015-16 to 2016-17
State/UT2015-16 2016-17 Change in Enrolment in 2016-
17 over 2015-16% Change in Enrolment in
2016-17 % to Total Decline
Total Enrolment Boys Girls Total Boys Girls TotalWestBengal 2759187 2594254 -94012 -70921 -164933 -7.42 -4.76 -5.98 -51.35Jharkhand 1025793 884460 -74449 -66884 -141333 -14.37 -13.18 -13.78 -44.00Bihar 3421427 3348906 -55373 -17148 -72521 -3.23 -1.01 -2.12 -22.58Chhattisgarh 989703 943703 -24484 -21516 -46000 -5.01 -4.29 -4.65 -14.32Kerala 1098249 1065183 -17346 -15720 -33066 -3.07 -2.95 -3.01 -10.29Jammu&Kashmir 338349 312191 -12721 -13437 -26158 -7.05 -8.50 -7.73 -8.14Madhya Pradesh 2577724 2566709 -10632 -383 -11015 -0.77 -0.03 -0.43 -3.43Telangana 1058128 1048814 -1716 -7598 -9314 -0.32 -1.45 -0.88 -2.90Nagaland 59215 51100 -4270 -3845 -8115 -14.40 -13.00 -13.70 -2.53HimachalPradesh 255897 248209 -5270 -2418 -7688 -3.83 -2.04 -3.00 -2.39Tripura 141181 133763 -4091 -3327 -7418 -5.78 -4.73 -5.25 -2.31Manipur 85570 79551 -3280 -2739 -6019 -7.53 -6.52 -7.03 -1.87Uttarakhand 388613 382615 -4282 -1716 -5998 -2.10 -0.93 -1.54 -1.87Mizoram 41534 36529 -2607 -2398 -5005 -12.52 -11.58 -12.05 -1.56Meghalaya 105495 100632 -2458 -2405 -4863 -4.99 -4.28 -4.61 -1.51Goa 50664 48313 -1063 -1288 -2351 -3.99 -5.36 -4.64 -0.73ArunachalPradesh 53668 51458 -1349 -861 -2210 -4.87 -3.31 -4.12 -0.69Sikkim 27250 25472 -795 -983 -1778 -6.11 -6.90 -6.52 -0.55Tamil Nadu 2258095 2256706 -7546 6157 -1389 -0.65 0.56 -0.06 -0.43Puducherry 44234 43517 -151 -566 -717 -0.67 -2.63 -1.62 -0.22A&NIslands 12819 12429 -169 -221 -390 -2.55 -3.57 -3.04 -0.12Lakshadweep 2518 2484 3 -37 -34 0.24 -2.88 -1.35 -0.01All States 39145052 38823854 -166879 -154319 -321198 -0.81 -0.83 -0.82 -100.00
Patterns of Decline in Enrolment: Analysis of U-DISE 2016-17 Data28
Patterns of Decline in Enrolment: Analysis of U-DISE 2016-17 Data
34
Secondary Enrolment: Grades IX & X
State-specific changeinSecondaryenrolment(Classes IX&X)duringthe years 2015-16 and
2016-17 presented in Table 14reveals that 22 outof36States&UTshavereported a decline
in enrolment at the Secondarylevel ofeducation.Further,itisobservedthatonly six states
haveshownhugedeclineinenrolmentinClassesIX toXwhereas in most of the remaining
states,declineisnegligible.WestBengal,Jharkhand,Bihar,Chhattisgarh,KeralaandJammu
&Kashmir are six states whichexperienceda steepdecline inenrolment.Decline inWest
Bengalisofthetuneof165thousand(5.98percent)comparedto141thousand(13.78percent)
decline inJharkhand,73thousand(2.12percent)inBiharand46thousand(4.65percent)in
Chhattisgarh.EvenKeralareporteda decline in Secondary enrolment by 33 thousand whichis
3.01percentof thesameinthepreviousyear. Overall,enrolmentat the Secondarylevelof
education in 2016-17 declinedby321thousand(0.82percent)ofwhichboyscontributed167
thousand(52percent)andgirls,154thousand(48percent).Infact,actualdeclinein enrolment
is more than 321thousand,ifstatesthosewhohavereportedincreaseinenrolmentin 2016-17
is not considered i.e. 558 thousand in total enrolment. Above76 percent decline in Secondary
enrolment inClassesIX& XiscontributedbyWestBengal(29.54percent), Jharkhand(25.31
percent),Bihar(12.99percent)andChhattisgarh(8.24percent) whichmeansthat8outofevery
10 students decline is contributed by these four states which has serious implications for
achievingthegoalofUniversalSecondaryEducationnotonlyinthesestatesbutalsoforthe
Countryasawhole.LetusexaminehowmuchGrades IXand Xhas individuallycontributed
to the total decline in Secondary enrolment whichispresentedinTables15&16.
Figure 5
Grade IX Enrolment
18.15
19.7 20.3
20.49
20.49
16.517
17.518
18.519
19.520
20.521
2012-13 2013-14 2014-15 2015-16 2016-17
In M
illio
n
Enrolment in Grade IX: 2012-13 to 2016-17
Grade IX
Manipur (49.37 percent), all otherstatesfromtheregionhaveabove50percentgirls’enrolmentinSecondaryclasses.
Like enrolment in Secondaryclasses, in a good number of statespercentage of girls’ enrolmentin Higher Secondary classes toois above 50 percent. ArunachalPradesh,Chhattisgarh,Goa,Kerala,Meghalaya, Mizoram, Puducherry, Sikkim, Tamil Nadu, Telangana
and West Bengal are few such states. Onthe other hand, the same is as low as 43.10percent in Chandigarh and 41.54 percent in Rajasthan. Needless to observe that withoutbringing all the remaining girls under the umbrellaofeducation,neitherthegoalofuniversal elementary nor secondary education can be achieved.
It is also possible that many children of age group 15+ to16+and17+ to18+year are still outofschoolorafewofthemareinelementaryclasses.It may also be observed that only elementaryschool graduates can be admitted in Grade IX,which is the first grade of the next higher leveli.e. Secondary level.Thismeans that enrolmentin Secondary classes is not a function of correspondingage-specificpopulationi.e.15+to16+butisafunctionofelementarygraduates.Thesameisalsotrueforchildrenofagebetween11+to13+yearsallofwhommaynottransittoUpperPrimaryleveli.e.GradeVI,thefirstgradeofnextlevelunlesstheycompletethelastgradei.e.GradeVof theprevious level.No educational level isindependenttootherlevelsofeducationingeneralandjustonelevelbelowinparticular.Enrolmentinaparticularlevelmaynotincreaseindependenttotheimmediatelowerlevel.Therefore,toensureconsistent increase in enrolment in a particular level/class, the lower level/class must produceadequatenumberofgraduatesandsend them tothefirstGradeofthenexthigherlevel.Inviewofthis, it is therefore importantnotonly to reviewenrolment in Secondary and Higher Secondarygradesbutalsotakealookattheenrolmentinthe
in Higher Secondary classes (Table 10). AllSecondaryandHigherSecondaryClasses(IXtoXII)togetherhas47.57percentgirls’enrolment.Irrespectiveofaneducationallevel,shareofgirlsremainedalmoststagnantwhichisalsoreflectedintheratioofboystogirls’enrolmentpresentedinTable11. Percentageofgirls’enrolment inafewschoolcategories ismuch lower thanat theall-India average. Primary with Upper Primary& Secondary (45.77 percent) and Primary withUpper Primary, Secondary&Higher Secondary(44.33percent)schoolsaresuchschoolcategories.Itmayalsobeobservedthatpercentageofgirls’enrolment in Secondary and Higher Secondaryclasses in 2016-17 is a bit lower than the samein case of Primary (48.11 percent) and UpperPrimary (48.54 percent) classes. In a fewstates, percentage of girls’ enrolment is 50 andabove and on the other hand, a few states havemuch lower percentage of girls’ enrolment inSecondary classes (Table 12). Assam (51.83percent), Bihar (50.39 percent), Tripura (50.11percent) and West Bengal (54.75 percent) arefewsuchstates.Ontheotherhand,percentageofgirls’ inSecondaryclasses isas lowas41.65 inGujarat, 43.38 percent in Punjab, 43.31 percentinRajasthanand45.92percent inUttarPradeshallwhichareverycrucialforachievingthegoalofUniversalSecondaryenrolment.Bihartoohasanimpressivepercentageofgirls’enrolmentbothincaseofthePrimary(49.64percent)andUpperPrimary (50.72percent) classes.States from theNorth-Eastern region too have high percentageofgirls’enrolment inSecondaryclasses.Except
Figure 5

Implications for Universal Secondary Education in India 29
and Adjusted-NER & Gross and Net AttendanceRate.
Wherever required above indicators have beenanalysed over a period of time or in a year forwhichthelatestdataisavailable,bygenderandalso for social categories, if available either attheall-India levelorstate-wise. DatageneratedthroughtheU-DISEisthemainsourceofanalysisused in the present report.
Enrolment in Secondary & Higher Secondary ClassesEnrolment in Secondary and Higher Secondaryclasses during the period 2012-13 to 2016-17presented in Tables 13 reveals that enrolmentin Secondary classes has increased from 34.64 million in2012-13 to38.82million in2016-17;thus showing an increase of 4.18millionwhich
lowerleveli.e.Elementaryandalsotransitionfromthe Primary to Upper Primary and Elementary to Secondarylevelsofeducation.Inthisprocessthefollowingindicators/variableshavebeencriticallyexaminedatdifferentlevelsofeducation:
• Patterns in decline in enrolment in geneal andGradeI,GradeV,GradeVI,GradeVIII, Grade IX, Grade X and Grade XII in particular; • Transition from Primary to Upper Primary levelandotherlevelsofeducation; • Gender Parity Index at different levels of education: Primary, Upper Primary, SecondaryandHigherSecondarylevels; • Trends in the total enrolment at Primary, Upper Primary, Secondary and Higher Secondarylevelsofeducation;and • EnrolmentRatios:Gross,Net,Age-specific
Table 15: Enrolment in Grade IX: 2012-13 to 2016-17
YearGrade IX (In Million)
Boys Girls Total 2012-13 9.57 8.58 18.152013-14 10.34 9.36 19.702014-15 10.67 9.63 20.302015-16 10.75 9.74 20.492016-17 10.79 9.70 20.49
Year%age Share
Boys Girls Total2012-13 52.73 47.27 100.002013-14 52.49 47.51 100.002014-15 52.56 47.44 100.002015-16 52.46 47.54 100.002016-17 52.66 47.34 100.00
YearChange in Enrolment (In Million)
Boys Girls Total2012-13 - - -2013-14 0.77 0.78 1.552014-15 0.33 0.27 0.602015-16 0.08 0.11 0.192016-17 0.04 -0.04 0.00
Year%age Change over 2012-13
Boys Girls Total2013-14 8.05 9.09 8.542014-15 11.42 12.24 11.812015-16 24.40 27.10 25.682016-17 12.63 13.10 12.85

Patterns of Decline in Enrolment: Analysis of U-DISE 2016-17 Data30
SecondaryandHigherSecondaryclassestototalenrolmentintheClassesI toXIIwas21.46and25 percent respectively in 2012-13. However,totalenrolmentintheClassesItoXIIhaveshowna decline during the same period i.e. 2012-13to 2016-17. The same has shown a consistentincrease during the period 2012-13 to 2015-16but significantly declined during the next yearwhichneedfurtherprobe.Eventhoughdeclineinenrolment is limited to about 300 thousand both at the Secondary and Higher Secondary levelsof education butmay have serious implicationsfor universal school education. A look at theenrolmentatelementarylevelofeducationduringthe same period of time presents interesting picture (Table24).
Secondary Enrolment: Grades IX & XState-specific change in Secondary enrolment(Classes IX&X)during theyears2015-16and2016-17 presented in Table 14 reveals that 22out of 36States&UTshave reported adeclineinenrolmentattheSecondarylevelofeducation.Further, it is observed that only six states haveshownhugedeclineinenrolmentinClassesIXtoXwhereasinmostoftheremainingstates,declineis negligible. West Bengal, Jharkhand, Bihar,Chhattisgarh,KeralaandJammu&Kashmiraresix states which experienced a steep decline inenrolment.DeclineinWestBengalisofthetune
comesto12.07percent.Duringthesameperiod,enrolmentatHigherSecondarylevelofeducationincreasedfrom19.92millionin2012-13to24.40million in 2016-17; thus showing an increaseof 4.48 million (22.49 percent). Increase inenrolmentisalsoreflectedinthetotalenrolmentin Secondary and Higher Secondary classeswhichtoohaveconsistentlyincreasedfrom54.56million in 2012-13 to 63.88million in 2015-16butdeclinedto63.22millionin2016-17whichisalsotrueforindividualenrolmentinSecondary,aswellasHigherSecondaryclasses.Fromahighof39.15millionin2015-16,enrolmentatSecondaryleveldeclinedto38.82millionnextyearcomparedto24.40millionin2016-17fromahighof24.74millionin2015-16attheHigherSecondarylevelof education all which has a significant impacton achieving the goal of universal secondaryeducation in theCountry.Thiswould also havea serious implication for enrolment at HigherEducationlevel togrowandtouchaGERof30percent in year 2020.On the other hand, of thetotal enrolment in Classes I to XII in 2012-13,enrolment in Secondary and Higher SecondaryClasses together had a total enrolment of 54.56 million of which Secondary level constitute63.49 percent and Higher Secondary level,36.51 percent. It may be observed that totalenrolment in the Classes I to XII in 2012-13was 254.27million. Percentage of enrolment in
Patterns of Decline in Enrolment: Analysis of U-DISE 2016-17 Data
37
Figure 6
Table 16: Enrolment in Grade X: 2012-13 to 2016-17
Year Grade X (InMillion)
Boys Girls Total 2012-13 8743419 7743724 16487143 2013-14 9312497 8279058 17591555 2014-15 9451352 8553657 18005009 2015-16 9802220 8859055 18661275 2016-17 9594356 8743232 18337588
Year %age Share
Boys Girls Total 2012-13 53.03 46.97 100.00 2013-14 52.94 47.06 100.00 2014-15 52.49 47.51 100.00 2015-16 52.53 47.47 100.00 2016-17 52.32 47.68 100.00
Year Change in Enrolment
Boys Girls Total 2012-13 - - - 2013-14 569078 535334 1104412 2014-15 138855 274599 413454 2015-16 350868 305398 656266 2016-17 -207864 -115823 -323687
%age Change over 2012-13 Year Boys Girls Total
2013-14 6.51 6.91 6.70 2014-15 8.10 10.46 9.21 2015-16 12.11 14.40 13.19 2016-17 9.73 12.91 11.22
16.48
17.5918.00
18.6618.33
15.00
15.50
16.00
16.50
17.00
17.50
18.00
18.50
19.00
In M
illio
n
Enrolment in Grade X: 2012-13 to 2016-17
Grade X
Figure 6

Implications for Universal Secondary Education in India 31
(8.24percent)whichmeansthat8outofevery10students decline is contributed by these four states whichhasseriousimplicationsforachievingthegoalofUniversalSecondaryEducationnotonlyinthesestatesbutalsofortheCountryasawhole.LetusexaminehowmuchGradesIXandXhasindividually contributed to the total decline inSecondaryenrolmentwhichispresentedinTables15&16.
Grade IX EnrolmentTable15revealsthatGradeIXenrolment(total)remains stagnant during the years 2015-16 to2016-17; however, the same in case of girls’enrolment declined by 38.5 thousand during the same period. The same, if analyzed during theperiod2012-13to2016-17,howevershowsthatenrolmentinGradeIXhasimpressivelyincreasedfrom18.15millionin2012-13to20.29millionin
of165thousand(5.98percent)comparedto141thousand(13.78percent)declineinJharkhand,73thousand(2.12percent)inBiharand46thousand(4.65 percent) in Chhattisgarh. Even Keralareported a decline in Secondary enrolment by 33 thousand which is 3.01 percent of the samein the previous year. Overall, enrolment at theSecondarylevelofeducationin2016-17declinedby 321 thousand (0.82 percent) of which boyscontributed167 thousand(52percent)andgirls,154thousand(48percent).Infact,actualdeclineinenrolmentismorethan321thousand,ifstatesthosewhohavereportedincreaseinenrolmentin2016-17isnotconsideredi.e.558thousandintotalenrolment.Above76percentdeclineinSecondaryenrolment inClasses IX& X iscontributedbyWest Bengal (29.54 percent), Jharkhand (25.31percent),Bihar(12.99percent)andChhattisgarh
Table 16: Enrolment in Grade X: 2012-13 to 2016-17
YearGrade X (In Million)
Boys Girls Total 2012-13 8743419 7743724 164871432013-14 9312497 8279058 175915552014-15 9451352 8553657 180050092015-16 9802220 8859055 186612752016-17 9594356 8743232 18337588
Year% age Share
Boys Girls Total2012-13 53.03 46.97 100.002013-14 52.94 47.06 100.002014-15 52.49 47.51 100.002015-16 52.53 47.47 100.002016-17 52.32 47.68 100.00
YearChange in Enrolment
Boys Girls Total2012-13 - - -2013-14 569078 535334 11044122014-15 138855 274599 4134542015-16 350868 305398 6562662016-17 -207864 -115823 -323687
Year% age Change over 2012-13
Boys Girls Total2013-14 6.51 6.91 6.702014-15 8.10 10.46 9.212015-16 12.11 14.40 13.192016-17 9.73 12.91 11.22

Patterns of Decline in Enrolment: Analysis of U-DISE 2016-17 Data32
0.85million(9.73percent)andthatofgirlsby1.00million(12.91percent).AnnualchangeinGradeX enrolment further reveals that the same hadconsistentlyincreasedduringtheperiod2012-13to2015-16butdeclinedinthefollowingyeari.e.2016-17whichistrueforbothboysaswellasforgirls’enrolment.ItmaybefurtherobservedthatthetotalenrolmentinGradeXincreasedimpressivelyby656thousandduring2014-15to2015-16butdeclinedby323.7millionthefollowingyeari.e.2016-17. Similar trend is observed both in thecaseofboys(declinedby207.9million)andgirls(115.8thousand)enrolmentinGradeX.ItmayberecalledthatenrolmentattheSecondarylevelisdeclinedby321.2thousandin2016-17whichiscontributedbythedeclineinGradeXenrolmentaloneasnosignificantchangehasbeenobservedinGradeIXenrolmentduringtheperiod2015-16to2016-17(Table15).Itmayalsobeenobserved
2016-17;thusshowinganincreaseof2.34millionwhich is 12.89 percent of the total enrolment inGrade IX in 2012-13. Further, it has also beenobservedthatthepercentageofgirls’enrolmentin2016-17 ismuch lower at47.34percent and thesame remained almost stagnant during the period 2012-13to2016-17.AsitseemsthatcontributionofGradeIXenrolmenttototaldeclineinSecondaryenrolmentin2016-17isnegligibleandwhateveristhedeclineinenrolmentisduetodeclineinGradeXenrolmentwhichispresentedinTable16.
Grade X EnrolmentTable 16 reveals that enrolment in Grade Xincreased impressively from 16.49 million in2012-13to18.34millionin2016-17;thusshowinganincreaseof1.85millionwhichis11.22percentofthesameintheyear2012-13.Duringthesameperiod,boysenrolmentinGradeXincreasedby
Table 17: Change in Grade X Enrolment: 2015-16 to 2016-17
State/UT
Grade X Enrol-ment Change in Enrolment in
2016-17%Change inenrolment % to Total
Decline2015-16 2016-17Total Boys Girls Total Boys Girls Total
Uttar Pradesh 3510535 3279643 -143124 -87768 -230892 -7.62 -5.38 -6.58 -42.27
WestBengal 1230469 1114974 -64142 -51353 -115495 -11.38 -7.70 -9.39 -21.14
Jharkhand 486561 417667 -35848 -33046 -68894 -14.63 -13.68 -14.16 -12.61
Chhattisgarh 459617 425463 -18073 -16081 -34154 -8.20 -6.72 -7.43 -6.25
Jammu&Kashmir 157306 138900 -9320 -9086 -18406 -11.14 -12.34 -11.70 -3.37
Kerala 552608 534311 -9630 -8667 -18297 -3.41 -3.21 -3.31 -3.35
Madhya Pradesh 1110670 1093602 -9127 -7941 -17068 -1.51 -1.57 -1.54 -3.12
Gujarat 824156 817015 -6806 -335 -7141 -1.40 -0.10 -0.87 -1.31
HimachalPradesh 129347 122474 -4274 -2599 -6873 -6.14 -4.35 -5.31 -1.26
Punjab 432139 426461 -2613 -3065 -5678 -1.07 -1.63 -1.31 -1.04
Uttarakhand 196518 190924 -3983 -1611 -5594 -3.89 -1.71 -2.85 -1.02
Manipur 41844 37317 -2714 -1813 -4527 -12.66 -8.89 -10.82 -0.83
Mizoram 19424 15756 -2070 -1598 -3668 -21.51 -16.31 -18.88 -0.67
Nagaland 22909 20099 -1572 -1238 -2810 -13.86 -10.70 -12.27 -0.51
Meghalaya 47128 45752 -607 -769 -1376 -2.79 -3.03 -2.92 -0.25
ArunachalPradesh 24517 23205 -800 -512 -1312 -6.40 -4.26 -5.35 -0.24
Telangana 523324 522027 1699 -2996 -1297 0.65 -1.15 -0.25 -0.24
Goa 21098 19837 -649 -612 -1261 -6.20 -5.76 -5.98 -0.23
Sikkim 11135 10392 -363 -380 -743 -6.90 -6.47 -6.67 -0.14
Puducherry 20743 20318 73 -498 -425 0.71 -4.75 -2.05 -0.08
A&NIslands 5929 5744 -98 -87 -185 -3.29 -2.95 -3.12 -0.03
Dadra&NagarHaveli 5948 5779 -82 -87 -169 -2.58 -3.14 -2.84 -0.03
All States 18661275 18337588 -207864 -115823 -323687 -2.12 -1.31 -1.73 -59.25

Implications for Universal Secondary Education in India 33
Secondarylevelofeducation(61.73percent).Ontheonehand,GradeXenrolmentisdeclinedby323.7thousand,ontheotherhandtransitionratefrom the Secondary to Higher Secondary levelof education is as low as 61.73 percent whichmeans that about 38 percent of the total students inGradeIXcouldn’tabletotransittothehigherlevelofeducationi.e.GradeXI.Bothboys(61.89percent)and(61.55percent)girlsequallytransitfromtheSecondarytoHigherSecondarylevelofeducation. It is also important to mention that a fewstates,likeAndhraPradesh,ChandigarhandKarnataka couldn’t fully collect enrolment dataat theHigherSecondary levelbecauseofwhichtransition rate in these states do not present the truepicture.Inafewsmallerstates,transitionrateisaround90percent,suchstatesareDelhi,GoaandLakshadweep,andinafewotherstates,suchas Himachal Pradesh,Maharashtra, Puducherry,Punjab and Tamil Nadu, the same is above 80percent.Ontheotherhand,oneoftheimportantstates to achieve the goal of universalisation ofschool education is Bihar which has reporteda low (25.69 percent) transition rate from theSecondarytoHigherSecondarylevelofeducationwhich is also incidentally the lowest amongstall states.Another important state,namelyUttarPradesh reported above 75 percent transitionfrom the Secondary to Higher Secondary levelof education. Only four states reported belowfiftypercent transitionrateallwhich isgoing toaffect India’s efforts towards achieving the goalofuniversalschoolenrolment.Itmayberecalledthat about 11 percent students couldn’t able to
that 22 out of the 26 states have shown a declinein Grade X enrolmentin 2016-17. Remainingstates those shownincrease in enrolment,if not considered, thereal decline in GradeX enrolment may bemuch higher than 323.7 thousand i.e. 546.3 thousand. Of the total decline in the Grade Xenrolment in 2016-17, more than 50 percent isattributed to the decline alone in one of the most populous states of the country, namely UttarPradesh (230.9 thousand, 42.27 percent). WestBengal(115.5thousand,21.14percent),Jharkhand(68.9 thousand), Chhattisgarh (34.2 thousand)andJammu&Kashmir(18.4thousand)areotherstatesinwhichthedeclineinGradeXenrolmentismuchhigherthanthesameinotherstates.BiharwhichhasshownahighdeclineinGradeI,GradeV andGradeVI enrolment,GradeX enrolmenthas shown increased by 16.6 thousand. Of thetotaldeclineinUttarPradesh, theshareofgirl’sstandsat38.01percentwhichismuchlowerthanthesameincaseofthedeclineinboy’senrolmentinGradeX.GirlssharetothetotaldeclineinWestBengal, Jharkhand, Chhattisgarh and Jammu &Kashmir is also lower than the decline in boy’senrolment(Table17).
Declinein theGradeXenrolment in2016-17isexpectedtobereflectedintheHigherSecondaryenrolmentingeneralandGradeXIenrolmentinparticularin2017-18.Inaddition,itisalsoimportantto analyze transition rate from theSecondary toHigher Secondary level of education which islatestavailablefortheyear2015-16i.e.Grade XI enrolment minus repeaters in 2016-17 is divided by the Grade X enrolment in the previous year i.e. 2015-16. Transition rate from the Secondary to HigherSecondarylevelofeducationispresentedinTable45alongwiththetransitionratefromthePrimary to Upper Primary and Upper Primary to Secondary levelof educationwhich reveals thatthesameismuchlowerattheSecondarytoHigher
Patterns of Decline in Enrolment: Analysis of U-DISE 2016-17 Data
40
of the actual enrolment. Ignoringtheseobservations,acursorylookat Table 18 revealsthat
enrolment attheHigher Secondarylevelofeducationisdeclined by a huge 2.11 millionwhich
maybetreatedasgrossoverestimateofthe true decline in enrolment in 2016-17 (Table18).
Figure 7
Total enrolment at the HigherSecondarylevelofeducation:GradesXI&XII during the period
2015-16 and 2016-17 further revealsthatlikeotherlevelsofeducation,thislevelofeducation
tooshows adeclineinenrolment;whichatthe all-Indialevelmayalsobebecauseofthefact
that a fewmajor states, such as Andhra Pradesh and Karnataka couldn’t fully extend the
coverageof U-DISE to all of its intermediate colleges (GradesXII)asthesameisnotpartof
the schooleducationwhichmayalsobetrueforafewotherstates.Ontheonehand,Andhra
PradeshreportednilenrolmentinGradesXI&XIIin2016-17,on theotherhand,Karnataka
reportedadeclineof787.6thousand(23.30percent)whichissimplybecauseofthe incomplete
coverage. U-DISE 2016-17 has used projected enrolment in these two states but couldn’t
providedetailsashowthe enrolmentisprojected?Whatmethodology has been used?Whether
the same is obtained by adding the district-wiseprojectedenrolment? Intheabsenceofdetails,
inthepresentnote,whileanalyzingthe change in enrolment at the all-Indialevel,enrolment
ofAndhraPradeshandKarnatakahasnotbeenconsideredwhichrevealsthatstillthesame
showsadeclinewhichisofthe tune of 385.7 thousand attheHigherSecondarylevel.Asmany
as21stateshave
10.51
11.54
12.07
12.57
11.65
5 7 9 11 13 15
Grade XI
In Million
Enrolment in Grade XI: 2012-13 to 2016-17
Figure 7

Patterns of Decline in Enrolment: Analysis of U-DISE 2016-17 Data34
Table 18: Higher Secondary Enrolment: Grades XI to XII
State/UTTotal Change in Enrolment in 2016-17 % Increase/Decrease
2015-16 2016-17 Boys Girls Total Boys Girls Total
A&NIslands 10761 10497 -204 -60 -264 -3.80 -1.11 -2.45
AndhraPradesh* 936600 NR - - - - - -
ArunachalPradesh 35154 29102 -3276 -2776 -6052 -18.45 -15.96 -17.22
Assam 428793 439109 1516 8800 10316 0.68 4.30 2.41
Bihar 1236425 1000615 -119724 -116086 -235810 -18.07 -20.23 -19.07
Chandigarh 39908 39859 -158 109 -49 -0.69 0.64 -0.12
Chhattisgarh 550397 554969 -4761 9333 4572 -1.72 3.42 0.83
Dadra&NagarHaveli 6564 7006 223 219 442 6.47 7.02 6.73
Daman&Diu 2211 3553 664 678 1342 58.92 62.55 60.70
Delhi 516470 491805 -14687 -9978 -24665 -5.49 -4.01 -4.78
Goa 35753 37076 385 938 1323 2.17 5.21 3.70
Gujarat 950803 945204 -6642 1043 -5599 -1.25 0.25 -0.59
Haryana 595955 607802 7531 4316 11847 2.27 1.64 1.99
HimachalPradesh 226597 218166 -4100 -4331 -8431 -3.43 -4.04 -3.72
Jammu&Kashmir 246618 222673 -12427 -11518 -23945 -9.28 -10.22 -9.71
Jharkhand 559635 429224 -70562 -59849 -130411 -23.87 -22.67 -23.30
Karnataka* 814217 26652@ - - - - - -
Kerala 805140 823884 7253 11491 18744 1.88 2.74 2.33
Lakshadweep 2398 2391 -8 1 -7 -0.76 0.07 -0.29
Madhya Pradesh 1282965 1335965 18304 34696 53000 2.59 6.01 4.13
Maharashtra 2742807 2860505 62583 55115 117698 4.21 4.38 4.29
Manipur 60297 57110 -2051 -1136 -3187 -6.52 -3.94 -5.29
Meghalaya 53583 50138 -1275 -2170 -3445 -5.12 -7.56 -6.43
Mizoram 22986 22540 -281 -165 -446 -2.50 -1.40 -1.94
Nagaland 31202 31094 -237 129 -108 -1.49 0.84 -0.35
Odisha 497556 545980 25095 23329 48424 9.93 9.53 9.73
Puducherry 34987 34699 -217 -71 -288 -1.31 -0.39 -0.82
Punjab 691518 711683 11459 8706 20165 2.99 2.82 2.92
Rajasthan 1657335 1685291 1719 26237 27956 0.17 3.89 1.69
Sikkim 17039 16038 -419 -582 -1001 -5.48 -6.20 -5.87
Tamil Nadu 1783694 1819928 16296 19938 36234 1.94 2.11 2.03
Telangana 694288 572568 -64942 -56778 -121720 -19.10 -16.03 -17.53
Tripura 56763 54714 -1406 -643 -2049 -4.58 -2.47 -3.61
Uttar Pradesh 5162438 5007589 -80829 -74020 -154849 -2.96 -3.04 -3.00
Uttarakhand 308681 313733 4367 685 5052 2.79 0.45 1.64
WestBengal 1636859 1616286 -28873 8300 -20573 -3.54 1.01 -1.26
All States 24735397 22625448@@ -1121427 -988522 -2109949 -8.62 -8.42 -8.53
@ : Incomplete data * : Incomplete data has been provided by the states of Andhra Pradesh and Karnataka.@@ : 24,39,7536 including projected enrolment in Andhra Pradesh & Karnataka.
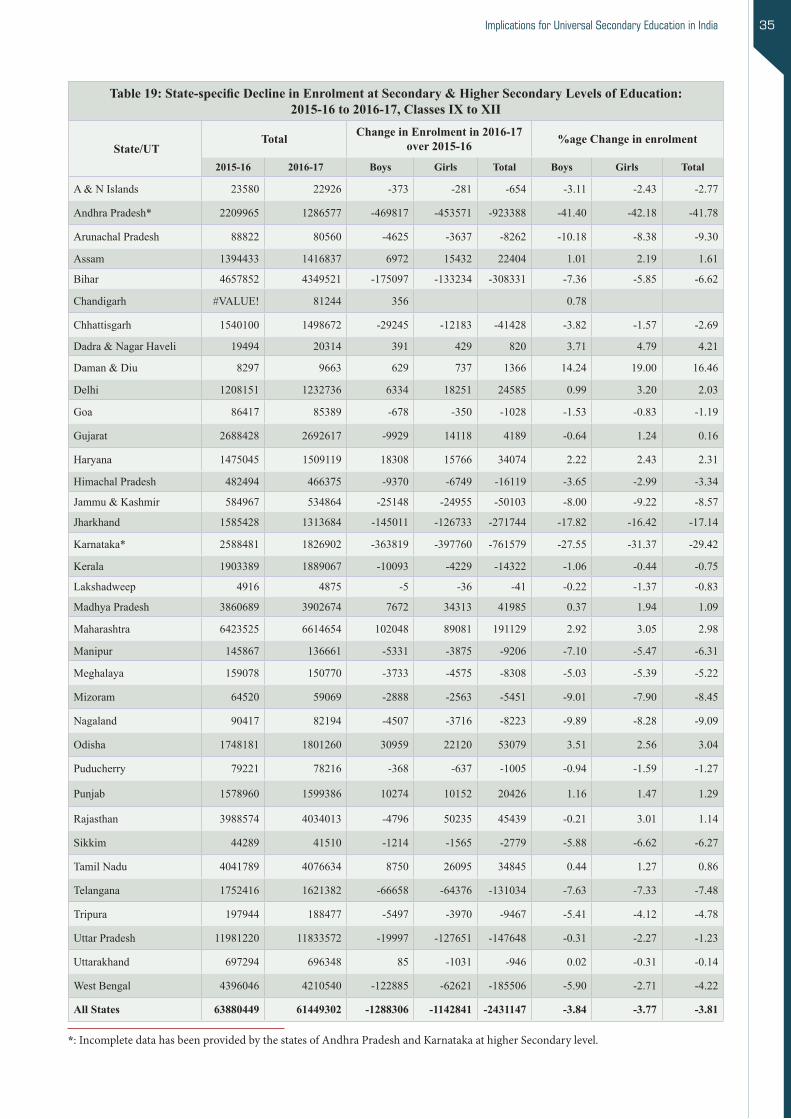
Implications for Universal Secondary Education in India 35
Table 19: State-specific Decline in Enrolment at Secondary & Higher Secondary Levels of Education: 2015-16 to 2016-17, Classes IX to XII
State/UTTotal Change in Enrolment in 2016-17
over 2015-16 %age Change in enrolment
2015-16 2016-17 Boys Girls Total Boys Girls Total
A&NIslands 23580 22926 -373 -281 -654 -3.11 -2.43 -2.77
AndhraPradesh* 2209965 1286577 -469817 -453571 -923388 -41.40 -42.18 -41.78
ArunachalPradesh 88822 80560 -4625 -3637 -8262 -10.18 -8.38 -9.30
Assam 1394433 1416837 6972 15432 22404 1.01 2.19 1.61
Bihar 4657852 4349521 -175097 -133234 -308331 -7.36 -5.85 -6.62
Chandigarh #VALUE! 81244 356 0.78
Chhattisgarh 1540100 1498672 -29245 -12183 -41428 -3.82 -1.57 -2.69
Dadra&NagarHaveli 19494 20314 391 429 820 3.71 4.79 4.21
Daman&Diu 8297 9663 629 737 1366 14.24 19.00 16.46
Delhi 1208151 1232736 6334 18251 24585 0.99 3.20 2.03
Goa 86417 85389 -678 -350 -1028 -1.53 -0.83 -1.19
Gujarat 2688428 2692617 -9929 14118 4189 -0.64 1.24 0.16
Haryana 1475045 1509119 18308 15766 34074 2.22 2.43 2.31
HimachalPradesh 482494 466375 -9370 -6749 -16119 -3.65 -2.99 -3.34
Jammu&Kashmir 584967 534864 -25148 -24955 -50103 -8.00 -9.22 -8.57
Jharkhand 1585428 1313684 -145011 -126733 -271744 -17.82 -16.42 -17.14
Karnataka* 2588481 1826902 -363819 -397760 -761579 -27.55 -31.37 -29.42
Kerala 1903389 1889067 -10093 -4229 -14322 -1.06 -0.44 -0.75
Lakshadweep 4916 4875 -5 -36 -41 -0.22 -1.37 -0.83
Madhya Pradesh 3860689 3902674 7672 34313 41985 0.37 1.94 1.09
Maharashtra 6423525 6614654 102048 89081 191129 2.92 3.05 2.98
Manipur 145867 136661 -5331 -3875 -9206 -7.10 -5.47 -6.31
Meghalaya 159078 150770 -3733 -4575 -8308 -5.03 -5.39 -5.22
Mizoram 64520 59069 -2888 -2563 -5451 -9.01 -7.90 -8.45
Nagaland 90417 82194 -4507 -3716 -8223 -9.89 -8.28 -9.09
Odisha 1748181 1801260 30959 22120 53079 3.51 2.56 3.04
Puducherry 79221 78216 -368 -637 -1005 -0.94 -1.59 -1.27
Punjab 1578960 1599386 10274 10152 20426 1.16 1.47 1.29
Rajasthan 3988574 4034013 -4796 50235 45439 -0.21 3.01 1.14
Sikkim 44289 41510 -1214 -1565 -2779 -5.88 -6.62 -6.27
Tamil Nadu 4041789 4076634 8750 26095 34845 0.44 1.27 0.86
Telangana 1752416 1621382 -66658 -64376 -131034 -7.63 -7.33 -7.48
Tripura 197944 188477 -5497 -3970 -9467 -5.41 -4.12 -4.78
Uttar Pradesh 11981220 11833572 -19997 -127651 -147648 -0.31 -2.27 -1.23
Uttarakhand 697294 696348 85 -1031 -946 0.02 -0.31 -0.14
WestBengal 4396046 4210540 -122885 -62621 -185506 -5.90 -2.71 -4.22
All States 63880449 61449302 -1288306 -1142841 -2431147 -3.84 -3.77 -3.81
*: Incomplete data has been provided by the states of Andhra Pradesh and Karnataka at higher Secondary level.
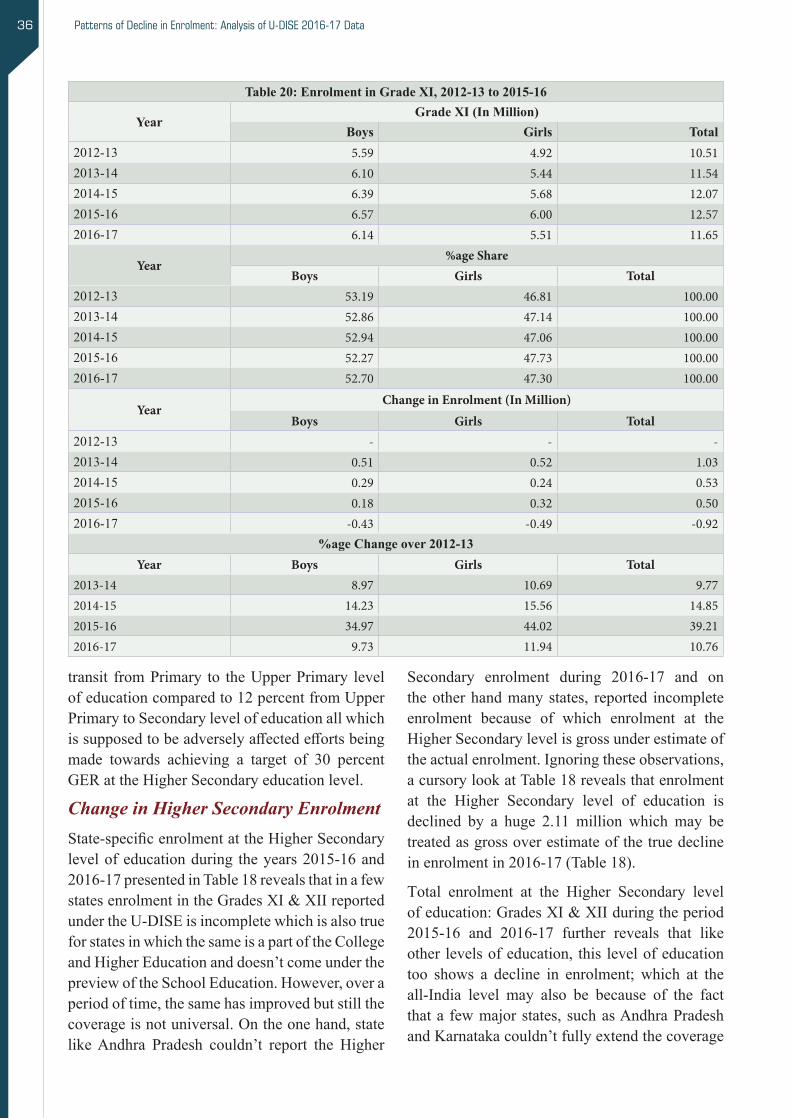
Patterns of Decline in Enrolment: Analysis of U-DISE 2016-17 Data36
Secondary enrolment during 2016-17 and ontheotherhandmanystates, reported incompleteenrolment because of which enrolment at theHigherSecondarylevelisgrossunderestimateoftheactualenrolment.Ignoringtheseobservations,acursorylookatTable18revealsthatenrolmentat the Higher Secondary level of education isdeclined by a huge 2.11million whichmay betreatedasgrossoverestimateofthetruedeclineinenrolmentin2016-17(Table18).
Total enrolment at the Higher Secondary levelofeducation:GradesXI&XIIduringtheperiod2015-16 and 2016-17 further reveals that likeotherlevelsofeducation, this levelofeducationtoo shows a decline in enrolment; which at theall-India level may also be because of the factthata fewmajorstates, suchasAndhraPradeshandKarnatakacouldn’tfullyextendthecoverage
transit fromPrimary to theUpperPrimary levelof education compared to 12 percent from Upper PrimarytoSecondarylevelofeducationallwhichissupposedtobeadverselyaffectedeffortsbeingmade towards achieving a target of 30 percentGERattheHigherSecondaryeducationlevel.
Change in Higher Secondary EnrolmentState-specificenrolmentattheHigherSecondarylevelofeducationduring theyears2015-16and2016-17presentedinTable18revealsthatinafewstatesenrolmentintheGradesXI&XIIreportedundertheU-DISEisincompletewhichisalsotrueforstatesinwhichthesameisapartoftheCollegeandHigherEducationanddoesn’tcomeunderthepreviewoftheSchoolEducation.However,overaperiodoftime,thesamehasimprovedbutstillthecoverageisnotuniversal.Ontheonehand,statelikeAndhra Pradesh couldn’t report the Higher
Table 20: Enrolment in Grade XI, 2012-13 to 2015-16
YearGrade XI (In Million)
Boys Girls Total 2012-13 5.59 4.92 10.512013-14 6.10 5.44 11.542014-15 6.39 5.68 12.072015-16 6.57 6.00 12.572016-17 6.14 5.51 11.65
Year%age Share
Boys Girls Total2012-13 53.19 46.81 100.002013-14 52.86 47.14 100.002014-15 52.94 47.06 100.002015-16 52.27 47.73 100.002016-17 52.70 47.30 100.00
YearChange in Enrolment (In Million)
Boys Girls Total2012-13 - - -2013-14 0.51 0.52 1.032014-15 0.29 0.24 0.532015-16 0.18 0.32 0.502016-17 -0.43 -0.49 -0.92
%age Change over 2012-13Year Boys Girls Total
2013-14 8.97 10.69 9.772014-15 14.23 15.56 14.852015-16 34.97 44.02 39.212016-17 9.73 11.94 10.76
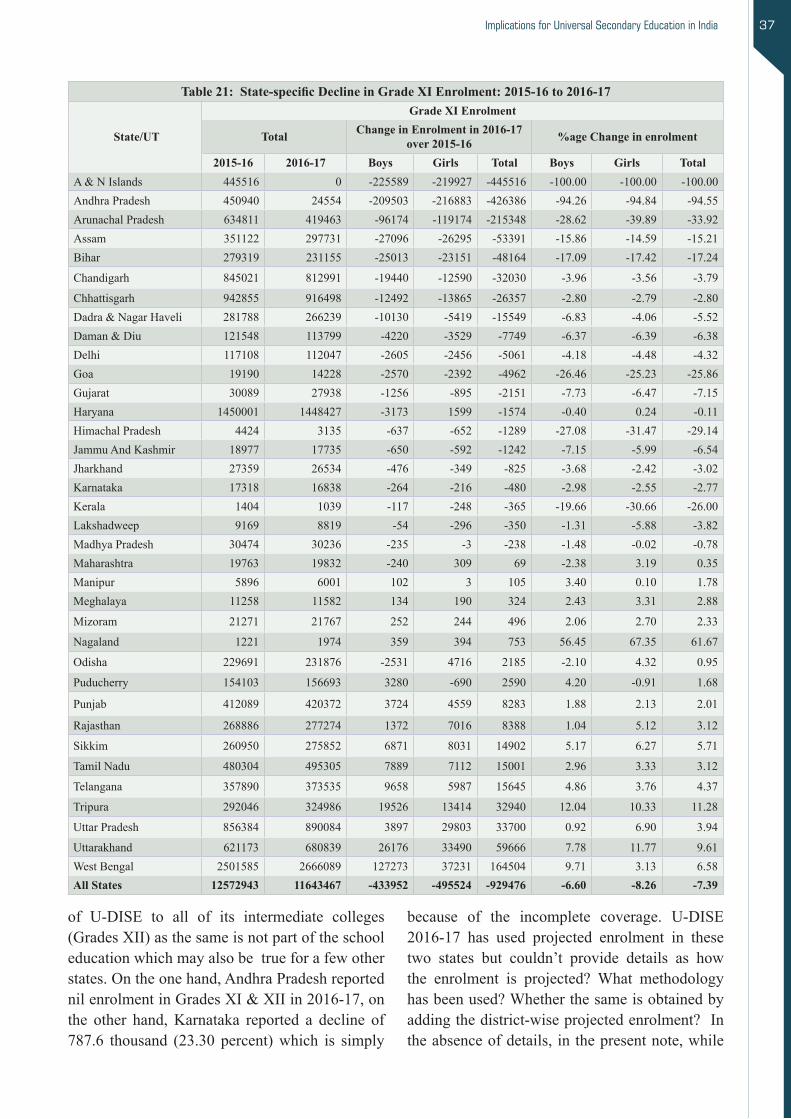
Implications for Universal Secondary Education in India 37
because of the incomplete coverage. U-DISE2016-17 has used projected enrolment in thesetwo states but couldn’t provide details as howthe enrolment is projected?What methodologyhasbeenused?Whetherthesameisobtainedbyaddingthedistrict-wiseprojectedenrolment?Intheabsenceofdetails, inthepresentnote,while
of U-DISE to all of its intermediate colleges(GradesXII)asthesameisnotpartoftheschooleducationwhichmayalsobetrueforafewotherstates.Ontheonehand,AndhraPradeshreportednilenrolmentinGradesXI&XIIin2016-17,onthe other hand,Karnataka reported a decline of787.6 thousand (23.30 percent)which is simply
Table 21: State-specific Decline in Grade XI Enrolment: 2015-16 to 2016-17
State/UT
Grade XI Enrolment
Total Change in Enrolment in 2016-17 over 2015-16 %age Change in enrolment
2015-16 2016-17 Boys Girls Total Boys Girls TotalA&NIslands 445516 0 -225589 -219927 -445516 -100.00 -100.00 -100.00AndhraPradesh 450940 24554 -209503 -216883 -426386 -94.26 -94.84 -94.55ArunachalPradesh 634811 419463 -96174 -119174 -215348 -28.62 -39.89 -33.92Assam 351122 297731 -27096 -26295 -53391 -15.86 -14.59 -15.21Bihar 279319 231155 -25013 -23151 -48164 -17.09 -17.42 -17.24
Chandigarh 845021 812991 -19440 -12590 -32030 -3.96 -3.56 -3.79
Chhattisgarh 942855 916498 -12492 -13865 -26357 -2.80 -2.79 -2.80Dadra&NagarHaveli 281788 266239 -10130 -5419 -15549 -6.83 -4.06 -5.52Daman&Diu 121548 113799 -4220 -3529 -7749 -6.37 -6.39 -6.38Delhi 117108 112047 -2605 -2456 -5061 -4.18 -4.48 -4.32Goa 19190 14228 -2570 -2392 -4962 -26.46 -25.23 -25.86Gujarat 30089 27938 -1256 -895 -2151 -7.73 -6.47 -7.15Haryana 1450001 1448427 -3173 1599 -1574 -0.40 0.24 -0.11HimachalPradesh 4424 3135 -637 -652 -1289 -27.08 -31.47 -29.14JammuAndKashmir 18977 17735 -650 -592 -1242 -7.15 -5.99 -6.54Jharkhand 27359 26534 -476 -349 -825 -3.68 -2.42 -3.02Karnataka 17318 16838 -264 -216 -480 -2.98 -2.55 -2.77Kerala 1404 1039 -117 -248 -365 -19.66 -30.66 -26.00Lakshadweep 9169 8819 -54 -296 -350 -1.31 -5.88 -3.82Madhya Pradesh 30474 30236 -235 -3 -238 -1.48 -0.02 -0.78Maharashtra 19763 19832 -240 309 69 -2.38 3.19 0.35Manipur 5896 6001 102 3 105 3.40 0.10 1.78Meghalaya 11258 11582 134 190 324 2.43 3.31 2.88
Mizoram 21271 21767 252 244 496 2.06 2.70 2.33
Nagaland 1221 1974 359 394 753 56.45 67.35 61.67
Odisha 229691 231876 -2531 4716 2185 -2.10 4.32 0.95
Puducherry 154103 156693 3280 -690 2590 4.20 -0.91 1.68
Punjab 412089 420372 3724 4559 8283 1.88 2.13 2.01
Rajasthan 268886 277274 1372 7016 8388 1.04 5.12 3.12
Sikkim 260950 275852 6871 8031 14902 5.17 6.27 5.71
Tamil Nadu 480304 495305 7889 7112 15001 2.96 3.33 3.12
Telangana 357890 373535 9658 5987 15645 4.86 3.76 4.37
Tripura 292046 324986 19526 13414 32940 12.04 10.33 11.28
Uttar Pradesh 856384 890084 3897 29803 33700 0.92 6.90 3.94
Uttarakhand 621173 680839 26176 33490 59666 7.78 11.77 9.61WestBengal 2501585 2666089 127273 37231 164504 9.71 3.13 6.58All States 12572943 11643467 -433952 -495524 -929476 -6.60 -8.26 -7.39
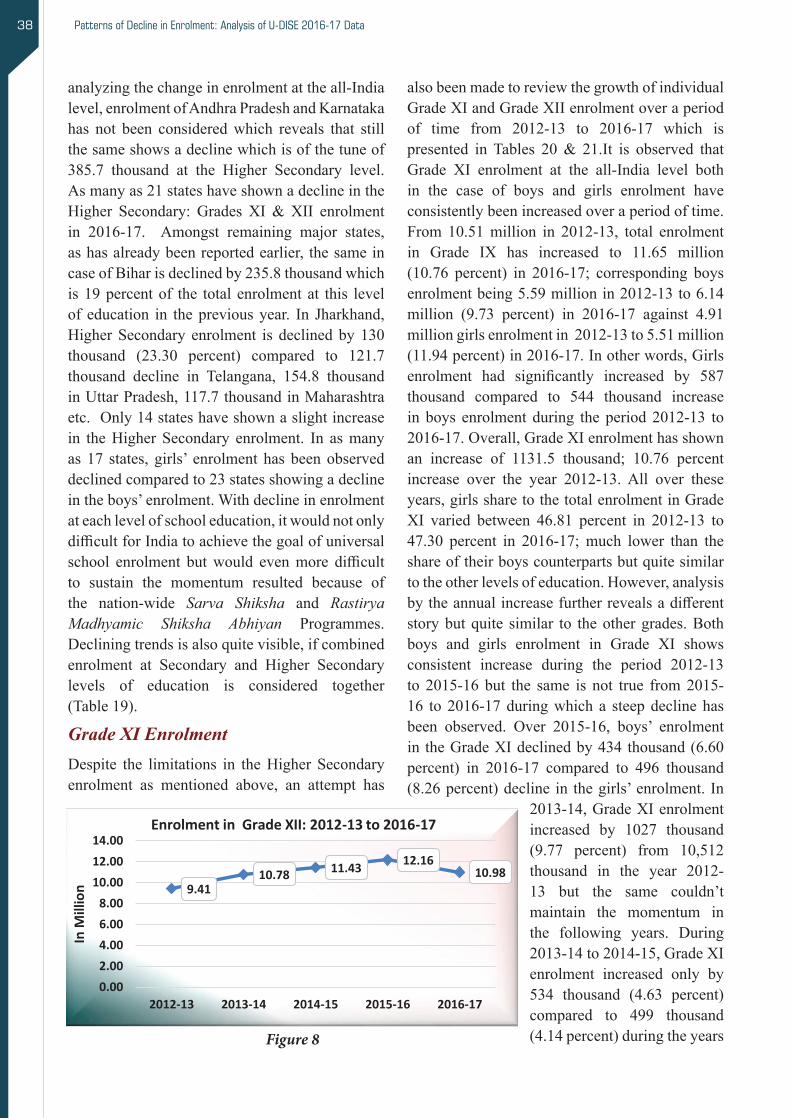
Patterns of Decline in Enrolment: Analysis of U-DISE 2016-17 Data38
alsobeenmadetoreviewthegrowthofindividualGradeXIandGradeXIIenrolmentoveraperiodof time from 2012-13 to 2016-17 which ispresented inTables 20& 21.It is observed thatGrade XI enrolment at the all-India level bothin the case of boys and girls enrolment haveconsistentlybeenincreasedoveraperiodoftime.From 10.51million in 2012-13, total enrolmentin Grade IX has increased to 11.65 million(10.76 percent) in 2016-17; corresponding boysenrolmentbeing5.59millionin2012-13to6.14million (9.73 percent) in 2016-17 against 4.91milliongirlsenrolmentin2012-13to5.51million(11.94percent)in2016-17.Inotherwords,Girlsenrolment had significantly increased by 587thousand compared to 544 thousand increase in boys enrolment during theperiod2012-13 to2016-17.Overall,GradeXIenrolmenthasshownan increase of 1131.5 thousand; 10.76 percentincrease over the year 2012-13.All over theseyears,girlssharetothetotalenrolmentinGradeXI varied between 46.81 percent in 2012-13 to47.30 percent in 2016-17;much lower than theshareoftheirboyscounterpartsbutquitesimilartotheotherlevelsofeducation.However,analysisbytheannualincreasefurtherrevealsadifferentstorybutquite similar to theothergrades.Bothboys and girls enrolment in Grade XI showsconsistent increase during the period 2012-13to 2015-16but the same is not true from2015-16 to2016-17duringwhich a steepdeclinehasbeen observed. Over 2015-16, boys’ enrolmentin theGradeXIdeclinedby434thousand(6.60percent) in 2016-17 compared to 496 thousand(8.26percent)decline in thegirls’enrolment. In
2013-14,GradeXIenrolmentincreased by 1027 thousand (9.77 percent) from 10,512thousand in the year 2012-13 but the same couldn’tmaintain the momentum in the following years. During2013-14to2014-15,GradeXIenrolment increased only by 534 thousand (4.63 percent)compared to 499 thousand (4.14percent)duringtheyears
analyzingthechangeinenrolmentattheall-Indialevel,enrolmentofAndhraPradeshandKarnatakahas not been consideredwhich reveals that stillthesameshowsadeclinewhichisofthetuneof385.7 thousand at the Higher Secondary level.Asmanyas21stateshaveshownadeclineintheHigher Secondary: Grades XI&XII enrolmentin 2016-17. Amongst remaining major states,ashasalreadybeenreportedearlier, thesameincaseofBiharisdeclinedby235.8thousandwhichis19percentof the totalenrolmentat this levelof education in thepreviousyear. In Jharkhand,HigherSecondary enrolment is declinedby130thousand (23.30 percent) compared to 121.7thousand decline in Telangana, 154.8 thousandinUttarPradesh,117.7thousandinMaharashtraetc.Only14stateshaveshownaslightincreasein theHigherSecondary enrolment. In asmanyas 17 states, girls’ enrolment hasbeenobserveddeclinedcomparedto23statesshowingadeclineintheboys’enrolment.Withdeclineinenrolmentateachlevelofschooleducation,itwouldnotonlydifficultforIndiatoachievethegoalofuniversalschool enrolment butwould evenmore difficultto sustain the momentum resulted because of the nation-wide Sarva Shiksha and Rastirya Madhyamic Shiksha Abhiyan Programmes. Decliningtrendsisalsoquitevisible,ifcombinedenrolment at Secondary and Higher Secondarylevels of education is considered together (Table19).
Grade XI EnrolmentDespite the limitations in theHigher Secondaryenrolment as mentioned above, an attempt has
Patterns of Decline in Enrolment: Analysis of U-DISE 2016-17 Data
47
Grade XII Enrolment
Enrolment inGradeXII at the all-India level presented inTable22 reveals that like other
grades, GradeXIIenrolmenthasalso been consistently increased during the period 2012-13 to
2015-16butdeclinedsignificantlyduringthefollowingyeari.e.2016-17.Further,ithasalso
been observed that girl’s enrolment over a period of time has also been increased during the
period 2012-13 to 2015-16butthesamelikethe totalenrolmentinGradeXIItoo declined in
2016-17.Attheall-Indialevel,GradeXIIenrolmenthasincreasedfromalow9.41millionin
2012-13 to 10.77 million in 2014-15,11.43millionin2014-15 and further increased to 12.16
million in 2015-16 but declined to 10.98 million in thefollowingyear2016-17;thusshowing
a decline of 1.18 million in absolute term or 9.71 in the percentage term. Steep decline in the
GradeXIIenrolmentin2016-17 may also be attributed to the incomplete data provided by a
host of the states especiallyAndhraPradeshandKarnatakabothofwhicharecrucialforthe
Countrytomovetowardsthe universalschooleducation.So far as the share of girls’ in Grade
XIIenrolmentisconsidered, the same remained muchlowerthantheshareofboys’ enrolment
in the GradeXIIthroughouttheperiod2012-13 to 2016-17. In the latest year i.e. 2016-17,the
share of girl’s enrolment in the GradeXIIisaslowas47.72percentcomparedto52.28percent
share of boys. During 2015-16 to 2016-17 girls enrolment in Grade XII declined by 493
thousand (8.60 percent) compared to 687 thousand (10.69 percent) decline in the boys
enrolment in GradeXII againstwhich the total enrolment in GradeXII declined by 1180
thousand(9.71percent) during the same period. However,ifanalysedduringtheperiod2012-
13 to 2016-17,bothboys(678thousand,13.43percent)andgirls(890thousand,20.47percent)
enrolment aswellasthe totalenrolment(1,570thousand,16.68percent)inthe GradeXIIshows
an impressiveimprovement.
Figure 8
9.4110.78 11.43 12.16
10.98
0.002.004.006.008.00
10.0012.0014.00
2012-13 2013-14 2014-15 2015-16 2016-17
In M
illio
n
Enrolment in Grade XII: 2012-13 to 2016-17
Figure 8

Implications for Universal Secondary Education in India 39
year 2016-17; thus showing a decline of 1.18million in absolute term or 9.71 in the percentage term.SteepdeclineintheGradeXIIenrolmentin2016-17mayalsobeattributedtotheincompletedata provided by a host of the states especiallyAndhra Pradesh and Karnataka both of whichare crucial for the country tomove towards theuniversalschooleducation.Sofarastheshareofgirls’ inGradeXII enrolment is considered, thesameremainedmuchlowerthantheshareofboys’enrolmentintheGradeXIIthroughouttheperiod2012-13to2016-17.Inthelatestyeari.e.2016-17,theshareofgirl’senrolmentintheGradeXIIisaslowas47.72percentcomparedto52.28percentshare of boys.During 2015-16 to 2016-17 girlsenrolmentinGradeXIIdeclinedby493thousand(8.60percent)comparedto687thousand(10.69percent)decline in theboysenrolment inGradeXII against which the total enrolment in GradeXII declined by 1180 thousand (9.71 percent)
during the same period. However, if analysedduring the period 2012-13to2016-17,bothboys(678thousand, 13.43 percent)and girls (890 thousand,20.47percent)enrolmentas
wellasthetotalenrolment(1,570thousand,16.68percent) in the Grade XII shows an impressiveimprovement.
State-specificenrolmentintheGradeXIIin2015-16 and 2016-17 presented in Table 23 revealsthat apart fromAndhra Pradesh and Karnatakawho had supplied the incomplete data ofGradeXII in2016-17,significantdecline inGradeXIIenrolmenthasalsobeenobservedinthestatesofJharkhand (82,247),Telangana (68,329), JammuandKashmir(16,196),UttarPradesh(3,19,353),Haryana (2,10,93), Gujarat (20,600) and Bihar(20,462). A few states from the North-EasternRegion too had shown a decline in Grade XIIenrolmentin2016-17.Evenadeclinetothetuneof9,116isobservedinDelhi.PercentageofdeclineinUttarPradesh,JharkhandandBiharaloneisofthe tuneof4,22,062 which is66.52percentageof the total decline (6,34,515) in theGradeXIIenrolment. As many as 19 states have shown
2014-15to2015-16butdeclinedby929thousand(7.39percent)inthefollowingyeari.e.from2015-16 to 2016-17. Steep decline in enrolmentmaybebecauseofthestatesthosewho,asmentionedearlier, couldn’t collect the complete enrolmentdata at the Higher Secondary level, such asAndhra Pradesh & Karnataka. About 20 stateshavereportedadeclineinGradeXIenrolmentofwhichBihar reportedadeclineof16.71percentcompared to 4.14 percent in Telangana, 3.74percent in Jharkhand, 2.48 percent inRajasthanand 2.04 percent in Tamil Nadu. It may be recalled that the total decline in Grade XI enrolment isof the tuneof58 thousand (without consideringAndhra Pradesh & Karnataka) which if statesshowing the increase is not considered may behigher at 417 thousand.As many as 16 stateshave reported increase in Grade XI enrolmentin2016-17.AfewsmallerStates&UTssuchas,ArunachalPradesh(25.86percent),Dadra&NagarHaveli (29.14 percent),Lakshadweep (26 .00percent)andDaman&Diu(61.67percent),thedeclinein theGradeXI enrolmentinpercentagetermsisveryhigh.Letus examinewhatisthecontributionofGradeXIIenrolmenttototaldeclineintheHigherSecondaryEnrolmentwhichis presented in the Table 22.
Grade XII EnrolmentEnrolment in Grade XII at the all-India levelpresented in Table 22 reveals that like othergrades, Grade XII enrolment has also beenconsistentlyincreasedduringtheperiod2012-13to 2015-16 but declined significantly during thefollowing year i.e. 2016-17. Further, it has alsobeenobservedthatgirl’senrolmentoveraperiodof time has also been increased during the period 2012-13 to 2015-16 but the same like the totalenrolmentinGradeXIItoodeclinedin2016-17.At the all-India level, GradeXII enrolment hasincreasedfromalow9.41millionin2012-13to10.77millionin2014-15,11.43millionin2014-15andfurtherincreasedto12.16millionin2015-16butdeclinedto10.98millioninthefollowing
“Decline in enrolment in these levels of education has serious implications for the Secondary and Higher Secondary enrolment to grow which may not increase independent to the enrolment in the lower levels”

Patterns of Decline in Enrolment: Analysis of U-DISE 2016-17 Data40
Decline is also high in the case of a few statesfrom the North-Eastern Region which in viewof the small size of these statesmay be termedas alarming. Such states are Meghalaya (9.99percent), Manipur (9.89 percent), Sikkim (8.27percent) andArunachal Pradesh (6.83 percent).Ontheotherhand,ashasalreadybeenmentionedabove that15 stateshave shown increase in theGrade XII enrolment; however barring TamilNadu (62,591 students, 7.44percent),Rajasthan(59,986students,7.38percent)andMaharashtra(1,19,272students,9.23percent),increaseinthepercentage term is not significant but the samein the case of Lakshadweep (36.02 percent,358 students), Daman & Diu (59.49 percent,589 students) andDadra&NagarHavel (80.89students,1731students)isquitehigh.
TrendsinenrolmentatthePrimary,UpperPrimary
decline (6,34,515) in the Grade XII enrolmentcompared to 15 states having shown increase(3,06,305) in2016-17over thepreviousyear. ItmayberecalledthattotalenrolmentintheHigherSecondary grades is declined by 2.10 million in 2016-17 of which 1.18 million (56.19 percent)aloneiscontributedbythedeclineinGradeXIIenrolmentandthebalanceof0.92million(43.81percent) by the decline in GradeXI enrolment.SofarasthepercentageofdeclineinGradeXIIenrolmentin2016-17overthepreviousyear2015-16 isconcerned,asmanyas fourstates,namelyJharkhand (29.34 percent), Telangana (19.91percent),Jammu&Kashmir(12.95percent)andUttar Pradesh (12.00 percent), the percentagedecline is above12percentwhichbyallmeansisconsideredsignificantandmayadverselyaffecttheuniversalhighersecondaryeducationinIndia.
Table 22: Enrolment in Grade XII, 202-13 to 2016-17
YearGrade XII(In Million)
Boys Girls Total 2012-13 5.06 4.35 9.412013-14 5.73 5.04 10.772014-15 6.05 5.38 11.432015-16 6.43 5.73 12.162016-17 5.74 5.24 10.98
Year%age Share
Boys Girls Total2012-13 53.77 46.23 100.002013-14 53.20 46.80 100.002014-15 52.93 47.07 100.002015-16 52.88 47.12 100.002016-17 52.28 47.72 100.00
YearChange in Enrolment (In Million)
Boys Girls Total2012-13 - - -2013-14 0.67 0.69 1.362014-15 0.32 0.34 0.662015-16 0.38 0.35 0.732016-17 -0.69 -0.49 -1.18
%age Change over 2012-13Year Boys Girls Total
2013-14 13.24 15.86 14.452014-15 19.51 23.65 21.432015-16 54.02 63.61 58.452016-17 13.43 20.47 16.68

Implications for Universal Secondary Education in India 41
the period 2012-13 to 2016-17 presented in theTable 24 reveals that enrolment at the PrimarylevelofeducationhasconsistentlydeclinedwhichisnottrueforenrolmentattheUpperPrimarylevelofeducationexceptduringtheperiodfrom2015-16 to 2016-17; all which would have a seriousimplicationforenrolmentattheSecondarylevelofeducationtogrowinyearsthatfollow.UpperPrimaryenrolmentdeclinedby1.51million(2.24percent)to66.08millionin2016-17from67.59millioninthepreviousyeari.e.2015-16.SofarastheenrolmentatthePrimarylevelofeducationisconcerned,thesametoohaddeclinedfromahigh134.78million in 2012-13 to 123.81million in
andElementarylevelsofeducationaswellintheindividualgradeshavealsobeenundertakenandpresented below as the decline in enrolment intheselevelsofeducationhasseriousimplicationsfortheSecondaryandHigherSecondaryenrolmentto growwhichmaynot increase independent tothe enrolment in the lower levels and transitionfromthelowerleveltothislevelofeducationallwhichhasbeencriticallyexaminedbelow.
Enrolment in Primary & Upper Primary ClassesEnrolment in the Primary and Upper Primary classesaswellasintheElementaryclassesduring
Table 23: State-specific Decline in Grade XII Enrolment: 2016-17
State/UTGrade XII Enrolment
2015-16 2016-17 Change over Previous Year %age ChangeTotal Boys Girls Total Boys Girls Total
Uttar Pradesh 2660853 2341500 -208102 -111251 -319353 -14.69 -8.94 -12.00Jharkhand 280316 198069 -45549 -36698 -82247 -30.53 -27.99 -29.34Telangana 343166 274837 -37846 -30483 -68329 -22.37 -17.52 -19.91WestBengal 780475 726202 -32770 -21503 -54273 -8.37 -5.53 -6.95Haryana 303909 282816 -11995 -9098 -21093 -7.05 -6.80 -6.94
Gujarat 470499 449899 -14531 -6069 -20600 -5.52 -2.93 -4.38
Bihar 601614 581152 -23550 3088 -20462 -7.21 1.12 -3.40Jammu&Kashmir 125070 108874 -8207 -7989 -16196 -12.14 -13.90 -12.95Delhi 234682 225566 -4557 -4559 -9116 -3.82 -3.95 -3.88Madhya Pradesh 661792 655126 -7872 1206 -6666 -2.13 0.41 -1.01Chhattisgarh 281511 277695 -6133 2317 -3816 -4.21 1.70 -1.36
HimachalPradesh 109489 106119 -1495 -1875 -3370 -2.62 -3.58 -3.08
Manipur 29823 26874 -1816 -1133 -2949 -11.62 -7.98 -9.89Meghalaya 26224 23604 -799 -1821 -2620 -6.67 -12.78 -9.99ArunachalPradesh 15964 14874 -706 -384 -1090 -8.77 -4.85 -6.83Mizoram 11728 10958 -415 -355 -770 -7.25 -5.92 -6.57Sikkim 7870 7219 -365 -286 -651 -10.39 -6.56 -8.27Chandigarh 18637 18092 -410 -135 -545 -3.87 -1.68 -2.92A&NIslands 4865 4496 -306 -63 -369 -12.90 -2.53 -7.58Total 6968487 6333972 -407424 -227091 -634515 -11.00 -6.96 -9.11
Table 24: Enrolment at Primary, Upper Primary & Elementary Levels of Education: 2012-13 to 2016-17
Year Primary Level: Grades I to V
Change in Enrolment
Upper Primary Level: Grades VI to VIII
Change in Enrolment
Elementary Level: Grades I to VIII
Change in Enrolment
2012-13 134784272 - 64926077 - 199710349 -2013-14 132428440 -2355832 66471219 1545142 196543827 -31665222014-15 130501135 -1927305 67165774 694555 195739604 -8042232015-16 129122784 -1378351 67593727 427953 196716511 9769072016-17 123807892 -5314892 66079123 -1514604 189887015 -6829496
Note: Primary enrolment: 124.62 million in 2005-06, 131.85 million in 2006-07, 134.13 million in 2007-08, 134.38 million in 2008-09, 133.41 million in 2009-10, 135.21 million in 2010-11 & 137.10 million in 2011-12.

Patterns of Decline in Enrolment: Analysis of U-DISE 2016-17 Data42 Patterns of Decline in Enrolment: Analysis of U-DISE 2016-17 Data
52
Figure 9
Percentage change in the decline in enrolment at different levels of school education is
presentedintheTable25whichrevealsthatirrespectiveofaneducationallevel,enrolmentin
2016-17 shows decline over the previous years. The highest decline, as has already been
observedabove,isnoticedinthecaseofPrimarylevelofeducation(4.12percent).Overall,
GradeItoXIIenrolmentdeclinedbyabout3percentduringthesameperiod.Further,ithas
beenobservedthatdeclineinenrolmentin2016-17isacrossallthelevelsofschooleducation
i.e.Primary,UpperPrimary,Elementary,SecondaryandhigherSecondary.
Table 25: Percentage Change in Enrolment over 2012-13, School Education Year Primary Upper
Primary Elementary Secondary Hr. Secondary Total (Grades I to XII)
2012-13 - - - - - 2013-14 -1.75 2.38 -1.59 7.67 12.00 0.74 2014-15 -1.46 1.04 -0.41 2.69 5.32 0.54 2015-16 -1.06 0.64 0.50 2.20 5.25 1.19 2016-17 -4.12 -2.24 -3.47 -0.82 -1.37 -2.87
Figure 10
134.78 132.43 130.50 129.12 123.8164.92 66.47 67.16 67.59
66.07
199.71 196.54 195.74 196.72 189.89
0.00
50.00
100.00
150.00
200.00
250.00
2012-13 2013-14 2014-15 2015-16 2016-17
In M
illio
n
Enrolment at Different Levels of Education: 2012-13 to 2016-17
Primary (I to V) Upper Primary (VI to VIII)Elementary ( I to VIII)
124.62
131.85134.13 134.38 133.41
135.21137.10
134.78132.43
130.50129.12
123.81
115.00
120.00
125.00
130.00
135.00
140.00
In M
illio
n
Year
Enrolment at Primary Level: 2005-06 to 2016-17
Patterns of Decline in Enrolment: Analysis of U-DISE 2016-17 Data
52
Figure 9
Percentage change in the decline in enrolment at different levels of school education is
presentedintheTable25whichrevealsthatirrespectiveofaneducationallevel,enrolmentin
2016-17 shows decline over the previous years. The highest decline, as has already been
observedabove,isnoticedinthecaseofPrimarylevelofeducation(4.12percent).Overall,
GradeItoXIIenrolmentdeclinedbyabout3percentduringthesameperiod.Further,ithas
beenobservedthatdeclineinenrolmentin2016-17isacrossallthelevelsofschooleducation
i.e.Primary,UpperPrimary,Elementary,SecondaryandhigherSecondary.
Table 25: Percentage Change in Enrolment over 2012-13, School Education Year Primary Upper
Primary Elementary Secondary Hr. Secondary Total (Grades I to XII)
2012-13 - - - - - 2013-14 -1.75 2.38 -1.59 7.67 12.00 0.74 2014-15 -1.46 1.04 -0.41 2.69 5.32 0.54 2015-16 -1.06 0.64 0.50 2.20 5.25 1.19 2016-17 -4.12 -2.24 -3.47 -0.82 -1.37 -2.87
Figure 10
134.78 132.43 130.50 129.12 123.8164.92 66.47 67.16 67.59
66.07
199.71 196.54 195.74 196.72 189.89
0.00
50.00
100.00
150.00
200.00
250.00
2012-13 2013-14 2014-15 2015-16 2016-17
In M
illio
n
Enrolment at Different Levels of Education: 2012-13 to 2016-17
Primary (I to V) Upper Primary (VI to VIII)Elementary ( I to VIII)
124.62
131.85134.13 134.38 133.41
135.21137.10
134.78132.43
130.50129.12
123.81
115.00
120.00
125.00
130.00
135.00
140.00
In M
illio
n
Year
Enrolment at Primary Level: 2005-06 to 2016-17
level of educationwasashighas137.10million in 2011-12.During 2005-06 to2011-12, barring afew years, enrolmentin the Primary classes consistently increased from a low 124.62million in 2005-06 to137.10 million in the year 2011-12. From
124.62millionin2005-06,thesameincreasedto131.85millionin2006-07andto134.38millionin2008-09butdeclinedslightlyto133.41millionthenextyearandimprovedagainandreach135.21millionin2010-11.Intherecentyears,itwasthe
year2011-12,whenenrolmentatthePrimarylevelwas the highest, at its peak i.e. 137.10million,thereafter it started to slide down and that tooconsistently.Therefore,itispertinenttoknowthepatterns and possible reasons of decline and states whichhavecontributedthemosttothedeclineinenrolmentatdifferentlevelsofeducation.
2016-17;thusshowingadeclineof10.97millionin the absolute term and 8.13 in the percentage form in a short period of five years. Enrolmentanalysis by the Gender, Scheduled Castes andScheduledTribesmayrevealmoredetailsabout
the decline in enrolment which has got seriousimplementation not only for achieving the goalofUniversalPrimaryEnrolmentbutalsofor theSecondary andother higher levels of education.The sharpest decline in enrolment at the Primary levelofeducationisobservedbetweentheyears2015-16 and 2016-17 duringwhich the same isdeclined by 5.31 million w h i c his 48.40 percent of the total decline in enrolment i.e. Grades ItoXIIduringthe same period. It may also be observedthatenrolment at the Primary
Table 25: Percentage Change in Enrolment over 2012-13, School EducationYear Primary Upper Primary Elementary Secondary Hr. Secondary Total (Grades I to XII)
2012-13 - - - - - -2013-14 -1.75 2.38 -1.59 7.67 12.00 0.742014-15 -1.46 1.04 -0.41 2.69 5.32 0.542015-16 -1.06 0.64 0.50 2.20 5.25 1.192016-17 -4.12 -2.24 -3.47 -0.82 -1.37 -2.87
Figure 9
Figure 10

Implications for Universal Secondary Education in India 43
Change in Primary EnrolmentState-specific enrolment at the Primary level ofeducation and change in enrolment during the period 2015-16 to 2016-17 and percentage tothetotaldeclineispresentedinTable26.Ashasalready been mentioned that Primary enrolment during the said period had declined by a hoping 5.31 million which is 4.12 percent of the totalPrimary enrolment in 2015-16. To the totaldecline in Primary enrolment, boys contributed49.45 percent and that of girls, 50.55 percent.Decline in the absolute terms is considered huge andwouldeventuallyaffecttheeffortsbeingmadetowardstheuniversalprimaryeducation.Inotherterms, boys enrolment declined by 3.93 percentcompared to 4.32 percent decline in their girls counterparts.
State-specific decline inthe Primary enrolment further reveals that morethan 27 percent to decline in enrolment is contributed alone by Bihar followedby Uttar Pradesh (25.79percent), West Bengal(10.93 percent), Jharkhand(9.65percent)andMadhyaPradesh (3.79 percent).As
manyas30outofthe36stateshaveshownadeclineinPrimaryenrolmentin2016-17overthesameinthepreviousyeari.e.2015-16.Inotherwords,itisobservedthatabout53percentofthetotaldeclinein the Primary enrolment is contributed alone by BiharandUttarPradesh.Above90percentofthetotal decline in Primary enrolment is contributed bytenstates.Inrestofthestates,declineissmallbutpercentagetotheirenrolmentinthepreviousyearinafewstatesisquitehigh.About5stateshave shown 10 percent and above decline withNagaland showing the highest, 17.92 percent.The lowest decline, 0.24 percent is observed inTripura.Otherstateswiththehighpercentageofdecline are Jharkhand (11.52 percent), Jammu& Kashmir (10.34 percent),Arunachal Pradesh(16.24 percent), Sikkim (10.58 percent) andLakshadweep(5.13percent).Barringafewstates,
Along with the Primary and Upper Primaryenrolment,enrolmentat theElementary levelofeducation; Classes I to VIII during the period2012-13to2016-17hasalsobeenanalysed(Table24)whichrevealsthatthesamehasdeclinedfroma high of 199.71 million in 2012-13 to 189.89millionin2016-17whichincidentallyisthelowestduringtheseyears.Exceptduringtheyears2014-15to2015-16,aconsistentdeclineinElementaryenrolment has been observed throughout theperiod 2012-13 to 2016-17. During the period2015-16to2016-17,enrolmentattheElementarylevel of education declined to 189.89 millionfromahigh196.72million in thepreviousyeari.e. 2015-16 (9.82 million, 4.99 percent). Year2016-17istheonlyyearduringwhichenrolmentbothatthePrimaryandUpperPrimarylevelsofeducationhaveshownadeclineforthefirsttime.Atotal of 6.83 million decline isobservedinenrolmentinElementary classes whichis 3.47 percent of the total enrolment in the previousyear which is mainlybecause of the steep decline in the Primary enrolment by 5.31 million (4.11percent). This may havegot serious implication for theSecondaryenrolmenttogrow.Alongwiththeaggregate enrolment in the Elementary classes,Grade VIII enrolment and transition from theElementary(GradeVIII)toSecondary(GradeIX)levelofeducationhasalsobeenanalysed.
Percentage change in the decline in enrolment at different levels of school education is presentedintheTable25whichrevealsthatirrespectiveofaneducationallevel,enrolmentin2016-17showsdecline over the previous years. The highestdecline, as has already been observed above, isnoticedinthecaseofPrimarylevelofeducation(4.12percent).Overall,GradeItoXIIenrolmentdeclined by about 3 percent during the same period.Further,ithasbeenobservedthatdeclinein enrolment in 2016-17 is across all the levelsofschooleducationi.e.Primary,UpperPrimary, Elementary,SecondaryandhigherSecondary.
“A total of 6.83 million decline is ob-served in enrolment in Elementary classes which is 3.47 percent of the total enrolment in the previous year which is mainly because of the steep decline in the Primary enrolment by 5.31 million (4.11 percent). This may have got serious implication for the Secondary enrolment to grow”
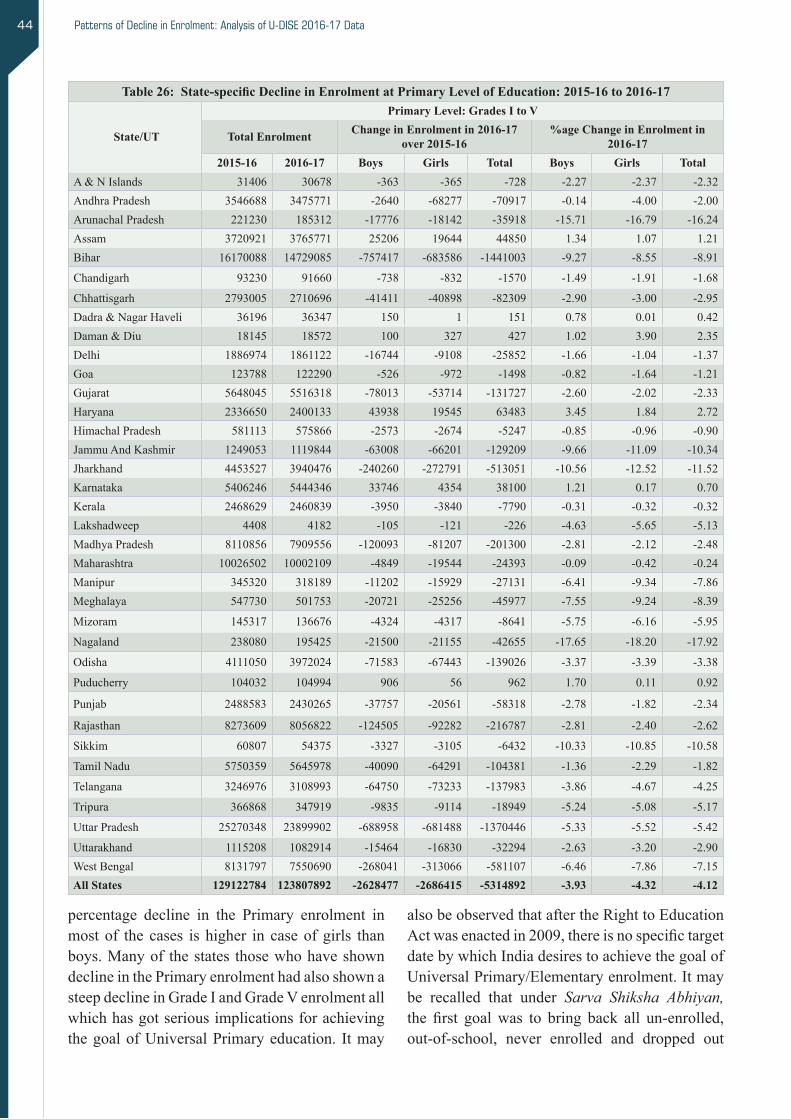
Patterns of Decline in Enrolment: Analysis of U-DISE 2016-17 Data44
alsobeobservedthataftertheRighttoEducationActwasenactedin2009,thereisnospecifictargetdatebywhichIndiadesirestoachievethegoalofUniversalPrimary/Elementaryenrolment.Itmaybe recalled that under Sarva Shiksha Abhiyan, the first goalwas to bring back all un-enrolled,out-of-school, never enrolled and dropped out
percentage decline in the Primary enrolment in most of the cases is higher in case of girls than boys.Manyof thestates thosewhohaveshowndeclineinthePrimaryenrolmenthadalsoshownasteepdeclineinGradeIandGradeVenrolmentallwhichhasgotseriousimplicationsforachievingthegoalofUniversalPrimaryeducation. Itmay
Table 26: State-specific Decline in Enrolment at Primary Level of Education: 2015-16 to 2016-17
State/UT
Primary Level: Grades I to V
Total Enrolment Change in Enrolment in 2016-17 over 2015-16
%age Change in Enrolment in 2016-17
2015-16 2016-17 Boys Girls Total Boys Girls TotalA&NIslands 31406 30678 -363 -365 -728 -2.27 -2.37 -2.32AndhraPradesh 3546688 3475771 -2640 -68277 -70917 -0.14 -4.00 -2.00ArunachalPradesh 221230 185312 -17776 -18142 -35918 -15.71 -16.79 -16.24Assam 3720921 3765771 25206 19644 44850 1.34 1.07 1.21Bihar 16170088 14729085 -757417 -683586 -1441003 -9.27 -8.55 -8.91
Chandigarh 93230 91660 -738 -832 -1570 -1.49 -1.91 -1.68
Chhattisgarh 2793005 2710696 -41411 -40898 -82309 -2.90 -3.00 -2.95Dadra&NagarHaveli 36196 36347 150 1 151 0.78 0.01 0.42Daman&Diu 18145 18572 100 327 427 1.02 3.90 2.35Delhi 1886974 1861122 -16744 -9108 -25852 -1.66 -1.04 -1.37Goa 123788 122290 -526 -972 -1498 -0.82 -1.64 -1.21Gujarat 5648045 5516318 -78013 -53714 -131727 -2.60 -2.02 -2.33Haryana 2336650 2400133 43938 19545 63483 3.45 1.84 2.72HimachalPradesh 581113 575866 -2573 -2674 -5247 -0.85 -0.96 -0.90JammuAndKashmir 1249053 1119844 -63008 -66201 -129209 -9.66 -11.09 -10.34Jharkhand 4453527 3940476 -240260 -272791 -513051 -10.56 -12.52 -11.52Karnataka 5406246 5444346 33746 4354 38100 1.21 0.17 0.70Kerala 2468629 2460839 -3950 -3840 -7790 -0.31 -0.32 -0.32Lakshadweep 4408 4182 -105 -121 -226 -4.63 -5.65 -5.13Madhya Pradesh 8110856 7909556 -120093 -81207 -201300 -2.81 -2.12 -2.48Maharashtra 10026502 10002109 -4849 -19544 -24393 -0.09 -0.42 -0.24Manipur 345320 318189 -11202 -15929 -27131 -6.41 -9.34 -7.86Meghalaya 547730 501753 -20721 -25256 -45977 -7.55 -9.24 -8.39
Mizoram 145317 136676 -4324 -4317 -8641 -5.75 -6.16 -5.95
Nagaland 238080 195425 -21500 -21155 -42655 -17.65 -18.20 -17.92
Odisha 4111050 3972024 -71583 -67443 -139026 -3.37 -3.39 -3.38
Puducherry 104032 104994 906 56 962 1.70 0.11 0.92
Punjab 2488583 2430265 -37757 -20561 -58318 -2.78 -1.82 -2.34
Rajasthan 8273609 8056822 -124505 -92282 -216787 -2.81 -2.40 -2.62
Sikkim 60807 54375 -3327 -3105 -6432 -10.33 -10.85 -10.58
Tamil Nadu 5750359 5645978 -40090 -64291 -104381 -1.36 -2.29 -1.82
Telangana 3246976 3108993 -64750 -73233 -137983 -3.86 -4.67 -4.25
Tripura 366868 347919 -9835 -9114 -18949 -5.24 -5.08 -5.17
Uttar Pradesh 25270348 23899902 -688958 -681488 -1370446 -5.33 -5.52 -5.42
Uttarakhand 1115208 1082914 -15464 -16830 -32294 -2.63 -3.20 -2.90WestBengal 8131797 7550690 -268041 -313066 -581107 -6.46 -7.86 -7.15All States 129122784 123807892 -2628477 -2686415 -5314892 -3.93 -4.32 -4.12
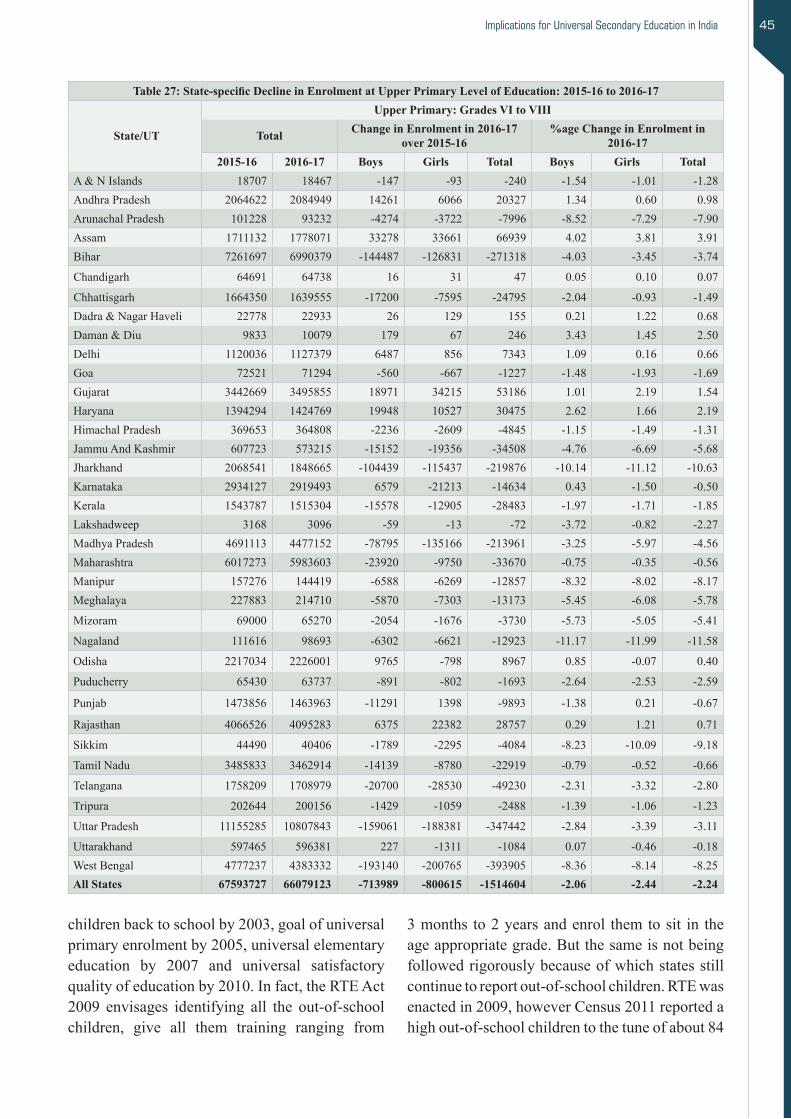
Implications for Universal Secondary Education in India 45
3 months to 2 years and enrol them to sit in the ageappropriategrade.Butthesameisnotbeingfollowedrigorouslybecauseofwhichstatesstillcontinuetoreportout-of-schoolchildren.RTEwasenactedin2009,howeverCensus2011reportedahighout-of-schoolchildrentothetuneofabout84
childrenbacktoschoolby2003,goalofuniversalprimaryenrolmentby2005,universalelementaryeducation by 2007 and universal satisfactoryqualityofeducationby2010.Infact,theRTEAct2009 envisages identifying all the out-of-schoolchildren, give all them training ranging from
Table 27: State-specific Decline in Enrolment at Upper Primary Level of Education: 2015-16 to 2016-17
State/UT
Upper Primary: Grades VI to VIII
Total Change in Enrolment in 2016-17 over 2015-16
%age Change in Enrolment in 2016-17
2015-16 2016-17 Boys Girls Total Boys Girls TotalA&NIslands 18707 18467 -147 -93 -240 -1.54 -1.01 -1.28AndhraPradesh 2064622 2084949 14261 6066 20327 1.34 0.60 0.98ArunachalPradesh 101228 93232 -4274 -3722 -7996 -8.52 -7.29 -7.90Assam 1711132 1778071 33278 33661 66939 4.02 3.81 3.91Bihar 7261697 6990379 -144487 -126831 -271318 -4.03 -3.45 -3.74
Chandigarh 64691 64738 16 31 47 0.05 0.10 0.07
Chhattisgarh 1664350 1639555 -17200 -7595 -24795 -2.04 -0.93 -1.49Dadra&NagarHaveli 22778 22933 26 129 155 0.21 1.22 0.68Daman&Diu 9833 10079 179 67 246 3.43 1.45 2.50Delhi 1120036 1127379 6487 856 7343 1.09 0.16 0.66Goa 72521 71294 -560 -667 -1227 -1.48 -1.93 -1.69Gujarat 3442669 3495855 18971 34215 53186 1.01 2.19 1.54Haryana 1394294 1424769 19948 10527 30475 2.62 1.66 2.19HimachalPradesh 369653 364808 -2236 -2609 -4845 -1.15 -1.49 -1.31JammuAndKashmir 607723 573215 -15152 -19356 -34508 -4.76 -6.69 -5.68Jharkhand 2068541 1848665 -104439 -115437 -219876 -10.14 -11.12 -10.63Karnataka 2934127 2919493 6579 -21213 -14634 0.43 -1.50 -0.50Kerala 1543787 1515304 -15578 -12905 -28483 -1.97 -1.71 -1.85Lakshadweep 3168 3096 -59 -13 -72 -3.72 -0.82 -2.27Madhya Pradesh 4691113 4477152 -78795 -135166 -213961 -3.25 -5.97 -4.56Maharashtra 6017273 5983603 -23920 -9750 -33670 -0.75 -0.35 -0.56Manipur 157276 144419 -6588 -6269 -12857 -8.32 -8.02 -8.17Meghalaya 227883 214710 -5870 -7303 -13173 -5.45 -6.08 -5.78
Mizoram 69000 65270 -2054 -1676 -3730 -5.73 -5.05 -5.41
Nagaland 111616 98693 -6302 -6621 -12923 -11.17 -11.99 -11.58
Odisha 2217034 2226001 9765 -798 8967 0.85 -0.07 0.40
Puducherry 65430 63737 -891 -802 -1693 -2.64 -2.53 -2.59
Punjab 1473856 1463963 -11291 1398 -9893 -1.38 0.21 -0.67
Rajasthan 4066526 4095283 6375 22382 28757 0.29 1.21 0.71
Sikkim 44490 40406 -1789 -2295 -4084 -8.23 -10.09 -9.18
Tamil Nadu 3485833 3462914 -14139 -8780 -22919 -0.79 -0.52 -0.66
Telangana 1758209 1708979 -20700 -28530 -49230 -2.31 -3.32 -2.80
Tripura 202644 200156 -1429 -1059 -2488 -1.39 -1.06 -1.23
Uttar Pradesh 11155285 10807843 -159061 -188381 -347442 -2.84 -3.39 -3.11
Uttarakhand 597465 596381 227 -1311 -1084 0.07 -0.46 -0.18WestBengal 4777237 4383332 -193140 -200765 -393905 -8.36 -8.14 -8.25All States 67593727 66079123 -713989 -800615 -1514604 -2.06 -2.44 -2.24

Patterns of Decline in Enrolment: Analysis of U-DISE 2016-17 Data46
enrolment most of which also had shown adecline in the Primary enrolment during the sameperiodi.e.2015-16to2016-17.Inasmanyas ten states, the decline observed in theUpperPrimaryenrolmentisabovethefivepercent.WestBengal(26.01percent)followedbyUttarPradesh(22.94percent),Bihar(17.91percent),Jharkhand(14.52percent),MadhyaPradesh(14.13percent)and Telangana (3.25 percent) have contributedsignificantly to the total decline in the UpperPrimary enrolment. Year 2016-17 is the firstyearinwhichnotonlyenrolmentinthePrimaryclasses has been declined (5.31 million) butUpper Primary enrolment has also declined in 26 outofthe36stateswhichwillsignificantlyaffectenrolmentattheSecondarylevelofeducationtogrowinyearsthatfollow.
Total Enrolment at School Level:Grades I to XIIThestate-specifictotalenrolmentintheGradesItoXIIfortheyears2015-16and2016-17hasbeenpresentedintheTable28whichrevealsadeclineofabout9.26million(3.55percent)butinviewofthepartialdatabeenprovidedattheSecondaryandHigherSecondary levelsofeducationespeciallybyAndhraPradeshandKarnataka,actualdeclinemay be a bit lower than the presented here.However, decline in a few states is significantandwouldeventuallyaffectthegoalofachievingUniversal Secondary Education which by allmeans is still adistantdream.Asuddendeclineinenrolmentatallthelevelsofschooleducationmay raise serious issues regarding incentivesbeingprovidedtostudentsundertheflagshipSSAandRMSAprogrammeswhich theCountryhadinvestedimmenselywhichshallincludethemid-daymeals,freetextbooks&uniformsandthehostoftheothersuchincentives.Eventhenumberofteachers in the government schools is also usedtobeprovidedbasedon thenumberof studentsa school has. Reasons of the steep decline in the enrolment need further probe which may notonly because of the launching of the student data collectioninthein-syncwiththeU-DISEduring2016-17.
State-specific decline in the enrolment (Tables
million of 5 to 17 years age group. The Ministry ofHRDcommissionedsurvey(2014)reported61million children of the age-group 6 to 13 yearsas the out-of-schools which may be treated asthegrossunderestimate,ifthesameiscomparedwith the 2011 Census estimates. Between 2011to2014,duringwhichtheout-of-schoolchildrenis reported to have declined, enrolment in theElementary classes increased from 193 million in 2010-11to199millionin2013-14;correspondingNet Enrolment Ratio being 99.89 and 61.82 percent in2010-11and88.08and70.20percentin2013-14respectivelyatthePrimaryandUpperprimary levels of education. Based on a morerecent National Sample Survey 71st Round,Dubey etc (2018) estimated a total of about 45millionout-of-schoolchildrenoftheage-group6to 14 years. This may be termed as disappointing asevenaftermanyyearsoftheRTE,theUPEisstill a far distant goal in the real sense. Despite theRTE,majorityoftheschoolsstilldonothaveall the necessary facilities required for smoothfunctioningofschools.U-DISEreportedtohavecollected data from a good number of unrecognised schoolswhichaspertheRTEcouldn’thavehadinposition after 31st March 2013.
Change in Upper Primary Enrolment The state-specific change in the enrolment atUpper Primary level of education during theperiod 2015-16 to 2016-17 is presented in theTable27whichrevealsthatenrolmentisdeclinedby1.51millionwhichis2.24percentofthetotalenrolmentduring thepreviousyearcomparedtowhichenrolmentatthePrimaryleveldeclinedby5.31million.A totaldeclineof6.83millionhasbeenreportedintheElementaryenrolmentwhichis 3.47 percent of the same during the previousyear.Analysisbythegenderfurtherreveals(Table27)thatboysenrolmentdeclinedby2.06percent(0.71million)andthatofgirls,2.44percent(0.81million).Ofthetotaldecline,boyssharewastothetuneof47.02percentandtherest,52.98percentwascontributedbytheirgirls’counterpart.State-specificchange in theUpperPrimaryenrolmentfurther shows that as many as 26 states havehadshownadeclineeven in theUpperPrimary

Implications for Universal Secondary Education in India 47
statesnamely,Assam,Daman&Diu,Delhi,Goa,HimachalPradesh andMaharashtrahave shownanincreasingtrendinthetotalenrolment(GradesItoXII)in2016-17overthepreviousyear.Further,ithasalsobeenobservedthatdecliningstateshave
28&29)furtherrevealsthatthesameisdeclinedby 2.02 million alone in Bihar, 1.00 million inJharkhand and1.87million inUttarPradesh allwhich are crucial for the Country in achievingthegoalofUniversalSchoolEducation.Onlysix
Table 28: State-specific Decline in Total Enrolment (Grades I to XII): 2015-16 to 2016-17
State/UT
Total Enrolment: Grades I to XII
Total Change in Enrolment in 2016-17 over 2015-16
%age Change in enrolment in 2016-17
2015-16 2016-17 Boys Girls Total Boys Girls TotalA&NIslands 73693 72071 -883 -739 -1622 -2.35 -2.04 -2.20AndhraPradesh* 7821275 6847297 -458196 -515782 -973978 -11.36 -13.62 -12.45ArunachalPradesh 411280 359104 -26675 -25501 -52176 -12.78 -12.59 -12.69Assam 6826486 6960679 65456 68737 134193 1.93 2.00 1.97Bihar 28089637 26068985 -1077001 -943651 -2020652 -7.61 -6.77 -7.19
Chandigarh 238081 237642 -366 -73 -439 -0.28 -0.07 -0.18
Chhattisgarh 5997455 5848923 -87856 -60676 -148532 -2.89 -2.05 -2.48Dadra&NagarHaveli 78468 79594 567 559 1126 1.35 1.53 1.43Daman&Diu 36275 38314 908 1131 2039 4.68 6.70 5.62Delhi 4215161 4221237 -3923 9999 6076 -0.18 0.51 0.14Goa 282726 278973 -1764 -1989 -3753 -1.20 -1.46 -1.33Gujarat 11779142 11704790 -68971 -5381 -74352 -1.07 -0.10 -0.63Haryana 5205989 5334021 82194 45838 128032 2.87 1.96 2.46HimachalPradesh 1433260 1407049 -14179 -12032 -26211 -1.88 -1.77 -1.83Jammu&Kashmir 2441743 2227923 -103308 -110512 -213820 -8.04 -9.55 -8.76Jharkhand 8107496 7102825 -489710 -514961 -1004671 -11.89 -12.91 -12.39Karnataka* 10928854 10190741 -323494 -414619 -738113 -5.75 -7.82 -6.75Kerala 5915805 5865210 -29621 -20974 -50595 -0.99 -0.72 -0.86Lakshadweep 12492 12153 -169 -170 -339 -2.76 -2.67 -2.71Madhya Pradesh 16662658 16289382 -191216 -182060 -373276 -2.17 -2.31 -2.24Maharashtra 22467300 22600366 73279 59787 133066 0.61 0.57 0.59Manipur 648463 599269 -23121 -26073 -49194 -7.03 -8.16 -7.59Meghalaya 934691 867233 -30324 -37134 -67458 -6.64 -7.77 -7.22
Mizoram 278837 261015 -9266 -8556 -17822 -6.47 -6.30 -6.39
Nagaland 440113 376312 -32309 -31492 -63801 -14.44 -14.56 -14.50
Odisha 8076265 7999285 -30859 -46121 -76980 -0.74 -1.18 -0.95
Puducherry 248683 246947 -353 -1383 -1736 -0.28 -1.13 -0.70
Punjab 5541399 5493614 -38774 -9011 -47785 -1.27 -0.36 -0.86
Rajasthan 16328709 16186118 -122926 -19665 -142591 -1.37 -0.27 -0.87
Sikkim 149586 136291 -6330 -6965 -13295 -8.48 -9.29 -8.89
Tamil Nadu 13277981 13185526 -45479 -46976 -92455 -0.68 -0.72 -0.70
Telangana 6757601 6439354 -152108 -166139 -318247 -4.41 -5.02 -4.71
Tripura 767456 736552 -16761 -14143 -30904 -4.28 -3.76 -4.03
Uttar Pradesh 48406853 46541317 -868016 -997520 -1865536 -3.49 -4.24 -3.85
Uttarakhand 2409967 2375643 -15152 -19172 -34324 -1.20 -1.67 -1.42WestBengal 17305080 16144562 -584066 -576452 -1160518 -6.84 -6.58 -6.71All States 260596960 251336317** -4630772 -4629871 -9260643 -3.43 -3.69 -3.55
*: Steep decline is because of the incomplete enrolment provided at Higher Secondary Level of Education.**: 25,31,08,405 including projected enrolment in the states of Andhra Pradesh & Karnataka.

Patterns of Decline in Enrolment: Analysis of U-DISE 2016-17 Data48
Table 29: State-specific Decline in Enrolment at Different Levels of School Education: 2015-16 to 2016-17
State/UT
Decline in Enrolment to Total Decline: 2016-17 over 2015-16
Primary Upper Primary Secondary Higher Secondary Total Enrolment:
Grades I to XII
Decline in
Enrolment
% Decline
Decline in
Enrolment
% Decline
Decline in
Enrolment
% Decline
Decline in
Enrolment
% Decline
A&NIslands -728 0.01 -240 -0.02 -390 -0.12 -264 -0.01 -1622AndhraPradesh* -70917 1.33 20327 1.34 13212 4.11 -936600 -44.39 -973978ArunachalPradesh -35918 0.68 -7996 -0.53 -2210 -0.69 -6052 -0.29 -52176Assam 44850 -0.84 66939 4.42 12088 3.76 10316 0.49 134193Bihar -1441003 27.11 -271318 -17.91 -72521 -22.58 -235810 -11.18 -2020652Chandigarh -1570 0.03 47 0.00 1133 0.35 -49 0.00 -439Chhattisgarh -82309 1.55 -24795 -1.64 -46000 -14.32 4572 0.22 -148532Dadra&NagarHaveli 151 0.00 155 0.01 378 0.12 442 0.02 1126Daman&Diu 427 -0.01 246 0.02 24 0.01 1342 0.06 2039Delhi -25852 0.49 7343 0.48 49250 15.33 -24665 -1.17 6076Goa -1498 0.03 -1227 -0.08 -2351 -0.73 1323 0.06 -3753
Gujarat -131727 2.48 53186 3.51 9788 3.05 -5599 -0.27 -74352
Haryana 63483 -1.19 30475 2.01 22227 6.92 11847 0.56 128032HimachalPradesh -5247 0.10 -4845 -0.32 -7688 -2.39 -8431 -0.40 -26211Jammu&Kashmir -129209 2.43 -34508 -2.28 -26158 -8.14 -23945 -1.13 -213820Jharkhand -513051 9.65 -219876 -14.52 -141333 -44.00 -130411 -6.18 -1004671Karnataka* 38100 -0.72 -14634 -0.97 25986 8.09 -787565 -37.33 -738113Kerala -7790 0.15 -28483 -1.88 -33066 -10.29 18744 0.89 -50595Lakshadweep -226 0.00 -72 0.00 -34 -0.01 -7 0.00 -339Madhya Pradesh -201300 3.79 -213961 -14.13 -11015 -3.43 53000 2.51 -373276Maharashtra -24393 0.46 -33670 -2.22 73431 22.86 117698 5.58 133066Manipur -27131 0.51 -12857 -0.85 -6019 -1.87 -3187 -0.15 -49194Meghalaya -45977 0.87 -13173 -0.87 -4863 -1.51 -3445 -0.16 -67458Mizoram -8641 0.16 -3730 -0.25 -5005 -1.56 -446 -0.02 -17822Nagaland -42655 0.80 -12923 -0.85 -8115 -2.53 -108 -0.01 -63801Odisha -139026 2.62 8967 0.59 4655 1.45 48424 2.30 -76980Puducherry 962 -0.02 -1693 -0.11 -717 -0.22 -288 -0.01 -1736Punjab -58318 1.10 -9893 -0.65 261 0.08 20165 0.96 -47785Rajasthan -216787 4.08 28757 1.90 17483 5.44 27956 1.32 -142591Sikkim -6432 0.12 -4084 -0.27 -1778 -0.55 -1001 -0.05 -13295Tamil Nadu -104381 1.96 -22919 -1.51 -1389 -0.43 36234 1.72 -92455Telangana -137983 2.60 -49230 -3.25 -9314 -2.90 -121720 -5.77 -318247Tripura -18949 0.36 -2488 -0.16 -7418 -2.31 -2049 -0.10 -30904Uttar Pradesh -1370446 25.79 -347442 -22.94 7201 2.24 -154849 -7.34 -1865536Uttarakhand -32294 0.61 -1084 -0.07 -5998 -1.87 5052 0.24 -34324WestBengal -581107 10.93 -393905 -26.01 -164933 -51.35 -20573 -0.98 -1160518All States -5314892 100.00 -1514604 -100.00 -321198 -100.00 -2109949 -100.00 -9260643
showndeclineincaseofbothgirlsaswellasboysenrolment individually.Of the total2.02milliondeclineinBihar,boyscontributionisofthetuneof1.08million(53.47percent)andthatofgirls,0.94million(46.53percent);thusshowingthatdeclineis higher in the case of boys than their counterpart girls.However, in Jharkhand, it is just reversed
asthedeclineinthecaseofgirls(0.51million)ismorethanboys(0.49million).Inabout16states,declineinthecaseofgirlsenrolmentinGradesItoXIIishigherthantheboys.ApartfromBiharand Jharkhand, West Bengal is one of anothermajor statewhich toohad reporteda significantdeclineinthetotalenrolmentwhichhasdeclined

Implications for Universal Secondary Education in India 49
Table 30: State-specific Percentage to total Decline in Enrolment: 2015-16 to 2016-17
State/UT
Primary Upper Primary Secondary Higher Secondary Total Enrolment:
Grades I to XII
Decline in
Enrolment
% Decline
Decline in
Enrolment
% Decline
Decline in
Enrolment
% Decline
Decline in
Enrolment
% Decline
A&NIslands -728 44.88 -240 14.80 -390 24.04 -264 16.28 -1622AndhraPradesh* -70917 7.28 20327 -2.09 13212 -1.36 -936600 96.16 -973978ArunachalPradesh -35918 68.84 -7996 15.33 -2210 4.24 -6052 11.60 -52176Assam 44850 33.42 66939 49.88 12088 9.01 10316 7.69 134193Bihar -1441003 71.31 -271318 13.43 -72521 3.59 -235810 11.67 -2020652Chandigarh -1570 357.63 47 -10.71 1133 -258.09 -49 11.16 -439Chhattisgarh -82309 55.41 -24795 16.69 -46000 30.97 4572 -3.08 -148532Dadra&NagarHaveli 151 13.41 155 13.77 378 33.57 442 39.25 1126Daman&Diu 427 20.94 246 12.06 24 1.18 1342 65.82 2039Delhi -25852 -425.48 7343 120.85 49250 810.57 -24665 -405.94 6076Goa -1498 39.91 -1227 32.69 -2351 62.64 1323 -35.25 -3753Gujarat -131727 177.17 53186 -71.53 9788 -13.16 -5599 7.53 -74352Haryana 63483 49.58 30475 23.80 22227 17.36 11847 9.25 128032HimachalPradesh -5247 20.02 -4845 18.48 -7688 29.33 -8431 32.17 -26211Jammu&Kashmir -129209 60.43 -34508 16.14 -26158 12.23 -23945 11.20 -213820Jharkhand -513051 51.07 -219876 21.89 -141333 14.07 -130411 12.98 -1004671Karnataka* 38100 -5.16 -14634 1.98 25986 -3.52 -787565 106.70 -738113Kerala -7790 15.40 -28483 56.30 -33066 65.35 18744 -37.05 -50595Lakshadweep -226 66.67 -72 21.24 -34 10.03 -7 2.06 -339Madhya Pradesh -201300 53.93 -213961 57.32 -11015 2.95 53000 -14.20 -373276Maharashtra -24393 -18.33 -33670 -25.30 73431 55.18 117698 88.45 133066Manipur -27131 55.15 -12857 26.14 -6019 12.24 -3187 6.48 -49194Meghalaya -45977 68.16 -13173 19.53 -4863 7.21 -3445 5.11 -67458Mizoram -8641 48.49 -3730 20.93 -5005 28.08 -446 2.50 -17822Nagaland -42655 66.86 -12923 20.26 -8115 12.72 -108 0.17 -63801Odisha -139026 180.60 8967 -11.65 4655 -6.05 48424 -62.90 -76980Puducherry 962 -55.41 -1693 97.52 -717 41.30 -288 16.59 -1736Punjab -58318 122.04 -9893 20.70 261 -0.55 20165 -42.20 -47785Rajasthan -216787 152.03 28757 -20.17 17483 -12.26 27956 -19.61 -142591Sikkim -6432 48.38 -4084 30.72 -1778 13.37 -1001 7.53 -13295Tamil Nadu -104381 112.90 -22919 24.79 -1389 1.50 36234 -39.19 -92455Telangana -137983 43.36 -49230 15.47 -9314 2.93 -121720 38.25 -318247Tripura -18949 61.32 -2488 8.05 -7418 24.00 -2049 6.63 -30904Uttar Pradesh -1370446 73.46 -347442 18.62 7201 -0.39 -154849 8.30 -1865536Uttarakhand -32294 94.09 -1084 3.16 -5998 17.47 5052 -14.72 -34324WestBengal -581107 50.07 -393905 33.94 -164933 14.21 -20573 1.77 -1160518All States -5314892 57.39 -1514604 16.36 -321198 3.47 -2109949 22.78 -9260643
to16.14millionin2016-17fromahighof17.31million; thus showing a decline of 1.16million(6.71percent).However,declineincaseofgirlsisabitlowerthantheirboys’counterpartsinWestBengal.Chhattisgarh(1,48,532students),Gujarat(74,352 students), Jammu&Kashmir (2,13,820students), Madhya Pradesh (3,73,276 students),Rajasthan (1,42,591 students) and Telangana
(3,18,247students)area fewother stateswhichtoohad showna significant decline in theTotalI to XII enrolment. In a few smaller States &UTs,thoughdeclineinthetotalenrolmentislowin absolute term but the same in the percentage termisveryhigh.Declinewasinthetuneof12.69and 14.50 percent respectively in the states ofArunachalPradeshandNagaland.Further ithas
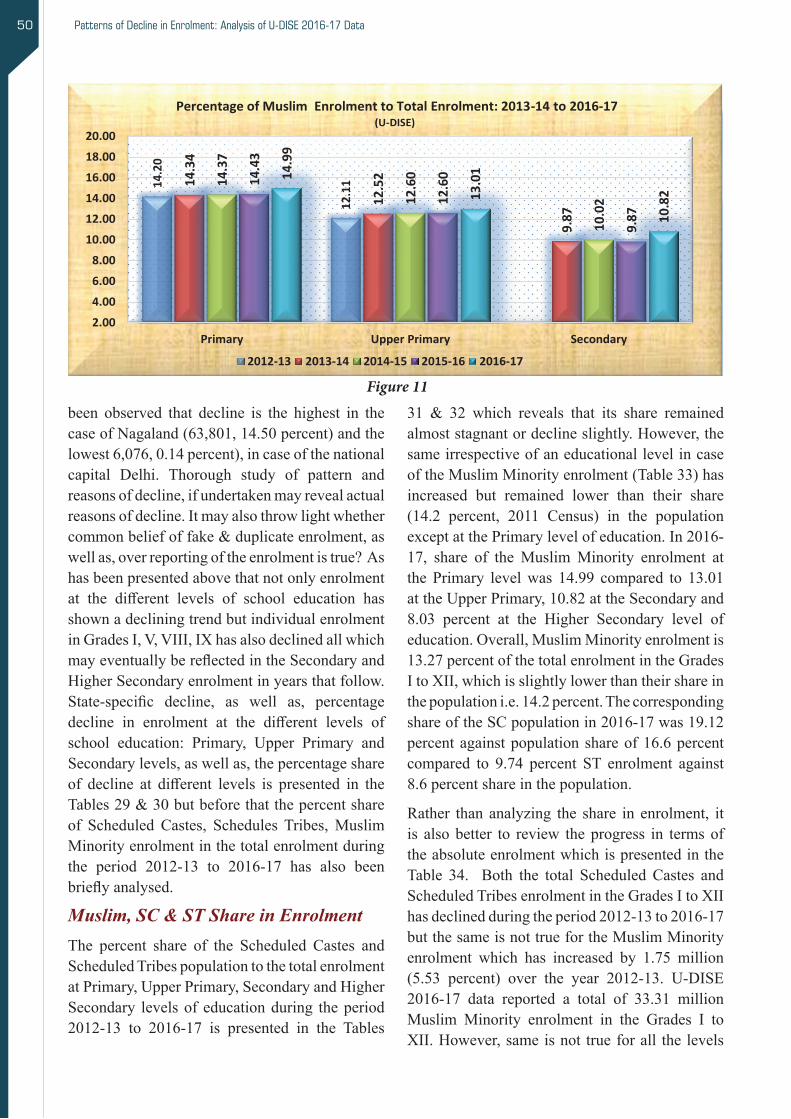
Patterns of Decline in Enrolment: Analysis of U-DISE 2016-17 Data50 Patterns of Decline in Enrolment: Analysis of U-DISE 2016-17 Data
64
Figure 11
Table 34: Scheduled Castes , Scheduled Tribes & Muslim Enrolment, 2012-13 & 2016-17
Year Primary Upper Primary Secondary Higher
Secondary Total
Scheduled Castes 2012-13 27284611 12584198 6317024 3451837 49637670 2016-17 24313511 12640956 7213840 3895761 48064068 Change -2971100 56758 896816 443924 -1573602 %Change -10.89 0.45 14.20 12.86 -3.17
Scheduled Tribes 2012-13 15202000 6361241 2915233 1232768 25711242 2016-17 13080793 6562561 3276570 1552853 24472777 Change -2121207 201320 361337 320085 -1238465 %Change -13.95 3.16 12.39 25.96 -4.82
Muslim Minority 2012-13 19139710 7863433 3135465 1422171 31560779 2016-17 18554694 8594047 4199948 1958374 33307063 Change -585016 730614 1064483 536203 1746284 %Change -3.06 9.29 33.95 37.70 5.53 2015-16 SC 25742437 13175293 7311216 4287448 50516394 ST 13739147 6630378 3323235 1674735 25367495 Muslim 18631695 8515253 4008147 1990990 33146085 %age Change
SC -5.55 -4.06 -1.33 -9.14 -4.85 ST -4.79 -1.02 -1.40 -7.28 -3.53 Muslim -0.41 0.93 4.79 -1.64 0.49
CWSN Students
Ashas alreadybeen indicated that together the Secondary andHigherSecondary levels of
education has a total enrolment of 63.22 million in 2016-17 ofwhichtheshareofthe Secondary
levelis38.82 million (61.40percent) and that of the HigherSecondarylevel,26.40 million
14.2
0
12.1
114.3
4
12.5
2
9.87
14.3
7
12.6
0
10.0
2
14.4
3
12.6
0
9.87
14.9
9
13.0
1
10.8
2
2.004.006.008.00
10.0012.0014.0016.0018.0020.00
Primary Upper Primary Secondary
Percentage of Muslim Enrolment to Total Enrolment: 2013-14 to 2016-17(U-DISE)
2012-13 2013-14 2014-15 2015-16 2016-17
been observed that decline is the highest in thecaseofNagaland(63,801,14.50percent)andthelowest6,076,0.14percent),incaseofthenationalcapital Delhi. Thorough study of pattern and reasonsofdecline,ifundertakenmayrevealactualreasonsofdecline.Itmayalsothrowlightwhethercommonbeliefoffake&duplicateenrolment,aswellas,overreportingoftheenrolmentistrue?Ashasbeenpresentedabovethatnotonlyenrolmentat the different levels of school education hasshownadecliningtrendbutindividualenrolmentinGradesI,V,VIII,IXhasalsodeclinedallwhichmayeventuallybereflectedintheSecondaryandHigherSecondaryenrolmentinyearsthatfollow.State-specific decline, as well as, percentagedecline in enrolment at the different levels ofschool education: Primary, Upper Primary andSecondarylevels,aswellas,thepercentageshareof decline at different levels is presented in theTables29&30butbeforethatthepercentshareof Scheduled Castes, Schedules Tribes,MuslimMinority enrolment in the total enrolment during the period 2012-13 to 2016-17 has also beenbrieflyanalysed.
Muslim, SC & ST Share in EnrolmentThe percent share of the Scheduled Castes and Scheduled Tribes population to the total enrolment atPrimary,UpperPrimary,SecondaryandHigherSecondary levelsof educationduring theperiod2012-13 to 2016-17 is presented in the Tables
31 & 32 which reveals that its share remainedalmoststagnantordeclineslightly.However,thesameirrespectiveofaneducationallevelincaseoftheMuslimMinorityenrolment(Table33)hasincreased but remained lower than their share(14.2 percent, 2011 Census) in the populationexceptatthePrimarylevelofeducation.In2016-17, share of theMuslimMinority enrolment atthePrimary levelwas 14.99 compared to 13.01attheUpperPrimary,10.82attheSecondaryand8.03 percent at the Higher Secondary level ofeducation.Overall,MuslimMinorityenrolmentis13.27percentofthetotalenrolmentintheGradesItoXII,whichisslightlylowerthantheirshareinthe population i.e. 14.2 percent. The corresponding shareoftheSCpopulationin2016-17was19.12percent against population share of 16.6 percent compared to 9.74 percent ST enrolment against 8.6 percent share in the population.
Rather than analyzing the share in enrolment, itis alsobetter to review theprogress in termsoftheabsoluteenrolmentwhichispresentedintheTable 34. Both the total ScheduledCastes andScheduledTribesenrolmentintheGradesItoXIIhasdeclinedduringtheperiod2012-13to2016-17but the same is not true for the Muslim Minority enrolment which has increased by 1.75 million(5.53 percent) over the year 2012-13. U-DISE2016-17 data reported a total of 33.31 millionMuslim Minority enrolment in the Grades I toXII.However,sameisnot trueforall thelevels
Figure 11

Map 6
(ALL INDIA: 10.82)
CHANDIGARH4.98
JAMMU & KASHMIR62.03
HIMACHAL PRADESH1.25
PUNJAB1.62
RAJASTHAN5.16
MADHYA PRADESH3.63 CHHATTISGARH
1.29
JHARKHAND12.03
WEST BENGAL28.91
BIHAR12.11
SIKKIM0.98
MEGHALAYA2.87
ASSAM25.60
NAGALAND2.13
ARUNACHAL PRADESH1.20
MANIPUR7.85
MIZORAM0.18TRIPURA
9.70
ODISHA1.78
MAHARASHTRA11.28
DAMAN & DIU8.61
GUJARAT6.68
DADRA & NAGAR HAVELI
2.97
A R A B I A N S E A
GOA10.83
B AY O F B E N G A L
KERALA32.95
KARNATAKA14.02
ANDHRA PRADESH6.90
TELANGANA13.45
PUDUCHERRY7.03
LAKSHADWEEP99.48
TAMIL NADU5.45
AND
AMAN
AND
NICO
BAR ISLAND
S
8.46
DELHI14.38
UTTARAKHAND7.84
UTTAR PRADESH7.66
HARYANA3.62
0.18 - 10.00
10.01 - 50.00
50.01 - 90.00
90.01 - 99.48
Note: Map not to scale Disclaimer: The boundaries and the names used in the maps are only a visual representation and do not determine the legal boundary position.
PERCENTAGE OF MUSLIM ENROLMENT:
SECONDARY LEVEL
INDIA
Percentage of Muslim Enrolment : Secondary Level
U-DISE 2016-17

Patterns of Decline in Enrolment: Analysis of U-DISE 2016-17 Data52
Table 31: Share of Scheduled Castes Enrolment to Total ADD Enrolment, 2012- 13 to 2016-17
Year Primary Upper Primary Secondary Higher Sec-ondary Total
2012-13 20.24 19.38 18.24 17.33 19.522013-14 19.88 19.41 18.42 17.38 -2014-15 19.93 19.55 18.67 17.59 -2015-16 19.88 19.49 18.68 17.33 -2016-17 19.64 19.13 18.58 17.29 19.12
Table 32: Share of Scheduled Tribes Enrolment to Total Enrolment, 2012-13 to 2016-17
Year Primary Upper Primary Secondary Higher Sec-ondary Total
2012-13 10.80 11.28 8.42 6.19 10.112013-14 11.09 9.73 8.58 6.25 -2014-15 10.83 9.76 8.49 6.45 -2015-16 10.64 9.81 8.49 6.77 -2016-17 10.57 9.93 8.44 6.79 9.74
Table 33: Percentage of Muslim Minority Enrolment to Total Enrolment: 2012-13 to 2016-17
Year Primary Upper Primary Secondary Higher Sec-ondary Total
2012-13 14.20 12.11 - - 12.412013-14 14.34 12.52 9.87 8.27 -2014-15 14.37 12.60 10.02 8.34 -2015-16 14.43 12.60 9.87 8.27 -2016-17 14.99 13.01 10.82 8.03 13.27
Note: Share of SC population to total population in 2011 was 14.2 percent.
Note: Share of ST population to total population in 2011 was 8.6 percent.
Note: Share of Muslim population to total population in 2011 was 14.23 percent.
of education as the same in case of enrolment at thePrimary levelof education isdeclinedbymore than585 thousand(3.06percent) in2016-17 but other levels of education experienced asignificantincreaseinenrolmentin2016-17overthe same in the year 2012-13 i.e. the first yearof unification of theDISE andSEMIS.MuslimMinorityenrolmentattheHigherSecondarylevelincreasedimpressivelyby37.70percentcomparedto 33.95 percent in the case of Secondary and 9.29 percent in case of the Upper Primary enrolment. AshasbeenobservedabovethatenrolmentatthePrimary levelofeducationhasdeclinedby5.31million(4.12percentover2015-16)ofwhichtheshareofSC,STandMuslimenrolmentcomesouttobe26.91,12.40and0.02percentrespectively.SC enrolment declined to 24.31 million at the Primary level in 2016-17 from25.74million inthe previous yearwhich is 26.91 percent of thetotal decline in the Primary enrolment i.e. 5.31
million which means that one in every fourthdecline in the enrolment is because of decline in the SC enrolment. During the same period i.e. 2015-16 to 2016-17, SC enrolment has alsodeclinedatallotherlevelsofschooleducationi.e.UpperPrimary,SecondaryandHigherSecondarylevels,whichisalsotruefortheScheduledTribesenrolment.However, theMuslim enrolment hasshownadeclineonly in thecaseof thePrimaryandHigherSecondarylevelsofeducation.During2015-16to2016-17,Muslimenrolmentincreasedby0.93and4.79percentrespectivelyattheUpperPrimaryandSecondarylevelofeducation.
CWSN Students As has already been indicated that together the Secondary and Higher Secondary levels ofeducation has a total enrolment of 63.22 million in2016-17ofwhich theshareof theSecondarylevel is 38.82 million (61.40 percent) and that
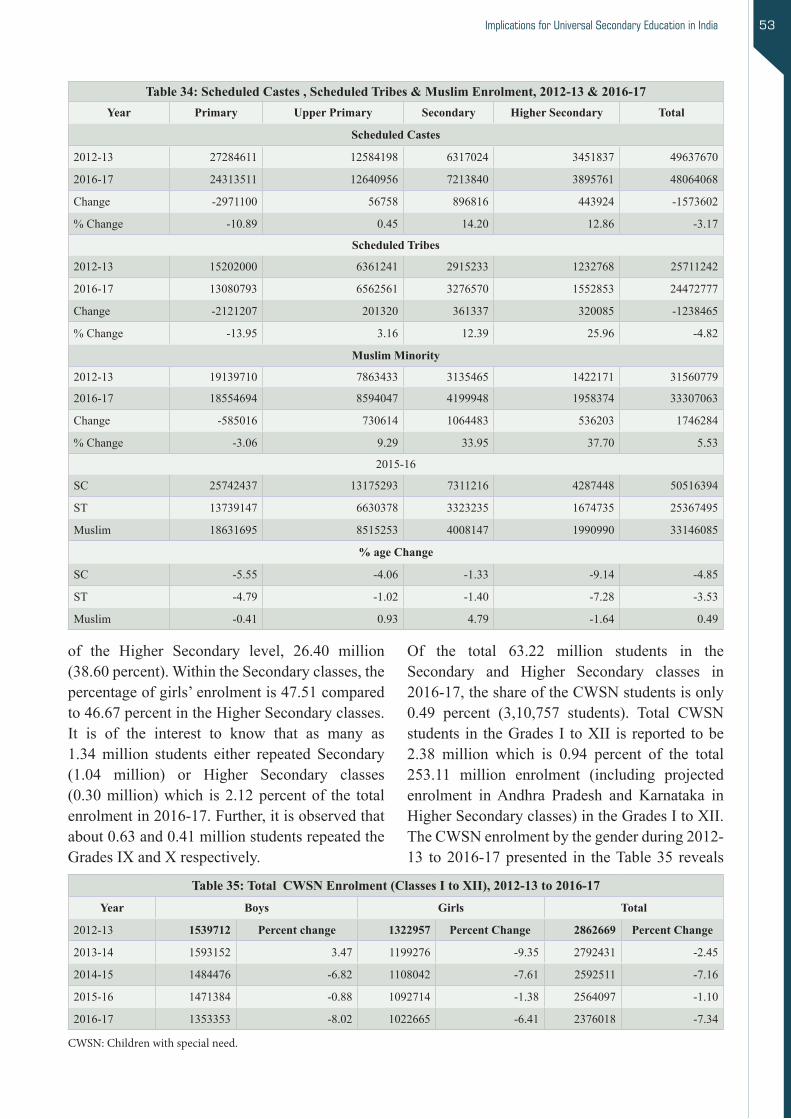
Implications for Universal Secondary Education in India 53
Table 34: Scheduled Castes , Scheduled Tribes & Muslim Enrolment, 2012-13 & 2016-17Year Primary Upper Primary Secondary Higher Secondary Total
Scheduled Castes
2012-13 27284611 12584198 6317024 3451837 49637670
2016-17 24313511 12640956 7213840 3895761 48064068
Change -2971100 56758 896816 443924 -1573602
% Change -10.89 0.45 14.20 12.86 -3.17
Scheduled Tribes
2012-13 15202000 6361241 2915233 1232768 25711242
2016-17 13080793 6562561 3276570 1552853 24472777
Change -2121207 201320 361337 320085 -1238465
% Change -13.95 3.16 12.39 25.96 -4.82
Muslim Minority
2012-13 19139710 7863433 3135465 1422171 31560779
2016-17 18554694 8594047 4199948 1958374 33307063
Change -585016 730614 1064483 536203 1746284
% Change -3.06 9.29 33.95 37.70 5.53
2015-16
SC 25742437 13175293 7311216 4287448 50516394
ST 13739147 6630378 3323235 1674735 25367495
Muslim 18631695 8515253 4008147 1990990 33146085
% age Change
SC -5.55 -4.06 -1.33 -9.14 -4.85
ST -4.79 -1.02 -1.40 -7.28 -3.53
Muslim -0.41 0.93 4.79 -1.64 0.49
Table 35: Total CWSN Enrolment (Classes I to XII), 2012-13 to 2016-17Year Boys Girls Total
2012-13 1539712 Percent change 1322957 Percent Change 2862669 Percent Change
2013-14 1593152 3.47 1199276 -9.35 2792431 -2.45
2014-15 1484476 -6.82 1108042 -7.61 2592511 -7.16
2015-16 1471384 -0.88 1092714 -1.38 2564097 -1.10
2016-17 1353353 -8.02 1022665 -6.41 2376018 -7.34
CWSN : Children with special need.
of the Higher Secondary level, 26.40 million(38.60percent).WithintheSecondaryclasses,thepercentageofgirls’enrolmentis47.51comparedto46.67percentintheHigherSecondaryclasses.It is of the interest to know that as many as1.34 million students either repeated Secondary (1.04 million) or Higher Secondary classes(0.30million)which is2.12percentof the totalenrolmentin2016-17.Further,itisobservedthatabout 0.63 and 0.41 million students repeated the GradesIXandXrespectively.
Of the total 63.22 million students in the Secondary and Higher Secondary classes in2016-17,theshareoftheCWSNstudentsisonly0.49 percent (3,10,757 students). Total CWSNstudents in theGrades I toXII is reported tobe2.38 million which is 0.94 percent of the total253.11 million enrolment (including projectedenrolment inAndhra Pradesh and Karnataka inHigherSecondaryclasses)intheGradesItoXII.TheCWSNenrolmentbythegenderduring2012-13 to2016-17presented in theTable35 reveals

Patterns of Decline in Enrolment: Analysis of U-DISE 2016-17 Data54
Table 36: Enrolment by Castes at Secondary & Higher Secondary Levels of Education: 2016-17
State/UT
Enrolment by Castes
Secondary Level Higher Secondary Level
% General
% S C
% ST
% OBC
% Muslim
% General
% SC
% ST
% OBC
% Muslim
A&NIslands 69.64 0.00 6.80 23.56 8.46 67.84 0.00 6.88 25.28 7.98
AndhraPradesh 25.63 19.11 5.11 50.15 6.90 23.81 19.98 5.04 51.18 N.R
ArunachalPradesh 23.21 1.05 74.16 1.59 1.20 19.51 0.98 77.84 1.67 1.18
Assam 43.52 9.91 17.18 29.39 25.60 43.32 8.71 17.73 30.24 19.30
Bihar 15.67 16.44 1.48 66.41 12.11 24.22 13.35 1.92 60.52 12.66
Chandigarh 82.83 13.93 0.20 3.05 4.98 83.74 12.99 0.36 2.90 2.87
Chhattisgarh 8.59 14.83 28.51 48.08 1.29 10.95 13.85 25.95 49.24 1.30
D&NHaveli 29.72 2.31 64.91 3.07 2.97 34.91 3.50 56.24 5.35 2.78
Daman&Diu 37.14 5.34 13.01 44.52 8.61 33.46 7.54 11.06 47.93 7.21
Delhi 81.44 12.96 0.37 5.23 14.38 79.25 12.58 0.52 7.65 11.24
Goa 70.67 2.27 11.46 15.59 10.83 67.25 2.23 12.47 18.04 7.39
Gujarat 30.47 7.80 14.61 47.12 6.68 39.04 7.56 12.65 40.75 5.17
Haryana 45.67 24.66 0.00 29.67 3.62 53.88 17.55 0.00 28.56 2.20
HimachalPradesh 51.37 27.61 6.04 14.98 1.25 52.84 24.66 6.09 16.41 0.88
J&K 71.31 9.46 10.91 8.32 62.03 78.21 7.43 7.73 6.64 62.02
Jharkhand 14.15 11.20 22.91 51.74 12.03 24.84 9.40 19.55 46.20 9.78
Karnataka 14.71 18.09 6.89 60.31 14.02 12.90 16.30 6.82 63.99 N.R
Kerala 23.86 9.25 1.68 65.21 32.95 28.36 10.25 1.47 59.92 23.88
Lakshadweep 0.64 0.00 98.95 0.40 99.48 0.42 0.04 99.12 0.42 99.79
Madhya Pradesh 17.74 17.38 18.17 46.71 3.63 24.97 14.90 12.96 47.17 3.40
Maharashtra 40.68 14.24 9.68 35.41 11.28 42.73 13.52 7.30 36.46 7.84
Manipur 25.53 4.79 38.53 31.14 7.85 34.56 5.20 34.93 25.31 6.67
Meghalaya 7.43 0.88 90.70 1.00 2.87 8.74 0.87 89.40 0.99 2.38
Mizoram 1.26 0.36 98.38 0.00 0.18 1.27 0.35 98.38 0.00 0.16
Nagaland 8.32 1.37 88.22 2.09 2.13 5.92 1.23 90.84 2.01 1.27
Odisha 15.59 19.45 21.48 43.49 1.78 39.75 15.38 18.79 26.08 0.85
Puducherry 8.59 19.28 0.23 71.90 7.03 9.35 18.01 0.17 72.47 5.87
Punjab 47.32 36.84 0.01 15.83 1.62 51.79 32.20 0.01 15.99 1.27
Rajasthan 18.58 18.91 13.72 48.79 5.16 21.77 16.49 12.34 49.40 3.92
Sikkim 17.56 6.60 35.13 40.70 0.98 16.92 5.23 36.91 40.94 1.08
Tamil Nadu 3.61 23.99 1.11 71.30 5.45 4.24 22.40 0.92 72.43 5.26
Telangana 20.97 17.27 10.00 51.76 13.45 28.87 18.01 11.60 41.52 1.99
Tripura 23.60 20.36 35.67 20.37 9.70 28.97 20.49 25.81 24.73 7.77
Uttar Pradesh 24.45 22.65 0.80 52.10 7.66 26.04 20.60 0.68 52.68 7.24
Uttarakhand 51.62 23.42 3.18 21.77 7.84 57.07 20.31 3.34 19.28 5.56
WestBengal 50.50 26.96 5.34 17.20 28.91 53.32 24.48 4.41 17.80 23.73
All States 27.26 18.58 8.44 45.72 10.82 31.82 17.29 6.79 44.10 8.03
Note : Muslim enrolment in Andhra Pradesh and Karnataka are actual and are not projected. NR : Data not fully reported.

Map 7
(ALL INDIA: 0.91)
CHANDIGARH0.77
JAMMU & KASHMIR0.85
HIMACHAL PRADESH0.88
PUNJAB0.78
RAJASTHAN0.74
MADHYA PRADESH0.86 CHHATTISGARH
1.03
JHARKHAND0.96
WEST BENGAL28.91
BIHAR0.97
SIKKIM1.13
MEGHALAYA1.14
ASSAM1.03
NAGALAND1.00
ARUNACHAL PRADESH0.97
MANIPUR0.96
MIZORAM1.02TRIPURA
0.96
ODISHA0.97
MAHARASHTRA0.84
DAMAN & DIU0.91
GUJARAT0.74
DADRA & NAGAR HAVELI
0.86
A R A B I A N S E A
GOA0.95
B AY O F B E N G A L
KERALA1.01
KARNATAKA0.95
ANDHRA PRADESH0.95
TELANGANA1.01
PUDUCHERRY1.01
LAKSHADWEEP1.14
TAMIL NADU1.04
AND
AMAN
AND
NICO
BAR ISLAND
S
0.97
DELHI0.91
UTTARAKHAND0.93
UTTAR PRADESH0.87
HARYANA0.79
0.74 - 0.80
0.81 - 0.90
0.91 - 0.95
0.96 - 1.15
Note: Map not to scale Disclaimer: The boundaries and the names used in the maps are only a visual representation and do not determine the legal boundary position.
RATIO OF GIRLS TO BOYS
ENROLMENT: TOTAL
INDIA
Ratio of Girls to Boys Enrolment :
Secondary & Higher Secondary
U-DISE 2016-17
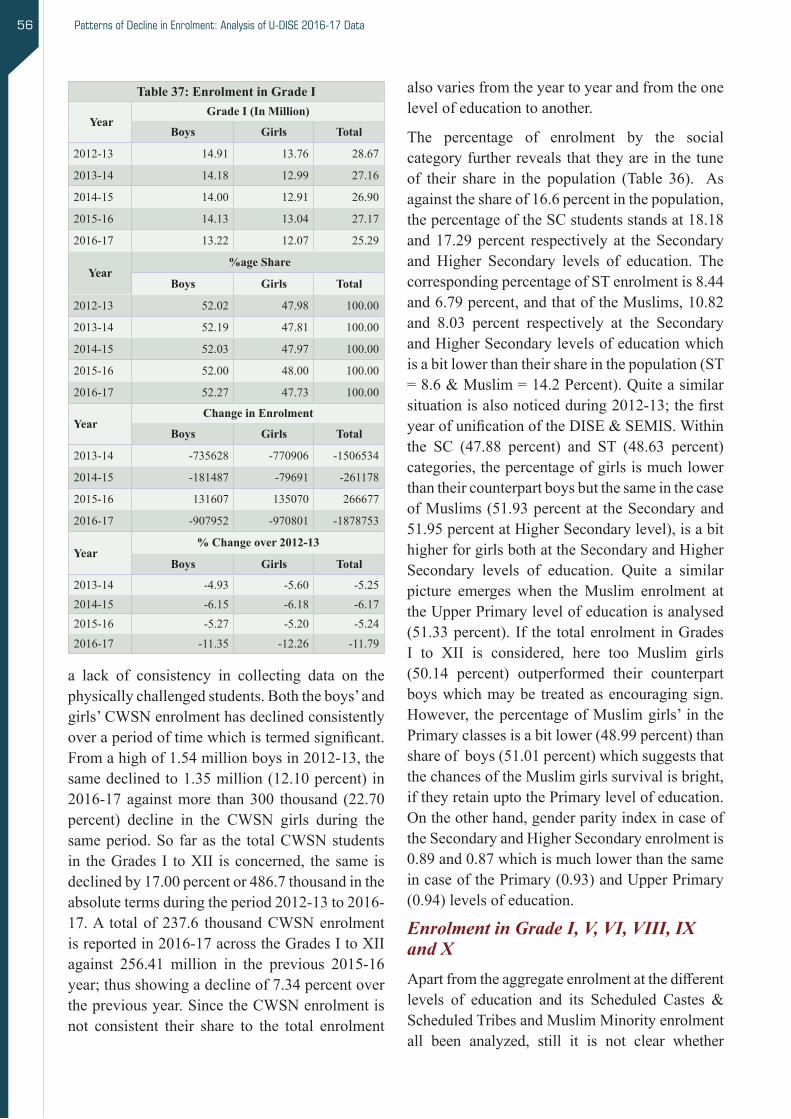
Patterns of Decline in Enrolment: Analysis of U-DISE 2016-17 Data56
Table 37: Enrolment in Grade I
YearGrade I (In Million)
Boys Girls Total
2012-13 14.91 13.76 28.67
2013-14 14.18 12.99 27.16
2014-15 14.00 12.91 26.90
2015-16 14.13 13.04 27.17
2016-17 13.22 12.07 25.29
Year %age Share
Boys Girls Total
2012-13 52.02 47.98 100.00
2013-14 52.19 47.81 100.00
2014-15 52.03 47.97 100.00
2015-16 52.00 48.00 100.00
2016-17 52.27 47.73 100.00
YearChange in Enrolment
Boys Girls Total
2013-14 -735628 -770906 -1506534
2014-15 -181487 -79691 -261178
2015-16 131607 135070 266677
2016-17 -907952 -970801 -1878753
Year% Change over 2012-13
Boys Girls Total
2013-14 -4.93 -5.60 -5.252014-15 -6.15 -6.18 -6.172015-16 -5.27 -5.20 -5.24
2016-17 -11.35 -12.26 -11.79
a lack of consistency in collecting data on thephysicallychallengedstudents.Boththeboys’andgirls’CWSNenrolmenthasdeclinedconsistentlyoveraperiodoftimewhichistermedsignificant.Fromahighof1.54millionboysin2012-13,thesamedeclinedto1.35million(12.10percent)in2016-17againstmore than300 thousand (22.70percent) decline in the CWSN girls during thesameperiod.Sofaras the totalCWSNstudentsin theGrades I toXII isconcerned, thesame isdeclined by 17.00 percent or 486.7 thousand in the absolutetermsduringtheperiod2012-13to2016-17.A totalof237.6 thousandCWSNenrolmentisreportedin2016-17acrosstheGradesItoXIIagainst 256.41 million in the previous 2015-16year;thusshowingadeclineof7.34percentoverthepreviousyear.SincetheCWSNenrolmentisnot consistent their share to the total enrolment
alsovariesfromtheyeartoyearandfromtheonelevelofeducationtoanother.
The percentage of enrolment by the social categoryfurtherrevealsthattheyareinthetuneof their share in the population (Table 36). Asagainsttheshareof16.6percentinthepopulation,the percentage of the SC students stands at 18.18 and17.29percent respectively at theSecondaryand Higher Secondary levels of education. Thecorresponding percentage of ST enrolment is 8.44 and6.79percent,andthatoftheMuslims,10.82and 8.03 percent respectively at the SecondaryandHigherSecondarylevelsofeducationwhichisabitlowerthantheirshareinthepopulation(ST=8.6&Muslim=14.2Percent).Quiteasimilarsituationisalsonoticedduring2012-13;thefirstyearofunificationoftheDISE&SEMIS.Withinthe SC (47.88 percent) and ST (48.63 percent)categories,thepercentageofgirlsismuchlowerthan their counterpart boys but the same in the case ofMuslims(51.93percentat theSecondaryand51.95percentatHigherSecondarylevel),isabithigherforgirlsbothattheSecondaryandHigherSecondary levels of education. Quite a similarpicture emerges when theMuslim enrolment attheUpperPrimarylevelofeducationisanalysed(51.33percent). If the totalenrolment inGradesI to XII is considered, here too Muslim girls(50.14 percent) outperformed their counterpartboyswhichmaybe treatedasencouragingsign.However, thepercentageofMuslimgirls’ in thePrimaryclassesisabitlower(48.99percent)thanshareofboys(51.01percent)whichsuggeststhatthechancesoftheMuslimgirlssurvivalisbright,iftheyretainuptothePrimarylevelofeducation.Ontheotherhand,genderparityindexincaseoftheSecondaryandHigherSecondaryenrolmentis0.89and0.87whichismuchlowerthanthesameincaseofthePrimary(0.93)andUpperPrimary(0.94)levelsofeducation.
Enrolment in Grade I, V, VI, VIII, IX and XApartfromtheaggregateenrolmentatthedifferentlevels of education and its Scheduled Castes &Scheduled Tribes and Muslim Minority enrolment all been analyzed, still it is not clear whether

Implications for Universal Secondary Education in India 57 Patterns of Decline in Enrolment: Analysis of U-DISE 2016-17 Data
69
Figure 12
2012-13, thesamehasgonedownto25.29millionintheyear2016-17;thusshowingadecline
of3.38millionintheabsoluteor11.79inthepercentageterm.Duringthesameperiod,both
theboys,aswellas,girl’s enrolment declined by1.69millionwhichis11.35 and 12.26 percent
in theGrade I enrolment in the previous year. The percentage of decline in case of girl’s
enrolmentinGradeIisabithigherthantheircounterpartboyswhichmayseverelyaffectnot
only theUpperprimaryenrolment togrowbutwould alsohaveserious implication for the
Secondaryenrolmenttogrowinyearsthatfollow.DeclineintheGradeIenrolmentin2013-
14 is expected to be reflected in theGradeV enrolment in the year 2017-18, GradeVIII
enrolment in 2020-21andGradeIXenrolment in 2021-22. Table 37 also presents the annual
changeinGradeIenrolmentduringtheperiod2012-13 to 2016-17whichrevealsthatexcept
during the years 2014-15 to 2015-16, both the boys & girls’ enrolment, as well as, total
enrolmentdeclinedwithsubsequent year.Itwasduring2015-16, theonlyyearduringwhich
girls’ enrolment in the GradeIincreasedandtouched13.04 million from 12.91million in the
previous year. During this year, increase in the girls’ enrolment is a bit higher than the increase
in the boysenrolment.OverallGradeIenrolmentin2015-16increasedby0.93percent(Boys,
0.88percent&Girls.0.98percent)overthepreviousyear.Bothonyeartoyearbasisandalso
over2012-13,thesteepest declineintheGradeIenrolmentisnoticedduringthecurrentyear,
i.e. 2016-17forwhichtheU-DISEdataisthelatestavailableinthepublicdomain.Itmaybe
recalled that thetotalenrolmentinthePrimaryClassesItoVhasalsoshownadeclinetothe
tune of 5.31 million in 2016-17ofwhichthecontributionofGradeIalonewas1.88million
(66.67percent).Ofthetotaldeclineof5.31millioninthePrimaryclassesin2016-17, boys’
contributionis2.63million(49.53percent)andthatofgirls,2.68million(50.47percent).Is
thedecline in theGrade Ienrolment in2016-17 is because of the demographic transaction
takingplaceintheCountry?OrisitbecauseoftheundercoverageoftheschoolsunderU-
28.67 27.16 26.90 27.17
25.29
23.00
24.00
25.00
26.00
27.00
28.00
29.00
2012-13 2013-14 2014-15 2015-16 2016-17
In M
illio
nEnrolment in Grade I: 2012-13 to 2016-17
Grade I
Patterns of Decline in Enrolment: Analysis of U-DISE 2016-17 Data
70
DISE 2016-17? Or 2016-17enrolment isnowmorerealistic than in thepreviousyear?Or
whether the over reporting, duplicate and fake enrolment has come down because of the
individualstudentdatacollectionon35parameters initiated during 2016-17 data collection
in-syncwiththeU-DISE.Thispaperwouldthereforetrytofindoutanswersofsomeofthese
issueswhichhavegotseriousimplicationsfor Indiatoachievethegoalofuniversalschool
education. In the absence oftheprojectedsingle-age ‘6’ and 6-11,11-14,15-16 and 16 to 18
years age-specificchildpopulation,itisnotpossibletoexaminetheimpactofthedemographic
transactionondeclineintheenrolmentatdifferentlevelsofeducationingeneralandtheGrade
Ienrolmentinparticular.Ontheotherhand,theU-DISE 2016-17datashowsthatthesameis
basedonmorenumberofschools(13,264schools)
Figure 13
(15,35,610schools)thaninthepreviousyear2015-16(15,22,346schools).Student-wisedata,
if available in thepublicdomainmaybeused to examinewhether there is any correlation
betweendeclineinenrolmentandstates thosewhohadrigorouslyinitiated the student data
collectionbutthesameisyettobemadeavailableinthepublicdomain.
The state-wise decline in theGrade I enrolment during the years 2015-16 and 2016-17 is
criticallyanalyzed(seeTable38)whichpresentstheinterestingpicture. Of the total decline in
GradeIenrolmentin2016-17(1.88million),98.34percentiscontributedby12statesofwhich
morethan62percentiscontributedalonebytwostatesnamelyBiharandUttarPradesh.The
totaldeclineinthesetwostatesisofthetuneof852.5thousandinBihar(45.38percent)and
319.7thousandinUttarPradesh(17.02percent).Onlyeightstateshaveshownaslightincrease
intheGradeIenrolmentwhichvariesfrom149inDaman&Diuto36,732inHaryana.Inthe
remaining six states,increaseintheGradeIenrolmentisobservedtobelessthan1600.Inthe
27.1
7
25.8
1
25.4
3
25.6
5
25.0
4
23.0
2
25.2
9
25.2
7
24.8
2
24.1
9
24.2
2
22.2
6
0
5
10
15
20
25
30
I II III IV V VI
Grade-wise Enrolment
In M
illio
n
Grade-wise Enrolment 2015-162016-17
the decline in the enrolment in the recent past isbecauseof thedeclineat theentry levelofaneducationallevel?Therefore,inadditiontodeclineinenrolmentatdifferentlevelsofeducation,trendsintheenrolmentat theentrylevel i.e.GradeI isfirstanalyzed inaddition to theenrolment in theGradesV,VIII and IXwhichhasgot significantrelevance for the Secondary enrolment to grow.The analysis may reveal level or grade whichhas contributed to decline in enrolment but shall not present reasons of steep decline in a grade or level in2016-17.First, theGrade I enrolment isanalysedseparatelyforBoysandGirlsduringtheperiod2012-13to2016-17whichispresentedinTable 37.
TheGradeIenrolmentisveryimportantthroughwhich a number of indicators can be computedwhichhavegotsignificantinfluenceonenrolmentatthePrimarylevelofeducationtogrowbutthesame both in the case of boys and girls during the
period2012-13to2016-17(barring2014-15 to 2015-16) has showna consistent decline. On the other hand,thepercentageofgirlsintheGradeIenrolmentremainsalmoststagnant at about 48 percent during the same period. From a high of 28.67 million enrolment in the Grade I in2012-13, the samehasgone down to 25.29 million inthe year 2016-17; thus showinga decline of 3.38 million in the
absolute or 11.79 in the percentage term. During thesameperiod,boththeboys,aswellas,girl’senrolmentdeclinedby1.69millionwhichis11.35and12.26percentoftheGradeIenrolmentinthepreviousyear.Thepercentageofdeclineincaseofgirl’senrolmentinGradeIisabithigherthantheircounterpartboyswhichmayseverelyaffectnot only the Upper primary enrolment to growbutwould also have serious implication for theSecondaryenrolmenttogrowinyearsthatfollow.Decline in theGrade I enrolment in 2013-14 isexpectedtobereflectedintheGradeVenrolmentin the year 2017-18, Grade VIII enrolment in2020-21 and Grade IX enrolment in 2021-22.Table37alsopresentstheannualchangeinGradeIenrolmentduringtheperiod2012-13to2016-17whichrevealsthatexceptduringtheyears2014-15to2015-16,boththeboys&girls’enrolment,aswellas,totalenrolmentdeclinedwithsubsequentyear.Itwasduring2015-16,theonlyyearduringwhich girls’ enrolment in theGrade I increasedand touched 13.04 million from 12.91 million in
Figure 12
Figure 13

Patterns of Decline in Enrolment: Analysis of U-DISE 2016-17 Data58
Table 38: Decline in Grade I Enrolment in Top 12 States*: 2015-16 to 2016-17
Year2015-16 2015-16 Percent Change
Boys Girls Total Boys Girls Total Boys Girls Total % to Total
Bihar 1726083 1666299 3392382 1295098 1244743 2539841 -430985 -421556 -852541 -45.38
Uttar Pradesh 2782874 2611362 5394236 2620749 2453762 5074511 -162125 -157600 -319725 -17.02
Rajasthan 1083706 949701 2033407 945376 821479 1766855 -138330 -128222 -266552 -14.19
Jharkhand 502645 474538 977183 449462 404799 854261 -53183 -69739 -122922 -6.54
WestBengal 867179 828335 1695514 825881 776625 1602506 -41298 -51710 -93008 -4.95
J&K 156602 143926 300528 129721 117204 246925 -26881 -26722 -53603 -2.85
Telangana 379604 347444 727048 360109 329224 689333 -19495 -18220 -37715 -2.01
Karnataka 587709 548958 1136667 581333 529655 1110988 -6376 -19303 -25679 -1.37
Assam 458271 440217 898488 445462 430459 875921 -12809 -9758 -22567 -1.20
Maharashtra 1089182 950710 2039892 1078414 940902 2019316 -10768 -9808 -20576 -1.10
Punjab 277323 232771 510094 266865 225339 492204 -10458 -7432 -17890 -0.95
Tamil Nadu 565301 534262 1099563 558334 526455 1084789 -6967 -7807 -14774 -0.79
thepreviousyear.Duringthisyear,increaseinthegirls’enrolmentisabithigherthantheincreaseintheboysenrolment.OverallGradeIenrolmentin2015-16increasedby0.93percent(Boys,0.88percent&Girls,0.98percent)over thepreviousyear.Bothonyeartoyearbasisandalsoover2012-13,thesteepestdeclineintheGradeIenrolmentisnoticedduringthecurrentyear,i.e.2016-17forwhich theU-DISEdata is the latestavailable inthe public domain. It may be recalled that the total enrolmentinthePrimaryClassesItoVhasalsoshownadeclinetothetuneof5.31millionin2016-17ofwhichthecontributionofGradeIalonewas1.88million(66.67percent).Ofthetotaldeclineof5.31millioninthePrimaryclassesin2016-17,boys’contributionis2.63million(49.53percent)andthatofgirls,2.68million(50.47percent).Isthe decline in Grade I enrolment in 2016-17 isbecause of the demographic transaction takingplace in the Country? or is it because of the under coverageoftheschoolsunderU-DISE2016-17?or2016-17enrolmentisnowmorerealisticthaninthepreviousyear?orwhethertheoverreporting,duplicate and fake enrolment has come downbecauseof the individualstudentdatacollectionon 35 parameters initiated during 2016-17 in-syncwiththeU-DISE.Thispaperwouldthereforetry to find out answers of some of these issueswhichhavegotserious implicationsfor India toachieve the goal of universal school education.Intheabsenceoftheprojectedsingle-age‘6’and6-11,11-14,15-16and16to18yearsage-specific
childpopulation,itisnotpossibletoexaminetheimpact of the demographic transaction on decline intheenrolmentatdifferentlevelsofeducationingeneral and theGrade I enrolment inparticular.On the other hand, the U-DISE 2016-17 datashowsthatthesameisbasedonmorenumberofschools(13,264schools)(15,35,610schools)thaninthepreviousyear2015-16(15,22,346schoolsin 2016-17). Student-wise data, if availablein the public domain may be used to examine whetherthereisanycorrelationbetweendeclineinenrolmentandstatesthosewhohadrigorouslyinitiated the student data collection but the same isyettobemadeavailableinthepublicdomain.
The state-wisedecline in theGrade I enrolmentduringtheyears2015-16and2016-17iscriticallyanalyzed (see Table 38) which presents theinterestingpicture.Of the totaldecline inGradeI enrolment in 2016-17 (1.88 million), 98.34percentiscontributedby12statesofwhichmorethan62percentiscontributedalonebytwostatesnamelyBiharandUttarPradesh.Thetotaldeclineinthesetwostatesisofthetuneof852.5thousandin Bihar (45.38 percent) and 319.7 thousand inUttar Pradesh (17.02 percent).Only eight stateshave shown a slight increase in the Grade Ienrolmentwhichvariesfrom149inDaman&Diuto36,732inHaryana.Intheremainingsixstates,increaseintheGradeIenrolmentisobservedtobelessthan1600.Intheotherwords,onecansaythat more than 80 percent of the total decline in GradeIenrolmentiscontributedbyBihar,Uttar

Implications for Universal Secondary Education in India 59
Table 39: Enrolment in Grade V
YearGrade V (In Million)
Boys Girls Total
2012-13 13.00 12.26 25.26
2013-14 13.09 12.30 25.38
2014-15 13.14 12.31 25.45
2015-16 12.95 12.09 25.05
2016-17 12.53 11.69 24.22
Year % age Share
Boys Girls Total
2012-13 52.02 47.98 100.00
2013-14 52.19 47.81 100.00
2014-15 52.03 47.97 100.00
2015-16 52.00 48.00 100.00
2016-17 52.27 47.73 100.00
YearChange in Enrolment
Boys Girls Total
2012-13 - - -
2013-14 84199 34555 118754
2014-15 51347 18258 69605
2015-16 -183994 -220726 -404720
2016-17 -424281 -398927 -823208
Year% Change over 2012-13
Boys Girls Total
2013-14 0.65 0.26 0.47
2014-15 1.04 0.43 0.75
2015-16 -0.37 -1.37 -0.86
2016-17 -3.64 -4.62 -4.11
togrowinyearsthatfollow.Thebalanceof2.61million decline in the Primary enrolment may be attributedtothedropoutswhohaveleftthesystembefore completing a particular grade.
An attempt has also been made to examine the state-wise share of the total decline inGradeVenrolment during the period 2015-16 to 2016-17and thesame ispresented inTable40whichreveals that asmany as 29 states have reportedadecline in theGradeVenrolment in2016-17.Ontheotherhand,sevenstatesincludingAssam,MadhyaPradesh,HaryanaandKarnatakareportedincrease in the Grade V enrolment amongstwhich Karnataka reported an increase of 34.4thousand (3.36 percent) and Madhya Pradesh,21.6 thousand (1.37 percent). Puducherry (320
Pradesh, Rajasthan and Jharkhand; all ofwhicharetheimportantstatesforachievingthegoalofUniversalPrimaryandElementaryeducation.
Grade V EnrolmentTo further examine the decline in enrolment at the Primary level (Grades I toV) of education,in addition to the Grade I enrolment presentedabove,GradeVenrolmenthasalsobeencriticallyanalysed during the period 2012-13 to 2016-17(Table39)whichalsoshowsadeclinein theboys’,girls’andtotalenrolmentinGradeV.Froma high of 25.26million enrolment in theGradeV in 2012-13, the same has declined to 24.22million in the year 2016-17; thus showing adecline of 1.04million (4.11 percent).GradeVenrolmentintheyear2016-17,isobservedtobethelowestduringtheentireperiodfrom2012-13to2016-17.Further,ithasbeenobservedthatboththeboys,aswellasgirlsenrolmenthasdeclinedduring the same period: 472.7 thousand (3.64percent) boys and 566.8 thousand girls (4.62percent)allwhichhasgotseriousimplicationsfortheUpperPrimaryenrolmenttogrow.Duringthesameperiod,thepercentshareofgirls’inGradeVenrolmentremainedstagnantaround48percentwhichisquitesimilartothesameintheGradeI.Between the years 2013-14 to 2015-16, a slightincreaseintheGradeVenrolmentisobservedbutthe same couldn’t maintain the momentum anddeclinedintheyear2016-17.During2015-16to2016-17alone,theGradeVenrolmentisdeclinedby424.3thousandincaseofboys’comparedtoadeclineof398.9thousandincaseofgirls’.
Itmaybe recalled that enrolment in theGradesI toV is declined by 5.31million ofwhich theGrade Icontributed1.88millionwhich is35.40percent of the total decline in theGrade I toVenrolment. Both the Grades I and V enrolmenttogetherhavecontributeda totalof2.70million(50.85percent) to the totaldecline in theGradeItoVenrolmentin2016-17.Itmeansthatmorethan50percentoftotaldeclineintheGradesItoVenrolmentisduetodeclineintheGradeIandGradeVenrolment alonewhichhasgot seriousimplications not only for the Primary enrolment togrowbutalsofortheUpperPrimaryenrolment

Patterns of Decline in Enrolment: Analysis of U-DISE 2016-17 Data60 Patterns of Decline in Enrolment: Analysis of U-DISE 2016-17 Data
73
Figure 14
Anattempthasalsobeenmadetoexaminethestate-wiseshareofthetotaldeclineinGradeV
enrolment during the period 2015-16 to 2016-17 and the same is presented in Table 40 which
revealsthatasmanyas29stateshavereportedadeclineintheGradeVenrolmentin2016-17.
Ontheotherhand,sevenstates includingAssam,MadhyaPradesh,HaryanaandKarnataka
reportedincreaseintheGradeVenrolmentamongstwhichKarnatakareported an increase of
34.4thousand(3.36percent)andMadhyaPradesh,21.6thousand(1.37percent).Puducherry
(320students,3.52percent)andDamanandDiu(219students,6.21percent)alsoreporteda
smallincreaseintheGradeVenrolment.ThoughsmallUnionTerritory,Dadra&NagarHaveli
reportedahighdeclineofabout49percentintheGradeVenrolmentbutintheabsoluteterm
itisdeclinedonlyby3,835students.Nagaland(16.63percent)andArunachalPradesh(14.122
percent)tooreportedabove15percentdeclineintheGradeVenrolment.Inafewbigstates,
suchasJharkhand(14percent),Gujarat(7.37percent),Bihar(6.84percent),Telangana(4.67
percent),WestBengal(4.56percent),Rajasthan(4.27percent)and Odisha (3.53percent)steep
declineintheGradeVenrolmenthasbeenobservedintheyear2016-17whichshallinfluence
both the Primary, aswellas, UpperPrimaryenrolmenttogrowinyearsthatfollow.Declinein
afewofthesestates,inabsolutetermisveryhigh.SomeofthesestatesareJharkhand(118.9
thousand),Gujarat(90.6thousand),Bihar(214.6thousand),Rajasthan(64.6thousand),Odisha
(29.6 thousand) and West Bengal (74.7 thousand). Steep decline in the Grades I and V
enrolment shall adversely affect enrolment based indicators in these and most of the other
states.
Table 40: Decline in Grade V Enrolment in Top 12 States*: 2015-16 to 2016-17
State 2015-16 2016-17 Change
Boys Girls Total Boys Girls Total Boys Girls Total % to Total Decline
Bihar 1580765 1557235 3138000 1470569 1452790 2923359 -110196 -104445 -214641 -26.07
Jharkhand 431012 418836 849848 374157 356710 730867 -56855 -62126 -118981 -14.45
25.26 25.38 25.4525.05
24.22
23.50
24.00
24.50
25.00
25.50
26.00
2012-13 2013-14 2014-15 2015-16 2016-17
In M
illio
nEnrolment in Grade V: 2012-13 to 2016-17
Grade V
states,inabsolutetermisveryhigh.Some of these states are Jharkhand(118.9 thousand), Gujarat (90.6thousand), Bihar (214.6 thousand),Rajasthan (64.6 thousand), Odisha(29.6 thousand) and West Bengal(74.7 thousand). Steep decline intheGrades I andVenrolment shalladversely affect enrolment basedindicators in these and most of the other states.
Thestate-wisedeclineintheGradeVenrolmentduring 2015-16 to 2016-17 in a select statespresentedintheTable40revealsthat9outof12statesarethesamewhichtoohadexperiencedasteepdeclineintheGradeIenrolment(seeTable38).OfthetotaldeclineintheGradeVenrolment(0.83 million), Bihar alone contributed a littleover26percent(0.215million)andUttarPradesh,0.110 million (13.41 percent). Contribution ofBihar, Jharkhand (0.119million, 14.45 percent)and Utter Pradesh is of the tune of 53.93 percent (0.444 million) to the total decline in Grade Venrolmentin2016-17.OthermajorcontributorstothetotaldeclineinGradeVenrolmentareGujarat(11.00 percent), West Bengal (9.07 percent),Rajasthan(7.84percent)etc.IfdeclineinGradeIandGradeVenrolment isconsideredtogether,Bihar contributed 1.07 million (20.01 percent)to the total 5.31 million decline in enrolment at thePrimary levelwhich is74percentof the
students,3.52percent)andDamanandDiu(219students, 6.21 percent) also reported a smallincrease in the Grade V enrolment. Thoughsmall Union Territory, Dadra & Nagar Havelireported a high decline of about 49 percent in theGradeVenrolment but in the absolute termit is declined only by 3,835 students. Nagaland(16.63 percent) and Arunachal Pradesh (14.12percent)tooreportedabove15percentdeclineinGradeVenrolment. Ina fewbigstates, suchasJharkhand (14 percent), Gujarat (7.37 percent),Bihar (6.84 percent), Telangana (4.67 percent),West Bengal (4.56 percent), Rajasthan (4.27percent)andOdisha(3.53percent)steepdeclinein theGradeV enrolment has been observed intheyear2016-17which shall influenceboth thePrimary,aswellas,UpperPrimaryenrolmenttogrowinyearsthatfollow.Declineinafewofthese
Table 40: Decline in Grade V Enrolment in Top 12 States*: 2015-16 to 2016-17
Year2015-16 2015-16 Change
Boys Girls Total Boys Girls Total Boys Girls Total % to Total
Bihar 1580765 1557235 3138000 1470569 1452790 2923359 -110196 -104445 -214641 -26.07
Jharkhand 431012 418836 849848 374157 356710 730867 -56855 -62126 -118981 -14.45
Uttar Pradesh 2350507 2272133 4622640 2299859 2212416 4512275 -50648 -59717 -110365 -13.41
Gujarat 659603 568864 1228467 603484 534405 1137889 -56119 -34459 -90578 -11.00
WestBengal 815265 823264 1638529 780616 783207 1563823 -34649 -40057 -74706 -9.07
Rajasthan 815334 696821 1512155 780519 667062 1447581 -34815 -29759 -64574 -7.84
Chhattisgarh 294366 283483 577849 278964 267360 546324 -15402 -16123 -31525 -3.83
Odisha 435458 405124 840582 421026 389913 810939 -14432 -15211 -29643 -3.60
Telangana 320625 302320 622945 306936 286932 593868 -13689 -15388 -29077 -3.53
Tamil Nadu 603349 575471 1178820 593502 559651 1153153 -9847 -15820 -25667 -3.12
Maharashtra 1055331 933716 1989047 1044267 926890 1971157 -11064 -6826 -17890 -2.17
Punjab 275450 225372 500822 264464 220337 484801 -10986 -5035 -16021 -1.95
* : Percentage to total decline
Figure 14

Implications for Universal Secondary Education in India 61
andUniversalPrimaryEducationinparticular.Itmay be recalled that most of the states in India and these three states in particular had initiated enrolment drives in the recent past because ofwhichenrolmentincreasedtoasignificantaffectbut the momentum cannot be sustained and the samestarteddecliningwiththespeedhigherthanthe increase in enrolment. Why enrolment hasstarteddeclining?isitmorerealisticnowthaninthepast?istheenrolmentnowisfreefromoverreporting, fake and duplicate enrolment? hasstudentdatacollectionstartedin2016-17resultedinto the decline in enrolment? Answers to allsuchquestionscannotbeansweredalonebyjustexamining the trends in enrolment or patterns of declineinenrolmentforwhichadetailedin-depthanalysisfollowedbythefieldtripstoschoolsandinteractionwiththerespondentsandallthosewhoareinvolvedintheprocessofdatacollectionandmanagementisrequired.
Analysispresentedabovewithregardtothetrendsin enrolment at the Primary level and decline
in enrolment in GradesI and V has seriousimplications for the Upper Primary enrolment to grow for which it isequally important tocritically analyse the Transition Rate from the Primary to Upper Primary levelofeducationbeforethatwetakealookattheindividual Grade VIIIenrolmentwhich has gotsignificant relevance for
totaldecline(1.44million)inenrolmentinBiharat the Primary level. One of the other majorcontributors to decline in enrolment is the state of UttarPradeshwhichhascontributed0.43million(8.09percent,GradesI&Vtogether)tothetotaldeclineinPrimaryenrolment(5.31million)whichis 31.38 percent of the total decline in enrolment atthePrimarylevelofeducationinUttarPradesh.Bihar, Uttar Pradesh and Jharkhand togethercontributed a total of 1.74 million to the total decline in theGrades I andV enrolmentwhichcomes out to be 32.72 percent of the total decline inPrimaryenrolment (5.31million) in2016-17.It may be recalled that these three states havecontributed 3.32 million (62.52 percent) to thetotal 5.31 million decline in the Primary enrolment which means that 6 out of every 10 studentsdeclineiscontributedalonebyBihar,Jharkhandand Uttar Pradesh and the contribution is of the tune of 1.99 million (37.48 percent). Largelybecauseofthesestates,Indiacannotyetaffordtoachieve the goal of school education in general
Table 41: Internal Efficiency of Primary Education System: Cohort 2015-16*Indicator Grade I Grade II Grade III Grade IV Grade V Grade VI
Cohort Dropout Rate - 6.70 3.56 4.36 4.75 - Years Input per
GraduateCohort Survival Rate 100.00 93.30 89.74 85.39 80.63 71.73Pupil-years Invested 1008 938 902 858 810 Input/Output RatioCoefficient of Efficiency 79.42 0.79 6.30Total Input Years Wasted 929 % to Total Wastage
Average Duration of Stay
Graduates 5.03
Years Wasted on Account of
Repeaters 20 2.12 Drop-outs 3.22
Drop-outs 910 98.88 Cohort 2.91
*: Computed based on a set of assumptions and grade-specific enrolment in 2015-16 & 2016-17 and number of repeaters in 2016-17
Patterns of Decline in Enrolment: Analysis of U-DISE 2016-17 Data
80
Figure 15
Further, it has been observed that transition rate in case of girls’ in many states is a bit higher
than their counterpart boys. 25 out of the 26 States/UTs have reported above 90 percent
transition rate from the Primary to Upper Primarylevelofeducation (Table43).Fewstates,
suchasChandigarh,KeralaandPuducherryreportedabovehundredtransitionratewhichmay
bebecauseoftheinconsistentenrolmentdata. ItmayberecalledthatBihar,Jharkhandand
Uttar Pradesh reported a steep decline in Primary enrolment in 2016-17allwhichalsohavea
lowtransitionratein2015-16.Biharhasthelowesttransitionrateof76.12percentfollowed
by Jharkhand (76.28 percent) andUttar Pradesh (77.89 percent). These are the only states
whichhavereportedbelow80percenttransitionratewhichmayhaveseriousimplicationfor
achievingthegoalofUEE.
Figure 16
0.00
20.00
40.00
60.00
80.00
100.00
120.00
2015-16 2014-15 2013-14 2012-13 2011-12
88.5
6
90.1
4
87.4
0
89.5
8
87.0
6
90.3
2
90.6
2
89.1
0
91.9
5
92.6
5
61.7
3
69.0
4
65.7
4
68.9
1
Transition Rate: 2011-12 to 2015-16
Primary to Upper Primary Upper Primary to Secondary Secondary to Higher Secondary
0
20
40
60
80
100
120
2015-16 2014-15 2013-14 2012-13 2011-12
88.5
6
91.1
4
87.4
0
59.5
8
87.0
6
Transition Rate at Primary to Upper Primary Level: 2011-12to 2015-16
Figure 15

Patterns of Decline in Enrolment: Analysis of U-DISE 2016-17 Data62
Table 42: Transition Rate at Different Levels of School Education, 2011-12 to 2015-16
YearPrimary to Upper Primary Level Upper Primary to Secondary Level Secondary to Higher Secondary Level
Boys Girls Total Boys Girls Total Boys Girls Total2015-16 88.41 88.72 88.56 92.62 87.91 90.32 61.89 61.55 61.732014-15 89.83 90.48 90.14 92.48 88.66 90.62 68.67 59.46 69.042013-14 87.18 87.62 87.40 91.33 86.75 89.10 65.75 65.74 65.742012-13 89.41 89.76 89.58 94.10 89.68 91.95 68.57 69.30 68.912011-12 86.64 7.50 87.06 94.93 90.22 92.65 - - -
Retention Rate at Primary Level, 2016-172016-17 86.90 87.93 87.40 - - - - - -2015-16 88.66 84.81 84.21 70.02 71.13 70.70 57.90 56.45 57.202014-15 83.30 84.21 83.74 66.68 68.14 67.38 57.90 56.45 57.20
Patterns of Decline in Enrolment: Analysis of U-DISE 2016-17 Data
80
Figure 15
Further, it has been observed that transition rate in case of girls’ in many states is a bit higher
than their counterpart boys. 25 out of the 26 States/UTs have reported above 90 percent
transition rate from the Primary to Upper Primarylevelofeducation (Table43).Fewstates,
suchasChandigarh,KeralaandPuducherryreportedabovehundredtransitionratewhichmay
bebecauseoftheinconsistentenrolmentdata. ItmayberecalledthatBihar,Jharkhandand
Uttar Pradesh reported a steep decline in Primary enrolment in 2016-17allwhichalsohavea
lowtransitionratein2015-16.Biharhasthelowesttransitionrateof76.12percentfollowed
by Jharkhand (76.28 percent) andUttar Pradesh (77.89 percent). These are the only states
whichhavereportedbelow80percenttransitionratewhichmayhaveseriousimplicationfor
achievingthegoalofUEE.
Figure 16
0.00
20.00
40.00
60.00
80.00
100.00
120.00
2015-16 2014-15 2013-14 2012-13 2011-12
88.5
6
90.1
4
87.4
0
89.5
8
87.0
6
90.3
2
90.6
2
89.1
0
91.9
5
92.6
5
61.7
3
69.0
4
65.7
4
68.9
1
Transition Rate: 2011-12 to 2015-16
Primary to Upper Primary Upper Primary to Secondary Secondary to Higher Secondary
0
20
40
60
80
100
120
2015-16 2014-15 2013-14 2012-13 2011-12
88.5
6
91.1
4
87.4
0
59.5
8
87.0
6
Transition Rate at Primary to Upper Primary Level: 2011-12to 2015-16
theSecondaryenrolmenttogrow.
Flow Rates & Indicators of Internal Efficiency: Primary LevelBeforetheGradeVIIIenrolmentoveraperiodoftimeisanalyzed,firstthegrade-specificenrolmentin the Grades I to V during the years 2015-16and2016-17alongwiththenumberofrepeatersin2016-17hasbeenanalysedwhichareusedtocalculate the flow rates (promotion, repetitionand dropout rates) along with a set of internalefficiencyofeducationsystemrelated indicators(seeTable41)whicharebasedonasetof threeassumptions(i)exitinggrade-to-gradepromotion,repetition and dropout rates remain constant throughouttheevolutionofcohort(untilthelastchildremaininthesystem);(ii)nostudentwillbeallowed to enter into the system in between theevolution of cohort as the prime objective is tomonitor the movement of a hypothetical groupof 1,000 students thosewhohaveenteredintothesystem together through theGradeI;and(iii)afterrepeating a grade for three times,astudentwilleitherbe promoted to the next grade or compulsorily be dropped out from the system;howeverastudentcan repeat another grade.
It may be recalled that of the total 5.53 million decline in enrolment at the Primary level of
education,GradesIandVcontributed2.70million(50.85percent).Ontheotherhand,GradesII,IIIandIVcontributed10.23,11.58and27.35percentrespectively to the total decline in enrolment. Itmayalsobeobservedthatdespitethenodetentionpolicyintheplace,asmanyas7,01,221students(0.54 percent of the total enrolment in previousyear) repeated Primary grades. Grade I hasthe highest repeaters which is 32.40 percent ofthe total repeaters followed by Grade II (19.12percent), Grade III (16.82 percent), Grade V(15.93 percent) and Grade IV (15.73 percent).Grade-wise enrolment during the years 2015-16 and 2016-17 further reveals that in none ofthe previous grades, all students in a grade arepromoted to thenexthighergradewhichmeansthat enrolment in Grade II in the year 2016-17islowerthantheenrolmentintheGradeIinthepreviousyearwhichistrueforalltheremaininggradesatPrimarylevel.
Figure 16
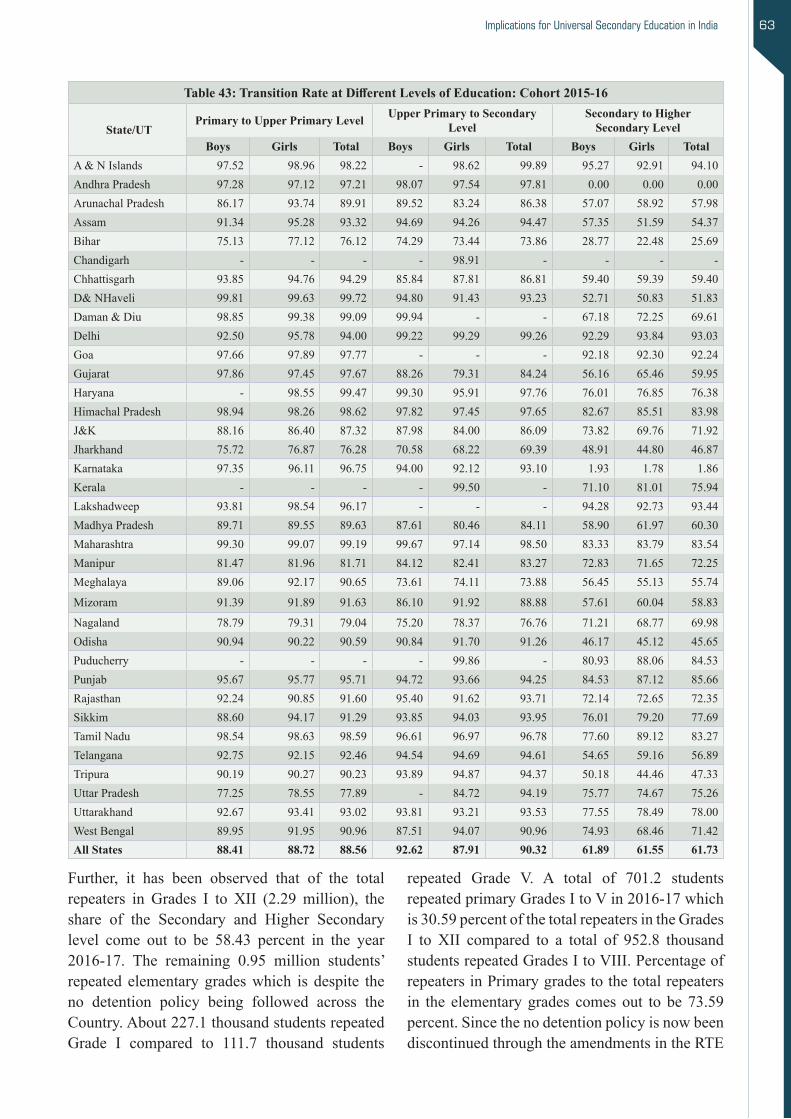
Implications for Universal Secondary Education in India 63
repeated Grade V. A total of 701.2 studentsrepeatedprimaryGradesItoVin2016-17whichis30.59percentofthetotalrepeatersintheGradesI to XII compared to a total of 952.8 thousandstudentsrepeatedGradesItoVIII.Percentageofrepeaters in Primary grades to the total repeaters in the elementary grades comes out to be 73.59 percent.Sincethenodetentionpolicyisnowbeendiscontinued through the amendments in the RTE
Further, it has been observed that of the totalrepeaters in Grades I to XII (2.29million), theshare of the Secondary and Higher Secondarylevel come out to be 58.43 percent in the year2016-17. The remaining 0.95 million students’repeated elementarygradeswhich is despite theno detention policy being followed across theCountry.About227.1thousandstudentsrepeatedGrade I compared to 111.7 thousand students
Table 43: Transition Rate at Different Levels of Education: Cohort 2015-16
State/UTPrimary to Upper Primary Level Upper Primary to Secondary
LevelSecondary to Higher
Secondary LevelBoys Girls Total Boys Girls Total Boys Girls Total
A&NIslands 97.52 98.96 98.22 - 98.62 99.89 95.27 92.91 94.10AndhraPradesh 97.28 97.12 97.21 98.07 97.54 97.81 0.00 0.00 0.00ArunachalPradesh 86.17 93.74 89.91 89.52 83.24 86.38 57.07 58.92 57.98Assam 91.34 95.28 93.32 94.69 94.26 94.47 57.35 51.59 54.37Bihar 75.13 77.12 76.12 74.29 73.44 73.86 28.77 22.48 25.69Chandigarh - - - - 98.91 - - - -Chhattisgarh 93.85 94.76 94.29 85.84 87.81 86.81 59.40 59.39 59.40D&NHaveli 99.81 99.63 99.72 94.80 91.43 93.23 52.71 50.83 51.83Daman&Diu 98.85 99.38 99.09 99.94 - - 67.18 72.25 69.61Delhi 92.50 95.78 94.00 99.22 99.29 99.26 92.29 93.84 93.03Goa 97.66 97.89 97.77 - - - 92.18 92.30 92.24Gujarat 97.86 97.45 97.67 88.26 79.31 84.24 56.16 65.46 59.95Haryana - 98.55 99.47 99.30 95.91 97.76 76.01 76.85 76.38HimachalPradesh 98.94 98.26 98.62 97.82 97.45 97.65 82.67 85.51 83.98J&K 88.16 86.40 87.32 87.98 84.00 86.09 73.82 69.76 71.92Jharkhand 75.72 76.87 76.28 70.58 68.22 69.39 48.91 44.80 46.87Karnataka 97.35 96.11 96.75 94.00 92.12 93.10 1.93 1.78 1.86Kerala - - - - 99.50 - 71.10 81.01 75.94Lakshadweep 93.81 98.54 96.17 - - - 94.28 92.73 93.44Madhya Pradesh 89.71 89.55 89.63 87.61 80.46 84.11 58.90 61.97 60.30Maharashtra 99.30 99.07 99.19 99.67 97.14 98.50 83.33 83.79 83.54Manipur 81.47 81.96 81.71 84.12 82.41 83.27 72.83 71.65 72.25Meghalaya 89.06 92.17 90.65 73.61 74.11 73.88 56.45 55.13 55.74
Mizoram 91.39 91.89 91.63 86.10 91.92 88.88 57.61 60.04 58.83
Nagaland 78.79 79.31 79.04 75.20 78.37 76.76 71.21 68.77 69.98Odisha 90.94 90.22 90.59 90.84 91.70 91.26 46.17 45.12 45.65Puducherry - - - - 99.86 - 80.93 88.06 84.53Punjab 95.67 95.77 95.71 94.72 93.66 94.25 84.53 87.12 85.66Rajasthan 92.24 90.85 91.60 95.40 91.62 93.71 72.14 72.65 72.35Sikkim 88.60 94.17 91.29 93.85 94.03 93.95 76.01 79.20 77.69Tamil Nadu 98.54 98.63 98.59 96.61 96.97 96.78 77.60 89.12 83.27Telangana 92.75 92.15 92.46 94.54 94.69 94.61 54.65 59.16 56.89Tripura 90.19 90.27 90.23 93.89 94.87 94.37 50.18 44.46 47.33Uttar Pradesh 77.25 78.55 77.89 - 84.72 94.19 75.77 74.67 75.26Uttarakhand 92.67 93.41 93.02 93.81 93.21 93.53 77.55 78.49 78.00WestBengal 89.95 91.95 90.96 87.51 94.07 90.96 74.93 68.46 71.42All States 88.41 88.72 88.56 92.62 87.91 90.32 61.89 61.55 61.73

Patterns of Decline in Enrolment: Analysis of U-DISE 2016-17 Data64
Table 44: Enrolment Grade VI, 2012-13 to 2016-17
YearGrade VI (In Million)
Boys Girls Total
2012-13 11540616 10966071 22506687
2013-14 11724311 11099532 22823843
2014-15 11773301 11118348 22891649
2015-16 11848108 11181081 23029189
2016-17 11499785 10769000 22268785
Year %age Share
Boys Girls Total
2012-13 51.28 48.72 100.00
2013-14 51.37 48.63 100.00
2014-15 51.43 48.57 100.00
2015-16 51.45 48.55 100.00
2016-17 51.64 48.36 100.00
YearChange in Enrolment
Boys Girls Total
2012-13 - - -
2013-14 183695 133461 317156
2014-15 48990 18816 67806
2015-16 74807 62733 137540
2016-17 -348323 -412081 -760404
Year% Change over 2012-13
Boys Girls Total
2013-14 1.59 1.22 1.41
2014-15 2.02 1.39 1.71
2015-16 2.66 1.96 2.32
2016-17 -0.35 -1.80 -1.06
Act,itisexpectedthatthenumberofrepeatersinthe elementarygradeswill increase in theyearsthatfollow.
One of the important reasons of the decline in Primary enrolment (5.53 million) is highincidenceofdropoutsacrossthePrimarygrades,As many as 8.20 million students dropped outfromthePrimarygradeswhichis6.35percentofthe totalPrimaryenrolment in thepreviousyeari.e.2015-16.Averagepromotionrateindicatethat93 percent of the total students are promoted to the nexthighergrade; restof the7percent studentshaveeitherrepeatedaparticulargradeordroppedout from the system before the completion of a grade. The number of dropouts across the Primary gradesisobservedtobehighanditis2.75millionin the Grade V which is 33.59 percent of thetotal dropped out students. One out of the three studentsthosewhohavedroppedout,droppedoutintheGradeVwhichhasgotsevereimplicationsfortheUpperPrimaryenrolmenttogrow.Ontheotherhand,about22percentofthetotaldroppedoutstudentsdroppedoutintheGradeIsoas12,15 and 17 percent students dropped out from the systembefore completing theGrades II, III andIV respectively; thus causing inefficiency to thesystemtoagreatextantwhichisreflectedintheindicators concerning internal efficiency of thePrimaryeducationsystem(Table41).
The variety of internal efficiency of educationsystemrelatedindicatorsrevealsthattheprimaryeducation system is efficient to the tune ofonly 79 percent which means that of the totalinvestment about 21 percent resources are notbeingoptimallyutilizedwhichiscomputedbasedon actual data at the all-India level. Indicatorsofefficiencyarecomputed in the termsof inputyears and outcomes/output. Had there been nowastage in the system,who so ever has enteredintothesystemwouldhavecompletedfiveyearsofPrimarylevelexactlyinthefiveyearswhichistermedastheperfecteducationsystem.Inreality,suchaperfectsystemishardlytobeseen.AllIndiaindicators show thatof the1,000 students thosewhohaveenteredintothesystemthroughGradeI,only807studentsareexpectedtoreachGradeV
exactlyinthefiveyearsandrestofthem,willtakemore years to reachGradeV; thus contributingto inefficiency in thesystem.Had therebeennowastage in the system, the system would havetaken 5,000 students years (1,000 students x 5yearstocompletePrimarylevel)butintherealityunder three assumptions as mentioned above,the system has taken only 4,516 student yearsand could produce only 829 Primary graduates. On the part of the dropped out and repeaters, atotalof929studentyearsarewastedoutofwhichthe dropped out students contributed 910 student years(97.88percent)andrest20studentyearsarewastedontheaccountofrepeaters(2.12percent).Ashasalreadybeenmentionedabovethatallthesuccessfulgraduateshavenot exactly takenfiveyearsbutafewofthemhavetaken1or2oreven
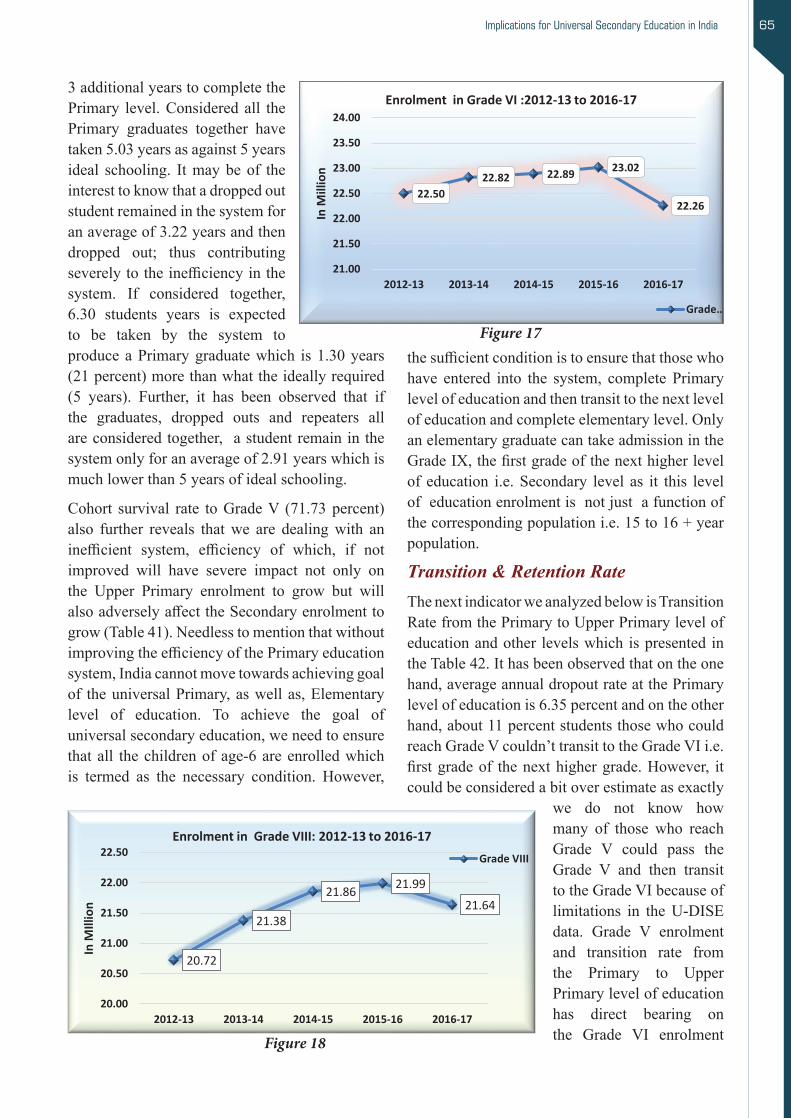
Implications for Universal Secondary Education in India 65
thesufficientconditionistoensurethatthosewhohave entered into the system, complete Primarylevelofeducationandthentransittothenextlevelofeducationandcompleteelementarylevel.OnlyanelementarygraduatecantakeadmissionintheGradeIX,thefirstgradeofthenexthigherlevelof education i.e.Secondary level as it this levelofeducationenrolmentisnotjustafunctionofthecorrespondingpopulationi.e.15to16+yearpopulation.
Transition & Retention Rate ThenextindicatorweanalyzedbelowisTransitionRatefromthePrimarytoUpperPrimarylevelofeducationandother levelswhichispresentedintheTable42.Ithasbeenobservedthatontheonehand,averageannualdropoutrateatthePrimarylevelofeducationis6.35percentandontheotherhand,about11percentstudentsthosewhocouldreachGradeVcouldn’ttransittotheGradeVIi.e.firstgradeof thenexthighergrade.However, itcouldbeconsideredabitoverestimateasexactly
we do not know howmany of those who reachGrade V could pass theGrade V and then transittotheGradeVIbecauseoflimitations in theU-DISEdata. Grade V enrolmentand transition rate from the Primary to Upper Primarylevelofeducationhas direct bearing on the Grade VI enrolment
3 additional years to complete the Primary level.Consideredall thePrimary graduates together havetaken5.03yearsasagainst5yearsideal schooling. It may be of the interesttoknowthatadroppedoutstudent remained in the system for anaverageof3.22yearsandthendropped out; thus contributingseverelytotheinefficiencyinthesystem. If considered together,6.30 students years is expected to be taken by the system toproduceaPrimarygraduatewhich is1.30years(21percent)morethanwhattheideallyrequired(5 years). Further, it has been observed that ifthe graduates, dropped outs and repeaters allareconsideredtogether, astudentremaininthesystemonlyforanaverageof2.91yearswhichismuchlowerthan5yearsofidealschooling.
Cohort survival rate toGradeV (71.73percent)also further reveals thatwe are dealingwith aninefficient system, efficiency of which, if notimproved will have severe impact not only onthe Upper Primary enrolment to grow but willalsoadverselyaffecttheSecondaryenrolmenttogrow(Table41).NeedlesstomentionthatwithoutimprovingtheefficiencyofthePrimaryeducationsystem,Indiacannotmovetowardsachievinggoalof theuniversalPrimary,aswellas,Elementarylevel of education. To achieve the goal ofuniversalsecondaryeducation,weneedtoensurethatall thechildrenofage-6areenrolledwhichis termed as the necessary condition. However,
Patterns of Decline in Enrolment: Analysis of U-DISE 2016-17 Data
84
Figure 17
Grade VIII Enrolment
Like enrolment in theGrades I, V and VI, Grade VIII enrolment has also been critically
analyzedduringtheperiod2012-13 to 2016-17 and the same is presented in the Table 45 which
revealsthat the same has consistently been increased during the period 2012-13 to 2015-16 but
declinedinthefollowingyeari.e.2016-17whichis trueforbothboysandgirlsenrolment.
From 20.72 million in 2012-13,GradeVIIIenrolmentincreasedto21.99millionintheyear
2015-16 but declined to 21.64 million in 2016-17; thus showingadeclineof352 thousand
whichis1.60percentoftheenrolmentinthepreviousyearcomparedtowhichboysenrolment
declinedby166thousand(1.47percent)andthatofgirls,186thousand(1.74percent)during
the same period. However, during the period 2012-13 to 2016-17, boys, girls and total
enrolment in Grade VIII, increased by 486 thousand (4.58 percent), 427 thousand (4.22
percent)and913thousand(4.40percent)respectively.
It may be recalled that the total enrolment at the Upper Primarylevelofeducationisdeclined
by 1.51 million in the year 2016-17ofwhichmorethan23percentaloneiscontributedbythe
decline in Grade VIII enrolment and another 50.20 percent by Grade VI enrolment (760
thousand).Whiletheboyscontributed166thousandtodecline,girlscontributed186thousand
tothetotaldeclineintheUpperPrimaryenrolment.BoththeGradesVIandVIIItogetherhave
contributedmorethan73percenttothetotaldeclineintheUpperPrimaryenrolmentwhich
means that the balanceof27percentiscontributedbytheGradeVIIenrolment.State-specific
declineinGradeVIIIenrolmentfurther reveals that23outofthe36stateshavereporteda
declineinenrolmentandtheremaining13stateshaveshownanincrease.Morethan50 percent
declineintheenrolmentiscontributedbythestatesofWestBengal(29.59percent)andUttar
22.5022.82 22.89 23.02
22.26
21.00
21.50
22.00
22.50
23.00
23.50
24.00
2012-13 2013-14 2014-15 2015-16 2016-17
In M
illio
n
Enrolment in Grade VI :2012-13 to 2016-17
Grade…
Patterns of Decline in Enrolment: Analysis of U-DISE 2016-17 Data
85
Pradesh (24.62percent).Bihar (15.70percent), Jharkhand (15.70percent),Karnataka (4.91
percent)and Jammu&Kashmir (2.22 percent) are the othermajor contributors to the total
declineinGradeVIIIenrolmentallwhichareverycrucial for theCountytoachievethegoal
ofUniversalElementaryEducation.
Table 45:Enrolment, 2012-13 to2 016-17
Year Grade VIII (In Million)
Boys Girls Total 2012-13 10.62 10.10 20.72 2013-14 10.97 10.41 21.38 2014-15 11.22 10.63 21.86 2015-16 11.27 10.71 21.99 2016-17 11.11 10.53 21.64
Year %age Share
Boys Girls Total 2012-13 51.26 48.74 100.00 2013-14 51.30 48.70 100.00 2014-15 51.35 48.65 100.00 2015-16 51.27 48.73 100.00 2016-17 51.34 48.66 100.00
Year Change in Enrolment
Boys Girls Total 2012-13 - - - 2013-14 343994 307851 651845 2014-15 257556 224551 482107 2015-16 50275 80418 130693 2016-17 -165745 -186216 -351961
Year %age Decline over 2012-13
Boys Girls Total 2013-14 3.24 3.05 3.15 2014-15 5.66 5.27 5.47 2015-16 6.14 6.07 6.10 2016-17 4.58 4.22 4.40
Figure 18
20.72
21.38
21.86 21.9921.64
20.00
20.50
21.00
21.50
22.00
22.50
2012-13 2013-14 2014-15 2015-16 2016-17
In M
Illio
n
Enrolment in Grade VIII: 2012-13 to 2016-17 Grade VIII
Figure 17
Figure 18
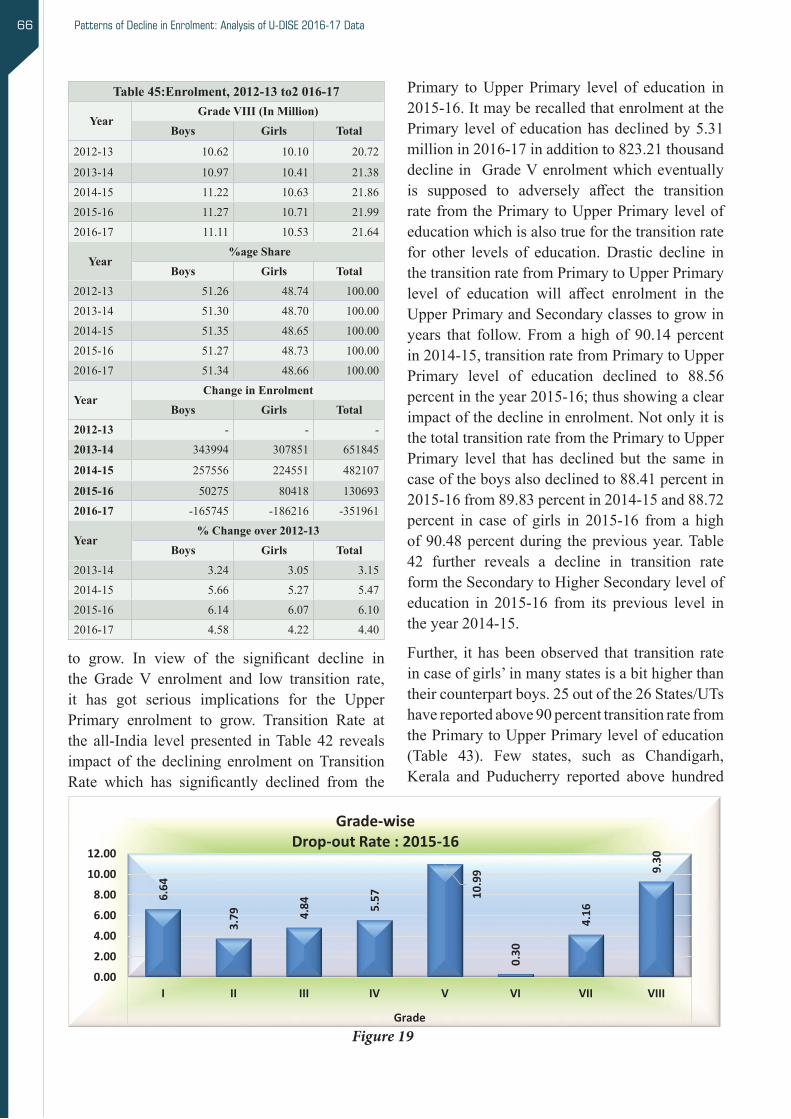
Patterns of Decline in Enrolment: Analysis of U-DISE 2016-17 Data66
Table 45:Enrolment, 2012-13 to2 016-17
YearGrade VIII (In Million)
Boys Girls Total
2012-13 10.62 10.10 20.72
2013-14 10.97 10.41 21.38
2014-15 11.22 10.63 21.86
2015-16 11.27 10.71 21.99
2016-17 11.11 10.53 21.64
Year %age Share
Boys Girls Total
2012-13 51.26 48.74 100.00
2013-14 51.30 48.70 100.00
2014-15 51.35 48.65 100.00
2015-16 51.27 48.73 100.00
2016-17 51.34 48.66 100.00
YearChange in Enrolment
Boys Girls Total 2012-13 - - -2013-14 343994 307851 651845
2014-15 257556 224551 482107
2015-16 50275 80418 1306932016-17 -165745 -186216 -351961
Year% Change over 2012-13
Boys Girls Total
2013-14 3.24 3.05 3.15
2014-15 5.66 5.27 5.47
2015-16 6.14 6.07 6.10
2016-17 4.58 4.22 4.40
Patterns of Decline in Enrolment: Analysis of U-DISE 2016-17 Data
87
Flow Rate
Grade Average
Annual
Rate
Grade Average
Annual
Rate I II III IV V VI VII VIII
Promotion 92.52 95.69 84.70 94.00 88.58 93.11 95.93 95.47 90.32 93.95
Repetition 0.84 0.52 0.46 0.43 0.45 0.54 3.77 0.37 0.37 1.53
Dropout 6.64 3.79 4.84 5.57 10.99 6.35 0.30 4.16 9.30 4.52
Figure 19
Transition Rate from Elementary to Secondary Level
The state-specificTransitionRatespresentedaboveintheTable43 &47 revealsthatthesame
isashighas90.32percentincaseoftheUpperPrimarytoSecondarylevelofeducationas
comparedto88.56percentfromthePrimarytoUpperPrimarylevelofeducationbothofwhich
areconsideredreasonablyhigh.However,thesameincaseofGirlsfromtheUpperPrimaryto
Secondarylevelofeducationisabitlowerat87.91percentcomparedtotheircounterpartboys
(92.62percent).Transitionrateincaseofafewstatesobtainedisabovehundredwhichinthe
U-DISE 2016-17 is reportedtobe100percent;suchstatesareChandigarh,Daman&Diu,Goa,
Kerala,LakshadweepandPuducherryallofwhicharesmallinsizeandalittleoverreporting
ofenrolmentinGradeIXmayresultedintotheabovehundredtransitionrate.Ontheother
hand,TransitionRatefromtheElementarytoSecondarylevelof education inafewstatesis
low,a fewofsuchstatesare:Bihar(73.86percent),Jharkhand(69.39percent),Meghalaya
(73.88percent)andNagaland (76.76percent).Chhattisgarh (86.81percent),Gujarat (84.24
percent),Jammu&Kashmir(86.09percent),MadhyaPradesh(84.11percent)andManipur
(83.27percent)areafewotherstateswhichalsohavealowtransitionratefromtheElementary
toSecondarylevelofeducation.Ontheotherhand,about25stateshavetransitionrateabove
90percentinthesestates9outofthe10studentsinGradeVIIIin2015-16 transited to the next
6.64
3.79 4.
84 5.57 10
.99
0.30
4.16
9.30
0.002.004.006.008.00
10.0012.00
I II III IV V VI VII VIII
Grade
Grade-wise Drop-out Rate : 2015-16
to grow. In view of the significant decline inthe GradeV enrolment and low transition rate,it has got serious implications for the Upper Primary enrolment to grow. Transition Rate atthe all-India level presented inTable 42 revealsimpact of the declining enrolment on Transition Rate which has significantly declined from the
Primary toUpper Primary level of education in2015-16.ItmayberecalledthatenrolmentatthePrimary levelofeducationhasdeclinedby5.31millionin2016-17inadditionto823.21thousanddeclinein GradeVenrolmentwhicheventuallyis supposed to adversely affect the transitionratefromthePrimarytoUpperPrimarylevelofeducationwhichisalsotrueforthetransitionratefor other levels of education.Drastic decline inthe transition rate from Primary to Upper Primary level of education will affect enrolment in theUpperPrimaryandSecondaryclassestogrowinyears that follow.Froma highof 90.14percentin2014-15,transitionratefromPrimarytoUpperPrimary level of education declined to 88.56percentintheyear2015-16;thusshowingaclearimpact of the decline in enrolment. Not only it is the total transition rate from the Primary to Upper Primary level that has declined but the same incase of the boys also declined to 88.41 percent in 2015-16from89.83percentin2014-15and88.72percent in case of girls in 2015-16 from a highof90.48percentduring thepreviousyear.Table42 further reveals a decline in transition rateformtheSecondarytoHigherSecondarylevelofeducation in 2015-16 from its previous level intheyear2014-15.
Further, ithasbeenobserved that transition rateincaseofgirls’inmanystatesisabithigherthantheir counterpart boys. 25 out of the 26 States/UTs havereportedabove90percenttransitionratefromthePrimarytoUpperPrimarylevelofeducation(Table 43). Few states, such as Chandigarh,Kerala and Puducherry reported above hundred
Figure 19

Implications for Universal Secondary Education in India 67
case of boys. Unless the retention rate is further improved,UpperPrimarylevelandsubsequentlytheSecondarylevelofeducationisnotexpectedtosendtheadequatenumberofgraduates to thenexthigherlevelsufficienttoachievethegoalofuniversalenrolment.ImprovingtheefficiencyofthePrimarylevelofeducationistheonlyoptionlefttoachievethegoalofuniversalenrolmentatthisandotherhigherlevelsofeducation.
In the following section, trends in enrolment intheGradesVItoVIIIisdiscussed.
Grade VI EnrolmentLikeenrolment inGrades I andV,enrolment inGradeVIhasalsobeenanalysedduringtheperiod2012-13to2016-17andpresentedintheTable44whichrevealsthatthesamehasbeenconsistentlyincreasedduringtheperiod2012-13to2015-16but declined significantly in the following yeari.e.2016-17whichistrueforbothboysandgirlsenrolment. Total enrolment in the Grade VI in2016-17 is declined by 7,60,404 students (3.30percent over the previous year) of which thecontribution of boys is of the tune of 3,48,323(2.94 percent) and that of girls, 4,12,081 (3.69percent).Declineinthegirls’enrolmentinGradeVIisobservedtobehigherthanthatofthedeclinein boys’ enrolment. It may be recalled that theUpperPrimaryenrolmentin2016-17isdeclinedby15,14,604whichis2.24percentoftheUpperPrimary enrolment during the previous year i.e.2015-16. Here too girls enrolment declined by2.44percent(8,00,615students)whichishigherthan the same in case of the boys enrolment (7,13,989 students, 2.06 percent) both in termsof percentage and absolute forms. Decline in GradeVIenrolment(0.76million)isfoundtobemore than 50 percent of total decline in the Upper Primaryenrolment (1.51million).Percentageofgirls’enrolment to the totalGradeVIenrolment
transition rate which may be because of theinconsistent enrolment data. It may be recalled thatBihar,JharkhandandUttarPradeshreportedasteepdeclineinPrimaryenrolmentin2016-17allwhichalsohavealowtransitionratein2015-16.Biharhas the lowest transition rateof76.12percent followed by Jharkhand (76.28 percent)andUttarPradesh(77.89percent).Thesearetheonlystateswhichhavereportedbelow80percenttransitionratewhichmayhaveseriousimplicationforachievingthegoalofUEE.
It may be recalled that apart from the total enrolment inPrimarygrades,declinehasalsobeenobservedintheindividualGradeIandGradeVenrolmentin 2016-17 over the previous year i.e. 2015-16which shall also influence the retention rate atthePrimarylevelofeducationwhichiscomputedbasedontheGradeVenrolmentin2016-17asaratiooftheGradeIenrolmentfouryearsbacki.e.2012-13,Thoughtheretentionratefor theyears2014-15and2015-16isavailablebutthesameisnot truefor thelatestyear2016-17whichisnotreadily available but canbe computedbasedontheavailabledatawhichshowsthatalittleabove87 percent of the students in 2016-17 admittedin2012-13inGradeIcouldabletoreachGradeVexactlyinthefiveyearsandtheremaining13percentstudentsmighthavedroppedoutfromthesystem before the completion or a few of themmaystillbeintheGradesItoIVbecauseoftherepetition. Available information further showsthat only 71 percent students could able to retain up to theGradeVIIIascompared to57percentuptotheGradeXallwhichsuggestlowretainingcapacity of the system which is also reflectedin the indicators of the internal efficiency ofeducationsystempresentedabove.Further,ithasbeenobserved that retention rate at thePrimarylevelofeducationisabithigherinthecaseofgirls(87.93percent)comparedto80.90percentinthe
Table 46: Flow Rates at Primary & Upper Primary Levels of Education: 2015-16
Flow RateGrade Average
Annual Rate
Grade AverageAnnual
RateI II III IV V VI VII VIIIPromotion 92.52 95.69 84.70 94.00 88.58 93.11 95.93 95.47 90.32 93.95Repetition 0.84 0.52 0.46 0.43 0.45 0.54 3.77 0.37 0.37 1.53Dropout 6.64 3.79 4.84 5.57 10.99 6.35 0.30 4.16 9.30 4.52
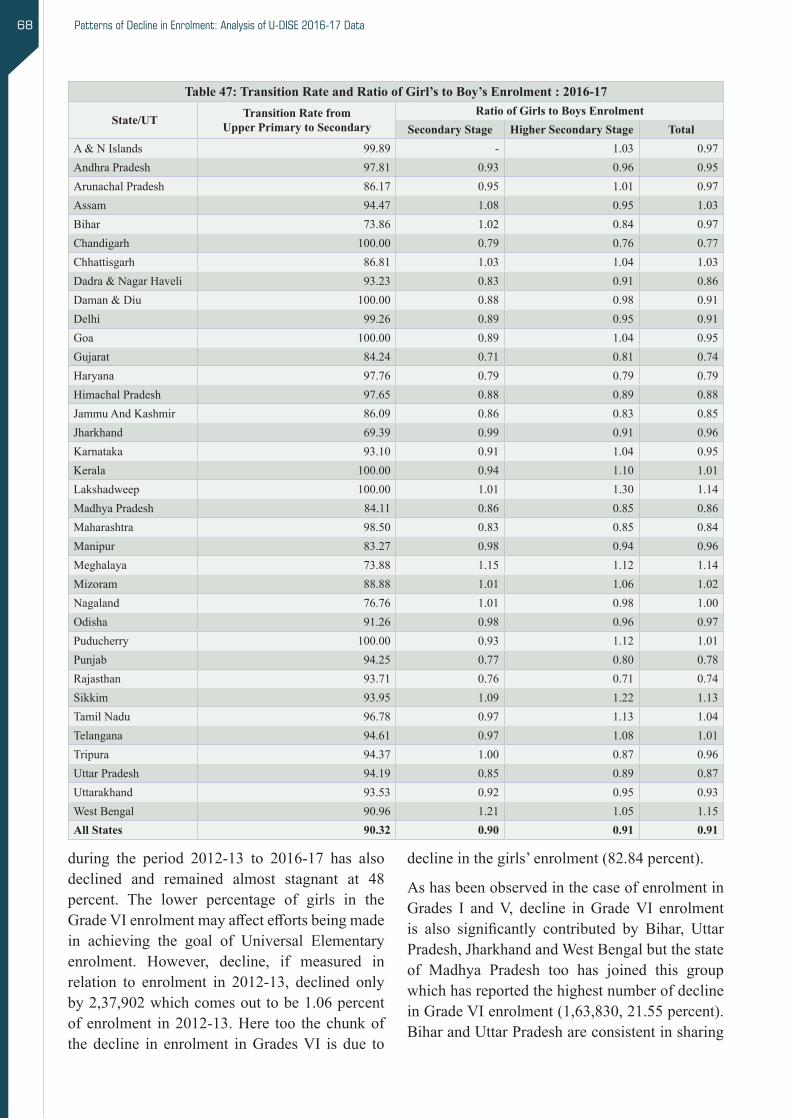
Patterns of Decline in Enrolment: Analysis of U-DISE 2016-17 Data68
Table 47: Transition Rate and Ratio of Girl’s to Boy’s Enrolment : 2016-17
State/UT Transition Rate from Upper Primary to Secondary
Ratio of Girls to Boys EnrolmentSecondary Stage Higher Secondary Stage Total
A&NIslands 99.89 - 1.03 0.97AndhraPradesh 97.81 0.93 0.96 0.95ArunachalPradesh 86.17 0.95 1.01 0.97Assam 94.47 1.08 0.95 1.03Bihar 73.86 1.02 0.84 0.97Chandigarh 100.00 0.79 0.76 0.77Chhattisgarh 86.81 1.03 1.04 1.03Dadra&NagarHaveli 93.23 0.83 0.91 0.86Daman&Diu 100.00 0.88 0.98 0.91Delhi 99.26 0.89 0.95 0.91Goa 100.00 0.89 1.04 0.95Gujarat 84.24 0.71 0.81 0.74Haryana 97.76 0.79 0.79 0.79HimachalPradesh 97.65 0.88 0.89 0.88JammuAndKashmir 86.09 0.86 0.83 0.85Jharkhand 69.39 0.99 0.91 0.96Karnataka 93.10 0.91 1.04 0.95Kerala 100.00 0.94 1.10 1.01Lakshadweep 100.00 1.01 1.30 1.14Madhya Pradesh 84.11 0.86 0.85 0.86Maharashtra 98.50 0.83 0.85 0.84Manipur 83.27 0.98 0.94 0.96Meghalaya 73.88 1.15 1.12 1.14Mizoram 88.88 1.01 1.06 1.02Nagaland 76.76 1.01 0.98 1.00Odisha 91.26 0.98 0.96 0.97Puducherry 100.00 0.93 1.12 1.01Punjab 94.25 0.77 0.80 0.78Rajasthan 93.71 0.76 0.71 0.74Sikkim 93.95 1.09 1.22 1.13Tamil Nadu 96.78 0.97 1.13 1.04Telangana 94.61 0.97 1.08 1.01Tripura 94.37 1.00 0.87 0.96Uttar Pradesh 94.19 0.85 0.89 0.87Uttarakhand 93.53 0.92 0.95 0.93WestBengal 90.96 1.21 1.05 1.15All States 90.32 0.90 0.91 0.91
declineinthegirls’enrolment(82.84percent).
AshasbeenobservedinthecaseofenrolmentinGrades I andV, decline inGradeVI enrolmentis also significantly contributed by Bihar, UttarPradesh,JharkhandandWestBengalbutthestateof Madhya Pradesh too has joined this groupwhichhasreportedthehighestnumberofdeclineinGradeVIenrolment(1,63,830,21.55percent).BiharandUttarPradeshareconsistentinsharing
during the period 2012-13 to 2016-17 has alsodeclined and remained almost stagnant at 48 percent. The lower percentage of girls in theGradeVIenrolmentmayaffecteffortsbeingmadein achieving the goal of Universal Elementaryenrolment. However, decline, if measured inrelation to enrolment in 2012-13, declined onlyby2,37,902whichcomesouttobe1.06percentofenrolment in2012-13.Here too thechunkofthedecline in enrolment inGradesVI is due to

Implications for Universal Secondary Education in India 69 Patterns of Decline in Enrolment: Analysis of U-DISE 2016-17 Data
90
Figure 20
Table 48: Enrolment Ratio at Different Levels of Education, 2012 13, 2015-16 and 2016-
17
Enrolment Ratio Primary Level
2012-13 2015-16 2016-17 GrossEnrolmentRatio 105.98 99.02 95.12 Net Enrolment Ratio 90.78 87.14 83.62
Adjusted-NER 91.47 88.05 Age-specificEnrolmentRatio:6+to10+Years 81.47 88.07
Upper Primary Level 2012-13 2015-16 2016-17
GrossEnrolment Ratio 82.80 91.82 90.73 Net Enrolment Ratio 64.24 73.94 72.69
Adjusted-NER 83.46 82.00 Age-specificEnrolmentRatio:11+to13+Years 92.72 91.33
Elementary Level 2012-13 2015-16 2016-17
GrossEnrolmentRatio 96.47 93.55 Net Enrolment Ratio 91.62 89.24
Adjusted-NER 91.92 89.23 Age-specificEnrolmentRatio:6+to13+Years 91.92 89.24
Secondary Level 2012-13 2015-16 2016-17
GrossEnrolmentRatio 68.13 79.30 79.35 Net Enrolment Ratio 41.00 50.80 51.77 Adjusted-NER 41.90 62.81 62.42 Age-specificEnrolmentRatio:14+to15+Years 75.15 76.47 Higher Secondary Level 2012-13 2015-16 2016-17 GrossEnrolmentRatio 40.76 55.76 55.40 Net Enrolment Ratio 23.73 32.05 30.95 Adjusted-NER - - -
Age-specificEnrolmentRatio:16+to17+Years 47.60 45.92
103.77 110.86 113.94 115.31 115.63 118.60105.98 101.36 100.08 99.21 95.12
59.1764.72 69.88
73.74 75.80 81.1582.50 89.33 91.24 92.81 91.73
0.00
50.00
100.00
150.00
200.00
250.00
2005-06 2006-07 2007-08 2008-09 2009-10 2010-11 2012-13 2013-14 2014-15 2015-16 2016-17
GER at Primary & Upper Primary Level: 2005-06 to 2016-17
Table 48: Enrolment Ratio at Different Levels of Education, 2012 13, 2015-16 and 2016-17
Enrolment RatioPrimary Level
2012-13 2015-16 2016-17
GrossEnrolmentRatio 105.98 99.02 95.12
Net Enrolment Ratio 90.78 87.14 83.62Adjusted-NER - 91.47 88.05
Age-specificEnrolmentRatio:6+to10+Years - 81.47 88.07
Upper Primary Level
2012-13 2015-16 2016-17
GrossEnrolmentRatio 82.80 91.82 90.73
Net Enrolment Ratio 64.24 73.94 72.69
Adjusted-NER - 83.46 82.00
Age-specificEnrolmentRatio:11+to13+Years - 92.72 91.33
Elementary Level
2012-13 2015-16 2016-17
GrossEnrolmentRatio - 96.47 93.55
Net Enrolment Ratio - 91.62 89.24
Adjusted-NER - 91.92 89.23
Age-specificEnrolmentRatio:6+to13+Years - 91.92 89.24
Secondary Level
2012-13 2015-16 2016-17
GrossEnrolmentRatio 68.13 79.30 79.35
Net Enrolment Ratio 41.00 50.80 51.77
Adjusted-NER 41.90 62.81 62.42
Age-specificEnrolmentRatio:14+to15+Years - 75.15 76.47
Higher Secondary Level
2012-13 2015-16 2016-17
GrossEnrolmentRatio 40.76 55.76 55.40
Net Enrolment Ratio 23.73 32.05 30.95
Adjusted-NER - - -
Age-specificEnrolmentRatio:16+to17+Years - 47.60 45.92
Figure 20
Patterns of Decline in Enrolment: Analysis of U-DISE 2016-17 Data70
theothermajorcontributorstothetotaldeclineinGradeVIIIenrolmentallwhichareverycrucialfor theCounty to achieve the goal ofUniversalElementary Education.
Ontheonehand,GradeVIenrolmenthasshownadeclinein2016-17andontheotherhand,GradeVIIIenrolment toohadshownadeclinebothofwhichmayinfluencetheefficiencyofelementaryeducation. Indicators of internal efficiency ofthe Primary education system has already been presented above which are based on a set ofthreeassumptionswhichalsoremainvalidwhilecomputingthesamefortheUpperPrimarylevelofeducation.Itmayberecalledthattheaverageannual dropout rate at the Primary level ofeducationfor2015-16Cohortisnoticedtobe6.35percent against 4.52 percent at the Upper Primary level of education. Grade-to-grade dropoutrate further reveals that the same across UpperPrimarygradesishigh.Ontheonehand,GradeVIenrolmentdeclinedby760thousand,ontheotherhand about 0.30 percent children dropped out beforethecompletionofGradeVI;thusseverelyaffecting the efficiencyof the education system.On the other hand, about 4.16 and 9.30 percentstudents dropped out before the completion of GradesVIIandVIIIrespectively.Itmayalsoberecalled that the dropout rate inGradeV is ashighas11percent.Averageannualpromotionratein the Upper Primary grades is 94 percent against alowrepetitionrateofaround1.53percent.Highincidence of dropout (average 4.52 percent perannum)hasseverelyaffectedtheefficiencyoftheUpper Primary level of educationwhich comesouttobe89.31percent;thusindicatingthatabout11 percent of the total investment (in terms ofstudent years) has just gone waste. Under theassumptionslaiddown,thesystemcouldproduceonly821graduatesagainst1,000studentsintheGradeVIwhohadtakenanaverageof3.01yearstocompletetheelementarylevel.Hadtherebeennowastage, the systemwouldhave taken3,000student years to produce 1,000 graduates but intherealityithastakenonly1,931studentyears;thusindicatingthatthesystemtowhichwedealwithisthehighlyinefficientoneaswastageof295studentyearsareaccountedtothedropouts(285
large number to decline in enrolment which isalsotruefortheGradesI,VandVI.
Grade VIII EnrolmentLikeenrolmentintheGradesI,VandVI,GradeVIIIenrolmenthasalsobeencriticallyanalyzedduring the period 2012-13 to 2016-17 and thesame ispresented in theTable45whichrevealsthat the same has consistently been increased during the period 2012-13 to 2015-16 butdeclinedinthefollowingyeari.e.2016-17whichis true for both boys and girls enrolment. From 20.72million in2012-13,GradeVIIIenrolmentincreased to 21.99 million in the year 2015-16but declined to 21.64 million in 2016-17; thusshowingadeclineof352thousandwhichis1.60percent of the enrolment in the previous yearcompared towhich boys enrolment declined by166thousand(1.47percent)andthatofgirls,186thousand (1.74percent)during the sameperiod.However,duringtheperiod2012-13to2016-17,boys, girls and total enrolment in Grade VIII,increased by 486 thousand (4.58 percent), 427thousand (4.22percent) and913 thousand (4.40percent)respectively.
It may be recalled that the total enrolment at the UpperPrimarylevelofeducationisdeclinedby1.51million in theyear2016-17ofwhichmorethan 23 percent alone is contributed by the decline inGradeVIIIenrolmentandanother50.20percentbyGradeVIenrolment(760thousand).Whiletheboys contributed 166 thousand to decline, girlscontributed 186 thousand to the total decline in theUpperPrimaryenrolment.BoththeGradesVIandVIIItogetherhavecontributedmorethan73percent to the total decline in the Upper Primary enrolment which means that the balance of 27percentiscontributedbytheGradeVIIenrolment.State-specific decline in Grade VIII enrolmentfurther reveals that 23out of the36 stateshavereported a decline in enrolment and the remaining 13stateshaveshownanincrease.More than50percent decline in the enrolment is contributed by thestatesofWestBengal(29.59percent)andUttarPradesh (24.62 percent). Bihar (15.70 percent),Jharkhand (15.70 percent), Karnataka (4.91percent)andJammu&Kashmir(2.22percent)are

Map 8
INDIAGross Enrolment Ratio at Secondary Level
U-DISE 2016-17
CHANDIGARH89.65
JAMMU & KASHMIR61.65
HIMACHAL PRADESH103.86
PUNJAB87.08
RAJASTHAN76.63
MADHYA PRADESH80.15 CHHATTISGARH
87.65
JHARKHAND63.50
WEST BENGAL78.56
BIHAR76.71
SIKKIM111.96
MEGHALAYA83.25
ASSAM78.56
NAGALAND61.80
ARUNACHAL PRADESH85.94
MANIPUR86.52
MIZORAM95.88TRIPURA
112.26
ODISHA79.91
MAHARASHTRA91.74
DAMAN & DIU73.26
GUJARAT74.54
DADRA & NAGAR HAVELI
91.16
A R A B I A N S E A
GOA99.33
B AY O F B E N G A L
KERALA99.36
KARNATAKA84.44
ANDHRA PRADESH76.30
TELANGANA81.80
PUDUCHERRY87.51
LAKSHADWEEP102.26
TAMIL NADU93.87
AND
AMAN
AND
NICO
BAR ISLAND
S
84.05
R A T I O
DELHI114.42
UTTARAKHAND84.40
UTTAR PRADESH67.82
60.00 - 75.00
75.01 - 90.00
90.01 - 100.00
100.00 - 115.00
HARYANA86.34
(ALL INDIA: 79.35)
Note: Map not to scale Disclaimer: The boundaries and the names used in the maps are only a visual representation and do not determine the legal boundary position.
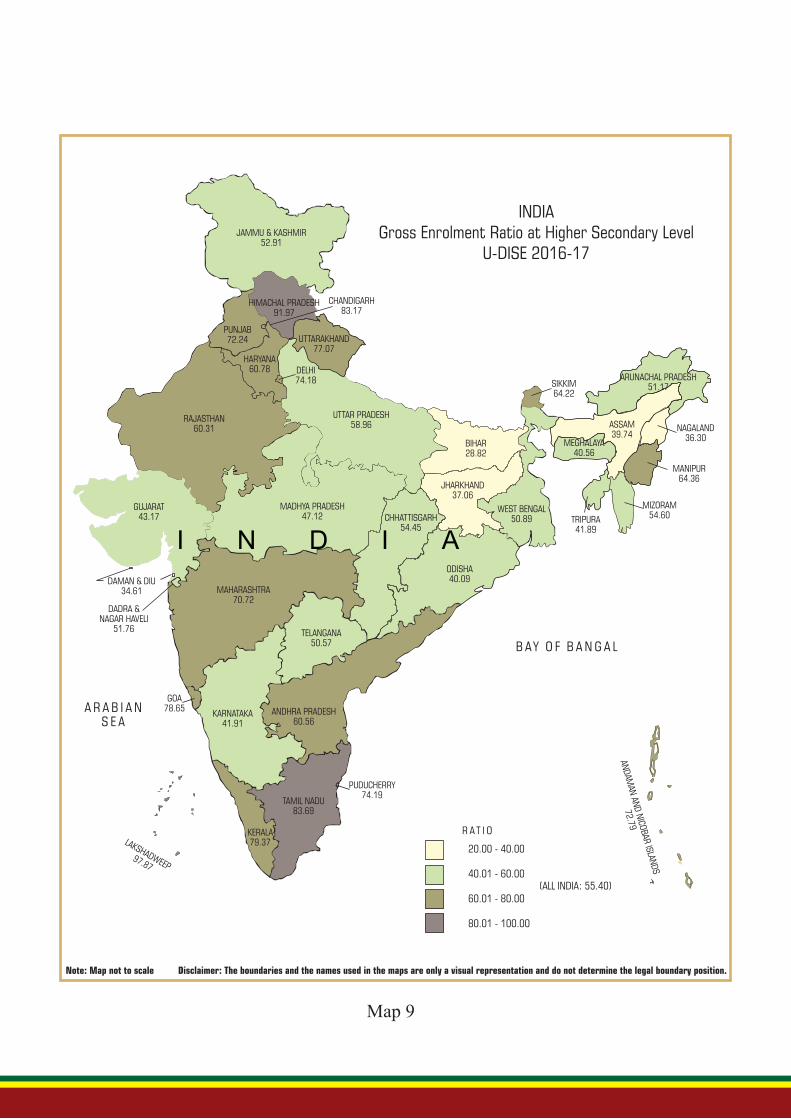
Map 9
INDIAGross Enrolment Ratio at Higher Secondary Level
U-DISE 2016-17
CHANDIGARH83.17
JAMMU & KASHMIR52.91
HIMACHAL PRADESH91.97
PUNJAB72.24
RAJASTHAN60.31
MADHYA PRADESH47.12 CHHATTISGARH
54.45
JHARKHAND37.06
WEST BENGAL50.89
BIHAR28.82
SIKKIM64.22
MEGHALAYA40.56
ASSAM39.74
NAGALAND36.30
ARUNACHAL PRADESH51.17
MANIPUR64.36
MIZORAM54.60TRIPURA
41.89
ODISHA40.09
MAHARASHTRA70.72
DAMAN & DIU34.61
GUJARAT43.17
DADRA & NAGAR HAVELI
51.76
A R A B I A N S E A
GOA78.65
B AY O F B A N G A L
KERALA79.37
KARNATAKA41.91
ANDHRA PRADESH60.56
TELANGANA50.57
PUDUCHERRY74.19
LAKSHADWEEP97.87
TAMIL NADU83.69
AND
AMAN
AND
NICO
BAR ISLAND
S
72.79
R A T I O
DELHI74.18
UTTARAKHAND77.07
UTTAR PRADESH58.96
20.00 - 40.00
40.01 - 60.00
60.01 - 80.00
80.01 - 100.00
HARYANA60.78
(ALL INDIA: 55.40)
Note: Map not to scale Disclaimer: The boundaries and the names used in the maps are only a visual representation and do not determine the legal boundary position.

Implications for Universal Secondary Education in India 73
manyofthemhavetransitedtothenextlevelofeducation through the Grade IX, transition ratefrom the Upper Primary to Secondary level ofeducationhasbeen analyzedwhich is presentedin the Table 47.
Transition Rate from Elementary to Secondary LevelThe state-specific Transition Rates presented
student years) and repeaters (10 student years).Ofthetotalwastage,contributionofdroppedoutstudents is to the tuneof96.67percentwhichifnotchecked,efficiencyofthesystemisunlikelytobeimproved.Itmayalsobeoftheinterest toknow that a dropped out child remained in thesystem for an averageof about 1.59years; thuscausing inefficiency in the system to a greatextant.Of thosewhoremainin thesystem,how
Table 49: Gross & Net Enrolment Ratio at Primary and Upper Primary Levels : 2016-17
State/UTGross Enrolment Ratio (GER)* Net Enrolment Ratio (NER)*Primary Upper Prima-ry Primary Upper Primary
A&NIslands 86.87 83.06 75.45 66.73AndhraPradesh 82.79 82.14 68.97 60.56ArunachalPradesh 106.18 119.85 84.11 83.44As 107.39 96.69 100.00 80.32Bihar 98.08 103.86 91.80 93.56Chandigarh 80.07 85.60 71.75 77.14Chhattisgarh 97.07 100.81 89.03 82.75Dadra&NagarHaveli 82.87 91.57 77.95 68.83Daman&Diu 83.96 81.13 73.04 64.79Delhi 109.19 128.96 92.55 99.25Goa 101.33 97.07 96.02 87.09Gujarat 94.97 97.20 80.67 74.55Haryana 93.90 94.40 75.63 69.77HimachalPradesh 97.91 102.99 83.65 80.31JammuAndKashmir 77.09 66.22 62.92 49.76Jharkhand 96.64 91.81 83.34 70.69Karnataka 103.71 92.90 96.95 85.94Kerala 95.14 93.63 85.81 79.69Lakshadweep 70.02 81.37 69.51 67.57Madhya Pradesh 92.13 89.73 78.62 70.29Maharashtra 97.50 98.69 86.07 79.54Manipur 120.57 119.27 100.00 94.65Meghalaya 129.07 128.04 89.01 68.68Mizoram 115.68 127.50 89.65 88.64Nagaland 81.67 90.44 66.84 65.34Odisha 100.22 94.84 88.47 75.48Puducherry 85.57 84.79 79.14 74.24Punjab 99.31 97.72 82.70 73.36Rajasthan 97.80 91.99 78.84 68.93Sikkim 91.98 136.99 54.78 54.05Tamil Nadu 102.01 93.42 89.47 74.17Telangana 98.64 86.91 81.59 66.01Tripura 102.38 126.40 96.82 100.00Uttar Pradesh 87.16 72.74 78.58 58.43Uttarakhand 96.41 86.73 81.71 66.29WestBengal 96.27 96.34 82.44 71.89All India 95.12 90.73 83.62 72.69
*: Child population projected is based on 2011 actual Census single-age population by the MHRD.

Patterns of Decline in Enrolment: Analysis of U-DISE 2016-17 Data74
(92.62percent).Transition rate incaseofa fewstates obtained is above hundred which in theU-DISE 2016-17 is reported to be 100 percent;suchstatesareChandigarh,Daman&Diu,Goa,Kerala, Lakshadweep and Puducherry all ofwhicharesmallinsizeandalittleoverreportingof enrolmentinGradeIXmayresultedintotheabovehundredtransitionrate.Ontheotherhand,Transition Rate from the Elementary to Secondary
above in the Tables 43 & 47 reveals that thesame is as high as 90.32 percent in case of the UpperPrimarytoSecondarylevelofeducationascompared to 88.56 percent from the Primary to UpperPrimarylevelofeducationbothofwhichare considered reasonably high. However, thesame in case of Girls from the Upper PrimarytoSecondarylevelofeducationisabit lowerat87.91 percent compared to their counterpart boys
Table 50: Gross & Net Enrolment Ratio at Secondary & Higher Secondary Levels : 2016-17
State/UTGross Enrolment Ratio (GER)* Net Enrolment Ratio (NER)*Secondary Higher Sec-ondary Secondary Higher Second-ary
A&NIslands 84.05 72.79 55.65 46.22AndhraPradesh 76.30 60.56 46.51 0.00ArunachalPradesh 85.94 51.17 50.23 31.53Assam 78.56 39.74 58.28 27.89Bihar 76.71 28.82 48.94 16.87Chandigarh 89.65 83.17 62.09 59.23Chhattisgarh 87.65 54.45 56.14 34.10Dadra&NagarHaveli 91.16 51.76 58.96 30.69Daman&Diu 73.26 34.61 49.64 27.15Delhi 114.42 74.18 71.74 48.55Goa 99.33 78.65 79.08 61.91Gujarat 74.54 43.17 47.92 27.12Haryana 86.34 60.78 49.49 34.64HimachalPradesh 103.86 91.97 66.28 53.86JammuAndKashmir 61.65 52.91 39.28 31.97Jharkhand 63.50 37.06 41.30 23.93Karnataka 84.44 41.91 75.36 0.00Kerala 99.36 79.37 75.69 58.19Lakshadweep 102.26 97.87 63.15 61.85Madhya Pradesh 80.15 47.12 48.79 28.83Maharashtra 91.74 70.72 61.36 45.85Manipur 86.52 64.36 60.27 42.45Meghalaya 83.25 40.56 34.94 18.19Mizoram 95.88 54.60 55.77 31.04Nagaland 61.80 36.30 34.03 19.62Odisha 79.91 40.09 54.91 20.23Puducherry 87.51 74.19 70.92 59.94Punjab 87.08 72.24 50.28 41.58
Rajasthan 76.63 60.31 42.21 30.95
Sikkim 111.96 64.22 21.69 10.70Tamil Nadu 93.87 83.69 66.60 56.53Telangana 81.80 50.57 53.28 20.76Tripura 112.26 41.89 88.04 31.98Uttar Pradesh 67.82 58.96 42.65 33.56Uttarakhand 84.40 77.07 50.29 43.66WestBengal 78.56 50.89 50.38 31.98All States 79.35 55.40 51.77 30.95
*: Child population projected is based on 2011 actual Census single-age population by the MHRD.
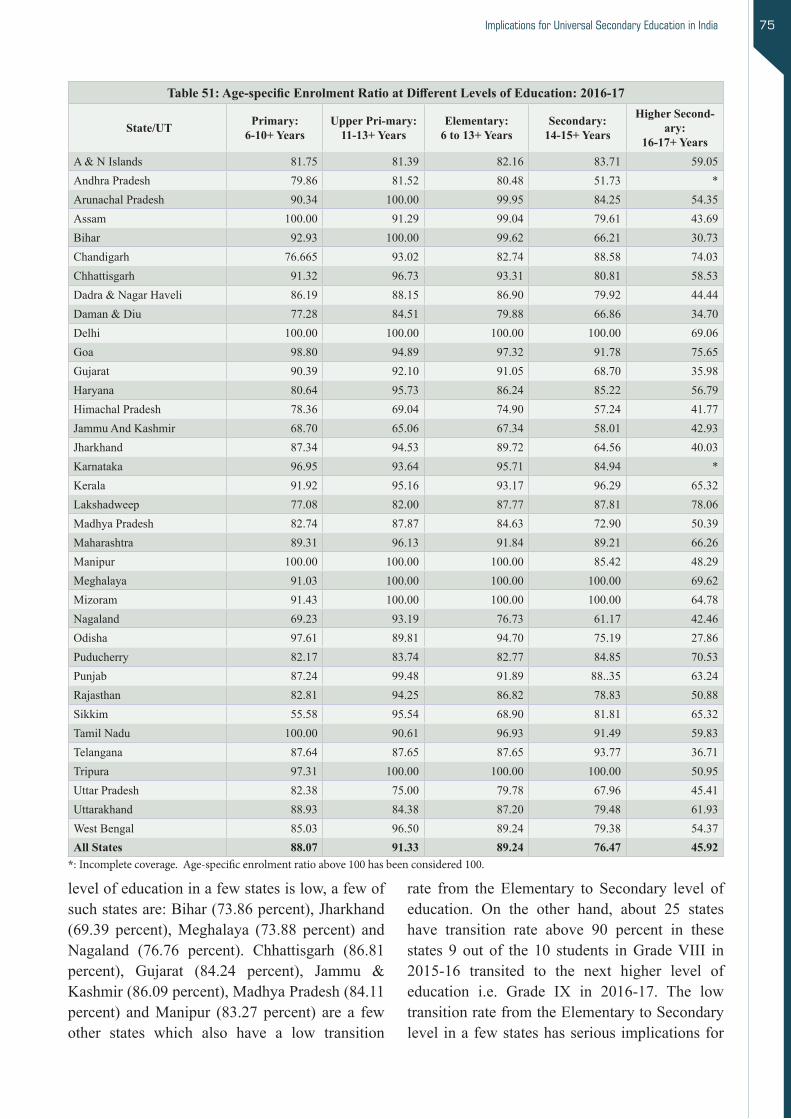
Implications for Universal Secondary Education in India 75
rate from the Elementary to Secondary level ofeducation. On the other hand, about 25 stateshave transition rate above 90 percent in thesestates 9 out of the 10 students inGradeVIII in2015-16 transited to the next higher level ofeducation i.e. Grade IX in 2016-17. The lowtransition rate from the Elementary to Secondary levelinafewstateshasseriousimplicationsfor
levelofeducationinafewstatesislow,afewofsuchstatesare:Bihar(73.86percent),Jharkhand(69.39 percent),Meghalaya (73.88 percent) andNagaland (76.76 percent). Chhattisgarh (86.81percent), Gujarat (84.24 percent), Jammu &Kashmir(86.09percent),MadhyaPradesh(84.11percent) andManipur (83.27 percent) are a fewother states which also have a low transition
Table 51: Age-specific Enrolment Ratio at Different Levels of Education: 2016-17
State/UT Primary: 6-10+ Years
Upper Pri-mary: 11-13+ Years
Elementary: 6 to 13+ Years
Secondary: 14-15+ Years
Higher Second-ary:
16-17+ YearsA&NIslands 81.75 81.39 82.16 83.71 59.05AndhraPradesh 79.86 81.52 80.48 51.73 *ArunachalPradesh 90.34 100.00 99.95 84.25 54.35Assam 100.00 91.29 99.04 79.61 43.69Bihar 92.93 100.00 99.62 66.21 30.73Chandigarh 76.665 93.02 82.74 88.58 74.03Chhattisgarh 91.32 96.73 93.31 80.81 58.53Dadra&NagarHaveli 86.19 88.15 86.90 79.92 44.44Daman&Diu 77.28 84.51 79.88 66.86 34.70Delhi 100.00 100.00 100.00 100.00 69.06Goa 98.80 94.89 97.32 91.78 75.65Gujarat 90.39 92.10 91.05 68.70 35.98Haryana 80.64 95.73 86.24 85.22 56.79HimachalPradesh 78.36 69.04 74.90 57.24 41.77JammuAndKashmir 68.70 65.06 67.34 58.01 42.93Jharkhand 87.34 94.53 89.72 64.56 40.03Karnataka 96.95 93.64 95.71 84.94 *Kerala 91.92 95.16 93.17 96.29 65.32Lakshadweep 77.08 82.00 87.77 87.81 78.06Madhya Pradesh 82.74 87.87 84.63 72.90 50.39Maharashtra 89.31 96.13 91.84 89.21 66.26Manipur 100.00 100.00 100.00 85.42 48.29Meghalaya 91.03 100.00 100.00 100.00 69.62Mizoram 91.43 100.00 100.00 100.00 64.78Nagaland 69.23 93.19 76.73 61.17 42.46Odisha 97.61 89.81 94.70 75.19 27.86Puducherry 82.17 83.74 82.77 84.85 70.53Punjab 87.24 99.48 91.89 88..35 63.24Rajasthan 82.81 94.25 86.82 78.83 50.88Sikkim 55.58 95.54 68.90 81.81 65.32Tamil Nadu 100.00 90.61 96.93 91.49 59.83Telangana 87.64 87.65 87.65 93.77 36.71Tripura 97.31 100.00 100.00 100.00 50.95Uttar Pradesh 82.38 75.00 79.78 67.96 45.41Uttarakhand 88.93 84.38 87.20 79.48 61.93WestBengal 85.03 96.50 89.24 79.38 54.37All States 88.07 91.33 89.24 76.47 45.92
*: Incomplete coverage. Age-specific enrolment ratio above 100 has been considered 100.

Patterns of Decline in Enrolment: Analysis of U-DISE 2016-17 Data76
viewoftheentiresystemwhereasthelevel-wiseenrolment ratio presents participation of children at a particular level of education. InGER, totalenrolment irrespective of the age is consideredwhileNERconsiderenrolmentofaparticularage-groupincorrespondinggrades.Ontheotherhand,ASERconsidertotalenrolmentofaparticularageorage-groupirrespectiveofthegradeinwhichachildisenrolled.Becauseofthedefinition,GERis considered as a crude indicator of enrolment andNER,animprovedversionoftheGERwhichisconsideredabitmorereliabletoviewchildrenparticipationataneducationallevel.However,itis theAdjusted-NERwhich givesmore reliablepicture about the participation and is considered betterthantheNER.Dependinguponthepurpose,an enrolment ratio is used.
Needless to mention that both enrolment and the relevantage-specificchildpopulationisrequiredtocalculatetheenrolmentratio.Whileenrolmentatdifferentlevelsofeducationisreadilyavailablefrom the U-DISE, the same is not true for theage-specificchildpopulation.Year-specificchildpopulationisrequiredtocompute theenrolmentratioinayearwhichisnotreadilyavailablefromthe Census sources. Till 2001 Census, it wasa regular practice to constitute a committee of experts to provide projected population but thesamebasedontheactual2011populationwasnotconstituted by the Office of the Registrar General of India inviewofwhichnoofficial projections areavailableintheabsenceofwhichitisnotaneasy task to compute enrolment ratios based onreliable child population. However, it may beobserved that even the Expert Committee didnot provide district-specific child population asit used to provide only state-specific populationin the absence of which it is difficult for thedistrict level officers to reliably computeenrolment ratios. In the absence of the Official Projections, the MHRD modified the Expert Committee Projections based up to the 2001 Census population (http://mhrd.gov.in/statistics-new?shs_term_node_tid_depth=385) and madeavailable state-wise projected child populationup to the year 2016.However, one of the otherpublicationsof theMHRD,namelyEducational
the Secondary enrolment to grow. Without thesignificant improvement in the efficiency of thePrimarylevelofeducationandtransitionfromtheElementarytoSecondarylevelofeducationinafewstates,IndiamaynotmovetowardsachievingthegoaloftheUniversalSecondaryenrolmentinthenearfuture.Ontheonehand,transitionrateisreasonablylow,ontheotherhand,ratioofGirlstoBoysenrolment at theSecondaryandHigherSecondary stage is also low (Table 47). Thereare5(Chandigarh,Gujarat,Haryana,PunjabandRajasthan)and3(Chandigarh,Gujarat,Haryana,PunjabandRajasthan)stateswhichhavearatioofgirls’toboys’enrolmentbelow0.80respectivelyattheSecondaryandHigherSecondarystageofeducation all which shows serious implicationsfortheSecondaryeducationtogrow.
Enrolment RatioDeclineinenrolmentpresentedabovehaveseriousimplicationfornotonlyinachievingthegoaloftheUniversalElementaryEducationbutalsoonthe Universal Secondary and Higher Secondarylevels of education.To further see its impact, avarietyof enrolmentbased indicatorshavebeenanalysed at Primary, Upper Primary, SecondaryandHigherSecondarylevelsofeducation.Toviewthe trends, first enrolment ratio at the all-Indialevel during the period 2012-13 to 2016-17 hasbeen analysed (Table 48).Thereafter, state-wiseenrolmentratiointhelatestyeari.e.2016-17hasbeenanalyzed(Table49).Gross Enrolment Ratio (GER), Net Enrolment Ratio (NER), Adjusted Net Enrolment Ratio (Adj-NER)andAge-specific Enrolment Ratio (ASER)havebeenanalysed.6to10+,11to13+,6to13+,14to15+and16to17+years age population is considered for obtaining correspondingage-specificenrolmentratioatthePrimary,UpperPrimary,Elementary, SecondaryandHigherSecondarylevelsofeducation.
Beforeweanalyse theenrolment ratio,meaningofthedifferenttypesofenrolmentratioisbrieflydiscussed. Enrolment ratio can be calculated for the entire school education (Grades I toXII) orforanindividuallevelsuchasthePrimary,UpperPrimary,SecondaryandHigherSecondarylevel.GER for the school education gives an overall

Implications for Universal Secondary Education in India 77
hasdeclined from105.98percent in2012-13 to95.12 percent in the year 2016-17. In one yearalone, the same is declined from 99.02 percentin2015-16to95.12percentin2016-17.AGERof 95.12 percent at the Primary level indicatethat95percentoftherelevantage-specificchildpopulation (6 to 10+ years) including those oftheover-ageandunder-agechildrenareenrolledin the corresponding grades i.e. Grades I to V.Remaining 5 percent children may be dropped out,neverenrolledorout-of-schoolormayevenafewofthembeenrolledinthenextimmediateleveli.e.UpperPrimaryLevel:GradesVItoVIII.Impact of decline in enrolment is also reflectedinNERwhich has declined from 87.14 percentin2015-16to83.62percentin2016-17.About4percent decline in NER by all means is considered significantandhasseriousimplicationforIndiatoachievethegoalofuniversalprimaryeducation.AnNERof83.62percentindicatethatalittleover16percentofthetotal6to10+yearsoldchildrenarenotenrolledinthecorrespondingGradesi.e.Grades I toVwhomayeitherbeoutof school,droppedout,neverenrolledorafewofthemmaybe enrolled in the next higher level. To knowmoreabout6to10+childrenenrolledinthenexthigher level,Adjusted-NER is computed whichcomesouttobe88.05percentwhichmeansthatthebalance12percentchildrenoftheage-group6to10+aretreatedasun-enrolled/out-of-ofschoolwhich are unless identified and brought to theeducation system, the goal of universal primaryenrolment may not be cherished in the near future. Age-specific Enrolment Ratio at the Primarylevel in 2016-17 comes out to be 88.07 percentwhichalsorevealsthat88percentchildrenof6+to 10+ age-group are enrolled but the same arenot necessarily be enrolled in the corresponding Grades I toV.Toachieve thegoalofUniversalPrimaryEnrolment,remaining12percentchildrenare to be brought under the education system.
OntheonehandenrolmentatthePrimarylevelofeducation has declined on the other hand during the same year i.e. 2016-17 enrolment in theGradeIaspresentedabovehasalsobeendeclinedsignificantlyallwhichwouldaffectandreflectedin both the absolute enrolment and enrolment ratio
Statistics - At a Glance, 2018 (http://mhrd.gov.in/sites/upload_files/mhrd/files/statistics-new/ESAG-2018.pdf) also presents 2017 provisionalprojected child population at the all-India levelbut the same is not used to estimate the enrolment ratio.Itmayalsobeoftheimportanttoobservethat NIEPA’s enrolment ratio published throughthe Flash Statistics for both the years, namely2015-16 and 2016-17 have been based on 2016childpopulationprovidedbytheMHRD(http://udise.in/Downloads/Publications/Documents/Flash_Statistics_on_School_Education-2016-17.pdf).IntheabsenceofprojectedchildpopulationfromtheOfficialsources,theauthorofthisarticlehas also made an attempt and made availableboththestate,aswellas,district-specificchildpopulation (https://www.educationforallinindia.com/census2011.html)which is based on actual2011Censussingle-agepopulationwhichisbeingusedbyanumberofStates&UTs,especiallyforcomputingdistrict-specificindicators.
To see the impact of declining enrolment on enrolment ratio, an attempt has been made tofirst present the same at the all-India level andthenatthestatelevel.Table48presentsavarietyof enrolment ratios for the year 2012-13, 2015-16 and 2017-18 at the all-India level. Table 48shows a clear impact of decline in enrolmenton enrolment ratio at different levels of schooleducation. As has already been shown abovethatenrolmentat thePrimary levelofeducationhas showna consistentdeclineover aperiodoftime; the highest been 137.10 million observedin2011-12andthelowest,123.81millionintheyear i.e. 2016-17 forwhich theU-DISE data isthelatestavailable.U-DISE2017-18datathoughcollected and submitted longbackbut the sameisyettobemadeavailableinthepublicdomain.Ashasalreadybeenmentionedabovethat2005-06was thefirstyearofunificationofDISEandSEMIS, since thenenrolment inPrimarygradesis declined by 10.97 million in a short period of four years i.e. in 2016-17. During 2015-16 and2016-17, primary enrolment is declinedby5.31millionwhichis4.12percentofthesameintheprevious year; thus causing significant declineinGER.GERat thePrimary level of education

Patterns of Decline in Enrolment: Analysis of U-DISE 2016-17 Data78
percent at the Secondary level as against only55.40 percent at the Higher Secondary level ofeducation compared to corresponding NER of 51.77 percent at the Secondary and 30.95 percent atHigherSecondarylevelallwhichsuggeststhata little less than 50 percent of the population is not enrolled in the corresponding Secondary grades. However,ASERreportedat theSecondarylevelis higher at 76.47 percent which means that agood number of children of the age-group 14+to15+yearsareenrolledinthelowergradesbutstillabout25percentchildrenaretermedasout-of-school. NER at the Higher Secondary levelin2016-17isaslowas30.95percentasagainst45.92percentASERwhichmeans thatabout69percent populationof the age-group16+ to17+yearsarenotenrolledinthecorrespondingGradesXI&XII.ASERat theHigherSecondary levelin2016-17reportedishoweverslightlyhigherat45.92whichmeansthatabout54percentchildrenoftheage-group16+to17+yearsarenotenrolledin any grade. It has also been observed thatenrolment ratio declines as we move from onelevelofeducationtoanotherwhichistrueforalltype of enrolment ratios.
State-specific enrolment ratio at the differentlevelsofeducationispresentedintheTables49and51whichreveals thatGERatPrimarylevelisabove90percentinmostofthestatesbutstillthere are a few states which have GER muchlower than the restof thestates.SuchstatesareChandigarh (80.07 percent), Jammu&Kashmir(77.09percent),Lakshadweep(70.02percent)andNagaland(81.67percent)allwhicharethesmallStates/UTsinthesize.Ontheotherhand,ashasalreadybeenreportedabove,NERatthePrimarylevelin2016-17attheall-Indialevelisobservedtobe83.72percentwhichindicatethatabout16percentchildrenof thecorrespondingage-groupare not enrolled inGrades I toV.Compared to83.62 percent NER at the all-India level, manystateshavemuch lowerNERallwhichseverelyaffecteffortsbeingmadeinIndiainachievingthegoalofuniversalprimaryenrolment.SomeofsuchstatesareAndhraPradesh(68.97percent),Gujarat(80.67percent),Haryana(80.67percent),Jammu& Kashmir (62.92 percent), Madhya Pradesh
inyearsthatfollows.Moresignificantly,declinein enrolment inGrade I in2016-17 is supposedtobereflectedinenrolmentinGradeVin2020-21,GradeVIIIin2023-24,GradeIXin2024-25andGradeXII in 2027-28. A look at theGERat theUpper Primary level of education revealsthatthesameisdeclinedto90.73percentin2016-17 from 91.82 percent in 2015-16 which maybe because of the decline in the Upper Primary enrolment by 1.51 million during the same period. A little above 9 percent children of 11+ to 13+yearsarenotenrolledinthecorrespondingGradesVItoVIIIbutmaynotbetreatedasout-of-schoolasafewofthemareenrolledinPrimaryclasseswhich is reflected in both the Adjusted-NERandAge-specificenrolmentRatioatthePrimarylevel of education presented above. Enrolmentin the Upper Primary classes is not a function of 11+ to13+yearpopulationasonly thePrimarygraduatescanbeadmittedinGradeVI.ANERof72.69percentattheUpperPrimarylevelin2016-17doesn’tsuggestthatIndiawouldachievegoaloftheUniversalElementaryeducationinthenearfuture. To move towards Universal Elementaryeducation,weneed to improveefficiencyof thePrimary education system to ensure that more and more primary graduates are produced as they only canbeenrolledinGradeVI.Adjusted-NERattheUpperPrimarylevel(82.00percent)alsosuggeststhatabout18percentchildrenof11+to13+yearspopulation are not enrolled either in the Primary or Upper Primary grades. On the other hand, a91.33percentASERat theUpperPrimary levelsuggests that 8.67 percent children of the age 11+to13+yearsareun-enrolled.SimilarpictureemergeswhenthedifferentenrolmentratiosattheElementary levelof education is analysedall ofwhich suggest that about 11 percent children oftheage6+to13+areyettobebroughtundertheumbrella of education.
InadditiontoPrimaryandUpperPrimarylevelsof education, enrolment ratio at the SecondaryandHigherSecondarylevelofeducationhasalsobeenanalysed(Table48&50)allwhichsuggestthatthegoalofUniversalSecondaryandHigherSecondary level of education is still a distantdream.U-DISE2016-17reportsaGERof79.35

Implications for Universal Secondary Education in India 79
whichmeans thatremaining54percentchildrenare treatedasun-enrolledwhichhasgot seriousimplications for the higher education level togrow.DeclineinGradeIandPrimaryandUpperPrimary enrolment during the year 2016-17wouldalsoimpactHigherEducationenrolmentinyearstofollow.GERof30percentattheHigherEducationlevelin2020cannotbeachievedunlesstheSecondaryeducationproduceadequatenumberof graduates and send them all to the HigherEducation level. Secondary Education levelwouldnotabletoachieveitunlesstheefficiencyoftheElementarylevelofeducationisimprovedto significant affect. Compartmentalization ofeducation may not produce results unless all the levels of education are considered together.In this direction, integration of the SSA andRMSAintheformofrecentlylaunchedSamagra ShikshaisawelcomestepprovidedthatplanningmethodologyismodifiedandadoptedacrosstheCountry to produce desired results.
Gross & Net Attendance RateApart from the U-DISE sources, the National Sample Survey Organisation (NSSO), Ministry of Statistics and Programme Implementation, Government of IndiaalsousedtogenerateGross(GAR)andNetAttendanceRates(NAR)throughitsdifferentroundsofsurveys;71thRound:2014-15 being the latest one. Needless to mention that information generated by the NSSO is being considered reliable. Other rounds on education beingthe52thRound:1995-96and64thRound:2007-08. Like the Official Statistics, both theGARandNARshowsimprovementoveraperiodof time (Table 52). However, the same like theU-DISE also shows a declining trend in GARincaseofPrimarylevelbutthesameisnottrueforUpperPrimary levelofeducationwhichhasshown consistent improvement both in case ofGAR and NAR during the same period. BoththeU-DISEandNSSOshowsthatmorechildrenin the schools now than in the past. However,estimate at the Elementary level of educationdoesn’t show much improvement. It remainedat97incaseofGARagainst87incaseofNARwhichsuggeststhatabout13percentchildrenof
(78.62percent),Rajasthan(78.84percent),UttarPradesh(78.58percent)andhostofothersmallerStatesandUTswhichincludesChandigarh(71.75percent),Daman&Diu(73.04percent),Nagaland(66.84percent)andSikkim(54.78percent).
State-specificGERandNERattheUpperPrimarylevel of education further reveals that the samebarringafewstatesislowerthanthesameatthePrimary level of education all which suggeststhat the goal of the universal elementary levelof education in India is still a far distant dream forwhich there is no option but to improve theefficiencyofPrimary levelof educationmaybethe only option. It is disheartening to observethat because of the enrolment drives and otherinitiatives enrolment in the recent past hasimproved but the system couldn’t able to retainallofthemandenrolmentduringtheyear2015-16to2016-17hasseenadrasticreductionbothintheabsoluteandratiotermswhichisalsoreflectedintheaverageannualdropoutrate(6.53percent)which is perhaps the highest in the recent pastwhich has got significant implications for therecently launched Samagra Shiksha.
Apart fromGERandNER, state-specificASERhasalsobeenanalysedfor6to10+,11to13+,6to13+,14to15+and16to17+age-grouppopulation(Table51).Attheall-Indialevel,itisobservedthatabout89percentchildrenoftheage-group6to13+areenrolled(GER,93.55percent&NER,89.24percent)whichalsorevealsthatabout11percentchildrenofthisage-groupareyettobeenrolled.However,thepercentageofsuchchildreninafewStates and UTs is much higher than at the national level.AfewstateswhichhavealowerASER(6to 13+ year: Elementary Level) are Chandigarh(82.74 percent), Himachal Pradesh (74.90percent), Jammu and Kashmir (67.34 percent),Nagaland(76.73percent),Sikkim(68.90percent)andUttarPradesh (79.78percent).On theotherhand,17stateshavereportedASERabovethe90percentcomparedtoalmostall thestateshavingreportedabove80percentASER.ButASERfortheage-groups14to15+and16to17+yearsisnot encouraging. Only 45.92 percent children of theage16to17+yeararereportedtobeenrolled

Patterns of Decline in Enrolment: Analysis of U-DISE 2016-17 Data80
from66to83duringthesameperiod.Further,ithasbeenobservedthatNARattheUpperPrimarylevelhassignificantlyimprovedfrom43in1995-96 to 63 in 2014-15. NSSO data further showsthattheparticipationratesvarybytheeconomic
the corresponding agegroupwerenot attendingtheschoolsasagainst10percentun-enrolledbasedontheU-DISEenrolmentdata.Betweentheyears1995-96to2014-15,GARatthePrimarylevelofeducationimprovedfrom85to101againstNAR
Table 52: NSSO Gross and Net Attendance Rates, 1995 to 2014
YearLevel
Primary Upper Primary Elementary
Gross Admission Rate
1995-96 85 65 -2007-08 104 84 972014-15 101 90 97
Net Admission Rate1995-96 66 43 -2007-08 84 59 862014-15 83 63 87
Table 53: Number of Schools by Category showing Decline in Enrolment in 2016-17
Scho
ol C
ateg
ory
Tota
l Num
ber
of S
choo
ls in
20
15-1
6
Scho
ols S
how
ing
Dec
line
in
Enr
olm
ent i
n 20
16-1
7
Num
ber
of G
over
nmen
t &A
ided
Sch
ools
in 2
015-
16
Gov
ernm
ent &
Aid
ed S
choo
ls
show
ing
Dec
line
in E
nrol
men
t in
201
6-17
%ag
e G
over
nmen
t Sch
ools
, 20
15-1
6
%ag
e G
over
nmen
t Sch
ools
sh
owin
g D
eclin
ing
Enr
olm
ent
to to
tal G
over
nmen
tSch
ools
Num
ber
of P
riva
te S
choo
ls
in 2
015-
16
Priv
ate
Scho
ols s
how
ing
De-
clin
e in
Enr
olm
ent i
n 20
16-1
7
%ag
e Pr
ivat
e Sc
hool
s sho
win
g D
eclin
ing
Enr
olm
ent t
o to
tal
Priv
ate
Scho
ols
Primary Only 840546 468545 55.74 728585 415486 86.68 88.68 111961 53059 47.39
Primarywith UpperPri-mary 282080 159840 56.66 184255 113566 65.32 71.05 97825 46274 47.30
PrimarywithUpperPri-mary&Secondary&HigherSec-ondary
41173 20104 48.83 14408 5747 34.99 28.59 26765 14357 53.64
UpperPri-maryOnly 147544 83227 56.41 129857 73783 88.01 88.65 17687 9444 53.40
UpperPri-marywithSecondary&HigherSec-ondary
35782 21443 59.93 29663 18044 82.90 84.15 6119 3399 55.55
PrimarywithUpperPri-mary&Sec-ondary
49400 22562 45.67 15179 7918 30.73 35.09 34221 14644 42.79
UpperPri-marywithSecondary 52553 26426 50.28 41501 21581 78.97 81.67 11052 4845 43.84
Secondary Only 37586 19547 52.01 24694 13645 65.70 69.81 12892 5902 45.78
SecondarywithHigherSecondary 22654 12939 57.12 15283 9017 67.46 69.69 7371 3922 53.21
HigherSec-ondary only 13028 5205 39.95 5162 2491 39.62 47.86 7866 2714 34.50
All Schools 15,22,346 8,39,838 55.17 1188587 681278 78.08 81.12 333759 158560 47.51

Implications for Universal Secondary Education in India 81
inenrolment in2016-17over thepreviousyear,whiledoingsoonlycommonschoolshavebeenconsidered. This has been analysed separately for theGovernmentschools includingtheAidedschools and Private schools which includesUnaided and Unrecognised schools as well asthe recognized and unrecognised Madrassa. Ashasalreadybeenreportedabovethatasmanyas15,22,346schoolswerecoveredundertheU-DISEin 2015-16 of which 8,39,838 schools (55.17percent);morethanhalfofthetotalschoolshaveshown a decline in enrolment in 2016-17 overthe previous year. Percentage of decline in theenrolmentbyschoolcategoryfurtherrevealsthatdeclineisirrespectiveoftheschoolcategoryandthehighestdeclineof59.93percentisobservedincaseofUpperPrimarywithSecondary&Higher
status.SincetheNSSORoundislatestavailablefor year 2014-15, it is not possible to knowwhether the declining trend in the enrolment ashasbeenobservedbasedon theU-DISEdata isalso truefor theattendancerate?However thereisadifferencebetweenGERandGARandNERandNAR.GERandNERpresentspercentageofchildrenofanagegroupenrolledwhiletheNARandGARpresentspercentageofthechildrenofanagegroupactuallyattendingschoolswhichmaybe considered a better indicator of participation of children in an educational programme.
Number of Schools showing Decline in EnrolmentAn effort has also been made to analyse thenumberof schools by category showingdecline
Patterns of Decline in Enrolment: Analysis of U-DISE 2016-17 Data
104
Figure 21
at 97 in 2007-08 incaseofGARagainst87 incaseofNARwhichsuggests thatabout13
percentchildrenofthecorrespondingagegroupwerenotattendingtheschoolsasagainst10
percent un-enrolled based on the U-DISE enrolment data.Betweentheyears1995-96 to 2014-
15,GARatthePrimarylevelofeducationimprovedfrom85to101againstNARfrom66to
83duringthesameperiod.Further,ithasbeenobservedthatNARattheUpperPrimarylevel
has significantlyimprovedfrom43in1995-96 to 63 in 2014-15.NSSOdatafurthershowsthat
theparticipationratesvarybytheeconomicstatus.SincetheNSSORoundislatestavailable
for year 2014-15,itisnotpossibletoknowwhetherthedecliningtrendin the enrolment as has
beenobservedbasedontheU-DISEdataisalsotruefortheattendancerate?Howeverthereis
adifferencebetweenGERandGARandNERandNAR.GERandNERpresentspercentage
of children of an age group enrolledwhile theNAR andGAR presents percentage of the
childrenofanagegroupactuallyattendingschoolswhichmaybeconsideredabetterindicator
of participation of children in an educational programme.
Figure 22
85
65
10484
10190
0
20
40
60
80
100
120
Primary Upper Primary
Gross Admission Rate : 1995 to 2014(NSSO)
1995-96 2007-08 2014-15
66
43
84
59
83
63
0
20
40
60
80
100
Primary Upper Primary
Net Admission Rate : 1995 to 2014(NSSO)
1995-96 2007-08 2014-15
Figure 21
Figure 22
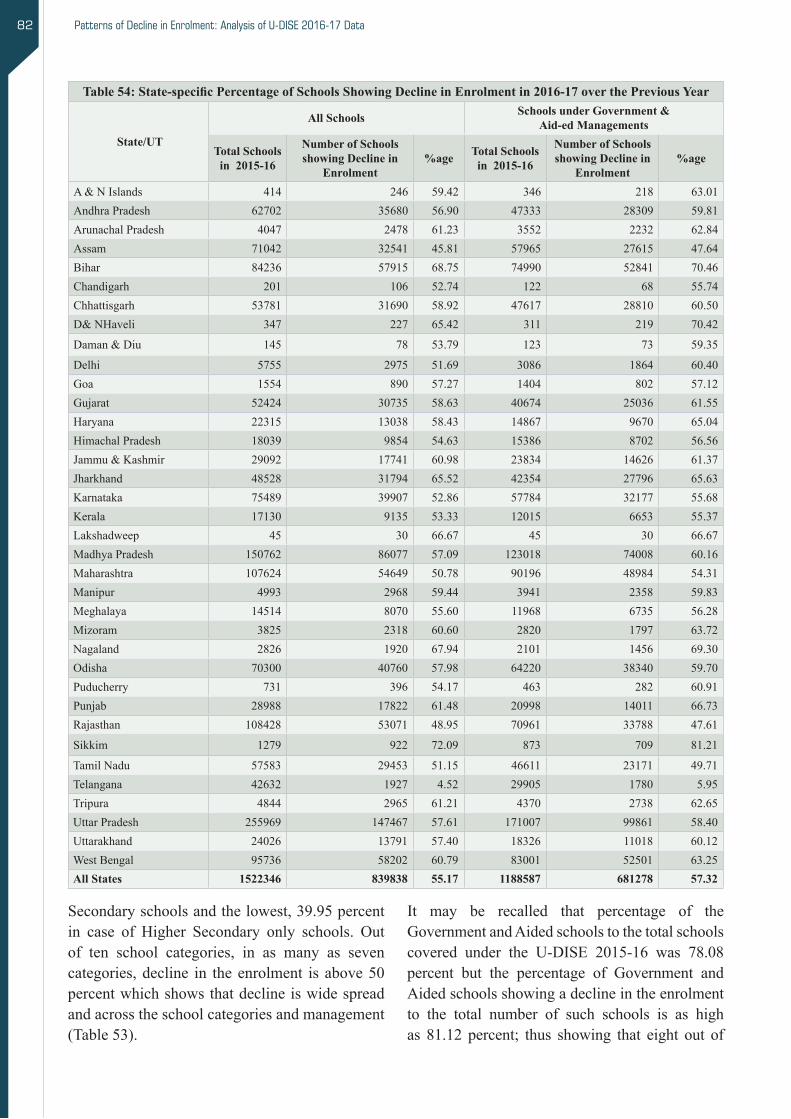
Patterns of Decline in Enrolment: Analysis of U-DISE 2016-17 Data82
Table 54: State-specific Percentage of Schools Showing Decline in Enrolment in 2016-17 over the Previous Year
State/UT
All Schools Schools under Government & Aid-ed Managements
Total Schools in 2015-16
Number of Schools showing Decline in
Enrolment%age Total Schools
in 2015-16
Number of Schools showing Decline in
Enrolment%age
A&NIslands 414 246 59.42 346 218 63.01AndhraPradesh 62702 35680 56.90 47333 28309 59.81ArunachalPradesh 4047 2478 61.23 3552 2232 62.84Assam 71042 32541 45.81 57965 27615 47.64Bihar 84236 57915 68.75 74990 52841 70.46Chandigarh 201 106 52.74 122 68 55.74Chhattisgarh 53781 31690 58.92 47617 28810 60.50D&NHaveli 347 227 65.42 311 219 70.42
Daman&Diu 145 78 53.79 123 73 59.35
Delhi 5755 2975 51.69 3086 1864 60.40Goa 1554 890 57.27 1404 802 57.12Gujarat 52424 30735 58.63 40674 25036 61.55Haryana 22315 13038 58.43 14867 9670 65.04HimachalPradesh 18039 9854 54.63 15386 8702 56.56Jammu&Kashmir 29092 17741 60.98 23834 14626 61.37Jharkhand 48528 31794 65.52 42354 27796 65.63Karnataka 75489 39907 52.86 57784 32177 55.68Kerala 17130 9135 53.33 12015 6653 55.37Lakshadweep 45 30 66.67 45 30 66.67Madhya Pradesh 150762 86077 57.09 123018 74008 60.16Maharashtra 107624 54649 50.78 90196 48984 54.31Manipur 4993 2968 59.44 3941 2358 59.83Meghalaya 14514 8070 55.60 11968 6735 56.28Mizoram 3825 2318 60.60 2820 1797 63.72Nagaland 2826 1920 67.94 2101 1456 69.30Odisha 70300 40760 57.98 64220 38340 59.70Puducherry 731 396 54.17 463 282 60.91Punjab 28988 17822 61.48 20998 14011 66.73Rajasthan 108428 53071 48.95 70961 33788 47.61
Sikkim 1279 922 72.09 873 709 81.21
Tamil Nadu 57583 29453 51.15 46611 23171 49.71Telangana 42632 1927 4.52 29905 1780 5.95Tripura 4844 2965 61.21 4370 2738 62.65Uttar Pradesh 255969 147467 57.61 171007 99861 58.40Uttarakhand 24026 13791 57.40 18326 11018 60.12WestBengal 95736 58202 60.79 83001 52501 63.25All States 1522346 839838 55.17 1188587 681278 57.32
It may be recalled that percentage of the GovernmentandAidedschoolstothetotalschoolscovered under the U-DISE 2015-16 was 78.08percent but the percentage of Government andAidedschoolsshowingadeclineintheenrolmentto the total number of such schools is as high as 81.12 percent; thus showing that eight out of
Secondaryschoolsandthelowest,39.95percentin case of Higher Secondary only schools. Outof ten school categories, in as many as sevencategories,decline in theenrolment is above50percentwhichshowsthatdeclineiswidespreadand across the school categories and management (Table53).

Map 10
INDIANumber of Schools Showing Decline in Enrolment
Government & Aidied ManagementsU-DISE 2016-17
CHANDIGARH55.74(68)
JAMMU & KASHMIR61.37
(27796)
HIMACHAL PRADESH56.56
(8,702)PUNJAB66.73
(14,011)
RAJASTHAN47.61
(33,788)
MADHYA PRADESH60.16
(74,008)CHHATTISGARH
60.50(28,810)
JHARKHAND65.63
(27,796) WEST BENGAL63.25
(52,501)
BIHAR70.4652,841
SIKKIM81.21(709)
MEGHALAYA56.28
(6,735)
ASSAM47.82
(27,615)NAGALAND
69.30(1,456)
ARUNACHAL PRADESH62.84
(2,232)
MANIPUR59.83
(2,358)
MIZORAM63.72
(1,797)TRIPURA62.65
(2,738)
ODISHA59.70
(38,340)MAHARASHTRA54.31
(48,984)
DAMAN & DIU59.35(73)
GUJARAT61.55
(25,039)
DADRA & NAGAR HAVELI
70.42(219)
A R A B I A N S E A
GOA57.12(802)
B AY O F B A N G A L
KERALA55.37
(6,653)
KARNATAKA55.68
(32,177)
ANDHRA PRADESH59.81
(28,309)
TELANGANA5.95
(1,780)
PUDUCHERRY60.91(282)
LAKSHADWEEP66.67(30)
TAMIL NADU49.71
(23,171)
AND
AMAN
AND
NICO
BAR ISLAND
S
63.01
(218)P e r c e n t a g e
DELHI60.40
(1,864)
UTTARAKHAND60.12
(11,018)
UTTAR PRADESH58.40
(99,861)
5.95 - 30.00
30.01 - 60.00
60.01 - 70.00
70.01 - 81.21
HARYANA65.04
(9,670)
ALL INDIA: 57.32 (681278)Figures in Bracket is No. of School
Note: Map not to scale Disclaimer: The boundaries and the names used in the maps are only a visual representation and do not determine the legal boundary position.

Patterns of Decline in Enrolment: Analysis of U-DISE 2016-17 Data84
declineinenrolmentonlyinits1,927schoolsandpercentage of such schools (4.52 percent) is thelowestacross theCountrywhich is true forbothall schools and schools run by the GovernmentandAidedmanagements.Surprisingly,30(66.67percent)outofatotal45schoolsinLakshadweeptooexperiencedadeclineinenrolmentin2016-17.
Decline in so many schools across the Country and that too across school categories must be an important area of concern but as its seems that the sameisnottakenseriouslyandhasnotgenerateddebateasthesamehasgotwidespreadimplicationsforIndiainachievingthegoalofuniversalschooleducationwhichmaybetreatedasajolttowardsachievingUEE.Significantdeclineinenrolmentmay also have had raised issues concerningincentives being provided to the students in therecent past. Is the decline in enrolment across the Country is due todemographic transitionwhichistakingplaceorthesameisalsobecauseofthefake, duplicate or over reporting of enrolmentwhichmighthavehappenbecauseofthedetailedstudentdatacollection in-syncwith theU-DISEinitiatedduringtheyear2016-17;in-depthstudiesat the grassroots levels, if initiated may throwmore light on real reasons behind decline or enrolmentstatisticsisnowmorerealistic?
Concluding ObservationsAs has been presented above that one of fewimportant indicators which have got directrelevance on the universal secondary enrolmentare enrolment ratio and transition rate.Both theGrossandNetenrolmentratiosarelowat79.35and 51.77 percent at the Secondary and 55.40 and 30.95 percent at the Higher Secondary level ofeducation.Even though enrolling all children isanecessaryconditionbutthesufficientconditionisthatwhosoeverenterintotheeducationsystemmust continue and transit from one level to thenext levelofeducation.The transitionrate fromthe Elementary to Secondary level is as highas 90.32 percent,which is even higher than thetransitionfromthePrimarytoUpperPrimarylevelofeducation(88.56percent)but thesameisnottruefor transitionfromtheSecondarytoHigherSecondarylevelofeducationwhichisaslowas
every ten schools imparting school education inthe Country have shown a decline in enrolmentin2016-17.Asmanyas6,81,278(81.12percent)schoolsoutofthetotal11,88,587GovernmentandAidedschoolshaveshownadeclineinenrolmentin 2016-17. Further, it has been observed thatdecline in enrolment is wide spread across theGovernment and Aided schools and is true formost of the school categories.The lowest 35.09percentdeclineisobservedincaseofPrimarywithUpper Primary and Secondary schools and the highest,88.65percentisobservedincaseofUpperPrimary only schools having Government andAidedmanagements.Further,ithasbeenobservedthatnotonly schoolsunder theGovernmentandAidedmanagementshaveshownadeclinebutagoodnumberofschools(1,58,560schools,47.51percent)under thePrivatemanagements toohadexperienced a decline in enrolment in 2016-17over thepreviousyear i.e.2015-16;howeverthepercentageofsuchschoolsismuchlowerthanthesameincaseoftheGovernmentandAidedschools.Thenumberofschoolsbycategoryfurthershowsthat the majority of schools having experienceddecline in enrolment are the Primary only schools (4,68,545 schools, 55.79 percent) which is alsotruefortheGovernment(4,15,486schools,60.99percent) and Private schools (53,059 schools,33.46percent).
State-wise distribution of schools further revealsthat inasmanyas33states, percentagedeclinein enrolment is above 50 percent of the totalschools which is true for both all schools ingeneral and Government and Aided schools inparticular (Table 54). The highest 72.09 percentschoolswhichexperiencedadeclineinenrolmentisobserved tobe inSikkimwhichhadonly922schools in 2015-16 compared to which declineisobservedinasmanyas57,915schools(68.75percent) in Bihar compared to 86,077 schools(57.09 percent) in Madhya Pradesh, 1,47,467schools (57.61percent) inUttarPradesh.58,202schools (60.70 percent) inWest Bengal, 54,649schools (50.78 percent) in Maharashtra, 39,907schools(52.86percent)inKarnatakaetc.majorityofwhicharetheGovernmentandAidedschools.However, it isTelanganawhichhadexperienced
Implications for Universal Secondary Education in India 85
61.73percentandisalsoevidentinthelowpasspercentage,especiallyincaseofSC,STandOBCstudents.HightransitionfromtheElementarytoSecondarylevelandlowgrossandnetenrolmentratioattheSecondarylevelofeducationindicatethatelementarylevelofeducationisnotprovidingenough elementary graduates to the first gradei.e. Grade IX of the next stage. Even thoughGERandNERisquitehighatthePrimarylevelof education but the same is not true for Upper Primarylevelofeducationdespitehightransitionrate from Primary to Upper primary level ofeducation.ThemainreasonwhySecondarylevelis not receiving enough number of elementarygraduates is because of the low efficiency ofPrimary education system. Total enrolment in theprimaryclasseswas134.78millionin2012-13 which has gone down to 121.81 million in2016-17;thusshowingadeclineof12.97million(9.62 percent). Preliminary U-DISE 2017-18data further shows a decline (0.37 million) butthe same is onlymarginal (250.97million totalenrolment in Grades I to XII in 2017-18). Theaverageannualdrop-outrateatthePrimarylevelis around 6.35 percent (Boys, 6.40 percent &Girls,6.30percent)comparedtowhichthesameis slightly lower at the Upper Primary level ofeducation (All,5.67percent,Boys,4.97percentand Girls 6.42 percent). An average of 6.35percentannualdrop-outrateatthePrimarylevelotherwiseindicatesthatoveraperiodoffiveyears,roughlyabout25percentchildrenthosewhohadenrolledinGradeIcouldn’tabletoremaininthesystemwhichisalsoreflectedinretentionrateatthePrimary(84.21percent)andElementarylevelofeducation(70.70percent).Comparedtodrop-outrateatthePrimaryandUpperPrimarylevelsofeducation,drop-outrateattheSecondarylevelofeducationishighat22.13percent(Boys:22.11percent & Girls: 22.15 percent). However, thesame isalsohighat theHigherSecondary levelofeducationbutabitlowerthanattheSecondarylevel of education; Total, 13.09 percent, Boys,13.18percent&Girls,12.98percent).Grade-wisedrop-outrateinthePrimarygradesfurtherrevealsthat it is thehighest inGradeV (10.99percent)comparedto9.30percentingradeVIIIand13.09
percent in Grade XI. In addition, steep declinein enrolment in the Primary classes in the recent yearwouldalsoeventuallyaffectUpperPrimary,Secondary and Higher Secondary enrolment togrowinyearswhichfollow.Thus,unlessefficiencyof the Primary education system is improvedsignificantly,neitherthegoalofuniversalPrimarynorElementarylevelofeducationislikelytobeachieved in thenear future.Unless thathappen,wemaynotmovetowardsachievingthegoalofthe Universal Secondary Education. Researchstudiesmustbe initiated tofindout real reasonsof decline in enrolment as the present report could study only the pattern in decline in enrolment.
Perhapsthetimehascometoreverttothetraditionalmode of district planning rather than focus on the parameter/excel based mechanical planning whichhasgotthelimitedacademicflavor.Perhapsthe time has come to rejuvenate the DistrictPlanningTeamsandmakethemfullyfunctional.Generally only one or two officials observed tobe seen involved in the plan formulation mostof them are the State MIS Coordinators. In the DPEP and also during the initial stage of Sarva Shiksha Abhiyan,theexerciseofplanformulationwasintensivewhichwasusedtobefollowedbyan external critical appraisal at the state levelwhich had component to visit districts, blocksand schools. Being amember of such appraisalmissions a number of times, thewhole exercisewas founduseful toboth thestateandappraisalteams deputed from the national level. Itwas agood opportunity to see the realities and the actual implementationatthegrassrootslevel.TherewasalsoaprovisionfortheLeaderoftheAppraisalMissionanditsMembers(about8to10members)tosharethefindingsoftheMissionatthenationallevelwhichwasusedtobechairedbynoneotherthan the Secretary (SchoolEducation),Ministryof HRD. Heated academic debates during suchmeetingswerefoundtobeusefulandencouraging.
In the recently launched Samagra Shikshawhichis a flagship programme of the Government ofIndiahasprovision toset theannualcumulativetarget values on a verity of critical indicators(results framework) from enrolment ratio to
Patterns of Decline in Enrolment: Analysis of U-DISE 2016-17 Data86
retention & transition rates to the achievementlevels at the state level.Hope this exercisewillbefirstundertakenatthedistrictandlowerlevelswithoutwhichthestateleveltargetsmaynotbeaneasytasktofix.Dothestateshavesuchexpertiseatthedistrictleveltofixrealistictargets?Itmaybe recalled that in the beginning of SSA, statesusedtohavetargetsontheGER,NER,Transitionrates and host of the other parameters but the same couldneverbeachievedastheygenerallywerenotfixedscientificallyandinmostofthecasestherewerenodisaggregatedtargets.Exerciseoffixingtargetsannuallyendedintheyear2009,whentheCountry enacted The Right of Children to Free andCompulsoryEducationActon4August2009.Sincethen,wedonothaveaprovisiontofixtheannualtargetsat thedistrict levelbuttoidentifyout-of-school children, train them and makethem all to sit in the age appropriate grades. The nationalinstitutionslike,NIEPA,ifinvolvedcanplay an important role in the capacity building of thedistrictandstatelevelofficersinformulatingdistrict plans under the banner of SamagraShiksha asitwasactivelyinvolvedintheinitialperiodofSSAandduringtheentireperiodofDPEP.
Implications for Universal Secondary Education in India 87
References
1. All India School Education Survey: 8th Survey (NCERT, New Delhi):AConciseReport, Janary2016(http://ncert.nic.in/pdf_files/8th_AISES_Concise_Report.pdf)
2. District Information System for Education (NIEPA, New Delhi):http://udise.in
3. Mehta,ArunC. (1993):A Note on Educational Statistics in India,Journal of Educational Planing and Administration;7(1);(January):105-18
4. Mehta,A.C.(1996):Reliability of Educational Data in the Context of NCERT Survey. Journal of Educational Planning and Administration,10(3)(July):281-307
5. Mehta,ArunC(1997):Education Information System in India its Limitations: Suggestions for Improvement, Journal of Indian Education,VolumeXXIII, No. 2,August, 1997, NCERT, NewDelhi
6. Mehta,ArunC(2002):Can There be Alternative Indicators of Enrolment: A Critical Review of Frequently Used Indicators, ESCAP Statistical Newsletter, No.125,April 2002, Bangkok (Thailand)
7. Mehta,ArunC(2003):Can the Goal of Universal Secondary Education be Achieved in the Near Future?,Journal of Educational Planning & Adminstration,July2003,NIEPA,NewDelhi
8. Mehta,ArunC(2013):Status of Secondary Education in India: A Note based on DISE 2012-13 Data,Mimeo,NIEPA,NewDelhi
9. Mehta,ArunC(2017):Strengthening Educational Management Information System in India through U-DISE: A Story of its Evolution,paperpresentedinComparative & International Education Society Annual Conference(CIES)2017heldatAtlanta(USA)duringMarch5to9, 2017,Atlanta,USA)
10. MinistryofHRD(2013):Report of the Expert Group Unified System of School Education Statistics,GovernmentofIndia
11. Ed. CIL (Ministry of HRD) & Social & Rural Research Institute (IMRB): 2014,National Sample Survey of Estimation of Out-of-School Children in the Age 6-13 in India, NewDelhi
12. Ministry of HRD (1918): Samagra Shiksha Abhiyan, An Integrated Scheme for School Education: Framework for Implementation,http://samagra.mhrd.gov.in/
13. MuchkundDubey,AshokPankaj&SusmitraMitra(1918):Still too many Children Out of School, The Hindu, September 4 (https://www.thehindu.com/opinion/op-ed/still-too-many- children-out-of-school/article24857149.ece)
14. National Sample Survey Organisation: Reports of 52nd, 64th and 71th Round,Ministry of StatisticsandProgrammeImplementation,GovernmentofIndia
15. School Report Cards(NIEPA):http://schoolreportcards.in
16. U-DISE Reporter Module(NIEPA,NewDelhi):http://14.139.60.146/ReporterModule/Repor Module/Startup/Startup.aspx
Patterns of Decline in Enrolment: Analysis of U-DISE 2016-17 Data88
ABOUT THE AUTHOR
Prof. Arun C. MehtaProfessor & Head
Department of Educational Management Information SystemNIEPA, New Delhi
Ph.D. (Demographic Projections) from the University of Rajasthan, Jaipur; specialist in EMIS,Quantitative Techniques and Projections and Forecasting of Educational Data; authored books onEducationforAllinIndia,EnrolmentProjections,PopulationProjectionsandUpperPrimaryEducationand contributed a number of research articles in journals and inNUEPAOccasional Paper Series;publishedanumberofreportsannuallybasedonDISEdata;presentedpapersbothattheOxfordandCambridgeUniversities,ConsultedbyWorldBank,UNICEF,UNESCOandACCU(Japan),TrainedatUNESCORegionalOfficeatBangkokandHarvardInstituteofInternationalDevelopment,USA.
WasactivelyengagedinstrengtheningofEducationalManagementInformationSysteminIndiaduring2001to2017(January)atthenationallevelandmanagedoneoftheWorld’slargestinformationsystemsi.e.DistrictInformationSystemforEducation(DISE/U-DISE).
http://schoolreportcards.in&www.udise.indevelopedundertheguidanceofProf.Mehtaistherecipientofe-Governance2010&eINDIA2010NationalAwards&ManthanAwardSouthAsia2010&EMPI-IndianExpressIndianInnovationAward2012.
www.educationforallinindia.comwww.dise.inwww.udise.inwww.schoolreportcards.in
ACKNOWLEDGEMENT
TheAuthoristhankfultoDISEProjectStaffatNIEPA,especiallyMs.AparnaMookerjee,Mr.JameelAliChishti,Ms.ShakunSethi.Mr.ArunJoshi,Mr.JayPrakashGuptaandMr.DeepeshKumarfortheirhelpwithoutwhichitwasnotpossibletoundertaketheanalysisofdata.