pathways to a low-carbon economy for brazil
TRANSCRIPT

• a •
PATHWAYS TO A LOW-CARBON ECONOMY FOR BRAZIL
Pathways to a Low-Carbon Economy for Brazil

• 1 •
Preface
Leaders in many nations are currently discussing ambitious
targets for reducing emissions of greenhouse gases (GHGs) in order
to mitigate the serious impact of climate change on the environment,
human societies, and our economies. Many scientists and policy
makers believe that limiting the rise in global mean temperatures below
2 degrees Celsius is an important aim, as they see this as a threshold
where the implications of global warming become very serious.
Aiming to contribute to these discussions, McKinsey & Company has
undertaken a global effort to provide a fact base on what technical levers
exist to achieve abatement from the projected base case of emissions,
and at what cost. The global work concluded that the implementation
of some 200 initiatives across ten major economic activities and 21
regions has the potential to reduce these admissions by 55 percent, at
a cost of less �60 per tonne of CO2e1 or even 70 percent with higher
cost initiatives or by sequestering atmospheric carbon.
The following report focuses on what the challenge is for Brazil to play
its part in this process of abating carbon emissions. Not surprisingly,
it identifies reducing deforestation and emissions from the agriculture
sector as the main sources of abatement, representing 85 percent of
the abatement potential in the country.
A particular challenge for the taskforce was the quantification of what
it would cost to effectively stop deforestation by 2030, especially in the
Amazon biome.
It is not our intention to point the way to a specific path to solve a
problem as complex as this one. Our contribution consists of compiling
the works of numerous experts who have been studying this theme
for decades, and public managers who have the practical job of facing
this challenge, to develop a systemic approach for addressing the
issue. This approach is anchored on strengthening the institutions and
monitoring and control mechanisms, on creating incentives to develop
and grow sustainable forestry activities, and investments to create
1 CO2e means “carbon dioxide equivalent”, a standard unit used to measure GHGs and methane. Emissions are measured in metric tonnes of CO2e per year or multiples such as million (MtCO2e) or billion (GtCO2e) metric tonnes.

• 2 •
formal jobs and improve the human development indices in the Amazon
region. We are making the results of this modelling effort, including the
cost and the impact associated with each of the numerous initiatives,
available to the public as our contribution to advance the discussion
of these themes.
The conclusions in this report confirm Brazil’s potential to take a
leading role in the global fight against climate change.
In addition to contributing by eliminating deforestation, because it has
a large landmass that is either degraded or is not productive, Brazil
has the capability to implement a broad scale reforestation program
it can use for atmospheric carbon sequestration. When the global
carbon sequestration markets are sufficiently developed to remunerate
such reforestation programs more amply, Brazil would be the natural
destination for this new industry and could serve as a global carbon
reservoir.
This study intentionally avoids any assessment of specific policies and
regulatory choices. Instead, its purpose is to provide an objective and
uniform set of data that can serve as a starting point for corporate
leaders, academics and policy makers when discussing how best to
achieve emission reductions in Brazil.
Stefan Matzinger

• 3 •
Introduction
According to the World Resources Institute2, Brazil is the 4th largest greenhouse gas (GHG)
emitter in the world but, looking forward to 2030, it is also one of the 5 countries with the largest
potential to reduce such emissions. Its leading role in global climate change has then a number
of implications, as well as creating significant opportunities.
The numerous issues related to these opportunities must be debated by various groups
within Brazilian society – business, the government, regulatory bodies and non-government
organizations. Sixty initiatives account for 10 percent of the potential abatement in Brazil, and
have been identified as having a negative costs or, in other words, the associated savings would
be larger than the costs. Of the remaining 70 initiatives, 80 percent of the abatement potential
would cost less than �10 per tonne of CO2e (tCO
2e) , much less than the value of a tonne of CO
2e
traded in the international carbon credit market. Implementing these initiatives, however, will
require significant effort, from creating a low carbon culture and a regulatory framework through
investments that would need encouragement in the form of legislation, or with this country’s
increased involvement in the global carbon trading markets.
Within this context, the purpose of McKinsey & Company’s report is to identify and quantify
the impact and cost of each of the initiatives Brazil can use to contribute to the global climate
change agenda. This document is organized into the following chapters:
1. Summary of the main results
2. The Brazilian base case
3. Details of the emissions and abatement opportunities by sector
4. Implications for the Country
Appendix 1 – Model approach
Appendix 2 – How to read the abatement curve
Appendix 3 – Calculating implementation cost of avoiding deforestation
2 World Resources Institute is a Washington, D.C. based environmental research institute created in 1982.

• 4 •
PATHWAYS TO A LOW-CARBON ECONOMY FOR BRAZIL
1. Summary of the main results – Brazil has an important
role to play in reducing global Greenhouse gas emissions
Globally, in 2005 around 45 gigatonnes of CO2 equivalent (GtCO
2e) were emitted into the
atmosphere. According to the global McKinsey study3 that looked at current emissions and their
projected growth, by 2030 emissions under a business-as-usual4 (BAU) scenario are expected
to reach 70 GtCO2e. The study built a database of over 200 opportunities for GHG abatement
distributed across 10 economic sectors and 21 world regions.
Our global analysis reveals that we can reduce emissions from 70 to 32 GtCO2e by taking a
number of globally coordinated initiatives, with a cost of up to �60 per GtCO2e (Figure 1) An
additional 9 GtCO2e could come from either more costly technical measures (above �60 per
GtCO2e), from significant behaviour changes, or carbon sequestration from intense reforestation
programs or other alternative techniques. Theoretically, capturing all this potential would mean
emission levels that are broadly consistent with an emission pathway that, according to the
Intergovernmental Panel on Climate Change (IPCC), would result in an average increase in the
global temperature of less than 2 degrees Celsius.
Figure 1
3 “Pathways to a Low-Carbon Economy - Version 2 of the Global Greenhouse Gas Abatement Cost Curve”, McKinsey & Company, 2009.
4 The McKinsey & Company report uses BAU (business as usual) as terminology for the base case.
102005 25
Global greenhouse gas emissionsGtCO2e/year
2015 2030
Evolution in global greenhouse gas emissions
Base case
Global abatement opportunities< €60/t CO2e
Global abatement opportunities (€60–100/t CO2e) and behavior changes(high level estimates)
-9 (20%)
70
32
-38 (80%)
23
Evolution required to keep temperature increase below 2ºC
Peak at 550 ppm, long-term stabilization at 550 ppmPeak at 550 ppm, long-term stabilization at 550 ppm
Peak at 550 ppm, long-term stabilization at 550 ppm
Concentration of CO2e in the atmosphere
Note: As a reference, 1990 total emissions were 36 GtCO2e
SOURCE: Global GHG Abatement Cost Curve v2.0; Houghton; IEA; IPCC; den Elzen; Meinshausen; OECD; US EPA; van Vuuren
0
10
20
30
40
50
60
70
• 5 •
PATHWAYS TO A LOW-CARBON ECONOMY FOR BRAZIL
Within this context, Brazil has a relevant role to pay as it is responsible for 5 percent of the current GHG emissions and will be responsible for 4 percent of the estimated 2030 emissions, or 2.8 GtCO
2e. Unlike more industrialized nations and the global norm, the main source of
emissions in Brazil is the forestry sector. Deforestation alone is responsible for 55 percent of this country’s current GHG emissions and will be responsible for 43 percent in 2030. This very significant negative impact of the forestry sector is partially compensated by the low emissions of Brazil’s power sector, as most of the power in Brazil comes from large hydroelectric plants. In addition, ethanol penetration in the vehicle fleet is quite high.
Nevertheless, at 12 tCO2e per capita emission, Brazil is comparable to industrialized nations in
Europe, where per capita emissions are around 10 tCO2e per capita. If we exclude the forestry
sector, Brazilian per capita emissions drop to 5 tCO2e, which would bring this country down
to the level of low/moderate emitters. However, as the Brazilian economy grows, so will the intensity of its GHG emissions, reaching a projected 14 tCO
2e per capita in 2030, or 7.5 tCO
2e
per capita if we leave out the forestry sector. In short, Brazil’s emissions are already above the global average and, looking forward, even if we eliminate emissions from the forestry sector, they would remain relatively high.
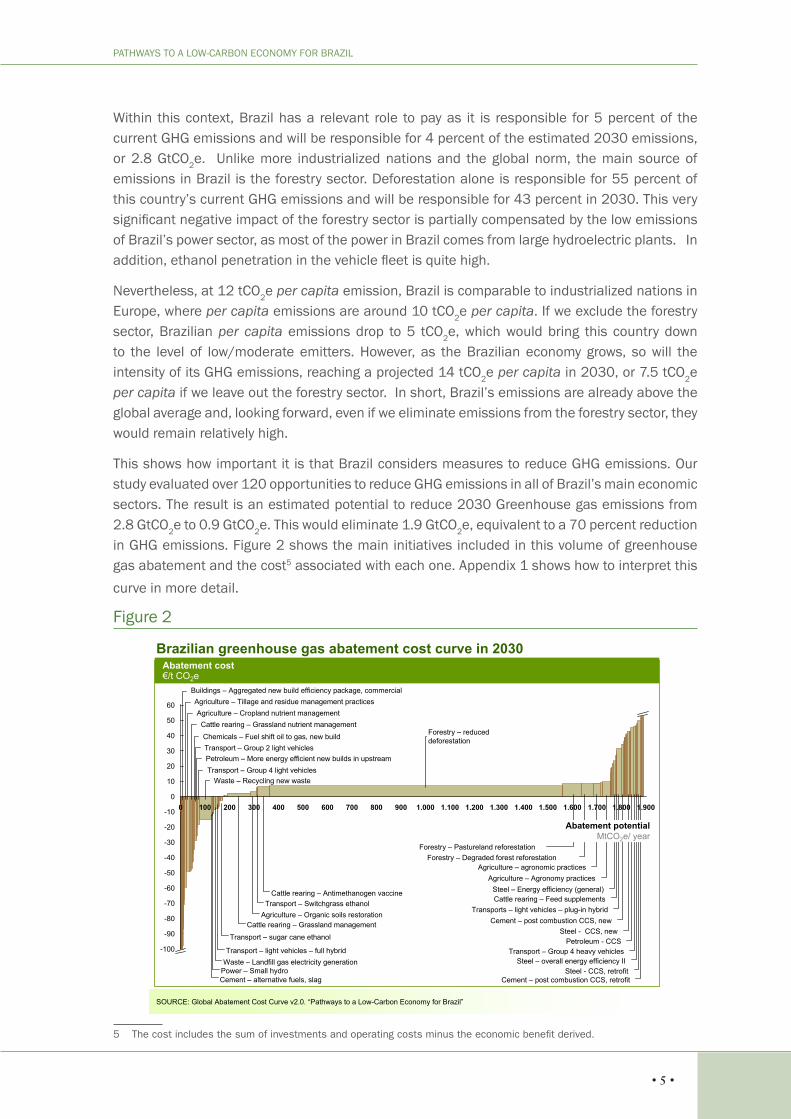
This shows how important it is that Brazil considers measures to reduce GHG emissions. Our study evaluated over 120 opportunities to reduce GHG emissions in all of Brazil’s main economic sectors. The result is an estimated potential to reduce 2030 Greenhouse gas emissions from 2.8 GtCO
2e to 0.9 GtCO
2e. This would eliminate 1.9 GtCO
2e, equivalent to a 70 percent reduction
in GHG emissions. Figure 2 shows the main initiatives included in this volume of greenhouse gas abatement and the cost5 associated with each one. Appendix 1 shows how to interpret this
curve in more detail.
Figure 2
5 The cost includes the sum of investments and operating costs minus the economic benefit derived.
Brazilian greenhouse gas abatement cost curve in 2030
SOURCE: Global Abatement Cost Curve v2.0. “Pathways to a Low-Carbon Economy for Brazil”
Abatement cost€/t CO2e
1.900300 1.800100 500 1.2006000
1.500
20
30
40
50
60
1.600
10
800 1.7001.4000 1.3001.100900200 1.000700-10
-100
-20
-30
-40
-50
-60
-70
-80
400
-90
Cement – post combustion CCS, retrofitSteel - CCS, retrofit
Steel – overall energy efficiency IITransport – Group 4 heavy vehicles
Petroleum - CCSSteel - CCS, new
Cement – post combustion CCS, newTransports – light vehicles – plug-in hybrid
Cattle rearing – Feed supplementsSteel – Energy efficiency (general)
Agriculture – Agronomy practicesAgriculture – agronomic practices
Agriculture – Tillage and residue management practicesAgriculture – Cropland nutrient managementCattle rearing – Grassland nutrient managementChemicals – Fuel shift oil to gas, new buildTransport – Group 2 light vehiclesPetroleum – More energy efficient new builds in upstreamTransport – Group 4 light vehicles
Waste – Recycling new waste
Buildings – Aggregated new build efficiency package, commercial
Forestry – Pastureland reforestationForestry – Degraded forest reforestation
Abatement potentialMtCO2e/ year
Forestry – reduced deforestation
Waste – Landfill gas electricity generationTransport – light vehicles – full hybrid
Cattle rearing – Antimethanogen vaccine
Agriculture – Organic soils restorationTransport – Switchgrass ethanol
Cattle rearing – Grassland management
Transport – sugar cane ethanol
Power – Small hydroCement – alternative fuels, slag

• 6 •
PATHWAYS TO A LOW-CARBON ECONOMY FOR BRAZIL
The potential abatement volume is significant, positioning Brazil behind only the US, China and
India in terms of absolute reduction in emission volume. In percentage terms, the potential
abatement is higher than the 50 percent global average. In addition, the costs associated with
the Brazilian abatement curve are low. Whereas the world average for 2030 is around �18 per
tCO2e abated for initiatives with a positive cost, in Brazil the average cost of such initiatives is
�9 per tCO2e.
Globally, the main sources of GHGs are power and transportation, which together would
account for 40 percent of the BAU emissions in 2030. In Brazil, the environmental performance
of these sectors is relatively good and together they account for only 13 percent of emissions.
The preponderance of hydroelectric plants for power generation and the high penetration of
ethanol as an automobile fuel have a positive impact on both these sectors. There are several
opportunities for abatement in both these sectors but the overall impact is not large, especially
when we consider that the energy matrix is expected to remain relatively good in the base case
scenario. The abatement potential in these sectors adds up to 72 MtCO2e, or 4 percent of Brazil’s
total abatement potential.
Globally, the industrial sector (cement, steel, chemicals, oil & gas and other sectors) will account
for 26 percent of the 2030 emissions. In Brazil, the industrial sector is less important, accounting
for only 13 percent of the emissions. This is partly the result of the way power is produced and
partly due to characteristics intrinsic to industry in Brazil. This includes, for example, carbon
intensity associated with domestic crude oil production, which at 18 kg CO2e per barrel of
crude is relatively low. This in turn is due to the type of crude oil and environmental measures
already implemented by the industrial sector. In other countries, crude oil is a much more carbon
intense industry, reaching levels in excess of 70 kg CO2e per barrel of crude. Another example
is Brazil’s steel industry. About 35 percent of this country’s pig iron is produced using charcoal
rather than coke. If we assume that future supplies of charcoal will come from reforested or
sustainably managed sources, the environmental performance of the Brazilian steel industry
could contribute to GHG abatement. Abatement initiatives for these industry sectors add up to
130 MtCO2e, or 7 percent of this country’s abatement potential.
The two sectors that depend heavily on the behaviour of the end consumer - buildings and
waste treatment – will be responsible for 7 percent and 2 percent of the world’s 2030 emissions
respectively. In Brazil, they add up to 3 percent of all emissions. The buildings sector has the
advantage that Brazil is a tropical country, reducing the need for energy to heat homes and offices.
Initiatives related to home and office insulation have less of an impact and would account for only
8 MtCO2e in 2030, or 0.4 percent of Brazil’s abatement potential. However, in terms of waste
treatment, Brazil is at a disadvantage, with little treatment of landfill gases or recycling of solid
waste. Abatement initiatives in waste treatment would account for 3 percent of this country’s
abatement potential and are mostly concentrated in waste recycling and utilization of landfill gases.

• 7 •
PATHWAYS TO A LOW-CARBON ECONOMY FOR BRAZIL
The most relevant sectors in Brazil, both in terms of emissions as well as abatement opportunities,
are those related to land use. Some 70 percent of current and 2030 base case emissions come
from forestry and agriculture, making it essential that these emissions be significantly curtailed.
The relevance of agriculture comes from the fact that Brazil is a large producer of agricultural
products, providing much of the world’s increasing demand for food, and leading global exports
in a number of commodities such as grains (30 percent of all the soy traded worldwide) and beef
(25 percent of global trade).
Agriculture, including cattle, accounts for about 25 percent of current Brazilian emissions,
a percentage that is expected to increase to 30 percent, or 820 MtCO2e by 2030. Half of the
agriculture emissions come from cattle, as enteric fermentation and organic wastes from close
to 200 million heads of cattle produce methane, one of the GHGs. The other half of the sector
emissions come from farming practices such as burning off land prior to planting and excessive
use of nitrogen fertilizers, leading to the formation of nitrous oxide, another GHG. Abatement
opportunities in agriculture and cattle rearing are significant and account for 14 percent of this
country’s total 2030 abatement potential. The initiatives identified depend on farmer training
and changes in farming and cattle rearing practices, and on investments in research and specific
regulations.
The largest portion, however, will come from the forestry sector. Deforestation, especially in
the Amazon biome, is Brazil’s largest source of GHG emissions and responsible for 55 percent
of current emissions. This percentage is expected to drop to 43 percent in 2030, based on a
premise that the volume of deforestation will level off at the average level of the past 10 years
as outlined in the baseline scenario defined by the National Climate Change Plan6 released
in 2008. Eliminating deforestation by 2030 accounts for 72 percent of all of the abatement
opportunities in Brazil.
A lasting solution to eliminate emissions associated with deforestation requires an understanding
of the socio-economic context and the economic forces at work in the destruction of forests,
especially in the Amazon biome. This knowledge is essential to develop a set of initiatives that
can be used to systematically address the issue, something that both the experts on the theme
and the Government leaders involved have long understood.
To understand the costs associated with the initiative to preserve the Amazon forest using a
sustainable development model, we have compiled numerous contributions from experts on this
theme and developed a systemic approach that includes:
• (i) strengthening institutions;
• (ii) Reinforcing the command/control of the State;
6 Federal Government, Interministerial Committee on Climate Change.

• 8 •
PATHWAYS TO A LOW-CARBON ECONOMY FOR BRAZIL
• (iii) Incentives to increase the supply of timber and other forest products based on
sustainable practices;
• (iv) And lastly investments to create formal jobs and improve the Human Development
Index of the population affected by deforestation.
The spending associated with abatement of forestry led GHG emissions will vary over time. On
average, the annual cost would be �2.5 billion7 over the course of the next twenty years for
initiatives directly related to curbing deforestation, or �5.7 billion if we include the initiatives
required to increase the socio-economic development indicators of the rural population in
those parts of the legal Amazon most affected by deforestation. Over time, this investment
will likely be essential to give the population access to better paying jobs and promote the
sustainable development of the region. This would translate into a cost per tonne of carbon
close to �8 per tCO2e.
Unlike other studies, this report does not evaluate the economic value of the standing forest
itself, which consists of the revenue from selling deforested timber and the alternative use of the
land for faming, cattle rearing or mining. In this case, we would also have to model the negative
side effects of deforestation such as, for instance, a change in the continent’s rainfall pattern
across the continent. Such considerations were considered not pertinent to the central question
being addressed in this project: what would it take to reduce the current level of deforestation
in the Amazon?
There are also reforestation opportunities in areas where the native forest has been cut down.
These opportunities could become the targets of commercial exploration, such as timber and
pulp, or the recovery of legal and permanent reserves. In this case, the costs could be covered
by international carbon credits and could even become an economically profitable activity.
In conclusion, our study shows that to implement all of the identified initiatives to cut Brazil’s
2030 GHG emissions by 70 percent would require spending some �5.7 billion annually to
preserve the Amazon Forest, and an amount associated with other initiatives that would increase
over time reaching �8 billion by 2030. The total spending would amount to some 1 percent of
the country’s GDP. A significant part of this cost could be funded using international carbon
credits. In this calculation we have left out initiatives with a negative cost or, in other words,
where the savings generated are larger than the investment required.
7 At an exchange rate of 1.4 US$/� and a 4 percent discount rate.

• 9 •
PATHWAYS TO A LOW-CARBON ECONOMY FOR BRAZIL
2. Brazil’s base case – deforestation in the Amazon distorts
this country’s low carbon intensity
Brazil has an important role in the world’s greenhouse gas emissions. In 2005 it was
responsible for 5 percent of the base case emissions, or 2.2 GtCO2e, making it the world’s
4th largest emitter according to the World Resources Institute. The Brazilian forestry sector is
primarily responsible for this high ranking: deforestation accounts for 55 percent of all the GHGs
emitted in Brazil. According to the National Emissions Inventory published in 2006, each year
1.2 GtCO2e8 are emitted into the atmosphere by burning forests to open up cropland or by forests
that have been cut down to make charcoal for the steel industry or to provide raw material for
wood products. If we were to leave out the forestry sector from the emissions inventory, Brazil
would be responsible for only some 2 percent of global emissions.
A base case for how emissions will evolve has been developed to enable the assessment of the
potential levers to abate carbon emissions between 2005 and 2030. This base case considers
that all economic activities will see the impact of existing regulations and reflects current
expectations of how market conditions will evolve. Thus, annual global emissions are expected
to grow at a rate in excess of 50 percent between 2005 and 2030.
The main premises used to model the Brazil case are based on the country having a significant
development potential that it is likely to capture over the coming years. For the purposes of
this model, we have assumed that the population will grow on average at 0.9 percent per year
through 2030, and that the GDP will grow at an average annual rate of 3.5 percent through
2015 and 2.8 percent between 2015 and 2030. This is based on the expectation that Brazilian
industry will experience vigorous development, with the output of cement and steel, for instance,
increasing an average of 4.2 percent and 4.6 percent a year respectively until the end of the
study period. In the agricultural sector, the country would continue to have about 6 percent of
the world’s pasture area and 4.3 percent of its cropland. In general, we have assumed 2005
prices and costs, US$ 60 per barrel9 of crude oil and a 4 percent annual interest.
In this base case, Brazil’s emissions would grow by only 28 percent between 2005 and 2030,
as shown in Figure 3. This is because we have assumed that emissions by the main source, the
forestry sector, will remain constant at the average rate measured between 1996 and 2005,
the period used as the basis for comparison in the National Climate Change Plan. However, if
we exclude the forestry sector from our analysis altogether, the anticipated growth in emissions
in Brazil is 60 percent, higher than the global average. Much of this increase is the result of the
expectation that Brazilian industry will develop intensely over the period, and a strong growth in
road transportation.
8 Includes gross emissions from the First Brazilian Inventory of Atropic Greenhouse Gas Emissions using the maximum carbon intensities per biome adjusted for the average 1990 – 2005 deforestation rate for the biome.
9 IEA WEO 2007 – International Energy Agency, World Energy Outlook 2007.

• 10 •
PATHWAYS TO A LOW-CARBON ECONOMY FOR BRAZIL
Figure 3
However, Brazil’s accelerated economic development is based on a low emission platform.
Brazil’s 2005 GHG emissions, again if we exclude the forestry sector, were 5 tCO2e per capita,
bringing Brazil down to below the 100th global position in per capita intensity of GHG emissions.
In the base case, economic development will increase per capita emissions to 7,5 tCO2e, bringing
this country into a position closer to the current European figure of 10 tCO2e per capita, but still
far from US emissions (23 tCO2e per capita). If we include forestry sector emissions, Brazil’s
per capita GHG emissions in 2005 increase to 12 tCO2e per capita, which is higher than the
European average.
If we compare Brazil’s current and 2030 emissions with the rest of the world (Figure 4), we
see very different behaviours. One of the main differences between Brazil and the rest of the
world is that while globally, on average, emissions from the power sector are the most important
(27 percent) in Brazil they have low relevance (3 percent). Road transport, another sector of
extremely high relevance to the global average, is of only moderate importance in Brazil. On
the other hand, agriculture and forestry, of only moderate relevance to the global average (21
percent), are the most important GHG emitters in Brazil (72 percent).
Brazilian base case GHG emissions by sector in 2005 and 2030GtCO2e/ year
SOURCE: MCT, IEA, IPCC, UNFCCC, US EPA, Global Abatement Cost Curve v2.0. “Pathways to a Low-Carbon Economy for Brazil”
Not land-userelated
Agriculture
Forestry
2.83
2030
0.42
0.59
1.20
2.21
2005
0.81
0.82
1.20
0.040.02
0.42
2005
0.09
0.28
0.13
0.14
0.07
0.03
0.030.02
0.040.02
0.07
0.06
0.06
0.04
0,05
0,04
0.81
2030
Power
Roadtransport
Steel
Chemicals
Cement
Oil & Gas
Other industry
Waste
Buildings
Industry sectors
Power matrix
Consumer sector
Land use
28%

• 11 •
PATHWAYS TO A LOW-CARBON ECONOMY FOR BRAZIL
Figure 4
World
Comparison of the Brazilian and worldwide GHG emission profiles in 2030
0.07Chemicals
0.06
Steel
Cement
0.06Oil & Gas
0.04Other industry
0.28
0.09Power
0.05
Road transport
0.13
0.82
Forestry
Buildings
Agriculture
Waste
0.04
1,20
3.7
3.5
3.5
3.0
1.7
4.6
7.9
7.2
18.7
11.4
4.7
SOURCE: MCT, Global Abatement Cost Curve v2.0. “Pathways to a Low-Carbon Economy for Brazil”
GtCO2e, direct emissions, base case, 2030
2.83Total 69.9
Relative weight (%)
3
10
5
2
2
2
2
2
1
29
43
Brazil
27
16
7
5
5
5
4
2
7
11
10

• 12 •
PATHWAYS TO A LOW-CARBON ECONOMY FOR BRAZIL
3. Details of the emissions and abatement opportunities by
sector - While there are opportunities to reduce emissions
in all sectors, it is in the forestry sector where impact will be
greatest
Just as the forestry sector is a weighty component of Brazil’s GHG emissions, the opportunities
for abatement in this sector are just as important, as can be seen by the abatement cost curve
(Figure 5). By far the largest opportunity Brazil has to reduce Greenhouse gases is to eliminate
deforestation and promote reforestation of degraded land, which together account for over 70
percent of the abatement opportunity. Nevertheless, even though the other sectors analyzed,
namely manufacturing industry, buildings, transportation, power and waste treatment are less
important in relative terms, in absolute terms they represent a potential abatement of 530
MtCO2e per year in 2030, higher than that of several developed nations.
Figure 5
2030 GHG abatement opportunities in Brazil
SOURCE: MCT, Global Abatement Cost Curve v2.0. “Pathways to a Low-Carbon Economy for Brazil”
Relative weight (%)
<0.01Power
0.07Road transport
0.05Steel
0.03Chemicals
0.02Cement
0.02Oil & Gas
0.01Other industry
1.36 0.941
0.06Waste
0.01Buildings
0.26Agriculture
2.30Forestry
1.89Total -68%
Potential abatement by 2030GtCO2e 2030
2030 emissions reduction compared to base case
<1
4
3
2
1
1
<1
3
<1
14
72
-8%
-25%
-38%
-50%
-29%
-35%
-17%
-117%
-24%
-32%
-113%
1 Potential additional abatement based on extensive reforestation of degraded areas in the country
100

• 13 •
PATHWAYS TO A LOW-CARBON ECONOMY FOR BRAZIL
3a. Power Generation – The power sector is responsible for
significant carbon emissions in developed nations, but in Brazil it has
an outstanding environmental performance
Brazil’s current power generation matrix is one of the cleanest in the world. Hydroelectric power
plants account for 85 percent of all of the electricity generated, so Brazil emits an average of 94
t of CO2e per gigawatt hour (GWh) produced. The global average is 580 tCO
2e per GWh and, in
countries that rely heavily on coal fired power plants, can be as high as 1,000 tCO2e per GWh.
These emissions account for only 1.5 percent of the country’s total emissions, positioning it as
one of the countries with the smallest proportion of GHGs from power generation. Worldwide,
power plant emissions account for 24 percent of the total, making it the top ranked GHG emitter.
The expectation is that investments will be made to increase the global penetration of nuclear,
wind and solar energy, as well as biomass based cogeneration. This would bring down the global
average to 170 tCO2e per GWh, still almost twice the current Brazilian average.
According to Brazil’s National Energy Plan, Brazil will more than double the amount of electricity it
generates over the next 20 years. This growth, while including major investment in hydroelectricity
and promoting alternative sources such as nuclear energy, will result in a power generation
matrix that is more dependent on fossil fuels – 14 percent compared to the current 9 percent
(Figure 6). As a consequence, sector emissions will triple, from 30 MtCO2e to 90 MtCO
2e by
2030. In spite of this relatively high growth, the share of emissions from the power sector in
Brazil will be around 3.5 percent, much lower than the global average.
Whilst considering opportunities to reduce emissions beyond the business-as-usual scenario
it is worth noting the demand reduction expected from abatement initiatives in other sectors,
which in the case of Brazil reach around 10 percent of base case generation in 2030. This
reduction in demand can be either reflected in cancelling the investments in fossil fuel plants
or distributed across power sources. In the first case, the Brazilian electric energy matrix would
become even cleaner than it is today as shown in Figure 6. For reporting purposes we adopted
the more conservative option, distributing the demand reduction across all power sources.
In both cases, we also considered expanding small hydroelectric plants participation in the
matrix to reduce fossil fuel penetration, as such investments are typically cost effective and
could reduce emissions by 7 MtCO2e, equivalent to some 8 percent of the base case emissions
expected in 2030.
The cost associated with the small hydro initiative is low, perhaps even negative, given the
competitiveness of these small hydroelectric plants, however extending the use of this potential
would pose a significant challenge. On the other hand, if Brazil opts to reduce its dependence
on hydroelectric power, it could invest more aggressively in wind, sun and biomass power, all

• 14 •
PATHWAYS TO A LOW-CARBON ECONOMY FOR BRAZIL
of which Brazil is excellently placed to develop. Solar and wind energy options remain more
expensive, although costs are expected to come down in future as technology evolves and
players acquire scale. Additionally, Brazil could explore the option of biomass power generation
more aggressively.
Figure 6
3b. Highway transportation – High levels of ethanol penetration in
the fuel market have a positive impact on Brazil.
Highway transportation emissions, defined as the emissions of the domestic fleet of light
(passenger cars), light commercial and heavy vehicles accounts for 6 percent of current Brazilian
GHG emissions, behind only forestry and agriculture. Worldwide, highway transportation is the
second largest sector and accounts for 13 percent of GHG emissions. In Brazil, this sector benefits
heavily from the significant penetration of fuel ethanol, that represents 40 percent of the fuels
market for light-duty vehicles (in energy content). Over 85 percent of all light vehicles currently
sold in Brazil use flexfuel technology. By 2020, over 80 percent of the Brazilian automobile fleet
should be capable of running on pure ethanol, a jump from the current 20 percent, displacing
gasoline even further. In spite of this, emissions intensity from the gasoline and Diesel used in
Brazil can be high due to delays in the investment needed to improve their quality, as stipulated
under the Automotive Vehicle Air Pollution Control Program (Proconve).
2%3%2%2%
9%
82%
15%
73%
401
2005
1%
4%4%
3%
933
2030
1 Excludes imported power2 Wind and solar3 Demand reduction leading to cancelation of investments in fossil fuel plants 4 Distribution of demand reduction across all power sources
Evolution of the Brazilian power generation matrix under base case scenario and with abatement%, TWh/year1
SOURCE: IEA WEO 2007. PNE, Global Abatement Cost Curve v2.0. “Pathways to a Low-Carbon Economy for Brazil”
2%
4%5%
4%4%
81%73%
8421%
4%5%
3%14%
842 Other2
BiomassSmall hydroNuclear
Fossil fuels
Large hydro
91
Base case 2030 with demand reduction and increased share of small hydro
Demand reduction from abatement in other sectors
Distributed reduction4
Reduction allocatedto fossil fuel only3

• 15 •
PATHWAYS TO A LOW-CARBON ECONOMY FOR BRAZIL
The base case projects accelerated growth of the Brazilian fleet–115 percent between 2005 and
2030, when it will reach 49 million vehicles. Much of this growth will come from light vehicles.
The increase in base case emissions between 2005 and 2030 is limited to 100 percent, reaching
280 MtCO2e due to the expected improvements in fuel quality by 2030 (Proconve), the levelling
off of ethanol use by Otto cycle engines at 46 percent10 and a 5 percent penetration of biodiesel.
This is 7 percent of all GHGs expected for 2030.
Opportunities to reduce emissions from road transportation can be split into improvements
in technology and increased penetration of biofuels. Sixteen technological improvements
applicable to light vehicles have been mapped. These can impact the engine, the transmission
box, aerodynamics, weight and tires. In addition, we have included the penetration of hybrids
(pure hybrids or plug-ins) and electric cars. Ethanol penetration will increase and includes both
ethanol produced from existing sugarcane technology as well as biomass and lignocellulose
ethanol, a technology expected to come on-stream after 2015. Biodiesel penetration has been
limited to the base case and no additional opportunity is foreseen as this fuel competes for
edible oils. In the case of heavy and commercial vehicles, opportunities will come primarily from
improved technology (Figure 7). These investments should reduce anticipated 2030 base case
emissions by 25 percent or some 70 MtCO2e, at an average cost of �12 per tCO
2e.
Figure 7
10 In energy contained, source PNE 2030 – Empresa de Pesquisa Energética
50 60 700
120
0
6090
-30-60
30
10 20 30 40
-90
Implementing initiatives in the transport sector could reduce annual emissions by 69 MtCO2e in 2030
SOURCE: Global Abatement Cost Curve v2.0. “Pathways to a Low-Carbon Economy for Brazil”
LightCommercialHeavy
Greenhouse gas abatement cost curve for road transport in 2030
Cost€/ tCO2e
Light vehicles (improvements)
Hybrid vehicles
Sugar cane ethanol
Switchgrassethanol
Hybrid vehicles plug in
Heavy vehicles (improvements)
Abatement potentialMtCO2e
Light vehicles
Commercial vehicles (improvements)

• 16 •
PATHWAYS TO A LOW-CARBON ECONOMY FOR BRAZIL
3c. Steel – The outlook for significant expansion of Brazil’s steel
industry will lead to significantly higher emissions
Most of Brazil’s steel plants are integrated mills that emit 2.5 times as much carbon as scrap (or
recycled) metal based facilities. However, Brazilian steel partially relies on charcoal (35 percent)
to produce pig iron, which reduces emissions if the charcoal used comes from reforestation and
not from native forests.
The base case anticipates significant growth of the steel sector, driven both by Brazil’s own
development as well as the export of semi-finished goods. Production capacity is expected to
reach some 95 Mt or three times the current capacity by 2030, with significant participation still
from integrated plants and (reforested) charcoal pig iron.
Opportunities to reduce steel plant emissions will come from: (i) numerous initiatives to improve
the energy efficiency in the production process itself; (ii) the use of renewable energy sources
(replacing coke with charcoal); (iii) the use of new efficient technologies in new mills (such as, for
example, integrating continuous casting and hot rolling); (iv) carbon capture and sequestration
(CSS) technology (Figure 8). The more cost effective solutions are linked to energy efficiency, for
example installing cogeneration facilities in new plants to use blast furnace gases to generate
electricity. Other efficiency measures would include preventive maintenance, optimized process
flows (management, logistics, IT), improved heat recovery, pre-heating scrap and laser based
scrap analysis. Coal replacement in Brazil’s integrated steel mills will be indirect, as electric arc
furnaces in the region will be encouraged to use pig iron made from charcoal up to the technically
feasible limit, so that more scrap can be used by integrated mills, thereby requiring less coal.
These opportunities would cost an average of �4 per tCO2e and save some 28 MtCO
2e. CCS
opportunities would cost an average of �46 per tCO2e and save some 22 MtCO
2e. In all, the
potential 50 MtCO2e abatement would reduce 2030 base case emissions by 38 percent.

• 17 •
PATHWAYS TO A LOW-CARBON ECONOMY FOR BRAZIL
Figure 8
3d. Chemicals - The chemical industry could reduce its 2030
emissions by 50 percent
Petrochemicals are a large portion of Brazil’s chemical industry, accounting for 60 percent of
its output. Forty percent of the petroleum equivalents used by the sector are used to drive its
plants. Worldwide, much of the power (40 percent) used by the sector comes from natural gas,
which is cleaner than petroleum and contributes to limiting chemical plant emissions. However,
given the scarcity in Brazil, increasing penetration of gas beyond current levels is challenging.
In Brazil, the chemical sector uses very little coal (1 percent), whereas the world average is 14
percent. Another positive factor is that in Brazil, biomass already accounts for 2 percent of the
power used in the chemical sector.
In the base case, chemical sector emissions should grow 2.4 fold, given that the industry itself
is expected to expand significantly. Much of this growth will come from GHGs emitted by the
chemical processes themselves.
Twenty percent of the abatement opportunity in the chemical sector would come from replacing
the fuel used to generate power, replacing coal and expanding the use of natural gas and
biomass (e.g. sugarcane bagasse). Normally such replacements have a negative economic
cost (Figure 9). Of similar importance are process related opportunities (such as improving
Implementing initiatives in the steel sector could reduce annual emissions by 50 MtCO2e in 2030
SOURCE: Global Abatement Cost Curve v2.0. “Pathways to a Low-Carbon Economy for Brazil”
Abatement potentialMtCO2e
Cost€/ tCO2e
Greenhouse gas abatement cost curve for the steel sector in 2030
-50
-100
0
50
20 3010 50400
New
Retrofit
Increased energy efficiency, new
Coke substitution - new
Coke substitution - retrofit
More efficient machinery and processes - retrofit
CCS, new CCS, retrofit
More efficient facilities and technology

• 18 •
PATHWAYS TO A LOW-CARBON ECONOMY FOR BRAZIL
continuous processes, enhanced process control, preventive maintenance and logistics), and
optimum use of catalysts to reduce direct emissions by improving the chemical structure and
enhancing some chain reactions, reducing reaction temperatures at limited additional cost.
These and other opportunities related to using process energy to generate heat and reduce
the volume of fuel used would add up to an abatement potential of 24 MtCO2e, at an average
negative cost of �-18 per tCO2e. Carbon capture and storage opportunities would add another
9 MtCO2e, albeit at high cost of �43 per tCO
2e. In all, these 33 MtCO
2e would be a 50 percent
abatement of the anticipated base case chemical industry emissions for 2030.
Figure 9
3e. Oil & Gas – Currently emissions from the Brazilian Oil & Gas
industry are low compared to other countries, and abatement
opportunities are limited
Both oil & gas production and refining emit GHGs. The relatively small amounts of GHGs emitted
by crude oil exploration and development are excluded from the scope of this analysis. GHGs
emitted by petrochemical plants are included in the chemical sector, those emitted as a result
of the distribution of fuels are included in ground transportation and those emitted by marketing
and end consumption are included under power, buildings and transportation.
CCS
Greenhouse gas abatement cost curve for the chemical sector in 2030
Implementing initiatives in the chemical sector could reduce annual emissions by 33 MtCO2e in 2030
SOURCE: Global Abatement Cost Curve v2.0. “Pathways to a Low-Carbon Economy for Brazil”
3050
204060
-20 3510 15 20 250
Abatement potentialMtCO2e
Cost€/ tCO2e
Motor systems
Fuel shift oil to gas or coal to biomassCHP (combined heat and power)
Ethylene crackingProcess intensification
Catalyst optimization

• 19 •
PATHWAYS TO A LOW-CARBON ECONOMY FOR BRAZIL
Compared to other countries, the Brazilian Oil & Gas sector emits only small amounts of GHGs.
This is the result of the type of crude oil produced in Brazil, the technology used to produce and
refine it and primarily the quality and extent of the environmental measures adopted by industry
players in this country. In addition, there is also the advantage of a clean power generation
matrix. More than half the Oil & Gas industry emissions come from refining, 30-40 percent come
from crude oil production and the remaining 10 percent from gas distribution and processing.
In the base case, emissions would increase 50 percent by 2030, reaching 60 MtCO2e or 2
percent of all emissions. The average annual increase in the period is 1 percent, less than the
expected increase in Brazil’s oil output, which is 3 percent, and is the result of the fact that new
fields will naturally adopt more advanced technology and environmental efforts will continue.
Opportunities for abatement add up to 20 MtCO2e, or 35 percent of the expected 2030 base case
emissions and 1 percent of the total GHG abatement potential for Brazil (Figure 10). About 40
percent of these opportunities are the result of refinery initiatives to use energy more efficiently,
which in turn includes an increased awareness and improvement of maintenance processes
(leading to optimum equipment utilization). Because of the savings this would generate, costs
tend to be negative, in this case �-54 per tCO2e. The remainder of the opportunities are based
on improvements in CCS, costing a significant �45 per tCO2e.
Figure 10
Greenhouse gas abatement cost curve for the oil & gas sector in 2030
205 100
80
15
Cost€/ tCO2e
-80
40
0-40
Implementing initiatives in the oil & gas sector could reduce annual emissions by 20 MtCO2e in 2030
SOURCE: Global Abatement Cost Curve v2.0. “Pathways to a Low-Carbon Economy for Brazil”
Abatement potentialMtCO2e
Behavioral/procedural changes
Improved maintenance & process control
Planning
Behavioral changes and improved maintenance & process control in upstream oil and gas production
Downstream energy efficiency projects
More energy efficient new buildings, upstream
CCS
Reduced flaringDistribution maintenance
Replace sealsMaintain compressors
Energy efficiency projects requiring CAPEXat process unit level in upstream oil and gas

• 20 •
PATHWAYS TO A LOW-CARBON ECONOMY FOR BRAZIL
3f. Cement – In the base case the cement industry anticipates
steeper increases in emissions between 2005 and 2030
Given that Brazil is under intense development, cement production is expected reach 2030
with an output almost 3 times that of 2005. The cement industry produces the basic input for
concrete, widely used in construction and infrastructure works. Rapid growth will come with an
increase in emissions, which are expected to grow 1.7 times over this period, the largest of any
of Brazil’s industries.
Over 70 percent of the emissions from cement plants in Brazil are generated when limestone
and clay are calcined to produce clinker, an intermediate in cement production. Replacing clinker
with alternative materials such as slag from the steel industry will directly reduce emissions. A
small portion of the cement sector emissions in Brazil is indirect, resulting from the use of
electricity and the burning of fuels.
In Brazil, abatement in cement sector emissions is mostly linked to replacing clinker and using
alternative fuels, at a negative cost of �-13 per tCO2e. In Brazil, the primary replacement for
clinker is blast furnace slag from steel mills, unlike other countries that can also use fly ash from
coal burning power plants (Figure 11). In addition, in Brazil this slag can also come from blast
furnaces that use charcoal rather than coke, completely abating emissions as this would be
renewable slag. This corresponds to 35 percent of the 16 Mt potential reduction in GHGs emitted
by the cement sector in Brazil. Another 25 percent is related to the use of alternative fuels
such as industrial or municipal waste or biomass. The remaining 40 percent of the abatement
opportunity is in CCS, at a high cost of over �40 per tCO2e. Total abatement could potentially
reduce Brazilian emissions in 2030 by 30 percent compared to the base case.

• 21 •
PATHWAYS TO A LOW-CARBON ECONOMY FOR BRAZIL
Figure 11
3g. Waste Treatment – The second largest potential for abatement in
sectors not related to land use is in the waste treatment sector
Solid waste and effluent (residential sewage and industrial effluents) treatment has very
significant opportunities for abatement, second only to those sectors that rely on the use of
land (forestry and agriculture), and close to road transport. These wastes produce methane
from the anaerobic decomposition of organic materials. Emissions from solid waste are driven
by organic waste content, system humidity, weather conditions and the design of the landfill.
Effluent emissions (methane and nitrous oxide) tend to be more intense in countries where
treatment and collection systems are in the early stages.
Brazil has the world’s 5th largest population, and penetration of residue collection and treatment
is relatively low. Waste emissions contribute 53 MtCO2e, placing Brazil among the global top 10.
The base case scenario for 2030 projects a moderate 26 percent growth of these emissions
compared to 2005, taking into account the various ongoing initiatives to treat landfill gases.
In the analysis of these abatement opportunities we included solid waste pre-treatment (recycling
and composting) and treatment (e.g. collecting landfill gases). The abatement of GHGs emitted
from effluent treatment has not been assessed due to lack of information.
Greenhouse gas abatement cost curve for cement in 2030
0 10 1550
80
40
-40
-80
Cost€/ tCO2e
Abatement potentialMtCO2e
Implementing initiatives in the cement sector could reduce annual emissions by 16 MtCO2e in 2030
SOURCE: Global Abatement Cost Curve v2.0. “Pathways to a Low-Carbon Economy for Brazil”
Clinker substitution by Other MIC
Clinker substitution by fly ash
Alternative fuel - waste
Clinker substitution by slag
Post combustion CCS - retrofit
Post combustion CCS- new capacity
Alternative fuel - biomass

• 22 •
PATHWAYS TO A LOW-CARBON ECONOMY FOR BRAZIL
Brazil has the opportunity to totally displace these emissions, especially through initiatives to
recycle any new solid wastes generated (Figure 12). These initiatives, such as reusing metals
and papers as inputs in their own production chains, would cover 75 percent of the potential
sector abatement. Composting new solid waste would add another 2 percent of abatement. The
remaining 23 percent of the opportunity is related to more intense use of landfill gases (either
directly or to generate electricity). Typically, the cost of these initiatives is negative, or around
�-15 per tCO2e, due to the revenue from these activities. However, success depends primarily on
changing behaviour and getting people and companies to develop a culture of recycling. Technology
barriers are currently considered minimal and could be completely eliminated by 2030.
Figure 12
3h. Buildings – The buildings sector has the most cost effective
opportunities, but the potential for abatement is limited
Residential and commercial buildings will account for only 1 percent of the expected base case
emissions in 2030. On a global average, the sector is responsible for 7 percent of the emissions.
Brazil is at an advantage primarily because of its tropical climate, with less energy used to
heat buildings and water. However, some 50 percent of the lamps used in this country are still
incandescent lamps, and there has been an increase in the penetration of electronic goods, as
the lower income segments of the population quickly gain access to credit, all of which drive up
power consumption.
0 10 20 30 40 50 600
-20
-40
20
Implementing initiatives in the waste treatment sector could reduce annual emissions by 63 MtCO2 e in 2030
Abatement potentialMtCO2e
Cost€/ tCO2e
SOURCE: Global Abatement Cost Curve v2.0. “Pathways to a Low-Carbon Economy for Brazil”
Greenhouse gas abatement cost curve for waste treatment in 2030
Landfill gas direct use
Recycling new waste
Landfill gas electricity generation
Composting new waste

• 23 •
PATHWAYS TO A LOW-CARBON ECONOMY FOR BRAZIL
In the base case, emissions by the Brazilian building sector would grow 43 percent to 36 MtCO2e
by 2030. About 65 percent of the emissions come from residences, where almost 25 percent
of the power consumed is in the form of electricity, and 75 percent is in the form of liquefied
petroleum gas (LPG) used for cooking. Compared to the global average, the penetration of natural
gas in Brazilian residences is extremely low (less than 1 percent). The commercial segment
(offices and public buildings) is responsible for the remaining 35 percent of the emissions, and
here electricity is the major component and accounts for about half of this total.
There is the opportunity to abate some 8.5 Mt of the CO2e emitted by the sector, 25 percent of
which by improving lighting systems, and another 25 percent by switching water heating systems
in homes and commercial buildings (Figure 13). Opportunities in lighting include switching
incandescent and compact fluorescent lamps (CFL) for much more efficient light emitting diodes
(LEDs). LEDs produce 150 lumens per watt (lm/W), whereas CFLs produce 60 and incandescent
lamps 12 lumens per watt. In water heating, the opportunities are in replacing electric or gas
systems with solar energy, saving up to 85 percent of the power used. Another 20 percent of
the opportunity is related to the gradual replacement of existing white goods and consumer
electronics with more energy efficient ones, a potential energy saving of 35 percent. Energy
efficiency packages add another 20 percent potential abatement by reducing the demand for
energy through improved thermal insulation and internal air flows in new buildings, as well as
more efficient building materials and techniques to put up walls, roofs, floors and windows.
These opportunities could bring down 2030 base case emissions by about 24 percent. The
cost associated with all of them is negative, on average less than �-100 per tCO2e. Measures
to reduce emissions associated with lighting are the most cost effective. However, the initial
investment will typically overshadow any short term financial savings, which is a barrier for the
population and builders to adopt such measures.

• 24 •
PATHWAYS TO A LOW-CARBON ECONOMY FOR BRAZIL
Figure 13
3i. Agriculture – Agriculture is the second largest emitter, behind
only forestry. There is high potential to reduce the GHGs emitted by
this activity, but implementation is challenging.
Agriculture is Brazil’s second largest GHG emitter and will account for 29 percent of the base
case emissions in 2030. At 820 MtCO2e, it is second only to forestry. Typically, agricultural
activities emit nitrous oxide (46 percent of all agricultural emissions worldwide) and methane
(54 percent) rather than carbon dioxide. A number of the abatement opportunities are related
to carbon sequestration.
In Brazil, the main agricultural activity that gives rise to GHGs is cattle rearing and is the result
of enteric fermentation and residues deposited on pastures. These account for more than 50
percent of the emissions. Another portion is the result of farming practices such as managing
soil nutrients (for instance excessive use of nitrogen) and burning waste (e.g. sugarcane farms).
The sheer volume of these emissions is such that Brazil contributes 10 percent of all of the
GHGs coming from agriculture, and is second only to China.
Given expected growth in agricultural activities in the base case, these emissions are expected
to grow by 40 percent between 2005 and 2030. Cattle rearing accounts for 37 percent of the
Greenhouse gas abatement cost curve for the buildings sector in 2030
Implementing initiatives in the buildings sector could reduce annual emissions by 8.5 MtCO2e in 2030
Cost€/ tCO2e
Commercial
Residential
SOURCE: Global Abatement Cost Curve v2.0. “Pathways to a Low-Carbon Economy for Brazil”, IEA
-49
0 1
-350
43 52
-700
6 7 80
Switch incandescent to LEDs
Switch CFLs to LEDs
Electronic consumer
Lighting new build controls
Appliances
Electronics -office
Appliances -refrigerators
Retrofit HVAC - air conditioning
Lighting retrofit controls
Switching from electric to solar water heating
Switching from T12 light to T8/T5
Retrofit HVAC controls
Building envelope retrofit
Retrofit air conditioning maintenance
Air conditioning retrofit
Aggregated new build efficiency package
Water heating –switching from gas to solar
Abatement potentialMtCO2e

• 25 •
PATHWAYS TO A LOW-CARBON ECONOMY FOR BRAZIL
expected growth. Soil emissions are expected to grow at a much faster pace - 90 percent - and
by 2030 their share will be similar to that of cattle rearing activities. Emissions from farming
practices such as burning wastes should remain flat over the period, which means their share of
total agricultural emissions should drop from 30 percent to 21 percent.
Base case estimates bear in mind three factors that are of relevance for the domestic and
international markets: (i) population growth (25 percent worldwide between 2005 and 2030); (ii)
global development resulting in an increase in per capita GDP; (iii) changes in eating habits with
a consequent increase in the consumption of animal protein. The base case does not take into
account the potential consequences of climate change which could affect agricultural output
(e.g. rain cycles), given that the magnitude of such impact is still uncertain. The base case does
include the effects of carbon storage associated with larger crop areas. Related emissions reflect
the best scientific work available by the time of publication of Brazil’s Initial Communication to
the United Nations Framework Convention on Climate Change, but as in other sectors, some
uncertainties exist.
The potential for abatement has been estimated at 262 MtCO2e, or 32 percent of the anticipated
2030 emissions (Figure 14). About 60 percent of the potential abatement is related to cattle
rearing and can be split into two main initiatives. The first would be to improve pasture management
so as to enable more intense cattle rearing (today limited to around 1 head per hectare). This
would require enhanced productivity through genetic screening of the types of pasture used, fire
management and irrigation, as well as improved pasture nutrition, which in turn requires more
precise fertilizer use. The second initiative has to do with the improving the efficiency of ruminal
fermentation by administering drugs that select desirable bacteria and control the undesirable
bacteria present in animal fermentation chambers. This means that animals make better use of
nutrients which reduces the production of undesirable fermentation products such as methane.
Nutritional supplements are already used in the few confinements in the country, yet they remain
relatively costly and are more complex to use for cattle raised in large areas of pasture. In addition,
vaccines to control the action of methanogenic bacteria are being developed and could be an
attractive option if they are proven effective and are reasonably priced.

• 26 •
PATHWAYS TO A LOW-CARBON ECONOMY FOR BRAZIL
Figure 14
Another 26 percent of the potential abatement is related to initiatives to recover farm soil, often
degraded due to excessive or improper use, erosion, the loss of organic material, high salt
contents or low pH. Soil productivity can be recovered by planting pasture. Soils can be made
more fertile by proper nutrient selection, the application of organic substrates such as some
wastes or composts, less tillage (direct planting), keeping farm wastes on the soil and moisture
retention. Industry estimates show that 26 million hectares (Mha) in Brazil already use direct
planting, a practice that reduces soil degradation. This high level of penetration is considered in
the base case. However, Embrapa and FAO11 estimates show that there are some 100 Mha to
188 Mha of degraded soil in Brazil, mostly in the Cerrado region and along the coast. In addition,
there are opportunities associated with the recovery of flooded areas (organic soil). Draining
these areas for farming tends to emit nitrous oxide and carbon dioxide.
The remaining opportunities are distributed in the form of better farm nutrient management,
including rice (evaluated separately due to its significance in other countries) and waste
management practices.
The average cost of the initiatives in the agricultural sector is low, expected to average around
�2 per tCO2e in 2030. Little investment is required and it will be mostly enabled through small
changes in current farming practices. This estimate excludes the need for training, incentives/
11 Bai ZG, Dent DL, Olsson L and Schaepman ME 2008. Global assessment of land degradation and improvement 1: identification by remote sensing. Report 2008/01, FAO/ISRIC – Rome/Wageningen.
Greenhouse gas abatement cost curve for the agriculture sector in 2030
40
-20 0 250
-40
-60
50 100
Cost€/ tCO2e
1500
20
200
Implementing initiatives in the agricultural sector could reduce annual emissions by 262 MtCO2e in 2030
Tillage and residue management practicesCropland nutrient management
Grassland nutrient managementRice management - shallow flooding
Rice management - nutrient managementGrassland management
Organic soils restorationCattle rearing – Antimethanogen vaccine
Agronomy practices
Degraded land restoration
Cattle rearing - Feed supplements
SOURCE: Global Abatement Cost Curve v2.0. “Pathways to a Low-Carbon Economy for Brazil”
Abatement potentialMtCO2e

• 27 •
PATHWAYS TO A LOW-CARBON ECONOMY FOR BRAZIL
fees or monitoring tools. Even so, preliminary quantitative estimates show that the additional
cost would be limited to �1 per tCO2e. There are barriers to implementing these initiatives in
that the farming sector is highly fragmented. In a number of areas agriculture is merely for
subsistence, and in this case using climate change as a motivator is not very efficient.
3j. Forestry – Most of the opportunities for GHG abatement in Brazil
are in the forestry sector, and include both reducing deforestation
and recovering degraded areas. However, the implementation of
structural initiatives in the region is complex.
The forestry sector has received much of the attention of the Brazilian climate change agenda.
This is not only due to the volume of GHGs emitted by deforestation, but also because of other
negative effects such as the loss of biodiversity and changes in rainfall patterns. In addition,
Brazil has the word’s largest inventory of tropical forests (~460 Mha), more than half the world
total. It is also the country with the highest absolute deforestation rate with an average of 1.9
Mha deforested per year in the region in the period of 1996-2005, the timeframe analyzed
by the National Climate Change Plan. The Amazon forest biome analyzed in this plan has the
highest rate of deforestation and the highest carbon inventory in Brazil.
Recently the government has taken a number of initiatives to reduce deforestation; of special
importance is the Action Plan to Prevent and Control Deforestation in the Legal Amazon
(PPCDAM)12, which was able to reduce the area deforested each year by 60 percent between
2003 and 2008. Secondly there is the December 2008 National Climate Change Plan13 that
aims to gradually reduce deforestation until it is completely eliminated in 2040.
Because of the historical occupation model for the Amazon, the population in the region has
over the past 30 years grown from 10 to 25 million. Some 6 million live in rural areas and around
700 thousand are engaged directly in forest destroying economic activities like timber logging
or cattle ranching.
Experts who have dedicated decades to this theme as well as government leaders who must
address this challenge in practical terms contend that there must be a systemic approach to
eliminate deforestation related emissions. This systemic approach focus on creating formal
employment options and a range of products based on legal activities that use sustainable
practices. An important part of any solution to this puzzle is also likely to be a stronger presence
for public institutions, starting with the effective implementation of land titling efforts.
12 Plan drafted by the Permanent Interministerial Working Group to Reduce Deforestation in the Legal Amazon. This is a Federal Government plan Coordinated by the Office of the Chief of Staff
13 Created by the Interministerial Committee on Climate change

• 28 •
PATHWAYS TO A LOW-CARBON ECONOMY FOR BRAZIL
To understand the costs associated with the initiative to preserve the Amazon forest using a
sustainable development model, we have compiled numerous contributions from experts on this
theme and developed a systemic approach that includes:
• (i) Strengthening institutions;
• (ii) Reinforcing the command/control of the State;
• (iii) Incentives to grow sustainable practices;
• (iv) And lastly investments to create formal jobs and improve the Human Development
Index of the population in the rural area (Figure 15).
Figure 15
There are some prerequisites that are likely to need to be put in place if any deforestation effort is
to be effective over the long term. First, this is likely to include solid land ownership regulations.
In other words, we must know who the land belongs to before the law can be enforced, and
certainly before we can expect to attract formal and serious businesses to the area. Today, less
than 10 percent of the area has clear land title. In addition, law enforcement must be present
and enforced in the field, with more police and a more efficient judiciary system. We estimate
these efforts would require some �1 billion per year14 (Figure 16).
14 At an exchange rate of 3 R$/� for initiatives to curtail deforestation.
Incentives
Development
Institutions strengthening
Monitoring/ enforcement
A
B
C
Environmental enforcement4
Origin assurance5
Forest stewards6
Payments for forest maintenance & recovery7
Subsidies/Financial aid for alternative products8
Penalties for non sustainable activities9
Land tenure1
Law enforcement2
Judiciary3
Economic development10
11 Social development
D
SOURCE: “Pathways to a Low-Carbon Economy for Brazil”
Initiatives to preserve the Amazon forestLevers Initiative/action

• 29 •
PATHWAYS TO A LOW-CARBON ECONOMY FOR BRAZIL
Figure 16
Stronger institutions will increase the probability of successfully implementing and capturing
the benefits of monitoring and control initiatives. We have analysed a set of ideas proposed for
the category and estimate that effective oversight would be possible at an annual investment of
around �0.5 billion. For example, effectively monitoring existing parks would likely require three
times the current number of agents. Implementing intelligent systems to track cattle and timber
are also critical to successful government monitoring and control. Finally, there will be a need to
compensate traditional communities for their monitoring effort, something that is already being
done but could be expanded.
It is not enough to put pressure on the causes of deforestation. In some regions, activities
associated with deforestation are essential to the local economy. Incentives for new production
chains that can replace the existing ones will need to be created. Specifically, support would
be required for the creation of formal activities along the cattle and lumber chains, such as
sustainable and certified handling, and more intense cattle farming and enhanced pasture
management, which would enable doubling the output using the same area. Initiatives such
as these would enable increasing the output of these production chains without deforestation.
They would also increase formal employment and tax revenue for the government. There is also
the option to implement mechanisms to pay land owners who opt to preserve their forested
land for the provision of environmental services. We estimate that some �0.8 billion would be
required each year for incentives and to pay for environmental services of this nature
Annual cost of the 5-front effort required to avoid deforestation of the Amazon forest
ESTIMATE
SOURCE: “Pathways to a Low-Carbon Economy for Brazil”
0,5
1,5
1,8
5,7
0,8
1,1
AInstitutions
strengthening
BMonitoring/
enforcement
CIncentives
Economic Social Total cost
DDevelopment
€ billion per year, average annual cost through 2030

• 30 •
PATHWAYS TO A LOW-CARBON ECONOMY FOR BRAZIL
According to our model, the spending associated with abatement of forestry emissions will
vary over time as some of it is for structural investments and some is for recurring expenses.
On average, the annual cost over the next twenty years will be �2.4 billion. We believe that it
is technically possible that twenty years will be sufficient to eliminate deforestation in Brazil.
Assuming a linear reduction in deforestation over this period we arrive at an average cost per
tonne of CO2e not emitted of �3.5. After this initial twenty year period we would assume that the
costs associated with fighting deforestation would be much smaller, as all structural investments
would have been made and a new sustainable economy will be in place.
In addition to initiatives designed to specifically reduce deforestation, we believe it is important to
ensure in the long term a certain level of economic and social development in the less favoured
areas of the Brazilian North, as well as in the emigration poles for this region. In addition to the
sustainable rural activities mentioned above, we would also have to create higher value added
jobs in the smaller cities and towns and increase the investment in basic services such as
healthcare and education in the Amazon so as to improve the population’s human development
index. Over the long term this investment will be essential to give the population access to better
paying jobs and promote the sustainable development of the region. We estimate this would add
an incremental cost of �3 billion per year. This could be recorded as an expense the country must
face in order to bring a less developed area up to the national average, or included in the overall
balance sheet associated with reducing deforestation. If, as a nation, Brazil selects the second
option, the total annual cost to avoid the 0.8 GtCO2e emitted each year from deforestation of the
Amazon biome will be �5.7 billion, or �8 per tCO2e.
Figure 17
Greenhouse gas abatement cost curve for the forestry sector in 2030
0 100 1.000 1.100 1.200 1.300200 300 400 5000
900800700600
10
15
20
25
5
CostEUR/tCO2e
Implementing initiatives in the forestry sector could reduce annual emissions by 1.36 GtCO2e in 2030
Reduced deforestation outside the Amazon
SOURCE: Global Abatement Cost Curve v2.0. “Pathways to a Low-Carbon Economy for Brazil”
Abatement potentialMtCO2e
Forest management
Cropland reforestation
Degraded forest reforestation
Pastureland reforestation
Reduced deforestation in the Amazon

• 31 •
PATHWAYS TO A LOW-CARBON ECONOMY FOR BRAZIL
The 30 percent of GHGs emitted by deforestation in areas outside the Amazon are, for the
most part (80 percent), the result of deforestation in the Cerrado and Pantanal regions. We
estimate the annual cost of curtailing deforestation in other regions would be �600 million, or
�1.8 per tCO2e. The cost is smaller than it is in the Amazon biome because it does not include
investments in economic and social development, or the strengthening of institutions. Figure 17
illustrates the cost curve for all forestry sector initiatives.
Recently implemented efforts show commitment on the part of government and private entities
to curtail deforestation. In the government sphere we point to major efforts made to create
conservation areas, new regulation that limits credit for properties that have environmental
liabilities, new credit facilities for reforestation and State programs to systematically fight
deforestation. There are also initiatives to reduce the consumption of illegal timber, such as the
new Caixa Econômica Federal Standards for mortgage approval, and the new law passed by the
State of São Paulo to encourage the sustainable use of timber. Finally, private enterprise is also
undertaking important efforts such as the Soy Moratorium15.
Finally we point to the creation of the Amazon Fund, which may be an important vehicle to support
systemic initiatives to reduce deforestation and promote sustainable development in the region.
In addition to opportunities to reduce deforestation related GHG emissions, we have included
opportunities in reforestation of the areas surrounding pasture and cropland, forestry
management (for instance fire control), and reforestation of degraded areas, totalling 0.75 Mha
of additional forest each year, or 16 Mha planted by 2030. These initiatives represent a carbon
storage opportunity equivalent to 158 MtCO2e, 13 percent of the total abatement opportunity in
forests, at an average cost of �9 per tCO2e.
This volume of reforested land is conservative when compared to the potential Brazil has to use
degraded areas for carbon storage reforestation. Although no official number exists, Embrapa
and FAO indicate that there are some 100 Mha to 188 Mha of degraded land in the country. There
is a significant potential in reforestation, especially in the Amazon where forests grow at a faster
rate than anywhere else in the world. This could include a combination of commercial forestry
operations, where Brazil already leads the world in pulp production and could consolidate itself
as the world leader in wood products, and reforestation using native species to permanently
restore legal reserves not for commercial use.
This not-for-profit reforestation could be funded using international carbon credits. This
mechanism is already operational on a small scale and the expectation is that it will increase
rapidly, given that opportunities to reduce GHG emissions at lower costs are limited. By 2030
there will be 9 GtCO2e for which there is no abatement option costing less than �60 per tCO
2e.
15 Soy producer and exporter associations have declared a moratorium on soy from deforested areas. This moratorium ends in 2009.

• 32 •
PATHWAYS TO A LOW-CARBON ECONOMY FOR BRAZIL
This will require implementing new, higher cost technologies or sequestering the emitted carbon.
Given this context, reforestation is a very attractive option. If we assume that by 2030, 25 percent
of this volume (2.3 GtCO2e per year) will be captured by 230 Mha of reforested area all over the
world, and that the average price of a carbon credit will be �20-30 per tonne, we arrive at a
market worth close to �25-30 billion a year. Brazil is very well positioned to capture an important
share of this market.
4. Implications – The need to invest, to mobilize players and
the implications for society at large are concentrated in the
forestry sector
Although our study is not intended as a detailed roadmap to a low-carbon society in Brazil,
it does make it clear that it is entirely possible to achieve this. It is up to Brazil, as a society, to
find the path to make this future happen for the next generation. Our cost curve shows that the
cost of implementing the necessary initiatives in all sectors except for forestry would require an
annual spending that would grow over time to reach �8 billion by 2030. In this calculation we
have left out initiatives with a negative cost or, in other words, where the savings generated are
larger than the investment required.
The estimated annual cost to preserve the Amazon forest varies between �2.4 and �5.7 billion,
depending on whether or not economic and social development costs are included, in addition
to those directly associated with curbing deforestation.
Thus the total cost for implementing all of the initiatives required to reduce Brazil’s GHGs vary
over time, but would be somewhere around 1 percent of the country’s GDP. A significant part of
this cost could possibly be funded using international carbon credits.
In addition to the cost of reducing emissions, we have identified that Brazil potentially has a major
opportunity in the reforestation of degraded areas to obtain carbon credits. This market is still
incipient, but the scenario is ripe for rapid growth if international regulation evolves favourably.
We hope that the facts provided by this report will serve as a useful starting point for decision
makers and be useful for the country, especially at a time in which these topics are being
assessed globally.

• 33 •
PATHWAYS TO A LOW-CARBON ECONOMY FOR BRAZIL
Appendices
Appendix 1 – Model approach
To arrive at these conclusions, the costs and abatement potential of more than 100 abatement
measures across six industry sectors have been analyzed using a four step process. First, a
‘business-as-usual’ baseline was determined using current trends applied to current and future
emissions. Second, a range of emission reduction opportunities was identified and fact-based
estimates were made of the costs and potential abatement volume presented by each one. Third,
these costs and volumes were combined to form the Brazilian GHG abatement cost curve The
fourth and final step was to analyze the impact of likely regulatory and technological scenarios
on the costs and abatement potential, and quantify the likely economic implications for Brazil.
Phase 1: A business-as-usual baseline was determined using the Brazilian government’s inventory
of GHGs. The data available was extrapolated to 2030 based on premises and methodology
consistent with the IPCC approach. These forecasts represent the emissions trajectory that
would occur under present trends and with all government policies in place as of 2006, but with
no additional efforts made to address climate change. They are based on a projected economic
growth rate of 3 percent, meaning that the carbon intensity of the economy (i.e. the economic
output per unit of carbon emissions) will continue to decline, consistent with the standard long-
term trend resulting from business-as-usual base case economic development. This trend is
driven by the relative growth of the service sector and other business-as-usual decarbonization
effects.
This baseline covers direct emissions—thus the power sector includes all emissions from power-
generation activities, regardless of the downstream end user of the power.
Phase 2: Potential emission reduction opportunities and costs were assessed. We looked at a
range of abatement opportunities, including renewable energy sources, alternative fuels, energy
efficiency measures and new technologies, to examine ways that GHG generating activities can
be replaced by lower emission or ‘carbon neutral’ alternatives. The scope of the measures
considered were those requiring deployment of present-day technologies, as well as a limited
number of maturing emerging technologies. Experimental or incipient technologies, as well as
those requiring any significant lifestyle changes, were not included. For example, fuel substitution
and improved efficiency of private vehicles were included, but promotion of public transport or
bicycle riding to replace those vehicles was not. Similarly, efficiency in residential air conditioning
was in scope, but reduction in the use of air conditioning was not.

• 34 •
PATHWAYS TO A LOW-CARBON ECONOMY FOR BRAZIL
For each opportunity analyzed, the abatement cost is taken to be the additional cost to society
of implementing the opportunity compared to the cost of the activity that would otherwise occur
in the business-as-usual case. For example, the abatement cost of wind power is driven by the
additional generation cost over and above the average generation cost of power assets in the
business-as-usual case, as well as by the quantity of emissions that can be avoided with each
unit of wind energy production. These costs are modelled on a full cost basis over the lifecycle
of the asset or opportunity. We have not addressed the issue of who will be responsible for the
added cost, whether they will be subsidized by governments, passed along to the consumer or
paid for by businesses. We merely assume that the underlying economic cost remains the same.
While these are likely to constitute the vast majority of costs to the Brazilian economy, they do
not include difficult to quantify transactional costs, such as the management time required to
implement such changes. Furthermore, they are gross costs, that is, we have not built in the likely
cost of a ‘do-nothing’ scenario, such as the costs induced by a decline in agricultural production.
Nor have we attempted to quantify anticipated value creation in the economy through the pursuit
of new business opportunities. Opportunities involving lifestyle or behavioural shifts were
excluded not because they are undesirable, but because their costs or benefits are largely non-
financial and thus difficult to quantify. In fact, many of these out-of-scope shifts may be attractive
and some are likely to occur automatically in response to carbon price signals in the economy.
It is our belief that on balance, our modelling is conservative given the likely combination of
negative and positive impacts from the aforementioned factors.
The volume of each initiative is its potential to reduce GHGs. This has been estimated as a
‘technical’ potential and is not a forecast, but rather an estimate of what is deemed feasible in
the timeframe of the cost curve. Volumes are sensitive to the order of implementation, since, for
example, energy demand reduction initiatives reduce the total amount of energy produced, and
hence the additional abatement potential of the power sector
Analyzing the in-scope measures involved making a range of assumptions, including power capacity
forecasts, expected learning curves and initial generation costs. Where applicable we tailored
the insights from McKinsey’s global studies for use in the Brazilian context (e.g. global capital
investment costs and learning curves are assumed for onshore wind and solar photovoltaic).
Thus, our assumptions are consistent with recent McKinsey global studies, as well as those
undertaken in the UK, the US and Germany. These premises have been reviewed by scientists,
academics and industry experts. Where possible, unique Brazilian considerations (such as the
potential for biomass power penetration, or for increased efficiency of solar photovoltaic assets
due to local sunshine intensity), have been factored into underlying cost and volume calculations.
Our assumptions were also guided by a range of existing publicly available documents. While the
Brazilian team did not undertake an exhaustive analysis of every abatement measure, we believe
this work provides a robust fact base for more detailed sectoral analyses.

• 35 •
PATHWAYS TO A LOW-CARBON ECONOMY FOR BRAZIL
The emissions reduction opportunities considered were both direct and indirect. The power
sector (along with forestry, agriculture and transport) primarily produces direct emissions from
its production activities. Abatement opportunities in the building sector, on the other hand,
represent the potential to reduce energy demand. These are regarded as indirect abatement
opportunities. Almost all opportunities considered in the building sector, and a significant
proportion of those in the industry sector, are indirect. If implemented, they would reduce the
power sector’s direct GHG emissions.
Phase 3: Measures were combined to form the Brazilian greenhouse gas abatement cost
curve. The various abatement measures were ordered from lowest to highest cost, adjusted to
eliminate double counting, and their costs and volumes plotted to form the Brazilian greenhouse
gas abatement cost curve for 2030.
Phase 4: We extracted the consequences of the total abatement potential and the associated
costs for the economy. We used the 2030 cost curve to calculate the abatement levels achievable
and the associated cost. We modelled the likely costs of the reduction targets proposed by
the IPCC, currently the subject of international negotiations. We also calculated the cost per
household, as well as the total gross cost to Brazil for achieving the stated emissions reductions.
Using this fact base, we extracted insights to form high-level recommendations for government,
business and consumers. We reiterate, however, that the intent of this report is to answer
the question ‘what is possible when, and at what cost?’ Further work is required to give more
detailed, sector-specific answers to the question ‘how do we make this happen?’
Appendix 2 – How to read the abatement curve
McKinsey’s global greenhouse gas abatement “cost curve” summarizes the technical
opportunities (i.e., without a material impact on the lifestyle of consumers) to reduce emissions.
The cost curve shows the range of emission reduction actions that are possible with technologies
that either are available today or offer a high degree of certainty about their potential in a 2030
time horizon.
The width of each bar represents the potential of that opportunity to reduce GHG emissions
in a specific year compared o the business-as-usual development (BAU). The potential of
each opportunity assumes aggressive global action starting in 2010 to capture that specific
opportunity, and so does not represent a forecast of how each opportunity will develop. The
height of each bar represents the average cost of avoiding 1 tonne of CO2e by 2030 through
that opportunity. The cost is a weighted average across sub-opportunities, regions, and years. All
costs are in 2005 real Euros. The graph is ordered left to right from the lowest-cost abatement
opportunities to the highest-cost. The uncertainty can be significant for individual opportunities

• 36 •
PATHWAYS TO A LOW-CARBON ECONOMY FOR BRAZIL
for both volume and cost estimates, in particular for the Forestry and Agriculture sectors, and for
emerging technologies.
The priority in our research has been to look at the global emission reduction opportunities
with one consistent methodology, rather than to deep dive in any individual emission reduction
opportunity.
Therefore, the curve should be used for overall comparisons of the size and cost of different
opportunities, the relative importance of different sectors and regions, and the overall size of
the emission reduction opportunity, rather than for predictions of the development of individual
technologies. It can also be used as a simulation tool, testing for different implementation
scenarios, energy prices, interest rates and technological developments.
The reader should also bear in mind that the cost of abatement is calculated from a societal
perspective (i.e., excluding taxes, subsidies, and with a capital cost similar to government bond
rates). This methodology is useful because it allows for comparisons of opportunities and costs
across countries, sectors and individual opportunities.
However, it also means that the costs calculated are different from the costs a company or
consumer would see, as these decision makers would include taxes, subsides, and different
interest rates in their calculations. Therefore, the curve cannot be used for determining switching
economics between investments, not for forecasting CO2 prices. The cost of each opportunity
also excludes transaction and program costs to implement the opportunity at a large scale, as
these are highly dependent on how policy makers choose to implement each opportunity.
Appendix 3 – The cost of the initiatives to avoid deforestation in the
Amazon
Estimates of the cost of avoiding deforestation were created in four steps:
• (i) Identifying the value chains responsible for deforestation, of which cattle rearing and
timber are the most important, followed by soy and charcoal.
• (ii) Assessing the links between the value chains more susceptible to actions so as to
transform these chains into sustainable activities. Two of the main levers have been
described: Increased monitoring along the chain and incentives for sustainable activities,
coupled with the imposition of penalties for those that are not.
• (iii) Assessment of the effects on the populations involved in these value chains, including
a map of employment generation activities, not only for those directly involved in

• 37 •
PATHWAYS TO A LOW-CARBON ECONOMY FOR BRAZIL
deforestation, but also for the low income populations not directly involved in the chains.
This approach has been developed to avoid that openings in non sustainable practices
be occupied by people in the lower income brackets due to the low levels of human
development in the region. Our analysis is based on increasing the spending on healthcare
and education in these regions to the average spending in the rest of the country.
• (iv) Developing initiatives to strengthen institutions to reduce informality and illegality along
the chains, and consequently curtail the trade in the products of illegal deforestation.
For each initiative we estimated the annual investment required over the implementation lifetime.
Initiative Action
Annual cost
in 2030
� million/year
Land titling1.1 Verify land ownership and titling in the Amazon
region571
Law enforcement2.1 Hire law enforcement agents or purchase UN
standard equipment518
Judiciary
3.1 Expand the Judiciary in the small and mid-sized cities and towns in the legal Amazon
n/a
3.2 Increase the efficiency of environmental litigation (cases, statistics and oversight)
n/a
Coercion
4.1 Increase the number of agents available for conservation units
157
4.2 Hire environmental agents to deploy an accelerated environmental recovery program
57
4.3 Agents responsible for chains -
4.3.1 Hire inspectors for the cattle tracking system 32
4.3.2 Hire agents to remotely monitor the soy crop 1
4.3.3 Hire agents to improve the inspection of the charcoal production chain
21
4.3.4 Equip and train agents who inspect wood custody systems
7
Guarantee of origin
5.1 Invest in tracking systems
5.1.1 Make it compulsory to track cattle in Brazil 43
5.1.2 Institute tracking by origin in the legal Amazon –
5.2 Finalize the economic and ecological zoning of the states in the legal Amazon (limits on large scale commercial cattle raising in areas beyond the agricultural frontier)
2
Forest guardians6.1 Compensate traditional communities for
monitoring forests and planting native species171

• 38 •
PATHWAYS TO A LOW-CARBON ECONOMY FOR BRAZIL
Payments for forest conservation
7.1 Reward land owners for the opportunity cost associated with standing forests
200
Financial Incentives
8.1 Reduce the need for timber -
8.1.1 Incentives to improve sawmill efficiency 7
8.1.2 Implement large reforestation and forest management programs
243
8.1.3 Create concessions for forest handling and reforestation at the outskirts of deforestation
n/a
8.1.4 Encourage the use of alternative materials n/a
8.1.5 Support forestry R&D n/a
8.1.6 Encourage the use of alternative materials n/a
8.2 Reduce the need for pasture
8.2.1 Invest in more intense cattle raising 196
8.2.2 Develop technical service programs to enable cattle farmers to intensify their production
7
8.3 Reduce the use of native forest to make charcoal by providing subsidies to make the price of sustainable raw materials equivalent
150
Desincentivos para cadeias não sustentáveis
9.1 Increase taxes on products made from non certified timber
n/a
9.2 Restrict access to public sources of credit for cattle farmers who do not comply with environmental legislation
n/a
Desenvolvimento econômico
10.1 Invest in rural and urban area development initiatives to create jobs for those currently involved in non sustainable chains
1429
Desenvolvimento social
11.1 Improve the healthcare system 857
11.2 Improve education 929

• 39 •
PATHWAYS TO A LOW-CARBON ECONOMY FOR BRAZIL
REFERENCES and SOURCES
ABIMCI - Associação Brasileira da Indústria de Madeira Processada Estudo setorial madeira processada, 2007Main Brazilian softwood products, supply trends and prospects, 2007
ABIMOVEL - Associação Brasileira de MóveisPanorama do Setor moveleiro no Brasil, Agosto 2006
ABIOVE - Associação Brasileira de Indústria de Óleos VegetaisComplexo Soja – Estatística Mensal Ano Safra 2008/09 Sutentabilidade – Moratória da Soja
ABRAF - Associação Brasileira de Produtores de Florestas PlantadasAnuário 2007
ABRAMAT – Associação Brasileira da Indústria de Materiais de Construção Boletim Setorial 2008Perfil da cadeia produtiva da construção e da indústria de materiais, 2007
AgraFNPAgrianual 2009Anualpec 2008
AlcoaFolder Mina de Juruti - O maior desafio: Conquistar diariamente o direito de operar o empreendimento garantindo a sustentabilidade
Aliança da TerraThree Essential Strategies for Reducing Deforestation, 2007
AmataBusiness plan presentation, 2007
American Petroleum InstituteCompendium of Greenhouse Gas Emissions Methodologies for Oil and Gas Industry, 2004
Amigos da TerraO Reino do gado: uma nova fase de pecuarização da Amazônia, 2008
Amin, AshAn Institutionalist Perspective on Regional Economic Development, 1999
Ambiente BrasilPerguntas e Respostas sobre a Certificação Florestal no Brasil, 2008Ambiente Brasil, News: O Olho Eletrônico do IBAMA, dezembro 2002
AMS - Associação Mineira de SilviculturaAnuário 2008Evolução do consumo de carvão vegetal no Brasil e MG, 2008O complexo florestal industrial em Minas Gerais, 2004
Banco Mundial Margulis, S., Causas do desmatamento da Amazônia Brasileira - 1a edição, Banco Mundial, Brasília, 2003At loggerheads? Agricultural Expansion, Poverty Reduction, and Environment in the Tropical Forests, 2006
Barcelos, E. et Al.Mineração e desflorestamento na Amazônia Legal, 2002
BASA - Banco da AmazôniaExtração da madeira e agregação ao PIB da região amazônica, 2005Estudo exploratório da cadeia produtiva do carvão vegetal no estado do Pará, 2008
BNDES - Banco de Desenvolvimento Econômico e Social Painéis de madeira no Brasil: panorama e perspectivas, 2008
BP - British PetroleumStatistical Review of World Energy 2007
Bracelpa - Associação Brasileira de Papel e CeluloseRelatório Florestal 2007
CBI - Confederation of British IndustriesClimate Change Taskforce, Climate change: Everyone’s business, 2007
Center for Global DevelopmentJoining the Fight Against Global Poverty: A menu for corporate engagement, 2007
CEPEA-USP - Centro de Estudos Avançados em Economia AplicadaIndicadores de Preços (http://www.cepea.esalq.usp.br/indicador/)
CGEE - Centro de Gestão e Estudos Estratégicos

• 40 •
PATHWAYS TO A LOW-CARBON ECONOMY FOR BRAZIL
Manual de Capacitação para Projetos MDL, 2008
Chatham HouseImpact assessment: due diligence in the EU timber market, 2009
CIFOR - Center for International Forestry Research -Does tree grow on money?, 2008Milne, M., Transaction costs of forest carbon projects, 2006
Comitê Interministerial sobre Mudança do ClimaPlano Nacional sobre Mudança do Clima (PNMC), 2008
CONAB - Companhia Nacional de AbastecimentoCentral de Informações Agropecuárias
CONAMA - Conselho Nacional de Meio AmbienteResolução 406 - Parâmetros para Plano de Manejo Florestal Sustentável, 2009
Congresso Nacional Comissão mista especial sobre mudanças climáticas Relatório das atividades de 2007, 2007Projeto de Lei, Fundo Nacional Mudanças Climáticas, 2008Netherlands Environmental Assessment AgencyDe Cara, S.; Houze, M.; P-A Jayet, Methane and Nitrous Oxide Emission Pathway for Meeting the EU 2º C Climate Target: global and regional emission implications, 2006
GTZ - Deutsche Gesellschaft für Technische ZusammenarbeitForest Certification: An innovative instrument in the service of sustainable development, 2005
EIA - Energy Information Administration Technology Forecast Updates – Residential and Commercial Building Technologies – Reference Case, NavigantCOnsulting, Inc., Reference Number 117943, 2004.
Eliasch, J.Climate change: financing global forests, 2008
EMBRAPA - Empresa Brasileira de Pesquisa AgropecuáriaAquecimento Global e a Nova Geografia da Produção Agrícola no Brasil, 2008Capim Elefante: Uma Nova Fonte Alternativa de EnergiaGuzeiras na Amazônia: perigo para a floresta, 2007Plano de Negócios APRUM Acre, 2005Redução das emissões do gás carbônico através da produção de bioenergia utilizando Capim elefante, 2004Energia limpa - Capim elefante pode substituir o carvão mineral, 06/09/2006
EPE - Empresa de Pesquisa Energética Plano Nacional de Energia 2030, 2008
Europe UnionAssessment of Impact Measures to Prevent Importation or Placing Market of Illegally Harvested Timber, 2008Identifying factors of success and failure in European IST-related national/regional developments
FAO - Food and Agriculture OrganizationForestry Resources Assessment (FRA) Brazil country pre-report 2010 and 2008, and county report 2005Commercialization of Non-Timber Forest Products: Review and Analysis of Research, 2000Fertilizer requirements in 2015 and 2030FAPRI Staff Report O7-FSR1, 2007
FFT - Fundação Floresta Tropical Custos e Benefícios Financeiros da Exploração Florestal de Impacto Reduzido em Comparação à Exploração Florestal Convencional na Amazônia Oriental
Forest TrendsDeveloping markets for watershed services, 2007
Fórum Amazônia Sustentável e Movimento Nossa São PauloRelatório Setorial - Setor de Madeira no Brasil, 2008
FSC - Forest Stewardship CouncilMarket info pack, 2008
Fundação de Apoio à Pesquisa Agropecuária de Mato Grosso Clement, C.R.. Melhoramento de espécies nativas, 2001
GreenpeaceAlguns aspectos observados sobre o SISFLORAAssentamentos de papel, madeira de lei, 2008.A descentralização da gestão florestal na Amazônia brasileira, 2006Cadeia da madeira ilegal, 2005Desmatamento na Amazônia: O leão acordou.Uma análise do Plano de Ação para a Prevenção e Controle do Desmatamento na Amazônia Legal, 2008Forests for Climate: Developing a hybrid approach for REDD, 2008O rastro da Pecuária na Amazônia - MT, 2007

• 41 •
The economics of Nuclear Power, 2007
GTA - Grupo de Trabalho AmazônicoCarvão: o quinto elemento do desmatamento
IBAMA - Instituto Brasileiro do Meio Ambiente e dos Recursos Naturais RenováveisIbama em números, 2007Manual do documento de origem florestal - DOFNormas florestais federais para a Amazônia, 2007
IBGE - Instituto Brasileiro de Geografia e EstatísticaSistema IBGE de Recuperação de Informação – SIDRA
IEA - International Energy AgencyBioenergy Project Development & Biomass Supply, 2007Energy Statistics of non-OECD Countries, 2007Energy Technology Perpectives 2008 (Scenarios and Strategies to 2050).World Energy Outlook, 2007
IIED - International Institute for Environment and DevelopmentGrieg-Gan, The cost of avoiding deforestation, IIED, 2006 and 2008GTZ-Pronatura, Barreiras à Certificação Florestal na Amazônia Brasileira - a importância dos custos, 2000
ILO - International Labour OrganisationA global program: Investing in employment for poverty reduction and local economic growth, 2007
Imazon - Instituto do Homem e Meio Ambiente da AmazôniaAcertando o alvo 2, 2002A destinação dos bens apreendidos em crimes ambientais na Amazônia, 2008A pecuária e o desmatamento na Amazônia na era das mudanças climáticas, 2008Amazônia Sustentável: limitantes e oportunidades para o desenvolvimento rural, 2007Custos e benefícios do manejo florestal para produção de madeira na Amazônia Oriental, 1998Desmatamento na Amazônia indo alem da emergência crônica, 2004Desmatamento nos assentamentos de Reforma Agrária na Amazônia, 2006Fatos Florestais da Amazônia, 2003, 2005O rendimento no processamento de madeira no estado do Pará, 2008Pressão humana na floresta amazônica brasileira, 2005Quem é o dono da Amazônia? Uma análise do recadastramento de imóveis rurais, 2008Redução de desperdícios na produção de madeira na Amazônia, 1998
Instituto Carvão CidadãoA economia da escravidão no Brasil, 2006
INPE - Instituto Nacional de Pesquisas EspaciaisCâmara, G., Zoneamento Ecológico-Econômico: Bases Teóricas e Condições de Sucesso, 2008Estimativas Anuais de Desmatamento. Projeto PRODES monitoramento da floresta Amazônica Brasileira por satélite, 2009
IPAM - Instituto de Pesqsuisa Ambiental da AmazôniaMoutinho e Santilli, Submissão Internacional a UNFCCC/SBTSA. Redução de emissões de GEE oriundas do desmatamento nos países em desenvolvimento, 2007Moutinho e Schwartzman, Tropical deforestation and climate change, Environmental Defense Fund, 2005
IPAM / WHRCHoughton, R. A., Tropical deforestation as a source of greenhouse gas emissions in Tropical Deforestation and Climate Change, 2005The costs and benefits of reducing carbon emissions form deforestation and forest degradation in the Brazilian Amazon, 2007
IPCC - Intergovernmental Panel on Climate Change Carbon Dioxide Capture and Storage (CSS) Special report, 2005Fourth Assessment Report (AR4), 2007
IPEA - Instituto de Pesquisa Econômica AplicadaSituação social e demográfica dos beneficiários da reforma agrária, 1998
ISA - Instituto Socioambiental Mapa de áreas protegidas, 2007
ISIACC Florestas e mudanças climáticas, 2007
ITTO - International Tropical Timber Trade OrganizationPrices of major tropical timber and selected competing softwood products, 2008Annual review and assessment of the World timber situation, 2008Developing Forest Certification, Brazil case, 2008Market reports 2008 and 2009
IUCN - International Union for Conservation of NatureBuilding biodiversity business, 2008
IWC - International Woodland CompanyAnnual report 2007

• 42 •
PATHWAYS TO A LOW-CARBON ECONOMY FOR BRAZIL
Timberland Investments in an Institutional Portfolio, 2008
Katoomba GroupConservation Economy Backgrounder, 2008
LafisEstudo setorial - Materiais de acabamento, 2008
MAPA - Ministério da Agricultura, Pecuária e AbastecimentoCadeia produtiva da madeira, 2008
McKinsey & CompanyPathways to a low carbon economy v 2.0, 2009McKinsey Quarterly, Global Cost Curve Version 1: A Cost curve for greenhouse gas reduction, 2007
McKinsey Global InstituteCurbing global energy demand growth: The energy productivity opportunity, 2007The carbon productivity challenge: Curbing climate change and sustaining economic growth, 2008The case for investing in energy productivity, 2008
MCT - Ministério da Ciência e TecnologiaComunicação Nacional do Brasil e Convenção Quadro Sobre Mudanças Climáticas, 2004
MDA - Ministério do Desenvolvimento AgrárioDados de assentamentos na Amazônia Legal até outubro de 2007, 2008Plano Nacional de Reforma Agrária (PNRA), 2004
MDIC - Ministério do Desenvolvimento, Indústria e Comércio exteriorAliceweb
MIDIC - Ministério da Indústria e ComércioManaus Free Trade Zone: Business Opportunity and Investment in Amazon, 2006
MIT - Massachusetts Institute of TechnologyThe Future of Coal, 2007
MMA - Ministério do Meio AmbienteCaderno de Referência - Programa Zoneamento Ecológico Econômico, 2006Contas abertas, Orçamento do MMA até 2008, 2008Instrução Normativa 05 - Procedimentos para Plano de Manejo Florestal Sustentável, 2006Modelo de Licenciamento ambiental em propriedade rural na Amazônia Legal, 2002Pilares para o Plano de Sustentabilidade Financeira do SNUC, 2007Plano Amazônia Sustentável, 2008Plano Nacional de Áreas Protegidas, 2008Relatório de Avaliação do Programa piloto proteção florestas tropicais, 2006Unidades de conservação no Brasil, 2007
MTE - Ministério do Trabalho e EmpregoRAIS-CAGED - Indicadores de emprego e desemprego, 2006 e 2007
OCDE - Organization for Economic Cooperation and DevelopmentBuilding Competitive Regions, 2005The economics of illegal logging and associated trade, 2007Incentives to reduce GHG emissions from deforestation: lessons learned from Costa Rica and Mexico, May 2007
OneStone Consulting GroupCement Projects Focus 2010, 2006
ORSARelatório de Sustentabilidade, 2007
PNUD - Programa das Nações Unidas para o DesenvolvimentoRelatório de Desenvolvimento Humano no Brasil, Atlas do Desenvolvimento Humano, 2000
Portal da Madeira ManejadaDocumento de Origem Florestal (DOF)
Presidência da RepúblicaMedida Provisória n. 458 de 10/fevereiro/2009 – Dispõe sobre a regularização fundiária das ocupações incidentes em terras situadas em áreas da União
Revista NatureModelling conservation in the Amazon basin, 2006Large-scale impoverishment of Amazonian forests by logging and fire, 1999
Revista ScienceBeyond Deforestation: Restoring Forests and Ecosystem Services on Degraded Lands, 13 de Junho de 2008
SBS - Sociedade Brasileira de SilviculturaFatos e números do Brasil florestal, 2007
SFB - Serviço Florestal BrasileiroApresentação Combating Deforestation and Promoting Sustainable Development in the Amazon – The Amazon Fund, 2008
Sindiferpa – Sindicato das Indústrias de Ferro Gusa do Estado do Pará

• 43 •
PATHWAYS TO A LOW-CARBON ECONOMY FOR BRAZIL
Revista Pólo Sustentável Nov/2007
SRI ConsultingCEH Marketing Research Report: Nitric Acid, Donald H. Lauriente, 2007
Standard & PoorsListed Global Timber & Forestry Assets, August 2007
Stern, N.Stern Review, 2007
Suframa - Superintendência da Zona Franca de Manaus Indicadores de Desempenho do Pólo Industrial de ManausTyndall CentreReducing Greenhouse Gas Emissions from Deforestation in Developing Countries - Revisiting the Assumptions, 2007
UFPA - Universidade Federal do ParáDe Abreu Monteiro, M et. al,. Desmatamento na Amazônia Brasileira: desocultando o papel da produção de carvão vegetal nas mudanças espaciais recentes, 2005
ULCOS - Ultra–Low Carbon Dioxide SteelmakingIntra European manufacturers project for ultra low CO2 steel making,
UNEP - United Nations Environment Program Cross-sectorial toolkit for the conservation and sustainable management of forest biodiversity, 2008Geo Amazonia, 2008
UNCTAD - United Nations Conference on Trade and DevelopmentInvestment Policy Review: Brazil, 2005
UNFCCC - United Nations Framework Convention on Climate Change Clean development Mechanisms Project design: document for Afforestation and Reforestation project activities, Facilitating Reforestation for Guangxi Watershed Management in Pearl River Basin, 2006Investment and Financial Flows to Address Climate Change, 2007Investment flows and finance schemes in the forestry sector with particular reference to developing countries need – final report, 2007
UNICAMPAssessment of greenhouse gas emissions in the production and use of fuel ethanol in Brazil, 2004
USAID MOROCCOPromoting Rural Tourism, 2006
U.S. Department of Agriculture Forest ServiceMoulton, R.J., and Richards, K.R., Costs of sequestering carbon through tree planting and forest management in the United States, General Technical Report WO-58, 1990
U.S. Environmental Protection AgencySathaye et al., GHG mitigation potential, costs and benefits in global forests, 2005Sathaye, J. et al., GHG Mitigation Potential, Cost in Global Forestry: A Dynamic Partial Equilibrium Approach, 2005 Greenhouse Gas Mitigation Potential in U.S. Forestry and Agriculture, EPA 430-R-05-006, 2005
USP - Universidade de São Paulo Fischer, R., Desenvolvimento e sustentabilidade: um estudo de alianças estratégicas intersetoriais no empreendedorismo social, 2007Galdos, M., Estoque de carbono na cana de açúcar, 2007Movimento Nossa São PauloConexões sustentáveis: São Paulo-Amazônia. Quem se beneficia com a destruição da Amazônia, 2008
WRI - World Resources InstituteClimate Analysis Indicators Tool (CAIT) Version 6.0, 2009Country Profiles on line, 2003
WWF - World Wide Fund for NatureEfetividade de gestão das unidades de conservação federais do Brasil, 2007Illegal wood for the European market, 2008Keeping the Amazon forests standing: a matter of values, 2009
ZEW - Centre for European Economic ResearchAnger and Sathaye, Reducing Deforestation and Trading Emissions Economic Implications for the post-Kyoto Carbon Market, 2007


• 45 •
PATHWAYS TO A LOW-CARBON ECONOMY FOR BRAZIL
Amsterdam
Antwerp
Asia House Frankfurt
Athens
Atlanta
Auckland
Bahrain
Bangkok
Barcelona
Beijing
Berlin
Bogota
Boston
Bratislava
Brussels
Bucharest
Budapest
Buenos Aires
Calgary
Caracas
Casablanca
Charlotte
Chicago
Cleveland
Cologne
Copenhagen
Dallas
Delhi
Detroit
Dubai
Dublin
Düsseldorf
Frankfurt
Geneva
Gothenburg
Hamburg
Helsinki
Hong Kong
Houston
Istanbul
Jakarta
Johannesburg
Kuala Lumpur
Lima
Lisbon
London
Los Angeles
Luxembourg
Madrid
Manila
Melbourne
Mexico City
Miami
Milan
Minneapolis
Montréal
Moscow
Mumbai
Munich
New Jersey
New York
Orange County
Oslo
Pacific Northwest
Paris
Philadelphia
Pittsburgh
Prague
Rio de Janeiro
Rome
San Francisco
Santiago
São Paulo
Seattle
Seoul
Shanghai
Silicon Valley
Singapore
Sofia
Stamford
Stockholm
Stuttgart
Sydney
Taipei
Tel Aviv
Tokyo
Toronto
Verona
Vienna
Warsaw
Washington, D.C.
Zagreb
Zurich
© McKinsey & CompanyRua Alexandre Dumas, 1711, 10th floor04717-004 • Chácara Santo AntonioSão Paulo - SP