passion & purpose - tbf/media/tbforg/files... · passion & purpose raising the fiscal...
TRANSCRIPT

U N D E R S T A N D I N G B O S T O N
Passion & PurposeRaising the Fiscal Fitness Bar for Massachusetts Nonprofi ts
The Boston Foundation
June 2008

About the Boston Foundation
The Boston Foundation, Greater Boston’s community foundation, is one of the oldest and largest community foundations in the nation, with assets of almost $900 million. In 2007, the Foundation and its donors made some $92 million in grants to nonprofit organizations and received gifts of more than $90 million. The Foundation is made up of some 900 separate charitable funds established by donors either for the general benefit of the commu-nity or for special purposes. The Boston Foundation also serves as a major civic leader, provider of information, convener, and sponsor of special initiatives designed to address the community’s and region’s most pressing challenges. For more information about the Boston Foundation, visit www.tbf.org or call 617-338-1700.
UNDERSTANDING BOSTON is a series of forums, educational events and research sponsored by the Boston Foundation to
provide information and insight into issues affecting Boston, its neighborhoods and the region. By working in col-
laboration with a wide range of partners, the Boston Foundation provides opportunities for people to come together
to explore challenges facing our constantly changing community and to develop an informed civic agenda.
Copyright © 2008 by The Boston Foundation. All rights reserved.

Passion & PurposeRaising the Fiscal Fitness Bar for Massachusetts Nonprofits
AuthorsElizabeth Keating, Ph.D, CPA, Visiting Assistant Professor,
Carroll School of Management, Boston CollegeAssociate Scholar, Center for Nonprofits and Philanthropy, Urban Institute
Geeta Pradhan, Director of Programs, The Boston Foundation
Gregory H. Wassall, Ph.D, Associate Professor of Economics, Northeastern University
Douglas DeNatale, Ph.D, President, Community Logic, Inc.
EditorBarbara Hindley, The Boston Foundation
Publication CreditsMary Jo Meisner, Vice President for Communications,
Community Relations and Public Affairs, The Boston Foundation
David Trueblood, Director of Public Relations, The Boston Foundation
DesignKate Canfield, Canfield Design
ProductionMatt Mayerchak


Contents
Preface by Paul S. Grogan
Introduction . . . . . . . . . . . . . . . . . . . . . . . . . . . . . . . . . . . . . . . . . . . . . . . . . . . . . . . . . . . . . . . . . . . . . . . . . . . . . . . . . . 5
Executive Summary . . . . . . . . . . . . . . . . . . . . . . . . . . . . . . . . . . . . . . . . . . . . . . . . . . . . . . . . . . . . . . . . . . . . . . . . . . . . 7
ChapteR ONe The Massachusetts Nonprofit Sector – A Snapshot and Growth Trends . . . . . . . . . . . . . . . . . . . . . . 17
ChapteR twO Three Value Propositions – Financial Fitness by Organization Budget Size . . . . . . . . . . . . . . . . . . 26
ChapteR thRee Financial Health Across 10 Industry Sectors . . . . . . . . . . . . . . . . . . . . . . . . . . . . . . . . . . . . . . . . 41
ChapteR FOuR Regional Distribution of Nonprofits – Does It Stack Up Against Need? . . . . . . . . . . . . . . . . . . . . . 81
Conclusion . . . . . . . . . . . . . . . . . . . . . . . . . . . . . . . . . . . . . . . . . . . . . . . . . . . . . . . . . . . . . . . . . . . . . . . . . . . . . . . . . 104
Technical Appendices
A. THE INDUSTRy SECTOR COMPOSITION OF MASSACHUSETTS PUBlIC CHARITIES . . . . . . . . . . . . . . . . . . . . . . . . . . . . . . . . . . . . . . . . . . 107
B. GlOSSARy OF TERMS . . . . . . . . . . . . . . . . . . . . . . . . . . . . . . . . . . . . . . . . . . . . . . . . . . . . . . . . . . . . . . . . . . . . . . . . . . . . 108
C. RESTRUCTURING OPTIONS . . . . . . . . . . . . . . . . . . . . . . . . . . . . . . . . . . . . . . . . . . . . . . . . . . . . . . . . . . . . . . . . . . . . . . . . . 109
ENDNOTES . . . . . . . . . . . . . . . . . . . . . . . . . . . . . . . . . . . . . . . . . . . . . . . . . . . . . . . . . . . . . . . . . . . . . . . . . . . . . . . . . . . . 110
ABOUT THE AUTHORS . . . . . . . . . . . . . . . . . . . . . . . . . . . . . . . . . . . . . . . . . . . . . . . . . . . . . . . . . . . . . . . . . . . . . . . . . . . . . . 111
ACkNOwlEDGEMENTS . . . . . . . . . . . . . . . . . . . . . . . . . . . . . . . . . . . . . . . . . . . . . . . . . . . . . . . . . . . . . . . . . . . . . . . . . . . . . 112

4 u n d e r s t a n d i n g B o s t o n
Preface
This report is titled Passion & Purpose because almost all nonprofit organizations begin with a deeply felt sense of mission on the part of a group of people or, in some cases, an individual. After that initial spark, however, the rubber hits the road and the real work begins. And as nonprofits evolve over the years, a whole host of issues surface, many of them related to organizational growth and financial stability.
You will find a tremendous amount of detail about the Commonwealth’s nonprofit sector in these pages—not only its finances, which are the primary focus, but its size, scope, workers and geographic reach. There are close to 37,000 nonprofit organizations in Massachusetts generating more than $86 billion in revenues and holding some $207 billion in assets. Almost 14 percent of the Massachusetts workforce is employed by nonprofits. The diversity within the sector is also striking—embracing everything from small theater troupes in the Berkshires to human services agencies in every part of the state—to one of the most richly endowed universities in the world.
But this report is not only descriptive of the sector. It sounds a very serious alarm about how stressed and extremely vulnerable our state’s nonprofit sector is in today’s economy and issues a clarion call to nonprofit orga-nizations, especially those that are small and mid-sized, to consider innovative, even bold strategies to buoy their chances of surviving in uncertain times. This call goes out not just to the staffs and boards of these organizations, but to all of their stakeholders and supporters, including government, foundations and individual donors.
One of the major challenges facing the nonprofit sector in Massachusetts today is its dramatic growth over the last two decades. In just 18 years, the number of public charities in this state has virtually doubled. In an expan-sive, booming economy, this kind of growth might be welcome or at least sustainable, but in an economy that is shrinking, it is cause for serious concern.
History tells us that when our economy goes flat, the government’s instinct is to cut funds. It took years for the nonprofit sector to recover from the economic downturn that started in 2001 and was exacerbated by 9/11, when cuts in government support choked support for the kinds of basic human services that so many nonprofits provide.
The good news is that today the nonprofit sector in our state has more going for it than ever before. Until recently, Massachusetts was one of just a few states without an association to represent the interests of its nonprofit organizations. But in 2007, hundreds of nonprofits statewide began to find their voice and speak as one when the Massachusetts Nonprofit Network was created to strengthen the sector through advocacy, capacity-building and public awareness.
And now, with this detailed report, we have the power of information and a series of specific recommendations for shoring up this all important sector. So, in addition to providing a tremendous amount of data and analysis, we hope that this report will open a dialogue about how to strengthen the Commonwealth’s nonprofit sector and help to prepare it for hard times, whenever they may come.
Paul S. GroganPresident and CEOThe Boston Foundation

5p a s s i o n & p u r p o s e : R a i s i n g t h e F i s c a l F i t n e s s B a r f o r M a s s a c h u s e t t s N o n p r o f i t s
Introduction
The nonprofit sector plays a vital role in supporting the long-term needs and well-being of our state and our nation—from providing health care and social services, to offering a platform for arts and culture, to coping with everything from economic downturns to global warming. Strong financial health is essential to fulfill-ing these all-important roles, yet scholars and skeptics both express serious concerns about the sector’s weak financial health—with debates ranging from ques-tions about the sector’s ability to sustain vital services to concerns about its inefficiencies and duplication of services. Some argue that the sector’s financial weak-ness is due to the rapid proliferation of organiza-tions that are competing with each other for financial resources. Others view the shortage of funding as a serious threat to the fabric of the entire sector.
Notwithstanding these concerns, the Massachusetts nonprofit sector is an unmistakably major contributor to the Commonwealth and its economy. The economic importance of the nonprofit sector’s 36,748 nonprofit organizations is clearly evident from its earnings of $86.7 billion in revenues and $207.1 billion in total assets in 2007. With more than a quarter of these reve-nues spent annually on compensation, the nonprofit sector is also a solid source of employment in the state, employing well over 447,642 people or 13.8% of state’s workforce. Public charities comprise the majority of the sector (23,886 or 81%), generating $70.4 billion in revenues with $168.6 billion in total assets.
However, the true value of the nonprofit sector lies in its ‘public purpose’. From reducing health dispari-ties, to counseling families facing home foreclosures, to providing higher education, to training immigrants for jobs in the new economy, Massachusetts nonprof-its provide critical services. They advocate for change on important community issues from civil rights to the environment, and express community values and invigo-rate life into our communities through arts and cultural activities. They engage thousands of volunteers and workers and bring personal passion and commitment to serving the public good. They build the community’s social capital, foster innovation and spur social change.
Abolition. Suffrage. The great cultural institutions constructed at the end of the 19th century, such as Symphony Hall and the Museum of Fine Arts. The affordable housing movement. The most extensive network of Community Health Centers in the country. The creation of First Night. The founding of City Year. Stories of the nonprofit sector’s impact illuminate the history of the Commonwealth, reminding us of the numerous times that collective civic action gave rise to the civic institutions and social movements which have shaped our country, enriched our society, and improved the quality of all of our lives. Most of all, nonprofit organizations offer numerous benefits that are neither the purpose nor the purview of the private and public sectors.
“The 21st century will be the century of the social sector organization. The more economy,
money, and information become global, the more community will matter. And only the
social sector nonprofit organization performs in the community, exploits its opportunities,
mobilizes its local resources, solves its problems. The leadership, competence, and
management of the social sector nonprofit organization will thus largely determine the
values, the vision, the cohesion, and the performance of the 21st century society.”
—Peter Drucker, Leader to Leader Institute

6 u n d e r s t a n d i n g B o s t o n
This report examines the overall health of the nonprofit sector, with a particular focus on financial health. What types of organizations exhibit strong or weak financial attributes? Does financial health vary by budget size? Do organizations in certain sub-sectors exhibit greater financial strength? What factors are associated with better financial health? The answers to these questions form the basis for a series of recommendations related to restructuring and consolidation, as well as changes to the funding strategies and policy implications neces-sary for the sector’s future sustainability. This report represents not the end but the beginning of a dialogue that ultimately will strengthen the entire sector—building on the powerful combination of passion and purpose that drives nonprofit organizations to inno-vate, to excel, and, always, to serve the interests and concerns of the people of Massachusetts.
A deep look at the nonprofit sector uncovers three primary value propositions: 1) the creation of a civil society through grassroots action and volunteerism; 2) the provision of societal benefit and a ‘safety net’ through the delivery of services and quality of life contributions; and 3) large-scale services and contributions to the state’s economic health and competitiveness. These three value proposi-tions are represented by three different segments of the sector. Distinguished in this report as “Grass-roots” organizations, “Safety Net” organizations and “Economic Engine” organizations, these three segments typically exist in a variety of business envi-ronments and exhibit differing financial health indica-tors. They encompass the broad diversity of the sector and urge us to look at practices of running and fund-ing nonprofits with a more nuanced view of the value of the sector, as we make hard decisions about how best to enhance the entire sector’s capacity to meet its stated purposes.

7p a s s i o n & p u r p o s e : R a i s i n g t h e F i s c a l F i t n e s s B a r f o r M a s s a c h u s e t t s N o n p r o f i t s
Passion & Purpose: Raising the Fiscal Fitness Bar for Massachusetts Nonprofits is both a primer on the state’s nonprofit organizations and a call to action. It aims to further the understanding of Massachusetts nonprofits and the value they provide, as well as take a hard look at the sector to underscore the importance of financial health as a necessary and critical condition to meeting its public purpose. The report calls upon all stakehold-ers—government, foundations, investors and nonprof-its themselves—to raise the fiscal fitness bar by looking at strategies, practices and policies to strengthen the Massachusetts nonprofit sector so that it can continue to serve as a powerful ‘glue’ for our communities, an expression of our values, and an important contributor to our state’s competitive edge.
A Snapshot of the Massachusetts Nonprofit SectorDoubling in size over the last two decades, today’s Massachusetts Nonprofit Sector has evolved into a principal provider of services, a major employer and a formidable economic player in the Commonwealth. In late 2007, the nonprofit sector in Massachusetts was estimated to include almost 36,748 nonprofit orga-nizations that earned $86.7 billion in revenues and held $207.1 billion in total assets.1 Of this total, public charities—the principal focus of this report at 29,766 organizations—made up 81% of the sector, generated $70.4 billion in revenues and held $168.6 billion in total assets. As an employer, the Massachusetts nonprofit sector as a whole accounted for 13.8% of the Massachu-setts working population in 2007 with 447,642 workers2 whose total wages amounted to $20.8 billion. Massa-chusetts has the fourth highest percentage of total nonprofit workers with Washington, DC leading with 16.2% of its working population.3
The Massachusetts nonprofit sector’s importance was evident in its vital role during the economic down-turn that followed the technology bust of 2000 and post 9-11. During the 2001–2004 period, Massachusetts
experienced a 5.5% decline in employment overall, yet educational services and health care/social assistance programs experienced employment growth of 5.8% and 5.5%, respectively.4 Using these large classifica-tions, health care and social assistance programs added more employees than any other sector (22,205) with educational services coming in second at 6,404 addi-tional employees. In the 2004 to 2006 period, these two sectors grew in terms of employment faster than the state rate of 1.8%, posting gains of 4.1% (health care) and 3.1% (education). Again health care provided the largest number of new jobs with 17,492 and the educa-tion sector adding 3,699 new jobs.
Spread across a wide variety of industries, nonprofits touch all aspects of our lives and our communi-ties. Offering a wide range of services, the highest concentration of nonprofits can be found in areas that
Executive Summarythe State Of the Massachusetts Nonprofit Sector & a Call to action
Principal Sources for 2007 Snapshot DataThere is no single source of current data on nonprof-its. This study therefore uses a combination of data from the Internal Revenue Service (IRS), the National Center for Charitable Statistics, the American Community Survey of the US Census, and the Massa-chusetts Department of Unemployment Assistance to provide a current snapshot of the Massachusetts Nonprofit Sector.
Form 990 Filing Public Charities as the Empirical Focus of the Study
The report’s quantitative analysis is focused on the subset of federally registered public charities that filed an annual Form 990 return with the IRS in 2003, the most recent year for which digitized Form 990 data is available. The sample includes 8,312 public charities that receive more than $25,000 in revenue and are required to file a return, and excludes most churches. Some charities that voluntarily file are also included in this analysis.

8 u n d e r s t a n d i n g B o s t o n
essentially define the image and competitive edge of Massachusetts as the “Education and Health Care Mecca,” with a rich and vibrant Arts and Cultural environment, and a community that cares deeply about its most vulnerable members. Of the 10 industry sectors defined further in this report, Massachusetts nonprofits are most densely concentrated in the areas of: Education, Science, Technology & Social Sciences, at 19% of the total; followed by Arts, Culture & Humani-ties organizations, at 14% of the total; and three other areas—Youth Development, Human Services, and Health Care—each accounting for 10% of the total.
The sector’s 36,748 nonprofits include 17,900 organi-zations that are non-filers and are under $25,000 in budget size, 5,647 organizations that have budgets under $25,000 but file the Form 990 with the IRS, and 7,655 organizations with budget sizes that range between $25,000 and $250,000. The total also includes 5,380 organizations with budgets between $250,000 and $50 Million, and 166 organizations whose budgets exceed $50 million.
Found in every community across the Commonwealth, on a strictly numeric basis, nonprofit organizations are concentrated in the eastern half of the state, with the highest concentration in Suffolk, Middlesex, Norfolk and Essex Counties. As data show, nonprofits are more heavily concentrated in urbanized areas. Greater Boston, Worcester, Springfield, Holyoke, Pittsfield, New Bedford, and Fall River form distinct clusters.
Three Value PropositionsA thoughtful analysis of the breadth and depth of the entire Massachusetts nonprofit sector reveals three fundamental value propositions that capture its full range of activities and services:
n Creation of civil society through grassroots action and volunteerism;
n Provision of societal benefit and a “safety net” provision through the delivery of services and quality of life contributions; and
n Large-scale services and contributions to the state’s economic health and competitiveness.
Organizations can benefit the community through a combination of these value propositions, but most organizations exhibit one more fully than the others. For the purposes of this report, budget size was combined with these value propositions to create three categories of nonprofits: “Grassroots” organiza-tions are those with $250,000 or less in total expenses; “Safety Net” nonprofits range from $250,000 to $50 million in total expenses; and “Economic Engine” nonprofits report $50 million or more in total expenses. These three segments typically exist in a variety of business environments and exhibit differing financial health indicators. Five major business models based on financial characteristics and revenue streams are found across the spectrum of these public charities. They include: Support Organizations, Membership Organiza-tions, Expressive Voice Organizations, Service Providers, and Large Institutions (See page 27 for descriptions). These business models can also be found across differ-ent sub-sectors in the 10 industry sectors defined by the mission focus of organizations.
As the analysis illustrates, the financial health outcomes of nonprofit organizations tend to vary most significantly by budget size, which is closely related to value propositions. And while this classification by budget size may seem over-simplified, it helps us grapple with the complexity, breadth and depth of nonprofit activities. It also enables us to look at prac-tices of running, funding, and supporting nonprofits with a deeper view of the value of nonprofits as we make choices about how best to enhance the sector’s capacity to meet its stated public purpose.
Number of Organizations Non Filers < $25k $25k to $250k $250k-$50M >$50M Total
Year 1995 15,144 1,504 5,975 4,214 116 26,953
Year 2003 (Analysis Year) 16,572 5,560 7,134 4,825 138 34,229
Year 2007 17,900 5,647 7,655 5,380 166 36,748
9p a s s i o n & p u r p o s e : R a i s i n g t h e F i s c a l F i t n e s s B a r f o r M a s s a c h u s e t t s N o n p r o f i t s
are critical for mission fulfillment now and into the future. An organization that exhibits strong financial stewardship can answer affirmatively to the following four questions posed by Regina Herzlinger in her 1996 Harvard Business Review article “Can Public Trust in Nonprofits and Governments be Restored?:”
1. Are the organization’s goals consistent with its financial resources?
2. Is the organization practicing intergenerational equity?
3. Are the sources and uses of funds appropriately matched?
4. Is the organization sustainable?
As the analysis in this report will show, there is no single set of financial indicators and ratios to which the entire sector can be held. The financial health of nonprofits must, therefore, be seen in context—of simi-larly sized organizations with similar business models and similar mission and organizational activities.
The financial analysis on which this report’s recommen-dations are based will focus on indicators of short- and long-term financial health that relate to these questions: Liquidity, Profitability and Sustainability. For an explanation of technical terms, see Appendix B.
1. liquidityDoes the organization have sufficient cash resources to deliver its mission and pay its obligations on a timely basis?
Several different measures can help to assess liquid-ity. Cash on hand, which compares the cash balance to operating expenses (total expenses less depreciation), indicates how many days or months of expenses an organization can cover out of current cash holdings without liquidating investments or relying on new revenues. A rule of thumb that is often used asserts that nonprofits should have three months of cash on hand as a liquidity buffer. The study also looks at other liquidity measures, such as net operating cycle, which compares net working capital5 to operating expenses, and the inverse current ratio,6 which is current liabilities divided by current assets or the resources needed to be paid in cash or delivered in services in the next 12 months against liabilities over the 12-month period.
what Constitutes Nonprofit Financial Health?A consensus does not exist about what does or should constitute financial health for a nonprofit organiza-tion. The use of the term ‘nonprofit’ to define the sector has resulted in a view held by many nonprofit boards, executives, and funders that nonprofits should oper-ate with zero annual profit. This view maintains that holding valuable resources in anticipation of future needs or potential funding disruptions means forego-ing provision of much needed services today. Under this current services view, nonprofits are not created to generate profits, but rather to serve the public. Hence many nonprofits feel compelled to devote the bulk of their income toward current program services, operate with breakeven budgets, and invest little in support services, such as organizational capacity, administra-tion and fundraising.
Staffing is kept to a minimum, and volunteers and modest wages are encouraged. This approach results in relatively small organizations that generally grow opportunistically when funding prospects arise, with few investments or cash reserves either to sustain operations—during economic downturns or funding disruptions—or to expand to meet increased demand for services. Increasingly, the nonprofit sector and its stakeholders are questioning this approach as it creates a plethora of small organizations that are financially fragile, and run the risk of being unable to sustain their mission and provide program services at current levels into the future.
An alternative view is that the financial health of nonprofits should be measured using modified finan-cial ratios commonly employed in the for-profit sector. The financial statement view suggests a focus on a few key ratios to assess a nonprofit’s health in comparison to some standards of financial health, such as holding three months of cash on hand, operating with modest surpluses or maintaining low levels of debt. This approach, however, does not take into consideration the heterogeneity of the sector, in terms of size, mission or business model. It also assumes organizations with lower levels of debt are financially healthier; however, in the nonprofit sector, organizations are often impaired because they lack sufficient access to credit.
This study presents a broader analytic framework called ‘Financial Stewardship’—an approach rooted in the belief that strong financial health and accountability

10 u n d e r s t a n d i n g B o s t o n
While higher leverage is considered a risk factor in the corporate sector, a lack of leverage may be problem-atic for many nonprofits. A for-profit is encouraged to borrow to fund long-lived assets (e.g., buildings and land) and overcome short-term liquidity needs when necessary. As borrowing allows firms to grow internally, deal with cash flow fluctuations, or acquire others and interest is tax-deductible, leverage is encouraged up to the point that a firm may no longer be able to service its debts in a timely fashion.
In a nonprofit setting, most forms of debt (excluding publicly issued bonds) do not benefit from tax exemp-tion-related subsidies, making it less attractive. In addition, many nonprofits are not offered the ability to borrow from a lender, vendor or even a funder. These factors combined cause nonprofits to rely relatively little on credit or debt financing. Therefore, a high percentage of nonprofits in this study (44%) report no current liabilities and one-third report no liabilities at all. The Grassroots and Economic Engine organiza-tions (with some exceptions) tend to fall neatly into the extremes of financial distress and health. In between the two extremes are the Safety Net organizations that are working to develop sufficient financial resources to escape the constant financial pressures associated with meeting payroll and remaining open to shift their eventual focus to being professionally run, financially stable institutions.
State of the Massachusetts Nonprofit SectorThe report’s quantitative analysis is focused on the subset of federally registered public charities that filed an annual Form 990 return with the IRS in 2003, the most recent year for which digitized Form 990 data is available. The sample includes 8,312 public charities that filed a return, which includes most nonprofits with more than $25,000 in revenue, and some charities (mainly churches) that voluntarily filed. The quantita-tive analysis (discussed in detail later in this report) forms the basis of the recommendations in this report. It looks at financial characteristics and financial health of nonprofits across budget size or industry sector. It also compares the regional distribution of nonprofits against socioeconomic indicators to see how the distri-bution compares to need. The following is a synthesis of the analysis:
2. ProfitabilityHas the organization earned new economic revenues sufficient to cover current expenses and allow for appropriate growth and a margin for error?
Profitability in the nonprofit sector is generally measured by net income (annual deficit or surplus) as a percent of total revenues. This measure is known as the surplus margin. Many organizations operate based on annual budgets that call for breakeven operations, i.e. a surplus margin of 0%. This goal, however, does not ensure that current resources are sufficient to meet current needs, while also providing adequate resources to allow for intergenerational equity and organizational sustainabil-ity. Specifically, it does not take into consideration four issues: current financial health, economic growth, contin-gencies, and projected future service needs.
Most organizations do not budget for positive surplus margins sufficient to build their existing financial resources to the target level that is desirable for their industry sector and business model. As nonprofits cannot issue stock, running surpluses (either in opera-tions or in capital gifts) or reinvesting endowment income are the only methods to grow the organiza-tion’s resource base. To be sustainable, organizations need to keep pace with inflation or real economic growth. Breakeven budgets also fail to recognize that budgets are estimates and that unexpected events often have an adverse effect on earnings. The final factor to consider in setting a budget target is the level of expected future service needs.
Combined, these factors suggest that many nonprofits should budget and operate regularly with positive surplus margins in the 2% to 5% range.
3. SustainabilityDoes the organization have enough of its own resources to continue operations into the future?
This concept is the hardest to assess well, since a busi-ness outlook is not offered with the financial state-ments. As forward-looking information is not readily attainable, sustainability in this study will be measured using leverage. This measure is defined as total liabili-ties divided by total assets, and it measures the degree to which an organization relies on debt rather than its own resources—known as net assets7—to fund its assets.

11p a s s i o n & p u r p o s e : R a i s i n g t h e F i s c a l F i t n e s s B a r f o r M a s s a c h u s e t t s N o n p r o f i t s
have less need to grow in size or in mission scope. For niche organizations to thrive, they must be able to sustain a positive surplus margin, have no outstanding payables/bills, and maintain two to three months of cash on hand.
Given the growing competition, these nonprofits can be well served by consolidation of operations such as back office support functions, space, staff and infra-structure or by mergers with more stable entities particularly for organizations that are neighborhood based or mission aligned.
Safety Net Organizations Often characterized by staffed organizations, the sector’s 3,601 Safety Net organizations were those with budgets ranging between $250,000 to $50 million. This represents a broad spread, which in the quantita-tive analysis has been further broken down into four budget-size groupings: $ 250,000 to $1 million; $1–5 million; $5–10 million; and $10–50 million. These orga-nizations are typically concentrated in the program areas of Housing (62%), followed by Human Services (60%), Health & Medical (60%), and Community Capacity (46%)—industry sectors that provide a bulk of the safety net and quality of life services for commu-nities. Business models that define most of the organi-zations in this classification are the ‘service provider’ and ‘large institution’ model.
Safety Net organizations offer both critical human services and quality of life enhancing services. Some examples of sub-sectors where these organizations
Grassroots OrganizationsThe fastest growing segment of the three types of nonprofits identified for this report is Grassroots orga-nizations with budgets of under $250,000. In 2003, 4,574 such organizations filed Form 990s, accounting for 55% of the filing entities in Massachusetts. They are concentrated in industry sectors or program areas related to: Youth Development and Recreation (75%); Philanthropy (74%); Arts, Culture & Humanities (70%); Environment (67%); and Education (57%). Some examples of sub-sectors within these industries where small organizations are concentrated include: Perform-ing Arts Organizations—representing the ‘Expressive Voice’ business model that are typically founder-led and hire actors and performers on an as needed or contractual basis; or Amateur and Professional Sports Organizations—representing the ‘Membership’ business model that are typically volunteer driven organiza-tions that depend upon annual membership drives and contributions.
These organizations are cash driven with little or no opportunity or means for investment with more than 40% of organizations having 10% or less of their assets financed by debt. They are largely volunteer and shrink or grow over time in relation to their cash resources. Just over a quarter have cash on hand of 30 days or less, while almost half of them report annual deficits.
In addition to being the fastest growing of the three nonprofit types, Grassroots organizations are an incubator for new ideas and start-up organizations. A number of them have a niche focus and, therefore,
Grassroots OrganizationsFinancial Characteristics Financial Condition of Median Organization Recommended range
Organization Budget Size $0 to $250,000Liquidity: Days Cash on Hand 55 days 60–90 days
Percent with Employees 30.5%Liquidity:Inverse Current Ratio 0.0* Over 0 and under 1
Dominant Asset CashProfitability:Surplus Margin 5.0% 2–5% minimum
Dominant Revenue ContributionsSustainability:Leverage 0.0* Over 0 and under 1
Dominant Expense None
* indicating no current liabilities

12 u n d e r s t a n d i n g B o s t o n
are concentrated include: Residential Care, Adult Day Care & Independence Services, Children & Youth, Hous-ing Development, and Mental Health Services. They represent the ‘service provider’ business model that is often heavily funded by federal, state and local government resources and generally paid in arrears (such as through cost-reimbursement). These funders often do not cover or cover fully important costs, and discourage profitability. As a result, many of these organizations see their cost of services not fully funded and have to raise additional funds for opera-tions and to cover the gap in funds.
As Service Providers, these organizations depend upon stable staff, which creates a recurring fixed cost struc-ture. A recent study conducted by the Massachusetts Executive Office of Health and Human Services found that one-third of them report annual deficits, with a total of 60% reporting surplus margins at 2% or lower. Almost half of the providers have liabilities in excess of net assets and 4% have negative net assets. Cash on hand is quite low, with 60% of providers holding under 30 days of cash on hand.
Other Safety Net organizations are spread across the Arts, Education and Environment program areas, and, by virtue of their size and financial characteristics, fit the ‘Large Institution’ business model. In the Arts, these organizations are found in the Museums, Historical Societies, Performing Arts and Media and Communications sub-sectors. Their revenues depend on contributions and also ticket sales and memberships. With the excep-tion of Media and Communications, these entities have extensive investments (45%–56% of assets) and
fixed assets (23%–30% of assets). Surplus margins fall heavily in the 2–5% range. Median cash levels are on average quite high for the sector ranging from 83 to 177 days of operating expenses. This category, similar to the Economic Engine organizations category has more access to instruments of bond and mortgage financing than organizations in many other sectors.
Safety Net organizations make up the heart and soul of the nonprofit sector and solutions for this critical group lie largely in the approach funders take to covering the full cost of services they are purchasing with a suffi-cient cushion to enable stability and growth. In addi-tion, this segment of the nonprofit sector, particularly those of the ‘Service Provider’ business model will be strengthened by strategic alliances and mergers aimed at creating efficiencies of scale and operating cost effi-ciencies as well as reducing duplication of services. Financially healthier organizations will have increased clout and competitiveness.
Economic Engine OrganizationsIn 2003, the 137 Massachusetts public charities with $50 million or more in annual budgets represented 2% of organizations but 80% of assets and 72% of spending. These organizations are crucial to the state’s economy and are concentrated in the Education and Health Care & Medical program areas. Hospitals and Universities account for 60% of these organizations with others scattered across the nonprofit sector. Sub-sectors in Education where these organizations dominate include Universities and Secondary Schools. In the Health Care &
Safety Net OrganizationsFinancial Characteristics Financial Condition of Median Organization Recommended range
Organization budget size$250,000 to $50 Million
Liquidity: Days Cash on Hand 60.2 days 90–180 days
Percent with employees 89.3%Liquidity:Inverse Current Ratio 0.26 Over 0 and under 1
Dominant Asset Fixed AssetsProfitability:Surplus Margin 0.7% 2–5% minimum
Dominant RevenueProgram Service Revenue
Sustainability:Leverage 0.27% Over 0 and under 1
Dominant Expense Compensation
13p a s s i o n & p u r p o s e : R a i s i n g t h e F i s c a l F i t n e s s B a r f o r M a s s a c h u s e t t s N o n p r o f i t s
In general, these organizations are in pretty sound financial condition and because of their large economic impact have access to many of the infrastructure assets that the private sector enjoys.
Regional Distribution of Nonprofits Across Massachusetts Nonprofit Network8 regions:While nonprofits are found in practically all commu-nities across Massachusetts, their distribution is not always commensurate with socioeconomic need. Their concentration is sometimes driven by capturing economic opportunity, as in the Berkshires where there is a higher percentage of Arts nonprofits. And some-times they express the values that a community holds dear, as in the Cape & Islands which have a concentra-tion of Environmental groups. At other times, nonprofit intensity is driven by access to policy and power struc-tures, as indicated by the many large and small institu-tions located in the Boston area, which is the seat of government and the setting for policy makers.
From a socioeconomic perspective, the distribution of nonprofits geographically does not always stack up against need. This is particularly evident in a region like the Pioneer Valley which is both economically distressed and has relatively few nonprofits serving populations in need, or the Boston Urban Core which has an abundance of nonprofits, but its highly diverse demographics are not matched with an equitable distribution of services, as well as the vibrant Metro- west region which has an unbalanced mix of nonprofits.
Medical program area, they include Hospitals and Nurs-ing and Mental Health facilities. They typically conform to the ‘Large Institution’ business model.
These organizations have a complex revenue mix. They rely heavily on program service revenue but also have endowments, debt, and consistent contributors that allow them to invest in their human capital and in systems to be more effective and sustain their opera-tions. As a result, their organizational and financial characteristics, in general, are quite healthy.
In Education, program service revenue is the dominant form of income for colleges and independent schools. Educational institutions have extensive investments (medians in 48%–79% of total assets), and fixed assets are the next most dominant form of asset. Similar to Arts institutions, Educational institutions have days of cash on hand that are relatively high, in the 40–140 days of operating expense range, and have surplus margins in the 2% to 5% range.
In 2003, Health sector institutes were the least finan-cially healthy in the Economic Engine category. They were heavily reliant on program service revenue (63% to 74% of total revenues) and have the lowest cash levels in the 30 to 40 day range with receivables and inventory levels matching or exceeding payables in the 30 to 45 day range. Surplus margins fall in the 0% to 2% range. The financial health of this subsector has strengthened considerably in the past five years due to mergers and substantial restructurings designed to lower costs and increase revenues.
Economic Engine OrganizationsFinancial Characteristics Financial Condition of Median Organization Recommended range
Organization Budget Size$50 million and above
Liquidity: Days Cash on Hand 19.6 days 90–180 days
Percent with Employees 96.4%Liquidity:Inverse Current Ratio 0.56 Over 0 and under 1
Dominant Asset Fixed AssetsProfitability:Surplus Margin 15.0% 2–5% minimum
Dominant RevenueProgram Service Revenue
Sustainability:Leverage 0.33% Over 0 and under 1
Dominant Expense Compensation

14 u n d e r s t a n d i n g B o s t o n
of services are rarely fully covered, money comes with a plethora of restrictions, investments in infra-structure and overhead costs are difficult to fund, and access to credit is limited to the better endowed nonprofits. Therefore, the nonprofits whose industry focus and operations most closely resemble the busi-ness sector, are the ones that are the most likely to succeed financially.
An in-depth look at public charities (the focus of this report) across six budget size categories, 46 industry sub-sectors, and eight regional groupings analyzed in this report indicates that there is no single set of financial indicators and ratios to which the entire sector can be held. The financial health of nonprofits must therefore be seen in the context of similarly-sized organizations with similar business models, missions and purposes.
So, How Financially Healthy is the Sector?In a nutshell, the results are not positive. The Massa-chusetts nonprofit sector’s growth in revenue is not keeping pace with the numeric growth of organiza-tions. This is exacerbated by the fact that inflation and cost of business factors are causing expenses to exceed revenue growth. These trends can be seen across orga-nizational budget size and across industry sectors.
To ensure the sector’s robust health and its continued ability to meet its public purpose, the Massachusetts nonprofit sector has to pause and reposition itself in view of its growth, its immense economic impact and its increasingly professional outlook.
The steady growth of the sector locally and nationally has not been accompanied by an investment in the infrastructure needed to support this growth. While the larger organizations and institutions can access banks and other private sector institutions to obtain working and growth capital, the smaller and mid-sized organizations have no systems of support and must rely on their perseverance and persistence to survive.
Massachusetts nonprofit organizations must look at restructuring for cost efficiencies and consolidation for strengthening programs and services—and must focus on the financial health of their organizations. To secure a high quality of services now and into the future, the nonprofit sector’s stakeholders—government, founda-tions and individual donors—must look at more efficient ways of funding to cover the full cost of services and encourage financially healthy organizations. To sustain the very public purpose for which this sector was created, policymakers must look at policies to protect nonprofits and raise the bar for a high level of accountability from these valuable institutions.
As this report shows, the nonprofit sector is large and complex, with a wide variety of missions and a broad diversity of organization budget sizes. These organiza-tions operate in business and financial environments that make it difficult to talk about the entire ‘nonprofit sector’s’ financial well being as a whole.
The private sector operates on a single bottom line—the profit motive. It functions within a well estab-lished financial market place where costs of products and services are fully covered and profitability is the key to success or failure. Rules of the game for the nonprofit sector, however, are different. Costs

• Strengthen organizational balance sheets to enhance program offerings and ensure measurable impact and inter-generational delivery of mission;
• Create economies of scale for greater impact—consolidating programs and associated support services; and
• Create economies of efficiency for revenue sharing, eliminating duplicative costs and administrative/operational redundancies through the sharing of staff, space, back office consolidation, and group purchasing.
n The sector must look to utilizing the fiscal management services of umbrella organizations and other larger institutions, allowing new ideas to incubate and grow without the administrative burden of organizational structure and costs.
n On the regulatory end, better tracking and regular public reporting of data on incorporation and dissolu-tion of nonprofits is needed.
n Funders need to support the cost of mergers and stra-tegic alliances, acknowledging that effective collabora-tion takes time and resources.
Repositioning Rooted in communities across the state, Massachusetts nonprofits are a powerful civic and economic force. With the recent creation of the Massachusetts Nonprofit Network—the first statewide association of nonprofits— and its longstanding and strong trade associations and regional networks, the sector is well positioned to maxi-mize its potential and gain the efficiencies and effective-ness possible only through collective action.
n The Massachusetts nonprofit sector is an important economic force and needs to use its collective clout to reposition itself to:
• Access and/or create instruments for growth, restructuring, capacity building and investment capital; and
• Access vendor credit, group purchasing, and shared training and capacity offerings, particularly for
A stable financial condition is critical for nonprofits to meet their public purpose. Simply put, the three funda-mental threats to nonprofit financial health are: 1) too many nonprofits; 2) too few resources; and 3) too little focus on future services and sustainability.
The rapid increase in the number of Massachusetts nonprofits, in contrast to the sector’s overall slow revenue growth and rising expenses, begs two serious questions. First, can the sector support this proliferation in small and very small nonprofits? Second, can our nonprofit organizations sustain their public purpose responsibility with their current financial practices? The slow revenue growth also speaks to the serious funding constraints currently facing the sector. An important reason for the poor financial health of so many Massachusetts nonprofits is their focus on expanding current service and program delivery to the detriment of financial and organizational health and future services. Even greater funding is needed if these organizations are to expand investments and savings without serious disruptions in current services.
The ‘call to action’ recommendations that follow capture the ideas that have emerged from this analysis and through conversations with various stakeholders over the course of this investigation. They are aimed at improving nonprofit financial health and the alignment of money and mission for greater social impact. They are structured around three powerful concepts—restructuring, reposi-tioning and reinvention.
Restructuring and ConsolidationWhile a simple solution to the problem could lie in consol-idating the sector, the wide range of values, services and benefits that nonprofits provide can easily be lost during a restructuring. Appropriate measures must be taken by a nonprofit based on its budget size, business model, indus-try sub-sector, and stage of organizational development. Well thought-out restructuring strategies9 that range from back office support collaborations to mergers however, are clearly required.
n The Massachusetts Nonprofit Sector needs to seriously consider mergers, strategic alliances and collaborations as a strategy to:
Raising the Fiscal Fitness Bar for Massachusetts NonprofitsA Call To Action
15p a s s i o n & p u r p o s e : R a i s i n g t h e F i s c a l F i t n e s s B a r f o r M a s s a c h u s e t t s N o n p r o f i t s

• Funders should pool resources to lower transac-tion costs for applying for and receiving funds and reporting on outcomes to reduce duplication;
• Standardize and streamline grant/contract applica-tions, operating requirements and reporting that is commensurate with grant size;
• Where possible, raise substantially the average grant/contract size to lower transaction costs, achieve economies of scale in fundraising and programming and foster collaboration; and
• Support fiscal sponsorship and other sector responses for brokering alliances.
n To ensure the strength and stability of the sector, the funding community must consider funding at both the organizational and the programmatic levels, even when the funder’s primary interest is in one program. Funders should:
• Support and reward investments in organizational health and capacity;
• Offer nonprofits access to working/growth/restruc-turing capital; and
• Work with the banking community to enhance access to credit for nonprofits.
n Nonprofit managers and boards must bring financial management into close alignment with organization mission and purpose:
• Regularly budget with a surplus margin and develop strategies to ensure sufficient liquidity and reserves to comfortably meet short-term obligations and/or unexpected funding disruptions or costs; and
• Ensure strong financial stewardship through gover-nance and sound internal controls, and institute regular finance and audit committee oversight and tracking of key metrics linking money and mission.
n Celebrate and reward excellence in nonprofit manage-ment and social innovation.
The past several years have shown the sector to be a criti-cally important ingredient in everything Massachusetts represents. Its rapid growth, while concerning, is also an indicator of its success. And while practices, policies and strategies are needed to enhance its value and strengthen its outcomes, it is important to ensure that we are able to retain the passion, commitment and civic engagement of private individuals for public good. The nonprofit sector in Massachusetts has created, to a large extent, the struc-tures and institutions needed to take it to the next level.
the small nonprofits through the Massachusetts Nonprofit Network.
n Nonprofits need to express their voice on key issues facing the sector—by joining the Massachusetts Nonprofit Network and other trade associations—and advocating for policies and practices to improve nonprofit financial health and mission accomplish-ment. Nonprofits must work together to:
• Invest in the nonprofit workforce through better wages, fringe benefits and professional develop-ment, particularly in the areas of human services and early education;
• Encourage investments in health, vitality and other ‘safety net’ issues for the families of those employed in the nonprofit sector through instruments of health insurance, retirement accounts and other benefits;
• Work with the public sector to create a ‘Small Busi-ness Association’ type of publicly funded entity to support the healthy growth of the Massachusetts nonprofit sector; and
• Reform the field’s overly complex and expensive accounting, regulatory, and contracting require-ments.
Reinvention and ReinvestmentThe Massachusetts nonprofit sector’s shift from a volun-teer sector to one that is increasingly run by highly qual-ified professionals, its emergence as a principal provider of critical services, and its functioning in a competitive business environment require that we rethink and rein-vent nonprofit operations and support systems commen-surate with the 21st century environment.
n Nonprofit managers and trustees need to focus on improving financial management practices with a keen eye toward balancing and strengthening money, mission and organizational capacity.
n Nonprofit organizations need to resist the temptation to cover a higher level of services—and limit opera-tions to those they can fully cover financially.
n Funders must be willing to pay fully to cover operating costs and support infrastructure and other strategies for efficiency and streamlining:
• Seriously consider changes in government contract-ing policies to prepay and cover the true cost of services;
16 u n d e r s t a n d i n g B o s t o n

17p a s s i o n & p u r p o s e : R a i s i n g t h e F i s c a l F i t n e s s B a r f o r M a s s a c h u s e t t s N o n p r o f i t s
ChapteR ONe
The Massachusetts Nonprofit Sector: Snapshot & Growth Trends
With the number of organizations doubling over the last two decades, the Massachusetts nonprofit sector today has evolved into a principal provider of services, a major employer and a formidable economic player in the Commonwealth. This chapter provides a brief picture of the size, scope, economic impact and growth trends of the Massachusetts nonprofit sector.
Number and Growth of Nonprofit OrganizationsAs of September 2007, 42,048 nonprofit organizations were registered in the Commonwealth of Massachu-setts. The vast majority (87%) of these organizations (36,748) have also obtained federal tax-exemption. Figure 1.1 provides a breakdown of the Massachusetts nonprofit sector in September 2007 into 25 federal tax code categories, including fraternities, labor unions, and business leagues. This breakdown clearly demon-strates the predominance of the 501(c)3 mission-driven nonprofits, which represent 65% of the total federally registered organizations. Intended to serve the general public welfare, these organizations have the ability to receive tax-exempt donations and provide a specific set of benefits to the public. Much of this study’s focus is on these 501(c)3 public charities as they rely on public and government funding and, in economic terms, account for most of the nonprofit activity in the Commonwealth.
Growth of Nonprofit Organizations in MassachusettsBased on Internal Revenue Service data, the number of registered nonprofit organizations has grown dramati-cally between 1989 (the earliest available year) and the present. Over this 18-year period, the number of public charities has doubled from 11,796 public charities in 1989 to 23,899 in September 2007 as shown in Figure 1.2. This change translates into an annualized growth
rate of 4.0% per year. The “other” types of nonprofits have also grown, rising from 7,800 in 1989 to 12,849 by 2007.
The total number of active nonprofits may be too high as the Internal Revenue Service continues to track inac-tive organizations that have ceased operations. One study suggests that the IRS count can be exaggerated by as much as 21%.10 If the overstatement is equally high in both periods then the overall growth rate remains unchanged.
8%
5%
5%
4%
4%3%
1%
Other 501(c)0%
Other Non-501(c)0%
2%
68%
501(c)9 - Veterans Associations
501(c)3 - Public Charities
501(c)3 - Private Foundations
501(c)4 - Civic Leagues/Social Welfare Organizations
501(c)5 - Labor, Agricultural Organizations
501(c)7 - Social and Recreational Clubs
501(c)6 - Business Leagues
501(c)8 - Fraternal Beneficiary Societies
501(c)10 - Domestic Fraternal Societies
FIGURE 1.1
Massachusetts Nonprofit Organizations by Tax Code Section – September 2007
Source: Internal Revenue Service, Business Master File, September 2007

18 u n d e r s t a n d i n g B o s t o n
Public Charities: Their Special RolePublic charities have an explicit social contract with the communities in which they operate to provide societal benefits under a special set of business conditions. They rely on public and government funding and, in economic terms, account for most of the nonprofit activity in the Commonwealth. This report’s focus on 501(c)3 public charities is intended to provide a more detailed picture of the specific set of environmental conditions in which this group of nonprofits operates.
The Growth of Public Charities in MassachusettsFrom 1989 to 2007, the number of public charities doubled to just under 24,000 organizations (see Figure 1.2). Over this period, the size distribution of the public charities shifted with an increasing proportion of small nonprofits as seen in Figure 1.3. In 1989, 56% of nonprofits either generated under $25,000 in revenues (in constant 2007 dollars) or were exempt from filing (most often earning under $25,000 in revenues). By 2007, the percentage of nonprofits falling within these two categories had risen to 64%. An estimated 75% of the nonprofits that were newly registered during the 18-year period are presently operating in these two small size categories. The combined economic impact of the organi-zations in these two groups is just 0.6% of Massachusetts nonprofit sector revenues, even assuming that the aver-age non-filer has $25,000 in annual revenues.
0
5000
10,000
15,000
20,000
25,000
30,000
1989 1991 1993 1995 1997 1999 2001 2003 2005 2007
Total Public CharitiesOther Nonprofits
FIGURE 1.2
Massachusetts Nonprofit Organizations listed in the IRS Business Master Files
Source: National Center for Charitable Statistics Annual Snapshots of BMF files
Form 990 Filing Public Charities as Empirical Focus of Study
As noted in the Executive Summary, this report’s quantitative analysis is focused on the subset of federally registered public charities that filed an annual Form 990 return with the IRS in 2003, the most recent year for which digitized Form 990 data is available. The sample includes 8,312 public chari-ties. Public charities, except churches, are required to file IRS Form 990s if their revenues exceed $25,000. Some charities, such as churches, that voluntarily file are also included in this analysis.
The Massachusetts Public Charities Industry SectorsPublic charities operate with a specific core mission or program area, and the nature of each nonprofit’s operations will vary in relation to that mission. To better understand the relationship between mission and the varying business models within which different nonprofits operate, the Boston Foundation consulted with practitioners and experts in the area of nonprofit finance to segment the sector and better reflect the relationship between business conditions and mission. Building on the 26 National Taxonomy of Nonprofit Entities (NTEE) categories developed by the National Center for Charitable Statistics, the nonprofits were regrouped into 10 major operational categories that represent programmatic mission alignments as indicated in Figure 1.4.
Reclassification of Nonprofits in the NTEE SystemAnother obstacle to understanding the relationship between mission and service delivery has been the high number of nonprofits that remained unclas-sified within the NTEE system (almost one-third), or have been incorrectly assigned due to limited information. The categorizations provided in this report were derived from an extensive effort that began in 2004 to classify uncategorized Massachu-setts nonprofits based on available online informa-tion. Our dataset contains a cumulative list of 54,542 different nonprofits derived from the IRS Business Master File between 1989 and 2007, of which only 332 were unclassifiable.
For more detail on data and methodology please see Appendix A.

19p a s s i o n & p u r p o s e : R a i s i n g t h e F i s c a l F i t n e s s B a r f o r M a s s a c h u s e t t s N o n p r o f i t s
Figure 1.5 shows the numeric distribution categories in 1989 as compared to 2007. The number of Environmen-tal, Youth Development and Other organizations grew more than 6% annually while, at the other extreme, the Health Care sector experienced only a 2.7% growth in new organizations over the period.
A more significant shift has taken place in the “Other” industry sector, which overtook the Arts, Culture & Humanities area to become the second largest industry group. Most of the growth in this area can be attributed to a strong increase in the number of “other organiza-tions,” which include member and mutual benefit orga-nizations as well as religious public charities, as shown in Figure 1.6. As of September 2007, 82% of all “Other” organizations were non-filers. This group, in fact, comprises 27% of all organizations that are non-filers.
Implications of Growth on the Sector’s Financial HealthSeveral factors threaten the long-term sustainability of the sector. These include the increased competition for funds as a result of the rapid expansion in the number of nonprofits, as well as the entry of the private sector into some traditional areas of nonprofit activity, as in the case of hospitals. The problem is highlighted by a rapid increase in the numbers of new nonprofit filers (6.3% annually from 1989 to 2003) in contrast to the slow expansion in the size of existing organizations (only 2.1% real annual growth in expenses from 1989 to 2003). The problem is further accentuated by the even more modest growth in annual revenues of 1.3%.
what is the Range of Services Offered?Nonprofits in Massachusetts offer a wide range of services. Based on the September 2007 IRS Business Master File and Boston Foundation industry coding: Education, Science, Technology & Social Science Orga-nizations represented 19 percent of the total; followed by Other, at 16%; Arts, Culture & Humanities, at 14%; and three categories—Youth Development, Human Services, and Health Care—each accounting for 10%.
The distribution by industry sector, depicted in Figure 1.4, has not shifted dramatically in the recent past.
0
2000
4000
6000
8000
10,000
12,000
14,000
1995 1997 1999 2001 2003 20051996 1998 2000 2002 2004 2006 2007
Non-FilerLess than $25,000$25,000–$250,000$250,000–$50 Million$50 Million and Greater
FIGURE 1.3
Massachusetts Public Charities Numeric Growth by Revenue Categories
Source: IRS Business Master Files, NCCS Core Files, NCCS-Guidestar Digitized Form 990 Files. Total Revenue adjusted for inflation in 2003 constant dollars.
19%
16%
10%
3% 4%
14%10%
10%
8%
5%
Arts, Culture and Humanities
Housing and Shelter
Philanthropy
Environmental and AnimalRelated
Community Capacity
Health Care and Medical
Human Services
Youth Development, Sportsand Recreation
Other
Education, Science, Technologyand Social Sciences
FIGURE 1.4
Distribution of Massachusetts Public Charities by Industry Sector, 2007
Source: Boston Foundation Dataset derived from IRS Business Master File, September 2007

20 u n d e r s t a n d i n g B o s t o n
where Nonprofit Services Are located: Geographic Distribution of Public CharitiesOn a strictly numeric basis, nonprofit organizations are concentrated in the eastern half of the state, with the highest concentration in Suffolk, Middlesex, Norfolk and Essex Counties. Figure 1.7 provides a dot-density map of the location of 501(c)3 nonprofits in Massachu-setts, with each dot representing five organizations within a single five-digit zip-code. As Figures 1.7 and 1.8 indicate, nonprofits are more heavily concentrated within urbanized areas. Greater Boston, Worcester, Springfield, Holyoke, Pittsfield, New Bedford and Fall River form distinct clusters on the map. Figure 1.8 provides more detail on the Greater Boston area.
Figure 1.9 depicts the concentration of nonprofits per 1,000 residents in the eight regions identified by the Massachusetts Nonprofit Network. The Cape and the Islands has the highest concentration of nonprofits per capita, with 5.7 organizations per thousand residents. The other areas of high concentration, in descending order, are the Berkshires, Metrowest and Greater Boston. Southeast Massachusetts has the lowest concentration of nonprofits per capita with 0.7 organizations per thou-sand residents.
0
1000
2000
3000
4000
5000
Arts, Culture& Humanities
CommunityCapacity
Education,Science,
Technology &Social Sciences
Environment &Animal-Related
Health Care& Medical
Housing& Shelter
HumanServices
Other Philanthropy YouthDevelopment,
Sports &Recreation
1989 2007
FIGURE 1.5
Numeric Distribution by Industry Sector, 1989–2007
Source: Boston Foundation Dataset derived from IRS Business Master Files
0
1000
2000
500
1500
2500
3000
International &Foreign Affairs
Mutual &Membership
Benefit
Public &SocietalBenefit
Religion
1989 2007
FIGURE 1.6
Numeric Distribution with ‘Other’ Industry Sector, 1995–2005
Source: Boston Foundation Dataset derived from IRS Business Master Files

21p a s s i o n & p u r p o s e : R a i s i n g t h e F i s c a l F i t n e s s B a r f o r M a s s a c h u s e t t s N o n p r o f i t s
While the Greater Boston area is moderate in terms of nonprofit organizations per capita, it dominates in terms of revenues (and spending) per capita. Table 1.1 shows nonprofit revenues per capita for 501(c)3 organizations in 2003 (most recent data). Greater Boston with almost $16,000 in public charity revenues per capita garners 86% more revenue than the next closest region (Metro-west) and 5.5 times the per capita public charity revenue of the smallest region (Southeast Massachusetts).
TABLE 1.1
Per Capita Public Charity Revenue by Massachusetts Nonprofit Network Region, 2003
PopulationPer Capita
Income
Per Capita Public Charity
Revenue
Berkshires 134,953 $ 21,805 $7,257
Pioneer Valley 695,368 $ 20,087 $ 4,631
Central Massachusetts 719,825 $ 22,795 $ 5,407
Metrowest 783,845 $ 36,841 $ 8,519
Northeast Massachusetts 892,201 $ 26,498 $ 4,075
Greater Boston 1,805,896 $ 26,500 $ 15,889
Southeast Massachusetts 1,070,272 $ 23,131 $ 2,455
Cape and Islands 246,737 $ 25,620 $ 4,396
Source: Boston Foundation Dataset derived from NCCS 2003 Digitized Form 990 Dataset
Massachusetts Public Charities by Zipcode
2007 Business Master File = 5 organizations
FIGURE 1.7
Numeric Distribution of Public Charities in Massachusetts – September 2007
Source: Internal Revenue Service Business Master File, September 2007
0 to 2.8
Public Charities Per Thousand by Region – September 2007
2.8 to 2.9
2.9 to 3.0
3.0 to 4.0
4.0 to 4.6
4.6 to 5.0
5.0 to 5.4
5.4 to 10.0
FIGURE 1.9
Total Public Charities by Massachusetts Nonprofit Network Regions, September 2007
Source: Internal Revenue Service Business Master File, September 2007
Greater Boston Public Charities by Zipcode
2007 Business Master File = 5 organizations
FIGURE 1.8
Numeric Distribution of Public Charities in Greater Boston – September 2007
Source: Internal Revenue Service Business Master File, September 2007

22 u n d e r s t a n d i n g B o s t o n
TABLE 1.2
State Rankings, Nonprofit workers as a Percent of Employed workers, 2006
Rank State Percent Non-Profit
1 District of Columbia 16.2%
2 Vermont 12.5%
3 Maine 11.2%
4 Massachusetts 10.6%
5 Pennsylvania 10.2%
6 Rhode Island 10.0%
7 Minnesota 9.7%
8 Alaska 9.4%
9 North Dakota 9.3%
10 New York 9.3%
11 New Hampshire 9.0%
12 South Dakota 8.9%
13 Iowa 8.8%
14 Missouri 8.8%
15 Nebraska 8.5%
16 Maryland 8.5%
17 Wisconsin 8.4%
18 Connecticut 8.3%
19 Illinois 8.3%
20 Oregon 8.2%Source: American Community Survey, US Census Bureau, 2006
The Massachusetts Nonprofit Sector Economy In late 2007, the nonprofit sector in Massachusetts was estimated to include almost 37,000 federally registered nonprofit organizations that earned $86.7 billion in revenues and held $207.1 billion in total assets. The public charities comprise the majority of the sector (65%), generating $70.4 billion in revenues, with $168.6 billion in total assets.
As an employer, in 2006, the sector as a whole accounted for 13.8% of the Massachusetts working population with 447,642 workers in 7,109 nonprofit organizations. It maintained its fourth position behind Washington DC, Vermont and Maine in this regard. The Massachusetts nonprofit sector’s importance was evident in its vital role during the economic downturn that followed the technology bust of 2000 and 9-11.
A Continued Source of Employment GrowthDuring the 2001–2004 period, Massachusetts expe-rienced a 5.5% decline in employment overall, yet educational services and health care/social assistance programs experienced an employment growth of 5.8% and 5.5%, respectively.11 Using these large classifica-tions, health care/social assistance programs added more employees than any other sector (22,205) with educational services coming in second with 6,404
0
100,000
200,000
300,000
400,000
500,000
600,000
Thousands
Health Care Educational Services Religious, Grantmaking,Civic and Professional
Organizations
Social Assistance Arts, Entertainment& Recreation
Professional Services
Nonprofit Workers
Other Employed Workers
FIGURE 1.10
Nonprofit and Total Employment by Top Six Sectors and Major Sectors of Nonprofit Employment, 2006
Source: American Community Survey, U.S. Census, 2006

23p a s s i o n & p u r p o s e : R a i s i n g t h e F i s c a l F i t n e s s B a r f o r M a s s a c h u s e t t s N o n p r o f i t s
in the for-profit sector. The nonprofit sector workforce made gains in all areas—education levels, median income, and employment status—when compared to the 2000 census data reported in the 2005 study, The Massachusetts Nonprofit Sector: An Economic Profile.
Education, Economic and Employment Status of the Nonprofit workforce In general, nonprofit workers are more likely to have college degrees when compared to their private sector counterparts. However, given the broad spectrum of industry sectors that span the nonprofit workforce there are many variations, particularly among compen-sation levels (See Figure 1.11).
Some workers that are critical to the safety net role of the sector—such as early education/child care workers, home health care workers, and those employed in the arts and recreation industries—are severely underpaid. In 2006, personal income of workers within the nonprofit sector varied from a low—of $14,500 in the Arts and $24,000 in Social Services—to close to $40,000 and above in the Education, Health Care and Professional Services sectors (see Figure 1.12). Interestingly, these compen-sation levels were found to be on par or exceeding the personal income levels of workers within compa-
additional employees. In the 2004 to 2006 period, these two sectors grew in terms of employment faster than the state rate of 1.8%, posting gains of 4.1% (Health Care) and 3.1% (Education). Again, Health Care provided the largest numbers of new jobs with 17,492 —with the Education sector adding 3,699 new jobs.
Share of Nonprofit Employment by Major Industry Sectors:In certain industry areas, nonprofits play an even more important role as an employer. The nonprofit sector provides 29.8% and 25.2%, respectively, of the employment in the areas of Health Care and Educa-tion. In the area of social assistance, nonprofits employ 42.3% of workers. In the areas of religious activities, grantmaking and civic and professional organizations, the nonprofit sector is almost the sole employer (see Figure 1.10).
The Nonprofit workforceThe nonprofit workforce is well-educated, highly skilled and earns generally on par with the rest of the Massachusetts workforce. This may suggest that nonprofit employees are, on average, less well compen-sated than their comparably educated and skilled peers
0%
10%
20%
30%
40%
50%
60%
70%
80%
All Industries
54.4
37.1
51.3
41.9
70.8
63.2 61.1 56.6
49.9
38.334.7
17.9
51.6 51.6
Health Care EducationalServices
Religious,Grantmaking,
Civic and ProfessionalOrganizations
SocialAssistance
Arts, Entertainment& Recreation
ProfessionalServices
Nonprofit Workers
Employed Workforce
FIGURE 1.11
Percent of workers with at least a Bachelor’s Degree for Selected Industries in Massachusetts, 2006
Source: American Community Survey, US Census, 2006

24 u n d e r s t a n d i n g B o s t o n
other ethnicities—the overall drop in the white popu-lation, from 82% in 2000 to 79.3% in 2006 masks these gains. In 2006 the African American (6.5%) and Asian (5.4%) share of nonprofit workers exceeded the racial composition share of 5.7% and 4.8% respectively. The share of Latino nonprofit workers, at 5.3%, remained behind the 7.9% of Latino population share as did other workers (see Figures 1.13–1.15).
In terms of the gender share, females continued to dominate the nonprofit workforce at 63.5% of all nonprofit workers. However more men appear to be entering the nonprofit workforce with the female share of workers dropping from 66.2% in 2000 to 63.2% in 2006.
The aging of the workforce is particularly alarming as large numbers of nonprofit leaders retire or move out of the nonprofit sector. National studies raise concerns regarding this trend, which is evident in the 2006 data, showing the median age of nonprofit workers increas-ing from 41 years of age in 2000 to 43 years in 2006, highlighting the need for preparing the next genera-tion of leaders for a sector whose size, scale, societal and economic importance is growing steadily.
rable for-profit industry sectors.
Median household income, homeownership rates and employment status of nonprofit workers all grew between 2000 and 2006. In 2006, the median income of nonprofit workers was at $81,000 compared to $80,000 of all workers. Homeownership rates at 68.5% were just a little below those of all workers at 70.5%. Median incomes among nonprofit workers grew from $68,800 in 2000 to $81,000 in 2006 and homeownership rates increased from 63.5% in 2000 to 68.5% in 2006.
The share of full-time workers also grew from 58.1% in 2000 to 65.3% in 2006, a change that could be explained to some extent by more males entering the nonprofit workforce and also the aging of the nonprofit work-force which enables the female workforce to devote more time to work as their children grow.
Racial, Gender and Age Composition of the Nonprofit workforce According to the American Community Survey (ACS) of 2006, the nonprofit workforce closely mirrors the racial and ethnic demographics of the state, with gains made in the employment of workers across most ethnicities. The 2000 census data reported in The Massachusetts Nonprofit Sector: An Economic Profile, in 2005 indicated that both the overall workforce and the nonprofit workforce were less diverse than the state’s population. Data from 2006, however, show that while gains have been made—with 19% of the nonprofit workforce being African American, Latino, Asian or
$0
$10,000
$20,000
$30,000
$40,000
$50,000
All Industries Health Care EducationalServices
Religious,Grantmaking,
Civic and ProfessionalOrganizations
SocialAssistance
Arts, Entertainment& Recreation
ProfessionalServices
Nonprofit Workers
Employed Workforce
FIGURE 1.12
Median Personal Income of Nonprofit workers vs. All workers in Selected Industries in Massachusetts, 2006
Source: American Community Survey, US Census, 2006

25p a s s i o n & p u r p o s e : R a i s i n g t h e F i s c a l F i t n e s s B a r f o r M a s s a c h u s e t t s N o n p r o f i t s
5.7%
7.9%
4.8%
2.3%
79.3%
White African America Latino Asian Other
FIGURE 1.13
Demographic Composition of Massachusetts, 2006
5.3%
7.1%
4.8%2.0%
80.8%
White African America Latino Asian Other
FIGURE 1.14
Racial Composition of Nonprofit workers in Massachusetts, 2006
6.5%
5.3%
5.4%1.9%
81.0%
White African America Latino Asian Other
FIGURE 1.15
Racial Composition of All workers in Massachusetts, 2006
Source: American Community Survey, US Census, 2006
white african america Latino asian Other

26 u n d e r s t a n d i n g B o s t o n
For the purposes of this report, the Massachusetts nonprofit sector is divided into three primary catego-ries that reflect both budget size and three value propositions:
n Grassroots organizations: Creation of civil society through grassroots action and volunteerism;
n Safety Net organizations: Provision of societal bene-fit and a ‘safety net’ through the delivery of services and quality of life contributions; and
n Economic Engine organizations: Large-scale services and contributions to the state’s economic health and competitiveness.
Organizations can benefit the community by provid-ing multiple forms of value; however most organiza-tions exhibit one value proposition more fully than the others. Approximate budget size was used to further define nonprofits as follows:
Grassroots organizations, with $250,000 or less in total expenses, generally reflect the first value proposition. They tend to be a source of innovation, creativity and political voice while also providing some basic social services. These small organizations account for 55% of public charity filers in 2003. However, this statistic significantly understates the number of Grassroots organizations since most non-filers are
likely to be grassroots in size and nature, and 49% of public charities were non-filers in 2003. Despite their high number, Grassroots organizations repre-sent only 1% of the nonprofit economic activity in the Commonwealth.
Safety Net organizations have budgets that range from $250,000 to $50 million in total expenses and are dominated by work in the areas of Housing, Human Services and Health Care, reflecting the second value proposition. This group includes 43% of the filing public charities, but just 27% of revenues and spending and 19% of the sector’s assets.
Economic Engine organizations report $50 million or more in total expenses and are characterized by hospi-tals and universities that employ high numbers of skilled and highly skilled workers. This group reflects the third value proposition and accounts for 72% of the entire sector’s spending and revenues and 80% of its total assets.
The distribution of the Massachusetts nonprofit sector by value proposition is as follows:
ChapteR twO
Three Value Propositions—Financial Fitness by Organization Budget Size
TABLE 2.1
Sector Activity by Budget Size, 2003
Number of Organizations
and Percent Percent of Sector Revenues Percent of Sector Spending Percent of Sector Assets
Grassroots 4,574 (55%) 1% 1% 1%
Safety Net 3,601 (43%) 27% 27% 19%
Economic Engine 137 (2%) 72% 72% 80%
Total 8,312 (100%) 100% 100% 100%Source: Boston Foundation Dataset derived from NCCS 2003 Digitized Form 990 Dataset

27p a s s i o n & p u r p o s e : R a i s i n g t h e F i s c a l F i t n e s s B a r f o r M a s s a c h u s e t t s N o n p r o f i t s
Several business models operate in the nonprofit sector. Just as the standard financial ratios vary by industry in the corporate sector, the financial attributes of nonprofits vary by business model. This chapter introduces five business models: Large Institution, Service Provider, Support, Member-ship, and Expressive Voice.
large Institution: These organizations exhibit economies of scale and generate the largest share of the nonprofit sector’s economic value. They are concentrated in the Education, Health and Arts industry sectors with a few found in other industry sectors. They comprise most of the Economic Engine category and much of the large end of the Safety Net category. These organizations have a complex revenue mix and are asset intensive, relying on extensive property, plant and equipment as well as financial investments to support their operations. Surplus margins average 1%. Cash on hand is a median of 24 days. This category does rely more significantly on bond and mortgage financing (many in the 5–25% range) than organizations in other sectors. The financial characteristics of these large organiza-tions differ markedly from the rest of the sector. Most have considerable access to credit, hire permanent staff whose employment is not conditional upon grants or governmen-tal funding, and have operating and permanent reserves.
Service Provider: Most of these organizations have grown through obtaining major government or foundation grants and have taken on employees. The heaviest indus-try concentrations are in the areas of Housing, Human Services, and Health Care. As providers of services on behalf of government, they are generally paid in arrears (e.g., cost-reimbursement) with some significant costs not covered (e.g., equipment purchases). So, these orga-nizations engage in fundraising designed to generate unrestricted funds to cover core office needs and gaps in program funding. A recent study12 of Health and Human Service providers revealed: One-third of these organiza-tions report annual deficits, with about 60% reporting surplus margins of 2% or lower. Almost half of the provid-ers have liabilities in excess of net assets with about 5% having negative net assets. Cash on hand is quite low, with about two-thirds of providers holding under one month. However these organizations are able to expand more rapidly than their voluntary counterparts. As they grow, the share of revenues from contributions declines and is replaced with program services revenues. With this growth comes the ability to decrease the necessary cash on hand and increase unpaid bills through vendor relationships. In addition, cash ceases to be the dominant asset and is replaced with fixed assets. This transition is made possible by a shift in organizations’ access to credit.
Support Organization: In every industry sector, there are a sizable number of organizations that provide support
services. These include fundraising entities, support orga-nizations, educational and student services, federated giving programs, recreational clubs, and parent-teacher groups. Essentially these organizations engage in fund-raising activities and then spend these resources on goods that are donated or pass the funds directly or indirectly to other nonprofit service providers. While mission fulfill-ment and resource matching may be the essential, these organizations do need to consider intergenerational equity and sustainability. Running large or repeated annual deficits would place a Support Organization in financial jeopardy. Support Organizations are generally relatively small, report cash as their primary asset, with the level of cash high or low depending on the timing of distributions or payments at the end of the fiscal year. They are likely to have zero or little leverage as there is little need to borrow, with surplus margins at or near zero.
Membership Organization: These organizations include advo-cacy groups (such as those concerned with the environ-ment or specific diseases), amateur and professional sports groups, alliances, camps, employment agencies, associa-tions, libraries, museums, and other cultural organizations. They generally rely on an annual payment of membership dues as well as related program revenues (arising from conferences and ticket sales). With the exception of libraries, museums and camps, they tend to devote their resources to direct membership services or advocacy on behalf of their members. They do have employees, but many are part-time. For a number of these organizations, member service is a central focus, however, for libraries, museums and camps, memberships may serve more as a method of obtaining early payment for ticket and store sales. Membership Orga-nizations can be found in both the Grassroots and Safety Net categories. The smaller sports, association and advocacy groups may resemble Support Organizations with cash as a primary asset, often coming from membership dues that are recorded as deferred revenue. They are likely to have zero or little leverage as there is little need to borrow, with surplus margins at or near zero.
Expressive Voice Organization: In addition to Support Organi-zations and Membership Organizations, Expressive Voice Organizations also fall in the Grassroots category. These groups are often founded by a committed individual or group of individuals interested in expressing their voice—artistically, athletically, educationally, religiously and/or politically. These organizations are often funded by contri-butions and personal loans from a small group of people, who also donate their time and encourage family and friends to participate. Additional funding may come from special events and performances. These organizations are likely to have no or little staff and cash may be the only or primary financial asset. Leverage is low or zero and profit-ability is also at or near zero.
Nonprofit Business Models

28 u n d e r s t a n d i n g B o s t o n
Grassroots OrganizationsGrassroots organizations can operate under any of the three business models— Support Organizations, Expressive Voice Organizations or Membership Organi-zations—each associated with different missions. While a limited number of organizations in this category are start-ups that eventually may grow into the Safety Net category, most small organizations are truly grassroots in nature, relying extensively on volunteer labor. In fact, only 30% indicate paying any employee-related costs, and compensation is only 14% of total expenses. These organizations are reliant on contributions for 46% of their operations. They tend to remain small and alter their level of services with variations in funding.
While Economic Engine organizations dominate in terms of spending and assets, most organizations that file Form 990s operate with $250,000 or less in revenues. In terms of the number of organizations, this category is growing the most rapidly with an expan-sion of 8.1% annually. Despite the large numbers, this group represented only 1% of the revenues, spending and assets in the documented Massachusetts public charity sector in 2003. These small Grassroots organi-zations are predominately in the fields of Youth Devel-opment, Arts, Philanthropy, Environment, and Other.
The vast majority of organizations in this category remain in the Grassroots category over time. Of the 852 organizations that were classified as Grassroots in 1989, 68% maintain that classification. Average total revenues declined 1.7% annually in real terms from 1989 to 2003, but the organizations managed to limit the contraction in real spending to only 0.2 %. Total assets grew in real terms at a 2.0% annual rate, with net assets expanding faster at 2.5%. In 2003, there were 3,904 organizations classified as Grassroots that had not filed in 1989 and 91 organizations previously cate-gorized as Safety Net organizations that had seriously contracted in size.
These organizations have virtually no access to credit with the median organization reporting no current liabilities, or no unpaid bills. To sustain operations, these organizations tend to hold all of their liquidity in cash, eschewing investments. This results in median cash on hand of 55 days. These voluntary organiza-tions tend also to have relatively few fixed assets, so it is not surprising that cash is the dominant asset for the median small organization.
Due to the small revenue base, a single grant can profoundly affect these organizations. In 2003, 42% of small organizations reported surplus margins of more than 10% while 29% had losses of more than 5% of revenues. Some 48% have more than two months of cash on hand, yet 38% have no cash. Since these orga-nizations have difficulty accessing credit, leverage is 10% or under for a full 78% of this sub-population.
Safety Net OrganizationsFor many, the image of the nonprofit sector is of an organization in the human services arena that provides high quality, low cost services. While the Service Provider business model is most prevalent in this size category, the other four business models (Large Institution, Support Organization, Member-ship Organization, and Expressive Voice Organiza-tion) are also quite common.
Budget sizes range from $250,000 to $1 million for the smallest organizations and $10 million to $50 million for the larger organizations. These organizations depend on their staff, with 85% of the smallest social benefit organizations and 94% of the larger organiza-tions having paid employees. They garner about 27% of revenues and spending with just 19% of the total assets of all public charity filers.
The 3,601 organizations that make up this category are more diverse than those at the small or large end of the spectrum and vary in revenues from $250,000 to $50 million. Many of these organizations have grown by obtaining a major government or foundation grant and have taken on employees. The heaviest industry concentrations in this group are in the areas of Hous-ing, Human Services, and Health Care.
Safety Net organizations can expand more rapidly than Grassroots organizations with median real annual revenue and spending growth of 2.8% and 3.1%, respectively. As they grow, the share of reve-nues from contributions declines from 42% to 25% and is replaced with program services revenues, which rise from 45% to 71% of median revenues. With this growth comes the ability to decrease the cash on hand from 2.7 to 0.9 months of expenses and increase unpaid bills from 0.4 to 1.0 months of expenses. In addition, cash ceases as the dominant asset and is replaced with fixed assets.

29p a s s i o n & p u r p o s e : R a i s i n g t h e F i s c a l F i t n e s s B a r f o r M a s s a c h u s e t t s N o n p r o f i t s
This transition is made possible by a shift in organiza-tional access to credit. The median small social benefit provider has only 14% of current assets funded by current liabilities, while the median larger one has a ratio of 46%. Organizations are able to shift their asset intensity from an asset-to-revenue relation of 92% to 73% as they grow in size.
These organizations operate under considerable finan-cial pressure, particularly the smaller ones, which have little or no access to credit. They tend to use their surplus margin to expand slowly. As a result, the distribution of surplus margins does not display extreme high and low percentages characteristic of voluntary groups.
An October 2007 study (DMA Health Strategies) provides valuable insights into those Safety Net orga-nizations that rely on the service provider business model. The study examined health and human service-oriented nonprofits that contract with the Common-wealth.13 These organizations are often heavily funded through federal, state and local sources. Government funding is generally paid in arrears (such as cost-reim-bursement) with some important costs not covered. So, these organizations engage in fundraising designed to generate unrestricted funds to cover core office needs and gaps in funding program. One-third of these orga-nizations report annual deficits, with a total of 60% reporting surplus margins are 2% or lower. Almost half of the providers have liabilities in excess of net assets and 4% have negative net assets. Cash on hand is quite low, with 60% of providers holding under one month on hand.
Economic Engine OrganizationsThe nonprofit sector is as an important employer and economic engine for the Commonwealth of Massa-chusetts. The high employment and recent employ-ment growth in the nonprofit sector can be largely attributed to the 137 organizations with more than $50 million in annual revenues in 2003, which drive the state’s economy while providing services on a large scale. In total, these organizations represent $36.4 billion in revenues, $36.3 billion in spending and $122.6 billion in assets, meaning that they account for 72% of revenues and expenses and 80% of total assets of the filing public charity sector. Health Care organi-
zations account for 56% of these large nonprofits with 29% drawn from the Educational services sector.
These organizations primarily deliver health and educational services paid for directly by individuals or third party payers but they also offer subsidized services through government programs. Many of the clients come from outside the local community or even the state. These organizations rely predominately on program service revenue (75.7%) and, to a lesser extent, on contributions (17.9%). Annual real revenue and spending growth for the organizations that filed in both 1989 and 2003 was 2.8% and 3.1%, respectively, outpacing the 1.3% and 2.1%, respectively, for the total sector. These organizations averaged $242.5 million in spending in 2003, primarily devoted to compensation (47.1% of total expenses).
Large organizations have been able to sustain their size. Of the 69 classified as Economic Engines in 1989, 66 (or 96%) were still in this category in 2003, with two of the other three declining to the $10 to $50 million budget size by 2003. In contrast, 23 organizations grew out of the $10 to $50 million budget range (based on 2003 dollars) and eight others grew from even smaller categories to join the largest category, often through mergers. Twenty-one left the sample during the period and 40 entered as large organizations, with the vast majority associated with hospital mergers that resulted in the core of the organization remaining as part of another large health care organization.
The overwhelmingly dominant business model for Economic Engine organizations is that of a Large Insti-tution. Institutions are mainly found in three industry sectors: 1) the Arts: museums, historical societies, some performing arts and media and communications enti-ties; 2) Education: colleges, universities, and secondary schools; and (3) Health: hospitals, nursing, and mental health. These organizations rely heavily on program service revenue and large-scale government funding. In the Arts, museums depend on large federal and state funding and also on ticket sales. Colleges and universities are funded by tuition and research grants, while hospitals and other health care organizations are supported heavily by third party payments from government programs and insurance providers.
These organizations have a complex revenue mix. In the Arts, revenues are substantially dependent on contributions but also benefit greatly from ticket sales

30 u n d e r s t a n d i n g B o s t o n
and memberships. Museums and historical societies have extensive financial investments (17% to 21% of assets) and fixed assets (27% to 39% of assets).
In the area of Education, program service revenue is the dominant form of income for colleges and independent schools. Libraries, colleges and universities have exten-sive financial investments (21% to 28% of total assets), while K-12 schools, colleges and universities have fixed assets of 30%. Like arts institutions, educational institu-tions have a relatively high number of days of cash on hand – in the 40–140 days of operating expense range – and have surplus margins in the 2% to 5% range.
Health institutions were the least financially healthy of the three sectors in 2003. They were the most reli-ant on program service revenue (63% to 74% of total revenues). Health Care organizations had the lowest cash levels in the 30 to 40 day range with receivables and inventory levels matching or exceeding payables in the 30 to 45 day range. Hospitals and nursing nonprofits had financial investments in the 15% to 19% range with mental health nonprofits holding only 3% of assets in the form of investments. These three types of health care organizations have fixed assets of 27% to 31% of total assets that are partially funded by bonds and mortgages, which constitute 18% to 25% of assets. Surplus margins fell in the 0% to 2% range. The financial well-being of many of these hospitals has turned around due to mergers and large capital grants. Nationally, 77% of US nonprofits had positive surplus margins in 2006.14
These organizations rely on leveraging assets to support their operations, resulting in a high average asset-to-revenue ratio, such as the 87% average for hospitals. Assessing growth in this category is compli-cated by the extensive number of hospital mergers. For the organizations that maintained the same employer identification number (EIN), total asset growth was positive with the median real annual growth of 3.7% supported equally by growth in liabilities and net assets and on par with the whole Massachusetts nonprofit sector.
Overall, Economic Engine organizations have consid-erable access to credit as well as operating and perma-nent reserves. As a result, they are able to maintain relatively low levels of cash on hand (0.6 months vs. 1.8 months of operating expenses) and can afford to pay their bills in just over a month. More than 60%
have breakeven or positive surplus margins. Unlike their counterparts, relatively few large organiza-tions generate a surplus margin of more than 10% of revenues or loss of more than 5% of revenues. Large colleges and universities have access to both the bond and bank loan markets as well as short-term and long-term debt. While the majority of nonprofits have leverage of less than 10%, less than 10% of large orga-nizations are unleveraged.
Financial Differences Between the Three Type of Value Propositions: A Discussion by Organizational Budget SizeSince it is difficult to determine a nonprofit organiza-tion’s business model, this report focuses on compar-ing the budget size of nonprofits based on their value propositions. To highlight these variations, it is help-ful to divide the middle group of nonprofits into four sizes: (1) $250,000 to $1 million, (2) $1 to $5 million, (3) $5 to $10 million, and (4) $10 to $50 million. This break-down will also differ by the mix of business models, with Membership, Expressive Voice, and Support Organizations falling most heavily into the under $1 million category, Service Providers falling more typi-cally in the $1 million to $10 million, and other institu-tions falling in the $10 to $50 million range.
liquidityOne factor affecting a nonprofit’s financial health is liquidity. As Figure 2.1 indicates, there are distinct size-related differences in liquidity. The median small Grass-roots organization has 55 days of cash on hand, meaning that if no new revenues are received, the median orga-nization can pay for 55 days of operating expenses using the cash on hand at year end. These organizations rely on cash as the sole form of liquidity, with no other form of current assets (such as receivables, inventory or prepaid expenses) that could be readily converted into cash and used to pay bills in the short term.
The median Grassroots organization has no current liabilities. With no employees, there are no unpaid wages at year-end, and they have fully paid for other short-term obligations. They hold most of their assets in the form of cash, which on median equals 1.8 months of expenses, allowing the organization
31p a s s i o n & p u r p o s e : R a i s i n g t h e F i s c a l F i t n e s s B a r f o r M a s s a c h u s e t t s N o n p r o f i t s
zation benefiting from already holding inventory and prepaid items equivalent to six days of expenses. These organizations, however, have unpaid bills equivalent to 45 days of operating expenses. Once these outstand-ing bills are paid, the median large organization is left with liquid assets sufficient to cover 25 days of operating expenses. This measure is known as the net operating cycle. A net operating cycle of 25 days could indicate financial distress for some types of organiza-tions. However, these large organizations manage cash in a sophisticated way, transferring any unneeded cash into investments, which are not reflected in current funds. Therefore, the liquidity of these organizations is better than the net operating cycle suggests.
Safety Net organizations exhibit an interesting pattern in net operating cycles. The smallest Safety Net orga-nizations with a $250,000 to $1 million budget size exhibit the highest net operating cycle of 85 days. The cycle is composed of 88 days of cash on hand, seven days of inventories and two days of inventories and payables that are offset by 12 days of bills outstanding. This group is the closest to reaching the recommended three months of liquidity that is frequently advised for nonprofits.
The smallest Safety Net group holds cash as its domi-nant asset and often relies solely on this financial
to reserve its cash holdings to pay future bills. This liquidity situation may be driven by limited revenue funding and lack of access to credit, leaving organi-zations with scarce quantities of cash to meet their obligations.
The cash position of Grassroots organizations is truly a defining financial trait. As Figure 2.2 indicates, there are two distinct modes of operation. Some 38% of Grassroots groups have no cash resources while 48% have more than two months of cash to cover operating costs. The organizations devoid of cash include sports clubs and other small associations that raise funds for periodic needs, such as sports equipment, and fully spend the resources raised. However, this category also includes other organizations, such as performing arts and student services groups that may be without cash due to unfavorable funding arrangements or high program costs. Ironically, these same organiza-tions are just as likely to hold more than two months of cash on hand.
At the other extreme, the hospitals and universities that make up the Economic Engine category have a very different liquidity profile. The median large organization holds 20 days of cash on hand. Once liquidated, these organizations can rely on receivables to cover another 44 days of expenses with the organi-
60
40
20
20
0
40
60
80
120
100
< 250K 250K–1M 1–5M 5–10M > 50M10–50M
Days Cash on Hand
Days Receivables on Hand
Days Inventory and PayablesOn Hand
Days Bills Outstanding
Days Deferred Revenue Paid
FIGURE 2.1
liquidity Measures by Size Buckets
Source: Boston Foundation Dataset derived from NCCS 2003 Digitized Form 990 Dataset
0%
20%
40%
60%
80%
100%
Under $250K $250K–$1M $1–$5M $5–$10M Over $50M$10–$50M
Over 2 Months
Exactly 0 Months
0 to 0.5 Month
0.5 to 1 Month
1 to 1.5 Months
1.5 to 2 Months
FIGURE 2.2
Distribution of Months Cash on Hand by Size Buckets
Source: Boston Foundation Dataset derived from NCCS 2003 Digitized Form 990 Dataset

32 u n d e r s t a n d i n g B o s t o n
TABLE 2.2
Budget Size Breakdowns
Demographic Statistics <250k 250k-1M 1-5M 5-10M 10-50M >50M Total Mega
Number of Organizations (1989) 1,543 905 658 170 159 90 3,525 8
Number of Organizations (2003) 4,574 1,747 1,138 351 365 137 8,312 22
Annual Growth Rate in Number of Organizations 8.1% 4.8% 4.0% 5.3% 6.1% 3.0% 6.3% 7.5%
Average Total Revenue (2003) $108,570 $575,824 $2,383,912 $7,395,660 $20,967,058 $265,301,052 $6,112,915 $661,200,000
Average Total Spending (2003) $83,164 $523,310 $2,247,206 $7,096,053 $19,875,483 $250,138,034 $5,758,676 $863,800,000
Average Program Spending (2003) $52,987 $412,991 $1,813,638 $5,850,798 $16,981,277 $216,404,873 $4,923,850 $756,800,000
Average Total Assets (2003) $396,008 $1,590,348 $5,180,401 $14,584,491 $38,954,832 $894,918,260 $18,338,119 $4,189,000,000
Average Net Assets (2003) $320,859 $1,092,743 $3,390,398 $9,880,533 $25,726,285 $462,993,260 $10,048,501 $1,905,000,000
For Organizations Filing in 1989 and 2003 670 637 492 170 201 97 2,267
Average Nominal Total Revenue (1989) $160,856 $491,842 $1,143,293 $3,558,707 $8,086,939 $95,909,377 $5,585,502 $310,800,000
Average Real Total Revenue (1989) $265,100 $810,587 $1,884,217 $5,864,968 $13,300,000 $158,000,000 $9,205,252 $512,000,000
Average Total Revenue (2003) $140,374 $579,572 $2,419,971 $7,604,100 $20,210,712 $260,000,000 $14,217,180 $876,700,000
Median Annual Real Revenue Growth Rate -1.7% 1.3% 2.7% 3.5% 3.7% 2.8% 1.3% 0.7%
Average Actual Total Spending (1989) $127,735 $424,588 $1,005,067 $3,004,871 $7,263,696 $87,989,424 $5,009,415 $280,200,000
Average Real Total Spending (1989) $210,516 $699,747 $1,656,412 $4,952,213 $12,000,000 $145,000,000 $8,255,824 $462,000,000
Average Total Spending (2003) $107,933 $540,270 $2,227,093 $7,213,969 $19,815,262 $242,500,000 $13,341,175 $789,600,000
Median Annual Total Real Spending Growth Rate -0.2% 2.0% 3.6% 3.5% 3.8% 3.1% 2.1% 0.6%
Nonprofit Budget Group Analysis (in 2003)
Total Subsector Revenues $496,600,482 $1,005,964,383 $2,712,891,796 $2,595,876,556 $7,652,976,074 $36,346,244,159 $50,810,553,450 $15,200,000,000
Total Subsector Assets $1,811,340,056 $2,778,337,919 $5,895,296,350 $5,119,156,242 $14,218,513,670 $122,603,801,583 $152,426,445,820 $92,200,000,000
Total Subsector Spending $380,393,992 $914,223,433 $2,557,319,992 $2,490,714,758 $7,254,551,179 $34,268,910,646 $47,866,114,000 $19,000,000,000
Total Subsector Program Spending $242,362,646 $721,496,145 $2,063,919,895 $2,053,630,063 $6,198,166,089 $29,647,467,563 $40,927,042,401 $16,600,000,000
Average Funding Mix (% total revenues)
Contributions 46.0% 42.1% 38.7% 29.4% 25.0% 17.9% 42.1% 19.4%
Government Funding 3.1% 9.1% 11.6% 12.2% 12.4% 7.7% 6.4% 21.3%
Program Service Revenue 38.4% 44.7% 52.8% 65.1% 71.0% 75.7% 44.9% 82.4%
Membership Dues 8.0% 3.9% 2.3% 1.8% 1.1% 0.2% 5.6% 0.0%
Investment Income -5.2% 3.5% 1.9% 1.5% 0.8% 2.3% -1.7% 0.0%
Other Income 12.7% 5.8% 4.2% 2.2% 2.1% 3.9% 9.1% -1.8%
2003 Ratios (medians unless otherwise noted)
liquidity
Inverse Current Ratio 0.00 0.14 0.29 0.43 0.46 0.56 0.11 0.62
Net Working Capital $11,009 $113,409 $332,596 $775,996 $1,773,084 $6,712,812 $49,838 $69,900,000
Days Cash on Hand 54.8 87.8 55.3 29.2 29.4 19.6 56.7 24.5
Days Receivables on Hand 0.0 7.0 28.6 39.6 40.1 44.3 0.0 43.8
Days Inventory and Payables On Hand 0.0 2.3 3.2 3.0 3.4 6.0 0.0 4.9
Days Bills Outstanding 0.0 12.0 22.4 30.6 31.8 45.0 2.6 54.6
Days Deferred Revenue Paid 0.0 0.0 0.0 0.0 0.2 0.0 0.0 0.0
Net Operating Cycle 54.8 85.1 64.7 41.2 41.0 25.0 54.2 18.6

33p a s s i o n & p u r p o s e : R a i s i n g t h e F i s c a l F i t n e s s B a r f o r M a s s a c h u s e t t s N o n p r o f i t s
TABLE 2.2
Budget Size Breakdowns (continued)
2003 Ratios (continued) (medians unless otherwise noted) <250k 250k-1M 1-5M 5-10M 10-50M >50M Total Mega
Balance Sheet Strength (averages unless otherwise indicated)Dominant Asset for the Median Firm Cash Cash LBE LBE LBE LBE Cash LBE
as % Total Assets 36.5% 38.2% 30.9% 31.7% 34.7% 29.1% 33.3% 27.4%
Cash-to-Assets 36.5% 38.2% 26.5% 19.0% 14.8% 11.2% 33.3% 10.2%
Other Current Assets-to-Assets 3.9% 14.3% 18.7% 24.1% 23.1% 16.7% 10.1% 14.1%
Loans Receivable-to-Assets 0.6% 1.4% 1.4% 0.9% 1.1% 1.6% 0.9% 4.1%
Investments-to-Assets 8.2% 10.9% 13.4% 13.3% 17.1% 25.2% 10.4% 29.4%
Fixed Assets-to-Assets 13.8% 27.6% 30.9% 31.7% 34.7% 29.1% 21.1% 27.2%
Payables-to-Assets 6.6% 13.4% 15.8% 17.2% 16.0% 16.7% 10.4% 17.1%
Deferred Revenues-to-Assets 2.2% 4.3% 4.5% 3.4% 3.3% 2.9% 3.1% 0.8%
Related Party Loans-to-Assets 6.4% 3.8% 0.2% 0.0% 0.0% 0.0% 4.3% 0.0%
Bonds and Mortgages-to-Assets 6.8% 15.8% 17.3% 18.4% 21.5% 20.4% 11.6% 20.2%
Liabilities-to-Assets 54.8% 46.7% 42.0% 41.5% 34.2% 33.1% 49.4% 36.4%
Assets-to-Revenues 87.3% 92.4% 91.6% 71.3% 72.9% 97.3% 87.8% 248.2%
ProfitabilityDominant Revenue Cont PSR PSR PSR PSR PSR PSR PSR
As % Total Revenue 46.0% 44.7% 52.8% 65.1% 71.0% 75.7% 44.9% 82.4%
Dominant Expense OthrExp Comp Comp Comp Comp Comp Comp Comp
As % Total Expenses 20.5% 42.8% 47.8% 51.9% 50.9% 47.1% 28.3% 46.1%
Surplus Margin 5.0% 0.3% 0.7% 1.3% 0.6% 1.0% 2.0% 2.4%
Total Comp. as % Total Expenses 13.6% 42.8% 47.8% 51.9% 50.9% 47.1% 28.3% 46.1%
% of Orgs with Employees 30.5% 84.6% 93.6% 94.3% 94.0% 96.4% 57.1% 100.0%
EfficiencyAdministrative Cost Ratio 1.6% 14.4% 13.8% 11.8% 10.6% 11.6% 9.1% 12.1%
Program Efficiency 64.6% 81.6% 82.7% 86.3% 88.0% 87.0% 79.3% 87.4%
Fundraising Efficiency 0.0% 1.2% 2.8% 0.5% 3.5% 5.3% 0.0% 1.2%
Months Cash on Hand DistributionOver 2 Months 48.4% 59.2% 45.9% 29.6% 24.9% 18.2% 48.0% 22.7%
1.5-2 Months 2.8% 7.2% 8.8% 5.7% 7.7% 4.4% 4.9% 4.5%
1-1.5 Months 3.1% 6.8% 10.2% 12.0% 14.5% 16.1% 6.0% 22.7%
0.5-1 Month 3.7% 10.4% 15.2% 18.5% 19.7% 16.0% 8.2% 4.5%
0 to 0.5 Month 4.2% 14.3% 18.7% 32.2% 31.6% 42.4% 11.4% 40.9%
Exactly 0 Months 37.8% 2.1% 1.2% 2.0% 1.6% 2.9% 21.5% 4.5%
Surplus Margin DistributionOver 10% 42.0% 24.0% 20.3% 14.0% 15.9% 11.9% 32.4% 13.6%
5% to10% 8.0% 9.3% 10.5% 13.4% 6.8% 10.3% 8.8% 18.2%
2% to 5% 6.2% 10.2% 12.7% 17.0% 15.7% 15.3% 9.0% 13.6%
0% to 2% 5.6% 8.1% 12.1% 18.3% 22.1% 23.4% 8.6% 18.2%
-5% to 0% 9.5% 14.6% 17.2% 16.2% 20.9% 26.2% 12.6% 22.7%
Below -5% 28.7% 33.8% 27.2% 21.1% 18.6% 13.9% 28.6% 13.6%
leverage Distribution0% to 10% 78.0% 42.1% 26.6% 14.6% 10.4% 8.8% 56.3% 13.6%
10% to 25% 6.0% 17.0% 21.1% 15.2% 17.1% 13.8% 11.5% 4.5%
25% to 50% 5.4% 16.1% 23.8% 32.1% 32.1% 34.3% 13.0% 22.7%
50% to 100% 5.6% 13.6% 18.6% 29.5% 34.1% 36.5% 12.0% 59.1%
Over 100% 5.0% 11.2% 9.9% 8.6% 6.3% 6.6% 7.2% 0.0%
Comp = Compensation; Cont = Contributions; LBE = Land, Building and Equipment; OthrExp = Other Expenses; PSR = Program Service Revenue

34 u n d e r s t a n d i n g B o s t o n
For the Economic Engine organization, the liquidity picture may seem the least healthy. However, the low cash balances and relatively high levels of unpaid bills are indicators of sophisticated cash management that allows excess cash to be invested for a higher return. In addition, many of these organizations have access to short-term bank credit that is an additional financial buffer should they experience an unexpected liquid-ity problem. These organizations also have significant receivables, largely from program services and some deferred revenues. Overall, they can comfortably cover all short-term obligations with just over half of their current assets.
ProfitabilityThe median profitability of the entire sector is quite low with net income equal to 2.0% of total revenues. In addition, the average annual real growth rate for reve-nues is 1.3% over the 1989 to 2003 period, in contrast to the 3.6% annual real rate of economic growth. The distribution of surplus margins is displayed in Figure 2.4. As the figure highlights, the surplus margin is the highest for Grassroots organizations with a median ratio of 5.0%. While it seems counterintuitive that these organizations would post the highest surplus margin,
resource to support them. These organizations have succeeded in procuring enough additional funding to support an employee, in some cases through govern-ment funding. The high level of cash liquidity may be necessary, since 80% of these organizations have paid staff in contrast to only 30% of Grassroots organiza-tions. Variations in the use of paid staff and employ-ees’ relative importance as an expense can be seen in Figure 2.3.
A transition in liquidity is noticeable in even larger Safety Net organizations. Starting at a $1 million annual budget, organizations have a sufficient finan-cial cushion in terms of short-term supplier, funder and bank credit to reduce their cash holdings.
For the organizations in the $5 to $10 million and $10 to $50 million categories, cash on hand almost equals bills outstanding, potentially indicating limited liquid-ity. However, the inverse current ratio is close to 0.5, suggesting that these organizations have developed other forms of current assets, such as receivables that provide another kind of a financial cushion. In fact, larger organizations are more reliant on program service revenue, which results in expanded receiv-ables. An analysis of current liabilities also reveals that these larger organizations hold current liabilities, such as deferred revenue, which are liquidated not by cash payments but by the delivery of future services, partic-ularly program services.
Under $250K $250K–$1M $1–$5M $5–$10M Over $50M$10–$50M
Compensation as % Total Expenses
% of Nonprofits with Employees
0
20
40
60
80
100
FIGURE 2.3
Employee Characteristics by Size Buckets
Source: Boston Foundation Dataset derived from NCCS 2003 Digitized Form 990 Dataset
0%
20%
40%
60%
80%
100%
Under $250K $250K–$1M $1–$5M $5–$10M Over $50M$10–$50M
Over 10%
Below 5%
5% to 0%
0% to 2%
2% to 5%
5% to10%
FIGURE 2.4
Surplus Margin by Size Buckets
Source: Boston Foundation Dataset derived from NCCS 2003 Digitized Form 990 Dataset

35p a s s i o n & p u r p o s e : R a i s i n g t h e F i s c a l F i t n e s s B a r f o r M a s s a c h u s e t t s N o n p r o f i t s
organization with paid employees and expanded offices. These additional financial costs have not been offset by growth in contributions. The shifts in funding mix can be observed in Figure 2.5.
By examining the larger size categories, a transition away from a reliance on contributions toward program service revenues becomes evident, culminating in a 76% reliance for the large Economic Engine nonprofits. Compensation becomes the dominant expense before an organization reaches $1 million in budget, and it stabilizes at close to 50% of total expenses. Unfortu-nately, the profitability profile for nonprofits remains unhealthy. Overall, 40% of nonprofits can be expected to operate unprofitably each year. The percentages are the lowest for Grassroots organizations and orga-nizations in the $10–50 million range; however, these percentages do not drop below 35%. If one includes nonprofits that report breakeven or modest surplus margins between 0 and 2%, then 50% of nonprofits report weak profitability with 60% or more of agencies with budgets $10 million or more posting meager or negative surpluses.
SustainabilityThe limited liquidity and weak profitability of the Massachusetts nonprofit community raises serious questions about the sustainability both of specific organizations and the bulk of the sector itself. In the for-profit sector, one looks to an organization’s balance sheet, equity base and current operations to determine its long-term prospects.
An analysis of the asset mix of Massachusetts nonprofits (see Figure 2.6) reveals variation by size. On average, cash represents 37% of total assets for Grassroots orga-nizations in comparison to only 11% for organizations with budgets of more than $50 million. The average Grassroots organization holds 8% of its assets in invest-ments, and this percentage rises to 25% for the largest organizations. As these figures are averages, the high endowment holdings of a number of local universities account for the relatively larger percentage of invest-ment assets for the Economic Engine organizations.
In the for-profit sector, firms with substantial debt rela-tive to equity are considered highly leveraged and at risk. Firms with more liabilities than assets are consid-ered technically insolvent and at risk of bankruptcy.
it may be the result of several factors: Without access to a funder, vendor or bank credit, running a surplus is the only method available to Grassroots organizations to sustain operations or grow. In addition, a dispro-portionate number of Grassroots organizations select December 31st fiscal year-ends. Due to end of year charitable giving, these organizations may be holding record high cash levels at fiscal year-end.
Just as Grassroots organizations tended to fall into one of two extreme modes for liquidity, a similar pattern is apparent for profitability. Some 42% of organiza-tions report surplus margins of 10% or higher, while 38% report negative margins. Remarkably, there is no correlation between Grassroots organizations’ key liquidity and profitability measures.
The smallest Safety Net organizations exhibit a mark-edly less favorable profitability profile with only 24% reporting surplus margins over 10% and 48% with negative profitability. It appears that these organiza-tions have grown by attracting more program service revenue, including government funding, which encouraged the transition to a more professional
0%
20%
20%
40%
60%
80%
100%
120%
Under $250K $250K–$1M $1–$5M $5–$10M Over $50M$10–$50M
Contributions
Program Service Revenue
Membership Dues
Investment Income
Other Income
FIGURE 2.5
Funding Mix Measures by Size Buckets
Source: Boston Foundation Dataset derived from NCCS 2003 Digitized Form 990 Dataset

36 u n d e r s t a n d i n g B o s t o n
On average, the smallest Safety Net organizations have gained more access to debt and improved program efficiency, allowing many of them to take on their first paid staff. However, this organizational restructuring poses a financial drain that results in more organiza-tions operating with deficits. Most nonprofit organi-zations then find themselves in the “current services trap,” which generally leaves them with unstable organizations and weak finances.
Ironically, lack of leverage may be a sign of financial distress in the nonprofit sector. Nonprofits, unlike corporations, cannot issue stock to raise funds. There-fore, nonprofits can only create reserves or grow either by borrowing or producing high surplus margins over a sustained period.
Two potentially beneficial factors may support a nonprofit that is striving to be larger and more finan-cially stable. First, larger nonprofits are granted access to both short- and long-term debt. As seen in Figure 2.7, access to credit – evidenced by higher leverage – increases with budget size. A second factor that could enhance financial sustainability is greater efficiency due to economies of scale. Figure 2.8 shows that nonprofits’ reported program and fundraising efficiencies increase with size.
So are nonprofit organizations able to capitalize on these factors to become financially robust?Unfortunately, the vast majority are not. At the small end of the spectrum, most Grassroots organizations (78%) have liabilities equal to less than 10% of their assets. Cash is their sole economic cushion to cover current and future operating costs. Any disruption in cash flow or loss of a key funding source threatens the viability of these organizations.
0%
20%
40%
60%
80%
100%
Under $250K $250K–$1M $1–$5M $5–$10M Over $50M$10–$50M
0% to 10%
10% to 25%
25% to 50%
50% to 100%
Over 100%
FIGURE 2.7
Distribution of leverage by Size Buckets
Source: Boston Foundation Dataset derived from NCCS 2003 Digitized Form 990 Dataset
0%
20%
40%
60%
80%
100%
< 250K 250K–1M 1–5M 5–10M > 50M10–50M
Other Assets
Cash
Other Current Assets
Loans
Investments
Fixed Assets
FIGURE 2.6
Distribution of Assets by Size Buckets
Source: Boston Foundation Dataset derived from NCCS 2003 Digitized Form 990 Dataset
0%
20%
40%
60%
80%
100%
Under $250K $5–$10M$1–$5M$250K–$1M $10–$50M Over $50M
Program EfficiencyAdministrative Cost RatioFundraising Efficiency
FIGURE 2.8
Efficiency Ratios by Size Buckets
Source: Boston Foundation Dataset derived from NCCS 2003 Digitized Form 990 Dataset

37p a s s i o n & p u r p o s e : R a i s i n g t h e F i s c a l F i t n e s s B a r f o r M a s s a c h u s e t t s N o n p r o f i t s
Despite their impressive size, financial strength and investment portfolios, this group has exhibit slow growth. Real annual revenue growth equaled 0.7%, compared to 1.3% for the whole Massachusetts nonprofit sector, while real annual spending was lower at 10.6% in contrast to the 2.1% average expansion for the sector. So, while these organizations are profitable and financial stable, it appears that these factors are not sufficient to enable these organizations to continue to grow and expand their mission and impact at the same pace as their smaller nonprofit counterparts.
In Tables 2.3 and 2.4, the left columns depict these less stable organizations. Even when nonprofits have the opportunity to expand through revenue growth or borrowing, these organizations are under consider-able pressure to use these resources to expand current services and raise program efficiency. Despite growing program services, they produce chronic deficits. As the organizations grow, their dominant asset changes from cash to physical plant, which brings with it future operational and maintenance costs. Resources are so depleted that they do not have financial investments that could serve as cushion. Investments in human and support services are also kept low.
what nonprofits are able to avoid the current services trap?Ideally, these organizations will exhibit the organi-zational characteristics and financial traits depicted in the right-hand columns of Tables 2.3 and 2.4. This study classifies a special nonprofit group as “mega-organizations.” These organizations serve clients and receive support from far beyond their local commu-nity. The criterion for inclusion in this group is an annual budget of $250 million or more for most indus-try sectors and $100 million or more for colleges and universities. Only 22 Massachusetts organizations meet this description.
Several financial characteristics of these mega-orga-nizations are very strong. The average spending per organization is $863.8 million. The median surplus margin is 2.4% with 64% operating profitably in 2003. These organizations rely on 82% of program service revenues with contributions composing most of the remainder. The median net operating cycle is only 19 days; however, investments comprise 29% of total assets, generally providing a more than adequate liquidity cushion. Some 23% of these organizations do maintain cash levels over two months. Two striking findings, however, are that current assets are funded 62% by current liabilities and the asset to revenue ratio is 248%. These percentages are much higher than those of any other nonprofit grouping. Fundraising costs are quite low, at 1.2% of each dollar raised, while admin-istrative expenses are relatively high at 12.1% of total expenses.

38 u n d e r s t a n d i n g B o s t o n
TABLE 2.3
Organizational Capacities
less Stable More Stable
1. Culture & Norms
a. Mission vs. money No overhead; all $ for programs Long-term mission and org sustainability
b. Staffing Volunteer/charity for labor and staff Paid programs staff and support
c. Financials Not profitable (not reinvesting) Finances sustain operations and infrastructure
d. Time horizon Responds to immediate program needs Exists to create long-term social value
2. Strategy No or poorly developed strategy or business plan
Strategy supports healthy norms
Responds opportunistically to funders and potential partners
Strategy augments business plan
3. Capacity
a. Staffing High turnover High retention
Low pay and few benefits Competitive pay and employee benefits
Low experience Provides meaningful work
Little training Provides training and professional growth
No career path Plentiful learning opportunities
b. Systems & Infrastructure Underinvestment Integrated
Outdated technology Capital budgeting
Short-term focus Long-term and capacity focus
Deferred maintenance Committed to asset maintenance
4. Operational Efficiency More is better Structured experiment
Keep costs low for programs Scale, when warranted
Scope
5. Performance Management Focus on current activities and outputs Root cause analysis
Compliance oriented Outcome/results oriented
Command and control oriented Performance driven management
Crude, simplistic measures Total quality management (TQM) philosophy
6. Accountability Reporting driven by regulation and funders
Active, informed board
Reporting to key constituents
Source: “The Current Services Trap”, Elizabeth K. Keating

39p a s s i o n & p u r p o s e : R a i s i n g t h e F i s c a l F i t n e s s B a r f o r M a s s a c h u s e t t s N o n p r o f i t s
TABLE 2.4
Sound Financial Business Model
less Sustainable More Sustainable
1. Profitability
a. Revenues Urgent short term appeals Value or cost based pricing
Heavy reliance on one time donors Solid base of recurrent funders
Uncertain revenue streams Extensive unrestricted revenues
Restricted programmatic finding Diversified revenue base
Time limited finding
Costly to raise
Undiversified revenue streams
b. Expenses Overhead costs not fully recovered from grants
Full costing
Program delivery absorbs all excess dollars
Rich understanding of cost structure
Investments regularly made
c. Surplus Breakeven operations Regularly runs a surplus
Additional revenues spent immediately on program
Fully meet financial obligations
Surplus builds operating and capital reserves
2. liquidity – working Capital Government reimbursement contracts Grants and contracts paid in advance
No cash on hand 3–6 months of cash on hand
Constant or growing reliance of line of credit
Unused line of credit
Bill payment difficult Sufficient cash to pay bills throughout year
3. Solvency Little or no net assets Operating reserves
Fixed assets maintenance & plant reserves
Endowments and quasi-endowments
4. Quality of Accountinq Systems Trust deemed sufficient Well designed and functional accounting systems
Few segregation of duties or internal controls
Segregation of duties and internal controls
Manual or out of date records Timely and informative internal reports
5. Capital Structure Little or no equity or long term debt Matched book, i.e. long-term financing sufficient to fund long-term assets
Source: “The Current Services Trap”, Elizabeth K. Keating


41p a s s i o n & p u r p o s e : R a i s i n g t h e F i s c a l F i t n e s s B a r f o r M a s s a c h u s e t t s N o n p r o f i t s
ChapteR thRee
Financial Health Across 10 Industry Sectors
A different perspective on the financial health of the Massachusetts Nonprofit Sector can be revealed by segmenting nonprofits by their mission and program services. Organizations with similar missions and program services often have similar business models and patterns of funding and spending.
To engage in this analysis, Massachusetts nonprofits were divided into 10 broad industry sector categories. These classifications were developed using the 26 National Taxonomy of Exempt Entity (NTEE classifica-tions) and combining them into 10 smaller industry groups as described in Appendix A. The initial assign-ment of a nonprofit to an NTEE code was based on the work of the Urban Institute’s National Center for Charitable Statistics (NCCS). Nonprofits classified as Unknown were assigned categories by the Boston Foundation, with just 322 ultimately left unclassified. In addition, a few classified nonprofits were reclas-sified based on available information about their operations.
To provide as much information as possible to read-ers of this report, the information for each of these 10 sectors was further broken down into three to six distinct sub-sectors. In each of the 10 broad indus-try sectors, nonprofits whose primary mission is to provide funding or support services to other nonprof-its were placed into a sub-sector called “support service organizations.” The remaining nonprofits were placed into sub-sectors that contain organizations with a similar mission, program services, and business model.
This industry sector chapter provides a financial summary of each of the 10 broad industry sectors along with statistics and some discussion of their financial characteristics and business models. In each broad category, one sub-sector has been selected for more detailed analysis.
See Table 3.0 All Sectors on pages 56–59.
Arts, Culture and Humanities The Arts, Culture and Humanities (“Arts”) industry sector’s 1,115 organizations enhance the state’s rich cultural tradition. The number of arts organizations has grown rapidly, from 455 in 1989 to 1,115 in 2003, an annual rate of growth of 6.6%. In contrast, the organizations operating in 1989 only grew 0.6% and 1.5%, respectively, in revenues and expenses in real terms annually. In 2003, these organizations spent $1.2 billion, held $4.3 billion in assets, drew revenues of $1.3 billion, and enriched the state’s quality of life through more than $908.4 million in program spend-ing. Of its sub-sectors, the fastest growth in terms of number of organizations occurred among support service organizations, which grew 20.7% annually within this period.
The six sub-sectors within the Arts industry sector are: (1) arts, culture and humanities; (2) performing arts; (3) museums; (4) media and communications; (5) historical societies; and (6) support service and other organizations. High profile organizations in this sector include large media and performing arts organizations such as WGBH and the Boston Symphony. Its muse-ums and historical societies include the Museum of Fine Arts, Clark Art Institute, Worcester Art Museum, Old Sturbridge Village, and Historic Salem.
Most of these organizations fit the Expressive Voice Organization business model (70%) and are small with budgets under $250,000. This is particularly true of the many Grassroots organizations found in the perform-ing arts sub-sector. Each has its own stylistic, program-matic and creative voice. Museums, with more unified missions and a more complex revenue mix, closely resemble the Large Institution model. Five of these organizations have budgets exceeding $50 million.
With the exception of performing arts groups, contrib-uted income is the dominant source of revenue in the Arts industry sector, comprising 43.8% of income. Program service revenue is the dominant form of

42 u n d e r s t a n d i n g B o s t o n
Spotlight: Performing ArtsThis sub-sector is in many ways representative of all arts organizations. It contains some large and notable organizations, but the majority are small and will remain small, with many existing ‘on the edge’ finan-cially. Local musical groups and historical societies, for example, do not have expansion or merger as an objec-tive. Still, it may be possible to reduce fiscal pressures on groups such as these through the sharing of knowl-edge, facilities and other resources.
Within the Arts sector, performing arts organizations are the most numerous, with 408 organizations, repre-senting a third of the sector total. Despite the presence of several prominent organizations, such as the Boston Symphony, Boston Ballet and the Huntington and American Repertory Theatres, the average organiza-tion in this sub-sector is quite small relative to the total Arts sector, with 73% falling into the Grassroots orga-nization budget size of under $250,000 in revenues, and their primary asset is cash.
Another characteristic of performing arts organizations is their reliance on program service revenue: 49.9% of their income comes from this source, more than any other Arts sub-sector. Consistent with their live perfor-mance mission, they rely on admissions income more heavily than other arts organizations.
While performing arts organizations require talented performers to be successful, it is surprising that compensation of employees is not their greatest expense, and they rank last among the Arts sub-sectors in terms of employees, with only 46.6% having employees. This makes more sense when considering the large number of small organizations that populate this sub-sector. Many utilize performers who volun-teer their time, and some contract for selected outside performers rather than paying them a regular salary.
The liquidity data for the performing arts sub-sector reveals that these organizations have less of a liquid-ity cushion than their counterparts in most other Arts sub-sectors. Their current ratio, net working capital and months of cash on hand are well below the medi-ans both inside and outside the Arts sector. Performing arts organizations had a median surplus margin ratio of 0.9%, and more than half had a negative surplus margin. Among the Arts sub-sectors, only museums had a lower surplus margin ratio than the performing
revenue for performing arts organizations, and the secondary source of income in the other sub-sectors. Museums and historical societies are often supported by membership dues, which provide just under 10% of the income in these two sub-sectors. The relative share of government contributions in arts organization income is markedly low at 3.6%; however, media and communications organizations obtain an average of 8.6% of income from this source.
The nonprofits in the Arts sector are more likely to hire employees than comparably sized organizations in other sectors with the exception of performing arts groups that hire based on their size.
As with nonprofits in several other industry sectors, cash is the dominant asset of the median-sized organization. Museums and historical societies, however, predomi-nantly own land, buildings and financial investments. With their high concentration of smaller budget orga-nizations, the balance sheets of arts organizations show little debt. Overall, performing arts organizations have a lower ratio of liabilities to assets than other nonprofits.
The liquidity profile of arts organizations is similar to that of other Massachusetts nonprofits. Its inverse current ratio, days cash on hand, and days bills outstanding indicate that arts groups hold slightly more cash and less short-term obligations than the statewide average. However, there are major variations within the sub-sectors. For example, months of days on hand range from 23 days for performing arts groups to 123 days for media and communications organiza-tions and 177 days for historical societies. Because of the large number of small organizations in this sector, the percentage of organizations with no cash on hand is higher than average.
This sector’s median surplus margin ratio lies just above the average for all nonprofits at 2.1%. Organiza-tions in this sector have been buffeted by recent busi-ness cycles. For example, during the troughs of the two business cycles, which occurred during 1989-2003, the surplus margin ratios of organizations in the arts sector fell to the all-organization level, but moved above that level as the economy grew stronger. Profit-ability varies considerably among sub-sectors. While support services organizations reported a median surplus margin ratio over 8.4%, the median ratio for museums was at breakeven with a negative 0.2% surplus margin.

43p a s s i o n & p u r p o s e : R a i s i n g t h e F i s c a l F i t n e s s B a r f o r M a s s a c h u s e t t s N o n p r o f i t s
proposition. The sector also has a high concentration of support service organizations and organizations that focus on delivering educational and student services. More than 80% of these Support Organizations are under $250,000 in budget size and fit the support orga-nization business model.
The K-12 and higher education schools are funded primarily by tuition and other program service reve-nue (76% and 61%, respectively). In contrast, libraries and general, social and applied science organizations rely on contributions for half of their funding. The support, educational, and student services groups have mixed revenue bases, with support services depend-ing on contributions and program service revenue and educational and student services funded by contribu-tions and other income.
The K-12 and higher education schools are heavily dependent on paid employees, with more than 80% of them having at least one paid employee and compen-sation costs clearly dominating their expense structure. The sub-sectors have employee statistics that is more characteristic of state averages.
Due to the large number of small organizations in this industry sector, the median organization’s dominant asset is cash, with the educational sub-sector hold-ing more cash on hand than the rest of the sector. The educational and student services sub-sectors hold the least cash, at 41 days of cash on hand, with libraries and K-12 schools reporting 141 and 79 days, respectively.
Most educational organizations have little or no unpaid bills or current liabilities. Colleges, K-12 schools and general, social and applied science orga-nizations, however, have more complex net operat-ing cycles that resemble many for-profits. The K-12 and general, social and applied science groups have outstanding bills equal to three to eight days of opera-tions, which is offset by six to eight days of receivables and other current assets that can be quickly converted to cash. Colleges and universities are able to defer paying bills for 24 days on average, which is offset by equal amounts of receivables and current assets. Higher education also benefits from the payment of tuition in advance of delivering classes.
This sector’s median surplus margin ratio of 2.9% is well above average, with most falling in the 2% to 5%
arts organizations. As with most Arts sub-sectors, cash is the most widely-held asset. However, the ratio of assets to revenues in the performing Arts sub-sector is well below that of any other sub-sector, primarily reflecting the relative lack of other types of longer-term, less liquid assets in their portfolios. Leverage is low with the ratio of liabilities to assets at 1.0%.
See Table 3.1 Arts, Culture & Humanities on pages 60–61.
Education, Science, Technology and Social SciencesThe Education, Science, Technology and Social Sciences industry sector is by several measures the largest of the 10 industry sectors. Its 1,727 organiza-tions constitute 21% of the Form 990 filers in Massa-chusetts. Collectively, its spending in 2003 was $14.3 billion (30% of total nonprofit spending), revenue was $16.4 billion (32%) and assets were $107.0 billion (70 %). Despite the sector’s generally large financial footprint, 58% of its organizations are in the under $250,000 spending category. The sector has expanded by 8.2% per annum in terms of the number of organi-zations, while only experiencing only 1.6% real growth in revenues per-organization between 1989 and 2003.
There are six sub-sectors in this category: (1) elemen-tary, secondary and vocational schools; (2) higher, graduate, and adult education; (3) libraries; (4) educa-tional and student services; (5) general, social and applied sciences; and (6) support service organiza-tions. The largest organizations in the Education sector are predominately internationally-known private colleges and universities or some private elementary and secondary schools. Several preeminent research organizations, such as the Mitre Corporation, Draper Laboratories, and the National Bureau of Economic Research, are found in this industry sector as well. Other large organizations include the John F. Kennedy Library Foundation and the New England Association of Schools and Colleges.
This industry sector’s numerous teaching institutions and libraries best conform to the Large Institution business model. They are run by professional staff and have complex revenue mixes and ranges of services. Most of these fall into the Economic Engine value
44 u n d e r s t a n d i n g B o s t o n
dation grants allow relatively high rates of overhead recovery which allows these organizations to offer relatively attractive employee benefits.
These organizations appear, by conventional ratio analysis, to operate with relatively little liquidity. Current liabilities average 36% of current assets, much higher than the 11% average for all Massachusetts nonprofits. Days of cash on hand and the net operating cycle average 47 and 41 days, respectively, providing just over one month of liquidity to cover operating expenses and 10 days less than the statewide nonprofit average. While this could suggest that these organiza-tions are cash-strapped, but in fact can indicate sophis-ticated cash and investment management.
The median surplus margin ratio for this sub-sector was 1.8% in 2003, slightly below the nonprofit average. Unlike other sub-sectors in this group, the dominant asset is land, buildings and equipment. Like elemen-tary and secondary education, colleges and universi-ties engage more heavily in borrowing, and have a ratio of liabilities to assets of 25.8%. Nevertheless, the balance sheets of these organizations are strong. Many of the larger organizations, such as Harvard University and MIT, have amassed substantial endowments to complement their property ownership. With their real property and financial investments, their ratio of assets to revenues is above average.
See Table 3.2 Education, Science, Technology and Social Sciences on pages 62–63.
Environment and Animal-RelatedThe Environment and Animal-Related sector is the smallest of the industry sectors, with only 345 organi-zations in 2003. However, it is also the fastest-growing, with an average annual organization growth rate of 8.7% between 1989 and 2003. In total, the sector’s spending and revenue in 2003, of $328.6 million and $360.8 million, respectively, represents only 1% of the Massachusetts nonprofit sector.
Organizations in this group are among the smallest in average size, with two-thirds of them reporting budgets under $250,000. In 2003, per organization spending and revenue both averaged $1.0 million and assets averaged $4.0 million. This industry sector is the only one that contains no organizations with spending in excess of $50 million. Median real annual growth in
range. There is great variability in the median ratio among sub-sectors, ranging from -1.8% for general, social and applied sciences to 8.8% for educational and social services.
Colleges and universities, libraries and elementary and secondary schools have extensive financial investments as well as fixed assets on average. Higher education organizations do rely on liabilities to finance half their assets. K-12 schools use more leverage, depending on liabilities to fund 37% of assets.
Spotlight: Higher, Graduate and Adult EducationHigher education institutions alone hold $91.6 billion in total assets, representing 60% of the assets of all Massachusetts nonprofits. Revenue and spending of $11.3 billion and $10.3 billion, respectively, are more modest, each accounting for 22% of the statewide total. Only the hospitals sub-sector in the Health Care sector accounts for more revenue and spending. Ranked by spending, seven of the 20 largest nonprofits statewide are colleges and universities. Ranked by assets, 10 of the 20 largest are colleges and universities. Organiza-tions in this sub-sector average more than $78.5 million in spending, $86.1 million in revenue, and $699.5 million in assets.
The larger higher education organizations operate on a Large Institution business model, resemble for-profit businesses more than most nonprofits, and are run by professional managers. Over and above their finan-cial size and administrative structure, perhaps their most defining characteristic is the symbolic role they play for the Commonwealth of Massachusetts and the Boston metropolitan area, in particular. These higher education institutions, along with financial and high-tech industries and professional sports teams, define this region in the eyes of many outsiders.
Higher education employs well-trained profession-als to deliver program services and run key support services. As a result, this sub-sector spends more on employee compensation (41.5%) than any other spending category. Fully 80.2% reported having paid employees. The median administrative cost ratio is relatively high at just under 15% of total expenses. This expense structure is supported primarily by program service revenue (61% of total) in the form of tuition and research grants. Generally government and foun-

45p a s s i o n & p u r p o s e : R a i s i n g t h e F i s c a l F i t n e s s B a r f o r M a s s a c h u s e t t s N o n p r o f i t s
of the organizations have employees, and employee compensation is under 20% of total expenses.
In 2003, Environment and Animal-Related organiza-tions had a median surplus margin ratio of 8.1%, well above the average. Over the 1989-2003 period, these organizations ranked either first or second in the median surplus margin ratio.
Spotlight: Conservation and Pollution ControlThis sub-sector contains 116 organizations, making it the largest Environmental sub-sector, yet new orga-nizations are being added at the lowest rate, 7.3% per annum. Organizations in this sub-sector are major landowners as well as advocates. Besides the Massa-chusetts Audubon Society and Trustees of Reserva-tions, organizations in this sub-sector include the Sheriff’s Meadow Foundation, New England Forestry Foundation, Sudbury Valley Trustees, Northeast Energy Efficiency Partnerships, and Nantucket Conser-vation Foundation.
Many of these organizations operate with elements of a Large Institution business model, although they may not be large in terms of annual funding and budget. They are fixed asset and investment heavy. At 75.4% of income, conservation and pollution control organiza-tions are the most reliant on contributions of any sub-sector in this industry sector. Program service revenue is relatively unimportant to these organizations, equal-ing less than 10%. The share of spending devoted to employee compensation is low (24.6%), but close to the average of this sector. However, employee compensa-tion is still the dominant expense for this sub-sector; 53.4% of these organizations have paid employees.
Conservation and pollution control agencies have good financial health metrics, compared to other environmental groups and the remainder of the Commonwealth’s nonprofit sector. Liquidity measures lie well above the averages for all nonprofits as well as averages for the Environment and Animal-Related sub-sectors. Days of cash on hand averaged more than seven months of operations and current liabilities were only 1% of current liabilities. This sub-sector’s median surplus margin ratio is an extraordinary 30.3%. This is the highest profit ratio of any sub-sector in the state. Last, its ratio of liabilities to assets is quite low, at 16%, and its ratio of assets to revenues is more than twice
per-organization revenue and spending between 1989 and 2003 equaled 3.2% and 4.3% respectively.
Within this sector, there are four sub-sectors: (1) conservation and pollution control; (2) botanical and environmental; (3) animal welfare, shelters and zoos; and (4) support service and other organizations. The conservation organizations in this group include the Trustees of Reservations and the Massachusetts Audu-bon Society. Animal welfare organizations include the Massachusetts Society for the Prevention of Cruelty to Animals (MSPCA) and the New England Aquarium, while the Massachusetts Horticultural Society and the Appalachian Mountain Club are categorized as botani-cal and environmental. Other notable organizations in this sector are the New England Anti-Vivisection Society, Sudbury Valley Trustees and the Conserva-tion Law Foundation. The larger organizations in this sector are primarily conservation organizations.
In this industry sector, there is a mix of small organiza-tions with visions established by their founders, and larger organizations with more complex objectives using more sophisticated fundraising to pursue their advocacy goals. Because of this wide range, organi-zations in this sector cannot be categorized into one business model. Rather, there is a mix, with Expressive Voice and Membership Organizations dominating.
Since many of these organizations, especially conser-vation organizations, rely on memberships and dona-tions, it is not surprising that they rank comparatively high in contributed income. Their share of total income coming from contributed income, at 65.6%, is the high-est of the 10 industry sectors. However, these organiza-tions rely heavily on private contributions rather than government support, which averaged just 4.4% of total income. This relative lack of government backing is typical of small budget organizations.
With the exception of the conservation organizations, the Environment and Animal-Related organizations, overall, display the financial health characteristic of small organizations with budgets under $250,000. The dominant asset is cash, which averaged 37 to 47 days for non-conservation organizations. The current liabili-ties are minimal at 3% to 5% of total current assets. Leverage varies considerably within this sector from 31% for Support Organizations to several botanical organizations with negative net assets. For the botani-cal and animal welfare categories, fewer than 45%
46 u n d e r s t a n d i n g B o s t o n
are large with complex asset mixes, professionally managed, and among the state’s economic engines. They best correspond to the Large Institution business model. Other, typically smaller organizations, such as those in nursing, mental health care, and other health care, better fit the Service Provider business model.
Those organizations in this industry sector provid-ing services to clients or patients rely most heavily on program service revenue from patients, insurance carriers and government for their sources of income. Those that engage in research or provide other types of support rely more heavily on contributions. Over-all, program service revenue is most important, with 52.6% of the total income in this sector coming from this source. Despite this, the degree to which these organizations depend on contributed income (40.8%) is very close to the nonprofit average (42.0%).
As in other industry sectors, larger nonprofits are more likely to have paid employees; 70.1% of health orga-nizations have paid employees. Only one other sector (Human Services) has a higher percentage. For all sub-sectors in the health industry sector, compensation of employees is the largest budget expense. The share of spending used to compensate employees (39.2%) is also second only to that of human services.
Cash is the dominant asset for all sub-sectors except hospitals, which have a higher concentration in fixed assets. Investments constitute only 3% to 19% of total assets with fixed assets in the 13% to 31% range. Bonds and mortgages, in the 6% to 25% of asset range, fund not only fixed assets but some short-term assets as well.
Organizations in the health industry sector have finan-cial statistics that fall on the lean side, but in general have fewer organizations reporting evidence of seri-ous distress. Their liquidity statistics show that these organizations have smaller margins of safety. As noted earlier, this is often characteristic of larger nonprof-its, which are able to plan financial outcomes more precisely. For example, although health nonprofits rank last in median months of cash on hand, only 12% report no cash on hand, a percentage lower than all but one other sector. Thus the typical organization in this industry sector holds less cash but is better able to manage the cash it holds.
The median surplus margin for this sector is 1.1%, about half the industry average. Only two other sectors
that of its industry sector, and more than three times that of all nonprofits.
See Table 3.3 Environment and Animal-Related on pages 64–65.
Health Care and MedicalThe Health Care and Medical industry sector contains 1,154 organizations, making it the third largest nonprofit industry sector in the state. However, this sector is also adding new organizations at the slowest rate of the 10 industry sectors, an average of 2.8% per year between 1989 and 2003 as compared to 6.3% over-all. In 2003, this sector spent $25.1 billion and earned $25.6 billion, meaning that it earned 50% of its revenues and spent 52% of its expenses. In contrast, it holds only 18% or $26.7 billion of the nonprofit sector’s total assets. The organizations in this sector exhibit annual real revenue growth of 2.3%, well above that of the state average at 1.3%. Much of this supplemental growth may be attributable to mergers and consolidations.
Relative to all nonprofits in the state, the health care and medical industry sector has the lowest proportion of organizations in the under $250,000 category (33.3%) and the highest in the over $50 million category (6.7%). This sector, along with the Education sector, contains the largest nonprofits in the state. Of the 137 organiza-tions that spent more than $50 million in 2003, 77 are in this industry sector.
This sector has been divided into six sub-sectors: (1) hospitals; (2) nursing; (3) mental health; (4) other health care; (5) specific disease treatment and research; and (6) support services and other organizations. Prominent hospitals include Massachusetts General, Brigham and Women’s, Children’s, Beth Israel Deacon-ess and Tufts Medical Center. Other health care orga-nizations include Harvard Pilgrim Health Care and the New England Organ Bank. Among Specific Disease Treatment and Research are the Dana-Farber Cancer Clinic and the Massachusetts Association for the Blind. Still other prominent organizations in other sub-sectors include the Hebrew Rehabilitation Center for the Aged, the Samaritans, and the Massachusetts Society for Medical Research.
Like most industry sectors, this one contains a diverse mix of organizations. The hospitals and medical centers

47p a s s i o n & p u r p o s e : R a i s i n g t h e F i s c a l F i t n e s s B a r f o r M a s s a c h u s e t t s N o n p r o f i t s
times the state average. As of 2003, hospitals are barely profitable as a group, with a median surplus margin ratio of 0.4%; however, many of these hospitals are not generating surpluses. More than 40% had negative rates of profit. Also, hospitals have a much higher than average ratio of liabilities to assets (56%).
Collectively, hospitals are large organizations with considerable financial resources, but their financial health had been a cause for concern as their financial condition weakened with the economy in the early 2000s. This study uses 2003 data, so this weakened financial condition is reflected in the tables. The finan-cial well-being of many of these hospitals has turned around due to mergers and large capital grants. Nationally, 77% of US nonprofits had positive surplus margins in 2006.15
See Table 3.4 Health Care and Medical on pages 66–67.
Community Capacity The Community Capacity industry sector was designed to bring together organizations that focus on serving communities rather than individuals. This segment contains 628 organizations and represents 8% of all organizations. It has added organizations at the rate of 8.6% per year between 1989 and 2003, an above average rate of growth. Total spending and revenues of this industry sector was $1.3 billion with total assets of $4.2 billion in 2003.
The average organization in this sector is slightly larger than the average Massachusetts nonprofit, spending $1.9 million, earning $2.1 million, and hold-ing $6.7 million in assets in 2003. These organizations had the highest annual rates of growth between 1989 and 2003, ranging from 5.5% in revenue to 12.7% in assets. While most sectors retained roughly the same financial size between 1989 and 2003, Community Capacity organizations moved up in relative size over the period thanks to their high growth rates.
Community Capacity is divided into four sub-sectors: Crime, Legal and Civil Rights; Employment; Commu-nity Development; and Support and Other. Within the Community Capacity industry sector, there is a great deal of fiscal diversity. The largest 10 organizations are not concentrated in any of the subgroups, and the larg-
reported lower profit margins. Three sub-sectors (mental health, hospitals, and nursing) have a median surplus margin ratio less than 1%.
Although they have large amounts of cash and prop-erty, health nonprofits are more heavily leveraged than others. This sector’s ratio of liabilities to assets of 24.4%, while not alarmingly high, is about five times that of all nonprofits. The ratios for hospitals and nurs-ing organizations are about 10 times the average.
Spotlight: HospitalsWithout the hospitals and higher education sub-sectors, the nonprofit landscape in Massachusetts would be strikingly different. The prominence of higher education organizations among the largest nonprofits in the state has already been noted, but hospitals have an equal degree of fiscal importance. Of the 77 health nonprofits with spending in excess of $50 million, 55 are hospitals. The 55 hospitals in the over $50 million spending category are double the number of colleges and universities in this category.
On the list of the 20 largest nonprofits in the state, nine are hospitals when ranked by spending, and four are hospitals when ranked by assets. Hospitals alone account for 31.9% of statewide nonprofit spending, 30.8% of revenue, and 12.0% of assets. Combined with higher education, these two sub-sectors account for 53% of spending and revenue and 72% of assets. Aver-age spending per hospital was $103.1 million, revenue per hospital was $105.8 million, and assets per hospital were $123.1 million.
Hospitals rely heavily on fees for service; program service revenue is 67% of total income, while contribu-tions account for only 12%. Employee compensation accounts for 44% of total spending and hospitals have a higher percentage of paid employees than any other sub-sector except higher education. Their dominant asset is land, buildings and equipment. Their ratio of assets to revenues is right at the nonprofit average.
Many of the points already made about the fiscal profile of health organizations as a whole are taken to greater extremes with hospitals, which operate with thin margins. The current ratio and months of cash on hand are less than half the nonprofit industry average, and the number of months of bills outstanding is 28

48 u n d e r s t a n d i n g B o s t o n
Spotlight: Community DevelopmentThis sub-sector has the distinction of having the high-est number of organizations among the sub-sectors and being the largest in terms of average budget size. The average organization spent $3.4 million, earned $3.2 million, and owned $13.8 million in assets. This sub-sector is experiencing double-digit growth in spending, revenue and assets, but it also has a high concentration of small organizations as well as several large ones.
Organizations in this sub-sector include the Allston-Brighton Community Development Corporation and the Massachusetts Youth Service Alliance. Like most organizations in this industry sector, community development groups rely heavily on contributions for income, at 54.1%. And like all sub-sectors in this indus-try sector, its dominant asset is cash. While its domi-
est in terms of revenue do not correspond to the largest in terms of assets. Recognizable organizations include the Boston Private Industry Council, the Massachusetts Bar Foundation, City Year, Jobs for the Future and the Neighborhood Stabilization Fund.
Organizations in this industry sector also have diverse business models. The employment and community development sub-sectors fit the service provider model, while the crime, legal and civil rights sub-sector, with its smaller organizations, is better fit the Expressive Voice model.
Due to the nature of their missions, Community Capacity organizations rely more heavily on contrib-uted income. Their share of contributed income in total revenue was 55.0% in 2003. Their share of government contributions in total revenue was 16.0% in 2003, high-est among all 10 industry sectors.
Since most of the organizations in this sector provide a variety of services, their need for professional staff is great. Community Capacity organizations devoted 32.3% of spending to employee compensation in 2003, a percentage higher than all but health care and human service organizations. They also ranked fourth in the percentage of organizations with paid employees, at 65.9%.
Measures of fiscal health place this sector slightly below average, with mixed results overall. Liquid-ity measures, such as days of cash on hand and the current ratio, are just above the average for the state. The median surplus margin ratio of this sub-sector was 0.7% in 2003, the second lowest of all 10 sectors. With such a low median surplus margin ratio, Community Capacity also has the second highest percentage of organizations with losses in the same year, at 46.1%. All sub-sectors except support and other shared these low surplus margin ratios in 2003 and had ratios well below that of the other sectors since 1989.
Community Capacity organizations are less leveraged than most. Their ratio of liabilities to assets was 42%, as compared to the 49% state norm. Assets constitute a lower than average percentage of revenues in all but two sub-sectors.
The Relationship Between Community Capacity and Housing and Shelter Organizations
There is a degree of mission overlap between some of the organizations in the community develop-ment sub-sector of community capacity and most of the organizations in the housing development sub-sector of housing and shelter. Community development organizations, based on the National Center for Charitable Statistics (NCCS) classifica-tion, include neighborhood groups, organiza-tions devoted to revitalizing and maintaining the economic viability of neighborhoods, and social coalitions based on ethnic connections. However, it also includes a minority of organizations whose primary mission is housing development. Housing and shelter contains a more homogeneous group of organizations; virtually all have housing develop-ment as their primary mission.
Assignments to specific NTEE categories are based on the organizations’ own descriptions of their missions; further adjustments may be made by NCCS personnel as they develop these data bases. Rather than reassigning organizations in the community development sub-sector to the hous-ing development sector when they appeared to be primarily involved in housing development, this study has retained the NCCS classification.

49p a s s i o n & p u r p o s e : R a i s i n g t h e F i s c a l F i t n e s s B a r f o r M a s s a c h u s e t t s N o n p r o f i t s
In general, organizations in this sector operate as Service Providers, and receive larger than aver-age amounts of government support to fulfill their missions. As such, most organizations in this sector best fit the Service Provider business model.
The share of income that Human Services organiza-tions received from contributions in 2003 (40.4%), is just below the ‘all organization’ average. However, Human Services received 11.1% of total revenue from government contributions, an amount that is exceeded only by Community Capacity. There is considerable variability in the importance of contributions in the income composition of the sub-sectors. For example, agriculture and food receives 72.6% of its income from contributions, but children and youth services receive 20.5%. The latter sub-sector relies much more heavily on program service revenue. Overall, this sector relies more heavily on program service revenue (47.8% of total income) than contributions.
A major part of the work of Human Services orga-nizations is providing skilled personnel to counsel and help needy individuals. It is no surprise that these organizations devote more of their spending to employee compensation (41.3%) than any other sector. It also ranks first in the percentage of organizations with paid employees (72.8%).
In terms of financial health, this industry sector is not strong. In terms of liquidity, the organizations in this sector hold almost two weeks less of cash on hand and rely on short-term credit, such as bills outstanding, to fund twice as many current assets as the average nonprofit in the state. This tight liquidity is typical of the fiscal stress that generally is characteristic of Service Providers.
The median surplus margin ratio of Human Services organizations was 1.7% in 2003, modestly lower than the nonprofit median of 2.0, and lower than all but three other industry sectors. Only 39.1% of Human Services organizations reported negative profit margins, modestly higher percentage than for the entire nonprofit sector.
A similar pattern is found when examining balance sheet strength. The median ratio of liabilities to assets for the Human Services sector in 2003 was 69%, much higher than the nonprofit median of 49%.
nant expense is compensation, at 28.2%, compensation constitutes a lower share of spending than it does for other community capacity sub-sectors with a lower than average (60.5%) of organizations with paid employees.
The fiscal health profile of community development organizations differs from the average Massachusetts nonprofit is several regards. The liquidity measures are stronger, with three vs. two months of cash on hand and the median surplus margin ratio is considerably lower, at 0.7%, as compared to the 2.0% state average. Similarly, leverage is 30%, well below the 49% leverage of the state benchmark.
See Table 3.5 Community Capacity on pages 68–69
Human Services The Human Services industry sector comprises two NTEE categories: Food, Agriculture, and Nutrition; and Human Services - Multipurpose and Other. With spending at $3.4 billion, revenues of $3.5 billion and assets of $3.0 billion, the Human Services sector is the third largest segment of the nonprofit community in Massachusetts. This sector is the only one to report more total revenues (and spending) than total assets. The annual growth in the number of organizations is relatively low, at 5.0% per year as compared to the 6.3% expansion in the full sector
In the Human Services sector, six sub-sectors were created: agriculture and food; human services; children and youth; family and personal; residential and adult day care and independence services, and support and other. Examples of prominent and diverse organiza-tions in this sector include the Pine Street Inn, various YMCAs and YWCAs, Action for Boston Community Development, the Home for Little Wanderers, and the New England Farm Workers’ Council.
A relatively low percentage of organizations (39.5%) fall into the under $250,000 spending range. As a result, the median size of an organization in this indus-try sector is relatively large. However, the sector has eight organizations with spending greater than $50 million. As a result the average spending and revenues per organization are relatively high and rank just behind Health Care and Education. However, given the lack of endowments and funds for capital invest-ment, the Human Services sector ranks eighth out of 10 in terms of assets per organization.

50 u n d e r s t a n d i n g B o s t o n
among the industry sectors. Overall, organizations in this sector spent $696.2 million, earned $655.0 million, and had assets worth $2.1 billion in 2003.
Organizations in this sector are small, with 95.7% of the nonprofits having budgets of less than $5 million. There are only two Housing and Shelter nonprofits in the over $50 million spending category. Spending per organization was $1.4 million in 2003, while revenue per organization was $1.5 million. Assets per organiza-tion were $4.5 million.
This sector is divided into three sub-sectors: hous-ing development; search, shelter associations and improvement; and support and other. Large organiza-tions in this sector include subsidized housing associa-tions, builders’ and lenders’ associations, and housing assistance organizations. Some recognizable organiza-tions in this category include Massachusetts Housing Investment Corporation, Metropolitan Boston Hous-ing Partnership, Rosie’s Place, the Housing Assistance Corporation, and The Community Builders.
Organizations in Housing and Shelter largely follow the Service Provider model. Accordingly, Housing and Shelter organizations depend heavily on program service revenue in their income mix; 59.4% of total income comes from this source. They rank last in percentage of revenue derived from contributions (26.7%). Yet, due to their social service mission, they receive more contributions from government than most sectors; their 9.6% share of revenue from govern-ment contributions places them behind only Commu-nity Capacity and Human Services organizations.
Housing and Shelter nonprofits devote relatively less to compensation, since most spending is on resources that make housing and shelter available to their clients. With 68.1% of its organizations having paid employ-ees, Housing and Shelter is at the high end of that range—only Health Care and Medical has a higher percentage. The dominant asset of organizations in this sector was land, buildings and equipment. Their ratio of assets to revenue at 380% is more than four times greater than the nonprofit average.
Housing and Shelter organizations have a unique and mixed financial health profile. First, they manage fund-ing of day-to-day operations reasonably well. Their median number of months of cash on hand in 2003 was above the industry median, as were its current ratio and net working capital.
As a result of their ongoing financial pressures, Human Services organizations have developed the ability to manage budgets effectively, so despite low liquidity and profit margins, relatively few organiza-tions fall into a very low range of profitability where fiscal failure becomes probable.
Spotlight: Children and youth Services
This sub-sector contains about 20% of all Human Services organizations. In terms of financial size, children and youth service organizations are smaller than the average of this sector, with average spending of $2.3 million and average revenue of $2.4 million. Assets per organization are $1.8 million.
Children and youth services organizations rely much more heavily on program service revenue (75.2%) than contributions (20.5%) as a source of income. They devote a higher percentage of spending to employee compensation (60.8%) than any sub-sector in the 10 nonprofit sectors. Fully 89.1% of all children and youth services organizations have paid employ-ees, again the highest percentage of any nonprofit sub-sector.
Organizations in this sub-sector present a riskier finan-cial profile than the Human Services sector as a whole. With respect to liquidity measures, the current ratio, months of cash on hand, and months of bills outstand-ing are all close to the amounts reported for the sector as a whole. However, the median surplus margin ratio of children and youth services was 0.8%, the lowest of any sub-sector in Human Services and well below the 2.0% median amount for the entire sector. In a sector with organizations already holding above average leverage and high asset intensity (i.e. low assets rela-tive to revenues), children and youth services stand out as particularly strained. The average leverage is 202%, while the asset to revenue ratio is only 37%.
See Table 3.6 Human Services on pages 70–71.
Housing and Shelter The Housing and Shelter industry sector contains just 470 organizations, making it the smallest of the 10 sectors. Its annual growth in new organizations between 1989 and 2003 was 7.1%, placing it fourth

51p a s s i o n & p u r p o s e : R a i s i n g t h e F i s c a l F i t n e s s B a r f o r M a s s a c h u s e t t s N o n p r o f i t s
organizations exhibits a -0.2% median annual loss. Thus over half of the organizations in this sub-sector reported losses in 2003. Leverage in this sub-sector is very high, with the median ratio of liabilities to assets at 70%. It would appear that any adverse effects in the overall economy that affect this sub-sector could drive some organizations in this group into an even more precarious situation.
Also see the Community Capacity section for overlap with Community Development nonprofits
See Table 3.7 Housing and Shelter on pages 72–73.
youth Development, Sports and Recreation The Youth industry sector has a membership of 912 organizations and is growing at an 8.6% annual rate, well above the all-organization average. Despite the high number of organizations (912) in this sector, it is the smallest financially. In 2003, its total spending was $517.6 million, its total revenue was $540.1 million, and its total asset holdings were $646.6 million.
Nonprofits in Youth Development, Sports and Recre-ation tend to be small; 75.1% fall in the under $250,000 spending category, a higher percentage than any other sector. In addition, 91.8% of organizations spent under $1 million, again a larger percentage than any other sector. Only one organization placed in the over $50 million spending category. On a per organization basis, spending was $567.6 thousand, revenue was $592.2 thousand, and assets were $709.0 thousand. These amounts mean that this sector has the small-est organizations of all 10 sectors in terms of average financial size. In addition, these nonprofits are growing a slower pace than the average.
This sector is further broken into the following four sub-sectors: camps and facilities; amateur and profes-sional sports; youth centers and youth development; and support and other. These sub-sectors show considerable diversity. Some of the larger and more prominent include the Eastern States Exposition, Massachusetts Golf Association, Boston Athletic Asso-ciation, Massachusetts Interscholastic Athletic Associa-tion, and Special Olympics Massachusetts. In terms of the number of organizations, the largest sub-sector by far is amateur and professional sports, which accounts for 501 of the 912 organizations in this sector.
These organizations reported a very low median surplus margin ratio for 2003. At 0.5%, it is the lowest reported figure for any of the 10 industry sectors. In fact, Housing and Shelter has had consistently low surplus margin ratios since 1989. In all but two years this sector has had the highest percentage of organiza-tions reporting losses.
Housing and Shelter organizations depart most dramatically from the average behavior of all organi-zations in their use of leverage. Their median ratio of liabilities to assets is 70% as compared to the 49% state median. A similar radical departure from the average shows up in its percentage of organizations with nega-tive net assets. As many organizations in this sector provide housing and shelter to indigent clients, these statistics are the residue of the provision of housing units financed through large amounts of borrowing, a pattern that shows up every year. This amount of leveraged debt is proving particularly problematic in a declining commercial and residential housing market.
Spotlight: Housing DevelopmentHousing development contains two-thirds of the orga-nizations in this sector. Thus its statistical outcomes mirror the overall numbers for Housing and Shelter. In terms of budget size, it is roughly equal to sector aver-ages in spending, revenue, and assets. Six of the eight organizations in this sector with spending in excess of $10 million are in housing development. Like all Hous-ing and Shelter sub-sectors, it has a higher than average ratio of assets to revenue. Prominent organizations in this sub-sector include the Metropolitan Boston Hous-ing Partnership and The Community Builders.
Organizations in this sub-sector rely most heavily on program service revenue (68.3%) in their income mix. As with the other Housing and Shelter sub-sectors, land, buildings and equipment are their dominant asset, accounting for 60.1% of the value of all assets. Compensation costs are relatively low, accounting for only 18.3% of total expenses.
The financial health profile of housing development is concerning. Liquidity measures in terms of days of cash on hand match that of the entire Housing and Shelter industry sector; however, this sub-sector relies even more heavily on current liabilities (40%) to fund current assets. Housing development sub-sector

52 u n d e r s t a n d i n g B o s t o n
organizations. Compared to the median nonprofit, its organizations have more liquidity, higher profit margins, and less debt. In terms of liquidity, months of cash on hand matches the nonprofit median. Other liquidity ratios exceed median levels for all nonprofits.
The median surplus margin ratio of 3.0% for this sector is a full percentage point above the nonprofit median. Among its four sub-sectors, surplus margin ratios ranged from 1.5% to 3.9%.
The largest asset in the balance sheets of Youth Devel-opment, Sports and Recreation organizations is cash. Only camps and facilities and youth centers possess significant amounts of real property. These two sub-sectors are the only ones that report ratios of liabilities to assets greater than zero.
Spotlight: Amateur and Professional SportsAmateur and professional sports contain more than half of all of the organizations in this industry sector. They are also the smallest organizations in terms of budget size. This sub-sector’s numbers are grow-ing rapidly, at a pace of more than 11.4% per year. Although most members of this group are local sports teams and leagues, among the more prominent are Boston Athletic Association and Massachusetts Youth Soccer Association.
In this sub-sector, 87.4% of the organizations are in the under $250,000 category, and 98.2% fall under $1 million. None spends more than $10 million. Per orga-nization spending and revenue are $173.3 thousand and $182.2 thousand, respectively. Assets per organi-zation are $165.4 thousand. Organizations of this size often use volunteer help. Only 15.0% of these nonprof-its have paid employees.
The most important sources of funding for these orga-nizations are program service revenue and member-ship dues. These two categories account for 68.9% of total revenue. Contributions play a much smaller role (19.2%), both compared to the rest of this sector and the typical Massachusetts nonprofit. With little spend-ing on employee compensation, the major expense category is made up of a variety of obligations classi-fied as “other” on the Form 990 return.
Despite (or perhaps because of) the small size of its organizations, the amateur and professional sports
There is considerable financial diversity among the sub-sectors. For example, the spending, revenue and assets per organization in amateur and professional sports (financially the smallest sub-sector) are less than one-tenth that of camps and facilities (the largest sub-sector). Also, the annual growth in number of organi-zations ranges from 3.6% per year for youth centers and youth development to 14.5% per year for support and other.
In addition, there is considerable diversity in terms of a common business model followed by organizations in this sector. Amateur and professional sports essen-tially rely on dues and program service revenue to provide opportunities for team and individual sports, and thus are Membership Organizations. Most youth centers provide services to a targeted clientele, and are most similar to Service Providers, though with less financial stress than most Service Providers experience. Camps and facilities seem to be a mix of models, with a revenue structure that falls between the other two, and a mix of mostly small and a few larger organizations.
The dominant source of income for Youth Develop-ment, Sports and Recreation organizations is program service revenue. However, program service revenue’s share in total income (36.6%) is well below average with contributed income providing 29.6% of revenues. In addition, there is a heavier reliance on dues and other income than in any other sector, making the sector one of the most diverse in terms of the funding mix. For example, youth centers and youth develop-ment rely more heavily on contributions than the average nonprofit. Camps and facilities and amateur and professional sports, which rely more heavily on user fees and memberships, both receive more than half their income from fees for program services and memberships.
Small organizations depend less on paid employment and more on volunteers to carry out their missions. Organizations in Youth Development, Sports and Recreation devoted a smaller share of their spending to employee compensation in 2003 (14.6%) than any other type of organization except philanthropy. The percentage of Youth Development, Sports and Recre-ation organizations with paid employees was 33.3%, the lowest among all 10 sectors.
Youth Development, Sports and Recreation has a financial health profile much like that of small budget

53p a s s i o n & p u r p o s e : R a i s i n g t h e F i s c a l F i t n e s s B a r f o r M a s s a c h u s e t t s N o n p r o f i t s
support, voluntarism and other. There is considerable financial diversity among these sub-sectors. For exam-ple, average revenue and spending in federated giving are about eight times larger than in support, volunta-rism and other.
Overall, this sector is quite homogeneous in its mission. Almost all organizations make donations to selected causes and recipients, and most have the words “foundation” or “trust” in their names. All fit the support organization business model. Examples of Massachusetts philanthropic nonprofits include a number of regional United Ways, Combined Jewish Philanthropies of Greater Boston, the Boston Foun-dation, Berkshire Center for Families and Children, Yawkey Foundation, and Big Brother/Big Sister Foundation.
Considering its purpose, it is not surprising that Philanthropy has a relatively high ratio of contributed income to total revenue. Its share of revenue from contributions of 58.1% in 2003 places it third. However, its share of revenue from government contributions of 1.4% places it last among the 10 sub-sectors. Also consistent with its business model, this sector relies on investment income (19.8%) as the second most important source of funds. It relies far less on program service revenue (8.0%) than any other sector.
The combination of these organizations’ relatively small size, stated mission, and history of voluntarism leads to an extremely low reliance on paid employees. Only 37.1% of these organizations had paid employees, and only 10.0% of their spending went to employee compensation. The sector ranked last in percentage of paid employees every year since 1998. Rather than compensation, their dominant expense is grants, at 43.4% of total spending.
With few paid employees, a large asset base, and considerable discretion over whether and how much to spend, one would expect that the fiscal health of this sector would be good. This turns out to be gener-ally accurate. For example, liquidity measures are uniformly good, being well above industry averages in every instance. For example, their 2.9 months of cash on hand is more than a full month above the nonprofit median. This sector’s median surplus margin ratio is 2.0%, the same as for all nonprofits. Profitability varies widely among sub-sectors however, ranging from 0.2% for federated giving to 8.4% for public foundations.
sub-sector shows little evidence of fiscal stress or vulnerability. These organizations tend to hold a week or less of cash on hand and finance none of their current operations with short-term credit or debt. At 3.9%, its surplus margin ratio is the highest of the sub-sectors and almost double the nonprofit average. The major asset of these organizations is cash; their cash holdings as a percent of total assets (47%) are well above the nonprofit average. Indebtedness for the median firm is zero, and the mean ratio of liabilities to assets is 31%.
Most of the organizations in this sub-sector are local sports associations. Because of the nature of their mission, it is unlikely that they will ever grow large, or be candidates for geographic mergers. Rather, their numbers are likely to grow as more towns and regions support a greater diversity of youth sports.
See Table 3.8 Youth Development, Sports and Recreation on pages 74–75.
PhilanthropyPhilanthropic nonprofits are numerically the second smallest of the 10 sectors, with 388 organizations. The annual growth in the number of organizations, at 8.6%, is second highest among the 10 industry segments. With fewer organizations than most sectors, Philanthropy’s economic activity is lower. In 2003, total sector spending was $419.3 million, revenue was $468.1 million, and assets were $1.9 billion.
With a few exceptions, this sector is composed of relatively small nonprofits; 68.9% were in the under $250,000 spending category, and 84.3% spent under $1 million in 2003. Only two placed in the over $50 million category. Per organization spending and reve-nue were $1.1 million and $1.2 million, respectively, ranking Philanthropy eighth and seventh in these cate-gories, respectively. As organizations whose primary role is to accumulate financial assets in order to make donations to targeted causes, they are relatively asset-heavy; their average ratio of assets to revenue of 135% is exceeded only by that of two other sectors. Its assets per organization of $4.9 million place it fourth among the 10 industry sectors.
Philanthropy is broken into four sub-sectors: private foundations; public foundations; federated giving; and

54 u n d e r s t a n d i n g B o s t o n
Other NonprofitsThe “Other” sector contains nonprofits that are not classified in any of the nine categories described previ-ously. Despite the merging of five diverse NTEE cate-gories to form this sector, it is still small in terms of the number of organizations; the 424 that filed Form 990s in 2003 place it above only Environment and Animal-Related and Philanthropy in size. Organizational enrollment has grown at a 5.9% annual rate, close to the average for all nonprofits. In 2003, organizations in the Other sector spent $549 million, earned $573 million, and held assets worth $1.1 billion.
Other organizations are categorized into three sub-sectors: international and foreign; religion; and other. With organizations in the first two sub-sectors gener-ally defined by a narrow mission and substantial contributed income, they best fit the Expressive Voice business model. The majority of the largest organiza-tions in this sector belong to the international and foreign sub-sector. Since the Other sector is comprised of more diverse and less known organizations, it is harder to identify prominent members. Some examples are Oxfam-America, The Union of Concerned Scien-tists, The New England Waterworks Association, the Council on International Education Exchange, and LASPAU Academic and Professional Programs for the Americas.
This eclectic sector contains mostly small organiza-tions, with 62.3% falling into the under $250,000 spend-ing range, and only two organizations falling into the over $50 million range. Per organization spending in 2003 was $1.3 million, revenue was $1.4 million, and assets were $2.1 million.
Despite their programmatic diversity, organizations in this sector rely heavily on contributed income. The ratio of contributed income to total income is 60.3%, second highest among the 10 sectors. These donations derive heavily from individuals, so it is not surpris-ing that the ratio of government contributions to total income, is only 3.3%.
As a sector that has mostly small organizations, there is less reliance on paid employees to carry out its missions. Spending on employee compensation accounts for only 21.5% of total spending; 55.7% of organizations have paid employees. Only Youth Development, Sports and Recreation and Philanthropy
Cash is the dominant asset (35.3%) on the balance sheets of Philanthropy organizations. Their median ratio of liabilities to assets is zero, and the average indebtedness equals 13% of assets.
Spotlight: Federated GivingFederated giving organizations coordinate fundraising, anticipate community needs and provide resources for those needs. There are 70 organizations in the feder-ated giving sub-sector, including several that are well-known, such as United Way of Massachusetts Bay and Merrimack Valley and the Combined Jewish Philan-thropies of Greater Boston.
This sub-sector reported the highest current revenue ($2.6 million per organization) and expenses ($2.4 million). Assets per organization were $8.6 million. Like private and public foundations, federated giving relies most heavily on contributions for its income, receiving 71.5% from this one source. Like other Philanthropy organizations, federated giving spent more on grants (47.1% of total spending) than on employee compensation (10.1%). Although employee compensation is not a significant expense, 55.7% of these organizations reported having paid employees, the largest percentage of any Philanthropy sub-sector.
The fiscal health profile of federated giving organi-zations is similar to those of its sister sub-sectors, although not as robust. Most notably, these organi-zations report a negative median surplus margin at 0.2%, well below the 2.0% statewide norm. Federated giving reported 1.6 months of cash on hand, less than other sub-sectors but close to the nonprofit average. Bills outstanding, at 1.5 days, were higher than the other sub-sectors, but less than the nonprofit aver-age. Although cash is their dominant asset, federated giving organizations have relatively less cash in their asset mix, meaning that these organizations have a mix of assets, including land and buildings as well as investments. Like the other sub-sectors, they have little long-term debt. Their ratio of liabilities to assets was 2%, highest among the Philanthropy sub-sectors but still below the nonprofit average.
See Table 3.9 Philanthropy on pages 76–77.

55p a s s i o n & p u r p o s e : R a i s i n g t h e F i s c a l F i t n e s s B a r f o r M a s s a c h u s e t t s N o n p r o f i t s
months that bills have been outstanding are above or close to industry medians. Their median surplus margin ratio is 2.9%, well above the industry median and the highest of the Other sub-sectors. They show very little borrowing, having a median ratio of liabili-ties to assets of 0.5%; however the mean borrowing is 79% of assets.
See Table 3.10 Other Nonprofits on pages 78–79.
spent relatively less on compensation. However five other sectors have a lower percentage of organizations with paid employees. Still, employee compensation is the dominant expense in this sector.
Despite the diversity of the sector, the financial health seems largely driven by the small average size of the organizations. Liquidity in terms of cash on hand corresponds to the state norm, but reliance on current liabilities is quite low, as in many small organizations.
The median surplus margin in 2003 was 2.0%, equal to the all-sector median. Only the international and foreign sub-sector’s profit margin fell below this level.
With respect to balance sheet strength, its dominant asset is cash, and its ratio of assets to revenues is lower the industry average (77% vs. 88%). Leverage is comparable (51% vs. 49%).
ReligionReligion organizations stand out due to their special mission, small size, and voluntary disclosure. Most religious organizations are not required to file Form 990s, so this group has decided to voluntarily offer their financial information. In 2003, per organization spending was $392.5 thousand, and per organization revenue was $413.8 thousand. Assets per organiza-tion were 963.2 thousand. In financial terms, religion organizations are roughly one-half the median size of organizations in the state.
Although the typical organization is small, there are 13 with spending in excess of $1 million. Included among the larger organizations are St. Ann’s Home, Jewish Family and Life, Inc., Boston Catholic Television Center, and the Wollaston Lutheran Church Apart-ments. These organizations tend to be religious societ-ies, centers and meeting places, and group homes.
Not surprisingly, religion organizations rely heavily on contributed income particularly from individu-als; 57.6% of income comes from this source. As with smaller organizations in this sector, they devote less of their spending to employee compensation (19.7%). Still, employee compensation is their dominant expense.
Their financial health is good. In terms of liquid-ity, their current ratio, months of cash on hand, and
The Industry Sector tables on pages 56–79 are all based on data from the Boston Foundation Dataset derived from NCCS 2003 Digitized Form 990 Dataset.
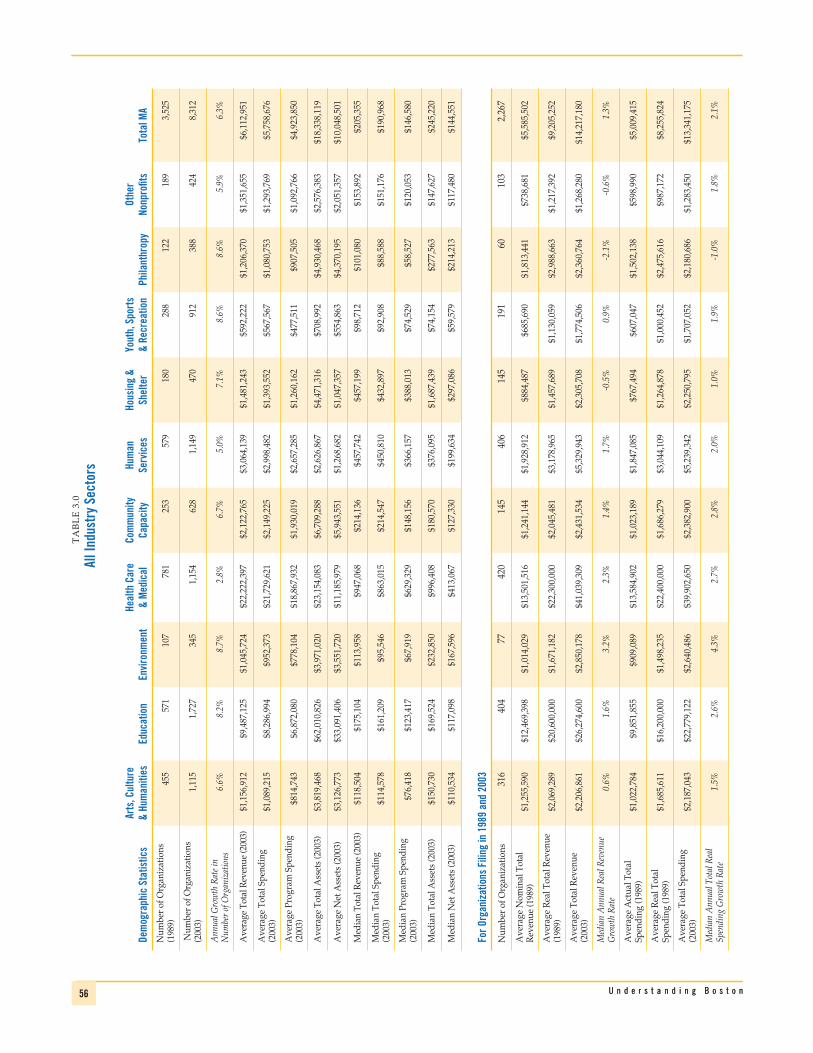
56 u n d e r s t a n d i n g B o s t o n56 u n d e r s t a n d i n g B o s t o n
Dem
ogra
phic
Sta
tistic
sAr
ts, C
ultu
re
& Hu
man
ities
Educ
atio
nEn
viro
nmen
tHe
alth
Car
e
& M
edic
alCo
mm
unity
Ca
paci
tyHu
man
Se
rvic
esHo
usin
g &
Shel
ter
yout
h, S
port
s
& Re
crea
tion
Phila
nthr
opy
Othe
r No
npro
fits
Tota
l MA
Num
ber o
f Org
aniz
atio
ns
(198
9)45
557
110
778
125
357
918
028
812
218
93,
525
Num
ber o
f Org
aniz
atio
ns
(200
3)
1,1
15
1,7
27
345
1
,154
6
28
1,1
49
470
9
12
388
4
24
8,3
12
Ann
ual G
row
th R
ate i
n N
umbe
r of O
rgan
izat
ions
6.6%
8.2%
8.7%
2.8%
6.7%
5.0%
7.1%
8.6%
8.6%
5.9%
6.3%
Ave
rage
Tot
al R
even
ue (2
003)
$1,1
56,9
12$9
,487
,125
$1,0
45,7
24$2
2,22
2,39
7$2
,122
,765
$3,0
64,1
39$1
,481
,243
$592
,222
$1,2
06,3
70$1
,351
,655
$6,1
12,9
51
Ave
rage
Tot
al S
pend
ing
(200
3)$1
,089
,215
$8,2
86,9
94$9
52,3
73$2
1,72
9,62
1$2
,149
,225
$2,9
98,4
82$1
,393
,552
$567
,567
$1,0
80,7
53$1
,293
,769
$5,7
58,6
76
Ave
rage
Pro
gram
Spe
ndin
g (2
003)
$814
,743
$6,8
72,0
80$7
78,1
04$1
8,86
7,93
2$1
,930
,019
$2,6
57,2
85$1
,260
,162
$477
,511
$907
,505
$1,0
92,7
66$4
,923
,850
Ave
rage
Tot
al A
sset
s (2
003)
$3,
819,
468
$62,
010,
826
$3,9
71,0
20$2
3,15
4,08
3$6
,709
,288
$2,6
26,8
67$4
,471
,316
$708
,992
$4,9
30,4
68$2
,576
,383
$18,
338,
119
Ave
rage
Net
Ass
ets
(200
3)$3
,126
,773
$33,
091,
406
$3,5
51,7
20$1
1,18
5,97
9$5
,943
,551
$1,2
68,6
82$1
,047
,357
$554
,863
$4,3
70,1
95$2
,051
,357
$10,
048,
501
Med
ian
Tota
l Rev
enue
(200
3) $
118,
504
$17
5,10
4 $
113,
958
$94
7,06
8 $
214,
136
$45
7,74
2 $
457,
199
$98
,712
$
101,
080
$15
3,89
2 $
205,
355
Med
ian
Tota
l Spe
ndin
g (2
003)
$11
4,57
8 $
161,
209
$95
,546
$
863,
015
$21
4,54
7 $
450,
810
$43
2,89
7 $
92,9
08
$88
,588
$
151,
176
$19
0,96
8
Med
ian
Prog
ram
Spe
ndin
g (2
003)
$76
,418
$
123,
417
$67
,919
$
629,
329
$14
8,15
6 $
366,
157
$38
8,01
3 $
74,5
29
$58
,527
$
120,
053
$14
6,58
0
Med
ian
Tota
l Ass
ets
(200
3) $
150,
730
$16
9,52
4 $
232,
850
$99
6,40
8 $
180,
570
$37
6,09
5 $
1,68
7,43
9 $
74,1
54
$27
7,56
3 $
147,
627
$24
5,22
0
Med
ian
Net
Ass
ets
(200
3) $
110,
534
$11
7,09
8 $
167,
596
$41
3,06
7 $
127,
330
$19
9,63
4 $
297,
086
$59
,579
$
214,
213
$11
7,48
0 $
144,
551
For O
rgan
izat
ions
Fili
ng in
198
9 an
d 20
03
Num
ber o
f Org
aniz
atio
ns31
640
477
420
145
406
145
191
6010
3 2
,267
Ave
rage
Nom
inal
Tot
al
Rev
enue
(198
9)
$1,
255,
590
$12
,469
,398
$
1,01
4,02
9 $
13,5
01,5
16
$1,
241,
144
$1,
928,
912
$88
4,48
7 $
685,
690
$1,
813,
441
$73
8,68
1 $
5,58
5,50
2
Ave
rage
Rea
l Tot
al R
even
ue
(198
9)
$2,
069,
289
$20
,600
,000
$
1,67
1,18
2 $
22,3
00,0
00
$2,
045,
481
$3,
178,
965
$1,
457,
689
$1,
130,
059
$2,
988,
663
$1,
217,
392
$9,
205,
252
Ave
rage
Tot
al R
even
ue
(200
3)
$2,
206,
861
$26
,274
,600
$
2,85
0,17
8 $
41,0
39,3
09
$2,
431,
534
$5,
329,
943
$2,
305,
708
$1,
774,
506
$2,
360,
764
$1,
268,
280
$14
,217
,180
Med
ian
Ann
ual R
eal R
even
ue
Gro
wth
Rat
e0.
6%1.
6%3.
2%2.
3%1.
4%1.
7%-0
.5%
0.9%
-2.1
%-0
.6%
1.3%
Ave
rage
Act
ual T
otal
Sp
endi
ng (1
989)
$
1,02
2,78
4 $
9,85
1,85
5 $
909,
089
$13
,584
,902
$
1,02
3,18
9 $
1,84
7,08
5 $
767,
494
$60
7,04
7 $
1,50
2,13
8 $
598,
990
$5,
009,
415
Ave
rage
Rea
l Tot
al
Spen
ding
(198
9)
$1,
685,
611
$16
,200
,000
$
1,49
8,23
5 $
22,4
00,0
00
$1,
686,
279
$3,
044,
109
$1,
264,
878
$1,
000,
452
$2,
475,
616
$98
7,17
2 $
8,25
5,82
4
Ave
rage
Tot
al S
pend
ing
(200
3)
$2,
187,
043
$22
,779
,122
$
2,64
0,48
6 $
39,9
02,6
50
$2,
382,
900
$5,
239,
342
$2,
250,
795
$1,
707,
052
$2,
180,
686
$1,
283,
450
$13
,341
,175
Med
ian
Ann
ual T
otal
Rea
l Sp
endi
ng G
row
th R
ate
1.5%
2.6%
4.3%
2.7%
2.8%
2.0%
1.0%
1.9%
-1.0
%1.
8%2.
1%
TA
BL
E 3
.0
All I
ndus
try
Sect
ors

57p a s s i o n & p u r p o s e : R a i s i n g t h e F i s c a l F i t n e s s B a r f o r M a s s a c h u s e t t s N o n p r o f i t s 57p a s s i o n & p u r p o s e : R a i s i n g t h e F i s c a l F i t n e s s B a r f o r M a s s a c h u s e t t s N o n p r o f i t s
Arts
, Cul
ture
&
Hum
aniti
esEd
ucat
ion
Envi
ronm
ent
Heal
th C
are
&
Med
ical
Com
mun
ity
Capa
city
Hum
an
Serv
ices
Hous
ing
& Sh
elte
ryo
uth,
Spo
rts
&
Recr
eatio
nPh
ilant
hrop
yOt
her
Nonp
rofit
sTo
tal M
A
Nonp
rofit
Sub
sect
or A
naly
sis
Tota
l Sub
sect
or R
even
ues
$1,2
89,9
57,1
85$1
6,38
4,26
5,71
1$3
60,7
74,6
34$2
5,64
4,64
6,35
6$1
,333
,096
,686
$3,5
20,6
96,1
93$6
96,1
84,2
78$5
40,1
06,7
86$4
68,0
71,3
72$5
73,1
01,8
03$5
0,81
0,84
7,22
3
Tota
l Sub
sect
or A
sset
s$4
,258
,706
,979
$107
,092
,695
,839
$1,3
70,0
02,0
43$2
6,71
9,81
1,28
8$4
,213
,432
,604
$3,0
18,2
69,7
95$2
,101
,518
,603
$646
,600
,481
$1,9
13,0
21,5
91$1
,092
,386
,597
$152
,426
,445
,820
Tota
l Sub
sect
or S
pend
ing
$1,2
14,4
74,7
21$1
4,31
1,63
8,00
6$3
28,5
68,5
99$2
5,07
5,98
2,56
1$1
,349
,713
,288
$3,4
45,2
55,3
53$6
54,9
69,6
54$5
17,6
21,3
51$4
19,3
32,2
12$5
48,5
58,2
55$4
7,86
6,11
4,00
0
Tota
l Sub
sect
or P
rogr
am
Spen
ding
$9
08,4
37,9
22$1
1,86
8,08
1,89
7$2
68,4
45,7
92$2
1,77
3,59
3,70
3$1
,212
,051
,973
$3,0
53,2
20,2
17$5
92,2
76,1
71$4
35,4
89,8
15$3
52,1
11,9
16$4
63,3
32,9
95$4
0,92
7,04
2,40
1
Budg
et S
ize
Cate
gorie
s (b
ased
on
tota
l spe
ndin
g)
<250
K77
899
423
238
433
745
318
068
526
726
44,
574
250K
-1M
203
340
6721
115
129
817
515
360
891,
747
1-5M
9920
830
215
109
216
9564
5051
1,13
8
5-10
M18
589
132
1388
126
69
351
10-5
0M12
877
135
1685
73
310
365
>50M
540
077
28
11
21
137
Fund
ing
Mix
(% to
tal r
even
ues)
Con
trib
utio
ns43
.8%
36.0
%65
.6%
40.8
%55
.0%
40.4
%26
.7%
29.6
%58
.1%
60.3
%42
.0%
Gov
ernm
ent F
undi
ng3.
6%4.
9%4.
4%7.
2%16
.0%
11.1
%9.
6%1.
9%1.
4%3.
3%8.
8%
Prog
ram
Ser
vice
Rev
enue
35.4
%38
.9%
17.6
%52
.6%
30.6
%47
.8%
59.4
%36
.6%
8.0%
21.7
%44
.9%
Mem
bers
hip
Due
s6.
1%4.
7%6.
1%2.
5%5.
6%2.
8%0.
8%19
.8%
1.4%
3.1%
5.6%
Inve
stm
ent I
ncom
e3.
9%5.
8%2.
2%3.
4%2.
1%2.
4%6.
4%1.
3%17
.8%
8.0%
-1.7
%
Oth
er In
com
e10
.7%
14.7
%8.
5%0.
6%6.
7%6.
6%6.
8%12
.7%
14.7
%6.
9%9.
1%
TA
BL
E 3
.0
All I
ndus
try
Sect
ors
(con
tinue
d)

58 u n d e r s t a n d i n g B o s t o n58 u n d e r s t a n d i n g B o s t o n
TA
BL
E 3
.0
All I
ndus
try
Sect
ors
(con
tinue
d)
Arts
, Cul
ture
&
Hum
aniti
esEd
ucat
ion
Envi
ronm
ent
Heal
th C
are
&
Med
ical
Com
mun
ity
Capa
city
Hum
an
Serv
ices
Hous
ing
& Sh
elte
ryo
uth,
Spo
rts
&
Recr
eatio
nPh
ilant
hrop
yOt
her
Nonp
rofit
sTo
tal M
A
2003
Rat
ios
(med
ians
unl
ess
othe
rwis
e no
ted)
liqu
idity
Inve
rse
Cur
rent
Rat
io
0.0
5 0
.11
0.0
2 0
.23
0.1
1 0
.22
0.2
9 0.
00.
0 0
.03
0.1
1
Net
Wor
king
Cap
ital
$29
,477
$
48,1
61
$39
,301
$
217,
128
$66
,948
$
87,9
31
$67
,961
$
25,5
09
$40
,555
$
41,9
81
$56
,058
Day
s C
ash
on H
and
58.
1 6
7.2
71.
6 4
2.5
60.
7 4
4.7
66.
7 5
6.5
86.
9 5
9.0
56.
7
Day
s R
ecei
vabl
es o
n H
and
0.0
0.0
0.0
22.
2 3
.2
7.9
6
.3
0.0
0.0
0.0
0.0
Day
s In
vent
ory
and
Paya
bles
On
Han
d0.
00.
00.
0 1
.4
0.0
0.8
3
.8
0.0
0.0
0.0
0.0
Day
s Bi
lls O
utst
andi
ng0.
00.
00.
0 1
9.3
7.8
1
2.3
35.
7 0.
00.
00.
0 2
.6
Day
s D
efer
red
Rev
enue
Pai
d0.
00.
00.
00.
00.
00.
00.
00.
00.
00.
00.
0
Net
Ope
ratin
g C
ycle
58.
1 6
7.2
71.
6 4
6.9
56.
0 4
1.0
41.
1 5
6.5
86.
9 5
9.0
54.
2
Bala
nce
Shee
t Str
engt
h (A
vera
ges)
Dom
inan
t Ass
etC
ash
Cas
hC
ash
Cas
hC
ash
Cas
hLB
EC
ash
Cas
hC
ash
Cas
h
As %
Tot
al A
sset
s31
.4%
35.3
%26
.5%
31.3
%39
.4%
32.0
%55
.2%
40.8
%35
.3%
38.8
%33
.3%
Cas
h-to
-Ass
ets
31.4
%35
.3%
26.5
%31
.3%
39.4
%32
.0%
14.9
%40
.8%
35.3
%38
.8%
33.3
%
Oth
er C
urre
nt A
sset
s-to
-A
sset
s7.
4%7.
8%6.
7%17
.6%
13.6
%14
.5%
7.6%
4.5%
6.6%
9.6%
10.1
%
Loan
s R
ecei
vabl
e-to
-Ass
ets
0.3%
0.3%
0.2%
0.8%
2.1%
0.9%
5.6%
0.1%
1.0%
0.9%
0.9%
Inve
stm
ents
-to-
Ass
ets
10.6
%12
.4%
11.3
%11
.7%
7.0%
7.9%
2.6%
5.1%
26.6
%14
.8%
10.4
%
Fixe
d A
sset
s-to
-Ass
ets
22.3
%16
.1%
23.4
%20
.0%
17.7
%26
.7%
55.2
%17
.1%
5.1%
13.4
%21
.1%
Paya
bles
-to-
Ass
ets
9.0%
7.3%
7.4%
15.4
%11
.2%
15.7
%5.
8%10
.1%
6.7%
9.0%
10.4
%
Def
erre
d R
even
ues-
to-
Ass
ets
3.1%
4.1%
1.0%
1.9%
2.4%
2.3%
1.4%
7.3%
0.8%
2.0%
3.1%
Rel
ated
Par
ty L
oans
-to-
Ass
ets
2.0%
4.5%
1.3%
13.6
%0.
9%4.
4%0.
1%0.
3%0.
0%8.
5%4.
3%
Bond
s an
d M
ortg
ages
-to-
Ass
ets
13.4
%8.
5%6.
0%11
.9%
10.1
%12
.8%
48.8
%2.
8%1.
7%7.
7%11
.6%
Liab
ilitie
s-to
-Ass
ets
92.2
%28
.4%
49.2
%46
.0%
41.7
%69
.3%
69.7
%25
.8%
13.0
%51
.2%
49.4
%
Ass
ets-
to-R
even
ues
105.
8%92
.5%
136.
1%73
.6%
68.1
%62
.0%
379.
7%65
.9%
134.
8%77
.2%
87.8
%
LBE
= la
nd, b
uild
ing
and
equi
pmen
t

59p a s s i o n & p u r p o s e : R a i s i n g t h e F i s c a l F i t n e s s B a r f o r M a s s a c h u s e t t s N o n p r o f i t s 59p a s s i o n & p u r p o s e : R a i s i n g t h e F i s c a l F i t n e s s B a r f o r M a s s a c h u s e t t s N o n p r o f i t s
TA
BL
E 3
.0
All I
ndus
try
Sect
ors
(con
tinue
d)
Arts
, Cul
ture
&
Hum
aniti
esEd
ucat
ion
Envi
ronm
ent
Heal
th C
are
&
Med
ical
Com
mun
ity
Capa
city
Hum
an
Serv
ices
Hous
ing
& Sh
elte
ryo
uth,
Spo
rts
&
Recr
eatio
nPh
ilant
hrop
yOt
her
Nonp
rofit
sTo
tal M
A
2003
Rat
ios
(med
ians
unl
ess
othe
rwis
e no
ted)
(con
tinue
d)
Profi
tabi
lity
Dom
inan
t Rev
enue
Con
tPS
RC
ont
PSR
Con
tPS
RPS
RPS
RC
ont
Con
tPS
R
As %
Tot
al R
even
ue43
.8%
38.9
%65
.6%
52.6
%55
.0%
47.8
%59
.4%
36.6
%58
.1%
60.3
%44
.9%
Dom
inan
t Exp
ense
Com
pC
omp
Com
pC
omp
Com
pC
omp
Oth
rExp
Oth
rExp
Gra
nts
Com
pC
omp
As %
Tot
al E
xpen
ses
23.2
%28
.8%
22.9
%39
.2%
34.9
%41
.3%
25.1
%27
.6%
43.4
%21
.5%
28.3
%
Surp
lus
Mar
gin
2.1%
2.9%
8.1%
1.1%
0.7%
1.7%
0.5%
3.0%
2.0%
2.0%
2.0%
Tota
l Com
p. a
s %
Tot
al
Expe
nses
23.2
%28
.8%
22.9
%39
.2%
34.9
%41
.3%
23.1
%14
.6%
10.0
%21
.5%
28.3
%
% o
f Org
s w
ith E
mpl
oyee
s53
.9%
52.8
%49
.3%
70.1
%65
.9%
72.8
%68
.1%
33.0
%37
.1%
55.7
%57
.1%
Effic
ienc
y
Adm
inis
trat
ive
Cos
t Rat
io11
.6%
8.0%
7.5%
11.8
%11
.0%
10.2
%8.
6%1.
8%5.
3%9.
5%9.
1%
Prog
ram
Effi
cien
cy66
.5%
76.8
%69
.7%
82.3
%79
.4%
83.3
%87
.8%
77.5
%79
.4%
77.9
%79
.3%
Fund
rais
ing
Effic
ienc
y0.
0%0.
0%0.
0%0.
0%0.
0%0.
0%0.
0%0.
0%0.
0%0.
0%0.
0%
Com
p =
Com
pens
atio
n; C
ont =
Con
trib
utio
ns;
Oth
rExp
= O
ther
Exp
ense
s; P
SR =
Pro
gram
Ser
vice
Rev
enue

60 u n d e r s t a n d i n g B o s t o n
TABLE 3.1
Industry Sector: Arts, Culture & Humanities
Demographic StatisticsArts, Culture & Humanities
Performing Arts Museums
Media & Communications
Historical Societies
Support Services and Other Total Arts Total MA
Number of Organizations (1989) 96 164 64 59 68 4 455 3,525
Number of Organizations (2003) 226 408 123 133 169 56 1,115 8,312
Annual Growth Rate in Number of Organizations 6.3% 6.7% 4.8% 6.0% 6.7% 20.7% 6.6% 6.3%
Average Total Revenue (2003) $477,912 $965,831 $2,778,314 $2,639,130 $402,098 $485,690 $1,156,912 $6,112,951
Average Total Spending (2003) $484,042 $961,612 $2,519,867 $2,441,661 $347,628 $344,817 $1,089,215 $5,758,676
Average Program Spending (2003) $352,558 $745,431 $1,767,009 $1,936,659 $214,989 $238,808 $814,743 $4,923,850
Average Total Assets (2003) $1,341,676 $2,127,304 $15,928,793 $4,891,933 $2,524,468 $911,510 $3,819,468 $18,338,119
Average Net Assets (2003) $910,525 $1,628,188 $14,576,544 $2,945,926 $2,361,519 $579,502 $3,126,773 $10,048,501
Median Total Revenue (2003) $94,851 $102,342 $355,578 $242,865 $91,976 $144,647 $118,504 $205,355
Median Total Spending (2003) $92,979 $102,877 $343,878 $221,538 $73,224 $107,185 $114,578 $190,968
Median Program Spending (2003) $59,536 $71,341 $213,186 $154,704 $43,907 $50,462 $76,418 $146,580
Median Total Assets (2003) $109,511 $54,934 $871,743 $303,941 $419,199 $98,360 $150,730 $245,220
Median Net Assets (2003) $83,884 $41,702 $750,512 $224,525 $403,164 $69,548 $110,534 $144,551
For Organizations Filing in 1989 and 2003
Number of Organizations 59 111 51 47 45 3 316 2,267
Average Nominal Total Revenue (1989) $431,439 $1,155,412 $2,041,501 $2,527,178 $497,482 $80,126 $1,255,590 $5,585,502
Average Real Total Revenue (1989) $711,039 $1,904,190 $3,364,520 $4,164,945 $819,881 $132,053 $2,069,289 $9,205,252
Average Total Revenue (2003) $723,431 $2,377,259 $2,111,267 $5,020,923 $1,023,170 $369,720 $2,206,861 $14,217,180
Median Annual Real Revenue Growth Rate -1.1% 0.8% 0.3% 1.5% 1.8% -0.6% 0.6% 1.3%
Average Actual Total Spending (1989) $401,177 $953,913 $1,334,354 $2,376,259 $303,644 $81,898 $1,022,784 $5,009,415
Average Real Total Spending (1989) $661,164 $1,572,107 $2,199,098 $3,916,220 $500,425 $134,972 $1,685,611 $8,255,824
Average Total Spending (2003) $788,161 $2,437,110 $2,413,874 $4,510,162 $859,856 $102,045 $2,187,043 $13,341,175
Median Annual Total Real Spending Growth Rate 1.1% 1.2% 1.3% 3.2% 2.4% -3.1% 1.5% 2.1%
Nonprofit Subsector Analysis
Total Subsector Revenues $108,008,066 $394,058,889 $341,732,656 $351,004,323 $67,954,601 $27,198,650 $1,289,957,185 $50,810,847,223
Total Subsector Assets $303,218,804 $867,939,945 $1,959,241,506 $650,627,145 $426,635,037 $51,044,542 $4,258,706,979 $152,426,445,820
Total Subsector Spending $109,393,437 $392,337,899 $309,943,660 $324,740,855 $58,749,125 $19,309,745 $1,214,474,721 $47,866,114,000
Total Subsector Program Spending $79,678,099 $304,135,788 $217,342,102 $257,575,601 $36,333,092 $13,373,240 $908,437,922 $40,927,042,401
Budget Size Categories (based on total spending)
<250K 173 297 53 73 139 43 778 4,574
250K–1M 37 62 33 42 19 10 203 1,747
1–5M 12 37 25 14 9 2 99 1,138
5–10M 2 6 6 1 2 1 18 351
10–50M 2 4 5 1 0 0 12 365
>50M 0 2 1 2 0 0 5 137

61p a s s i o n & p u r p o s e : R a i s i n g t h e F i s c a l F i t n e s s B a r f o r M a s s a c h u s e t t s N o n p r o f i t s
TABLE 3.1
Industry Sector: Arts, Culture & Humanities (continued)
Funding Mix (% total revenues)Arts, Culture
& Human0itiesPerforming
Arts MuseumsMedia &
CommunicationsHistorical Societies
Support Services and Other Total Arts Total MA
Contributions 39.7% 37.4% 50.3% 49.3% 48.0% 67.8% 43.8% 42.0%
Government Funding 3.5% 2.0% 5.7% 8.6% 1.8% 3.8% 3.6% 8.8%
Program Service Revenue 35.3% 49.9% 21.7% 37.1% 13.9% 21.9% 35.4% 44.9%
Membership Dues 6.0% 4.7% 9.0% 2.6% 9.8% 7.0% 6.1% 5.6%
Investment Income 6.3% -0.5% 1.9% 1.5% 14.9% 3.2% 3.9% -1.7%
Other Income 12.7% 8.6% 17.1% 9.6% 13.5% 0.1% 10.7% 9.1%
2003 Ratios (medians unless otherwise noted)
liquidity
Inverse Current Ratio 0.05 0.09 0.12 0.05 0.0 0.07 0.05 0.11
Net Working Capital $18,818 $5,008 $116,205 $80,827 $59,430 $12,161 $29,344 $56,058
Days Cash on Hand 42.1 23.2 83.1 125.5 177.3 68.6 58.1 56.7
Days Receivables on Hand 0.0 0.0 1.5 0.0 0.0 0.0 0.0 0.0
Days Inventory and Payables On Hand 0.0 0.0 10.4 0.0 0.0 0.0 0.0 0.0
Days Bills Outstanding 0.0 0.0 10.7 3.2 0.0 1.7 0.0 2.6
Days Deferred Revenue Paid 0.0 0.0 0.0 0.0 0.0 0.0 0.0 0.0
Net Operating Cycle 42.1 23.2 84.4 122.2 177.3 66.9 58.1 54.2
Balance Sheet Strength (averages)
Dominant Asset Cash Cash LBE Cash LBE Cash Cash Cash
As % Total Assets 31.2% 34.1% 39.0% 43.1% 26.6% 39.1% 31.4% 33.3%
Cash-to-Assets 31.2% 34.1% 17.0% 43.1% 24.3% 39.1% 31.4% 33.3%
Other Current Assets-to-Assets 6.4% 7.3% 6.4% 13.3% 3.9% 9.8% 7.4% 10.1%
Loans Receivable-to-Assets 0.2% 0.3% 0.2% 0.5% 0.1% 0.1% 0.3% 0.9%
Investments-to-Assets 9.2% 6.6% 17.5% 6.4% 20.7% 9.5% 10.6% 10.4%
Fixed Assets-to-Assets 21.7% 16.8% 39.0% 22.3% 26.6% 15.2% 22.3% 21.1%
Payables-to-Assets 6.8% 11.2% 2.4% 19.1% 3.6% 9.7% 9.0% 10.4%
Deferred Revenues-to-Assets 2.1% 4.3% 2.7% 5.0% 0.3% 3.4% 3.1% 3.1%
Related Party Loans-to-Assets 0.7% 2.3% 0.2% 3.7% 2.9% 3.0% 2.0% 4.3%
Bonds and Mortgages-to-Assets 33.5% 13.5% 4.9% 3.5% 2.5% 7.0% 13.4% 11.6%
Liabilities-to-Assets 340.5% 33.0% 13.2% 44.5% 18.9% 25.3% 92.2% 49.4%
Assets-to-Revenues 102.1% 48.4% 387.7% 126.8% 404.2% 72.0% 105.8% 87.8%
Profitability
Dominant Revenue Cont PSR Cont Cont Cont Cont Cont PSR
As % Total Revenue 39.7% 49.9% 50.3% 49.3% 48.0% 67.8% 43.8% 44.9%
Dominant Expense Comp OthrExp Comp Comp OthrExp Comp Comp Comp
As % Total Expenses 20.3% 18.5% 37.2% 34.5% 21.0% 20.0% 23.2% 28.3%
Surplus Margin 2.0% 0.9% -0.2% 4.4% 5.3% 8.4% 2.1% 2.0%
Total Comp. as % Total Expenses 20.3% 18.4% 37.2% 34.5% 20.4% 20.0% 23.2% 28.3%
% of Orgs with Employees 48.2% 46.6% 77.2% 70.7% 49.7% 51.8% 53.9% 57.1%
Efficiency
Administrative Cost Ratio 9.4% 7.5% 21.2% 15.2% 16.2% 7.9% 11.6% 9.1%
Program Efficiency 66.1% 65.3% 65.2% 75.0% 64.8% 62.2% 66.5% 79.3%
Fundraising Efficiency 0.0% 0.0% 4.8% 0.0% 0.0% 0.0% 0.0% 0.0%
Comp = Compensation; Cont = Contributions; LBE = Land, Building and Equipment; OthrExp = Other Expenses; PSR = Program Service Revenue

62 u n d e r s t a n d i n g B o s t o n
Demographic Statistics
Elementary, Secondary
& Vocational Schools
Higher, Graduate &
Adult Education librariesEducational &
Student Services
General, Social & Applied Sciences
Support & Other
Total Education Total MA
Number of Organizations (1989) 170 75 33 64 30 199 571 3,525
Number of Organizations (2003) 377 131 128 396 51 644 1,727 8,312
Annual Growth Rate in Number of Organizations 5.9% 4.1% 10.2% 13.9% 3.9% 8.8% 8.2% 6.3%
Average Total Revenue (2003) $3,387,832 $86,057,252 $550,567 $656,068 $24,731,610 $3,481,313 $9,487,125 $6,112,951
Average Total Spending (2003) $3,306,290 $78,544,392 $541,902 $583,856 $24,074,134 $1,937,112 $8,286,994 $5,758,676
Average Program Spending (2003) $2,653,471 $66,886,735 $435,323 $506,853 $21,249,651 $1,188,500 $6,872,080 $4,923,850
Average Total Assets (2003) $12,725,984 $699,468,634 $3,112,150 $1,299,737 $29,599,024 $12,798,149 $62,010,826 $18,338,119
Average Net Assets (2003) $9,825,752 $337,582,487 $2,958,797 $874,985 $19,263,160 $11,667,084 $33,091,406 $10,048,501
Median Total Revenue (2003) $492,846 $3,179,181 $116,807 $52,743 $413,955 $156,949 $175,104 $205,355
Median Total Spending (2003) $472,733 $3,589,577 $106,355 $47,299 $432,041 $145,635 $161,209 $190,968
Median Program Spending (2003) $404,333 $2,321,884 $79,495 $15,170 $352,552 $102,057 $123,417 $146,580
Median Total Assets (2003) $350,759 $2,532,386 $497,249 $60,094 $355,898 $149,474 $169,524 $245,220
Median Net Assets (2003) $186,667 $1,955,814 $444,296 $51,392 $198,364 $100,952 $117,098 $144,551
For Organizations Filing in 1989 and 2003
Number of Organizations 121 57 26 38 16 146 404 2,267
Average Nominal Total Revenue (1989) $2,506,982 $73,737,402 $593,432 $1,132,879 $7,597,248 $1,828,903 $12,469,398 $5,585,502
Average Real Total Revenue (1989) $4,131,661 $122,000,000 $978,012 $1,867,055 $12,500,000 $3,014,144 $20,600,000 $9,205,252
Average Total Revenue (2003) $5,278,894 $148,000,000 $1,254,693 $4,697,093 $11,450,073 $7,830,478 $26,274,600 $14,217,180
Median Annual Real Revenue Growth Rate 2.8% 1.8% -0.7% -0.6% -1.1% 1.1% 1.6% 1.3%
Average Actual Total Spending (1989) $2,040,152 $58,741,563 $454,727 $919,051 $6,645,569 $1,588,670 $9,851,855 $5,009,415
Average Real Total Spending (1989) $3,362,295 $96,800,000 $749,418 $1,514,653 $11,000,000 $2,618,226 $16,200,000 $8,255,824
Average Total Spending (2003) $5,186,092 $132,500,000 $1,412,693 $4,176,350 $10,549,007 $4,518,885 $22,779,122 $13,341,175
Median Annual Total Real Spending Growth Rate 3.0% 2.7% 2.9% 3.3% 0.5% 1.3% 2.6% 2.1%
Nonprofit Subsector Analysis
Total Subsector Revenues $1,277,212,498 $11,273,500,032 $70,472,538 $259,802,753 $1,261,312,113 $2,241,965,777 $16,384,265,711 $50,810,847,223
Total Subsector Assets $4,797,695,791 $91,630,391,110 $398,355,210 $514,695,654 $1,509,550,228 $8,242,007,846 $107,092,695,839 $152,426,445,820
Total Subsector Spending $1,246,471,286 $10,289,315,321 $69,363,428 $231,206,960 $1,227,780,836 $1,247,500,175 $14,311,638,006 $47,866,114,000
Total Subsector Program Spending $1,000,358,421 $8,762,162,349 $55,721,313 $200,713,899 $1,083,732,195 $765,393,720 $11,868,081,897 $40,927,042,401
Budget Size Categories (based on total spending)
<250K 135 36 81 331 22 389 994 4,574
250K–1M 93 20 29 38 13 147 340 1,747
1–5M 77 13 16 24 9 69 208 1,138
5–10M 33 4 1 1 2 17 58 351
10–50M 38 30 1 0 2 16 87 365
>50M 1 28 0 2 3 6 40 137
TABLE 3.2
Industry Sector: Education

63p a s s i o n & p u r p o s e : R a i s i n g t h e F i s c a l F i t n e s s B a r f o r M a s s a c h u s e t t s N o n p r o f i t s
TABLE 3.2
Industry Sector: Education (continued)
Funding Mix (% total revenues)
Elementary, Secondary & Vocational
Schools
Higher, Graduate &
Adult Education libraries
Educational & Student Services
General, Social & Applied
SciencesSupport & Other
Total Education Total MA
Contributions 18.3% 30.0% 52.7% 36.2% 46.6% 43.2% 36.0% 42.0%
Government Funding 2.8% 8.4% 17.1% 2.2% 14.3% 3.9% 4.9% 8.8%
Program Service Revenue 76.3% 60.7% 13.9% 17.1% 37.5% 31.2% 38.9% 44.9%
Membership Dues 0.9% 3.9% 9.5% 4.2% 5.1% 6.3% 4.7% 5.6%
Investment Income -0.1% 1.2% 12.0% 9.6% 4.4% 6.6% 5.8% -1.7%
Other Income 4.7% 4.3% 11.9% 32.9% 6.3% 12.8% 14.7% 9.1%
2003 Ratios (medians unless otherwise noted)
liquidity
Inverse Current Ratio 0.31 0.36 0.00 0.0 0.14 0.07 0.11 0.11
Net Working Capital $79,814 $199,056 $77,797 $8,875 $88,207 $43,701 $48,161 $56,058
Days Cash on Hand 78.8 47.0 140.4 40.8 54.2 63.5 67.2 56.7
Days Receivables on Hand 4.9 20.1 0.0 0.0 6.8 0.0 0.0 0.0
Days Inventory and Payables On Hand 1.0 3.3 0.0 0.0 1.2 0.0 0.0 0.0
Days Bills Outstanding 8.4 23.9 0.0 0.0 3.1 0.0 0.0 2.6
Days Deferred Revenue Paid 0.0 4.8 0.0 0.0 0.0 0.0 0.0 0.0
Net Operating Cycle 76.3 41.6 140.4 40.8 59.0 63.5 67.2 54.2
Balance Sheet Strength (averages)
Dominant Asset Cash LBE Security Cash Cash Cash Cash Cash
As % Total Assets 37.1% 30.1% 27.6% 37.4% 34.7% 37.1% 35.3% 33.3%
Cash-to-Assets 37.1% 24.9% 26.0% 37.4% 34.7% 37.1% 35.3% 33.3%
Other Current Assets-to-Assets 8.1% 9.8% 4.6% 3.0% 15.3% 10.1% 7.8% 10.1%
Loans Receivable-to-Assets 0.2% 1.7% 0.0% 0.5% 0.0% 0.2% 0.3% 0.9%
Investments-to-Assets 9.4% 21.0% 27.6% 11.1% 12.8% 10.2% 12.4% 10.4%
Fixed Assets-to-Assets 30.7% 30.1% 14.3% 3.0% 15.4% 13.0% 16.1% 21.1%
Payables-to-Assets 9.8% 8.3% 1.0% 3.1% 7.2% 9.4% 7.3% 10.4%
Deferred Revenues-to-Assets 7.9% 6.2% 1.0% 1.2% 6.6% 3.5% 4.1% 3.1%
Related Party Loans-to-Assets 2.7% 0.1% 0.1% 5.8% 4.4% 6.5% 4.5% 4.3%
Bonds and Mortgages-to-Assets 12.9% 19.1% 2.2% 3.0% 4.6% 8.6% 8.5% 11.6%
Liabilities-to-Assets 37.8% 25.8% 6.1% 15.3% 24.7% 35.8% 28.4% 49.4%
Assets-to-Revenues 73.2% 140.3% 258.8% 83.4% 92.1% 89.0% 92.5% 87.8%
Profitability
Dominant Revenue PSR PSR Cont Cont Cont Cont PSR PSR
As % Total Revenue 76.3% 60.7% 52.7% 36.2% 46.6% 43.2% 38.9% 44.9%
Dominant Expense Comp Comp Comp OthrExp Comp Comp Comp Comp
As % Total Expenses 54.5% 41.5% 23.4% 25.1% 30.5% 23.2% 28.8% 28.3%
Surplus Margin 1.7% 1.8% 4.8% 8.8% -1.8% 3.0% 2.9% 2.0%
Total Comp. as % Total Expenses 54.5% 41.5% 23.4% 10.5% 30.5% 23.2% 28.8% 28.3%
% of Orgs with Employees 82.2% 80.2% 47.7% 23.0% 66.7% 48.3% 52.8% 57.1%
Efficiency
Administrative Cost Ratio 11.6% 14.7% 6.6% 0.0% 11.9% 7.8% 8.0% 9.1%
Program Efficiency 82.3% 80.5% 79.3% 52.1% 79.6% 74.6% 76.8% 79.3%
Fundraising Efficiency 2.0% 8.2% 0.0% 0.0% 0.0% 0.0% 0.0% 0.0%
Comp = Compensation; Cont = Contributions; LBE = Land, Building and Equipment; OthrExp = Other Expenses; PSR = Program Service Revenue; Security = Investment Securities

64 u n d e r s t a n d i n g B o s t o n
TABLE 3.3
Industry Sector: Environment
Demographic StatisticsConservation &
Pollution ControlBotanical
& EnvironmentalAnimal welfare, Shelters & Zoos
Support & Other
Total Enviroment Total MA
Number of Organizations (1989) 43 16 26 22 107 3,525
Number of Organizations (2003) 116 44 102 83 345 8,312
Annual Growth Rate in Number of Organizations 7.3% 7.5% 10.3% 9.9% 8.7% 6.3%
Average Total Revenue (2003) $1,106,024 $870,724 $1,116,060 $967,781 $1,045,724 $6,112,951
Average Total Spending (2003) $825,898 $821,580 $1,141,218 $966,394 $952,373 $5,758,676
Average Program Spending (2003) $676,658 $648,110 $934,814 $796,212 $778,104 $4,923,850
Average Total Assets (2003) $6,626,728 $2,820,990 $3,504,437 $1,442,476 $3,971,020 $18,338,119
Average Net Assets (2003) $6,381,952 $2,403,119 $2,862,355 $1,052,284 $3,551,720 $10,048,501
Median Total Revenue (2003) $158,309 $79,420 $94,680 $227,953 $113,958 $205,355
Median Total Spending (2003) $106,890 $86,032 $82,718 $243,854 $95,546 $190,968
Median Program Spending (2003) $62,530 $48,395 $50,616 $164,411 $67,919 $146,580
Median Total Assets (2003) $870,771 $116,580 $96,742 $232,850 $232,850 $245,220
Median Net Assets (2003) $683,991 $98,161 $86,848 $118,780 $167,596 $144,551
For Organizations Filing in 1989 and 2003
Number of Organizations 29 10 17 21 77 2,267
Average Nominal Total Revenue (1989) $603,201 $326,734 $2,404,418 $751,117 $1,014,029 $5,585,502
Average Real Total Revenue (1989) $994,113 $538,477 $3,962,628 $1,237,887 $1,671,182 $9,205,252
Average Total Revenue (2003) $1,904,344 $2,814,356 $5,238,117 $2,240,295 $2,850,178 $14,217,180
Median Annual Real Revenue Growth Rate 3.8% -1.0% 0.7% 3.4% 3.2% 1.3%
Average Actual Total Spending (1989) $235,199 $1,121,494 $2,195,615 $697,082 $909,089 $5,009,415
Average Real Total Spending (1989) $387,622 $1,848,291 $3,618,508 $1,148,834 $1,498,235 $8,255,824
Average Total Spending (2003) $1,275,482 $2,636,469 $5,449,558 $2,253,393 $2,640,486 $13,341,175
Median Annual Total Real Spending Growth Rate 5.7% 1.3% 3.0% 5.6% 4.3% 2.1%
Nonprofit Subsector Analysis
Total Subsector Revenues $128,298,788 $38,311,863 $113,838,133 $80,325,850 $360,774,634 $50,810,847,223
Total Subsector Assets $768,700,391 $124,123,549 $357,452,611 $119,725,492 $1,370,002,043 $152,426,445,820
Total Subsector Spending $95,804,131 $36,149,521 $116,404,260 $80,210,687 $328,568,599 $47,866,114,000
Total Subsector Program Spending $78,492,339 $28,516,824 $95,351,010 $66,085,619 $268,445,792 $40,927,042,401
Budget Size Categories (based on total spending)
<250K 77 36 75 44 232 4,574
250K–1M 27 4 18 18 67 1,747
1–5M 8 1 5 16 30 1,138
5–10M 1 2 2 4 9 351
10–50M 3 1 2 1 7 365
>50M 0 0 0 0 0 137

65p a s s i o n & p u r p o s e : R a i s i n g t h e F i s c a l F i t n e s s B a r f o r M a s s a c h u s e t t s N o n p r o f i t s
TABLE 3.3
Industry Sector: Environment (continued)
Funding Mix (% total revenues)Conservation &
Pollution ControlBotanical
& EnvironmentalAnimal welfare, Shelters & Zoos
Support & Other
Total Enviroment Total MA
Contributions 75.4% 50.6% 65.8% 59.9% 65.6% 42.0%
Government Funding 2.8% 8.3% 2.5% 7.0% 4.4% 8.8%
Program Service Revenue 9.5% 27.8% 19.6% 21.0% 17.6% 44.9%
Membership Dues 6.3% 9.5% 2.8% 7.8% 6.1% 5.6%
Investment Income 1.5% 3.1% -1.0% 6.6% 2.2% -1.7%
Other Income 7.3% 9.0% 12.8% 4.7% 8.5% 9.1%
2003 Ratios (medians unless otherwise noted)
liquidityInverse Current Ratio 0.01 0.03 0.03 0.05 0.02 0.11
Net Working Capital $143,410 $21,704 $13,936 $33,518 $39,301 $56,058
Days Cash on Hand 219.5 43.4 46.9 37.4 71.6 56.7
Days Receivables on Hand 0.0 0.0 0.0 0.0 0.0 0.0
Days Inventory and Payables On Hand 0.0 0.0 0.0 0.0 0.0 0.0
Days Bills Outstanding 0.0 0.0 0.0 0.0 0.0 2.6
Days Deferred Revenue Paid 0.0 0.0 0.0 0.0 0.0 0.0
Net Operating Cycle 219.5 43.4 46.9 37.4 71.6 54.2
Balance Sheet Strength (averages)
Dominant Asset LBE Cash Cash Cash Cash Cash
As % Total Assets 34.8% 27.5% 25.7% 31.8% 26.5% 33.3%
Cash-to-Assets 23.1% 27.5% 25.7% 31.8% 26.5% 33.3%
Other Current Assets-to-Assets 6.0% 2.8% 3.5% 13.3% 6.7% 10.1%
Loans Receivable-to-Assets 0.4% 0.0% 0.0% 0.1% 0.2% 0.9%
Investments-to-Assets 6.5% 8.9% 13.1% 16.9% 11.3% 10.4%
Fixed Assets-to-Assets 34.8% 26.9% 18.7% 11.1% 23.4% 21.1%
Payables-to-Assets 2.3% 2.9% 4.5% 20.3% 7.4% 10.4%
Deferred Revenues-to-Assets 0.6% 0.5% 0.4% 2.6% 1.0% 3.1%
Related Party Loans-to-Assets 0.3% 0.0% 2.3% 1.9% 1.3% 4.3%
Bonds and Mortgages-to-Assets 11.4% 1.7% 4.5% 2.5% 6.0% 11.6%
Liabilities-to-Assets 16.0% 107.9% 77.9% 31.1% 49.2% 49.4%
Assets-to-Revenues 294.7% 116.1% 102.2% 87.8% 136.1% 87.8%
ProfitabilityDominant Revenue Cont Cont Cont Cont Cont PSR
As % Total Revenue 75.4% 50.6% 65.8% 59.9% 65.6% 44.9%
Dominant Expense Comp OthrExp OthrExp Comp Comp Comp
As % Total Expenses 24.6% 24.6% 26.8% 29.7% 22.9% 28.3%
Surplus Margin 30.3% 6.8% 3.8% 1.9% 8.1% 2.0%
Total Comp. as % Total Expenses 24.6% 13.9% 19.4% 29.7% 22.9% 28.3%
% of Orgs with Employees 53.4% 34.1% 45.1% 56.6% 49.3% 57.1%
EfficiencyAdministrative Cost Ratio 11.9% 6.2% 3.9% 7.6% 7.5% 9.1%
Program Efficiency 70.0% 62.3% 74.3% 75.2% 69.7% 79.3%
Fundraising Efficiency 0.0% 0.0% 0.0% 0.0% 0.0% 0.0%
Comp = Compensation; Cont = Contributions; LBE = Land, Building and Equipment; OthrExp = Other Expenses; PSR = Program Service Revenue

66 u n d e r s t a n d i n g B o s t o n
TABLE 3.4
Industry Sector: Health Care & Medical
Demographic Statistics HospitalsOther
Health Care Nursing Mental Health
Specific Disease
Treatment & Research
Support & Other
Total Health Care & Medical Total MA
Number of Organizations (1989) 193 132 121 101 97 137 781 3,525
Number of Organizations (2003) 148 212 134 154 167 339 1,154 8,312
Annual Growth Rate in Number of Organizations -1.9% 3.4% 0.7% 3.1% 4.0% 6.7% 2.8% 6.3%
Average Total Revenue (2003) $105,778,219 $27,070,257 $8,056,364 $5,074,132 $6,635,467 $3,780,187 $22,222,397 $6,112,951
Average Total Spending (2003) $103,146,352 $26,736,308 $8,040,302 $5,029,013 $6,599,587 $3,505,091 $21,729,621 $5,758,676
Average Program Spending (2003) $87,167,434 $24,845,851 $6,822,097 $4,422,913 $5,753,427 $3,095,519 $18,867,932 $4,923,850
Average Total Assets (2003) $123,095,305 $9,553,810 $9,888,822 $3,224,197 $12,294,393 $7,674,060 $23,154,083 $18,338,119
Average Net Assets (2003) $52,738,971 $4,514,878 $4,378,577 $1,652,427 $7,662,266 $5,974,325 $11,185,979 $10,048,501
Median Total Revenue (2003) $20,072,215 $1,919,992 $6,216,779 $542,732 $367,877 $360,348 $947,068 $205,355
Median Total Spending (2003) $21,103,148 $1,914,551 $5,982,414 $573,304 $368,048 $316,781 $863,015 $190,968
Median Program Spending (2003) $17,947,286 $1,559,262 $5,183,535 $440,295 $249,809 $190,346 $629,329 $146,580
Median Total Assets (2003) $14,828,541 $1,088,595 $4,474,932 $325,595 $383,775 $439,603 $996,408 $245,220
Median Net Assets (2003) $6,362,428 $435,420 $1,307,460 $155,887 $319,947 $270,401 $413,067 $144,551
For Organizations Filing in 1989 and 2003
Number of Organizations 81 76 71 50 54 88 420 2,267
Average Nominal Total Revenue (1989) $53,913,892 $6,614,017 $4,501,656 $3,333,721 $4,925,567 $2,183,250 $13,501,516 $5,585,502
Average Real Total Revenue (1989) $88,900,000 $10,900,000 $7,419,007 $5,494,177 $8,117,638 $3,598,131 $22,300,000 $9,205,252
Average Total Revenue (2003) $133,300,000 $53,031,140 $10,707,171 $7,971,623 $14,844,379 $5,139,981 $41,039,309 $14,217,180
Median Annual Real Revenue Growth Rate 1.8% 5.4% 2.2% 1.9% 1.6% 0.9% 2.3% 1.3%
Average Actual Total Spending (1989) $48,718,786 $12,428,904 $4,171,580 $3,086,682 $4,154,276 $1,590,831 $13,584,902 $5,009,415
Average Real Total Spending (1989) $80,300,000 $20,500,000 $6,875,021 $5,087,043 $6,846,503 $2,621,787 $22,400,000 $8,255,824
Average Total Spending (2003) $129,300,000 $51,878,734 $10,668,909 $7,835,659 $15,150,781 $4,235,054 $39,902,650 $13,341,175
Median Annual Total Real Spending Growth Rate 2.2% 5.9% 1.9% 2.3% 2.4% 1.4% 2.7% 2.1%
Nonprofit Subsector Analysis
Total Subsector Revenues $15,655,176,398 $5,738,894,421 $1,079,552,786 $781,416,341 $1,108,123,024 $1,281,483,386 $25,644,646,356 $50,810,847,223
Total Subsector Assets $18,218,105,202 $2,025,407,673 $1,325,102,182 $496,526,388 $2,053,163,586 $2,601,506,257 $26,719,811,288 $152,426,445,820
Total Subsector Spending $15,265,660,073 $5,668,097,346 $1,077,400,460 $774,467,932 $1,102,131,012 $1,188,225,738 $25,075,982,561 $47,866,114,000
Total Subsector Program Spending $12,900,780,190 $5,267,320,509 $914,160,939 $681,128,631 $960,822,376 $1,049,381,058 $21,773,593,703 $40,927,042,401
Budget Size Categories (based on total spending)
<250K 21 60 20 57 69 157 384 4,574
250K–1M 14 33 6 36 45 77 211 1,747
1–5M 16 44 33 27 31 64 215 1,138
5–10M 17 35 41 15 7 17 132 351
10–50M 25 29 32 16 11 22 135 365
>50M 55 11 2 3 4 2 77 137

67p a s s i o n & p u r p o s e : R a i s i n g t h e F i s c a l F i t n e s s B a r f o r M a s s a c h u s e t t s N o n p r o f i t s
TABLE 3.4
Industry Sector: Health Care & Medical (continued)
Funding Mix (% total revenues) HospitalsOther
Health Care Nursing Mental Health
Specific Disease
Treatment & Research
Support & Other
Total Health Care & Medical Total MA
Contributions 12.5% 32.9% 6.2% 37.2% 54.7% 43.6% 40.8% 42.0%
Government Funding 2.6% 7.5% 2.7% 15.4% 11.7% 5.0% 7.2% 8.8%
Program Service Revenue 66.8% 60.3% 83.6% 55.2% 27.1% 34.7% 52.6% 44.9%
Membership Dues 0.7% 2.2% 1.3% 0.8% 27.1% 4.4% 2.5% 5.6%
Investment Income 10.1% -1.6% 6.4% 0.3% 6.1% 2.6% 3.4% -1.7%
Other Income 9.9% 6.1% 2.6% 6.5% 8.7% 14.7% 0.6% 9.1%
2003 Ratios (medians unless otherwise noted)
liquidity
Inverse Current Ratio 0.47 0.22 0.48 0.30 0.12 0.08 0.23 0.11
Net Working Capital $1,075,224 $248,503 $421,132 $120,452 $178,080 $154,061 $217,128 $56,058
Days Cash on Hand 24.0 31.0 22.4 34.4 85.7 104.0 42.5 56.7
Days Receivables on Hand 43.5 29.6 42.4 20.2 5.2 0.2 22.2 0.0
Days Inventory and Payables On Hand 5.4 0.8 3.4 2.1 0.0 0.0 1.4 0.0
Days Bills Outstanding 41.7 16.4 32.3 16.2 8.1 8.0 19.3 2.6
Days Deferred Revenue Paid 0.0 0.0 0.0 0.0 0.0 0.0 0.0 0.0
Net Operating Cycle 31.1 45.1 36.0 40.6 82.8 96.3 46.9 54.2
Balance Sheet Strength (averages)
Dominant Asset LBE Cash LBE Cash Cash Cash Cash Cash
As % Total Assets 27.2% 31.9% 30.9% 32.5% 38.4% 40.0% 31.3% 33.3%
Cash-to-Assets 15.5% 31.9% 16.4% 32.5% 38.2% 40.0% 31.3% 33.3%
Other Current Assets-to-Assets 18.3% 23.2% 20.0% 20.7% 14.8% 13.1% 17.6% 10.1%
Loans Receivable-to-Assets 3.1% 0.3% 0.6% 0.2% 0.6% 0.7% 0.8% 0.9%
Investments-to-Assets 19.3% 6.7% 15.2% 3.0% 15.8% 11.8% 11.7% 10.4%
Fixed Assets-to-Assets 27.2% 19.2% 30.9% 30.7% 13.7% 11.3% 20.0% 21.1%
Payables-to-Assets 27.2% 19.3% 15.9% 15.3% 12.6% 9.0% 15.4% 10.4%
Deferred Revenues-to-Assets 0.3% 0.9% 2.1% 2.3% 2.9% 2.3% 1.9% 3.1%
Related Party Loans-to-Assets 0.0% 0.6% 0.0% 0.2% 0.1% 45.8% 13.6% 4.3%
Bonds and Mortgages-to-Assets 18.5% 6.8% 24.6% 21.3% 5.3% 6.1% 11.9% 11.6%
Liabilities-to-Assets 55.6% 37.5% 64.9% 88.2% 24.4% 31.4% 46.0% 49.4%
Assets-to-Revenues 87.0% 47.1% 77.2% 48.9% 89.4% 99.3% 73.6% 87.8%
Profitability
Dominant Revenue PSR PSR PSR PSR Cont Cont PSR PSR
As % Total Revenue 66.8% 60.3% 83.6% 55.2% 54.7% 43.6% 52.6% 44.9%
Dominant Expense Comp Comp Comp Comp Comp Comp Comp Comp
As % Total Expenses 44.2% 47.3% 56.5% 47.4% 27.8% 27.2% 39.2% 28.3%
Surplus Margin 0.4% 1.3% 0.7% 0.0% 2.6% 3.2% 1.1% 2.0%
Total Comp. as % Total Expenses 44.2% 47.3% 56.5% 47.4% 27.8% 27.2% 39.2% 28.3%
% of Orgs with Employees 81.8% 80.7% 88.8% 76.0% 55.7% 55.5% 70.1% 57.1%
Efficiency
Administrative Cost Ratio 12.4% 10.2% 12.7% 12.7% 11.8% 10.2% 11.8% 9.1%
Program Efficiency 84.0% 85.0% 86.3% 82.3% 75.3% 78.3% 82.3% 79.3%
Fundraising Efficiency 0.0% 0.0% 0.0% 0.0% 0.0% 0.0% 0.0% 0.0%
Comp = Compensation; Cont = Contributions; LBE = Land, Building and Equipment; PSR = Program Service Revenue

68 u n d e r s t a n d i n g B o s t o n
TABLE 3.5
Industry Sector: Community Capacity
Demographic StatisticsCrime, legal & Civil Rights Employment
Community Development
Support & Other
Total Community Capacity Total MA
Number of Organizations (1989) 62 47 117 27 253 3,525
Number of Organizations (2003) 170 85 253 120 628 8,312
Annual Growth Rate in Number of Organizations 7.5% 4.3% 5.7% 11.2% 6.7% 6.3%
Average Total Revenue (2003) $817,605 $2,073,770 $3,210,544 $1,713,049 $2,122,765 $6,112,951
Average Total Spending (2003) $780,877 $2,067,492 $3,351,499 $1,610,817 $2,149,225 $5,758,676
Average Program Spending (2003) $667,885 $1,784,634 $3,153,486 $1,241,549 $1,930,019 $4,923,850
Average Total Assets (2003) $520,397 $1,755,319 $13,792,581 $4,052,000 $6,709,288 $18,338,119
Average Net Assets (2003) $377,866 $1,002,179 $12,687,236 $3,110,475 $5,943,551 $10,048,501
Median Total Revenue (2003) $167,364 $577,493 $177,293 $229,447 $214,136 $205,355
Median Total Spending (2003) $171,558 $649,455 $188,355 $224,564 $214,547 $190,968
Median Program Spending (2003) $111,555 $578,892 $126,454 $130,982 $148,156 $146,580
Median Total Assets (2003) $127,746 $453,253 $243,658 $139,012 $180,570 $245,220
Median Net Assets (2003) $92,994 $249,894 $153,490 $101,429 $127,330 $144,551
For Organizations Filing in 1989 and 2003
Number of Organizations 40 26 58 21 145 2,267
Average Nominal Total Revenue (1989) $669,658 $1,272,545 $831,032 $3,364,871 $1,241,144 $5,585,502
Average Real Total Revenue (1989) $1,103,638 $2,097,233 $1,369,592 $5,545,515 $2,045,481 $9,205,252
Average Total Revenue (2003) $1,376,525 $2,401,346 $1,811,918 $6,189,769 $2,431,534 $14,217,180
Median Annual Real Revenue Growth Rate 3.2% 3.2% 0.8% 3.2% 1.4% 1.3%
Average Actual Total Spending (1989) $626,122 $1,288,604 $661,823 $2,448,961 $1,023,189 $5,009,415
Average Real Total Spending (1989) $1,031,887 $2,123,698 $1,090,725 $4,036,039 $1,686,279 $8,255,824
Average Total Spending (2003) $1,352,868 $2,407,859 $1,769,602 $6,007,836 $2,382,900 $13,341,175
Median Annual Total Real Spending Growth Rate 2.5% 3.3% 2.2% 4.0% 2.8% 2.1%
Nonprofit Subsector Analysis
Total Subsector Revenues $138,992,840 $176,270,490 $812,267,510 $205,565,846 $1,333,096,686 $50,810,847,223
Total Subsector Assets $88,467,492 $149,202,116 $3,489,522,993 $486,240,003 $4,213,432,604 $152,426,445,820
Total Subsector Spending $132,749,010 $175,736,855 $847,929,365 $193,298,058 $1,349,713,288 $47,866,114,000
Total Subsector Program Spending $113,540,393 $151,693,884 $797,831,835 $148,985,861 $1,212,051,973 $40,927,042,401
Budget Size Categories (based on total spending)
<250K 102 31 140 64 337 4,574
250K–1M 39 17 63 32 151 1,747
1–5M 25 28 40 16 109 1,138
5–10M 1 5 3 4 13 351
10–50M 3 4 6 3 16 365
>50M 0 0 1 1 2 137

69p a s s i o n & p u r p o s e : R a i s i n g t h e F i s c a l F i t n e s s B a r f o r M a s s a c h u s e t t s N o n p r o f i t s
TABLE 3.5
Industry Sector: Community Capacity (continued)
Funding Mix (% total revenues)Crime, legal & Civil Rights Employment
Community Development
Support & Other
Total Community Capacity Total MA
Contributions 64.1% 35.5% 54.1% 57.9% 55.0% 42.0%
Government Funding 17.6% 16.3% 18.6% 8.1% 16.0% 8.8%
Program Service Revenue 24.8% 50.3% 29.8% 26.4% 30.6% 44.9%
Membership Dues 4.5% 8.7% 5.2% 5.9% 5.6% 5.6%
Investment Income 1.2% -0.6% 4.1% 1.2% 2.1% -1.7%
Other Income 5.5% 6.1% 6.7% 8.7% 6.7% 9.1%
2003 Ratios (medians unless otherwise noted)
liquidity
Inverse Current Ratio 0.10 0.20 0.10 0.09 0.11 0.11
Net Working Capital $56,029 $175,848 $61,877 $38,944 $66,948 $56,058
Days Cash on Hand 40.1 52.9 86.8 56.7 60.7 56.7
Days Receivables on Hand 0.0 25.0 1.8 0.2 3.2 0.0
Days Inventory and Payables On Hand 0.0 1.6 0.0 0.0 0.0 0.0
Days Bills Outstanding 4.9 17.1 7.8 6.0 7.8 2.6
Days Deferred Revenue Paid 0.0 0.0 0.0 0.0 0.0 0.0
Net Operating Cycle 35.2 62.4 80.8 50.9 56.0 54.2
Balance Sheet Strength (averages)
Dominant Asset Cash Cash Cash Cash Cash Cash
As % Total Assets 42.8% 39.1% 35.4% 43.3% 39.4% 33.3%
Cash-to-Assets 42.8% 39.1% 35.4% 43.3% 39.4% 33.3%
Other Current Assets-to-Assets 13.3% 21.4% 9.9% 16.1% 13.6% 10.1%
Loans Receivable-to-Assets 0.1% 0.0% 5.1% 0.2% 2.1% 0.9%
Investments-to-Assets 6.9% 4.8% 6.3% 10.4% 7.0% 10.4%
Fixed Assets-to-Assets 16.2% 21.2% 20.2% 11.8% 17.7% 21.1%
Payables-to-Assets 12.3% 14.5% 8.1% 14.0% 11.2% 10.4%
Deferred Revenues-to-Assets 1.9% 2.5% 2.7% 2.6% 2.4% 3.1%
Related Party Loans-to-Assets 0.9% 1.5% 0.7% 1.0% 0.9% 4.3%
Bonds and Mortgages-to-Assets 4.6% 15.5% 13.0% 7.4% 10.1% 11.6%
Liabilities-to-Assets 32.9% 114.1% 29.8% 27.5% 41.7% 49.4%
Assets-to-Revenues 50.9% 63.0% 119.8% 65.1% 68.1% 87.8%
Profitability
Dominant Revenue Cont PSR Cont Cont Cont PSR
As % Total Revenue 64.1% 50.3% 54.1% 57.9% 55.0% 44.9%
Dominant Expense Comp Comp Comp Comp OthrExp Comp
As % Total Expenses 39.1% 47.9% 28.2% 33.5% 34.9% 28.3%
Surplus Margin 0.8% 0.2% 0.7% 2.1% 0.7% 2.0%
Total Comp. as % Total Expenses 39.1% 47.9% 28.2% 33.5% 34.9% 28.3%
% of Orgs with Employees 65.3% 83.5% 60.5% 65.8% 65.9% 57.1%
Efficiency
Administrative Cost Ratio 10.3% 11.9% 11.1% 11.8% 11.0% 9.1%
Program Efficiency 77.5% 86.5% 79.5% 74.7% 79.4% 79.3%
Fundraising Efficiency 0.0% 0.0% 0.0% 0.0% 0.0% 0.0%
Comp = Compensation; Cont = Contributions; OthrExp = Other Expenses; PSR = Program Service Revenue

70 u n d e r s t a n d i n g B o s t o n
TABLE 3.6
Industry Sector: Human Services
Demographic StatisticsAgriculture
& FoodHuman
ServicesChildren &
youthFamily & Personal
Residential Care, Adult Day Care &
Independence Services
Support & Other
Total Human Services Total MA
Number of Organizations (1989) 21 101 148 89 190 30 579 3,525
Number of Organizations (2003) 53 165 239 158 395 139 1,149 8,312
Annual Growth Rate in Number of Organizations 6.8% 3.6% 3.5% 4.2% 5.4% 11.6% 5.0% 6.3%
Average Total Revenue (2003) $2,485,827 $4,475,998 $2,398,598 $2,482,723 $4,038,420 $645,300 $3,064,139 $6,112,951
Average Total Spending (2003) $2,417,176 $4,343,873 $2,326,260 $2,512,082 $3,953,983 $616,529 $2,998,482 $5,758,676
Average Program Spending (2003) $2,260,833 $3,869,164 $2,070,721 $2,153,776 $3,510,775 $525,387 $2,657,285 $4,923,850
Average Total Assets (2003) $872,439 $4,243,956 $1,815,436 $1,372,280 $3,802,959 $855,391 $2,626,867 $18,338,119
Average Net Assets (2003) $648,549 $2,660,153 $1,284,015 $883,738 $1,148,480 $606,168 $1,268,682 $10,048,501
Median Total Revenue (2003) $179,162 $884,713 $505,447 $358,004 $717,443 $117,520 $457,742 $205,355
Median Total Spending (2003) $143,449 $916,424 $511,784 $346,967 $712,423 $124,037 $450,810 $190,968
Median Program Spending (2003) $111,901 $730,844 $437,609 $305,627 $576,638 $95,518 $366,157 $146,580
Median Total Assets (2003) $182,393 $840,822 $198,287 $302,616 $810,697 $142,607 $376,095 $245,220
Median Net Assets (2003) $141,014 $424,668 $137,537 $203,404 $313,319 $107,801 $199,634 $144,551
For Organizations Filing in 1989 and 2003
Number of Organizations 14 76 105 55 133 23 406 2,267
Average Nominal Total Revenue (1989) $1,091,524 $3,072,384 $1,039,833 $1,307,787 $2,424,314 $1,235,055 $1,928,912 $5,585,502
Average Real Total Revenue (1989) $1,798,899 $5,063,477 $1,713,708 $2,155,313 $3,995,419 $2,035,447 $3,178,965 $9,205,252
Average Total Revenue (2003) $5,244,861 $7,297,193 $3,439,399 $3,792,393 $6,931,846 $1,925,573 $5,329,943 $14,217,180
Median Annual Real Revenue Growth Rate 0.4% 1.6% 1.9% 1.6% 2.0% -1.0% 1.7% 1.3%
Average Actual Total Spending (1989) $947,935 $2,960,688 $993,146 $1,307,736 $2,334,008 $1,087,133 $1,847,085 $5,009,415
Average Real Total Spending (1989) $1,562,255 $4,879,397 $1,636,766 $2,155,230 $3,846,589 $1,791,662 $3,044,109 $8,255,824
Average Total Spending (2003) $5,144,047 $7,122,864 $3,434,602 $3,776,641 $6,790,583 $1,840,105 $5,239,342 $13,341,175
Median Annual Total Real Spending Growth Rate 1.9% 2.5% 1.7% 2.5% 2.3% 0.4% 2.0% 2.1%
Nonprofit Subsector Analysis
Total Subsector Revenues $131,748,826 $738,539,688 $573,265,019 $392,270,232 $1,595,175,758 $89,696,670 $3,520,696,193 $50,810,847,223
Total Subsector Assets $46,239,290 $700,252,801 $433,889,266 $216,820,254 $1,502,168,884 $118,899,300 $3,018,269,795 $152,426,445,820
Total Subsector Spending $128,110,303 $716,739,065 $555,976,161 $396,908,969 $1,561,823,353 $85,697,502 $3,445,255,353 $47,866,114,000
Total Subsector Program Spending $119,824,168 $638,412,105 $494,902,432 $340,296,584 $1,386,756,170 $73,028,758 $3,053,220,217 $40,927,042,401
Budget Size Categories (based on total spending)
<250K 33 61 59 65 146 89 453 4,574
250K–1M 12 25 108 43 76 34 298 1,747
1–5M 3 44 52 28 79 11 216 1,138
5–10M 3 16 10 9 45 5 88 351
10–50M 1 17 9 12 46 0 85 365
>50M 1 2 1 1 3 0 8 137

71p a s s i o n & p u r p o s e : R a i s i n g t h e F i s c a l F i t n e s s B a r f o r M a s s a c h u s e t t s N o n p r o f i t s
TABLE 3.6
Industry Sector: Human Services (continued)
Funding Mix (% total revenues)Agriculture
& FoodHuman
ServicesChildren &
youthFamily & Personal
Residential Care, Adult Day Care &
Independence Services
Support & Other
Total Human Services Total MA
Contributions 72.6% 43.2% 20.5% 52.4% 37.0% 54.8% 40.4% 42.0%
Government Funding 8.9% 11.6% 7.5% 13.6% 13.5% 7.4% 11.1% 8.8%
Program Service Revenue 18.3% 39.8% 75.2% 34.9% 51.3% 26.2% 47.8% 44.9%
Membership Dues 2.9% 5.9% 0.7% 2.7% 2.4% 3.8% 2.8% 5.6%
Investment Income 0.7% 0.8% 1.0% 2.5% 2.6% 7.0% 2.4% -1.7%
Other Income 5.6% 10.2% 2.7% 7.5% 6.7% 8.1% 6.6% 9.1%
2003 Ratios (medians unless otherwise noted)
liquidity
Inverse Current Ratio 0.09 0.24 0.24 0.13 0.29 0.03 0.22 0.11
Net Working Capital $47,444 $124,422 $69,620 $108,010 $129,919 $42,151 $87,931 $56,058
Days Cash on Hand 54.7 43.7 45.9 43.4 42.6 57.5 44.7 56.7
Days Receivables on Hand 0.0 13.8 10.1 5.0 17.0 0.0 7.9 0.0
Days Inventory and Payables On Hand 0.0 1.4 1.8 0.3 1.3 0.0 0.8 0.0
Days Bills Outstanding 2.6 17.0 11.3 7.1 19.1 0.0 12.3 2.6
Days Deferred Revenue Paid 0.0 0.0 0.0 0.0 0.0 0.0 0.0 0.0
Net Operating Cycle 52.1 42.0 46.5 41.6 41.7 57.5 41.0 54.2
Balance Sheet Strength (averages)
Dominant Asset LBE LBE Cash Cash LBE Cash Cash Cash
As % Total Assets 32.4% 35.2% 44.3% 34.0% 31.6% 35.5% 32.0% 33.3%
Cash-to-Assets 31.7% 24.7% 44.3% 34.0% 25.6% 35.5% 32.0% 33.3%
Other Current Assets-to-Assets 6.1% 11.6% 14.6% 15.9% 16.6% 13.6% 14.5% 10.1%
Loans Receivable-to-Assets 0.2% 1.1% 1.0% 1.5% 0.5% 1.2% 0.9% 0.9%
Investments-to-Assets 3.8% 7.8% 7.0% 6.5% 7.6% 13.6% 7.9% 10.4%
Fixed Assets-to-Assets 32.4% 35.2% 22.8% 22.0% 31.6% 12.2% 26.7% 21.1%
Payables-to-Assets 7.0% 11.2% 31.8% 11.1% 11.4% 13.8% 15.7% 10.4%
Deferred Revenues-to-Assets 0.5% 2.2% 4.1% 1.2% 2.0% 1.9% 2.3% 3.1%
Related Party Loans-to-Assets 0.1% 0.1% 7.7% 0.4% 6.5% 4.3% 4.4% 4.3%
Bonds and Mortgages-to-Assets 5.4% 15.1% 8.9% 7.8% 19.3% 6.0% 12.8% 11.6%
Liabilities-to-Assets 17.9% 26.6% 202.2% 19.2% 45.4% 34.3% 69.3% 49.4%
Assets-to-Revenues 96.4% 101.5% 36.7% 61.6% 64.3% 74.9% 62.0% 87.8%
Profitability
Dominant Revenue Cont Cont PSR Cont PSR Cont PSR PSR
As % Total Revenue 87.2% 43.2% 75.2% 52.4% 51.3% 54.8% 47.8% 44.9%
Dominant Expense Comp Comp Comp Comp Comp Comp Comp Comp
As % Total Expenses 22.1% 42.3% 60.8% 40.6% 38.9% 21.4% 41.3% 28.3%
Surplus Margin 4.9% 0.8% 0.8% 1.2% 2.1% 5.8% 1.7% 2.0%
Total Comp. as % Total Expenses 22.1% 42.3% 60.8% 40.6% 38.9% 21.4% 41.3% 28.3%
% of Orgs with Employees 60.4% 77.6% 89.1% 71.5% 71.6% 48.2% 72.8% 57.1%
Efficiency
Administrative Cost Ratio 8.4% 11.4% 13.4% 10.5% 9.8% 5.9% 10.2% 9.1%
Program Efficiency 77.0% 80.2% 84.5% 79.9% 84.9% 83.2% 83.3% 79.3%
Fundraising Efficiency 0.0% 0.1% 0.0% 0.8% 0.0% 0.0% 0.0% 0.0%
Comp = Compensation; Cont = Contributions; LBE = Land, Building and Equipment; PSR = Program Service Revenue

72 u n d e r s t a n d i n g B o s t o n
TABLE 3.7
Industry Sector: Housing & Shelter
Demographic StatisticsHousing
Development
Search, Shelter, Associations & Improvement
Support & Other
Total Housing and Shelter Total MA
Number of Organizations (1989) 125 35 20 180 3,525
Number of Organizations (2003) 314 79 77 470 8,312
Annual Growth Rate in Number of Organizations 6.8% 6.0% 10.1% 7.1% 6.3%
Average Total Revenue (2003) $1,572,370 $1,501,825 $1,088,517 $1,481,243 $6,112,951
Average Total Spending (2003) $1,483,155 $1,411,832 $1,009,407 $1,393,552 $5,758,676
Average Program Spending (2003) $1,364,332 $1,223,901 $872,566 $1,260,162 $4,923,850
Average Total Assets (2003) $5,231,500 $2,459,889 $3,435,019 $4,471,316 $18,338,119
Average Net Assets (2003) $1,068,337 $1,191,058 $814,366 $1,047,357 $10,048,501
Median Total Revenue (2003) $465,398 $621,631 $344,849 $457,199 $205,355
Median Total Spending (2003) $466,323 $397,657 $226,966 $432,897 $190,968
Median Program Spending (2003) $413,830 $351,294 $198,624 $388,013 $146,580
Median Total Assets (2003) $2,247,377 $1,085,080 $951,082 $1,687,439 $245,220
Median Net Assets (2003) $272,828 $525,785 $225,273 $297,086 $144,551
For Organizations Filing in 1989 and 2003
Number of Organizations 109 22 14 145 2,267
Average Nominal Total Revenue (1989) $923,887 $492,302 $1,213,716 $884,487 $5,585,502
Average Real Total Revenue (1989) $1,522,623 $811,343 $2,000,278 $1,457,689 $9,205,252
Average Total Revenue (2003) $2,629,464 $1,235,886 $1,466,184 $2,305,708 $14,217,180
Median Annual Real Revenue Growth Rate -0.8% 3.3% 2.2% -0.5% 1.3%
Average Actual Total Spending (1989) $804,602 $382,808 $1,083,091 $767,494 $5,009,415
Average Real Total Spending (1989) $1,326,034 $630,891 $1,785,000 $1,264,878 $8,255,824
Average Total Spending (2003) $2,562,118 $1,253,474 $1,394,140 $2,250,795 $13,341,175
Median Annual Total Real Spending Growth Rate -0.6% 2.7% 7.3% 1.0% 2.1%
Nonprofit Subsector Analysis
Total Subsector Revenues $493,724,264 $118,644,184 $83,815,830 $696,184,278 $50,810,847,223
Total Subsector Assets $1,642,690,958 $194,331,213 $264,496,432 $2,101,518,603 $152,426,445,820
Total Subsector Spending $465,710,613 $111,534,713 $77,724,328 $654,969,654 $47,866,114,000
Total Subsector Program Spending $428,400,382 $96,688,207 $67,187,582 $592,276,171 $40,927,042,401
Budget Size Categories (based on total spending)
<250K 113 28 39 180 4,574
250K–1M 126 28 21 175 1,747
1–5M 64 18 13 95 1,138
5–10M 5 4 3 12 351
10–50M 5 1 1 7 365
>50M 1 0 0 1 137

73p a s s i o n & p u r p o s e : R a i s i n g t h e F i s c a l F i t n e s s B a r f o r M a s s a c h u s e t t s N o n p r o f i t s
TABLE 3.7
Industry Sector: Housing & Shelter (continued)
Funding Mix (% total revenues)Housing
Development
Search, Shelter, Associations & Improvement
Support & Other
Total Housing and Shelter Total MA
Contributions 17.0% 46.9% 45.6% 26.7% 42.0%
Government Funding 5.2% 21.0% 15.4% 9.6% 8.8%
Program Service Revenue 68.3% 43.5% 39.4% 59.4% 44.9%
Membership Dues 0.3% 1.8% 1.8% 0.8% 5.6%
Investment Income 8.2% 3.0% 2.8% 6.4% -1.7%
Other Income 6.3% 4.9% 10.5% 6.8% 9.1%
2003 Ratios (medians unless otherwise noted)
liquidity
Inverse Current Ratio 0.40 0.19 0.18 0.29 0.11
Net Working Capital $43,074 $158,285 $87,241 $67,961 $56,058
Days Cash on Hand 66.4 72.9 61.0 66.7 56.7
Days Receivables on Hand 4.0 24.1 11.3 6.3 0.0
Days Inventory and Payables On Hand 4.5 2.6 0.8 3.8 0.0
Days Bills Outstanding 40.0 20.5 24.4 35.7 2.6
Days Deferred Revenue Paid 0.0 0.0 0.0 0.0 0.0
Net Operating Cycle 35.0 79.2 48.8 41.1 54.2
Balance Sheet Strength (averages)
Dominant Asset LBE LBE LBE LBE Cash
As % Total Assets 60.1% 44.2% 46.4% 55.2% 33.3%
Cash-to-Assets 12.6% 21.1% 18.3% 14.9% 33.3%
Other Current Assets-to-Assets 4.4% 15.4% 13.0% 7.6% 10.1%
Loans Receivable-to-Assets 6.2% 4.4% 4.2% 5.6% 0.9%
Investments-to-Assets 2.0% 4.1% 3.5% 2.6% 10.4%
Fixed Assets-to-Assets 60.1% 44.2% 46.4% 55.2% 21.1%
Payables-to-Assets 4.5% 10.4% 6.3% 5.8% 10.4%
Deferred Revenues-to-Assets 1.6% 1.1% 0.8% 1.4% 3.1%
Related Party Loans-to-Assets 0.0% 0.0% 0.3% 0.1% 4.3%
Bonds and Mortgages-to-Assets 57.7% 22.4% 39.3% 48.8% 11.6%
Liabilities-to-Assets 69.9% 31.8% 108.7% 69.7% 49.4%
Assets-to-Revenues 464.9% 132.1% 226.1% 379.7% 87.8%
Profitability
Dominant Revenue PSR Cont Cont PSR PSR
As % Total Revenue 68.3% 46.9% 45.6% 59.4% 44.9%
Dominant Expense OthrExp Comp Comp OthrExp Comp
As % Total Expenses 27.3% 41.2% 23.7% 25.1% 28.3%
Surplus Margin -0.2% 0.8% 3.9% 0.5% 2.0%
Total Comp. as % Total Expenses 18.3% 41.2% 23.7% 23.1% 28.3%
% of Orgs with Employees 68.2% 82.3% 53.2% 68.1% 57.1%
Efficiency
Administrative Cost Ratio 7.0% 11.9% 7.6% 8.6% 9.1%
Program Efficiency 90.0% 82.3% 85.4% 87.8% 79.3%
Fundraising Efficiency 0.0% 0.0% 0.0% 0.0% 0.0%
Comp = Compensation; Cont = Contributions; LBE = Land, Building and Equipment; OthrExp = Other Expenses; PSR = Program Service Revenue

74 u n d e r s t a n d i n g B o s t o n
TABLE 3.8
Industry Sector: youth, Sports & Recreation
Demographic Statistics Camps & FacilitiesAmateur &
Professional Sportsyouth Centers &
youth DevelopmentSupport & Other Total youth Total MA
Number of Organizations (1989) 66 110 95 17 288 3,525
Number of Organizations (2003) 143 501 155 113 912 8,312
Annual Growth Rate in Number of Organizations 5.7% 11.4% 3.6% 14.5% 8.6% 6.3%
Average Total Revenue (2003) $1,866,596 $182,164 $805,975 $504,367 $592,222 $6,112,951
Average Total Spending (2003) $1,842,551 $173,335 $729,968 $479,209 $567,567 $5,758,676
Average Program Spending (2003) $1,666,673 $128,751 $576,566 $383,042 $477,511 $4,923,850
Average Total Assets (2003) $1,705,077 $165,450 $1,567,624 $680,550 $708,992 $18,338,119
Average Net Assets (2003) $1,148,267 $129,235 $1,389,109 $546,672 $554,863 $10,048,501
Median Total Revenue (2003) $172,371 $86,306 $297,697 $84,496 $98,712 $205,355
Median Total Spending (2003) $160,997 $76,513 $311,610 $70,986 $92,908 $190,968
Median Program Spending (2003) $126,297 $47,391 $248,865 $42,641 $74,529 $146,580
Median Total Assets (2003) $222,209 $50,493 $376,370 $60,220 $74,154 $245,220
Median Net Assets (2003) $161,602 $42,694 $292,193 $45,980 $59,579 $144,551
For Organizations Filing in 1989 and 2003
Number of Organizations 45 70 63 13 191 2,267
Average Nominal Total Revenue (1989) $1,575,904 $147,827 $507,682 $1,127,896 $685,690 $5,585,502
Average Real Total Revenue (1989) $2,597,187 $243,628 $836,692 $1,858,842 $1,130,059 $9,205,252
Average Total Revenue (2003) $4,813,786 $337,633 $1,016,228 $2,665,658 $1,774,506 $14,217,180
Median Annual Real Revenue Growth Rate 1.3% 1.1% 0.3% 1.2% 0.9% 1.3%
Average Actual Total Spending (1989) $1,446,064 $128,347 $441,459 $1,082,847 $607,047 $5,009,415
Average Real Total Spending (1989) $2,383,202 $211,523 $727,551 $1,784,598 $1,000,452 $8,255,824
Average Total Spending (2003) $4,709,253 $310,434 $911,439 $2,690,738 $1,707,052 $13,341,175
Median Annual Total Real Spending Growth Rate 2.4% 2.4% 1.2% 1.8% 1.9% 2.1%
Nonprofit Subsector Analysis
Total Subsector Revenues $266,923,207 $91,264,042 $124,926,115 $56,993,422 $540,106,786 $50,810,847,223
Total Subsector Assets $243,826,039 $82,890,613 $242,981,663 $76,902,166 $646,600,481 $152,426,445,820
Total Subsector Spending $263,484,787 $86,840,931 $113,145,005 $54,150,628 $517,621,351 $47,866,114,000
Total Subsector Program Spending $238,334,248 $64,504,114 $89,367,673 $43,283,780 $435,489,815 $40,927,042,401
Budget Size Categories (based on total spending)
<250K 84 438 71 92 685 4,574
250K–1M 35 54 52 12 153 1,747
1–5M 21 7 29 7 64 1,138
5–10M 1 2 2 1 6 351
10–50M 1 0 1 1 3 365
>50M 1 0 0 0 1 137

75p a s s i o n & p u r p o s e : R a i s i n g t h e F i s c a l F i t n e s s B a r f o r M a s s a c h u s e t t s N o n p r o f i t s
TABLE 3.8
Industry Sector: youth, Sports & Recreation (continued)
Funding Mix (% total revenues) Camps & FacilitiesAmateur &
Professional Sportsyouth Centers &
youth DevelopmentSupport & Other Total youth Total MA
Contributions 37.8% 19.2% 45.6% 43.0% 29.6% 42.0%
Government Funding 3.8% 0.2% 4.0% 3.7% 1.9% 8.8%
Program Service Revenue 41.9% 39.5% 29.2% 27.7% 36.6% 44.9%
Membership Dues 8.5% 29.4% 5.8% 11.2% 19.8% 5.6%
Investment Income 2.1% 0.4% 2.8% 2.2% 1.3% -1.7%
Other Income 9.8% 11.5% 16.6% 16.0% 12.7% 9.1%
2003 Ratios (medians unless otherwise noted)
liquidity
Inverse Current Ratio 0.06 0.0 0.09 0.0 0.0 0.11
Net Working Capital $46,522 $12,134 $85,550 $16,233 $25,509 $56,058
Days Cash on Hand 60.8 49.7 76.9 45.7 56.5 56.7
Days Receivables on Hand 0.0 0.0 2.4 0.0 0.0 0.0
Days Inventory and Payables On Hand 0.0 0.0 0.7 0.0 0.0 0.0
Days Bills Outstanding 0.0 0.0 4.0 0.0 0.0 2.6
Days Deferred Revenue Paid 0.0 0.0 0.0 0.0 0.0 0.0
Net Operating Cycle 60.8 49.7 76.1 45.7 56.5 54.2
Balance Sheet Strength (averages)
Dominant Asset LBE Cash Cash Cash Cash Cash
As % Total Assets 32.1% 46.9% 29.5% 40.8% 40.8% 33.3%
Cash-to-Assets 32.1% 46.9% 29.5% 40.8% 40.8% 33.3%
Other Current Assets-to-Assets 6.5% 2.2% 9.0% 5.8% 4.5% 10.1%
Loans Receivable-to-Assets 0.2% 0.1% 0.2% 0.0% 0.1% 0.9%
Investments-to-Assets 7.0% 1.4% 14.5% 5.5% 5.1% 10.4%
Fixed Assets-to-Assets 32.1% 10.4% 26.7% 13.8% 17.1% 21.1%
Payables-to-Assets 7.8% 14.0% 3.9% 4.3% 10.1% 10.4%
Deferred Revenues-to-Assets 2.1% 11.9% 1.8% 1.7% 7.3% 3.1%
Related Party Loans-to-Assets 0.8% 0.3% 0.0% 0.2% 0.3% 4.3%
Bonds and Mortgages-to-Assets 4.3% 1.2% 5.5% 4.1% 2.8% 11.6%
Liabilities-to-Assets 25.0% 30.7% 20.0% 13.9% 25.8% 49.4%
Assets-to-Revenues 115.2% 51.0% 105.5% 60.8% 65.9% 87.8%
Profitability
Dominant Revenue PSR PSR Cont Cont PSR PSR
As % Total Revenue 41.9% 39.5% 45.6% 43.0% 36.6% 44.9%
Dominant Expense Comp OthrExp Comp OthrExp OthrExp Comp
As % Total Expenses 23.6% 36.9% 39.5% 23.7% 27.6% 28.3%
Surplus Margin 1.9% 3.9% 1.5% 3.0% 3.0% 2.0%
Total Comp. as % Total Expenses 23.6% 4.6% 39.5% 13.6% 14.6% 28.3%
% of Orgs with Employees 55.2% 15.0% 70.3% 33.6% 33.0% 57.1%
Efficiency
Administrative Cost Ratio 10.8% 0.0% 10.2% 1.7% 1.8% 9.1%
Program Efficiency 77.1% 79.1% 79.4% 71.5% 77.5% 79.3%
Fundraising Efficiency 0.0% 0.0% 2.3% 0.0% 0.0% 0.0%
Comp = Compensation; Cont = Contributions; LBE = Land, Building and Equipment; OthrExp = Other Expenses; PSR = Program Service Revenue

76 u n d e r s t a n d i n g B o s t o n
TABLE 3.9
Industry Sector: Philanthropy
Demographic StatisticsPrivate
FoundationsPublic
FoundationsFederated
Giving
Support, Voluntarism
& OtherTotal
Philanthropy Total MA
Number of Organizations (1989) 20 11 33 58 122 3,525
Number of Organizations (2003) 71 68 70 179 388 8,312
Annual Growth Rate in Number of Organizations 9.5% 13.9% 5.5% 8.4% 8.6% 6.3%
Average Total Revenue (2003) $573,241 $2,243,269 $2,581,919 $525,668 $1,206,370 $6,112,951
Average Total Spending (2003) $576,867 $1,698,770 $2,836,957 $359,058 $1,080,753 $5,758,676
Average Program Spending (2003) $482,675 $1,473,434 $2,379,792 $285,268 $907,505 $4,923,850
Average Total Assets (2003) $1,232,217 $12,903,870 $8,611,287 $1,928,944 $4,930,468 $18,338,119
Average Net Assets (2003) $1,153,389 $11,937,036 $7,051,995 $1,722,831 $4,370,195 $10,048,501
Median Total Revenue (2003) $83,755 $105,474 $219,191 $82,431 $101,080 $205,355
Median Total Spending (2003) $81,578 $68,816 $240,964 $72,421 $88,588 $190,968
Median Program Spending (2003) $58,000 $32,680 $164,988 $43,993 $58,527 $146,580
Median Total Assets (2003) $206,415 $149,235 $613,504 $269,547 $277,563 $245,220
Median Net Assets (2003) $140,170 $149,235 $336,571 $232,815 $214,213 $144,551
For Organizations Filing in 1989 and 2003
Number of Organizations 11 6 25 18 60 2,267
Average Nominal Total Revenue (1989) $357,400 $1,229,488 $3,615,872 $382,728 $1,813,441 $5,585,502
Average Real Total Revenue (1989) $589,016 $2,026,272 $5,959,180 $630,760 $2,988,663 $9,205,252
Average Total Revenue (2003) $577,614 $1,720,096 $3,798,128 $1,667,684 $2,360,764 $14,217,180
Median Annual Real Revenue Growth Rate 0.6% 1.2% -2.7% -2.6% -2.1% 1.3%
Average Actual Total Spending (1989) $233,805 $535,181 $3,292,383 $113,098 $1,502,138 $5,009,415
Average Real Total Spending (1989) $385,326 $882,012 $5,426,050 $186,393 $2,475,616 $8,255,824
Average Total Spending (2003) $591,241 $1,199,266 $4,250,915 $603,836 $2,180,686 $13,341,175
Median Annual Total Real Spending Growth Rate 5.2% 1.3% -2.1% 1.0% -1.0% 2.1%
Nonprofit Subsector Analysis
Total Subsector Revenues $40,700,126 $152,542,274 $180,734,336 $94,094,636 $468,071,372 $50,810,847,223
Total Subsector Assets $87,487,400 $877,463,187 $602,790,092 $345,280,912 $1,913,021,591 $152,426,445,820
Total Subsector Spending $40,957,584 $115,516,329 $198,586,982 $64,271,317 $419,332,212 $47,866,114,000
Total Subsector Program Spending $34,269,957 $100,193,523 $166,585,466 $51,062,970 $352,111,916 $40,927,042,401
Budget Size Categories (based on total spending)
<250K 48 49 36 134 267 4,574
250K–1M 9 11 15 25 60 1,747
1–5M 13 4 13 20 50 1,138
5–10M 1 2 3 0 6 351
10–50M 0 1 2 0 3 365
>50M 0 1 1 0 2 137

77p a s s i o n & p u r p o s e : R a i s i n g t h e F i s c a l F i t n e s s B a r f o r M a s s a c h u s e t t s N o n p r o f i t s
TABLE 3.9
Industry Sector: Philanthropy (continued)
Funding Mix (% total revenues)Private
FoundationsPublic
FoundationsFederated
Giving
Support, Voluntarism
& OtherTotal
Philanthropy Total MA
Contributions 54.9% 72.0% 71.5% 48.9% 58.1% 42.0%
Government Funding 2.9% 1.1% 0.2% 1.4% 1.4% 8.8%
Program Service Revenue 16.6% 6.5% 4.3% 6.5% 8.0% 44.9%
Membership Dues 0.9% 0.2% 3.4% 1.3% 1.4% 5.6%
Investment Income 11.8% 6.3% 7.9% 28.5% 17.8% -1.7%
Other Income 15.8% 15.0% 12.8% 14.8% 14.7% 9.1%
2003 Ratios (medians unless otherwise noted)
liquidity
Inverse Current Ratio 0.0 0.0 0.03 0.0 0.0 0.11
Net Working Capital $49,396 $39,054 $145,127 $30,630 $40,555 $56,058
Days Cash on Hand 134.3 124.8 49.2 85.2 86.9 56.7
Days Receivables on Hand 0.0 0.0 20.4 0.0 0.0 0.0
Days Inventory and Payables On Hand 0.0 0.0 0.0 0.0 0.0 0.0
Days Bills Outstanding 0.0 0.0 1.5 0.0 0.0 2.6
Days Deferred Revenue Paid 0.0 0.0 0.0 0.0 0.0 0.0
Net Operating Cycle 134.3 124.8 68.1 85.2 86.9 54.2
Balance Sheet Strength (averages)
Dominant Asset Cash Cash Cash Security Cash Cash
As % Total Assets 43.1% 39.7% 26.3% 34.5% 35.3% 33.3%
Cash-to-Assets 43.1% 39.7% 26.3% 34.0% 35.3% 33.3%
Other Current Assets-to-Assets 3.4% 2.8% 17.2% 5.1% 6.6% 10.1%
Loans Receivable-to-Assets 1.2% 0.4% 1.0% 1.1% 1.0% 0.9%
Investments-to-Assets 19.0% 18.6% 22.5% 34.5% 26.6% 10.4%
Fixed Assets-to-Assets 11.1% 3.5% 5.2% 3.3% 5.1% 21.1%
Payables-to-Assets 5.9% 2.8% 9.3% 7.4% 6.7% 10.4%
Deferred Revenues-to-Assets 1.0% 0.0% 0.8% 1.0% 0.8% 3.1%
Related Party Loans-to-Assets 0.0% 0.0% 0.1% 0.0% 0.0% 4.3%
Bonds and Mortgages-to-Assets 3.9% 1.0% 2.4% 0.8% 1.7% 11.6%
Liabilities-to-Assets 11.2% 7.0% 22.5% 12.3% 13.0% 49.4%
Assets-to-Revenues 100.1% 158.1% 136.2% 150.8% 134.8% 87.8%
Profitability
Dominant Revenue Cont Cont Cont Cont Cont PSR
As % Total Revenue 54.9% 72.0% 71.5% 48.9% 58.1% 44.9%
Dominant Expense Grants Grants Grants Grants Grants Comp
As % Total Expenses 36.7% 38.7% 47.1% 46.4% 43.4% 28.3%
Surplus Margin 1.2% 8.4% -0.2% 3.3% 2.0% 2.0%
Total Comp. as % Total Expenses 16.4% 6.2% 10.1% 8.9% 10.0% 28.3%
% of Orgs with Employees 42.3% 22.1% 55.7% 33.5% 37.1% 57.1%
Efficiency
Administrative Cost Ratio 2.4% 2.3% 7.8% 6.5% 5.3% 9.1%
Program Efficiency 85.0% 77.7% 79.9% 74.7% 79.4% 79.3%
Fundraising Efficiency 0.0% 0.0% 3.3% 0.0% 0.0% 0.0%
Comp = Compensation; Cont = Contributions; Grants = Grants Expense; PSR = Program Service Revenue; Security = Investment Securities

78 u n d e r s t a n d i n g B o s t o n
TABLE 3.10
Industry Sector: Other Nonprofits
Demographic StatisticsInternational
& Foreign Religion Other Total Other Total MA
Number of Organizations (1989) 65 77 47 189 3,525
Number of Organizations (2003) 182 184 58 424 8,312
Annual Growth Rate in Number of Organizations 7.6% 6.4% 1.5% 5.9% 6.3%
Average Total Revenue (2003) $2,191,871 $413,805 $1,690,363 $1,351,655 $6,112,951
Average Total Spending (2003) $2,173,977 $392,463 $1,391,054 $1,293,769 $5,758,676
Average Program Spending (2003) $1,879,591 $292,043 $1,163,992 $1,092,766 $4,923,850
Average Total Assets (2003) $3,283,931 $963,199 $5,473,835 $2,576,383 $18,338,119
Average Net Assets (2003) $2,386,513 $864,186 $4,765,859 $2,051,357 $10,048,501
Median Total Revenue (2003) $215,464 $111,347 $120,506 $153,892 $205,355
Median Total Spending (2003) $205,422 $107,158 $121,563 $151,176 $190,968
Median Program Spending (2003) $183,136 $68,874 $101,451 $120,053 $146,580
Median Total Assets (2003) $160,155 $119,542 $221,988 $147,627 $245,220
Median Net Assets (2003) $122,016 $103,086 $173,534 $117,480 $144,551
For Organizations Filing in 1989 and 2003
Number of Organizations 43 43 17 103 2,267
Average Nominal Total Revenue (1989) $1,390,019 $299,530 $222,398 $738,681 $5,585,502
Average Real Total Revenue (1989) $2,290,837 $493,644 $366,526 $1,217,392 $9,205,252
Average Total Revenue (2003) $2,365,363 $445,123 $575,409 $1,268,280 $14,217,180
Median Annual Real Revenue Growth Rate 0.7% -1.6% 3.2% -0.6% 1.3%
Average Actual Total Spending (1989) $1,132,975 $221,776 $202,451 $598,990 $5,009,415
Average Real Total Spending (1989) $1,867,212 $365,501 $333,651 $987,172 $8,255,824
Average Total Spending (2003) $2,404,784 $466,098 $514,554 $1,283,450 $13,341,175
Median Annual Total Real Spending Growth Rate 1.6% 1.8% 3.6% 1.8% 2.1%
Nonprofit Subsector Analysis
Total Subsector Revenues $398,920,590 $76,140,176 $98,041,037 $573,101,803 $50,810,847,223
Total Subsector Assets $597,675,479 $177,228,705 $317,482,413 $1,092,386,597 $152,426,445,820
Total Subsector Spending $395,663,899 $72,213,224 $80,681,132 $548,558,255 $47,866,114,000
Total Subsector Program Spending $342,085,553 $53,735,927 $67,511,515 $463,332,995 $40,927,042,401
Budget Size Categories (based on total spending)
<250K 101 128 35 264 4,574
250K–1M 33 43 13 89 1,747
1–5M 33 12 6 51 1,138
5–10M 7 0 2 9 351
10–50M 7 1 2 10 365
>50M 1 0 0 1 137

79p a s s i o n & p u r p o s e : R a i s i n g t h e F i s c a l F i t n e s s B a r f o r M a s s a c h u s e t t s N o n p r o f i t s
TABLE 3.10
Industry Sector: Other Nonprofits (continued)
Funding Mix (% total revenues)International
& Foreign Religion Other Total Other Total MA
Contributions 67.4% 57.6% 46.7% 60.3% 42.0%
Government Funding 3.1% 1.4% 9.5% 3.3% 8.8%
Program Service Revenue 22.7% 20.6% 21.9% 21.7% 44.9%
Membership Dues 2.2% 3.8% 3.9% 3.1% 5.6%
Investment Income 2.6% 9.6% 19.7% 8.0% -1.7%
Other Income 5.1% 8.4% 7.9% 6.9% 9.1%
2003 Ratios (medians unless otherwise noted)
liquidity
Inverse Current Ratio 0.09 0.02 0.01 0.03 0.11
Net Working Capital $59,007 $29,152 $27,544 $41,981 $56,058
Days Cash on Hand 65.8 51.3 72.8 59.0 56.7
Days Receivables on Hand 0.0 0.0 0.0 0.0 0.0
Days Inventory and Payables On Hand 0.0 0.0 0.0 0.0 0.0
Days Bills Outstanding 0.9 0.0 0.0 0.0 2.6
Days Deferred Revenue Paid 0.0 0.0 0.0 0.0 0.0
Net Operating Cycle 64.9 51.3 72.8 59.0 54.2
Balance Sheet Strength (averages)
Dominant Asset Cash Cash Cash Cash Cash
As % Total Assets 44.5% 32.6% 39.5% 38.8% 33.3%
Cash-to-Assets 44.5% 32.6% 39.5% 38.8% 33.3%
Other Current Assets-to-Assets 10.9% 8.4% 9.2% 9.6% 10.1%
Loans Receivable-to-Assets 1.3% 0.4% 1.3% 0.9% 0.9%
Investments-to-Assets 15.1% 13.2% 19.1% 14.8% 10.4%
Fixed Assets-to-Assets 7.7% 19.4% 13.0% 13.4% 21.1%
Payables-to-Assets 12.3% 6.5% 6.3% 9.0% 10.4%
Deferred Revenues-to-Assets 3.4% 0.7% 1.4% 2.0% 3.1%
Related Party Loans-to-Assets 8.1% 11.6% 0.0% 8.5% 4.3%
Bonds and Mortgages-to-Assets 3.7% 8.2% 18.7% 7.7% 11.6%
Liabilities-to-Assets 30.6% 79.4% 30.3% 51.2% 49.4%
Assets-to-Revenues 72.8% 82.8% 89.7% 77.2% 87.8%
Profitability
Dominant Revenue Cont Cont Cont Cont PSR
As % Total Revenue 67.4% 57.6% 46.7% 60.3% 44.9%
Dominant Expense Comp Comp Comp Comp Comp
As % Total Expenses 20.2% 19.7% 31.6% 21.5% 28.3%
Surplus Margin 1.2% 2.9% 2.2% 2.0% 2.0%
Total Comp. as % Total Expenses 20.2% 19.7% 31.6% 21.5% 28.3%
% of Orgs with Employees 59.9% 50.5% 58.6% 55.7% 57.1%
Efficiency
Administrative Cost Ratio 9.9% 7.3% 10.0% 9.5% 9.1%
Program Efficiency 81.0% 74.4% 78.5% 77.9% 79.3%
Fundraising Efficiency 0.0% 0.0% 0.0% 0.0% 0.0%
Comp = Compensation; Cont = Contributions; PSR = Program Service Revenue

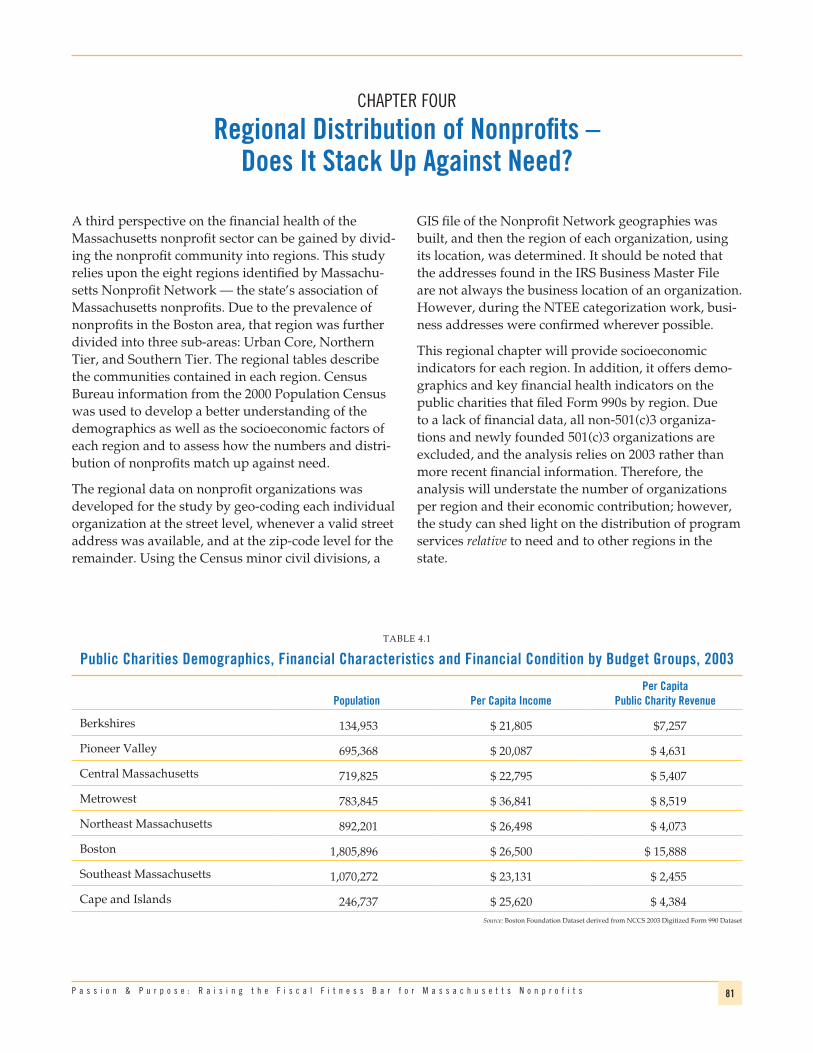
81p a s s i o n & p u r p o s e : R a i s i n g t h e F i s c a l F i t n e s s B a r f o r M a s s a c h u s e t t s N o n p r o f i t s
A third perspective on the financial health of the Massachusetts nonprofit sector can be gained by divid-ing the nonprofit community into regions. This study relies upon the eight regions identified by Massachu-setts Nonprofit Network — the state’s association of Massachusetts nonprofits. Due to the prevalence of nonprofits in the Boston area, that region was further divided into three sub-areas: Urban Core, Northern Tier, and Southern Tier. The regional tables describe the communities contained in each region. Census Bureau information from the 2000 Population Census was used to develop a better understanding of the demographics as well as the socioeconomic factors of each region and to assess how the numbers and distri-bution of nonprofits match up against need.
The regional data on nonprofit organizations was developed for the study by geo-coding each individual organization at the street level, whenever a valid street address was available, and at the zip-code level for the remainder. Using the Census minor civil divisions, a
GIS file of the Nonprofit Network geographies was built, and then the region of each organization, using its location, was determined. It should be noted that the addresses found in the IRS Business Master File are not always the business location of an organization. However, during the NTEE categorization work, busi-ness addresses were confirmed wherever possible.
This regional chapter will provide socioeconomic indicators for each region. In addition, it offers demo-graphics and key financial health indicators on the public charities that filed Form 990s by region. Due to a lack of financial data, all non-501(c)3 organiza-tions and newly founded 501(c)3 organizations are excluded, and the analysis relies on 2003 rather than more recent financial information. Therefore, the analysis will understate the number of organizations per region and their economic contribution; however, the study can shed light on the distribution of program services relative to need and to other regions in the state.
ChapteR FOuR
Regional Distribution of Nonprofits – Does It Stack Up Against Need?
TABLE 4.1
Public Charities Demographics, Financial Characteristics and Financial Condition by Budget Groups, 2003
Population Per Capita Income
Per Capita Public Charity Revenue
Berkshires 134,953 $ 21,805 $7,257
Pioneer Valley 695,368 $ 20,087 $ 4,631
Central Massachusetts 719,825 $ 22,795 $ 5,407
Metrowest 783,845 $ 36,841 $ 8,519
Northeast Massachusetts 892,201 $ 26,498 $ 4,073
Boston 1,805,896 $ 26,500 $ 15,888
Southeast Massachusetts 1,070,272 $ 23,131 $ 2,455
Cape and Islands 246,737 $ 25,620 $ 4,384Source: Boston Foundation Dataset derived from NCCS 2003 Digitized Form 990 Dataset

82 u n d e r s t a n d i n g B o s t o n
Arts organizations abound in this part of the state, constituting almost 20% of all nonprofits as compared to 13% in the state as a whole. The region has a heavy concentration of Arts organizations, more than twice what is expected based on population size, and per capita arts spending is high at $377 per person as compared to $191 per capita across the state. Spending by Human Services organizations and Philanthropic organizations is also relatively high. Human Services organizations spend 50% more in the Berkshires than is spent throughout the state.
From a financial health perspective, this region’s nonprofits are relatively more leveraged with short- and long-term debt and hold less cash relative to expenses than other nonprofits in the state. This phenomenon is due primarily to organizations being less financially strong than their industry peers in other parts of the state. The difference is particularly pronounced in the Arts and Health Care sub-sectors. Despite the higher leverage, current profitability is comparable to the rest of the state with Community Capacity, Housing and Human Services organizations exhibiting higher than expected surplus margins. Berk-shire nonprofits face a fundraising challenge due to the relatively high number of nonprofits that compete for local philanthropic, business, and individual donations.
The Berkshires represents the most western portion of the state and includes Pittsfield, Williamstown, North Adams, and Great Barrington. A mere 2.1% of the state’s population live in the Berkshires year-round, but the population swells in the summer months as vacationers are attracted to the summer arts and cultural offerings. It is not surprising, then, that 4.8% of the state’s arts and cultural organizations are based in this section of the state. The nonprofits are on aver-age larger than in most sections of the state. While more profitable, the median nonprofit in the Berkshires is relatively more heavily indebted, particularly with bank loans, and less liquid than its counterparts in the rest of the state, meaning that these organizations are less financially stable on most dimensions.
On a per capita basis, Berkshire residents earn $21,805, only 84% of the income of the average state resident. The unemployment rate of 5.1% is 12% higher than the state average. The region’s other demographics mirror rather closely the full state, with 9.0% of residents living under the poverty level, and its proportionate share of youth and the elderly. Ethnically, it is the least diverse section of the state.
The Berkshires nonprofit sector is vibrant with more than two nonprofits per thousand. Total sector spend-ing in the Berkshires is $936 million. Of the 274 nonprofit organizations filing Form 990s, the median nonprofit spends $468,000 annually with median assets of just over $200,000. This is the highest median asset size in the state. The spending by nonprofits in the Berkshires is $6,940 per capita, 92% of the $7,539 spent throughout the Commonwealth. The distribution of spending is highly skewed: Williams College accounts for 16% of the total spending and 74% of the total assets of nonprofits in the region.
Berkshires: A Dynamic Arts Sector

83p a s s i o n & p u r p o s e : R a i s i n g t h e F i s c a l F i t n e s s B a r f o r M a s s a c h u s e t t s N o n p r o f i t s
Nonprofit Industry SectorsOrganization
Count
Inverse Current
RatioMonths Cash
on Hand leverageSurplus Margin
Per Capita Total
Revenues
Per Capita
Spending
Per Capita Program Expenses
Per Capita Total Assets
Arts, Culture & Humanities 54 0.17 35.3 0.04 2.0% $520 $377 $263 $3,013
Community Capacity 18 0.07 9.8 0.05 4.9% $34 $34 $28 $44
Education, Science, Technology & Social Sciences 45 0.13 45.7 0.08 2.9% $1,757 $1,666 $1,331 $14,015
of which: Large Organizations 1 0.14 295.9 0.14 9.8% $1,206 $1,087 $890 $11,800
Environment and Animal-Related 18 0.02 77.3 0.00 9.4% $42 $39 $27 $143
Health Care & Medical 51 0.48 14.6 0.57 1.8% $3,749 $2,186 $1,916 $2,140
Housing & Shelter 13 0.32 37.7 0.30 1.0% $78 $70 $62 $125
Human Services 38 0.28 37.1 0.32 2.9% $820 $827 $746 $1,090
Other 8 0.31 4.6 0.05 1.2% $11 $11 $8 $10
Philanthropy 11 0.27 21.1 0.05 0.3% $160 $118 $102 $448
Youth Development, Sports & Recreation 18 0.17 35.6 0.07 -0.5% $86 $74 $56 $215
Total 274 0.20 29.4 0.14 1.9% $7,257 $6,940 $5,816 $23,178
Source: Boston Foundation Dataset derived from NCCS 2003 Digitized Form 990 Dataset
Regional Breakdown: Berkshires
Communities
Adams, Alford, Becket, Cheshire, Clarksburg, Dalton, Egremont, Florida, Great Barrington, Hancock, Hinsdale, Lanesborough, Lee, Lenox, Monterey, Mount Washington, New Ashford, New Marlborough, North Adams, Otis, Peru, Pittsfield, Richmond, Sandisfield, Savoy, Sheffield, Stockbridge, Tyringham, Washington, West Stockbridge, Williamstown, Windsor
2000 Census Bureau Information: Region Massachusetts
Population: 134,953 6,349,097
Per Capita Income: $21,805 $25,952
Percent of Population Under Poverty Level: 9.0% 9.0%
Unemployment Rate 5.1% 4.6%
Percent of Population Under 20: 25.3% 26.4%
Percent of Population 65 or Older: 17.9% 13.5%
Ethnic Breakdown:
White 95.0% 86.5%
Black 2.0% 5.5%
Native American 0.1% 0.2%
Asian 1.0% 3.8%
Other 0.6% 3.9%
Hispanic (contained in the other categories) 1.7% 6.8%
2003 NCCS Digitized Data Region Massachusetts
Nonprofit Profile on Per Capita Basis:
Number of Organizations (per thousand) 2.0 1.3
Revenue $7,257 $8,003
Total Spending $6,940 $7,539
Program Spending $5,816 $6,446
Total Assets $23,178 $24,008
Nonprofit Total Revenue for Region $979,347,182
Nonprofit Total Spending For Region $936,525,185

84 u n d e r s t a n d i n g B o s t o n
are not available, it is clear that these 25 organizations constitute the majority of nonprofit employment in the Greater Boston area. They include the two largest nonprofits in the Education and Health Care fields, Harvard University and General Hospital Corporation (including Massachusetts General Hospital). Due to the high level of endowments at several universities and hospitals, spending is low relative to assets and the per capita assets of this region’s nonprofits are $64,947, more than 270% of the state average.
Although one thinks of Boston as having a relatively high density of colleges and universities, the distribu-tion of nonprofits by industry within Greater Boston essentially mirrors that of the whole state. It does have a modestly higher number of health care organizations and fewer sports and youth groups. In terms of budget size, the median-sized organization in each subgroup is larger than in other regions with budgets that are just over $300,000. By asset size, Greater Boston is the second highest region with a median size of just over $350,000 in total assets. The low asset size of nonprofits in the Northern and Southern Tiers is offset by the extensive assets held by nonprofits in the Urban Core.
The overall financial health of Boston nonprofits largely reflects that of the state as a whole, although the surplus margin was thinner. Arts, Environmental groups, and Human Service organizations operated less profitability than their out-of-town counterparts. Also, Arts, Environmental, Educational, and “other” organizations reported high short- and long-term debt, reflecting both a greater ability to borrow and heavier investments in buildings than their peers outside of Boston.
Greater Boston is situated on the eastern coast of Massachusetts. For purposes of this study, it has been divided into three rather distinct geographic areas: Urban Core, Northern Tier, and Southern Tier. This region constitutes 28% of the population of the Commonwealth but a disproportionate share of the state’s nonprofit organizations (37%), particularly in the Housing, Community Capacity, Philanthropy, and Health Care fields. With twenty-five large and promi-nent educational and health care organizations serving communities well beyond Boston, this local nonprofit sector is a substantial contributor to the economic vital-ity of the region. In 2003, the Greater Boston nonprofit sector’s 3,108 organizations held $117 billion in total assets, generated $28.7 billion in revenues, and spent $26.4 billion a year in this region.
Overall, Greater Boston’s population is moderately better off economically than the rest of the state, with per capita income of 2% over the rest of the state, yet there is substantially more economic inequity. However, 11.6% of its population lives under the poverty level in contrast to the 9% exhibited through-out the state. Additionally, Greater Boston reports unemployment rates nominally above the norm with modestly fewer elderly residents and children than other portions of the state. This region is the most ethnically diverse in the state.
The Greater Boston nonprofit sector is relatively wealthy and spends accordingly. There are 1.7 nonprofits per thousand residents in Boston, 31% higher than nonprofit concentration in the whole state. Total spending per capita is $14,621, 94% higher than the statewide spending figure. Stated differently, 28% of the population lives in Greater Boston, yet is the source of 55% of the state’s nonprofit spending due primarily to its heavy concentration of large universi-ties and hospitals.
Greater Boston is home to 25 large organizations — ABCD, in the area of community capacity, 12 universi-ties and 12 hospitals — whose services stretch outside Boston benefiting students, patients, and clients worldwide. These organizations account for 60% of the revenues and spending in the Boston region and 80% of the total assets. While current employment figures
Greater Boston: Resource Rich and Spending Accordingly

85p a s s i o n & p u r p o s e : R a i s i n g t h e F i s c a l F i t n e s s B a r f o r M a s s a c h u s e t t s N o n p r o f i t s
Nonprofit Industry SectorsOrganization
Count
Inverse Current
RatioMonths Cash
on Hand leverageSurplus Margin
Per Capita Total
Revenues
Per Capita
Spending
Per Capita Program Expenses
Per Capita Total Assets
Arts, Culture & Humanities 421 0.10 57.2 0.04 1.0% $523 $500 $384 $1,593
Community Capacity 298 0.10 66.7 0.11 0.4% $598 $611 $556 $2,143
of which: Large Organizations 1 0.44 1.0 0.00 -12.6% $294 $331 $326 $1,355
Education, Science, Technology & Social Sciences 578 0.14 76.1 0.10 2.7% $5,976 $4,981 $4,107 $48,671
of which: Large Organizations 12 0.62 4.2 0.32 3.7% $5,076 $4,116 $3,437 $44,805
Environment and Animal-Related 85 0.05 53.8 0.02 2.4% $95 $96 $81 $263
Health Care & Medical 501 0.21 56.3 0.23 0.7% $7,248 $7,053 $6,023 $9,572
of which: Large Organizations 12 0.46 9.8 0.53 2.7% $4,359 $4,193 $3,603 $5,703
Housing & Shelter 235 0.29 62.0 0.64 0.9% $230 $211 $189 $760
Human Services 387 0.20 50.2 0.20 0.6% $628 $612 $534 $617
Other 196 0.08 64.7 0.03 2.0% $244 $231 $198 $452
Philanthropy 171 0.00 79.4 0.00 1.2% $182 $165 $140 $734
Youth Development, Sports & Recreation 236 0.02 45.0 0.01 3.2% $165 $161 $143 $141
Total 3,108 0.13 61.7 0.11 1.5% $15,889 $14,621 $12,354 $64,947
Source: Boston Foundation Dataset derived from NCCS 2003 Digitized Form 990 Dataset
Regional Breakdown: Greater Boston
Communities
Arlington, Belmont, Boston, Braintree, Brookline, Cambridge, Chelsea, Cohasset, Everett, Hingham, Holbrook, Hull, Lynn, Lynnfield, Malden, Marblehead, Medford, Melrose, Milton, Nahant, Peabody, Quincy, Randolph, Revere, Salem, Saugus, Somerville, Stoneham, Swampscott, Wakefield, Watertown, Weymouth, Winchester, Winthrop
2000 Census Bureau Information: Region Massachusetts
Population: 1,805,896 6,349,097
Per Capita Income: $26,500 $25,952
Percent of Population Under Poverty Level: 11.6% 9.0%
Unemployment Rate 5.0% 4.6%
Percent of Population Under 20: 23.2% 26.4%
Percent of Population 65 or Older: 13.2% 13.5%
Ethnic Breakdown:
White 73.6% 86.5%
Black 11.6% 5.5%
Native American 0.3% 0.2%
Asian 6.6% 3.8%
Other 4.6% 3.9%
Hispanic (contained in the other categories) 9.0% 6.8%
2003 NCCS Digitized Data Region Massachusetts
Nonprofit Profile on Per Capita Basis:
Number of Organizations (per thousand) 1.7 1.3
Revenue $15,889 $8,003
Total Spending $14,621 $7,539
Program Spending $12,354 $6,446
Total Assets $64,947 $24,008
Nonprofit Total Revenue for Region $28,693,094,646
Nonprofit Total Spending For Region $26,404,892,252

86 u n d e r s t a n d i n g B o s t o n
The Urban Core has 25 large organizations (12 each in Education and Health Care and one in the Community capacity arena). These large organizations are respon-sible for 64% of the Urban Core spending, with the two largest universities (Harvard University and MIT) accounting for 10% and 7% of the region’s nonprofit spending, respectively, and the two largest health care organizations (Massachusetts General Hospital and Brigham and Women’s) contributing an additional 6% and 5%, respectively. The remaining large organiza-tions represent 34% of the region’s nonprofit spending. The large nonprofits have considerable endowments, so the $95,073 in total assets per capita is held by Harvard University (at 56%) with 28% held by 24 other large organizations combined.
To better determine the financial health of the full Urban Core nonprofit sector, median ratios were examined. The median organizations were modestly more leveraged and liquid but less profitable than the nonprofits in other parts of the state. Certain sectors (such as the Arts, Education and Environmental agencies) have been better able to borrow both on short and longer terms. Several sectors exhibited low surplus margins of under 0.5%, including the Human Services, Community Capacity, and Philanthropic organizations.
Boston’s Urban Core is the most heavily populated with 19% of the population of the Commonwealth. Identified in this study as a sub-region of Greater Boston, the Urban Core appears to be economically on par with the rest of the state with per capita income equal to 99% of the state average. However, this statis-tic fails to reveal the high economic disparity in the region. Unemployment is 24% higher in this region, and 60% more people live under the poverty level. Due to the heavy college-aged student population, the percentage of children and the elderly in this area is relatively small. The population is quite diverse with an above average concentration of African Americans, Latinos and Asians.
Overall, the nonprofit sector in the Urban Core is quite wealthy, and it spends heavily. The 2,556 nonprofits in the region held $114.0 billion in total assets, generated $26.8 billion in revenues, and spent $24.6 billion a year in this region. There are 2.2 nonprofits per thousand residents in Boston, 68% higher than nonprofit concentration in the whole state. Total spending per capita is $20,893, 177% higher than the statewide spending figure. Stated differently, 19% of the population lives in the urban core of Boston, yet is the source of 51% of the state’s nonprofit spending. This heavy per capita spending is manifest in all sectors, not simply in the Education and Health Care sub-sectors. Even Human Services, a relatively weaker sub-sector, has spending at 50% higher than the state average. Even more dramatic is the total asset concentration. Per capita assets equal $95,073, more than four times the state average.
Boston Urban Core: The Nonprofit Asset Hub with Highly Diverse Demographics and Inequitable Distribution of Services

87p a s s i o n & p u r p o s e : R a i s i n g t h e F i s c a l F i t n e s s B a r f o r M a s s a c h u s e t t s N o n p r o f i t s
Nonprofit Industry SectorsOrganization
Count
Inverse Current
RatioMonths Cash
on Hand leverageSurplus Margin
Per Capita Total
Revenues
Per Capita
Spending
Per Capita Program Expenses
Per Capita Total Assets
Arts, Culture & Humanities 352 0.11 55.9 0.05 1.0% $743 $721 $558 $2,219
Community Capacity 254 0.11 68.8 0.15 0.4% $791 $818 $753 $3,149
of which: Large Organizations 1 0.44 1.0 0.00 -12.6% $451 $508 $500 $2,090
Education, Science, Technology & Social Sciences 478 0.15 78.4 0.12 2.7% $9,028 $7,504 $6,189 $74,023
of which: Large Organizations 12 0.62 4.2 0.32 3.7% $7,798 $6,323 $5,281 $68,835
Environment and Animal-Related 67 0.05 64.1 0.04 2.2% $142 $144 $122 $395
Health Care & Medical 441 0.21 58.9 0.24 0.9% $10,110 $9,796 $8,408 $13,751
of which: Large Organizations 12 0.46 9.8 0.53 2.7% $6,698 $6,441 $5,535 $8,762
Housing & Shelter 184 0.29 66.0 0.64 0.9% $288 $266 $240 $774
Human Services 317 0.21 47.8 0.21 0.2% $835 $819 $715 $842
Other 175 0.10 67.3 0.04 1.6% $369 $350 $301 $683
Philanthropy 136 0.00 93.9 0.00 0.5% $251 $240 $205 $1,045
Youth Development, Sports & Recreation 152 0.08 45.7 0.03 2.8% $240 $234 $210 $192
Total 2,556 0.14 62.9 0.12 1.4% $22,797 $20,893 $17,702 $97,073
Source: Boston Foundation Dataset derived from NCCS 2003 Digitized Form 990 Dataset
Regional Breakdown: Greater Boston – Urban Core Subregion
Communities
Arlington, Belmont, Boston, Brookline, Cambridge, Chelsea, Everett, Malden, Medford, Revere, Somerville, Watertown, Winthrop
2000 Census Bureau Information: Region Massachusetts
Population: 1,175,458 6,349,097
Per Capita Income: $25,674 $25,952
Percent of Population Under Poverty Level: 14.3% 9.0%
Unemployment Rate 5.7% 4.6%
Percent of Population Under 20: 22.4% 26.4%
Percent of Population 65 or Older: 11.9% 13.5%
Ethnic Breakdown:
White 66.6% 86.5%
Black 15.7% 5.5%
Native American 0.3% 0.2%
Asian 7.6% 3.8%
Other 5.8% 3.9%
Hispanic (contained in the other categories) 11.3% 6.8%
2003 NCCS Digitized Data Region Massachusetts
Nonprofit Profile on Per Capita Basis:
Number of Organizations (per thousand) 2.2 1.3
Revenue $22,797 $8,003
Total Spending $20,893 $7,539
Program Spending $17,702 $6,446
Total Assets $97,073 $24,008
Nonprofit Total Revenue for Region $26,797,421,524
Nonprofit Total Spending For Region $24,559,135,026

88 u n d e r s t a n d i n g B o s t o n
The nonprofits in Greater Boston’s Northern Tier have little liquidity and have access to little short-term or long-term debt and are relatively less profitable. Health Care is particularly weak with less than one month of cash on hand and operating losses. Several other sub-sectors are also stressed: Arts and Human Service organizations have surplus margins under 0.5%, while housing and philanthropic groups have at or below one month of cash on hand.
Greater Boston’s Northern Tier lies directly north of downtown Boston and includes Lynn, Salem, and Peabody. It represents 7% of the population of the Commonwealth yet fewer than 4% of the nonprofits. The region is economically stronger than the state overall, yet its nonprofit sector is among the least developed. Nonprofit spending by the region’s 303 nonprofits is just $958 million with revenues of $975 million, equal to only 2% of the statewide activity.
A healthier economic outlook may be one explanation for the small nonprofit sector, but proximity to the Urban Core may be another important one. Per capita income in Boston’s Northern Tier is 6% higher than the state average, with poverty and unemployment levels at just over 80% of that exhibited throughout the state. While demographically not diverse, the region shows some over-representation of Asians and the elderly and a slight under-representation of children.
The nonprofit sector in the Northern Tier is meager. There are 0.7 nonprofits per thousand residents in this area, about half the nonprofit concentration in the whole state. Housing and shelter are relatively active in this region, while Education and the Environment are particularly small in size. Total spending per capita is $2,194, a mere 29% of the statewide spending figure. Even more remarkable is the lack of investment in these nonprofits. Per capita total assets are only $3,159, which is only 13% of the levels produced throughout the state. The median nonprofit in the Northern Tier has a very small budget of under $130,000 and assets of under $170,000, surpassed by all other regions except the Cape (in terms of budget) and Metrowest (in terms of assets).
Greater Boston Northern Tier: Economically Robust Region with Few Nonprofit Resources

89p a s s i o n & p u r p o s e : R a i s i n g t h e F i s c a l F i t n e s s B a r f o r M a s s a c h u s e t t s N o n p r o f i t s
Nonprofit Industry SectorsOrganization
Count
Inverse Current
RatioMonths Cash
on Hand leverageSurplus Margin
Per Capita Total
Revenues
Per Capita
Spending
Per Capita Program Expenses
Per Capita Total Assets
Arts, Culture & Humanities 42 0.08 68.5 0.02 0.4% $102 $70 $35 $523
Community Capacity 25 0.04 54.0 0.00 2.7% $69 $69 $62 $22
Education, Science, Technology & Social Sciences 49 0.00 59.4 0.00 5.5% $58 $52 $41 $124
Environment and Animal-Related 8 0.10 45.6 0.00 1.9% $6 $5 $3 $12
Health Care & Medical 37 0.25 29.0 0.15 -1.2% $1,574 $1,631 $1,305 $1,461
Housing & Shelter 26 0.13 31.8 0.62 1.0% $93 $90 $78 $616
Human Services 43 0.18 61.2 0.17 0.3% $234 $223 $194 $162
Other 6 0.02 81.1 0.02 4.2% $6 $6 $4 $4
Philanthropy 21 0.00 15.1 0.00 17.0% $73 $29 $23 $216
Youth Development, Sports & Recreation 46 0.00 26.3 0.00 2.6% $18 $18 $13 $18
Total 303 0.05 38.7 0.01 1.5% $2,234 $2,194 $1,756 $3,159
Source: Boston Foundation Dataset derived from NCCS 2003 Digitized Form 990 Dataset
Regional Breakdown: Greater Boston – Northern Tier Subregion
Communities
Lynn, Lynnfield, Marblehead, Melrose, Nahant, Peabody, Quincy, Salem, Saugus, Stoneham, Swampscott, Wakefield, Winchester
2000 Census Bureau Information: Region Massachusetts
Population: 436,619 6,349,097
Per Capita Income: $27,443 $25,952
Percent of Population Under Poverty Level: 7.6% 9.0%
Unemployment Rate 3.8% 4.6%
Percent of Population Under 20: 24.2% 26.4%
Percent of Population 65 or Older: 15.7% 13.5%
Ethnic Breakdown:
White 85.8% 86.5%
Black 3.2% 5.5%
Native American 0.2% 0.2%
Asian 5.5% 3.8%
Other 3.1% 3.9%
Hispanic (contained in the other categories) 6.0% 6.8%
2003 NCCS Digitized Data Region Massachusetts
Nonprofit Profile on Per Capita Basis:
Number of Organizations (per thousand) 0.7 1.3
Revenue $2,234 $8,003
Total Spending $2,194 $7,539
Program Spending $1,756 $6,446
Total Assets $3,159 $24,008
Nonprofit Total Revenue for Region $975,383,483
Nonprofit Total Spending For Region $957,923,672

90 u n d e r s t a n d i n g B o s t o n
The nonprofits in Greater Boston’s Southern Tier are small in size but have lower leverage and liquidity and higher profitability. Environmental groups have little cash on hand. Housing organizations appear stressed with median annual losses of 3.4% and about 50 days of cash on hand. Community Capacity organizations also have low surplus margins (0.3%) but leverage and liquidity roughly on par with its peers.
Greater Boston’s Southern Tier includes Braintree, Milton and Cohasset and represents 3.1% of the population of the Commonwealth. The region is economically stronger than the state overall, yet its nonprofit sector is moderately underdeveloped. Nonprofit spending by the region’s 249 nonprofits is just $888 million with revenues of $920 million, equal to only 2% of the statewide activity.
Socioeconomic indicators suggest a region that is stronger than most parts of the state. Per capita income is 13% higher than the state average. The poverty and unemployment levels are much lower than expected at 50% and 72%, respectively, of state levels. The popula-tion reflects the state average for children and slightly more for the elderly. The ethnic diversity of the state is closely reflected in the southern tier region.
Interestingly, the region has relatively low poverty and unemployment rates yet a strong focus on hous-ing and human services. The housing nonprofits represent 5.3% of the state total and human services 4.7%, although the region is the home to only 3.1% of the total population. While the overall number of nonprofits per capita matches that of the state, South-ern Tier spending per capita is low. The absence of any large Educational or Health Care organizations could be one explanation for the low nonprofit spending per capita, at $4,581, just 61% of the state norm. The investment in the region is even lower with per capita total assets at only $9,301, which is 39% of state levels. Community Capacity organizations spend $575 per capita, close to three times the spending for this type of nonprofit throughout the state. The Housing and Shel-ter segments spend 40% more than their state coun-terparts. The Environment and Philanthropy spend relatively little in the sector.
Greater Boston Southern Tier: Economically Strong and Focused on Housing and Human Services

91p a s s i o n & p u r p o s e : R a i s i n g t h e F i s c a l F i t n e s s B a r f o r M a s s a c h u s e t t s N o n p r o f i t s
Nonprofit Industry SectorsOrganization
Count
Inverse Current
RatioMonths Cash
on Hand leverageSurplus Margin
Per Capita Total
Revenues
Per Capita
Spending
Per Capita Program Expenses
Per Capita Total Assets
Arts, Culture & Humanities 27 0.08 90.1 0.00 4.7% $133 $129 $109 $210
Community Capacity 19 0.16 64.6 0.29 0.3% $618 $575 $475 $821
Education, Science, Technology & Social Sciences 51 0.07 66.7 0.07 2.0% $793 $786 $638 $4,286
Environment and Animal-Related 10 0.04 0.0 0.00 3.7% $8 $9 $3 $28
Health Care & Medical 23 0.19 51.9 0.18 1.9% $2,668 $2,631 $2,182 $2,497
Housing & Shelter 25 0.38 48.8 0.88 -3.4% $190 $146 $130 $993
Human Services 27 0.12 67.5 0.15 4.7% $259 $231 $201 $282
Other 15 0.00 19.5 0.00 4.1% $19 $20 $15 $64
Philanthropy 14 0.00 155.7 0.00 2.1% $13 $12 $10 $15
Youth Development, Sports & Recreation 38 0.00 79.2 0.00 5.7% $46 $42 $33 $104
Total 249 0.07 64.0 0.04 2.8% $4,748 $4,581 $3,796 $9,301
Source: Boston Foundation Dataset derived from NCCS 2003 Digitized Form 990 Dataset
Regional Breakdown: Greater Boston – Southern Tier Subregion
Communities
Braintree, Cohasset, Hingham, Holbrook, Hull, Milton, Randolph, Weymouth
2000 Census Bureau Information: Region Massachusetts
Population: 193,819 6,349,097
Per Capita Income: $29,385 $25,952
Percent of Population Under Poverty Level: 4.5% 9.0%
Unemployment Rate 3.3% 4.6%
Percent of Population Under 20: 25.6% 26.4%
Percent of Population 65 or Older: 15.5% 13.5%
Ethnic Breakdown:
White 88.7% 86.5%
Black 5.6% 5.5%
Native American 0.2% 0.2%
Asian 3.2% 3.8%
Other 0.9% 3.9%
Hispanic (contained in the other categories) 1.6% 6.0%
2003 NCCS Digitized Data Region Massachusetts
Nonprofit Profile on Per Capita Basis:
Number of Organizations (per thousand) 1.3 1.3
Revenue $4,748 $8,003
Total Spending $4,581 $7,539
Program Spending $3,796 $6,446
Total Assets $9,301 $24,008
Nonprofit Total Revenue for Region $920,289,639
Nonprofit Total Spending For Region $887,833,554

92 u n d e r s t a n d i n g B o s t o n
Overall, the nonprofit sector in the Cape and the Islands is large in number but quite small in terms of spending and assets. There are 2.1 nonprofits per thousand residents on the Cape, 62% higher than the nonprofit concentration in the whole state. The total spending per capita is $4,035, just 54% of the statewide spending figure. The Environmental and Animal-Related nonprofits spend considerably more (176% of the state average), while spending on Community Capacity and Philanthropy is about one-fifth of the state average. Woods Hole Oceanographic, classified as an Educational and scientific institution, and Cape Cod Healthcare represent 57% of the region’s spend-ing and 44% of its assets. Despite the high percentage of retirees in the community, the per capita health care spending on the Cape and Islands is only 60% of the statewide figure.
The median nonprofit on the Cape and the Islands is financially healthier than the state as whole. These nonprofits have relatively little debt, slightly more liquidity and a surplus margin of 4.7%, which is more than double the median state nonprofit. These trends are exhibited throughout a wide range of nonprofits on the Cape. Counter to the trend, Arts, Housing and Health Care organizations have more debt than their statewide benchmarks, Community Capacity organiza-tions have thinner surplus margins, and Housing and Educational institutions are more liquid.
The Cape and the Islands is located in the southeast corner of the state and includes considerable coastline and a number of islands. The permanent residents constitute 4% of the population of the Commonwealth; however, this region experiences a considerable popu-lation influx during the summer months. The region is economically strong relative to the rest of the state and is the home of a disproportionate share of the state’s nonprofit organizations (6%), particularly in the Environmental (14%) and Arts (9%) arenas. The 522 nonprofits in the region held $1.9 billion in total assets, generated $1.1 billion in revenues, and spent $1.0 billion a year in this region.
By most indicators, the Cape and the Islands is econom-ically on par with the rest of the state. Per capita income is at the state average, but only 6.8% of the population lives under the poverty line, well below the 9.0% of the state. This may be explained by the heavy concentra-tion of retirees in the area; 22.1% of the residents are 65 or older in comparison to the 13.5% for the whole state. There are also relatively fewer children (22.1% versus 26.4% for the state) and less ethnic diversity.
The Cape and the Islands: Modest Nonprofit Resources with a Focus on the Environment and Arts

93p a s s i o n & p u r p o s e : R a i s i n g t h e F i s c a l F i t n e s s B a r f o r M a s s a c h u s e t t s N o n p r o f i t s
Nonprofit Industry SectorsOrganization
Count
Inverse Current
RatioMonths Cash
on Hand leverageSurplus Margin
Per Capita Total
Revenues
Per Capita
Spending
Per Capita Program Expenses
Per Capita Total Assets
Arts, Culture & Humanities 104 0.02 63.7 0.01 5.7% $171 $122 $77 $499
Community Capacity 24 0.11 20.0 0.02 0.4% $31 $27 $22 $52
Education, Science, Technology & Social Sciences 113 0.04 63.1 0.00 3.5% $1,046 $932 $840 $2,749
of which: Large Organizations 1 0.39 63.1 0.13 13.7% $554 $478 $456 $1,598
Environment and Animal-Related 49 0.00 156.0 0.00 28.6% $143 $91 $76 $1,157
Health Care & Medical 46 0.13 44.5 0.10 4.4% $2,459 $2,339 $2,018 $2,627
of which: Large Organizations 1 0.39 42.4 0.52 3.0% $1,871 $1,816 $1,580 $1,870
Housing & Shelter 25 0.16 150.7 0.32 4.0% $96 $89 $80 $224
Human Services 61 0.05 69.3 0.04 3.4% $294 $290 $243 $229
Other 15 0.14 12.7 0.09 8.8% $65 $66 $48 $135
Philanthropy 21 0.00 300.5 0.00 6.4% $24 $14 $11 $44
Youth Development, Sports & Recreation 64 0.00 61.7 0.00 1.9% $65 $64 $48 $121
Total 522 0.02 65.6 0.01 4.7% $4,396 $4,035 $3,464 $7,837
Source: Boston Foundation Dataset derived from NCCS 2003 Digitized Form 990 Dataset
Regional Breakdown: Cape and Islands
Communities
Aquinnah, Barnstable Town, Bourne, Brewster, Chatham, Chilmark, Dennis, Eastham, Edgartown, Falmouth, Gosnold, Harwich, Mashpee, Nantucket, Oak Bluffs, Orleans, Provincetown, Sandwich, Tisbury, Truro, Wellfleet, West Tisbury, Yarmouth
2000 Census Bureau Information: Region Massachusetts
Population: 246,737 6,349,097
Per Capita Income: $25,620 $25,952
Percent of Population Under Poverty Level: 6.8% 9.0%
Unemployment Rate 5.0% 4.6%
Percent of Population Under 20: 22.3% 26.4%
Percent of Population 65 or Older: 22.1% 13.5%
Ethnic Breakdown:
White 93.8% 86.5%
Black 2.1% 5.5%
Native American 0.6% 0.2%
Asian 0.6% 3.8%
Other 1.2% 3.9%
Hispanic (contained in the other categories) 1.4% 6.8%
2003 NCCS Digitized Data Region Massachusetts
Nonprofit Profile on Per Capita Basis:
Number of Organizations (per thousand) 2.1 1.3
Revenue $4,396 $8,003
Total Spending $4,035 $7,539
Program Spending $3,464 $6,446
Total Assets $7,837 $24,008
Nonprofit Total Revenue for Region $1,084,590,287
Nonprofit Total Spending For Region $995,484,348

94 u n d e r s t a n d i n g B o s t o n
In terms of financial health, the median nonprofits in Central Massachusetts are characteristic of the state as a whole but are moderately less liquid. The median Arts organization was under financial pressure, running a deficit in 2003, with just one month of cash on hand and relatively high short-term obligations. Human Service organizations exhibited a number of these same financial pressures although the median agency ran a surplus. The Educational, Environmen-tal, and Housing sub-sectors operated with annual surpluses higher than the state median peer.
Central Massachusetts encompasses old historic towns like Sturbridge, numerous small towns, as well as the large city of Worcester. It is the home of 11% of the population of the Commonwealth. The region is fairly comparable economically to the rest of the state, but is the headquarters of relatively few nonprofit organiza-tions (7%). The 617 nonprofits in the region held $4.9 billion in total assets, generated $3.9 billion in revenues and spending and are relatively focused on Human and Health Care services.
The Central Massachusetts socioeconomic condition is mixed. Per capita income is at 88% of the state aver-age, but the unemployment rate is lower than the state average. Children are slightly overrepresented in this region (28.3% versus 26.4% for the state). Outside of Boston, this region is one of the more ethnically diverse in the state.
In Central Massachusetts, only 0.9 501(c)3 nonprofit filers operate per thousand residents, far fewer than the 1.3 state norm. However, there is a burgeoning group of new nonprofits with volunteer staffs or staffs of two or under that serve African immigrants or are faith-based in orientation. Youth development agencies are common (11.1% of the state total), while Commu-nity Capacity, Arts, and Other organizations are few (between 5% and 6% of the state total). Total spending per capita is $5,371, about 70% of the amount spent statewide. Per capita spending by Human Services, Health Care and Environmental nonprofits, however, is comparable to the state practice. UMass Memo-rial Healthcare and Fallon Community Health Plan, remarkably, account for half of the nonprofit spending in the region, with Holy Cross and Worcester Polytech-nic Institute, the largest universities, combined, repre-senting another 7% of the spending.
Central Massachusetts: Relatively Few Nonprofits yet Focused on Human and Health Care Services

95p a s s i o n & p u r p o s e : R a i s i n g t h e F i s c a l F i t n e s s B a r f o r M a s s a c h u s e t t s N o n p r o f i t s
Nonprofit Industry SectorsOrganization
Count
Inverse Current
RatioMonths Cash
on Hand leverageSurplus Margin
Per Capita Total
Revenues
Per Capita
Spending
Per Capita Program Expenses
Per Capita Total Assets
Arts, Culture & Humanities 66 0.10 31.5 0.01 -0.1% $49 $63 $41 $367
Community Capacity 32 0.12 117.8 0.15 0.1% $24 $25 $19 $48
Education, Science, Technology & Social Sciences 115 0.12 68.4 0.01 4.3% $779 $777 $641 $2,829
of which: Large Organizations 2 0.67 34.1 0.25 -2.1% $374 $382 $318 $1,425
Environment and Animal-Related 33 0.02 64.3 0.02 13.1% $54 $50 $43 $60
Health Care & Medical 90 0.33 24.6 0.39 0.6% $3,817 $3,795 $3,202 $2,606
of which: Large Organizations 2 1.10 31.6 0.67 1.0% $2,716 $2,692 $2,304 $1,491
Housing & Shelter 37 0.34 36.6 0.76 0.8% $55 $55 $49 $126
Human Services 96 0.27 29.5 0.21 0.4% $544 $533 $485 $471
Other 22 0.00 39.4 0.00 9.6% $6 $6 $5 $31
Philanthropy 25 0.00 153.4 0.01 4.0% $40 $36 $31 $189
Youth Development, Sports & Recreation 101 0.04 15.7 0.00 5.3% $40 $30 $23 $75
Total 617 0.16 42.5 0.09 1.8% $5,407 $5,371 $4,538 $6,803
Source: Boston Foundation Dataset derived from NCCS 2003 Digitized Form 990 Dataset
Regional Breakdown: Central Massachusetts
Communities
Ashburnham, Ashby, Auburn, Ayer, Barre, Berlin, Blackstone, Bolton, Boylston, Brookfield, Charlton, Clinton, Douglas, Dudley, East Brookfield, Fitchburg, Gardner, Grafton, Hardwick, Harvard, Holden, Hubbardston, Lancaster, Leicester, Leominster, Lunenburg, Mendon, Millbury, Millville, New Braintree, North Brookfield, Northborough, Northbridge, Oakham, Oxford, Paxton, Princeton, Rutland, Shirley, Shrewsbury, Southbridge, Spencer, Sterling, Sturbridge, Sutton, Templeton, Townsend, Upton, Uxbridge, Warren, Webster, West Boylston, West Brookfield, Westborough, Westminster, Winchendon, Worcester
2000 Census Bureau Information: Region Massachusetts
Population: 719,825 6,349,097
Per Capita Income: $22,795 $25,952
Percent of Population Under Poverty Level: 9.0% 9.0%
Unemployment Rate 4.3% 4.6%
Percent of Population Under 20: 28.3% 26.4%
Percent of Population 65 or Older: 12.9% 13.5%
Ethnic Breakdown:
White 89.3% 86.5%
Black 2.9% 5.5%
Native American 0.3% 0.2%
Asian 2.7% 3.8%
Other 3.0% 3.9%
Hispanic (contained in the other categories) 7.0% 6.8%
2003 NCCS Digitized Data Region Massachusetts
Nonprofit Profile on Per Capita Basis:
Number of Organizations (per thousand) 0.9 1.3
Revenue $5,407 $8,003
Total Spending $5,371 $7,539
Program Spending $4,538 $6,446
Total Assets $6,803 $24,008
Nonprofit Total Revenue for Region $3,894,616,452
Nonprofit Total Spending For Region $3,868,292,782
96 u n d e r s t a n d i n g B o s t o n
The finances of the Metrowest nonprofit community are among the strongest in the state. Borrowing levels at the median organization are low at 2% of total assets. The median organization has just over two months of cash on hand to cover cash expenses and an annual surplus equal to 3% of total revenues. The Health Care, Housing and Human Service organizations in this part of the state are financially stronger than their peers in the rest of the state. Community Capacity organizations are under financial strain, exhibiting annual deficits and just over one month of cash on hand.
Metrowest is the region immediately west and south of Greater Boston and includes old communities that have, over time, become Boston suburbs, such as Lexington, Wellesley, Concord and Framingham. The region is economically strong, and the nonprofit sector is sizable in terms of numbers and spending. It is the home of 12% of the state population and 16% of the nonprofits. The 1,317 nonprofits in the region held $10.1 billion in total assets, generated $6.7 billion in revenues and $6.4 billion in spending.
Metrowest is economically vibrant. Per capita income is at 142% of the state average, and residents of this region are far less likely to live in poverty (4% vs. 9%) and have a much higher chance of being employed. The percentage of the population that is underage or elderly mirror that of the state. Ethnically, the region’s diversity comes from its Asian population.
In Metrowest, 1.7 nonprofits operate per thousand residents, far more than the 1.3 state norm. The Educa-tional sub-sector is substantial with 21.4% of the total Educational organizations domiciled in this region. The total spending per capita is $8,162, 108% of the state average. Above average per capita spending by the Human Services, Health Care and Education-oriented nonprofits explains this statistic. This finding is not unexpected, given the high concentration of institutes of higher education and Health Care Services in this region. Almost two-thirds of the region’s spend-ing is undertaken by the eight large Educational and Health Care organizations. While Education and Health Care spending is substantial, per capita spend-ing in Other sectors (such as Community Capacity, Philanthropy, Arts and Housing) is quite modest (20-54%) relative to state spending practices.
Metrowest: Vibrant Region with an Unbalanced Mix of Nonprofits

97p a s s i o n & p u r p o s e : R a i s i n g t h e F i s c a l F i t n e s s B a r f o r M a s s a c h u s e t t s N o n p r o f i t s
Nonprofit Industry SectorsOrganization
Count
Inverse Current
RatioMonths Cash
on Hand leverageSurplus Margin
Per Capita Total
Revenues
Per Capita
Spending
Per Capita Program Expenses
Per Capita Total Assets
Arts, Culture & Humanities 168 0.02 65.1 0.01 4.2% $90 $84 $65 $302
Community Capacity 71 0.08 35.8 0.02 -0.7% $49 $51 $37 $106
Education, Science, Technology & Social Sciences 369 0.10 73.3 0.02 3.3% $2,661 $2,383 $1,982 $8,692
of which: Large Organizations 6 0.36 66.3 0.27 -1.2% $1,810 $1,577 $1,347 $6,784
Environment and Animal-Related 54 0.03 73.7 0.00 6.0% $55 $51 $38 $297
Health Care & Medical 145 0.16 68.0 0.10 2.2% $4,826 $4,773 $4,500 $2,332
of which: Large Organizations 2 1.37 27.1 0.79 1.2% $3,580 $3,524 $3,407 $876
Housing & Shelter 36 0.24 107.4 0.44 2.9% $57 $56 $50 $203
Human Services 194 0.17 51.1 0.17 2.9% $643 $631 $554 $461
Other 74 0.00 77.0 0.00 4.6% $58 $53 $44 $144
Philanthropy 55 0.00 128.7 0.00 2.7% $20 $26 $21 $255
Youth Development, Sports & Recreation 151 0.00 79.4 0.00 2.8% $59 $54 $42 $90
Total 1,317 0.07 63.6 0.02 3.0% $8,519 $8,162 $7,333 $12,881
Source: Boston Foundation Dataset derived from NCCS 2003 Digitized Form 990 Dataset
Regional Breakdown: Metrowest
Communities
Acton, Ashland, Bellingham, Boxborough, Carlisle, Concord, Dedham, Dover, Framingham, Franklin, Holliston, Hopedale, Hopkinton, Hudson, Lexington, Lincoln, Littleton, Marlborough, Maynard, Medfield, Medway, Milford, Millis, Natick, Needham, Newton, Norfolk, Norwood, Sherborn, Southborough, Stow, Sudbury, Walpole, Waltham, Wayland, Wellesley, Weston, Westwood, Wrentham
2000 Census Bureau Information: Region Massachusetts
Population: 783,845 6,349,097
Per Capita Income: $36,841 $25,952
Percent of Population Under Poverty Level: 4.0% 9.0%
Unemployment Rate 3.1% 4.6%
Percent of Population Under 20: 27.2% 26.4%
Percent of Population 65 or Older: 13.1% 13.5%
Ethnic Breakdown:
White 90.5% 86.5%
Black 1.9% 5.5%
Native American 0.1% 0.2%
Asian 4.4% 3.8%
Other 1.5% 3.9%
Hispanic (contained in the other categories) 3.4% 6.8%
2003 NCCS Digitized Data Region Massachusetts
Nonprofit Profile on Per Capita Basis:
Number of Organizations (per thousand) 1.7 1.3
Revenue $8,519 $8,003
Total Spending $8,162 $7,539
Program Spending $7,333 $6,446
Total Assets $12,881 $24,008
Nonprofit Total Revenue for Region $6,677,247,828
Nonprofit Total Spending For Region $6,398,088,334

98 u n d e r s t a n d i n g B o s t o n
The per capita spending is particularly low in the Community Capacity and Philanthropic sectors, where spending was 11% and 20% of the state aver-age, respectively. Per capita spending by the Human Services agencies and Youth Development is slightly lower than state averages. One reason for the low spending by nonprofits in the region is that only two large organizations are based here. Mitre Corpora-tion, an Educational and scientific nonprofit, accounts for 22% of the region’s spending while Lahey Clinic Hospital accounts for an additional 10%.
Overall, the nonprofits in Northeast Massachusetts have significantly less heavy indebtedness on both a short- and long-term basis relative to nonprofits statewide. The liquidity in terms of cash on hand is comparable, with Northeast nonprofits having annual surpluses about 15% higher than others in the state. These positive comparisons are associated with virtual debt-free Arts, Other, Philanthropic, and Youth Devel-opment sub-sectors as well as high liquidity in the Arts and Housing organizations and wider surplus margins in the Housing and Philanthropic groups when contrasted with their peers in the rest of the state.
Northeast Massachusetts is located on the northern end of the eastern coast of Massachusetts and includes communities such as Andover, Beverly, Burlington, Gloucester, Lawrence, Lowell, and Salem. Some 14% of the population of the Commonwealth resides in this region, which is economically stable with a relatively small nonprofit sector. The 912 nonprofits in the region held $4.9 billion in total assets, generated $3.6 billion in revenues and $3.5 billion in spending.
Northeast Massachusetts is economically stable with per capita income at the state average, but an unem-ployment rate that is 12% lower than the state average and 17% fewer people living below the poverty line. The mix of residents is slightly higher in children and lower in the elderly. As regards ethnic diversity, this region has a relatively low African American and a modestly higher Latino population.
While Northeast Massachusetts’ economic situation closely resembles that of the state, its nonprofit sector is much smaller. Only 1.0 nonprofits operate per thou-sand residents, less than the 1.3 state norm. The region has a heavier than expected number of Human Service agencies and relatively few nonprofits in the Commu-nity Capacity sub-sector. The total spending per capita is $3,947, 52% of the state average. The median size of nonprofits in this region is also low at $134,000 in spending and $172,000 in total assets, making the median nonprofit in the northeast only 70% of the size of the median organization in the state.
Northeast Massachusetts: Economically Stable with Modest Nonprofit Activity

99p a s s i o n & p u r p o s e : R a i s i n g t h e F i s c a l F i t n e s s B a r f o r M a s s a c h u s e t t s N o n p r o f i t s
Nonprofit Industry SectorsOrganization
Count
Inverse Current
RatioMonths Cash
on Hand leverageSurplus Margin
Per Capita Total
Revenues
Per Capita
Spending
Per Capita Program Expenses
Per Capita Total Assets
Arts, Culture & Humanities 113 0.00 90.8 0.00 2.1% $46 $44 $31 $76
Community Capacity 41 0.05 46.3 0.06 3.3% $26 $23 $19 $32
Education, Science, Technology & Social Sciences 206 0.03 32.3 0.00 3.4% $1,380 $1,364 $1,156 $1,869
of which: Large Organizations 1 1.02 0.2 0.53 2.6% $877 $854 $741 $445
Environment and Animal-Related 31 0.05 69.0 0.00 4.7% $47 $36 $30 $227
Health Care & Medical 124 0.13 57.7 0.15 0.7% $1,869 $1,806 $1,551 $820
of which: Large Organizations 1 0.95 2.5 2.56 -4.2% $435 $453 $387 $95
Housing & Shelter 46 0.15 128.7 0.38 5.8% $40 $33 $30 $59
Human Services 135 0.26 35.6 0.24 1.6% $545 $523 $468 $162
Other 36 0.00 71.3 0.00 3.6% $36 $35 $29 $32
Philanthropy 39 0.00 66.8 0.00 7.4% $14 $13 $9 $17
Youth Development, Sports & Recreation 141 0.00 64.5 0.00 4.9% $72 $70 $55 $50
Total 912 0.05 58.6 0.02 2.6% $4,075 $3,947 $3,379 $3,343
Source: Boston Foundation Dataset derived from NCCS 2003 Digitized Form 990 Dataset
Regional Breakdown: Northeast Massachusetts
Communities
Amesbury, Andover, Bedford, Beverly, Billerica, Boxford, Burlington, Chelmsford, Danvers, Dracut, Dunstable, Essex, Georgetown, Gloucester, Groton, Groveland, Hamilton, Haverhill, Ipswich, Lawrence, Lowell, Manchester-by-the-Sea, Merrimac, Methuen, Middleton, Newbury, Newburyport, North Andover, North Reading, Pepperell, Reading, Rockport, Rowley, Salisbury, Tewksbury, Topsfield, Tyngsborough, Wenham, West Newbury, Westford, Wilmington, Woburn
2000 Census Bureau Information: Region Massachusetts
Population: 892,201 6,349,097
Per Capita Income: $26,498 $25,952
Percent of Population Under Poverty Level: 7.5% 9.0%
Unemployment Rate 4.1% 4.6%
Percent of Population Under 20: 28.5% 26.4%
Percent of Population 65 or Older: 12.3% 13.5%
Ethnic Breakdown:
White 87.6% 86.5%
Black 1.6% 5.5%
Native American 0.2% 0.2%
Asian 4.2% 3.8%
Other 4.6% 3.9%
Hispanic (contained in the other categories) 8.5% 6.8%
2003 NCCS Digitized Data Region Massachusetts
Nonprofit Profile on Per Capita Basis:
Number of Organizations (per thousand) 1.0 1.3
Revenue $4,075 $8,003
Total Spending $3,947 $7,539
Program Spending $3,379 $6,446
Total Assets $5,488 $24,008
Nonprofit Total Revenue for Region $3,633,112,058
Nonprofit Total Spending For Region $3,519,063,188

100 u n d e r s t a n d i n g B o s t o n
Despite these demographic indicators that suggest the need for high levels of nonprofit services, the spend-ing of Pioneer Valley nonprofits is relatively low. Only 1.1 organizations operate for every 1,000 residents in Pioneer Valley in comparison to 1.3 in the state as a whole. The total spending of the region’s nonprofits represent 6.6% of the state total even though its popu-lation is almost twice as large at 11.0%. The nonprofits in this community are also substantially smaller in terms of median revenues, assets and spending. Over-all, the distribution of nonprofit organizations closely resembles that of the whole state, although Pioneer Valley does have above average spending on Hous-ing and Human Services with modest spending in the Arts. Three large organizations (Amherst and Smith Colleges and Baystate Medical) represent 27% of the spending and 47% of the nonprofit assets in the region.
The nonprofits in the region are significantly more leveraged, slightly less liquid and moderately less profitable than those in the rest of the state. Regardless of sub-sector, Pioneer Valley nonprofits have substan-tially higher short-term indebtedness as a percentage of short-term assets when compared to their out-of-region peers. Arts, Environmental and Other organiza-tions have leverage that is four times higher than their statewide peers. While Housing organizations have adequate cash levels (93 vs. 57 days of cash on hand), they operate with a median deficit of 2.7%.
The Pioneer Valley constitutes an area in central Massachusetts that includes Springfield, Amherst, Greenfield and Deerfield. This region is economically stressed relative to the rest of the state and receives much less in nonprofit services. The region’s 798 nonprofit organizations spend $3.2 billion a year, with 83.9% allocated to program services. The nonprofits in the region held $7.3 billion in total assets and gener-ated $3.2 billion in revenues in 2003.
The Pioneer Valley represented 11% of the Massachu-setts population in 2000 but only 8.5% of the income of the state in 2003. Its per capita income is $20,087, 77% of the state average. In Pioneer Valley, 12.3% of the population lives under the poverty level, one-third higher than the state average, and 5.4% of the work-force is unemployed, 17% higher than the state aver-age. The region has a relatively higher proportion of the population under the age of 20 (28.2% vs. 26.4% statewide) or age 65 or older (14.0% vs. 13.5%). Pioneer Valley’s ethnic diversity is reflected primarily in a rela-tively high Latino population (10.9% vs. 6.8% for the state as a whole).
Pioneer Valley: Relatively low Service levels and Economically Stressed Region

101p a s s i o n & p u r p o s e : R a i s i n g t h e F i s c a l F i t n e s s B a r f o r M a s s a c h u s e t t s N o n p r o f i t s
Nonprofit Industry SectorsOrganization
Count
Inverse Current
RatioMonths Cash
on Hand leverageSurplus Margin
Per Capita Total
Revenues
Per Capita
Spending
Per Capita Program Expenses
Per Capita Total Assets
Arts, Culture & Humanities 101 0.13 47.9 0.09 5.7% $82 $68 $48 $280
Community Capacity 95 0.23 59.0 0.22 0.6% $119 $117 $102 $126
Education, Science, Technology & Social Sciences 156 0.12 71.4 0.11 1.4% $1,362 $1,379 $1,145 $6,958
of which: Large Organizations 2 0.41 431.8 0.18 -2.8% $440 $460 $388 $4,143
Environment and Animal-Related 33 0.03 27.0 0.03 2.5% $11 $10 $8 $29
Health Care & Medical 79 0.40 31.9 0.48 1.3% $2,137 $2,088 $1,722 $1,952
of which: Large Organizations 1 0.33 41.7 0.61 4.8% $822 $782 $645 $787
Housing & Shelter 53 0.52 93.3 0.88 -2.7% $112 $117 $107 $337
Human Services 123 0.34 31.1 0.27 1.9% $661 $660 $592 $468
Other 43 0.07 51.0 0.08 0.0% $36 $39 $33 $86
Philanthropy 34 0.00 66.7 0.00 1.3% $57 $43 $36 $191
Youth Development, Sports & Recreation 81 0.00 53.6 0.00 1.6% $55 $57 $46 $105
Total 798 0.07 50.7 0.04 2.2% $4,631 $4,577 $3,838 $10,532
Source: Boston Foundation Dataset derived from NCCS 2003 Digitized Form 990 Dataset
Regional Breakdown: Pioneer Valley
Communities
Agawam, Amherst, Ashfield, Athol, Belchertown, Bernardston, Blandford, Brimfield, Buckland, Charlemont, Chester, Chesterfield, Chicopee, Colrain, Conway, Cummington, Deerfield, East Longmeadow, Easthampton, Erving, Gill, Goshen, Granby, Granville, Greenfield, Hadley, Hampden, Hatfield, Hawley, Heath, Holland, Holyoke, Huntington, Leverett, Leyden, Longmeadow, Ludlow, Middlefield, Monroe, Monson, Montague, Montgomery, New Salem, Northampton, Northfield, Orange, Palmer, Pelham, Petersham, Phillipston, Plainfield, Rowe, Royalston, Russell, Shelburne, Shutesbury, South Hadley, Southampton, Southwick, Springfield, Sunderland, Tolland, Wales, Ware, Warwick, Wendell, West Springfield, Westfield, Westhampton, Whately, Wilbraham, Williamsburg, Worthington
2000 Census Bureau Information: Region Massachusetts
Population: 695,368 6,349,097
Per Capita Income: $20,087 $25,952
Percent of Population Under Poverty Level: 12.3% 9.0%
Unemployment Rate 5.4% 4.6%
Percent of Population Under 20: 28.2% 26.4%
Percent of Population 65 or Older: 14.0% 13.5%
Ethnic Breakdown:
White 83.8% 86.5%
Black 5.8% 5.5%
Native American 0.3% 0.2%
Asian 1.8% 3.8%
Other 6.2% 3.9%
Hispanic (contained in the other categories) 10.9% 6.8%
2003 NCCS Digitized Data Region Massachusetts
Nonprofit Profile on Per Capita Basis:
Number of Organizations (per thousand) 1.1 1.3
Revenue $4,631 $8,003
Total Spending $4,577 $7,539
Program Spending $3,838 $6,446
Total Assets $10,532 $24,008
Nonprofit Total Revenue for Region $3,220,559,571
Nonprofit Total Spending For Region $3,182,491,542

102 u n d e r s t a n d i n g B o s t o n
The most active sector in the region in Human Services operates at two-thirds the spending exhibited through-out the state. The region has only one large organiza-tion (Southcoast Hospital Group) that represents 17% of the spending in the region.
The Southeast Massachusetts nonprofit sector is slightly less leveraged and liquid but more profitable than the nonprofits throughout the state. However, a deeper look suggests financial distress. Organiza-tions in several sectors (Arts, Education, Environment, Other, Philanthropy, and Youth Development) are virtually devoid of both short-term and long-term borrowing, which suggests that nonprofits in this region have difficulty accessing credit. The Housing sector operates with deficits, while the Arts and Other sectors are operating at breakeven. The Health Care sector has low cash on hand (25 vs. 57 days for the state) and current liabilities more than double that of its statewide Health Care peers.
Southeast Massachusetts is located just south of Boston but north of the Cape and the Islands and includes communities such as Attleboro, Brockton, and Fall River. This region composes 17% of the population of the Commonwealth but a mere 9% of the nonprofit organizations. The 764 nonprofit organizations in the region held $2.9 billion in total assets and generated $2.6 billion in revenues and in spending.
Per capita income in Southeast Massachusetts is at 89% of the state average, yet the residents of this region are slightly less likely to live in poverty (8% vs. 9%). They also have a slightly lower chance of being employed. The percentage of the population that is elderly mirrors that of the state, while the age mix is slightly more weighted toward children.
What is striking is that this region has such little nonprofit activity. In Southeast Massachusetts, 0.7 nonprofits operate per thousand residents, 55% of the state average. All of the sub-sectors are under-represented. The total spending per capita is $2,393, a mere 32% of the state average. Spending by the Arts and Education sectors is particularly depressed, with just $27 and $277 spent per capita, respectively, as compared to $191 and $2,254 per capita throughout the state. Health Care, Housing, and Youth Develop-ment also exhibit significantly lower levels of nonprofit activity at about 40% of the state per capita spending.
Southeast Massachusetts: Small Nonprofit Sector Serves This Economically Stable Community
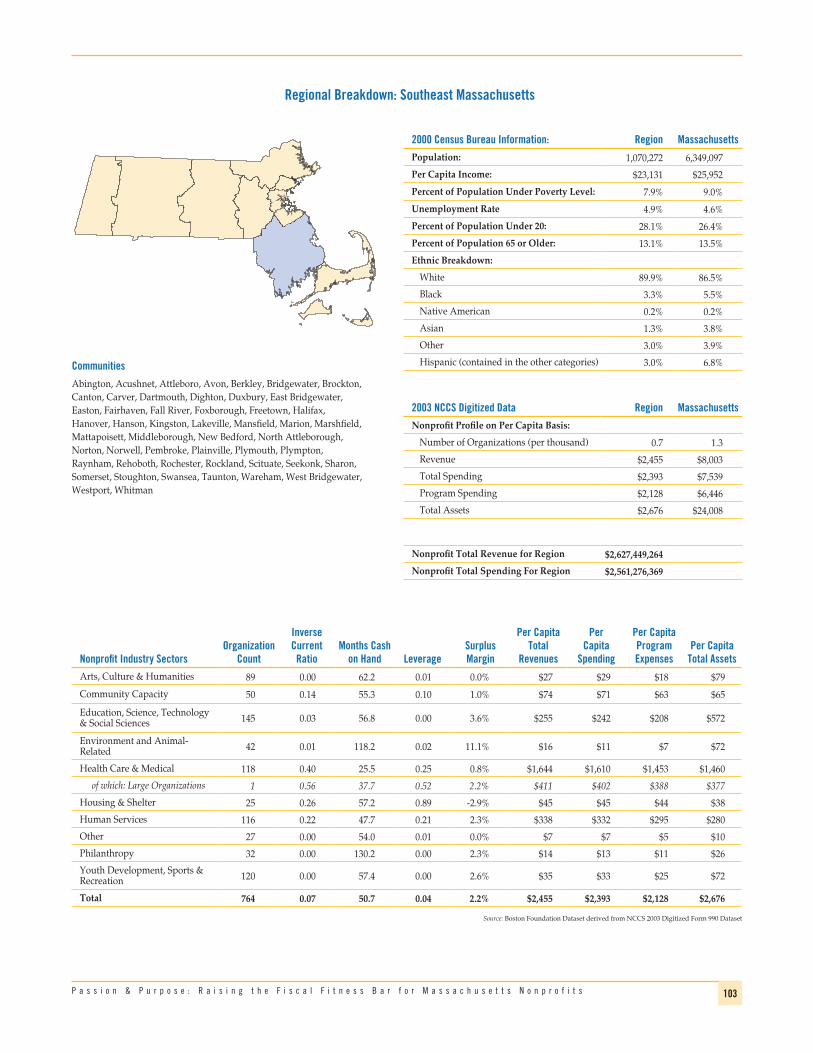
103p a s s i o n & p u r p o s e : R a i s i n g t h e F i s c a l F i t n e s s B a r f o r M a s s a c h u s e t t s N o n p r o f i t s
Nonprofit Industry SectorsOrganization
Count
Inverse Current
RatioMonths Cash
on Hand leverageSurplus Margin
Per Capita Total
Revenues
Per Capita
Spending
Per Capita Program Expenses
Per Capita Total Assets
Arts, Culture & Humanities 89 0.00 62.2 0.01 0.0% $27 $29 $18 $79
Community Capacity 50 0.14 55.3 0.10 1.0% $74 $71 $63 $65
Education, Science, Technology & Social Sciences 145 0.03 56.8 0.00 3.6% $255 $242 $208 $572
Environment and Animal-Related 42 0.01 118.2 0.02 11.1% $16 $11 $7 $72
Health Care & Medical 118 0.40 25.5 0.25 0.8% $1,644 $1,610 $1,453 $1,460
of which: Large Organizations 1 0.56 37.7 0.52 2.2% $411 $402 $388 $377
Housing & Shelter 25 0.26 57.2 0.89 -2.9% $45 $45 $44 $38
Human Services 116 0.22 47.7 0.21 2.3% $338 $332 $295 $280
Other 27 0.00 54.0 0.01 0.0% $7 $7 $5 $10
Philanthropy 32 0.00 130.2 0.00 2.3% $14 $13 $11 $26
Youth Development, Sports & Recreation 120 0.00 57.4 0.00 2.6% $35 $33 $25 $72
Total 764 0.07 50.7 0.04 2.2% $2,455 $2,393 $2,128 $2,676
Source: Boston Foundation Dataset derived from NCCS 2003 Digitized Form 990 Dataset
Regional Breakdown: Southeast Massachusetts
Communities
Abington, Acushnet, Attleboro, Avon, Berkley, Bridgewater, Brockton, Canton, Carver, Dartmouth, Dighton, Duxbury, East Bridgewater, Easton, Fairhaven, Fall River, Foxborough, Freetown, Halifax, Hanover, Hanson, Kingston, Lakeville, Mansfield, Marion, Marshfield, Mattapoisett, Middleborough, New Bedford, North Attleborough, Norton, Norwell, Pembroke, Plainville, Plymouth, Plympton, Raynham, Rehoboth, Rochester, Rockland, Scituate, Seekonk, Sharon, Somerset, Stoughton, Swansea, Taunton, Wareham, West Bridgewater, Westport, Whitman
2000 Census Bureau Information: Region Massachusetts
Population: 1,070,272 6,349,097
Per Capita Income: $23,131 $25,952
Percent of Population Under Poverty Level: 7.9% 9.0%
Unemployment Rate 4.9% 4.6%
Percent of Population Under 20: 28.1% 26.4%
Percent of Population 65 or Older: 13.1% 13.5%
Ethnic Breakdown:
White 89.9% 86.5%
Black 3.3% 5.5%
Native American 0.2% 0.2%
Asian 1.3% 3.8%
Other 3.0% 3.9%
Hispanic (contained in the other categories) 3.0% 6.8%
2003 NCCS Digitized Data Region Massachusetts
Nonprofit Profile on Per Capita Basis:
Number of Organizations (per thousand) 0.7 1.3
Revenue $2,455 $8,003
Total Spending $2,393 $7,539
Program Spending $2,128 $6,446
Total Assets $2,676 $24,008
Nonprofit Total Revenue for Region $2,627,449,264
Nonprofit Total Spending For Region $2,561,276,369

104 u n d e r s t a n d i n g B o s t o n
Conclusion
This report was designed to be both descriptive and prescriptive. One goal was to provide Massachusetts nonprofit leaders with a tremendous amount of infor-mation that will help them to see their work in the context of the entire sector—to understand where they fit in, and identify and think about the issues that all nonprofits are dealing with at this time in history.
The other goal was to draw the sector’s attention to a potentially dire situation for our state’s nonprofits, the result of unprecedented growth among organizations without commensurate growth in support.
Protecting and enhancing the sector’s value—and deal-ing with the daunting challenges it faces—demands both individual and collective responses. Nonprofit organizations, especially those that are small and medium-sized, should take a hard look at their orga-nizational strength, their funding prospects, and the possibility of repositioning themselves or working in new ways with groups that have similar missions. The sector as a whole must continue to come together to strengthen itself from within and advocate on its own behalf.
Consider the information and the recommendations in this report to be the beginning of a dialogue that you are invited to enter into as the sector braces for what might be tough economic times. Take comfort in the fact that the nonprofit sector has weathered tough times in the past and will most certainly prevail despite the challenges that affect individual institu-tions—small and large—and the sector as a whole.
This report calls for restructuring, repositioning and reinvesting in the Massachusetts nonprofit sector—measures that are essential to creating the stable finan-cial conditions necessary for nonprofits to meet their public purpose. These much-needed improvements in process and organizational structure already are being adopted by a number of organizations. If taken to scale and institutionalized, they will position the Massachu-setts nonprofit sector for success in the 21st century.
Despite resource constraints, a number of the state’s nonprofit organizations have developed innovative solutions to the challenges they face. Their approaches follow three distinctive strategies: 1) consolidation and restructuring; 2) repositioning; and 3) reinventing and reinvesting. This report closes with a brief summary of some examples of nonprofits that have embraced one of these three models.
Consolidation and RestructuringA variety of nonprofits have achieved greater efficiency, increased clout, and/or built stronger programs through consolidation and restructuring.
Pine Street Inn Faced with increased demand and level funding—and the operating deficits caused by that deadly combina-tion—Pine Street Inn, one of the state’s largest home-less shelters, analyzed all of its activities, including housing, outreach and the provision of food, clothing and medical care to its clients, against its core mission. As a result, the organization decided to outsource its health care services to Boston Health Care for the Home-less Program and the provision of clothing for its clients to Morgan Memorial Goodwill Industries. As a result, the Inn has managed to focus more fully on its core mission of providing shelter and permanent housing to clients and, in the process, experienced significant savings by cutting its administrative work.

105p a s s i o n & p u r p o s e : R a i s i n g t h e F i s c a l F i t n e s s B a r f o r M a s s a c h u s e t t s N o n p r o f i t s
DotwellDotWell is a formalized collaborative effort of its two founding organizations: Codman Square Health Center and Dorchester House Multi-Service Center. An innova-tive partnership between two well-respected commu-nity health and human service providers, DotWell represents an excellent example of administrative consolidation. It provides state-of-the-art and enter-prise-wide management support, including a compre-hensive Information Technology (IT) infrastructure, a performance improvement framework, development and public policy advocacy functions, as well as finan-cial management. DotWell has been lauded for its abil-ity to meet the complex needs of at-risk populations while realizing significant cost-savings.
Boston Teamworks Boston TeamWorks serves as a permanent administra-tive home to six sports-oriented youth organizations (MetroLacrosse, New England Scores, CityKicks, Good Sports, World T.E.A.M. Sports and A Better Chance) all serving urban boys and girls not only with sports programming but with enrichment programs, such as character education, community service, youth development, leadership development and educa-tional activities. Previously dispersed throughout various office locations, the organizations now share office space, conference rooms, and office equipment at their Dorchester location. Though functioning independently they all benefit from the efficiency of shared resources and shared services. In addition, the six organizations are planning to collaborate to enrich youth programming.
Crittenton women’s Union This is a merger/alliance of two historic nonprofit organizations—the Women’s Educational and Industrial Union and Crittenton Hastings House—both of which are dedicated to moving low-income and at-risk women and families out of poverty and into lives of personal and economic independence. By combin-ing staff and resources, the Crittenton Women’s Union was able to expand current programs, dedicate more resources toward research and new initiatives, and advocate for public policy changes that will increase opportunities for the economic self-sufficiency of the individuals and families they serve.
Home for little wanderers Since 1799, children and families in Massachusetts found helping hands in the various predecessor agen-cies that comprise what is now The Home for Little Wanderers (The Home). The infrastructure of the pres-ent organization reflects a vastly expanded range of services and programs through the merging of four major organizations over the last decade: Boston Chil-dren’s Services, The New England Home for Little Wander-ers, Parents’ and Children’s Services, and Charles River Health Management. The Home now collectively serves more than 10,000 children statewide and benefits from the ability to provide services to different constituen-cies that may not have been served had the merged organizations ceased to exist. It has also created a formidable “footprint” that enables the organization to play a leadership role in the child welfare field locally and regionally.
Group Purchasing Strategies of Trade Associations Trade organizations—such as the Massachusetts Associ ation of Community Development Corporations, the Massachusetts League of Community Health Centers, and the Massachusetts Council of Human Service Providers—are able to offer significant savings to their member nonprofit organizations in the areas of purchasing supplies and equipment, obtaining insur-ance and asset management. There is strength in numbers and in associations like these.
Third Sector New England’s Fiscal Agency Program This program extends nonprofit sector benefits to unin-corporated groups, projects and grassroots coalitions by providing services in the areas of human resources, IT and financial management, and by offering support with governance, organizational and technical matters. This service has allowed organizations to focus on their missions without the burden of an administrative infrastructure or the need to create a new nonprofit.

106 u n d e r s t a n d i n g B o s t o n
Repositioning The Massachusetts Nonprofit Sector is an important economic force and has already begun using its collec-tive clout to reposition itself and improve outcomes for its constituents. Repositioning requires both innovative ideas and strong leadership to support and enact them.
Massachusetts Nonprofit Network This state association of nonprofits, created in just 2006, has already grown to a 300-member organiza-tion. Its goal is to build public awareness about the value of nonprofits, advocate for the sector and its constituents, and build the capacity of organizations and people who work in the Massachusetts nonprofit sector. With this powerful vehicle for change, the sector is well-positioned to maximize its potential and gain efficiencies and influences possible only through collective action.
Single Sector Strategies The Massachusetts Council for Human Service Providers—the trade association of human service organizations—has been working to increase funding for human services operations and compensation for direct care workers. With no new money appropriated since 1987 to absorb the increased operating costs of provid-ing care in community-based settings, a majority of providers are struggling to maintain quality service in the face of two decades of rising rents, insurance premiums, utilities and transportation costs. This has resulted in a major crisis in the system. Only by coming together, can these agencies speak with a common voice and have an impact on a future that will affect all of them and their constituents.
The Cultural Task Force—a broad-based group of cultural organizations from across the state—came together in 2003 to develop strategies to enhance revenues and resources for the cultural sector. Signifi-cant results of this single-sector strategy include the creation of the Massachusetts Cultural Facilities Fund, for which the Legislature appropriated $25 million in its first two years, the strengthening of arts service organizations, and the development of fruitful partner-ships with the public sector for policy, operating and logistical support.
Reinvention and ReinvestmentRecommendations to reinvent and reinvest in the nonprofit sector require well-conceived systemic approaches and interventions. While this is the most uncharted territory among the innovative approaches to strengthening the sector, some examples include:
The Smith Family Foundation’s Capacity Building Grants Program—a support program for multi-year capacity building for high-impact youth-serving organiza-tions. Through this program, the Foundation aims to improve the strength and reach of a select number of nonprofits that do work in various focus areas. Launched in 2003, it provides annual, renewable grants to organizations with significant growth poten-tial that are making important contributions in the Foundation’s priority areas.
SkillWorks—a collaborative of private, community and public funders designed to train immigrants and low-wage workers in self-sustaining family jobs. In its first five years, SkillWorks provided training to some 2,700 people to work in the health care, automotive and hotel industries. Its programs include direct fund-ing for training, organizational capacity building and public policy advocacy for systemic impact.
The Barr Foundation Fellows program—was designed to honor the contributions of the Boston area’s experi-enced nonprofit and public school leaders by giving them an opportunity for replenishment, and by supporting their organizations during this time. Over a three-year period that includes a sabbatical, inter-national travel, a series of retreats, and peer learning, these leaders have an important opportunity to reflect on the accomplishments of their organizations and find the inspiration to attain even higher levels of effective-ness, creativity, and innovation.
looking ForwardThese innovative programs and solutions, the work of the Massachusetts Nonprofit Network and so many other initiatives and fresh ideas are beginning to have a palpable impact on the entire nonprofit sector in the Commonwealth. A serious dialogue is beginning—one that does not shy away from facing harsh realities, but also focuses entirely on positive solutions. We invite you to use this report as a primary source for self-examination and collective action.

107p a s s i o n & p u r p o s e : R a i s i n g t h e F i s c a l F i t n e s s B a r f o r M a s s a c h u s e t t s N o n p r o f i t s
Public charities operate with a specific core mission or program area, and the nature of each nonprofit’s operations will vary in relation to that mission. To better understand the relationship between mission and the varying business models within which differ-ent nonprofits operate, we consulted with practitioners and experts in the area of nonprofit finance to segment the sector in an attempt to reflect the relationship
between business conditions and mission. The catego-rization in this report builds upon the 26 “NTEE” cate-gories developed by the National Center for Charitable Statistics, which distinguish nonprofits on the basis of their main programmatic mission. These have been grouped into ten major operational categories (Indus-try Sectors) that represent a specific mode of service delivery as follows:
Technical Appendices
appendix aThe Industry Sector Composition of Massachusetts Public Charities
Major Industry SectorsNumber of
Organizations NTEE Classification
Arts, Culture & Humanities 1,115 Arts, Culture & Humanities (A)
Education, Science, Technology & Social Sciences 1,727 Education (B); Science &Technology (U); Social Sciences (V)
Environment and Animal-Related 345 Environment (C); Animal-Related (D)
Health Care & Medical 1,154Healthcare (E); Mental Health & Intervention (F); Disease, Disorders & Medical Disciplines (G); Medical Research (H)
Community Capacity 628
Crime & Legal related (I); Employment (J); Public Safety, Disaster Preparedness and Relief (M); Civil Rights, Social Action & Advocacy (R); Community Improvement & Capacity Building (S)
Human Services 1,149 Food, Agriculture & Nutrition (K); Human Services (P)
Housing & Shelter 470 Housing & Shelter (L)
Youth Development, Sports & Recreation 912 Youth Development (O), Sports & Recreation (N)
Philanthropy 388 Philanthropy (T)
Other 424International, Foreign Affairs & National Security (Q); Public & Societal Benefit (W); Religion-Related (X); Mutual & Membership Benefit (Y); Unknown (Z)
TABLE A–1
Industry Sector Composition of Massachusetts Public Charities

108 u n d e r s t a n d i n g B o s t o n
501(c)3 Organization is a nonprofit organization, whose tax-exemption is based on Section 501(c)3 of the Internal Revenue Code. They are charitable, religious, educational, and/or scientific organizations. The two kinds of 501(c)3 organiza-tions are private foundations and public charities.
Administrative Cost Ratio is total administrative expenses divided by total expenses as reported on the Statement of Functional Expenses on the Form 990.
Cash On Hand compares the cash balance to operating expenses (total expenses less depreciation), and it indicates how many days or months of expenses an organization can cover out of current cash holdings without liquidating investments or relying on new revenues.
Contributions is Line 1 in Part I of the Form 990. It includes contributions, gifts, grants and similar amounts.
Total Expenses is a cost that is often reflected as an outflow of money to pay for an item or service.
Financial Sustainability is whether an organization has enough of its own resources to continue operations into the future.
Compensation is composed of wages and salaries, payroll taxes, pension payments and other fringe benefits.
Current Ratio is current assets (the accounts that will convert into cash in the next 12 months) divided by current liabilities (the accounts that will need to be settled using cash or the delivery of services) in the next 12 months.
Fundraising Efficiency is total fundraising expenses divided by the sum of net special event revenue and contributions.
Investment Income is interest, dividends, and gains and losses on sales of securities.
leverage is defined as total liabilities divided by net assets.
liquidity is whether an organization has sufficient cash resources to deliver its mission and pay its obligations on a timely basis.
Net Assets is defined as total assets minus total liabilities. In other sectors, this concept is known as equity or net worth. This number is drawn from Part IV, Line 73 of the Form 990.
Net Income is the annual excess or deficit of a nonprofit. It is also known as the change in net assets and is reported on Part I, Line 18 of the Form 990.
Net Operating Cycle compares net working capital to operating expenses.
Net working Capital is current assets (cash, receivables, inven-tory or prepaid expenses) less current liabilities (unpaid bills, grants payable and deferred revenue).
Nonprofit Organizations for purposes of this study include orga-nizations that have obtained tax-exemption from the federal government and/or the Commonwealth of Massachusetts. It includes those organizations that have received tax exemp-tion under Section 501(c) of the Internal Revenue Code.
National Taxonomy of Nonprofit Entities (NTEE) is a classification system for nonprofit organizations recognized as tax exempt under the Internal Revenue Code. The NTEE was developed by National Center for Charitable Statistics during the 1980s through the collaboration of major nonprofit organizations.
Poverty line is a federal standard designed to determine the minimum level of income deemed necessary to achieve an adequate standard of living.
Program Efficiency is total program expenses divided by total expenses as reported on the Statement of Functional Expenses (Part II) of the Form 990.
Program Service Revenue is Part I, Line 2 in the Form 990. It includes income earned on contracts with government agen-cies that benefit government agencies rather than the public as a whole. It also includes tuition, admissions fees, and royalties.
Profitability is whether the organization earned new economic revenues sufficient to cover current expenses and allow for appropriate growth and a margin for error.
Public Charities include churches, hospitals, colleges and universities, and social service agencies that may have an active fundraising program and a diverse set of contributors.
Total Assets are probable future benefits obtained or controlled by a particular entity as a result of a past transaction or event. It is the sum of current and long-term assets owned by a nonprofit. It is taken from Part IV, Line 59 of the Form 990.
Total liabilities are obligations of an entity arising from past transactions or events that are to be settled by cash, transfers of assets or provision of services. It includes current liabili-ties, long-term debt, and any other liabilities. It is taken from Part IV, Line 59 of the Form 990.
Total Revenues include contributions, program service revenue, investment income, membership dues, net rental income, net income from special events and sales of inventory. It is found in Part I, Line 12 of the Form 990.
Surplus Margin (also known as a profit margin) is net income (i.e., the change in net assets) divided by total revenues.
appendix BGlossary of Terms in this Report

109p a s s i o n & p u r p o s e : R a i s i n g t h e F i s c a l F i t n e s s B a r f o r M a s s a c h u s e t t s N o n p r o f i t s 109p a s s i o n & p u r p o s e : R a i s i n g t h e F i s c a l F i t n e s s B a r f o r M a s s a c h u s e t t s N o n p r o f i t s
appe
ndix
C
Rest
ruct
urin
g Op
tions
Res
truc
turi
ng o
ptio
ns a
re d
efine
d a
s ar
rang
emen
ts b
etw
een
two
or m
ore
enti
ties
that
are
cre
ated
to a
chie
ve m
utua
l goa
ls th
roug
h co
llabo
rati
on.
Sinc
e no
cle
ar d
efini
tion
s ex
ist i
n th
e fi
eld
abo
ut th
e ra
nge
of s
trat
egic
alli
ance
act
ivit
ies,
we
have
defi
ned
term
s al
ong
a co
ntin
uum
that
des
crib
es
dif
fere
nces
bet
wee
n th
e st
rate
gic
allia
nce
acti
viti
es r
elat
ed to
Fun
ctio
nal,
Prog
ram
mat
ic, a
nd O
rgan
izat
iona
l Str
uctu
re a
ctiv
itie
s.
Type
of
Allia
nce
Purp
ose
Com
mitm
ent t
ype
Deci
sion
Mak
ing
Impa
ct o
n
Orga
niza
tion
Impa
ct O
n Se
rvic
es
FUNCTIONAl
Outs
ourc
ing
am
ong
No
npro
fits
To
red
uce
cost
and
tocr
eate
a m
issi
on fo
cus
on c
ore
com
pete
ncie
s fo
r or
gani
zati
on
Lim
ited
tim
e ag
reem
ent w
ith
sub-
cont
ract
s fo
r se
rvic
esC
lient
/V
end
or
rela
tion
ship
Lea
ner/
mor
e ni
mbl
e or
gani
zati
onL
ess
dir
ect c
ontr
ol—
qual
ity
dep
end
s up
on v
end
or
Adm
inis
trat
ive
Cons
olid
atio
ns
Res
ourc
e sh
arin
g to
red
uce
cost
—sh
arin
g st
aff,
spac
e, b
ack
offi
ce
func
tion
s
Tim
e-bo
und
agr
eem
ent w
ith
clea
r ro
les
and
res
pons
ibili
ties
of
part
icip
atin
g or
gani
zati
ons
Defi
ned
upf
ront
Cos
t Sav
ings
Non
e
Join
t Pur
chas
ing
Agre
emen
ts
To
max
imiz
e ef
fici
enci
es o
f sca
le
and
red
uce
cost
s th
roug
h jo
int
purc
hasi
ng o
f goo
ds
and
ser
vice
s
Con
trac
tual
agr
eem
ents
Defi
ned
upf
ront
Cos
t Sav
ings
Non
e
PROGRAMMATIC
Colla
bora
tion/
Part
ners
hip
To
com
bine
eff
orts
to s
erve
con
stit
-ue
nts
and
man
age
prog
ram
s m
ore
effe
ctiv
ely;
exp
and
con
stit
uenc
ies
and
clo
ut; a
nd r
educ
e d
uplic
atio
n
Defi
ned
tim
e ag
reem
ent t
ied
to
purp
ose
of c
olla
bora
tion
; som
e-ti
mes
taki
ng o
n th
e m
antl
e of
co
alit
ions
, net
wor
ks, c
onso
rtia
Shar
ed fo
r th
e pu
rpos
e of
join
t ac
tivi
ty
Ad
ds
tim
e an
d c
ost
Enl
arge
d c
onst
itue
ncy
poss
i-bi
litie
s fo
r en
hanc
ed s
ervi
ces;
re
duc
ed d
uplic
atio
n
Join
t Ven
ture
s
A le
gally
form
ed a
llian
ce in
whi
ch
mem
ber
orga
niza
tion
s m
aint
ain
join
t ow
ners
hip
to c
arry
out
sp
ecifi
c ta
sks/
serv
ices
Defi
ned
tim
e ag
reem
ent t
ied
to
purp
ose
of c
olla
bora
tion
; oft
en a
le
gal a
gree
men
t and
som
etim
es
the
crea
tion
of a
noth
er le
gal
enti
ty to
car
ry o
ut c
olla
bora
tive
w
ork
Shar
ed d
ecis
ion-
m
akin
g; jo
int
gove
rnan
ce
Ad
ds
tim
e an
d c
ost
Enl
arge
d c
onst
itue
ncy
poss
i-bi
litie
s fo
r en
hanc
ed s
ervi
ces,
po
ssib
le e
ffici
enci
es o
f sca
le,
red
uced
dup
licat
ion
of
sele
cted
act
ivit
ies
ORGANIZATIONAl STRUCTURE
Mer
gers
A s
tatu
tori
ly d
efine
d a
llian
ce in
w
hich
two
or m
ore
orga
niza
tion
s m
erge
thei
r ac
tivi
ties
, pro
gram
s,
staf
fs a
nd in
fras
truc
ture
bas
ed o
n m
utua
l agr
eem
ent
Perm
anen
t wit
h po
ssib
le c
avea
ts
that
ret
ain
som
e as
pect
s of
the
mer
ged
org
aniz
atio
n
Tra
nsfe
rred
to th
e ac
cept
ing
enti
ty
Maj
or im
pact
on
one
or a
ll pa
rtic
ipat
-in
g or
gani
zati
ons
re: o
rgan
izat
iona
l cu
ltur
e, s
taffi
ng,
wor
k re
spon
sibi
litie
s
Enl
arge
d c
onst
itue
ncy
poss
i-bi
litie
s fo
r en
hanc
ed s
ervi
ces,
po
ssib
le e
ffici
enci
es o
f sca
le,
red
uced
dup
licat
ion;
pos
sibl
e re
duc
ed c
osts
due
to c
onso
li-d
atio
n of
infr
astr
uctu
re
Diss
olut
ion
The
tran
sfer
of p
rogr
ams,
ser
vice
s,
asse
ts a
nd li
abili
ties
of a
noth
er
orga
niza
tion
in c
ase
an o
rgan
iza-
tion
is w
ind
ing
dow
n or
goi
ng
bank
rupt
Perm
anen
t and
on
acqu
irin
g or
gani
zati
on’s
term
s A
cqui
ring
org
ani-
zati
on d
ecid
es; i
n ca
se o
f ban
krup
tcy
dec
isio
ns a
re m
ade
by th
e A
ttor
ney
Gen
eral
or
Cou
rts
Los
s of
iden
tity
for
‘acq
uire
d’ o
rgan
iza-
tion
Pote
ntia
l for
loss
of s
ervi
ces
but i
f ini
tiat
ed b
y an
org
aniz
a-ti
on it
self
, can
lead
to r
educ
ed
dup
licat
ion
and
enh
ance
d
serv
ices
for
cons
titu
ents

110 u n d e r s t a n d i n g B o s t o n
Executive Summary:1. National Center for Charitable Statistics, Business Master File.
2. MA Division of Unemployment Assistance.
3. American Community Survey of the US Census.
4. MassINC, Mass Jobs: Meeting the Challenges of a Shift-ing Economy, Chapter 1, p. 48.
5. Net working capital is current assets (cash, receiv-ables, inventory or prepaid expenses) less current liabilities (unpaid bills, grants payable and deferred revenue).
6. While typically one would look at the current ratio, which is the ratio between current assets and current liabilities. Many nonprofits report no current liabilities rendering the current ratio incomputable. Therefore the study reports the inverse current ratio.
7. Net assets is the accumulation of surpluses and defi-cits over the organization’s operating history, with a positive number indicating that accumulated surpluses exceed accumulated losses.
8. Massachusetts Nonprofit Network is the state’s asso-ciation of nonprofits. Formed in 2006, its mission is to strengthen Massachusetts through nonprofit advocacy, public awareness and capacity building. Its activities and networks spread across Massachusetts through eight geographic regions defined further in this report.
9. See Restructuring options chart , Appendix C.
Chapter One:The Massachusetts Nonprofit Sector – A Snapshot and Growth Trends 10. In a 1994 study, the IRS examined a sample of 501(c)3 organizations in the BMF file, and found that 21% of organizations listed that did not file an annual Form 990 return were either out of operation or untraceable. (National Center for Charitable Statistics’ Guide to Using NCCS Data, August 2006, p. 5)
11. MassINC, Mass Jobs: Meeting the Challenges of a Shifting Economy, Chapter 1, p. 48.
Chapter Two: Three Value Propositions: Financial Fitness by Organization Budget Size 12. DMA Health Strategies. Financial Health of the Providers in the Massachusetts Human Service System, October 2007. Available at: http://www.mass.gov/Eeohhs2/docs/eohhs/provider_financial_health_07.pdf.
13. DMA Health Strategies. Financial Health of the Providers in the Massachusetts Human Service System, October 2007. Available at: http://www.mass.gov/Eeohhs2/docs/eohhs/provider_financial_health_07.pdf.
14. Nonprofit Hospitals, Once for the Poor, Strike it Rich. Wall Street Journal. April 4, 2008, pg. A1.
Chapter Three: Financial Health Across 10 Industry Sectors15. Nonprofit Hospitals, Once for the Poor, Strike it Rich. Wall Street Journal. April 4, 2008, pg. A1.
Endnotes

111p a s s i o n & p u r p o s e : R a i s i n g t h e F i s c a l F i t n e s s B a r f o r M a s s a c h u s e t t s N o n p r o f i t s
Elizabeth k. keating, CPA, is a Visiting Assistant Profes-sor at the Carroll School of Management at Boston College. She is also an Associate Scholar at the Center for Nonprofits and Philanthropy at the Urban Institute. Her research focuses on nonprofit and governmental accountability, financial health retirement funding, employee compensation and benefits, and overhead. She has taught at Harvard University, Northwestern University, and New York University. She received her Ph.D in management from the Sloan School of Management at MIT and her MBA from the Stern School of Business at New York University. She is on the board of Phillips Brooks House Association (PBHA) and until recently served as Treasurer of ARNOVA, the nonprofit academic association.
Geeta Pradhan is Director of Programs at the Boston Foundation, responsible for the Foundation’s Hous-ing & Community Development, Civic Health & Civic Engagement and Nonprofit Sector portfolio. She manages the Foundation’s Nonprofit Sector strategy, which includes supporting Greater Boston’s nonprofit sector, generating research and dialogue on critical nonprofit concerns, building organizational capacity, and helping reposition the Massachusetts nonprofit sector. She helped create and launch the Massachu-setts Nonprofit Network — the state’s Association of Nonprofit Organizations and serves on its Board of Directors. Geeta received her undergraduate degree in architecture from New Delhi, India and her Master’s degree in Urban Design from Harvard University.
Gregory H. wassall is an Associate Professor of econom-ics at Northeastern University in Boston, Massachu-setts and director of the Economics Department’s graduate programs. He teaches and conducts research in the areas of public economics and the economics of art and culture. His research has been funded by the U.S. Department of Commerce, the Ford Founda-tion, the National Endowment for the Arts, the New England Foundation for the Arts, the six New England
state arts agencies, and several city and state govern-ments and regional agencies. He holds a Bachelor’s degree from Rensselaer Polytechnic Institute and a Ph.D. from Rutgers University.
Douglas DeNatale is the President of Community Logic, Inc., an independent consulting firm that specializes in the development of information systems for the cultural sector and managing qualitative research proj-ects. He has consulted for national foundations and institutions including the Ford Foundation, the Rock-efeller Foundation, the Library of Congress, Heritage Preservation, and the Smithsonian Institution, as well as a variety of regional and local organizations. Deeply focused on the cultural sector, Dr. DeNatale has produced a series of studies examining the economic health of the creative economy in New England (co-author with Gregory H. Wassall). He holds a Ph.D from the University of Pennsylvania.
About the Authors

112 u n d e r s t a n d i n g B o s t o n
Acknowledgements
Over the course of the past three years of this endeavor, several people have contributed by helping us under-stand and highlight the breadth, complexity and value of the sector. The authors wish to particularly acknowl-edge the following contributors who have provided ideas, input guidance, comments, and/or support to help accomplish this monumental task:
Beth Green (formerly of) Human Services Forum, Springfield; Catherine Gill, Nonprofit Finance Fund; Catherine Peterson, ArtsBoston, Inc.; Cathy Mogavero, Marlborough Regional Chamber of Commerce; Charlie McDermott, Massachusetts Cultural Council; David Kronberg, Greater Lowell Community Foundation; David Tory, Essex County Community Foundation; David Turcott, Nonprofit Alliance of Greater Boston; Emily Barman, Boston University; Jennifer Dowley, Berkshire Taconic Community Foundation; Jonathan Spack, Third Sector New England; Michael Weekes, Massachusetts Council for Human Service Providers; Patsy C. Lewis, Northeast Insti-tute for Quality Community Action; Rita Kottcamp, Massachusetts Division of Unemployment Assistance; Susan Nicholls, Massachusetts Nonprofit Network; Sylvia Dehass-Phillips, Davis Community Foundation; Thomas Pollack, The Urban Institute.
The authors also wish to thank Boston Foundation staff: Mary Jo Meisner, Barbara Hindley, David Trueblood, Andrew McDowell, Tim Davis, James Rooney and the Boston Foundation Program Department team for their help and guidance throughout this project, and Kate Canfield, Canfield Design, and Matt Mayerchak for their excellent graphic design and production.
