particle dynamics in a dense vibrated fluidized bed as revealed by diffusing wave spectroscopy
TRANSCRIPT
Available online at www.sciencedirect.com
(2008) 192–201www.elsevier.com/locate/powtec
Powder Technology 182
Particle dynamics in a dense vibrated fluidized bed as revealed by diffusingwave spectroscopy
V. Zivkovic, M.J. Biggs ⁎, D.H. Glass, P. Pagliai, A. Buts
Institute for Materials and Processes, University of Edinburgh, King's Buildings, Mayfield Road, Edinburgh, United Kingdom, EH9 3JL
Received 29 August 2007; received in revised form 29 November 2007; accepted 7 December 2007Available online 17 December 2007
Abstract
We report granular temperature data and long-time dynamics of mono-disperse glass particles in a three-dimensional dense bed subject tovertical sinusoidal vibrations over a wide range of conditions. The granular temperature of the particles was found to scale with the square of thepeak vibrational velocity. The mean time of flight between the collisions was found to scale with the inverse of the square of the peak vibrationalvelocity, whilst the mean free path of the particles was observed to scale with the inverse of this velocity. The movement of the particlesthroughout the bed, which was observed to be sub-diffusive over macroscopic timescales for all conditions considered here, appears to begoverned by collective motion of particles between cavities defined by their neighbours.© 2007 Elsevier B.V. All rights reserved.
Keywords: Granular temperature; Vibro-fluidized bed; Sub-diffusive; Jamming; Glassy dynamics; Caged dynamics
1. Introduction
Vibrated granular materials have received much attention overmany years because they are a simple example of dissipative non-equilibrium systems that demonstrate rich and complex behaviour[1,2]. They are, however, also of wide interest across industry. Forexample, flow of bulk solids from hoppers and silos is oftencontrolled through the application of vibration [3], whilst morerecent work has shown that vibration can also improve thefluidization of fine powders [4]. Vibration has long been known tocause segregation inmixtures of different sized particles [5] as wellas compaction, whether desired as in the manufacture of sinteredproducts [6] or otherwise [7]. Squires [8] has recently highlightedhow vibrated granular systems may lead to improved operation ofreactors, combustors and heat exchangers. Finally, vibration ofgranular materials is important in the construction industryincluding, for example, in the manufacture of building materials[9], soil improvement [10] and soil response to seismic events [11].
A key quantity in granular systems is the ‘granulartemperature’, which is defined as the mean of the square of thevelocity fluctuations about the mean velocity [12,13]. The
⁎ Corresponding author. Tel.: +44 131 650 5891; fax: +44 131 650 6551.E-mail address: [email protected] (M.J. Biggs).
0032-5910/$ - see front matter © 2007 Elsevier B.V. All rights reserved.doi:10.1016/j.powtec.2007.12.007
granular temperature underpins the kinetic theory of granularflows [14,15], which has been widely used to model various non-equilibrium granular systems [16–19], as well as theories for heattransfer in granular materials [20], erosion in fluidized beds [21]and granulation [22]. The validation of these theories demands theexperimental elucidation of the particle dynamics in general anddetermination of granular temperature in particular.
Much understanding of the dynamics of particles in verticallyvibrated fluidized beds (vibro-FBs) and associated granulartemperature data has been accumulated over the past decade ormore using high-speed video imaging [23–31], nuclear magneticresonance [32,33], and positron emission particle tracking (PEPT)[34–37]. Various constraints inherent to these methods –multiplelight scattering for video methods, small bed-to-particle diameterratios in NMR, and limited spatial and temporal resolutions –mean they have all been restricted to one particle thick [23–28],relatively shallow [29–31], confined [32,33] or dilute three-dimensional (3D) [34–37] beds.
A few methods have been (or in principle can be) applied todense systems not accessible to video-based methods, NMR andPEPT including solids pressure-data inversion [38], mechanicalspectroscopy [39,40], which involves using the Langevinequation to interpret the random angular motion of a torsionalpendulum immersed in the granular material, and the light

193V. Zivkovic et al. / Powder Technology 182 (2008) 192–201
scattering based techniques of diffusing wave spectroscopy(DWS) [41] and speckle visibility spectroscopy (SVS) [42]. Thepressure-data based approach is, however, limited to the wallregion, whilst mechanical spectroscopy is an intrusive methodthat appears to give results that depend on the nature of theprobe used [40]. Both DWS and SVS, on the other hand, areneither intrusive nor restricted to the wall region, yet they areable to probe length and timescales well below those accessibleto NMR, their nearest rival in this regard.
The single DWS-based study to date of dense 3D vibro-FBs[41] was very limited in scope, focussing on a single frequencyand short-time dynamics of the particles. The SVS study [42] wassimilarly limited, focusing on describing a new method ratherthan the phenomena observed. We, therefore, undertook a farmore detailed study of the dynamics of particles in a dense 3Dvibro-FB using DWS in which we considered both the short andlong-time behaviour of the particles across a wide range ofconditions and at various point in the bed— this study is reportedhere. We first outline the experimental details, including anoverview of DWS and details pertaining to the apparatus and theparticulatematerial, and the experimental procedures used. This isfollowed by presentation of the results obtained, which includethe particle dynamic regimes observed and the variation of thegranular temperature with process conditions and height abovethe base of the bed, and their discussion.
2. Experimental details
2.1. Overview of diffusing wave spectroscopy
Diffusing wave spectroscopy (DWS), which is described indetail by Weitz and Pine [43], is a light-scattering technique thatcan be used to determine the dynamics of dense dispersed phasemedia such as turbid colloids and fluidized beds. Light-scatteringtechniques involve irradiating the medium of interest with lightand then measuring the temporal intensity fluctuations of the
Fig. 1. Schematic of the process that underpins diffusing wave spectroscopy (DWS).the moving particles (shown as grey circles) before exiting the medium to be pickedincident beam enters is said to be backscattered, whilst that which leaves through thebackscattered beams, which can be characterised in terms of temporal autocorrelatidetermine the dynamics of the light-scattering particles of the medium.
scattered light arising from the motion of the scatterers (which arethe particles in the case here). These intensity fluctuations can becharacterised by a temporal autocorrelation function whosebehaviour can be related quantitatively to the motion of thescatterers through mathematical models. In traditional dynamiclight scattering, this model assumes the photons are scattered atmost once — the method is, therefore, limited to dilute systems.Diffusing wave spectroscopy, on the other hand, is valid in theopposite limit: dense systems where the light is scattered so manytimes, Fig. 1, that it may be assumed that the photons areundergoing a random walk through the medium. Unbiasedrandom walks can be described by a purely diffusive process,which is exploited in DWS to relate the dynamics of the scatterersto the temporal autocorrelation function of the intensity.
2.2. Experimental setup
The experimental apparatus is illustrated in Fig. 2. Thegranular material was held in a rigidly fixed rectangular columnconstructed from two 500mmhigh and 196mmwide borosilicateglass plates separated by two aluminium edges 14.5 mm thick.The granular material was subject to vertical vibrations at the baseof the column by a piston fixed to an air-cooled electromagneticdriven shaker (V721, LDS Ltd., Hertfordshire, UK) controlled bya Dactron COMET USB controller (LDS Ltd.) with feedbackfrom two integrated circuit piezoelectric accelerometers (model353B03, PCB Piezotronics Inc., NY, US) attached to the piston.The shaker was capable of delivering a range of differentvibrational modes at frequencies in the range of 5–4000 Hz,accelerations up to 70 g, and amplitudes as large as 12.7 mm.
The dynamics of the particles in the vibro-FB were studiedusing DWS in transmission mode [43–47]. This methodinvolves illuminating one side of the bed at the point of interestwith a ~2 mm diameter laser beam and collecting the scatteredlight from the opposite side of the bed over time, t, with a singlemode optical fibre (OZ Optics Ltd., Ottawa, Canada). A
A beam of light incident on the dispersed phase medium is multiply scattered byup by light intensity detectors. The light that exits from the face on which theopposite face is said to be transmitted — the fluctuations in the transmitted andon functions (see details in Section 2.4.2 and Fig. 4), can both be analysed to

Fig. 2. Schematic of experimental setup.
194 V. Zivkovic et al. / Powder Technology 182 (2008) 192–201
400 mW diode pumped solid state linearly polarized laser(Torus 532, Laser Quantum Ltd., Cheshire, UK) operating at awavelength of λ=532 nm in single longitudinal mode wasused. The collected light signal was bifurcated and fed into twomatched photomultiplier tubes (PMTs) to reduce spuriouscorrelations due to possible after-pulsing effects of the detector.The outputs from the PMTs were amplified and fed to a multi-tau digital correlator (Flex 05, Correlator.com, US), whichperformed a pseudo cross-correlation analysis in real time togive the intensity autocorrelation function (IACF), g2(t), thatwas stored on a PC for further offline analysis as detailed below.Both the laser and the fibre optic cable were mounted on linearstages so that different points above the base of the vibro-FBcould be investigated with ease.
2.3. Particulate material
The particulate material, which was selected to ensure that allexperiments were conducted in the DWS regime, consisted ofsemi-transparent, strongly light-absorbing, spherical glass
Table 1Sinusoidal forcing frequency–acceleration combinations considered in this study alvelocity, vp, in mm s−1
Γ
50.00 69.48 96.54 134.14
1.5550.1540 0.0798 0.0413 0.021448.56 34.95 25.15 18.10
2.1600.2145 0.1112 0.0576 0.029867.45 48.54 34.93 25.14
3.0000.2980 0.1544 0.0800 0.041493.68 67.42 48.52 34.92
4.1700.4145 0.2147 0.1112 0.0576130.21 93.71 67.44 48.54
Note that the peak forcing velocity is constant across the diagonals. The acceleration a
particles of diameter dp=0.95±0.05 mm. In all cases thevibro-FB was filled to a depth of 75 mm with the material andsubject to at least 10 min of vibration at 50 Hz and 4.17 g beforeany data was collected so as to ensure, as far as was practicallypossible, that the bed was in a ‘stationary state’.
2.4. Experimental procedure
2.4.1. Study detailsThe vibro-FB was subject to sinusoidal vibrations in all cases
reported here. The vertical position of the piston at time, t, forsuch vibrational motion is governed by
yp ¼ A sin xtð Þ ð1Þ
where A and f=ω / 2π are the amplitude and frequencyrespectively. The associated peak vibrational velocity andacceleration of the piston are vp=ωA and ap=ω
2A respectively;the latter is presented here in the non-dimensional form, Γ=ap /g,where g is the acceleration due to gravity.
ong with the associated (top) amplitude, A, in mm, and (bottom) peak forcing
f (Hz)
186.38 258.97 359.84 500.00
0.0111 0.0057 0.0030 0.001513.03 9.37 6.75 4.860.0155 0.0080 0.0041 0.002118.09 13.02 9.37 6.740.0215 0.0111 0.0058 0.003025.13 18.09 13.02 9.370.0298 0.0155 0.0080 0.004134.93 25.14 18.09 13.02
nd frequency were controlled to a resolution of 0.005 g and 0.01 Hz respectively.

195V. Zivkovic et al. / Powder Technology 182 (2008) 192–201
The IACF was determined for the frequency/accelerationcombinations indicated in Table 1 at three points in the vibro-FBwhose coordinates were x=49 mm and y=25, 40 and 55 mm,where x is the horizontal distance from the centreline of the bed, andy is the distance from the vibrating base of the bed (see Fig. 2). Asthis table shows, the amplitude of the forcing varied from just underhalf a particle diameter at f=50 Hz and Γ=4.170, to just 0.15% ofthe particle size at f=500 Hz and Γ=1.555. Further inspection ofthis table also shows that the frequency/acceleration combinationswere selected so as to allow systematic study of the effect of peakvibrational velocity and amplitude over wide ranges.
2.4.2. Elucidating the particle dynamics and determining thegranular temperature
Intensity autocorrelation functions (IACF) were obtained bycollecting and correlating four blocks of data of 60 s long each.Each IACF was then subject to further analysis as follows. Thenormalized electric-field autocorrelation function (FACF), g1(t), was obtained from the intensity autocorrelation function, g2(t), using the Siegert relationship [43]
g2 tð Þ ¼ hI 0ð ÞI tð ÞihIi2 ¼ 1þ b1jgi tð Þj2 ð2Þ
where β1 is a phenomenological parameter determined from theintercept of the IACF; this phenomenological parameter wasalways found to be β1≈0.5, as expected. The mean squaredisplacement (MSD) of the particles, hDr2 tð Þi ¼ 6t=sk20 , wasdetermined by inverting the FACF using [43]
g1 tð Þ ¼L=l⁎þ4=3z0=l⁎þ2=3 sinh z0
l⁎
ffiffiffiffiffiffiffiffiffiffiffiffiffi6ts þ 3l⁎
la
q� �þ 2
3
ffiffiffiffiffiffiffiffiffiffiffiffiffi6ts þ 3l⁎
la
qcosh z0
l⁎
ffiffiffiffiffiffiffiffiffiffiffiffiffi6ts þ 3l⁎
la
q� �h i
1þ 49 � 6ts þ 4l⁎
3la
� �sinh L
l⁎
ffiffiffiffiffiffiffiffiffiffiffiffiffi6ts þ 3l⁎
la
q� �þ 4
3
ffiffiffiffiffiffiffiffiffiffiffiffiffi6ts þ 3l⁎
la
qcosh L
l⁎
ffiffiffiffiffiffiffiffiffiffiffiffiffiffiffi6ts þ 3l⁎
laÞ
q�
ð3Þwhere L is the sample thickness (14.5 mm here), l⁎ is thetransport mean free path, la is the absorption path length,z0=γl⁎ is the distance over which the incident light israndomized, τ=1 /k0
2D, D is the photon diffusion coefficient,and k0=2π /λ. The scaling factor, γ, was set to unity in line withcommon practice [43,46]. Note that this equation is for the casewhere light absorption is not insignificant.
The mean square particle velocity fluctuation about the meanvelocity, hδv2i, was derived from the short-time region of theMSD where ballistic motion occurs using [45–47]
tY0lim
hDr2 tð Þi ¼ hdv2it2: ð4Þ
2.4.3. Determination of the transport mean free path andabsorption path length
Eq. (3) requires knowledge of the transport mean free path,l⁎, and absorption path length, la, at the positions and conditionsconsidered. Because the experimental setup meant the incidentlight intensity could not be measured with ease and only theL=14.5 mm bed described above could be vibrated, a two-stagemethod based on the approach of Leutz and Rička [48] was usedto obtain the transport mean free path and absorption pathlength data — this method is described here.
The transport mean free path of a 0.1 vol.% aqueoussuspension of latex spheres (0.6 μm polystyrene, G. KiskerGbR., Germany) was first determined by obtaining the electric-field autocorrelation function of the suspension, and theninverting the following equation, which is valid in the weakabsorption limit [43]
g1 tð Þ ¼Ll⁎ þ 4
3
� � ffiffiffi6ts
q
1þ 8t3s
� �sinh L
l⁎
ffiffiffi6ts
q� �þ 4
3
ffiffiffi6ts
qcosh L
l⁎
ffiffiffi6ts
q� � : ð5Þ
A value of ls⁎=2.30±0.02 mm was obtained, which is veryclose to the theoretical value of 2.27 mm predicted by Miescattering [49,50].
A small amount of absorbing dye (Rhodamine B) was thenadded to the latex solution so as to bring its degree of ab-sorption into line with that of the strongly light-absorbingpacked beds used here (see below). The absorption path lengthof this dyed latex solution was then determined by fitting theequation [48]
I Lð Þ ¼ g l⁎; la; I0ð Þ exp �L=lað Þ ð6Þto the transmitted light intensity data, I(L), measured forseveral different thickness, L=15.5, 20.6 and 24.2 mm, of thedyed solution. A value of laS=5.5±0.2 mm was obtained.
The absorption path length of a well tapped packed bed ofthe particulate material was then determined by fitting Eq. (6) tothe transmitted intensity data for beds of thickness L=15.5,20.6 and 24.2 mm. A value of laP=4.0±0.2 was obtained. Thetransport mean free path of the packed bed was then determinedusing [48]
lal⁎¼ laR
l⁎R
IR Lð ÞI Lð Þ þ 2b
IR Lð ÞI Lð Þ � 1
� �ð7Þ
where the latex suspension data was identified with laR, lR⁎ andIR(L), and the packed bed data with la, l⁎ and I(L). A value oflp⁎=1.89±0.2 mm was obtained.
Our previous work on air fluidized beds [46,47] suggests thatthe absorption path length in such beds is not particularlysensitive to spatial position or solids density even for largedegrees of bed expansion. On this basis and taking into accountthat the degree of expansion experienced in the vibro-FBconsidered here was very small, we assumed here that the valueobtained for the packed bed was also valid for all points andconditions in the vibro-FB; i.e. laV=4.0±0.2. Using thisassumption, the transport mean free path of the vibro-FB wasdetermined using Eq. (7) for the points and conditions ofinterest, where the packed bed data were identified with laR, lR⁎
and IR(L), and the vibro-FB data with la, l⁎ and I(L).As Fig. 3 (a) shows, the ratio of the transmitted intensities of
the vibro-FB and packed bed, IV/ IP, were found to correlatevery well with the amplitude, A, of the vibrations. Thus,following Eq. (7), the transport mean free path of the vibro-FB,lV⁎, was correlated with A as indicated in Fig. 3(b). This figureshows that whilst lV⁎ increases with the amplitude of thevibrations and, to a lesser extent, the height above the base of

196 V. Zivkovic et al. / Powder Technology 182 (2008) 192–201
the vibro-FB, its variation over the range of conditions andpositions investigated here is small at ~10–15%.
3. Results and discussion
3.1. Overview of the particle dynamics observed
Fig. 4 shows an intensity autocorrelation function (IACF), g2(t), typical of mid-range frequencies along with the electric-fieldautocorrelation function (FACF), g1(t), and mean squaredisplacement (MSD), hΔr2i, derived from the analysis outlinedin Section 2.4.2. The IACF decays from g2≈1.5 over thetimescale of 10−6 ~10−5 s to an intermediate plateau ofg2≈1.01 where it remains before once again decaying overthe timescale of 10−1 ~101 s, this time towards unity. Tests [47]were undertaken to check that the double decay and intervening
Fig. 3. (a) Variation of the transmitted light intensity of a vibro-FB compared to thatof a packed bed, IV/ IP, with vibration amplitude, A, at x=49 mm and y=20mm fora range of accelerations (Γ=2.16 — green, Γ=3.00 — blue, Γ=5.79 — black)and frequencies (50Hz— circle, 70Hz— asterisk, 100Hz— diamond, 134Hz—triangle, 186 Hz— cross, 260 Hz— star, 360 Hz— square, 500 Hz— invertedtriangle). (b) Variation of transport mean free path of the vibro-FB, lV⁎, with thevibration amplitude, A, at x=49 mm for y=25 mm (circles), y=40 mm (squares)and y=55 mm (diamonds). See online version for colour plot. Lines are a guide forthe eye only.
Fig. 4. (a) The intensity autocorrelation function, g2, for the point x=49 mm andy=40 mm at Γ=3 and f=96.535 Hz (corresponding to vp=48.52 mm s−1 andA=0.08 mm). (b) The normalised electric-field autocorrelation function, g1,obtained from g2 using the Siegert relationship, Eq. (2). (c) The mean squaredisplacement obtained from g1 by inverting Eq. (3); the mean free path of theparticles, hλci, the average time between successive collisions, htci, and themean fluctuation velocity, hδv2i1/2, are indicated.
plateau observed here were not an experimental artefact [51]but, rather, a true reflection of the physics involved — we shallreturn to the origin of this double decay shortly.

Fig. 5. A schematic showing the three regimes experienced by the particles in the vibro-FB studied here: (a) ballistic dynamics at very short times in which the distancetravelled between collisions (i.e. free path) is λc; (b) ‘rattling’ around in cages defined by neighbouring particles at intermediate times; and (c) particles movingbetween cages in a cooperative manner at long times.
Fig. 6. The electric-field autocorrelation function for the point x=49 mm andy=40 mm at Γ=2.16 and f=500 Hz (corresponding to vp=674 mm s−1 andA=0.0021 mm). The insert shows a fraction of the oscillatory data on a lineartime axis to emphasis that the period of the oscillations is the same as theforcing. Note that the time axes have been non-dimensionalized by the forcingfrequency to emphasis that the period of the oscillations is the same as that of theforcing.
197V. Zivkovic et al. / Powder Technology 182 (2008) 192–201
Fig. 4(b) shows that the double decay seen in the IACF isclearly passed into the FACF, as one would expect given theSiegert relationship, Eq. (2). As the height of the intermediateplateau in the FACF is significantly enhanced relative to that ofthe IACF, it is now possible to see that whilst the second decaymay possibly go to g1≈0 (i.e. g2≈1), poor statistics at longtimes mean it is not possible to rule out further plateaus anddecays. A better picture of this long-time behaviour would beobtained using alternative light-scattering approaches [42,52].
The MSD shown in Fig. 4(c) is characterised by three welldefined regions. The first, which terminates at t≈50 μs for thiscase, is associated with the ballistic motion of the particles,with the curvature beyond t≈6 μs indicating a spread offluctuating velocities about the mean, which is estimated here ashδv2i1/2 =3.17 mm s−1 using the construction shown in thefigure. The associated time between collisions and the meanfree path are htci≈16 μs and htci=39 nm respectively; thesevalues are very much in line with those obtained by others fordense granular systems [44–47], and are indicative of the levelof resolution that is possible with DWS. Beyond the ballisticregion, the MSD remains unchanged up to t≈0.3 s, indicatingthat the particles are in effect moving about a point in spaceduring this period. The third region of the MSD, which islocated in this case over the timescale of t=0.3~6 s, appears tobe sub-diffusive where hΔr2i∼ tα with αb1. Inadequatestatistics at long times means it is not possible to say if adiffusive region – i.e. where α=1, which is indicated in Fig. 4(c) by the dashed line at long time – exists for this or any othercondition considered here.
On the basis of video images of a shallow air fluidized bedand MSDs derived for these images, Abate and Durian [30]identified four characteristic regimes: ballistic motion at shorttimes, caged motion at intermediate times where the MSD islargely unchanging as the particles rattle around in cagesdefined by neighbouring particles, sub-diffusive motion atlonger times where particles break free of their cages only tobecome trapped once again in new cages nearby, and finally ateven longer times, diffusive motion. Given the similaritiesbetween their MSDs and ours here, it is tempting to drawparallels and ascribe the decays and intervening plateau seen inthe ACFs accordingly. However, care needs to be exercised, asDWS is not particularly suited to the study of timescales that arecomparable to the forcing dynamics [42], and Eq. (3) is basedon certain approximations that may break down to a greater orlesser extent at longer times [53]. As the first decay in the ACFsoccurs at a time approximately 103 times smaller than theforcing period, it is safe to ascribe it to the ballistic motion of the
particles, Fig. 5(a). In order to attribute the intermediate plateauand second decay to caged motion and cage breaking, we appealto the results of others [52,54], who have obtained doubledecays similar to those observed here, albeit for colloidal gels,using light-scattering methods that are more appropriate forlonger time scales. Both these groups attribute the second decayby implication [52] or explicitly [54] to collective re-arrange-ment of the colloidal particles following a period of virtually nochange at all. On this basis, we believe that despite the potentialuncertainties associated with the long-time character of theMSDs obtained here, it is reasonable to ascribe the seconddecay in the ACFs of Fig. 4 and the preceding plateau toparticles moving in a collective manner between cages in whichthey remain trapped for some time, Fig. 5(b) and (c).
Fig. 6 shows an FACF typical of the higher frequenciesconsidered here. The FACF exhibits an initial decay at shorttimes followed by a finite number of decaying oscillations (or‘echoes’ [55]) whose period is identical to that of the forcing(see insert of this figure) and, finally, a gradual decrease in theFACF towards zero. If the amplitude of the echoes wereconstant, the bed would in effect be oscillating as a single bodyin tune with the base of the bed [55]. Decaying oscillations, onthe other hand, indicate that only a fraction of the particles are
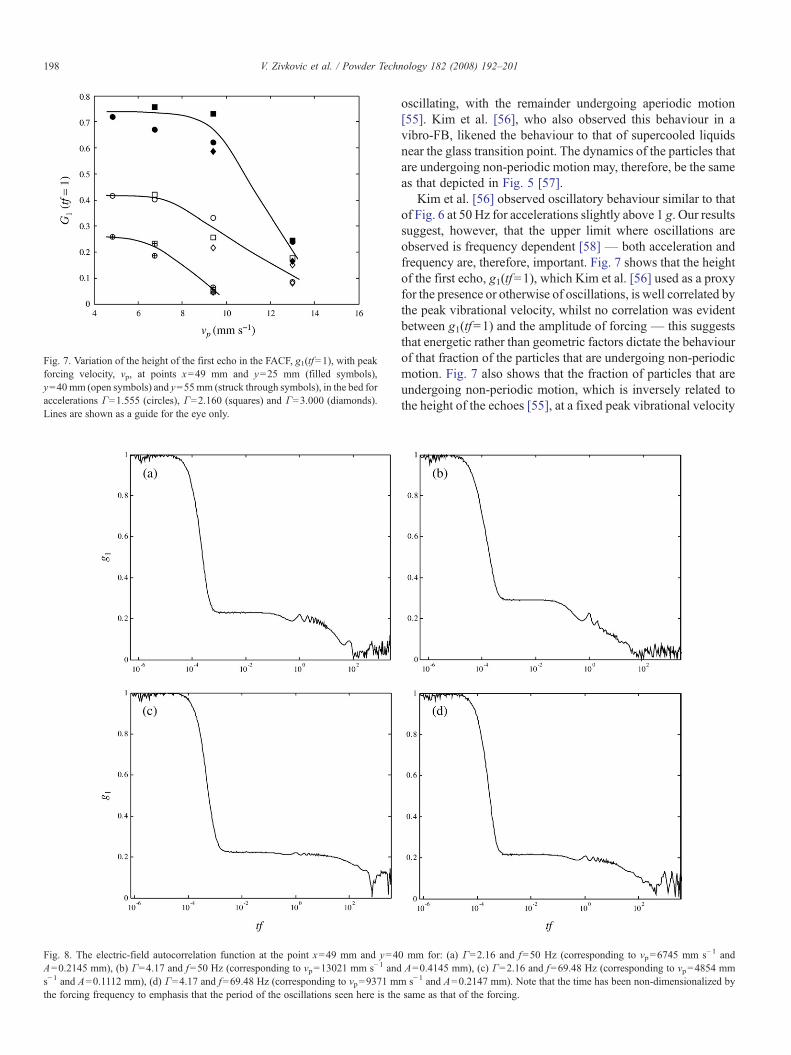
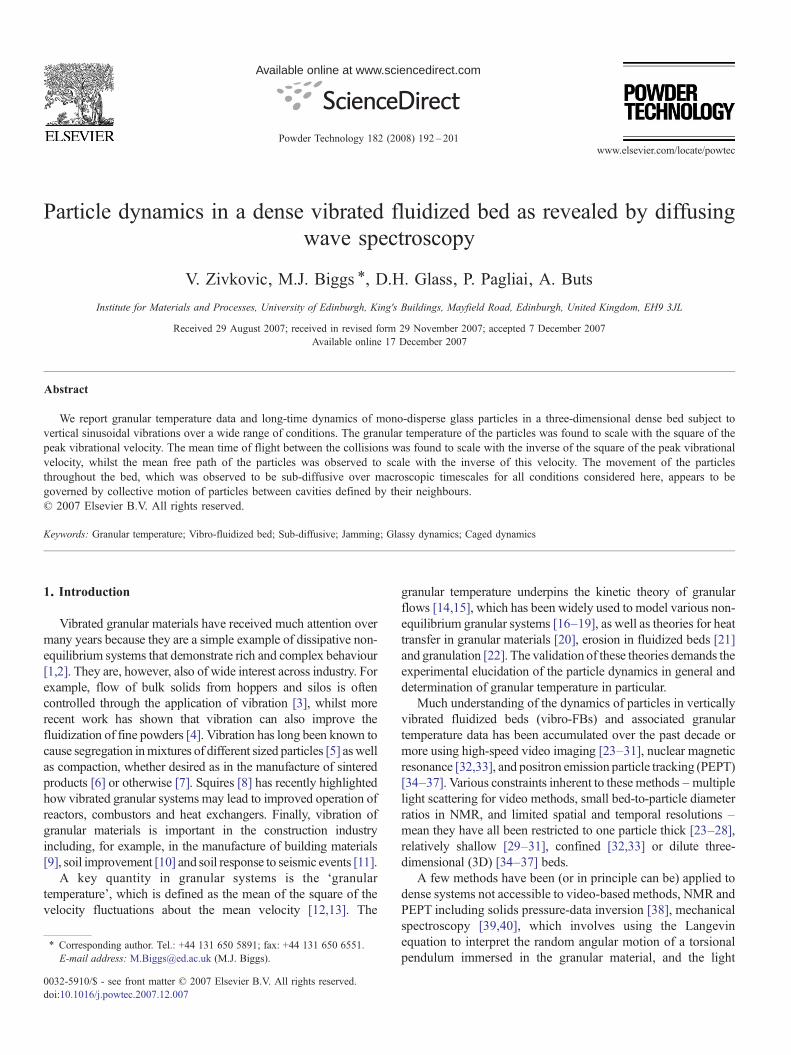
Fig. 7. Variation of the height of the first echo in the FACF, g1(tf=1), with peakforcing velocity, vp, at points x=49 mm and y=25 mm (filled symbols),y=40mm (open symbols) and y=55mm (struck through symbols), in the bed foraccelerations Γ=1.555 (circles), Γ=2.160 (squares) and Γ=3.000 (diamonds).Lines are shown as a guide for the eye only.
Fig. 8. The electric-field autocorrelation function at the point x=49 mm and y=4A=0.2145 mm), (b) Γ=4.17 and f=50 Hz (corresponding to vp=13021 mm s−1 ands−1 and A=0.1112 mm), (d) Γ=4.17 and f=69.48 Hz (corresponding to vp=9371 mthe forcing frequency to emphasis that the period of the oscillations seen here is the
198 V. Zivkovic et al. / Powder Technology 182 (2008) 192–201
oscillating, with the remainder undergoing aperiodic motion[55]. Kim et al. [56], who also observed this behaviour in avibro-FB, likened the behaviour to that of supercooled liquidsnear the glass transition point. The dynamics of the particles thatare undergoing non-periodic motion may, therefore, be the sameas that depicted in Fig. 5 [57].
Kim et al. [56] observed oscillatory behaviour similar to thatof Fig. 6 at 50 Hz for accelerations slightly above 1 g. Our resultssuggest, however, that the upper limit where oscillations areobserved is frequency dependent [58] — both acceleration andfrequency are, therefore, important. Fig. 7 shows that the heightof the first echo, g1(tf=1), which Kim et al. [56] used as a proxyfor the presence or otherwise of oscillations, is well correlated bythe peak vibrational velocity, whilst no correlation was evidentbetween g1(tf=1) and the amplitude of forcing — this suggeststhat energetic rather than geometric factors dictate the behaviourof that fraction of the particles that are undergoing non-periodicmotion. Fig. 7 also shows that the fraction of particles that areundergoing non-periodic motion, which is inversely related tothe height of the echoes [55], at a fixed peak vibrational velocity
0 mm for: (a) Γ=2.16 and f=50 Hz (corresponding to vp=6745 mm s−1 andA=0.4145 mm), (c) Γ=2.16 and f=69.48 Hz (corresponding to vp=4854 mm
m s−1 and A=0.2147 mm). Note that the time has been non-dimensionalized bysame as that of the forcing.

Fig. 10. Variation of (a) the mean time between collisions, htci, and (b) particlemean free path, hλci, with peak forcing velocity, vp, at the point x=49 mm andy=40 mm for accelerations of Γ=1.555 (circles), Γ=2.160 (squares),Γ=3.000 (diamonds) and Γ=4.170 (triangle).
199V. Zivkovic et al. / Powder Technology 182 (2008) 192–201
decreases with the distance above the base of the bed — thedegree of fluidization in effect increases with height in the bed.
The FACFs at the lowest frequencies considered here,examples of which are shown in Fig. 8, also include decayingechoes with a period equal to that of the forcing. These echoes,which are superimposed on the intermediate plateau or thesecond decay depending on the acceleration and frequency ofthe forcing, are much weaker than those observed at the upperend of the frequency range considered here (compare withFig. 6). The strength of the oscillations also appears to increaseas the acceleration of the forcing increases and its frequencydecreases (i.e. in effect, they tend to increase with the amplitudeand peak vibrational velocity), contrary to the high frequencybehaviour. Both this trend and the presence of echoes at 50 Hzfor accelerations as high as 4.17 g are also in stark contrast to theresults of Kim et al. [56], who observed no echoes at 50 Hz foraccelerations beyond 1.12 g. It is not clear precisely why thebehaviour seen here at low frequencies differs from that of Kimet al. [56] in these two respects as well as the higher frequencybehaviour observed here, but the differences in apparatus of thetwo studies suggest two possible causes: (1) the difference in theway the bed is vibrated – Kim and co-workers shake the bed asa whole whilst we ‘pump’ a piston at the base of a column – andthe presence of air in our system, which was removed in theexperiments of Kim et al. [56], could lead to greater oscillatorydriving of the particles at the lower frequencies whereamplitudes and peak velocities are significant, and (2) themuch smaller amplitude of forcing relative to the particle sizehere, could lead to fewer particles being able to take onaperiodic motion for the same energy input.
3.2. Granular temperature, mean time of free flight, and meanfree path
Fig. 9 shows that the granular temperature is correlated verywell with the peak vibrational velocity, vp, whilst there is no
Fig. 9. Variation of the mean velocity fluctuations about the mean, hδv2i1/2,with peak forcing velocity, vp, at the point x=49 mm and y=40 mm foraccelerations Γ=1.555 (circles), Γ=2.160 (squares), Γ=3.000 (diamonds)and Γ=4.170 (triangle). Lines are linear fits to the data and errors are no largerthan the symbols.
correlation with the vibrational acceleration. The data abovevp=18 mm s−1 appears to be well described by hδv2i1/2∼0.11vp,a scaling that appears both qualitatively and quantitatively to bevery much in line with that obtained by Yang and co-workers[32,33] using NMR in a relatively confined dense vibro-FB bed.The data below vp=18 mm s−1 is also described reasonably wellby a linear scaling, hδv2i1/2∼0.018vp. This crossover pointcorresponds very well to the point where echoes appear (see thedata for y=40 mm in Fig. 7), suggesting that it is near thejamming point [30,55,56].
The data here indicates that the granular temperature scaleswith the square of the peak vibrational velocity
hdv2ifv2p: ð8Þ
This scaling is in line with that obtained experimentally byothers for a thin bed [26], a shallow bed [29], a confined bed[32,33], and a bed similar to ours [41]. This scaling is also inline with a number of theoretical models, including those ofKumaran [16] and Warr et al. [24], who both obtain a scalingexponent of 2, and Martin et al. [59] who obtained a scalingexponent of 1.85±0.11 in the absence of significant wall

Fig. 11. Variation of the mean velocity fluctuations about the mean, hδv2i1/2,with height above the vibrating base at f=50 Hz (right triangle), f=70 Hz (lefttriangle), f=500 Hz (triangle). The errors are no larger than the symbols.
200 V. Zivkovic et al. / Powder Technology 182 (2008) 192–201
friction. These models are, however, restricted to relativelydilute systems, a point we shall return to further below.
Fig. 10 shows that both the mean time between collisions andthe mean free path of the particles decrease in a non-linearmanner as the peak vibrational velocity increases. The insert inFig. 10(a) indicates a scaling of
htcif 1v2p
ð9Þ
which, when combined with the scaling for the mean velocityfluctuations, gives
hkcif 1vp
: ð10Þ
Fig. 11, which shows the mean velocity fluctuations aboutthe mean as a function of the height above the bed base for threerepresentative frequencies, suggests that the granular tempera-ture varies little with height for the conditions investigated here.This lack of variation is at odds with the experimental data ofYou and Pak [41], who also studied a dense three-dimensionalvibro-FB, where an exponential increase in the granulartemperature with height was observed. The reason for thisdifference is not precisely clear, but the system of You and Pak[41] differed from that used here in a number of potentiallyimportant respects including the amplitudes – which were atleast 5dp compared to approximately 0.5dp here – and theabsence of gas in their bed, which You and Pak noted increasedin the granular temperature. The data of You and Pak [41] alsoappears to be at odds with that of other studies, albeit forgeometries [28] or densities [32–36] that differed from thoseconsidered here. In particular, whilst these studies revealed thatgranular temperature can change with height under someconditions, the changes were all far weaker than those ob-served by You and Pak [41] and were essentially linked to acorresponding variation in the solids density in every case, avariation which is barely seen in You and Pak [41] (~0.02%change across the bed height) or, indeed, here.
4. Conclusions
Using diffusing wave spectroscopy, we have elucidated thedynamics of particles in a dense three-dimensional fluidized bedin which the density variations are small, and have determinedthe granular temperature of particles as a function of thevibrational conditions and height above the base of the bed.
The granular temperature was found to scale very well withthe square of the peak vibrational velocity; no correlation wasobserved between granular temperature and other vibrationalvariables such as the acceleration or amplitude. The granulartemperature was found to vary little with height in the bed,although it was not possible to probe near the top and bottom ofthe bed where variations may be expected, due to limitations withthe experimental apparatus and data analysis procedures adopted.The mean time of flight between collisions was found to scaleinversely with the square of the peak forcing velocity, whilst themean free path of the particles scaled inversely with this velocity.
The longer time dynamics of the particles, which is depictedin Fig. 5, indicate that in systems such as that investigated here,macroscopic particle motion in the bed is governed by thecollective motion of particles between cavities in the bed,possibly by acquiring fluctuating velocities that are substan-tially greater than the local mean of the velocity fluctuations.This suggests that any model that seeks to describe densevibrated granular systems in which the density fluctuations aresmall must account for the distribution of fluctuating velocities,not just the mean, and must include spatial correlations. If this isthe case, the standard kinetic theory of granular systems [14,15]may not be appropriate for dense vibro-FBs such as thatinvestigated here without significant development.
Acknowledgements
We thank the EPSRC (EP/C546849) for the support of thisresearch.
References
[1] L.P. Kadanoff, Built upon sand: theoretical ideas inspired by granularflows, Rev. Mod. Phys. 71 (1999) 435–444.
[2] I.S. Aranson, L.S. Tsimring, Patterns and collective behaviour in granularmedia: theoretical concepts, Rev. Mod. Phys. 78 (2006) 641–692.
[3] J.C. Poncet, Total flow—maximizing storage in bins, hoppers, bunkers, andsilos by the use of novel correctly applied vibrations, From Powder to Bulk,Professional Engineering for IMechE, Bury St Edmunds, 2000, pp. 169–184.
[4] C. Xu, J. Zhu, Parametric study of fine particle fluidization undermechanical vibration, Powder. Technol. 161 (2006) 135–144.
[5] A. Kudrolli, Size separation in vibrated granular matter, Rep. Prog. Phys.67 (2004) 209–247.
[6] R. Linemann, J. Runge, M. Sommerfeld, U. Weiβgüttel, Compaction ofpowders due to vibrations and shock, Part. Part. Syst. Charact. 21 (2004)261–267.
[7] E.P. Maynard, Practical solutions for solving bulk solids flow problems,Proceedings of the 46th Annual Cement Industry Technical Conference,IEEE, New York, 2004, pp. 139–147.
[8] A.M. Squires, Chemical process opportunities for vibrated powders 2. Inthe field, Powder Technol. 147 (2004) 10–19.
[9] M.I. Safawi, I. Iwaki, T. Miura, A study on the applicability of vibration infresh high fluidity concrete, Cem. Concr. Res. 35 (2005) 1834–1845.

201V. Zivkovic et al. / Powder Technology 182 (2008) 192–201
[10] K.R. Massarsch, Deep compaction of granular soil, in: S. Wu, W. Zhang,R.D. Woods (Eds.), A look Back for Future Geotechnics, A.A. Balkema,Rotterdam (Netherlands), 2001, pp. 181–223.
[11] K. Ishihara, Ground behaviour during earthquake and its effect on foundationpiles, in: S. Wu, W. Zhang, R.D. Woods (Eds.), A look Back for FutureGeotechnics, A.A. Balkema, Rotterdam (Netherlands), 2001, pp. 15–91.
[12] S. Ogawa, Multitemperature theory of granular materials, in: S.C. Cowin,M. Satake (Eds.), Proceedings of the US–Japan seminar on continuummechanical and statistical approaches in the mechanics of granularmaterials; 1978; Sendai, Japan: Gakajutsu Bunken Fukyu-Kai: Tokyo,Japan, 1978, pp. 208–217.
[13] S. Ogawa, A. Umemura, N. Oshima, On the equations of fully fluidizedgranular materials, J. Appl. Math. Phys. 31 (1980) 483–493.
[14] J.T. Jenkins, S.B. Savage, A theory for the rapid flow of identical, smooth,nearly elastic, spherical-particles, J. Fluid Mech. 130 (1983) 187–202.
[15] C.K.K. Lun, S.B. Savage, D.J. Jeffrey, N. Chepurniy, Kinetic theories forgranular flow — inelastic particles in Couette-flow and slightly inelasticparticles in a general flowfield, J. Fluid Mech. 140 (1984) 223–256.
[16] V. Kumaran, Kinetic theory for a vibro-fluidized bed, J. Fluid Mech. 364(1998) 163–185.
[17] M.J.V. Goldschmidt, J.A.M. Kuipers, W.P.M. van Swaaij, Hydrodynamicmodelling of dense gas-fluidised beds using the kinetic theory of granularflow: effect of coefficient of restitution on bed dynamics, Chem. Eng. Sci.56 (2001) 571–578.
[18] D. Gidaspow, J. Jung, R.K. Singh, Hydrodynamics of fluidization usingkinetic theory: an emerging paradigm, Powder Technol. 148 (2004) 123–141.
[19] R. Delannay, M. Louge, P. Richard, N. Taberlet, A. Valance, Towards atheoretical picture of dense granular flows down inclines, Nat. Matters 6(2007) 99–108.
[20] M.L. Hunt, Discrete element simulations for granular material flows:effective thermal conductivity and self-diffusivity, Int. J. Heat MassTransfer 40 (1997) 3059–3068.
[21] R.W.Lyczkowski, J.X. Bouillard, State-of-the-art reviewof erosionmodelingin fluid/solids systems, Pror. Energy Combust. Sci. 28 (2002) 543–602.
[22] H.S. Tan, M.J.V. Goldschmidt, R. Boerefijn, M.J. Hounslow, A.D. Salman,J.A.M. Kuipers, Building population balance model for fluidized bed meltgranulation: lessons from kinetic theory of granular flow, Powder Technol.142 (2004) 103–109.
[23] S. Warr, G.T.H. Jacques, J.M. Huntley, Tracking the translational androtational motion of granular particles: use of high-speed photography andimage processing, Powder Technol. 81 (1994) 41.
[24] S. Warr, J.M. Huntley, G.T.H. Jacques, Fluidization of a two-dimensionalgranular system: experimental study and scaling behaviour, Phys. Rev. E52 (1995) 5583–5595.
[25] R.D. Wildman, J.M. Huntley, J.P. Hansen, Self-diffusion of grains in atwo-dimensional vibrofluidized bed, Phys. Rev. E 60 (1999) 7066–7075.
[26] K. Feitosa, N. Menon, Breakdown of energy equipartition in a 2D binaryvibrated granular gas, Phys. Rev. Lett. 88 (2002) 198301.
[27] C.H. Tai, S.S. Hsiau, Dynamic behaviors of powders in a vibrating bed,Powder Technol. 139 (2004) 221–232.
[28] S.C. Yang, Density effect on mixing and segregation processes in avibrated binary granular mixture, Powder Technol. 164 (2006) 65–74.
[29] W. Losert, D.G. Cooper, J. Delour, A. Kudrolli, J.P. Gollub, Velocitystatistics in excited granular media, Chaos 9 (1999) 682–690.
[30] A.R. Abate, D.J. Durian, Approach to jamming in an air-fluidized bed,Phys. Rev. E 74 (2006) 031308.
[31] G.W. Baxter, J.S. Olafsen, The temperature of a vibrated granular gas,Granul. Matter 9 (2007) 135–139.
[32] X. Yang, C. Huan, D. Candela, R.W. Mair, R.L. Walsworth, Measurementsof grain motion in a dense, three-dimensional granular fluid, Phys. Rev.Lett. 88 (2002) 044301.
[33] C. Huan, X. Yang, D. Candela, R.W. Mair, R.L. Walsworth, NMRexperiments on a three-dimensional vibrofluidized granular medium, Phys.Rev. E 69 (2004) 041302.
[34] R.D. Wildman, J.M. Huntley, J.P. Hansen, D.J. Parker, D.A. Allen, Single-particle motion in three-dimensional vibrofluidized granular beds, Phys.Rev. E 62 (2000) 3826.
[35] R.D. Wildman, J.M. Huntley, D.J. Parker, Granular temperature profiles inthree-dimensional vibrofluidized granular beds, Phys. Rev. E 63 (2001)061311.
[36] R.D. Wildman, D.J. Parker, Coexistence of two granular temperatures inbinary vibrofluidized beds, Phys. Rev. Lett. 88 (2002) 064301.
[37] R.D. Wildman, J.M. Huntley, Scaling exponents for energy transport anddissipation in binary vibro-fluidized granular beds, Phys. Fluids 15 (2003)3090.
[38] E. Falcon, S. Aumaitre, P. Evesque, F. Palencia, C. Lecoutre-Chabot, S.Fauve, et al., Collision statistics in a dilute granular gas fluidized byvibrations in low gravity, Europhys. Lett. 74 (2006) 830.
[39] G. D'Anna, P. Mayor, A. Barrat, V. Lotero, F. Nori, Observing Brownianmotion in vibration-fluidized granular matter, Nature 424 (2003) 909.
[40] P. Mayor, G. D'Anna, G. Gremaud, A. Barrat, V. Lotero mechanicalspectroscopy of vibrated granular matter, Mater. Sci. Eng. A 442 (2006)256–262.
[41] S.Y. You, H.K. Pak, Study of the short-time dynamics of a thick and highlydense vibro-fluidized granular system by using diffusing wave spectro-scopy, J. Korean Phys. Soc. 38 (2001) 577–581.
[42] P.K. Dixon, D.J. Durian, Speckle visibility spectroscopy and variablegranular fluidization, Phys. Rev. Lett. 90 (2003) 184302.
[43] D.A. Weitz, D.J. Pine, Diffusing-wave spectroscopy, in: W. Brown (Ed.),Dynamic Light Scattering: TheMethod and Some Applications, ClarendonPress, Oxford, 1993, pp. 652–720.
[44] S.Y. You, H.K. Pak, Study of the short-time dynamics of a thick and highlydense vibro-fluidized granular system by using diffusing wave spectroscopy,J. Korean Phys. Soc. 38 (2001) 577–581.
[45] N. Menon, D.J. Durian, Diffusing-wave spectroscopy of dynamics in athree-dimensional granular flow, Science 275 (1997) 1920–1922.
[46] L. Xie, M.J. Biggs, D. Glass, A.S. McLeod, S.U. Egelhaaf, G. Petekidis,Granular temperature distribution in a gas fluidized bed of hollowmicroparticles prior to onset of bubbling, Europhys. Lett. 74 (2006)268–274.
[47] M.J. Biggs, D. Glass, L. Xie, V. Zivkovic, A. Buts, M.A.C. Kounders,Granular temperature in a gas fluidized bed, Granul. Matter 10 (2008)63–73.
[48] W. Leutz, J. Rička, On light propagation through glass bead packings, Opt.Commun. 126 (1996) 260–268.
[49] H.C. van der Hulst, Light Scattering by Small Particles, John Wiley andSons, New York, 1957.
[50] L.F.R. Ochoa, Structure, Dynamics and Photon Diffusion in Charge-stabilized Colloidal Suspensions, PhD Thesis, Institut de Physique,Université de Fribourg, Switzerland, 2004.
[51] P.A. Lemieux, D.J. Durian, Investigating non-Gaussian scatteringprocesses by using nth-order intensity correlation functions, J. Opt. Soc.Am. A 16 (1999) 1651–1664.
[52] V. Viasnoff, F. Lequeux, D.J. Pine, Multispeckle diffusing-wave spectro-scopy: a tool to study slow relaxation and time-dependent dynamics, Rev.Sci. Instrum. 73 (2002) 2336.
[53] D.J. Durian, Accuracy of diffusing-wave spectroscopy theories, Phys. Rev.E 51 (1995) 3350–3358.
[54] H. Bissig, S. Romer, L. Cipelletti, V. Trappe, P. Schurtenberger,Intermittent dynamics and hyper-aging in dense colloidal gels, Phys.Chem. Commun. 6 (2003) 21–23.
[55] P. Hébraud, F. Lequeux, J.P. Munch, D.J. Pine, Yielding and rearrange-ments in disordered emulsions, Phys. Rev. Lett. 78 (1997) 4657–4660.
[56] K. Kim, J.K. Moon, J.J. Park, H.K. Kim, H.K. Pak, Jamming transition in ahighly dense granular system under vertical vibration, Phys. Rev. E 72(2005) 011302.
[57] L. Berthier, L.F. Cugliandolo, J.L. Iguain, Glassy systems under time-dependent driving forces: application to slow granular rheology, Phys.Rev. E 63 (2001) 051302.
[58] Oscillations were observed at accelerations up to 4.17 g, 3 g, 2.16 g and1.555 g for 500 Hz, 359.84 Hz, 258.97 Hz and 186.38 Hz respectively.
[59] T.W. Martin, J.M. Huntley, R.D. Wildman, Hydrodynamic model for avibrofluidized granular bed, J. Fluid Mech. 535 (2005) 325–345.