parallel imaging of drosophila embryos for quantitative...
TRANSCRIPT

RESOURCE ARTICLE
Parallel imaging of Drosophila embryos for quantitative analysisof genetic perturbations of the Ras pathwayYogesh Goyal1,2,*, Thomas J. Levario3,*, Henry H. Mattingly1,2, Susan Holmes4, Stanislav Y. Shvartsman1,2,‡ andHang Lu3,‡
ABSTRACTThe Ras pathway patterns the poles of the Drosophila embryoby downregulating the levels and activity of a DNA-bindingtranscriptional repressor Capicua (Cic). We demonstrate that thespatiotemporal pattern of Cic during this signaling event can beharnessed for functional studies of mutations in the Ras pathway inhuman diseases. Our approach relies on a new microfluidic devicethat enables parallel imaging of Cic dynamics in dozens of liveembryos.We found that although the pattern of Cic in early embryos iscomplex, it can be accurately approximated by a product of onespatial profile and one time-dependent amplitude. Analysis of thesefunctions of space and time alone reveals the differential effects ofmutations within the Ras pathway. Given the highly conserved natureof Ras-dependent control of Cic, our approach provides newopportunities for functional analysis of multiple sequence variantsfrom developmental abnormalities and cancers.
KEY WORDS: Microfluidics, Ras, Mutations, Capicua, SVD
INTRODUCTIONThe Ras signaling pathway is a highly conserved regulator of adultand developing animal tissues. Studies in model organisms wereessential in delineating this critical pathway via genetic screens thatrelied on analyses of the morphological defects in specific Ras-dependent structures, such as the insect eye or nematode vulva(Brunner et al., 1994; Freeman, 1996; Han and Sternberg, 1990;Han et al., 1993; Kornfeld et al., 1995; O’Neill et al., 1994;Schupbach andWieschaus, 1986; Sternberg and Han, 1998). One ofthe main advantages of these screens, which continue to reveal newcomponents and interactions, is their ability to examine largenumbers of samples, providing the basis for follow-up studies atmolecular and cellular levels. With the advent of live imaging, itbecame possible to not only analyze the ultimate morphologicaloutcomes of genetic perturbations, but also to monitor the dynamicsof signaling. However, most live-imaging studies are limited in thenumber of organisms that can be examined at any given time, which
is in contrast to the high-throughput nature of earlier work in modelgenetic systems. Here, we present an experimental and analyticalstrategy that addresses this problem, providing new opportunitiesfor the quantitative analysis of the Ras pathway and its geneticperturbations.
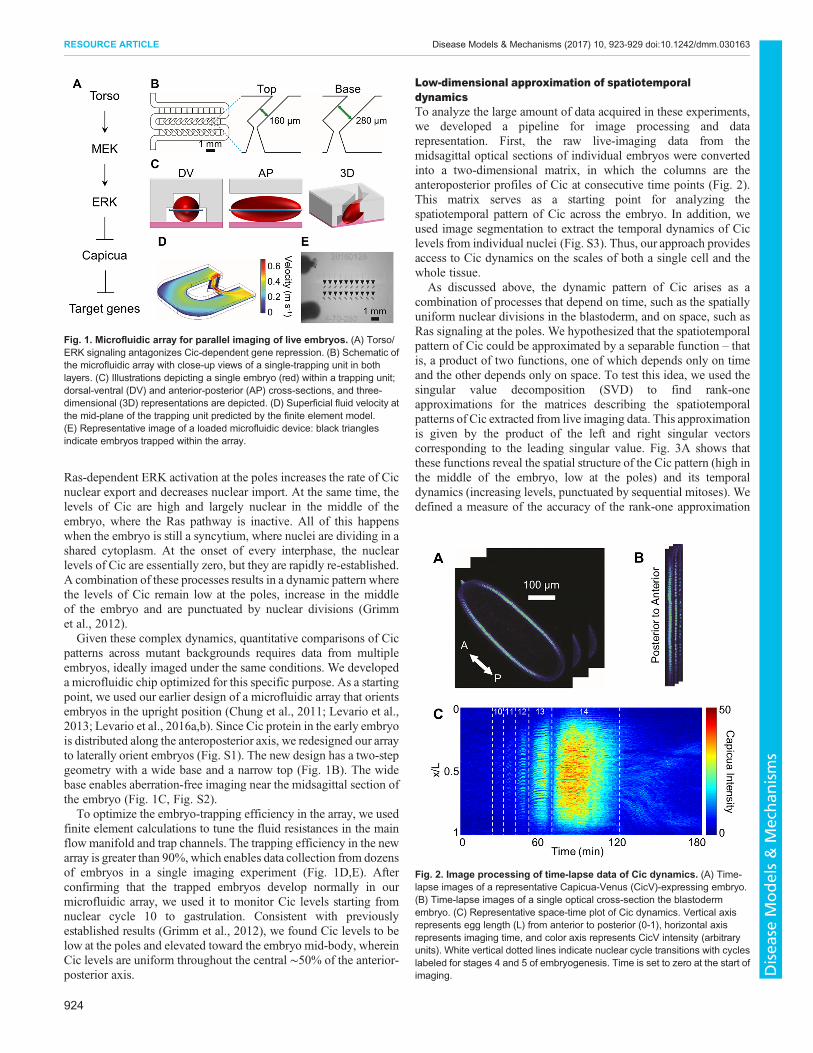
Our strategy is based on parallel imaging of the early Drosophilaembryo, a system that combines low cost, simple anatomy, andamenability to a wide range of genetic manipulations. We focus onRas signaling during the time when the embryonic termini arepatterned by a locally activated receptor tyrosine kinase (RTK),Torso (Casanova and Struhl, 1989). Torso is active only at the poles,reflecting the localized processing of its secreted ligand (Furriolsand Casanova, 2003). Signaling through the Ras pathway, Torsoinduces the dual phosphorylation and activation of the Extracellularsignal-regulated kinase (ERK), an enzyme with multipleintracellular substrates (Fig. 1A) (Gabay et al., 1997). One of themain substrates of ERK in the early embryo is a DNA-bindingtranscriptional repressor Capicua (Cic), which acts as a commonsensor of the Ras pathway in adult and embryonic tissues (Futranet al., 2013; Jiménez et al., 2000; Jiménez et al., 2012; Lee et al.,2002; Liao et al., 2017; Okimoto et al., 2016). In response to directphosphorylation by ERK, Cic is exported from the nucleus anddegraded in the cytoplasm, enabling the expression of genes neededfor the formation of nonsegmented terminal structures in the futurelarva (Grimm et al., 2012; Johnson et al., 2017; Lim et al., 2013).
The spatial pattern of Cic in the early embryo is very sensitive toRas activation, suggesting that it could be used to develop a strategyfor quantitative comparison of mutations associated withderegulated Ras signaling. However, this pattern is very dynamic,reflecting the fact that Ras-dependent control of Cic coincides withnuclear divisions. Therefore, quantitative comparison of Cicpatterns requires live imaging. Until recently, live imaging of Cichas been possible only in one embryo at a time (Grimm et al., 2012).We have designed a microfluidic device with new features forparallel imaging of Cic dynamics in dozens of embryos anddemonstrate that this enables quantitative analysis of the differentialeffects of mutations within the Ras pathway. Given the highlyconserved nature of the signaling cascade that leads from Torsoactivation to Cic downregulation, our approach can be used forfunctional analysis of the rapidly accumulating Ras pathwaymutations found in human diseases (Hanahan and Weinberg,2011; Jindal et al., 2015; Rauen, 2013).
RESULTSMicrofluidic device for parallel imaging of Cic dynamics inembryosThe spatiotemporal pattern of Cic in the early embryo reflects thecombined effects of spatially uniform translation of Cic frommaternally deposited transcript, localized control of Cic nuclearlocalization and degradation, and ongoing nuclear division.Received 30 March 2017; Accepted 8 May 2017
1Department of Chemical and Biological Engineering, Princeton University,Princeton, NJ 08544, USA. 2Lewis-Sigler Institute for Integrative Genomics,Princeton University, Princeton, NJ 08544, USA. 3School of Chemical andBiomolecular Engineering, Georgia Institute of Technology, Atlanta, GA 30332,USA. 4Department of Statistics, Stanford University, Stanford, CA 94305, USA.*These authors contributed equally to this work
‡Authors for correspondence ([email protected]; [email protected])
H.L., 0000-0002-6881-660X
This is an Open Access article distributed under the terms of the Creative Commons AttributionLicense (http://creativecommons.org/licenses/by/3.0), which permits unrestricted use,distribution and reproduction in any medium provided that the original work is properly attributed.
923
© 2017. Published by The Company of Biologists Ltd | Disease Models & Mechanisms (2017) 10, 923-929 doi:10.1242/dmm.030163
Disea
seModels&Mechan
isms
Ras-dependent ERK activation at the poles increases the rate of Cicnuclear export and decreases nuclear import. At the same time, thelevels of Cic are high and largely nuclear in the middle of theembryo, where the Ras pathway is inactive. All of this happenswhen the embryo is still a syncytium, where nuclei are dividing in ashared cytoplasm. At the onset of every interphase, the nuclearlevels of Cic are essentially zero, but they are rapidly re-established.A combination of these processes results in a dynamic pattern wherethe levels of Cic remain low at the poles, increase in the middleof the embryo and are punctuated by nuclear divisions (Grimmet al., 2012).Given these complex dynamics, quantitative comparisons of Cic
patterns across mutant backgrounds requires data from multipleembryos, ideally imaged under the same conditions. We developeda microfluidic chip optimized for this specific purpose. As a startingpoint, we used our earlier design of a microfluidic array that orientsembryos in the upright position (Chung et al., 2011; Levario et al.,2013; Levario et al., 2016a,b). Since Cic protein in the early embryois distributed along the anteroposterior axis, we redesigned our arrayto laterally orient embryos (Fig. S1). The new design has a two-stepgeometry with a wide base and a narrow top (Fig. 1B). The widebase enables aberration-free imaging near the midsagittal section ofthe embryo (Fig. 1C, Fig. S2).To optimize the embryo-trapping efficiency in the array, we used
finite element calculations to tune the fluid resistances in the mainflow manifold and trap channels. The trapping efficiency in the newarray is greater than 90%, which enables data collection from dozensof embryos in a single imaging experiment (Fig. 1D,E). Afterconfirming that the trapped embryos develop normally in ourmicrofluidic array, we used it to monitor Cic levels starting fromnuclear cycle 10 to gastrulation. Consistent with previouslyestablished results (Grimm et al., 2012), we found Cic levels to below at the poles and elevated toward the embryo mid-body, whereinCic levels are uniform throughout the central ∼50% of the anterior-posterior axis.
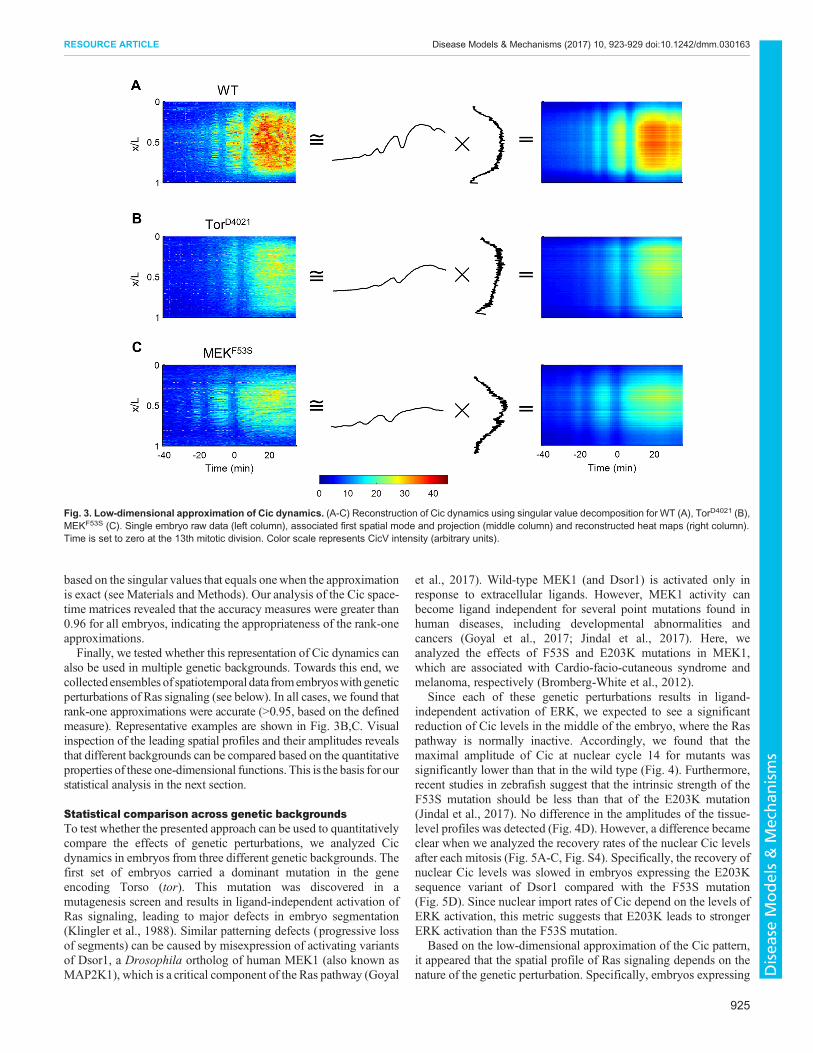
Low-dimensional approximation of spatiotemporaldynamicsTo analyze the large amount of data acquired in these experiments,we developed a pipeline for image processing and datarepresentation. First, the raw live-imaging data from themidsagittal optical sections of individual embryos were convertedinto a two-dimensional matrix, in which the columns are theanteroposterior profiles of Cic at consecutive time points (Fig. 2).This matrix serves as a starting point for analyzing thespatiotemporal pattern of Cic across the embryo. In addition, weused image segmentation to extract the temporal dynamics of Ciclevels from individual nuclei (Fig. S3). Thus, our approach providesaccess to Cic dynamics on the scales of both a single cell and thewhole tissue.
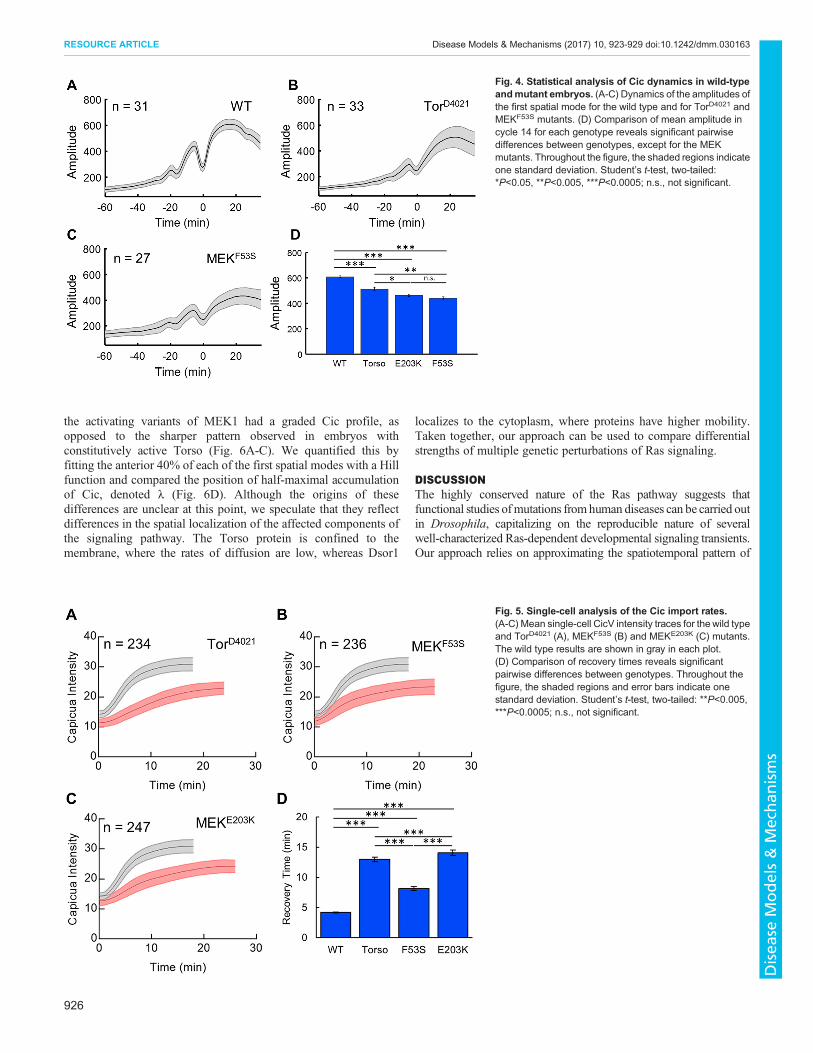
As discussed above, the dynamic pattern of Cic arises as acombination of processes that depend on time, such as the spatiallyuniform nuclear divisions in the blastoderm, and on space, such asRas signaling at the poles. We hypothesized that the spatiotemporalpattern of Cic could be approximated by a separable function – thatis, a product of two functions, one of which depends only on timeand the other depends only on space. To test this idea, we used thesingular value decomposition (SVD) to find rank-oneapproximations for the matrices describing the spatiotemporalpatterns of Cic extracted from live imaging data. This approximationis given by the product of the left and right singular vectorscorresponding to the leading singular value. Fig. 3A shows thatthese functions reveal the spatial structure of the Cic pattern (high inthe middle of the embryo, low at the poles) and its temporaldynamics (increasing levels, punctuated by sequential mitoses). Wedefined a measure of the accuracy of the rank-one approximation
Fig. 1. Microfluidic array for parallel imaging of live embryos. (A) Torso/ERK signaling antagonizes Cic-dependent gene repression. (B) Schematic ofthe microfluidic array with close-up views of a single-trapping unit in bothlayers. (C) Illustrations depicting a single embryo (red) within a trapping unit;dorsal-ventral (DV) and anterior-posterior (AP) cross-sections, and three-dimensional (3D) representations are depicted. (D) Superficial fluid velocity atthe mid-plane of the trapping unit predicted by the finite element model.(E) Representative image of a loaded microfluidic device: black trianglesindicate embryos trapped within the array.
Fig. 2. Image processing of time-lapse data of Cic dynamics. (A) Time-lapse images of a representative Capicua-Venus (CicV)-expressing embryo.(B) Time-lapse images of a single optical cross-section the blastodermembryo. (C) Representative space-time plot of Cic dynamics. Vertical axisrepresents egg length (L) from anterior to posterior (0-1), horizontal axisrepresents imaging time, and color axis represents CicV intensity (arbitraryunits). White vertical dotted lines indicate nuclear cycle transitions with cycleslabeled for stages 4 and 5 of embryogenesis. Time is set to zero at the start ofimaging.
924
RESOURCE ARTICLE Disease Models & Mechanisms (2017) 10, 923-929 doi:10.1242/dmm.030163
Disea
seModels&Mechan
isms
based on the singular values that equals onewhen the approximationis exact (see Materials and Methods). Our analysis of the Cic space-time matrices revealed that the accuracy measures were greater than0.96 for all embryos, indicating the appropriateness of the rank-oneapproximations.Finally, we tested whether this representation of Cic dynamics can
also be used in multiple genetic backgrounds. Towards this end, wecollected ensembles of spatiotemporal data fromembryoswithgeneticperturbations of Ras signaling (see below). In all cases, we found thatrank-one approximations were accurate (>0.95, based on the definedmeasure). Representative examples are shown in Fig. 3B,C. Visualinspection of the leading spatial profiles and their amplitudes revealsthat different backgrounds can be compared based on the quantitativeproperties of these one-dimensional functions. This is the basis for ourstatistical analysis in the next section.
Statistical comparison across genetic backgroundsTo test whether the presented approach can be used to quantitativelycompare the effects of genetic perturbations, we analyzed Cicdynamics in embryos from three different genetic backgrounds. Thefirst set of embryos carried a dominant mutation in the geneencoding Torso (tor). This mutation was discovered in amutagenesis screen and results in ligand-independent activation ofRas signaling, leading to major defects in embryo segmentation(Klingler et al., 1988). Similar patterning defects (progressive lossof segments) can be caused by misexpression of activating variantsof Dsor1, a Drosophila ortholog of human MEK1 (also known asMAP2K1), which is a critical component of the Ras pathway (Goyal
et al., 2017). Wild-type MEK1 (and Dsor1) is activated only inresponse to extracellular ligands. However, MEK1 activity canbecome ligand independent for several point mutations found inhuman diseases, including developmental abnormalities andcancers (Goyal et al., 2017; Jindal et al., 2017). Here, weanalyzed the effects of F53S and E203K mutations in MEK1,which are associated with Cardio-facio-cutaneous syndrome andmelanoma, respectively (Bromberg-White et al., 2012).
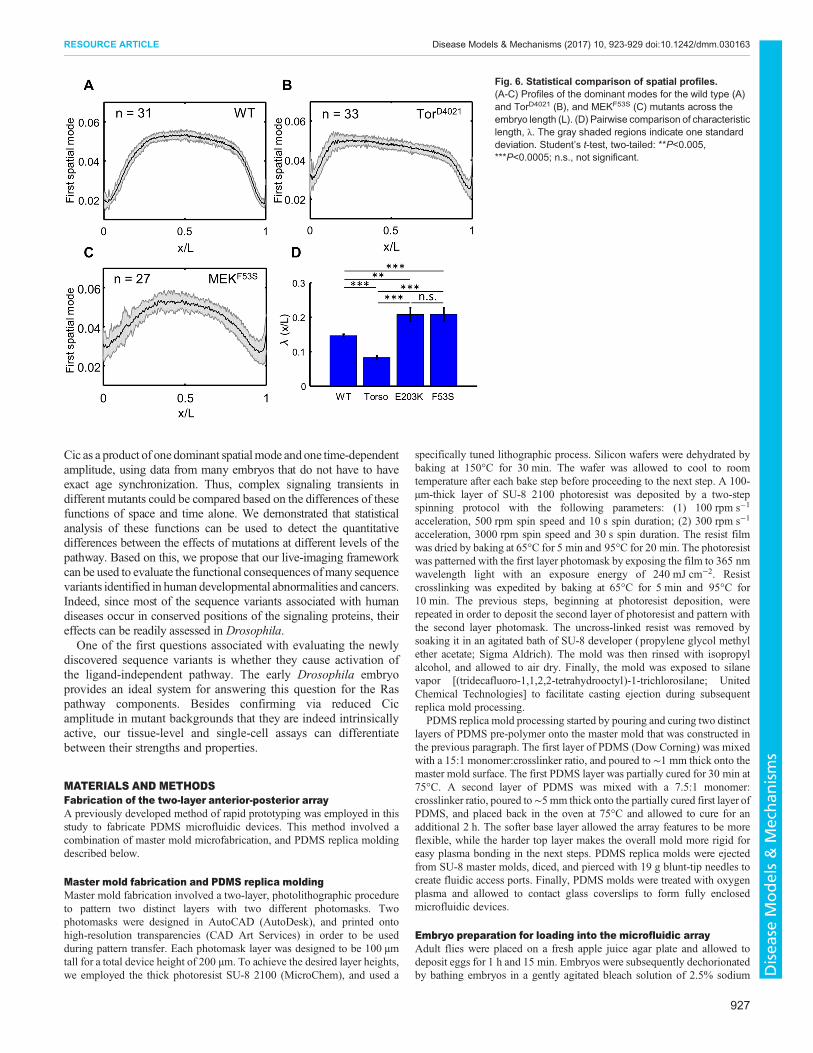
Since each of these genetic perturbations results in ligand-independent activation of ERK, we expected to see a significantreduction of Cic levels in the middle of the embryo, where the Raspathway is normally inactive. Accordingly, we found that themaximal amplitude of Cic at nuclear cycle 14 for mutants wassignificantly lower than that in the wild type (Fig. 4). Furthermore,recent studies in zebrafish suggest that the intrinsic strength of theF53S mutation should be less than that of the E203K mutation(Jindal et al., 2017). No difference in the amplitudes of the tissue-level profiles was detected (Fig. 4D). However, a difference becameclear when we analyzed the recovery rates of the nuclear Cic levelsafter each mitosis (Fig. 5A-C, Fig. S4). Specifically, the recovery ofnuclear Cic levels was slowed in embryos expressing the E203Ksequence variant of Dsor1 compared with the F53S mutation(Fig. 5D). Since nuclear import rates of Cic depend on the levels ofERK activation, this metric suggests that E203K leads to strongerERK activation than the F53S mutation.
Based on the low-dimensional approximation of the Cic pattern,it appeared that the spatial profile of Ras signaling depends on thenature of the genetic perturbation. Specifically, embryos expressing
Fig. 3. Low-dimensional approximation of Cic dynamics. (A-C) Reconstruction of Cic dynamics using singular value decomposition for WT (A), TorD4021 (B),MEKF53S (C). Single embryo raw data (left column), associated first spatial mode and projection (middle column) and reconstructed heat maps (right column).Time is set to zero at the 13th mitotic division. Color scale represents CicV intensity (arbitrary units).
925
RESOURCE ARTICLE Disease Models & Mechanisms (2017) 10, 923-929 doi:10.1242/dmm.030163
Disea
seModels&Mechan
isms
the activating variants of MEK1 had a graded Cic profile, asopposed to the sharper pattern observed in embryos withconstitutively active Torso (Fig. 6A-C). We quantified this byfitting the anterior 40% of each of the first spatial modes with a Hillfunction and compared the position of half-maximal accumulationof Cic, denoted λ (Fig. 6D). Although the origins of thesedifferences are unclear at this point, we speculate that they reflectdifferences in the spatial localization of the affected components ofthe signaling pathway. The Torso protein is confined to themembrane, where the rates of diffusion are low, whereas Dsor1
localizes to the cytoplasm, where proteins have higher mobility.Taken together, our approach can be used to compare differentialstrengths of multiple genetic perturbations of Ras signaling.
DISCUSSIONThe highly conserved nature of the Ras pathway suggests thatfunctional studies ofmutations fromhuman diseases can be carried outin Drosophila, capitalizing on the reproducible nature of severalwell-characterized Ras-dependent developmental signaling transients.Our approach relies on approximating the spatiotemporal pattern of
Fig. 4. Statistical analysis of Cic dynamics in wild-typeandmutant embryos. (A-C) Dynamics of the amplitudes ofthe first spatial mode for the wild type and for TorD4021 andMEKF53S mutants. (D) Comparison of mean amplitude incycle 14 for each genotype reveals significant pairwisedifferences between genotypes, except for the MEKmutants. Throughout the figure, the shaded regions indicateone standard deviation. Student’s t-test, two-tailed:*P<0.05, **P<0.005, ***P<0.0005; n.s., not significant.
Fig. 5. Single-cell analysis of the Cic import rates.(A-C) Mean single-cell CicV intensity traces for the wild typeand TorD4021 (A), MEKF53S (B) and MEKE203K (C) mutants.The wild type results are shown in gray in each plot.(D) Comparison of recovery times reveals significantpairwise differences between genotypes. Throughout thefigure, the shaded regions and error bars indicate onestandard deviation. Student’s t-test, two-tailed: **P<0.005,***P<0.0005; n.s., not significant.
926
RESOURCE ARTICLE Disease Models & Mechanisms (2017) 10, 923-929 doi:10.1242/dmm.030163
Disea
seModels&Mechan
isms
Cic as a product of one dominant spatialmode andone time-dependentamplitude, using data from many embryos that do not have to haveexact age synchronization. Thus, complex signaling transients indifferent mutants could be compared based on the differences of thesefunctions of space and time alone. We demonstrated that statisticalanalysis of these functions can be used to detect the quantitativedifferences between the effects of mutations at different levels of thepathway. Based on this, we propose that our live-imaging frameworkcan be used to evaluate the functional consequences ofmany sequencevariants identified in human developmental abnormalities and cancers.Indeed, since most of the sequence variants associated with humandiseases occur in conserved positions of the signaling proteins, theireffects can be readily assessed in Drosophila.One of the first questions associated with evaluating the newly
discovered sequence variants is whether they cause activation ofthe ligand-independent pathway. The early Drosophila embryoprovides an ideal system for answering this question for the Raspathway components. Besides confirming via reduced Cicamplitude in mutant backgrounds that they are indeed intrinsicallyactive, our tissue-level and single-cell assays can differentiatebetween their strengths and properties.
MATERIALS AND METHODSFabrication of the two-layer anterior-posterior arrayA previously developed method of rapid prototyping was employed in thisstudy to fabricate PDMS microfluidic devices. This method involved acombination of master mold microfabrication, and PDMS replica moldingdescribed below.
Master mold fabrication and PDMS replica moldingMaster mold fabrication involved a two-layer, photolithographic procedureto pattern two distinct layers with two different photomasks. Twophotomasks were designed in AutoCAD (AutoDesk), and printed ontohigh-resolution transparencies (CAD Art Services) in order to be usedduring pattern transfer. Each photomask layer was designed to be 100 µmtall for a total device height of 200 µm. To achieve the desired layer heights,we employed the thick photoresist SU-8 2100 (MicroChem), and used a
specifically tuned lithographic process. Silicon wafers were dehydrated bybaking at 150°C for 30 min. The wafer was allowed to cool to roomtemperature after each bake step before proceeding to the next step. A 100-µm-thick layer of SU-8 2100 photoresist was deposited by a two-stepspinning protocol with the following parameters: (1) 100 rpm s−1
acceleration, 500 rpm spin speed and 10 s spin duration; (2) 300 rpm s−1
acceleration, 3000 rpm spin speed and 30 s spin duration. The resist filmwas dried by baking at 65°C for 5 min and 95°C for 20 min. The photoresistwas patterned with the first layer photomask by exposing the film to 365 nmwavelength light with an exposure energy of 240 mJ cm−2. Resistcrosslinking was expedited by baking at 65°C for 5 min and 95°C for10 min. The previous steps, beginning at photoresist deposition, wererepeated in order to deposit the second layer of photoresist and pattern withthe second layer photomask. The uncross-linked resist was removed bysoaking it in an agitated bath of SU-8 developer (propylene glycol methylether acetate; Sigma Aldrich). The mold was then rinsed with isopropylalcohol, and allowed to air dry. Finally, the mold was exposed to silanevapor [(tridecafluoro-1,1,2,2-tetrahydrooctyl)-1-trichlorosilane; UnitedChemical Technologies] to facilitate casting ejection during subsequentreplica mold processing.
PDMS replica mold processing started by pouring and curing two distinctlayers of PDMS pre-polymer onto the master mold that was constructed inthe previous paragraph. The first layer of PDMS (Dow Corning) was mixedwith a 15:1 monomer:crosslinker ratio, and poured to ∼1 mm thick onto themaster mold surface. The first PDMS layer was partially cured for 30 min at75°C. A second layer of PDMS was mixed with a 7.5:1 monomer:crosslinker ratio, poured to∼5 mm thick onto the partially cured first layer ofPDMS, and placed back in the oven at 75°C and allowed to cure for anadditional 2 h. The softer base layer allowed the array features to be moreflexible, while the harder top layer makes the overall mold more rigid foreasy plasma bonding in the next steps. PDMS replica molds were ejectedfrom SU-8 master molds, diced, and pierced with 19 g blunt-tip needles tocreate fluidic access ports. Finally, PDMS molds were treated with oxygenplasma and allowed to contact glass coverslips to form fully enclosedmicrofluidic devices.
Embryo preparation for loading into the microfluidic arrayAdult flies were placed on a fresh apple juice agar plate and allowed todeposit eggs for 1 h and 15 min. Embryos were subsequently dechorionatedby bathing embryos in a gently agitated bleach solution of 2.5% sodium
Fig. 6. Statistical comparison of spatial profiles.(A-C) Profiles of the dominant modes for the wild type (A)and TorD4021 (B), and MEKF53S (C) mutants across theembryo length (L). (D) Pairwise comparison of characteristiclength, λ. The gray shaded regions indicate one standarddeviation. Student’s t-test, two-tailed: **P<0.005,***P<0.0005; n.s., not significant.
927
RESOURCE ARTICLE Disease Models & Mechanisms (2017) 10, 923-929 doi:10.1242/dmm.030163
Disea
seModels&Mechan
isms
hypochlorite for 1.5 min. Eggs were rinsed with 10 ml deionized water andsuspended in 1 ml of 0.15% Triton X-100 surfactant in phosphate-bufferedsaline (PBST) in an Eppendorf tube. Embryos were rinsed three times withfiltered PBST solution to remove unwanted particulates from the eggsuspension including, partially dissolved chorion membranes. This step isespecially important formicrofluidic arraying, because these particulates canalso be trapped by the array and introduce optical aberrations during imaging.
Three-dimensional finite element modeling of the trapping arrayFinite element modeling was performed with COMSOL Multiphysics 4.3bModeling Software. For simplification, a single trapping unit was modeledconsisting of an embryo trap, resistance channel and one turn of the mainserpentine channel. The three-dimensional (3D) steady-state incompressibleNavier-Stokes equations were solved to visualize flow through the traps. Forboundary conditions, the inlet superficial velocity that was experimentallyestimated to be ∼0.1 m/s, an assumed outlet condition of atmosphericpressure and no slip along channel surfaces.
Stocks and fly husbandryCapicua-Venus homozygous (CicV/CicV) stocks used in step 1 were crossedwith OregonR to generate heterozygous (CicV/+) embryos for analysis.Males from TorD4021/CyO were crossed with females from CicV/CicV togenerate TorD4021/CicV for analysis of maternal effects. UAS-MEKF53S/CyO; CicV/Tm3, sb and UAS-MEKE203K/CyO; CicV/Tm3, sb were made bycrossing UAS-MEKF53S/CyO; Dr/Tm3,Sb and sp/CyO; CicV/CicV. P(matα-GAL-VP16)mat67; P(matα-GAL-VP16)mat15 (Hunter and Wieschaus,2000) was used to drive expression of UAS constructs in the early embryo.
Arraying of embryos for time-lapse microscopyThe devicewas primed for embryo loading by filling themicrochannels witha loading solution of PBST. Air bubbles were removed by closing the deviceoutlet and simultaneously applying ∼10 psi pressure to the device inlet for∼5 min or until all air bubbles were removed. Embryos were gentlydelivered through the microfluidic array inlet by applying slight positivepressure to the embryo and PBST suspension. Device loading continueduntil all or most of the traps were occupied by a single embryo. The fluidicconnections at the device inlet and outlet were removed and the arrayedembryos were then imaged.
Time-lapse confocal imaging was done using Zeiss LSM 710 confocalmicroscope. A Zeiss Plan-Apochromat 20×/0.8 M27 air objective was usedfor all experiments. A 514 nm argon laser was used to excite CicVfluorescence while 514 nm transmission was used for capturing transmittedlight images simultaneously. Embryos were imaged in the AP plane at theembryo midsection with a frequency of 30 s−1 for 3 h. The temperature wasset to 25°C and maintained via an environmental chamber during imaging.
Image processing analysisPre-processing steps for tissue-level analysis were taken to prepare the rawimaging data for subsequent custom-designed automated analysis. Thisincludes processing raw data in ImageJ and importing in MATLAB forfurther analysis. Similar to the tissue-level analysis, we used a combinationof ImageJ- and MATLAB-based approaches to extract nuclear traces of Cicduring nuclear cycle 14 for single-cell analysis.
Singular value decomposition of Cic dynamicsWe applied the singular value decomposition (SVD) to individual movies ofCic dynamics in early embryos, decomposing them into spatial and temporalcomponents (Mardia et al., 1979). All analyses were performed using theCic signal on the dorsal side of each embryo cross-section. We measured theaccuracy of the rank-one approximations by calculating the ratio:
X 22
X 2F
¼ s21Pi s
2i
; ð1Þ
where X is the matrix containing the movie of dorsal Cic dynamics, X2 andXF are the induced matrix 2 norm and the Frobenius norm of X, and σi are theordered singular values of X (i.e. σ1>σ2>…>σn, where n is the number of
time points in the movie). This ratio equals onewhen the rank of X is one andis less than one otherwise. The average values of these ratios for wildtype, TorD4021, MEKF53S, and MEKE203K were as follows: 0.972±0.003,0.977±0.002, 0.959±0.009, and 0.968±0.004 (errors are one standarddeviation). Each movie was projected onto its respective first spatial mode toproduce time-varying amplitudes. We aligned the time courses acrossembryos by shifting each time axis such that the dip in signal at the 13thnuclear division occurred at the same time in all embryos. With theamplitudes aligned in time, we could proceed with calculating point-wisemeans and standard deviations of the amplitude across embryos. Additionalexperimental procedures are in the Supplementary Materials and Methods.They include a description of device fabrication and embryo preparation forloading.
AcknowledgementsWe thankmembers of the Shvartsman and Lu labs for helpful discussions during thisproject. We thank Kei Yamaya for help with fly husbandry.
Competing interestsThe authors declare no competing or financial interests.
Author contributionsConceptualization: Y.G., T.J.L., S.Y.S., H.L.; Methodology: Y.G., T.J.L., S.H., S.Y.S.,H.L.; Software: T.J.L., H.H.M.; Formal analysis: Y.G., T.J.L., H.H.M., S.H.; Datacuration: Y.G., T.J.L., H.H.M.; Writing - original draft: Y.G., T.J.L., S.Y.S., H.L.;Writing - review & editing: Y.G., T.J.L., H.H.M., S.Y.S., H.L.; Supervision: S.Y.S.;Project administration: H.L.; Funding acquisition: S.H., S.Y.S., H.L.
FundingY.G., H.H.M., and S.Y.S. were supported by the National Institutes of Health (NIH)(R01 GM107103). T.J.L. was partially supported by an NIH Fellowship (F31AA023160). S.Y.S. and H.L. were partially supported by the National ScienceFoundation (NSF) Science and Technology Center Emergent Behavior of IntegratedCellular Systems (EBICS) (CBET-0939511). S.H. was supported by the NSF (DMS-1501767). H.L. was supported by NIH (R01 NS096581 and R01 GM088333).
Data availabilityFly strains will be made available upon request.
Supplementary informationSupplementary information available online athttp://dmm.biologists.org/lookup/doi/10.1242/dmm.030163.supplemental
ReferencesBromberg-White, J. L., Andersen, N. J. and Duesbery, N. S. (2012). MEK
genomics in development and disease. Brief. Funct. Genomics 11, 300-310.Brunner, D., Oellers, N., Szabad, J., Biggs, W. H., Zipursky, S. L. and Hafen, E.
(1994). A gain-of-function mutation in Drosophila MAP kinase activates multiplereceptor tyrosine kinase signaling pathways. Cell 76, 875-888.
Casanova, J. and Struhl, G. (1989). Localized surface activity of torso, a receptortyrosine kinase, specifies terminal body pattern in Drosophila. Genes Dev. 3,2025-2038.
Chung, K., Kim, Y., Kanodia, J. S., Gong, E., Shvartsman, S. Y. and Lu, H.(2011). A microfluidic array for large-scale ordering and orientation of embryos.Nat. Methods 8, 171-176.
Freeman,M. (1996). Reiterative use of the EGF receptor triggers differentiation of allcell types in the Drosophila eye. Cell 87, 651-660.
Furriols, M. and Casanova, J. (2003). In and out of Torso RTK signalling. EMBO J.22, 1947-1952.
Futran, A. S., Link, A. J., Seger, R. andShvartsman, S. Y. (2013). ERKas amodel forsystems biology of enzyme kinetics in cells. Curr. Biol. 23, R972-R979.
Gabay, L., Seger, R. and Shilo, B. Z. (1997). MAP kinase in situ activation atlasduring Drosophila embryogenesis. Development 124, 3535-3541.
Goyal, Y., Jindal, G. A., Pelliccia, J. L., Yamaya, K., Yeung, E., Futran, A. S.,Burdine, R. D., Schupbach, T. and Shvartsman, S. Y. (2017). Divergent effectsof intrinsically active MEK variants on developmental Ras signaling. Nat. Genet.49, 465-469.
Grimm, O., Sanchez Zini, V., Kim, Y., Casanova, J., Shvartsman, S. Y. andWieschaus, E. (2012). Torso RTK controls Capicua degradation by changing itssubcellular localization. Development 139, 3962-3968.
Han, M. and Sternberg, P. W. (1990). let-60, a gene that specifies cell fates duringC. elegans vulval induction, encodes a ras protein. Cell 63, 921-931.
Han, M., Golden, A., Han, Y. and Sternberg, P. W. (1993). C. elegans lin-45 rafgene participates in let-60 ras-stimulated vulval differentiation. Nature 363,133-140.
928
RESOURCE ARTICLE Disease Models & Mechanisms (2017) 10, 923-929 doi:10.1242/dmm.030163
Disea
seModels&Mechan
isms
Hanahan, D. andWeinberg, R. A. (2011). Hallmarks of cancer: the next generation.Cell 144, 646-674.
Hunter, C. andWieschaus, E. (2000). Regulated expression of nullo is required forthe formation of distinct apical and basal adherens junctions in the Drosophilablastoderm. J. Cell Biol. 150, 391-402.
Jimenez, G., Guichet, A., Ephrussi, A. and Casanova, J. (2000). Relief of generepression by torso RTK signaling: role of capicua in Drosophila terminal anddorsoventral patterning. Genes Dev. 14, 224-231.
Jimenez, G., Shvartsman, S. Y. and Paroush, Z. (2012). The Capicua repressor–ageneral sensor of RTK signaling in development and disease. J Cell Sci. 15,1383-1391.
Jindal, G. A., Goyal, Y., Burdine, R. D., Rauen, K. A. and Shvartsman, S. Y.(2015). RASopathies: unraveling mechanisms with animal models. Dis. Model.Mech. 8, 769-782.
Jindal, G. A., Goyal, Y., Yamaya, K., Futran, A. S., Kountouridis, I., Balgobin,C. A., Schupbach, T., Burdine, R. D. and Shvartsman, S. Y. (2017). In vivoseverity ranking of Ras pathway mutations associated with developmentaldisorders. Proc. Natl. Acad. Sci. USA 114, 510-515.
Johnson, H. E., Goyal, Y., Pannucci, N. L., Schupbach, T., Shvartsman, S. Y.Toettcher, J. E. (2017). The spatiotemporal limits of developmental Erk signaling.Dev. Cell 40, 185-192.
Klingler, M., Erdelyi, M., Szabad, J. and Nusslein-Volhard, C. (1988). Function oftorso in determining the terminal anlagen of the Drosophila embryo. Nature 335,275-277.
Kornfeld, K., Hom, D. B. and Horvitz, H. R. (1995). The ksr-1 gene encodes anovel protein kinase involved in Ras-mediated signaling in C. elegans. Cell 83,903-913.
Lee, C.-J., Chan, W.-I., Cheung, M., Cheng, Y.-C., Appleby, V. J., Orme, A. T. andScotting, P. J. (2002). CIC, a member of a novel subfamily of the HMG-boxsuperfamily, is transiently expressed in developing granule neurons. Brain Res.Mol. Brain Res. 106, 151-156.
Levario, T. J., Zhan, M., Lim, B., Shvartsman, S. Y. and Lu, H. (2013). Microfluidictrap array for massively parallel imaging of Drosophila embryos. Nat. Protoc. 8,721-736.
Levario, T. J., Zhao, C., Rouse, T., Shvartsman, S. Y., Lu, H., McMahon, A.,Supatto, W., Fraser, S. E., Stathopoulos, A., Wang, Y. C. et al. (2016a). Anintegrated platform for large-scale data collection and precise perturbation of liveDrosophila embryos. Sci. Rep. 6, 21366.
Levario, T. J., Lim, B., Shvartsman, S. Y. and Lu, H. (2016b). Microfluidics forhigh-throughput quantitative studies of early development. Annu. Rev. Biomed.Eng. 18, 285-309.
Liao, S., Davoli, T., Leng, Y., Li, M. Z., Xu, Q. and Elledge, S. J. (2017). A geneticinteraction analysis identifies cancer drivers that modify EGFR dependency.Genes Dev. 31, 184-196.
Lim, B., Samper, N., Lu, H., Rushlow, C., Jimenez, G. and Shvartsman, S. Y.(2013). Kinetics of gene derepression by ERK signaling. Proc. Natl. Acad. Sci.USA 110, 10330-10335.
Mardia, K. V., Kent, J. T. and Bibby, J. M. (1979).Multivariate Analysis. New York,NY: Academic Press.
Okimoto, R. A., Breitenbuecher, F., Olivas, V. R., Wu, W., Gini, B., Hofree, M.,Asthana, S., Hrustanovic, G., Flanagan, J., Tulpule, A. et al. (2016).Inactivation of Capicua drives cancer metastasis. Nat. Genet. 49, 87-96.
O’Neill, E. M., Rebay, I., Tjian, R. andRubin, G. M. (1994). The activities of two Ets-related transcription factors required for drosophila eye development aremodulated by the Ras/MAPK pathway. Cell 78, 137-147.
Rauen, K. A. (2013). The RASopathies. Annu. Rev. Genomics Hum. Genet. 14,355-369.
Schupbach, T. and Wieschaus, E. (1986). Germline autonomy of maternal-effectmutations altering the embryonic body pattern of Drosophila. Dev. Biol. 113,443-448.
Sternberg, P. W. and Han, M. (1998). Genetics of RAS signaling in C. elegans.Trends Genet. 14, 466-472.
929
RESOURCE ARTICLE Disease Models & Mechanisms (2017) 10, 923-929 doi:10.1242/dmm.030163
Disea
seModels&Mechan
isms