the genetic architecture of ovariole number in drosophila ... · page 1 of 44. the genetic...
TRANSCRIPT

Page 1 of 44
The genetic architecture of ovariole number in Drosophila melanogaster: genes with major, quantitative, and pleiotropic effects
Amanda S. Lobell*,†, Rachel R. Kaspari*,‡, Yazmin L. Serrano Negron*, Susan T. Harbison*
*Laboratory of Systems Genetics, National Heart Lung and Blood Institute, National Institutes of Health, Bethesda, MD 20892. †Present address: Dept. of Human Evolutionary Biology, Harvard University, Cambridge, MA 02138. ‡Present address: Dept. of Cellular and Molecular Physiology, Yale University, New Haven, CT 06520.
G3: Genes|Genomes|Genetics Early Online, published on May 26, 2017 as doi:10.1534/g3.117.042390
© The Author(s) 2013. Published by the Genetics Society of America.

Page 2 of 44
Running Title: The genetic architecture of ovariole number
Keywords: ovariole number, sleep, genome-wide association study, Drosophila melanogaster
Corresponding author:
Susan T. Harbison Laboratory of Systems Genetics National Heart Lung and Blood Institute 10 Center Drive, Building 10, Room 7D13 Bethesda, MD 20892-1654 Ph.: (301) 435-8787 Fax: (301) 496-9985

Page 3 of 44
ABSTRACT
Ovariole number has a direct role in the number of eggs produced by an insect, suggesting that
it is a key morphological fitness trait. Many studies have documented the variability of ovariole
number and its relationship to other fitness and life-history traits in natural populations of
Drosophila. However, the genes contributing to this variability are largely unknown. Here we
conducted a genome-wide association study of ovariole number in a natural population of flies.
Using mutations and RNAi-mediated knockdown, we confirmed the effects of twenty-four
candidate genes on ovariole number, including a novel gene, anneboleyn (formerly CG32000),
that impacts both ovariole morphology and numbers of offspring produced. We also identified
pleiotropic genes between ovariole number traits and sleep and activity behavior. While few
polymorphisms overlapped between sleep parameters and ovariole number, thirty-nine
candidate genes were nevertheless in common. We verified the effects of seven genes on both
ovariole number and sleep: bin3, blot, CG42389, kirre, slim, VAChT, and zfh1. Linkage
disequilibrium among the polymorphisms in these common genes was low, suggesting that
these polymorphisms may evolve independently.
INTRODUCTION
Ovariole number in insects is a quantitative trait that affects reproductive fitness by impacting
the number of eggs produced by a female fly (BOULETREAU-MERLE et al. 1982; R'KHA et al. 1997;
KLEPSATEL et al. 2013b). Ovariole number is related to egg production at different times during
the lifespan, with a greater correlation during early life than at later ages (SCHMIDT et al. 2005) .

Page 4 of 44
Ovariole number exhibits latitudinal clines (CAPY et al. 1993; AZEVEDO et al. 1996; SCHMIDT et al.
2005), suggesting the influence of natural selection. Importantly, variation in ovariole number
has a significant genetic component (ROBERTSON 1957; WAYNE et al. 1997; WAYNE AND MACKAY
1998; WAYNE et al. 2001; ORGOGOZO et al. 2006; BERGLAND et al. 2008) that is therefore subject to
natural selection. Candidate genes for ovariole number have been identified and include bab1,
genes in the Hippo pathway, and InR (ORGOGOZO et al. 2006; GREEN AND EXTAVOUR 2012; SARIKAYA
et al. 2012; GREEN AND EXTAVOUR 2014; SARIKAYA AND EXTAVOUR 2015). But the extent of genes that
contribute to genetic variability in ovariole number in natural populations is unknown.
Here we measured ovariole number traits in the Drosophila Genetic Reference Panel (DGRP).
We measured ovariole number and ovariole asymmetry, and calculated the coefficient of
environmental variation (CVE) for these two traits as well. With the exception of ovariole
asymmetry CVE, we found high levels of genetic variation among DGRP lines for ovariole
number related traits, suggesting that they could be mapped by association analysis. Genome-
wide association (GWA) implicated 89 candidate genes for ovariole number, 115 for ovariole
number asymmetry, and 769 for ovariole number CVE. Using Minos/P-element insertions and
RNAi-mediated knockdown, we confirmed 24 candidate genes for ovariole number. Many of
these constructs had quantitative effects, changing as much as 4.6 ovarioles with a single
mutation. But we also observed major effects on ovariole number when two candidate genes
were perturbed. A Minos insertion in one of the candidate genes, anneboleyn (formerly
CG32000), had large, qualitative effects on ovariole morphology. anneboleyn females also
produced fewer offspring. Our analysis implicated zfh1 as well, a gene with known effects on

Page 5 of 44
ovariole number development (MOORE et al. 1998). Thus, the GWA identified genes with both
subtle, quantitative effects on ovariole number as well as gross morphological defects.
To discover potential evolutionary trade-offs, ovariole number has been contrasted with other
life-history traits. For example, ovariole number is correlated with body size across insect
species (HONEK 1993) and in D. melanogaster (BERGLAND et al. 2008). Here we correlated ovariole
number phenotypes with sleep, and we explored potential pleiotropic effects between
candidate genes for ovariole number and sleep by comparing our GWA results to a previous
study of sleep in the same population of flies (HARBISON et al. 2013). Neither ovariole number
nor ovariole asymmetry were genetically correlated with sleep, though genetic correlations
were found among the coefficients of environmental variation for these traits. Furthermore,
the overlap among polymorphic variants impacting the two suites of traits was low.
Nevertheless, 344 genes were common to both studies, with thirty-nine genes overlapping
between ovariole number and sleep. Effects on sleep and ovariole number were confirmed for
seven genes. Linkage disequilibrium patterns in genes common to both studies suggest
independent evolution of the two suites of traits.
Thus, ovariole number is a typical quantitative trait affected by many genes of small effect as
well as several large-effect genes. Despite its role as a fundamental morphological trait,
ovariole number genes exhibit pleiotropy with sleep, implying a complex relationship with
natural selection and fitness.

Page 6 of 44
MATERIALS AND METHODS
Ovariole phenotypes
Ovariole number and asymmetry were measured in the Drosophila Genetic Reference
Panel (DGRP), a collection of 205 inbred lines generated through 20 generations of full-sib
mating of progeny of Drosophila melanogaster females wild-caught in Raleigh, North Carolina
(MACKAY et al. 2012; HUANG et al. 2014). Flies were maintained under standard culture
conditions (cornmeal-sucrose medium, 25°C, 50-60% relative humidity) with a 12-hour light-
dark cycle. For each DGRP line, we seeded two parental cultures with 5 male flies and 5 female
flies to control parental density. Parents were cleared from culture vials after 6 days, before
offspring eclosion. Six days after eclosion, we transferred adult progeny to vials containing
standard medium plus a dab of thick yeast paste. The addition of yeast paste encourages egg
development to facilitate ovariole counting (BERGLAND et al. 2008). After 5 days on the yeast
paste medium, female flies were frozen at -20° C. A pilot study revealed that counting ovarioles
from 10 female flies per DGRP line gave 80% power to detect a 4 ovariole-difference at α = 0.05
(SOKAL AND ROHLF 1995). Based on this power calculation, we counted ovariole number in both
ovaries of 10 female flies per DGRP line and replicated these measures three times, resulting in
the measurements of 30 flies per DGRP line. Ovarioles were counted within 1 month of
freezing. Ovaries were dissected under magnification in a drop of PBS and stained with a
saturated solution of crystal violet (Fisher Scientific, Hampton, NH), which facilitated the
identification and counting of individual ovarioles.
The ovariole number of each fly was defined as the mean of the number of ovarioles in
the right and left ovaries. Ovariole asymmetry was defined as the absolute value of the

Page 7 of 44
difference in ovariole number between the right and left ovaries. Ovariole asymmetry is
sometimes calculated as the percent difference in ovariole number. We found that this
percentage scaled linearly with asymmetry (r = 0.779) and thus did not examine it as a separate
quantitative trait. In addition, for each DGRP line, the coefficient of environmental variation
(CVE) for ovariole number and asymmetry was calculated as (σE/µ) × 100, where µ is the mean
trait value per replicate, and σE is the within-replicate standard deviation (MACKAY AND LYMAN
2005).
Quantitative genetic analyses
We partitioned the variance in ovariole number and ovariole asymmetry using the
ANOVA model Y = μ + R + L + R×L + V(R×L) + ε, where R (replicate), L (line) and V (vial) are
random effects and ε is the error variance. In this model, Y is the phenotype; μ is the overall
trait mean; R is the replicate effect; L is the main effect of DGRP line (i.e., the genetic
component of variance); L×R accounts for the interaction of each line with the environmentally
derived variance across the three experimental replicates; and V(R×L) accounts for
environmental variance derived from a fly being reared in a particular culture vial, including
potential effects due to differences in rearing density. Broad sense heritability (H2) of ovariole
number and asymmetry was calculated as H2= σ2L/(σ2R + σ2L+ σ2R×L + σ2V(R×L)+ σ2 ε), where σ2L is
the variance component among lines and σ2R, σ2R×L , σ2V(R×L) and σ2 ε are all other potential
sources of variance in the model.
We partitioned the variance in ovariole number CVE and ovariole asymmetry CVE using
the ANOVA model Y= µ + L + ε, where Y is the phenotype, μ is the overall CVE mean, L is the

Page 8 of 44
random effect of DGRP line and ε is the error term. Broad sense heritability (H2) of CVE was
calculated as H2= σ2L/(σ2L+ σ2 ε), where σ2L is the variance component among lines and σ2 ε are
the remaining potential sources of variance in the model.
Phenotypic correlations (rP) between each reproductive trait and between reproductive
traits and female values for 14 previously measured sleep phenotypes (HARBISON et al. 2013)
were calculated using Pearson’s correlation coefficient in the software package JMP 13.0.0 (SAS
Institute, Cary, NC). Genetic correlations (rG) between traits were calculated as
cov12/√(σL12 × σL22) (FALCONER AND MACKAY 1996), where cov12 is the covariance between traits 1
and 2, and σL12 and σL22 are the among-line variances for traits 1 and 2, respectively. Except for
the phenotypic correlations, all other quantitative genetic analyses were conducted using SAS
software (SAS Institute, Cary, NC).
Genotype/phenotype associations
We associated mean ovariole number, ovariole asymmetry and ovariole number CVE for
each DGRP line with genetic variation segregating in the DGRP using three separate
approaches. In each approach, we associated the 3,461,238 sites segregating in the DGRP
having a minor allele frequency (MAF) ≥ 0.01 with ovariole traits. In the first approach, we used
the Factored Spectrally Transformed Linear Mixed Model (FaST-LMM) (LIPPERT et al. 2011) for
GWA and adjusted the model for genetic relatedness among the DGRP lines. We used the
DGRP Freeze 2.0 analysis pipeline available online (dgrp2.gnets.ncsu.edu) to obtain ovariole
phenotypes adjusted for the presence/absence of 5 common chromosomal inversions and
Wolbachia pipientsis infection status and incorporated these phenotypes into the FaST-LMM

Page 9 of 44
model (HUANG et al. 2014). Note that in order to increase computational speed, FaST-LMM uses
mean imputation to determine the genotype of variants with missing calls (LIPPERT et al. 2011).
In the second approach, we used FaST-LMM to associate polymorphisms with adjusted ovariole
traits, but without adjusting the model for genetic relatedness among the DGRP lines. This
enabled us to contrast the effect of incorporating genetic relatedness. In the third approach,
we applied a general linear model (GLM) Y = μ + M + ε where Y is the phenotype, μ is the trait
mean, M is variant genotype and ε is the error term; in this approach, we did not adjust
ovariole number phenotypes, nor correct for population structure. The GLM approach allowed
us to evaluate the effects of phenotypic adjustment as well as imputation. Genetic variants
significantly associated with ovariole phenotypes were defined as those with a nominal
discovery P-value of 1x10⁻⁵ or less in any of the three approaches, consistent with previous
studies using the DGRP (ARYA et al. 2015; DEMBECK et al. 2015a; DEMBECK et al. 2015b; GARLAPOW
et al. 2015; SHORTER et al. 2015; ZWARTS et al. 2015; HUNTER et al. 2016). We also calculated the
false discovery rate (FDR) for each association using the Benjamini-Hochberg procedure
(BENJAMINI AND HOCHBERG 1995). The GLM and FDR calculations were performed using SAS
software (SAS Institute, Cary, NC). For each trait, variant effect sizes (a) were calculated as one-
half the difference in mean trait value between all DGRP lines carrying the minor allele and
those carrying the major allele at that variant position (FALCONER AND MACKAY 1996).
Standardized effect sizes (a/σG) were calculated as variant effect sizes divided by the standard
deviation of genetic variation in the trait across the DGRP. Minor allele frequencies were
calculated as the quotient of the number of DGRP lines carrying the minor allele at a given locus
divided by the total number of DGPR lines with known genotypes at the locus. Effect sizes and

Page 10 of 44
allele frequencies were calculated using JMP 13.0.0 (SAS Institute, Cary, NC). Linkage
disequilibrium among SNPs was computed using PLINK 1.07 (PURCELL et al. 2007).
Verification of genotype-phenotype associations
GWA analyses implicated variants for ovariole number that fell in or within 1kb of 89
putative candidate genes. In 29 instances, polymorphic variants mapped to two overlapping
genes; in one instance, the variant mapped to three overlapping genes. As the false discovery
rates for GWA variants for ovariole number were relatively high, we wanted to verify all
candidate genes implicated by these variants through additional testing. Our strategy was to
test every gene in our candidate list using available stock having either a Minos Mi{ET1} or
P{GT1} insertion, or UAS-RNAi lines (Vienna Drosophila Stock Center, Vienna, Austria). We
chose these collections as they have isogenic control lines, reducing the potential for spurious
background effects. Forty-three candidate genes had stock available (Table S1). We tested 12
Minos element Mi{ET1} insertion lines (BELLEN et al. 2011) (Bloomington Drosophila Stock
Center, Bloomington, IN) and two P{GT1} P-element insertion alleles (BELLEN et al. 2004) of the
bin-3 gene (bin-3BG01137 and bin-3BG01146) against their isogenic controls, w1118 and w1118; Canton-
S B, respectively (Table S1). We also tested 32 homozygous UAS-RNAi lines (DIETZL et al. 2007)
(Vienna Drosophila Stock Center, Vienna, Austria) (Table S1). Two genes, Mdr49 and bru3, were
tested with both Minos element and RNAi constructs. Candidate gene expression was knocked-
down in the somatic cells of the ovary using the GAL-4 driver lines w{*};
P{w{+mW.hs}=GawB}bab1{PGal4-2}/TM6B, Tb from the Bloomington Stock Center (6803) and
TJ Gal4/ CyO Kr-Gal4, UAS-GFP (gift of B. Oliver) (LI et al. 2003). Male GAL-4 driver flies were

Page 11 of 44
mated to UAS-RNAi females and ovariole traits of female progeny were compared to the
isogenic control y,w1118;P{attP, y+, w3}. For each P-element, Minos or RNAi line, we assayed
ovariole phenotypes in 10 female flies per replicate. We replicated each assay three times, for a
total of 30 flies measured per line. We used the ANOVA model Y = μ + R + G + R×G + ε, where R
is the fixed effect of experimental replicate, G is the fixed effect of genotype and ε is the error
term, to identify genes for which there were significant differences in ovariole number between
knockdown lines and isogenic controls.
The two Gal4 drivers we used could affect gene knockdown differently. To determine
the influence of driver genotype on our RNAi results, we partitioned the variance in ovariole
number using the ANOVA model Y = μ + R + G + D + R×G + R×D + G×D + R×G×D + ε where Y is
the difference in ovariole number between an RNAi knockdown fly and its contemporaneous
isogenic control, R is the effect of experimental replicate, G is the effect of RNAi line genotype,
D is the effect of driver genotype and ε is the error term.
We observed dramatic, qualitative effects on ovary morphology when the candidate
genes CG32000 and zfh1 were knocked down. To quantify the effects of these changes on
female productivity (number of offspring), we individually mated 10 virgin female zfh1 and
CG23000 flies to isogenic control males. Parents were cleared from culture vials after three
days. We counted all live offspring for five days, beginning eleven days after initial mating. We
compared offspring counts across four conditions: 10 isogenic control males individually mated
to 10 isogenic control virgin females, 10 male knockdown/mutant flies individually mated to 10
virgin isogenic control females, 10 isogenic control males individually mated to 10
knockdown/mutant females, and 10 virgin knockdown/mutant males individually mated to 10

Page 12 of 44
knockdown/mutant females. We repeated each assay twice, resulting in measures from 20
female flies per gene/condition. Eighteen vials in the CG32000 assay did not produce live
offspring; these failed cultures were more prevalent among vials with CG32000 male parents,
suggesting a potential and unanticipated male effect on productivity. We restricted the analysis
to offspring-producing vials and used the ANOVA model Y = μ + M + F + M×F +R(M×F) + ε where
Y is the number of offspring, M is the fixed effect of male genotype, F is the fixed effect of
female genotype, R is the random effect of experimental replicate and ε is the error term. In
addition, we used a PCR assay to verify the presence of the Minos insertion in CG32000. We
used two amplifications, each with one primer placed within the Minos element and one in
CG32000 flanking sequence. Primer pairs were 5’ GAGCCTGCGGATGAAGATC 3’ (CG32000
flanking) and 5’ GGCGCACTTCGGTTTTTCTT 3’ (Minos) and 5’
GTACAATTTACAAAGGATTCGACGTGG 3’ (CG32000 flanking) and 5’ CATTACGCCGCGTTCGAATT
3’ (Minos). The presence of the P-element was verified in both assays (Fig. S1).
To identify pleiotropic effects of ovariole number candidate genes on other ovariole
phenotypes, we measured ovariole asymmetry and ovariole number CVE in all mutant and RNAi
knockdown lines (Table S1). We used the ANOVA model Y = μ + R + G + R×G + ε and Y = µ + G + ε
for ovariole asymmetry and ovariole number CVE, respectively, where R is the fixed effect of
experimental replicate, G is the fixed effect of knockdown line genotype and ε is the error term,
to determine whether there are significant differences in ovariole number CVE and asymmetry
between mutant or knock-down lines and their isogenic controls. We calculated the false
discovery rate (FDR) for all tests (BENJAMINI AND HOCHBERG 1995). All ANOVA models were
evaluated using SAS software (SAS Institute, Cary, NC).

Page 13 of 44
Pleiotropy with sleep
We identified genes common to sleep and ovariole number by comparing our ovariole
number GWAS results to a previous GWAS examining 14 sleep and activity phenotypes
(HARBISON et al. 2013). In that study, sleep and activity traits were measured in 167 lines of the
DGRP, which we describe briefly here. DGRP lines were divided into four blocks; each block was
replicated four times, resulting in sleep and activity measurements for 32 flies/sex/line. Virgin
males and females were loaded into Trikinetics (Waltham, MA) activity monitors. Sleep was
assayed and sleep phenotypes were calculated as detailed below (Sleep phenotypes). All DGRP
variants with a minor allele frequency ≥ 0.0238 were tested for association with sleep traits
using two models: 1) a GLM model similar to the one described above except that the effect of
sex was incorporated as an additional factor; and 2) a FaST-LMM model incorporating
population structure. Day average bout length in males was the only phenotype adjusted for
Wolbachia infection status, as this was the only phenotype affected. In addition, some sleep
characteristics were associated with chromosomal inversions (HARBISON et al. 2013). Variants
were called significant if their FDR ≤ 0.01 in the original study, but for the purposes of
comparison with the GWA described here, we used the same significance level for sleep as for
ovariole number traits—a P-value of 1×10⁻⁵.
We defined a gene as pleiotropic if it contained one or more polymorphic variants
significantly associated with ovariole number and one or more variants significantly associated
with at least one sleep trait. For both groups of traits, we considered both variants that map to

Page 14 of 44
gene coding sequences and those within a 1kb window up- or down-stream of the coding
sequence.
Sleep phenotypes
We tested the effect on sleep of 20 candidate pleiotropic ovariole number/sleep genes
using mutant alleles and RNAi constructs. These genes were identified through the GWAS
comparison using a 1×10⁻⁵ P-value threshold. In addition, mutant alleles of bin3 were previously
shown to affect day and night sleep duration in a study of genome-wide transcriptional
abundance (HARBISON et al. 2009). We tested these same alleles in this study for both sleep and
ovariole number traits. All genes were tested either with mutations or RNAi-induced
knockdown except bru3 which was tested with both (Table S1). For sleep tests using UAS-RNAi
constructs, we used the Gal4 driver line P{{w+Mc} = Gal4-elav.L}2/CyO (8765) from the
Bloomington Stock Center to reduce candidate gene expression in all neurons (HARBISON et al.
2013).
We recorded five days of continuous sleep activity from 16 male and 16 female flies per
genotype using the Drosophila Activity Monitoring System (Trikinetics, Waltham, MA) as in
(HARBISON et al. 2013). Trikinetics monitors record the activity of each individual fly by counting
the number of times a fly breaks an infrared beam each minute. Prior to sleep assays, virgin
flies collected from each line were held at 20 flies per same-sex vial to control for the effects of
mating (ISAAC et al. 2010) and social exposure (GANGULY-FITZGERALD et al. 2006) on sleep. Data
from flies that did not live through the assay were removed prior to analysis. A C# program (R.
Sean Barnes, personal communication) was used to calculate 16 sleep measures from the raw
Page 15 of 44
activity data. Sleep parameters included the 7 mean and 7 CVE traits previously measured
(HARBISON et al. 2013) plus two additional traits, sleep latency and its coefficient of
environmental variation. Sleep is defined as five or more continuous minutes of inactivity
(HUBER et al. 2004). Using this definition, we calculated the amount of time the flies spent
sleeping during the day or night; the number of sleep bouts during the day or night; the average
length of a sleep bout during the day or night; and the number of activity counts per minute
spent awake (waking activity). We defined sleep latency as the number of minutes from the
start of the night until a fly’s first sleep bout. The coefficient of environmental variation (CVE)
was calculated for these traits as well. Sleep measurements were replicated three times,
resulting in measurements from 48 flies per sex per line. We analyzed these data for both sexes
combined using the ANOVA model Y = μ + S + G + S×G + R(S×G) + ε, where S is the fixed effect of
sex, G is the fixed effect of genotype, R(S×G) is the random effect of experimental replicate on
the interaction of sex and genotype and ε is the error term. Sleep and its genetic basis differ
between male and female flies (HENDRICKS et al. 2003; HUBER et al. 2004; ISAAC et al. 2010;
HARBISON et al. 2013; GUO et al. 2016), which we examined with the reduced model Y = μ + R + G
+ R×G + ε where G is the fixed effect of genotype and ε is the error term. For CVE traits we used
the model Y = μ + S + G + S×G + ε where S is the fixed effect of sex, G is the fixed effect of
genotype and ε is the error term. Reduced models for CVE traits were computed as Y = µ + G + ε
for each sex separately. All ANOVA models were evaluated using SAS software (SAS Institute,
Cary, NC).
Data availability
Page 16 of 44
All data necessary to replicate our analyses are available as supporting files except for raw
ovariole trait counts for each fly, which are available upon request. Table S2 lists ovariole
number, ovariole asymmetry, ovariole number CVE, and ovariole asymmetry CVE mean
phenotypes for each DGRP line tested; Table S5 lists these means adjusted for the effects of
Wolbachia infection and chromosome inversion.
RESULTS
Quantitative genetic analyses
The mean values of both ovariole number and right/left ovariole asymmetry varied
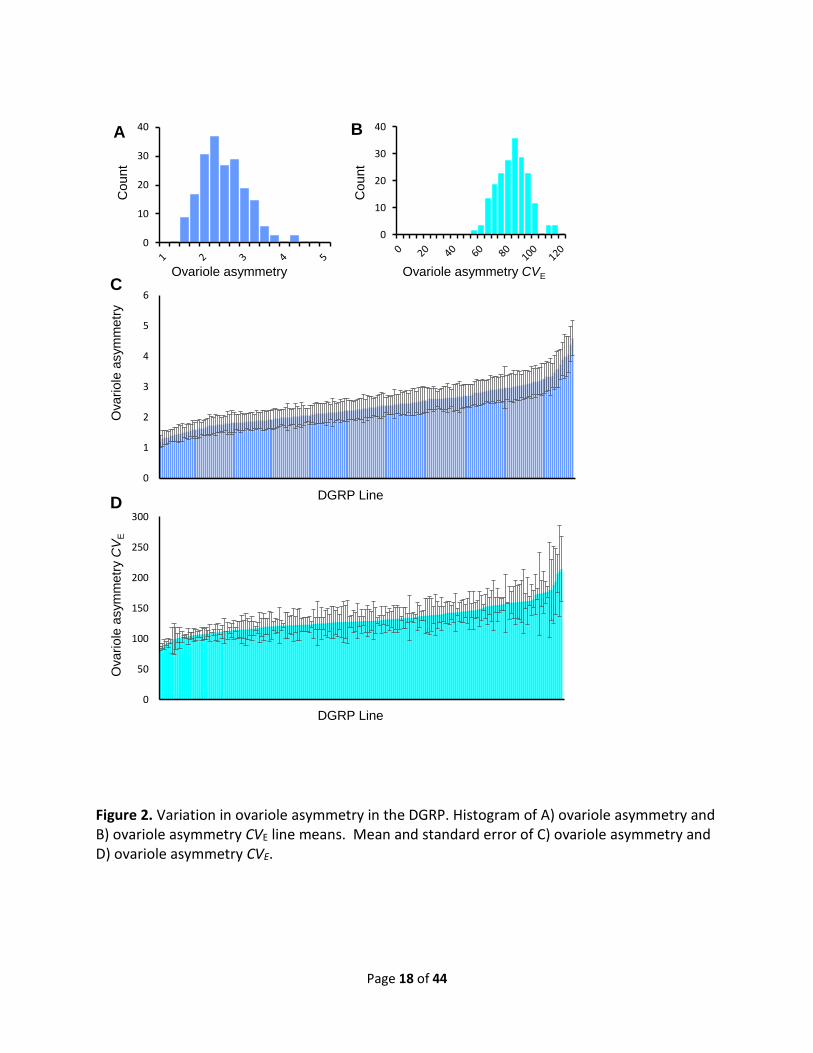
substantially among DGRP lines, ranging from 12.7 to 29.6 and from 1.2 to 4.6, respectively (Fig.
1 and 2, Table S2). Quantitative genetic analyses uncovered a highly significant genetic variance
component in both traits (P < 0.0001) (Fig. 3, Table S3), with a broad-sense heritability (H2) of
0.59 estimated for ovariole number and a H2 of 0.05 estimated for ovariole asymmetry,
consistent with previous estimates (ROBERTSON 1957; WAYNE et al. 2001). Thus ovariole number
is strongly influenced by genotype, while ovariole asymmetry is dominated by environmental
factors. To determine whether common genes might affect ovariole number and asymmetry,
we computed the genetic correlation between the traits. We found that ovariole number and
asymmetry were genetically correlated (rG= 0.72), which suggests that a proportion of the
genes affecting each trait are shared between them (Table S4). Thus, to the limited extent that
ovariole asymmetry is determined by genetics, it may share a common genetic and
developmental architecture with ovariole number.

Page 17 of 44
Figure 1. Variation in ovariole number in the DGRP. Histogram of A) ovariole number and B) ovariole number CVE line means. Mean and standard error of C) ovariole number and D) ovariole number CVE.
A B
Cou
nt
Cou
nt
Ovariole number Ovariole number CVE
0
5
10
15
20
25
30
0
10
20
30
40
50
0
5
10
15
20
25
30
35
Ova
riole
num
ber
DGRP Line
C
Ova
riole
num
ber C
VE
DGRP Line
D
0
500
1000
1500
2000
2500
3000
Page 18 of 44
Figure 2. Variation in ovariole asymmetry in the DGRP. Histogram of A) ovariole asymmetry and B) ovariole asymmetry CVE line means. Mean and standard error of C) ovariole asymmetry and D) ovariole asymmetry CVE.
0
10
20
30
40
0
10
20
30
40 B A C
ount
Cou
nt
Ovariole asymmetry Ovariole asymmetry CVE
0
1
2
3
4
5
6
Ova
riole
asym
met
ry
DGRP Line
C
Ova
riole
asym
met
ry C
VE
DGRP Line
D
0
50
100
150
200
250
300
Page 19 of 44
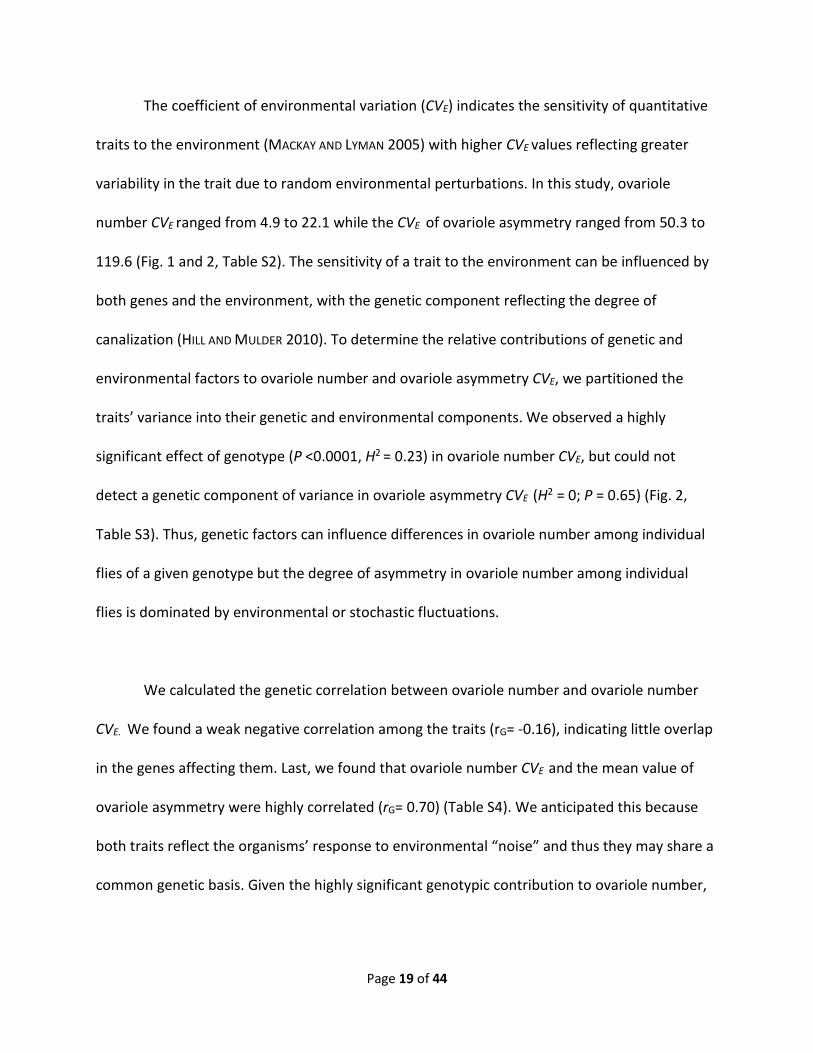
The coefficient of environmental variation (CVE) indicates the sensitivity of quantitative
traits to the environment (MACKAY AND LYMAN 2005) with higher CVE values reflecting greater
variability in the trait due to random environmental perturbations. In this study, ovariole
number CVE ranged from 4.9 to 22.1 while the CVE of ovariole asymmetry ranged from 50.3 to
119.6 (Fig. 1 and 2, Table S2). The sensitivity of a trait to the environment can be influenced by
both genes and the environment, with the genetic component reflecting the degree of
canalization (HILL AND MULDER 2010). To determine the relative contributions of genetic and
environmental factors to ovariole number and ovariole asymmetry CVE, we partitioned the
traits’ variance into their genetic and environmental components. We observed a highly
significant effect of genotype (P <0.0001, H2 = 0.23) in ovariole number CVE, but could not
detect a genetic component of variance in ovariole asymmetry CVE (H2 = 0; P = 0.65) (Fig. 2,
Table S3). Thus, genetic factors can influence differences in ovariole number among individual
flies of a given genotype but the degree of asymmetry in ovariole number among individual
flies is dominated by environmental or stochastic fluctuations.
We calculated the genetic correlation between ovariole number and ovariole number
CVE. We found a weak negative correlation among the traits (rG= -0.16), indicating little overlap
in the genes affecting them. Last, we found that ovariole number CVE and the mean value of
ovariole asymmetry were highly correlated (rG= 0.70) (Table S4). We anticipated this because
both traits reflect the organisms’ response to environmental “noise” and thus they may share a
common genetic basis. Given the highly significant genotypic contribution to ovariole number,
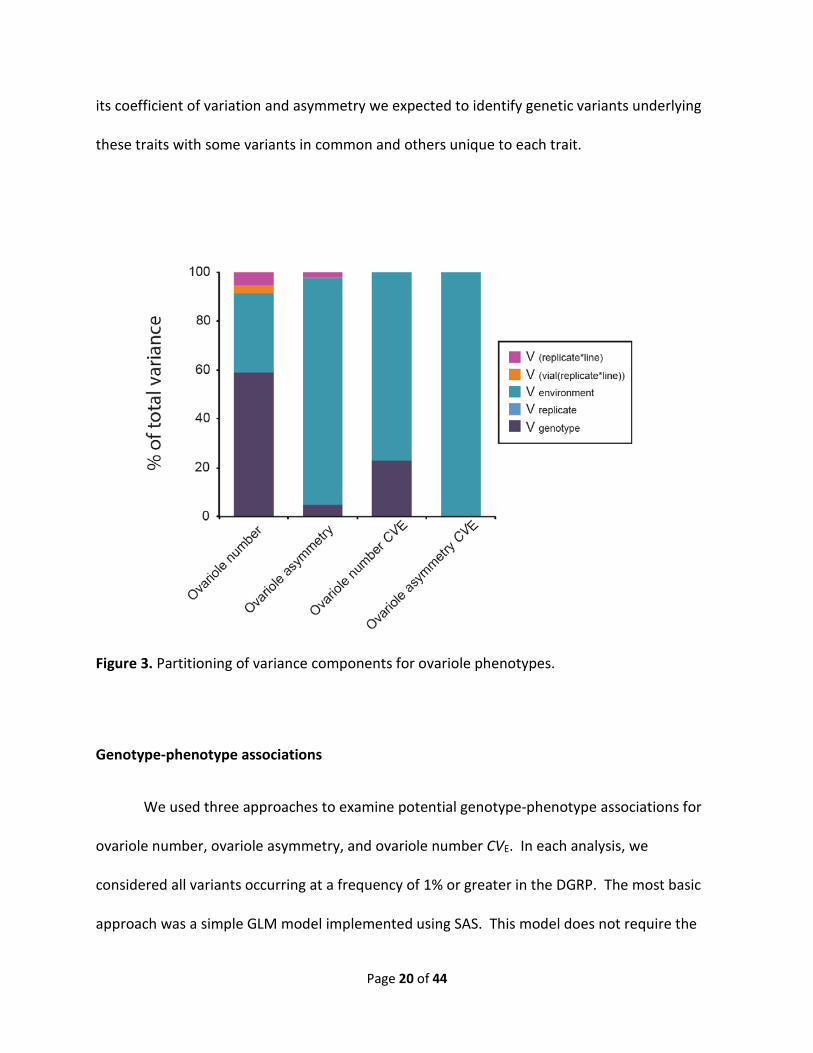
Page 20 of 44
its coefficient of variation and asymmetry we expected to identify genetic variants underlying
these traits with some variants in common and others unique to each trait.
Figure 3. Partitioning of variance components for ovariole phenotypes.
Genotype-phenotype associations
We used three approaches to examine potential genotype-phenotype associations for
ovariole number, ovariole asymmetry, and ovariole number CVE. In each analysis, we
considered all variants occurring at a frequency of 1% or greater in the DGRP. The most basic
approach was a simple GLM model implemented using SAS. This model does not require the

Page 21 of 44
imputation of missing variant allele calls, and did not account for Wolbachia infection status,
presence/absence of chromosomal inversions, or population structure, known confounders of
association studies in the DGRP (HUANG et al. 2014). The other two approaches used FaST-LMM
to calculate genotype-phenotype associations (LIPPERT et al. 2011); to obtain increases in
computational speed, FaST-LMM uses mean imputation to call alleles for missing variants. Both
FaST-LMM analyses used ovariole phenotypes corrected for the effects of Wolbachia infection
and chromosomal inversions. One FaST-LMM analysis accounted for population structure,
while the other did not. We observed little effect of population structure on these analyses,
and ovariole number traits were only mildly affected by Wolbachia infection and chromosomal
inversions, though they may have impacted ovariole number CVE. Thus, we observed a high
level of concordance among all three analyses. We present the combined results of the three
analyses here, and address differences among them in the Discussion.
Quantile-quantile (QQ) plots constructed from the GWA results revealed appreciable
deviation of observed from expected P-values for each trait (Figs. S2, S3, and S4). These
deviations may reflect population structure, linkage disequilibrium, or epistasis. One of our
analyses corrected for population structure by incorporating the relationship matrix into the
mixed-model analysis (LIPPERT et al. 2011); this analysis resulted in some slight improvement the
QQ plot or P-value distributions, suggesting little effect of population structure on the results.
Our use of polymorphic variants with a minor allele frequency of less than 5% increases the
potential of spurious associations due to long-range LD (HUANG et al. 2014). Accordingly, we
calculated the extent of LD among significant variants. We observed high LD (r2 ≥ 0.80) in a
small region on chromosome 2R (base-pair position 8583734-5854540), a small region on

Page 22 of 44
chromosome 3R (base-pair position 22162040-22178605) and virtually all of the significant
polymorphisms on chromosome 4 (Fig. S5A). Ovariole asymmetry showed little LD (Fig. S5B),
while ovariole CVE had a region of LD on chromosome 3R (base-pair position 12970391-
13034018) (Fig. S5C). These high-LD regions make causal polymorphisms were more difficult to
distinguish, despite the fact that LD decays within 10-30 bp on average in the DGRP (MACKAY et
al. 2012). In addition, adjustment of phenotypes for the effect of five common inversions and
for Wolbachia infection status before GWA analysis did not impact ovariole number or ovariole
asymmetry. The adjustment may have affected ovariole number CVE, though the correlation
between the adjusted and un-adjusted trait values was very high (0.968) (Fig. S4B; compare
Table S2 with Table S5). However, none of the inversions nor infection status were significantly
associated with any of the 3 ovariole phenotypes (Table S6). We hypothesized that variants
identified by this study would causally contribute to quantitative variation in ovariole
phenotypes with the caveat that causal polymorphisms would be more difficult to pinpoint in
regions of high LD.
We limited our significance threshold to an uncorrected P-value of 1x10⁻⁵ or lower, a
threshold applied in many quantitative trait studies in the DGRP (ARYA et al. 2015; DEMBECK et al.
2015a; DEMBECK et al. 2015b; GARLAPOW et al. 2015; SHORTER et al. 2015; ZWARTS et al. 2015;
HUNTER et al. 2016). Using this threshold, we identified 164 variants associated with ovariole
number with false discovery rates (FDRs) ranging from 0.057 to 0.430 (Table S7). For ovariole
number asymmetry, 175 variants were associated with FDRs ranging from 0.043 to 0.293 (Table
S8). In addition, 1855 variants were associated with ovariole number CVE, and FDRs ranged
from 0.0002 to 0.042 (Table S9). We were primarily interested in ovariole number, so we

Page 23 of 44
focused on the variants associated with it. However, many of the variants for ovariole number
had high false discovery rates, which indicated less confidence in these variant calls. We
addressed this issue with further analysis and testing (see below).
Significantly associated SNPs covered the complete allele frequency spectrum, with
MAFs ranging from 0.01 to 0.49. Low frequency alleles (MAF < 0.05) were associated with each
trait and had larger normalized effect sizes than the more common alleles (Fig. S6). Consistent
with the results of numerous GWA studies (MAURANO et al. 2012), the majority (88%) of
significant trait-associated variants mapped to non-coding regions of the genome. Many of
these (43%) were in introns (Fig. S7). In contrast, just 12% of identified variants were in gene
coding regions. Thus, polymorphisms associated with ovariole number and its related traits
tend to fall in non-coding regions, and large-effect variants tend to be rare.
Some of the variants were predicted to alter amino acids. Non-synonymous variants in
seven (beat-IIb, bin3, CG32006, CG33978, CG34427, IR67b, and Rad23) and seven genes
(CG10621, CG10623, CG11149, CG2023, Plap, sip1, and Tsf1) were associated with ovariole
number and ovariole number asymmetry, respectively. There were 135 non-synonymous
variants associated with ovariole number CVE. The amino-acid altering variants associated with
ovariole number CVE mapped to 86 unique genes. Notably, 16 of them were in CG14117, a gene
of unknown function. Although they were a minority of all variants associated with ovariole
traits, we would expect many of these non-synonymous substitutions, insertions and deletions
to significantly affect Drosophila female reproductive morphology.
To assess pleiotropy among ovariole traits, we investigated the degree to which ovariole
number, asymmetry and ovariole number CVE shared common genetic architectures. No
Page 24 of 44
variants were common to all three traits and among all possible two-way unions. While
pleiotropy among polymorphisms was nearly non-existent, we identified 27 genes common to
multiple ovariole traits (Table S10).
Several of the genes we found associated with ovariole number, asymmetry and
ovariole number CVE were biologically plausible candidates for affecting ovariole development.
These included genes with known function in Drosophila sexual differentiation (fru) (RYNER et al.
1996), germ cell migration (Mdr49) (RICARDO AND LEHMANN 2009) and oogenesis (zfh1, cher, and
bin3) (MOORE et al. 1998; SOKOL AND COOLEY 2003; SINGH et al. 2011). While experimental work is
needed to confirm causal alleles, these genes are candidate determinants of Drosophila fitness.
Functional verification of ovariole candidate genes
We used all available Minos (BELLEN et al. 2011) and P-element insertion lines (BELLEN et
al. 2004) and homozygous UAS-RNAi constructs (DIETZL et al. 2007) to evaluate candidate genes
for ovariole number. Of the 89 genes identified by the GWA, 46 constructs in 43 candidate
genes were available (Table S1). These were genes in which SNPs located within or up to 1000
base pairs up- or downstream of the gene coding sequence were significantly associated with
ovariole number in our GWA analyses. Tests of Minos and P-element lines revealed significant
effects of 9 genes (Table 1, Table S11). Notably, we observed a reduction in ovariole number in
all mutant lines except MB00990, which carries a Minos element in kirre. In tests using UAS-RNAi
lines, we reduced candidate gene expression in somatic cells of the ovary using the Gal4 driver
lines bab1-Gal4 and traffic jam-Gal4 (see methods). The transcription factor bric-a-brac 1

Page 25 of 44
(bab1) is expressed during the larval stage by terminal filament precursor and terminal filament
cells of the ovary (COUDERC et al. 2002). Loss of function of bab1 has been shown to affect
ovariole number by altering terminal filament cell proliferation (BARTOLETTI et al. 2012). traffic
jam (tj) is a large Maf transcription factor expressed by somatic gonadal cells throughout
ovarian development. It affects terminal filament morphogenesis by regulating the expression
of adhesion molecules as the ovary develops (LI et al. 2003). Thus, these two Gal4 drivers may
identify genes that affect ovariole number through different cell populations and
developmental mechanisms.
Figure 4. Impact of major effect genes on ovary morphology and female fecundity. A) anneboleyn mutant and B) zfh1 knockdown ovary morphology; C) anneboleyn mutant and D) zfh1 knockdown offspring production.

Page 26 of 44
Tests of RNAi constructs showed significant phenotypic effects of gene knockdowns for
15 genes (Table 1). Interestingly, the efficacy of gene expression knockdown was different with
bab1 or traffic jam drivers (Table S12). Four RNAi constructs in which gene expression was
reduced using the bab1 driver showed phenotypic effects, vs. 15 constructs driven by traffic
jam. Notably, different genes impacted ovarioles with the bab1 and tj drivers, though CG31999,
Mdr49, RhoGEF64C, and SdhA had significant ovariole differences from the control using both
drivers. Thus, the effects of individual genes on ovariole number are mediated by the cellular
localization and developmental timing of their expression.
In addition to these quantitative changes in ovariole number, we observed qualitative
disruptions to reproductive morphology in flies carrying a Minos element in CG32000 and RNAi-
mediated knockdown of zfh1. Sixty-six percent of CG32000 females had either just one ovary or
no visible reproductive tissue; the remaining flies examined had ovaries that were wild-type in
appearance (Fig. 4A). We also observed large-scale disruptions to ovary morphology in all
females with an RNAi construct in zfh1. The putative reduction of zfh1 resulted in no visible
reproductive tissue in 100% (tj Gal4 driver) and 70% (bab1 Gal4 driver) of flies tested. The
remaining bab1 flies had large-scale reproductive abnormalities: either a single, large, mass of
tissue in place of ovaries or free-floating egg chambers without a visible ovary (Fig. 4B). To
determine the effects of these morphological abnormalities on female reproductive fitness, we
measured the productivity of individual females by counting the number of offspring they
produced. Productivity in CG32000 females was reduced as compared to the isogenic control (P

Page 27 of 44
= 0.0269; Fig 4C). While crosses to CG32000 males also had reduced progeny relative to crosses
with isogenic control males, the effects were not significant (P = 0.7774). There was a highly
significant effect of zfh1 knockdown on fecundity when we used both the bab1 (P = 0.0014) and
traffic jam (P < 0.0001) (Fig 4D) Gal4 drivers. All females carrying the zfh1 RNAi construct were
sterile. Reducing zfh1 expression in males with the bab1 driver decreased productivity relative
to control males (P < 0.05) (Fig 4D). zfh1 has a well-known role in Drosophila gonad
development (MOORE et al. 1998), but the function of CG32000 in ovariole development is
unknown. These tests confirm the critical role of zfh1 in female fitness and identify CG32000 as
a novel gene affecting female reproductive morphology and fitness. Due to the reduction in
female productivity, we have renamed CG32000 anneboleyn (anne), after King Henry VIII of
England’s wife Anne Boleyn, who had fertility issues.
Although we chose these genes as candidates affecting ovariole number, we also
observed significant effects on ovariole asymmetry (Table S13). Seven genes (bin3, blot,
CG31999, CG33970, CG42533, SdhA and slim) also impacted ovariole asymmetry in these tests.
These effects suggested a shared genetic architecture underlying ovariole number and the
processes that control its variation within an individual, though additional replication would be
required to confirm these effects as ovariole asymmetry is dominated by environmental
factors. Interestingly, none of the genes impacting ovariole number were also observed to
affect ovariole number CVE (Table S13). This may be attributed to the difficulty in obtaining
accurate estimates of CVE (MULDER et al. 2007), or to differences in the genetic bases of these
traits.

Page 28 of 44
Pleiotropy with sleep
We computed genetic correlations between ovariole phenotypes and female values for
fourteen sleep/activity traits measured in the DGRP (HARBISON et al. 2013). We found that
ovariole number and asymmetry were essentially uncorrelated with all sleep/activity traits. In
contrast, there were stronger genetic correlations between ovariole number CVE and some
sleep/activity CVE traits (rG = 0.40 for night bout number CVE and rG = 0.37 for waking activity
CVE) (Table S14). This suggests common variants affecting environmental sensitivity in both
systems exist.
Although ovariole number and sleep traits showed little genetic correlation, we noted
that thirty-nine genes contained variants significantly associated both with ovariole number
and one or more of the fourteen measured sleep traits (HARBISON et al. 2013). Pleiotropy has
been observed previously where individual SNPs in a given gene did not overlap among traits,
but were individually associated with each trait (CARBONE et al. 2006). Interestingly, over half of
these candidate genes were associated with more than one sleep trait (Table S15 and S16). In
addition, 42 ovariole asymmetry and 276 ovariole number CVE genes overlapped with sleep
traits (Table S15). With both sets of traits, we examined the overlap among genes with variants
having nominal P-values of 1×10⁻⁵ or less. However, the number of genes overlapping among
any two data sets tends to scale linearly with the number of genes identified (S. Harbison,
unpublished data). Thus, some overlap between sleep and ovariole number candidate genes
existed, but to demonstrate pleiotropy, functional tests of candidate genes for their role in
sleep were necessary.

Page 29 of 44
We tested twenty of the mutations and gene knockdowns that we assessed for ovariole
number for pleiotropic effects on sleep. Some effects on sleep were sex-specific (Table S17)
while others were common to both males and females (Table S18). These tests verified multiple
GWAS findings of association between individual genes and specific sleep phenotypes (HARBISON
et al. 2013). Three, seven and eight GWAS predictions were verified for females, males, and
both sexes, respectively. In addition, we replicated the effects of bin3 mutations on both day
and night sleep duration (Tables S17 and S18) (HARBISON et al. 2009). Nearly every gene affected
more than one sleep trait, which is consistent with the extensive pleiotropy among sleep
candidate genes that was previously observed (HARBISON et al. 2013). Importantly, these tests
identified seven genes with verified functional effects on both sleep and ovariole number: bin3,
blot, CG42389, kirre, slim, VAChT, and zfh1 (Table S19). These genes may have pleiotropic
effects on both sleep and ovariole number; alternatively, the apparent commonality may be
due to linkage among candidate polymorphisms (HUGHES AND LEIPS 2017). Thus, we calculated
the linkage disequilibrium among 269 candidate polymorphisms in the twenty genes common
to sleep and ovariole number that were tested. Only three pairs of polymorphisms between
ovariole number and sleep had r2 values that were significantly different from zero. Within the
gene VAChT, r2 was 0.417 between base-pair positions 18707150 and 18711650 on
chromosome 3R for ovariole number and night average bout length, respectively. Two day
bout number CVE polymorphisms (base-pair positions 16631610 and 16635912 on chromosome
2L) in CG42389 had high r2 values (0.333 and 1.0, respectively) with ovariole number
polymorphism 16608818. Thus, we identified seven genes that exhibited pleiotropic effects on

Page 30 of 44
sleep and ovariole number, but the extent of linkage disequilibrium among candidate SNPs
within these genes was low.
DISCUSSION
We used the DGRP to identify polymorphisms underlying natural variation in ovariole
number, ovariole CVE, and ovariole number asymmetry. Only a few genes underlying ovariole
number were previously known. These are the insulin-like receptor InR, the transcription factor
bab1, and members of the Hippo pathway (hpo, yki, sav, Mer, and ex) (GREEN AND EXTAVOUR
2012; SARIKAYA et al. 2012; GREEN AND EXTAVOUR 2014; SARIKAYA AND EXTAVOUR 2015). We identified
164 unique polymorphisms in 89 genes implicated in ovariole number variation in this study.
Consistent with the genetic architecture of other complex traits (JORDAN et al. 2012; MACKAY et
al. 2012; WEBER et al. 2012; HARBISON et al. 2013), the majority of polymorphisms affecting
variation in ovariole number were at low frequency. These variants, which segregate in the
DGRP, have passed through natural selection’s filter. Given ovariole number’s importance to
reproductive fitness, we anticipate that some of its genetic determinants will have been fixed
by natural selection in the DGRP. For instance, mean ovariole number differs tremendously
among insects and also varies among Drosophila species (HODIN AND RIDDIFORD 2000; HODIN
2009). This suggests the existence of fixed variants that determine upper and lower limits for
ovariole number in a species. These cannot be detected by GWAS but likely still are important
to reproductive physiology.

Page 31 of 44
Most of the variants we reported for ovariole number traits would have been
discovered using any of the three analysis approaches outlined here. However, the analysis
that included population structure as a covariate and adjusted phenotypes for the presence of
Wolbachia infection and chromosomal inversions did identify more candidate genes that were
verified in candidate gene tests, as inspection of Table 1 reveals. Each approach yielded
relatively high false-discovery rates associated with ovariole number variants (.057 to 0.43),
suggesting that some of our GWAS results may be false positives. Yet many of the variants
implicated to impact ovariole number lie in genes involved in female reproductive
development. First, our analyses identified an intronic polymorphism in Zn finger homeodomain
1 (zfh1) as associated with ovariole number. zfh1 is a component of the Stat signaling pathway
essential for self-renewal of ovarian germline stem cells (LEATHERMAN AND DINARDO 2008). High
expression levels of zfh1 are needed for germ cell differentiation and, consequently the
formation of functional ovaries (MAIMON et al. 2014). Our RNAi-mediated gene knockdown
experiments in bab1 and tj-expressing cells verify the necessity of zfh1 for ovary development
and female fertility. These findings mirror those of a previous study (MAIMON et al. 2014), which
also used RNAi to reduce zfh1 expression in the ovary with a traffic jam Gal4 driver.
Second, eight additional candidate genes have been previously implicated in ovary
development: hts (SNAPP et al. 2004; POKRYWKA et al. 2014), cher (SOKOL AND COOLEY 2003), Mdr49
(RICARDO AND LEHMANN 2009), tai (BAI et al. 2000), pan (JORDAN et al. 2000), RhoGEF64c (WANG et
al. 2006), Nlg1 and VAChT (SOSHNEV et al. 2012). The overlap with genes implicated in ovary
development provides additional confidence in the GWAS predictions for these genes. Using
mutant and knockout lines, we verified effects on ovariole number of four of these genes:
Page 32 of 44
Mdr49, VAChT, RhoGEF64C, and Nlg1. The canonical sex determination gene fruitless (fru) and
dpr13, a fru target (VERNES 2014) also are candidate ovariole number genes, as is the doublesex
and Mab-related transcription factor dmrt93b. Interestingly, these sex-determination genes are
primarily expressed in and associated with the development of male reproductive morphology
and behavior (ITO et al. 1996; RYNER et al. 1996; O'DAY 2010). Our findings suggest a role in
female reproductive development as well.
We also observed effects on ovariole number of 19 additional candidate genes,
including major disruptions in reproductive morphology in anneboleyn mutant lines.
anneboleyn lies within the high-LD region of chromosome 4, along with Ank, CG1674, CG2219,
CG31999, CG33978, Crk, and pan. Ank, CG1674, CG2219, CG31999, and Crk all had significant
quantitative effects on ovariole number, with a reduction of ovariole number with reduced
gene product in each case (Table 1). We cannot rule out the possibility that there is a single
causal locus in this region because of the strong LD. However, it is unlikely that the effects of
the verification tests are positional as we used UAS-RNAi constructs that map to a single
location on the second chromosome for tests of CG1674, CG2219, CG31999, and Crk (DIETZL et
al. 2007). anneboleyn is predicted by electronic annotation to function as a cell membrane
protein involved in cation transport (ATTRILL et al. 2016), and is a novel reproductive gene with
no previously known function. Thus, the GWAS identified genes that not only impact ovariole
number, but also have major effects on ovariole morphology.
Several limitations exist when using mutations to verify candidate genes discovered
using genome-wide association. First, gene mutants and expression knockdowns may differ in
Page 33 of 44
their phenotypic effects from naturally segregating variants, and positional effects of
engineered mutations can cause opposing phenotypes (ROLLMANN et al. 2006). Second, although
the use of mutant/RNAi collections with isogenic controls greatly reduces background effects,
mutations can accumulate randomly in both mutant and control lines over time, potentially
resulting in off-target effects on the phenotypes of interest. Third, GWAS does not provide any
information concerning the tissues or developmental stages in which candidate gene action is
critical to the trait of interest. While we anticipate that the effects of natural variants may be
subtle, expression changes in natural populations of Drosophila can vary greatly in magnitude
(AYROLES et al. 2009). Furthermore, the expression levels of some tested genes may be reduced
more significantly than others as constructs differ in their efficiency. In addition, Minos and P-
element mutations impact gene expression in all cell types throughout development. The
ovariole number differences we observed between RNAi lines crossed to bab1 vs. tj Gal4 drivers
demonstrates that cell type and developmental timing are important considerations in the
phenotypic effects of candidate genes. Finally, the genetic backgrounds of flies having
mutations or RNAi constructs differ from the DGRP lines. Thus, we suggest that epistatic
interactions may modify candidate gene effects on ovariole number in the DGRP and in these
tests as epistasis is commonly observed among Drosophila complex traits, including sleep
(HUANG et al. 2012; SWARUP et al. 2012). 2,272 known D. melanogaster genes are grouped with
the gene ontology term ‘reproduction’, which includes, but is not limited to, genes involved in
ovariole number development (ATTRILL et al. 2016). There are 17,727 genes total, so an
unbiased survey of the entire genome would have a 12.8% chance of finding a gene involved in
reproduction. We tested 46 mutations in 43 candidate genes and found 24 with significant

Page 34 of 44
effects on ovariole number (55.8%). The GWA therefore significantly enhanced our ability to
discover candidate genes affecting female reproduction.
Most mutations and RNAi constructs did not show pleiotropic effects on other ovariole
traits. Eight genes impacted ovariole asymmetry in addition to ovariole number, and none
impacted ovariole number CVE. This finding is consistent with the low genetic correlation
between ovariole number and ovariole number CVE and suggests that different genes control
ovariole number and its sensitivity to the environment. This differs from sleep traits for which
the genetic architectures of trait means and their environmental sensitivities were largely
shared (HARBISON et al. 2013). Accordingly, some studies have observed little correlation
between ovariole number and egg production (ROBERTSON 1957; R'KHA et al. 1997) or
multigenerational fitness (WAYNE et al. 1997), which may reflect the sensitivity of ovariole
number to environmental factors such as temperature (COHET AND DAVID 1978; HODIN AND
RIDDIFORD 2000; SARIKAYA et al. 2012; KLEPSATEL et al. 2013a; KLEPSATEL et al. 2013b), or food
availability and nutrition (HODIN AND RIDDIFORD 2000; TU AND TATAR 2003; WAYNE et al. 2006;
BERGLAND et al. 2008). Additional work is needed to determine what factors influence these
relationships.
Fewer variants were associated with ovariole number than with asymmetry and ovariole
number CVE. This was not anticipated as ovariole number had greater broad-sense heritability
than ovariole asymmetry and ovariole number CVE. However, broad-sense heritability as we
have calculated it here encompasses all sources of genetic variation, including both dominance
and epistatic effects (FALCONER AND MACKAY 1996). Our result suggests that the contribution of

Page 35 of 44
additive genetic variance to ovariole number may be low. Furthermore, small, random
fluctuations in bialateral characters ordinarily are due to sensitivity of genotypes to random
environmental perturbations (VAN VALEN 1962). Thus, variation in ovariole number asymmetry
likely indicates differences in canalization among DGRP genotypes. In this way, ovariole
asymmetry and ovariole number CVE are similar traits: both measure variation in ovariole
number among genetically identical flies. The genes implicated in variation in these traits
comprise the genetic component of environmental variability (HARBISON et al. 2013).
Even so, six genes are predicted by GWAS to impact both traits. These include
crossveinless (cv-c), a component of the EGFR pathway implicated in tissue morphogenesis
(BRODU AND CASANOVA 2006) and the ecdysone receptor (EcR). EcR plays an important role in
ovary development (HACKNEY et al. 2007; LUO et al. 2015). It also has been shown to affect
plasticity in Drosophila ovariole number by another study (MENDES AND MIRTH 2016). Hormone
pathways serve as proximate mechanisms underlying phenotypic plasticity across species (ZHOU
et al. 2007; SOMMER AND OGAWA 2011) (reviewed in (LEMA AND KITANO 2013)). This is achieved
through modulating the expression of downstream genes that affect tissue development
(MARKEY et al. 2003). Interestingly, EcR also has been linked to phenotypic plasticity in butterfly
eyespots (MONTEIRO et al. 2015). Thus, it may underlie plasticity more broadly.
In addition, we examined the GWA results for evidence of pleiotropic genes affecting
both sleep and ovariole number traits. While no genetic correlation between ovariole number
and sleep existed, and the overlap between polymorphisms common to each was low, there
were 344 genes common to both studies. Recent work has argued that the partitioning of

Page 36 of 44
genetic variance into components at the phenotype level does not necessarily reflect
underlying gene action, which may explain why we were able to find overlapping genes (HUANG
AND MACKAY 2016). The GWAS for ovariole number traits identified 943 unique candidate genes,
5.3% of the number of genes in the fly genome (17,727). We would expect 5.3% of the 3,628
genes found in the sleep GWA to overlap by random chance, or 192 genes. Thus, the 344-gene
overlap we observed between sleep and ovariole number is higher than would be expected by
random chance. We confirmed the effects on both sleep and ovariole number for seven genes.
Little linkage disequilibrium existed among polymorphisms in these seven genes, implying
differences in the forces maintaining them in nature. Our results are analogous to a previous
study of Catecholamines up (Catsup), in which different polymorphic variants were significantly
associated with lifespan, bristle number, startle response, and starvation resistance—though
the genetic correlations among these traits were low (CARBONE et al. 2006). Population genetics
tests suggested that the polymorphisms in Catsup associated with different traits evolved
independently of one another (CARBONE et al. 2006). The same scenario may also be true for
these seven genes, suggesting that independent evolution of polymorphisms for complex traits
may be more widespread. Variation among complex traits would then be maintained by
networks of polymorphisms for each trait responding to environmental conditions.
Alternatively, if genes common to both traits interact with the environment, higher genetic
correlations may exist under different environmental conditions.
ACKNOWLEDGEMENTS
Page 37 of 44
This research was supported by the Intramural Research Program of the NIH, The National
Heart Lung and Blood Institute. The authors would like to thank J. Leips for helpful discussions.
Page 38 of 44
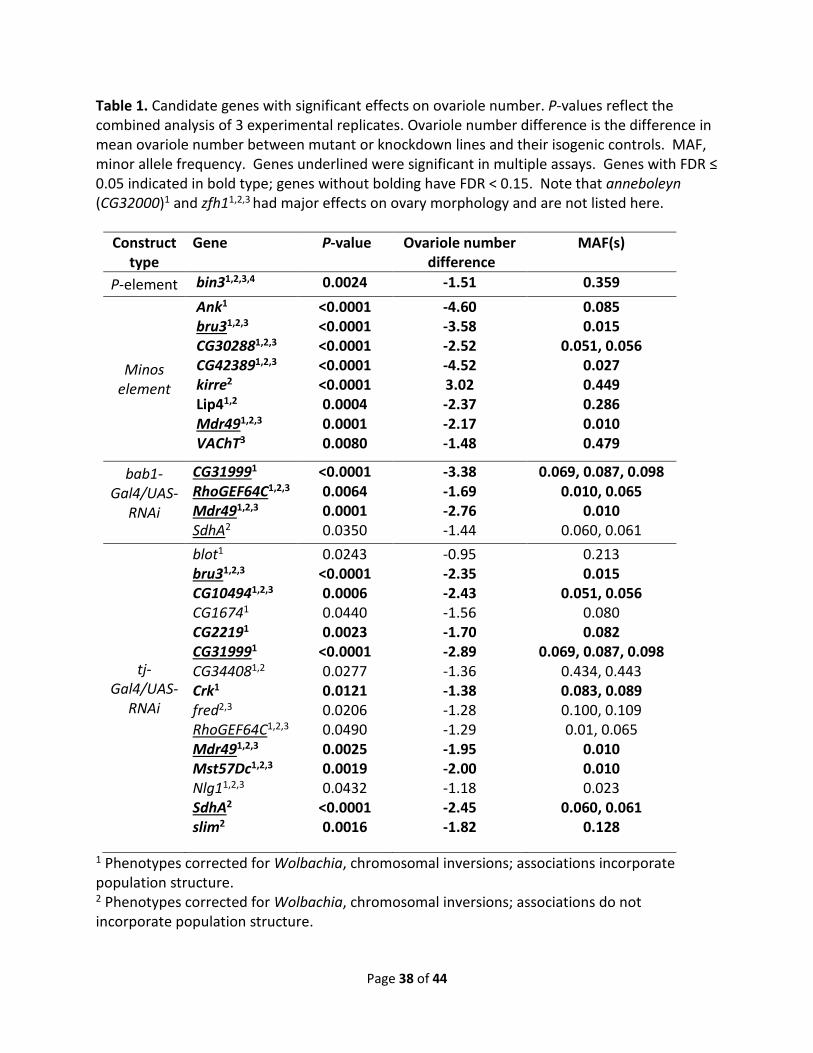
Table 1. Candidate genes with significant effects on ovariole number. P-values reflect the combined analysis of 3 experimental replicates. Ovariole number difference is the difference in mean ovariole number between mutant or knockdown lines and their isogenic controls. MAF, minor allele frequency. Genes underlined were significant in multiple assays. Genes with FDR ≤ 0.05 indicated in bold type; genes without bolding have FDR < 0.15. Note that anneboleyn (CG32000)1 and zfh11,2,3 had major effects on ovary morphology and are not listed here.
Construct type
Gene P-value Ovariole number difference
MAF(s)
P-element bin31,2,3,4 0.0024 -1.51 0.359
Minos element
Ank1 bru31,2,3 CG302881,2,3 CG423891,2,3 kirre2 Lip41,2 Mdr491,2,3 VAChT3
<0.0001 <0.0001 <0.0001 <0.0001 <0.0001 0.0004 0.0001 0.0080
-4.60 -3.58 -2.52 -4.52 3.02 -2.37 -2.17 -1.48
0.085 0.015
0.051, 0.056 0.027 0.449 0.286 0.010 0.479
bab1-Gal4/UAS-
RNAi
CG319991 RhoGEF64C1,2,3 Mdr491,2,3 SdhA2
<0.0001 0.0064 0.0001 0.0350
-3.38 -1.69 -2.76 -1.44
0.069, 0.087, 0.098 0.010, 0.065
0.010 0.060, 0.061
tj-Gal4/UAS-
RNAi
blot1 bru31,2,3 CG104941,2,3 CG16741 CG22191 CG319991 CG344081,2 Crk1 fred2,3 RhoGEF64C1,2,3 Mdr491,2,3 Mst57Dc1,2,3 Nlg11,2,3 SdhA2 slim2
0.0243 <0.0001 0.0006 0.0440 0.0023
<0.0001 0.0277 0.0121 0.0206 0.0490 0.0025 0.0019 0.0432
<0.0001 0.0016
-0.95 -2.35 -2.43 -1.56 -1.70 -2.89 -1.36 -1.38 -1.28 -1.29 -1.95 -2.00 -1.18 -2.45 -1.82
0.213 0.015
0.051, 0.056 0.080 0.082
0.069, 0.087, 0.098 0.434, 0.443 0.083, 0.089 0.100, 0.109 0.01, 0.065
0.010 0.010 0.023
0.060, 0.061 0.128
1 Phenotypes corrected for Wolbachia, chromosomal inversions; associations incorporate population structure. 2 Phenotypes corrected for Wolbachia, chromosomal inversions; associations do not incorporate population structure.

Page 39 of 44
3 Phenotypes not corrected for Wolbachia or chromosomal inversions; associations do not incorporate population structure. 4 Allele bin3BG01137 only.

Page 40 of 44
REFERENCES
Arya, G. H., M. M. Magwire, W. Huang, Y. L. Serrano Negron, T. F. Mackay et al., 2015 The genetic basis for variation in olfactory behavior in Drosophila melanogaster. Chemical Senses 40: 233-243.
Attrill, H., K. Falls, J. L. Goodman, G. H. Milburn, G. Antonazzo et al., 2016 FlyBase: establishing a gene group resource for Drosophila melanogaster. Nucleic Acids Res 44: D786-D792.
Ayroles, J. F., M. A. Carbone, E. A. Stone, K. W. Jordan, R. F. Lyman et al., 2009 Systems genetics of complex traits in Drosophila melanogaster. Nat Genet 41: 299-307.
Azevedo, R. B. R., V. French and L. Partridge, 1996 Thermal evolution of egg size in Drosophila melanogaster. Evolution 50: 2338-2345.
Bai, J., Y. Uehara and D. J. Montell, 2000 Regulation of invasive cell behavior by Taiman, a Drosophila protein related to AIB1, a steroid receptor coactivator amplified in breast cancer. Cell 103: 1047-1058.
Bartoletti, M., T. Rubin, F. Chalvet, S. Netter, N. Dos Santos et al., 2012 Genetic basis for developmental homeostasis of germline stem cell niche number: A network of tramtrack-group nuclear BTB factors. PLoS One 7: e49958.
Bellen, H. J., R. W. Levis, Y. He, J. W. Carlson, M. Evans-Holm et al., 2011 The Drosophila gene disruption project: Progress using transposons with distinctive site specificities. Genetics 188: 731-743.
Bellen, H. J., R. W. Levis, G. Liao, Y. He, J. W. Carlson et al., 2004 The BDGP gene disruption project: Single transposon insertions associated with 40% of Drosophila genes. Genetics 167: 761-781.
Benjamini, Y., and Y. Hochberg, 1995 Controlling the false discovery rate: a practical and powerful approach to multiple testing. J R Statist Soc B 57: 289-300.
Bergland, A. O., A. Genissel, S. V. Nuzhdin and M. Tatar, 2008 Quantitative trait loci affecting phenotypic plasticity and the allometric relationship of ovariole number and thorax length in Drosophila melanogaster. Genetics 180: 567-582.
Bouletreau-Merle, J., R. Allemand, Y. Cohet and J. R. David, 1982 Reproductive strategy in Drosophila melanogaster: Significance of a genetic divergence between temperate and tropical populations. Oecologia 53: 323-329.
Brodu, V., and J. Casanova, 2006 The RhoGAP crossveinless-c links trachealess and EGFR signaling to cell shape remodeling in Drosophila tracheal invagination. Genes Dev 20: 1817-1828.
Capy, P., E. Pla and J. R. David, 1993 Phenotypic and genetic variability of morphometrical traits in natural populations of Drosophila melanogaster and D. simulans. I. Geographic variations. Genet Sel Evol 25: 517-536.
Carbone, M. A., K. W. Jordan, R. F. Lyman, S. T. Harbison, J. Leips et al., 2006 Phenotypic variation and natural selection at Catsup, a pleiotropic quantitative trait gene in Drosophila. Curr Biol 16: 912-919.
Cohet, Y., and J. R. David, 1978 Control of adult reproductive potential by preimaginal thermal conditions. Oecologia 36: 295-306.
Couderc, J.-L., D. Godt, S. Zollman, J. Chen, M. Li et al., 2002 The bric a brac locus consists of two paralogous genes encoding BTB/POZ domain proteins and acts as a homeotic and morphogenetic regulator of imaginal development in Drosophila. Development 129: 2419-2433.
Dembeck, L. M., K. Boroczky, W. Huang, C. Schal, R. R. Anholt et al., 2015a Genetic architecture of natural variation in cuticular hydrocarbon composition in Drosophila melanogaster. Elife 4.
Dembeck, L. M., W. Huang, M. M. Magwire, F. Lawrence, R. F. Lyman et al., 2015b Genetic architecture of abdominal pigmentation in Drosophila melanogaster. PLoS Genet 11: e1005163.
Dietzl, G., D. Chen, F. Schnorrer, K. C. Su, Y. Barinova et al., 2007 A genome-wide transgenic RNAi library for conditional gene inactivation in Drosophila. Nature 448: 151-156.

Page 41 of 44
Falconer, D. S., and T. F. Mackay, 1996 Introduction to Quantitative Genetics. Addison Wesley Longman Limited, Edinburgh Gate, Harlow.
Ganguly-Fitzgerald, I., J. Donlea and P. J. Shaw, 2006 Waking experience affects sleep need in Drosophila. Science 313: 1775-1781.
Garlapow, M. E., W. Huang, M. T. Yarboro, K. R. Peterson and T. F. Mackay, 2015 Quantitative genetics of food intake in Drosophila melanogaster. PLoS One 10: e0138129.
Green, D. A., and C. G. Extavour, 2012 Convergent evolution of a reproductive trait through distinct developmental mechanisms in Drosophila. Dev Biol 372: 120-130.
Green, D. A., and C. G. Extavour, 2014 Insulin signalling underlies both plasticity and divergence of a reproductive trait in Drosophila. Proc R Soc B 281: 20132673.
Guo, F., J. Yu, H. J. Jung, K. C. Abruzzi, W. Luo et al., 2016 Circadian neuron feedback controls the Drosophila sleep-activity profile. Nature 536.
Hackney, J. F., C. Pucci, E. Naes and L. Dobens, 2007 Ras signaling modulates activity of the Ecdysone receptor EcR during cell migration in the Drosophila ovary. Dev Dyn 236: 1213-1226.
Harbison, S. T., M. A. Carbone, J. F. Ayroles, E. A. Stone, R. F. Lyman et al., 2009 Co-regulated transcriptional networks contribute to natural genetic variation in Drosophila sleep. Nat Genet 41: 371-375.
Harbison, S. T., L. J. McCoy and T. F. Mackay, 2013 Genome-wide association study of sleep in Drosophila melanogaster. BMC Genomics 14: 281.
Hendricks, J. C., S. Lu, K. Kume, J. C.-P. Yin, Z. Yang et al., 2003 Gender dimorphism in the role of cycle (BMAL1) in rest, rest regualation, and longevity in Drosophila melanogaster. J Biol Rhythms 18: 12-25.
Hill, W. G., and H. A. Mulder, 2010 Genetic analysis of environmental variation. Genet Res 92: 381-395. Hodin, J., 2009 She shapes events as they come: plasticity in female insect reproduction, pp. 423-521 in
Phenotypic plasticity of insects: mechanisms and consequences, edited by D. W. Whitman and T. N. Ananthakrishnan. Science, Enfield, NH.
Hodin, J., and L. M. Riddiford, 2000 Different mechanisms underlie phenotypic plasticity and interspecific variation for a reproductive character in Drosophilids (Insecta: Diptera). Evolution 54: 1638-1653.
Honek, A., 1993 Intraspecific variation in body size and fecundity in insects: A general relationship. Oikos 66: 483-492.
Huang, W., and T. F. Mackay, 2016 The Genetic Architecture of Quantitative Traits Cannot Be Inferred from Variance Component Analysis. PLoS Genet 12: e1006421.
Huang, W., A. Massouras, Y. Inoue, J. Peiffer, M. Ramia et al., 2014 Natural variation in genome architecture among 205 Drosophila melanogaster Genetic Reference Panel lines. Genome Res 24: 1193-1208.
Huang, W., S. Richards, M. A. Carbone, D. Zhu, R. R. Anholt et al., 2012 Epistasis dominates the genetics architecture of Drosophila quantitative traits. Proc Natl Acad Sci U S A 109: 15553-15559.
Huber, R., S. L. Hill, C. Holladay, M. Biesiadecki, G. Tononi et al., 2004 Sleep homeostasis in Drosophila melanogaster. Sleep 27: 628-639.
Hughes, K. A., and J. Leips, 2017 Pleiotropy, constraint, and modularity in the evolution of life histories: insights from genomic analyses. Ann N Y Acad Sci 1389: 76-91.
Hunter, C. M., W. Huang, T. F. Mackay and N. D. Singh, 2016 The Genetic Architecture of Natural Variation in Recombination Rate in Drosophila melanogaster. PLoS Genet 12: e1005951.
Isaac, R. E., C. Li, A. E. Leedale and A. D. Shirras, 2010 Drosophila male sex peptide inhibits siesta sleep and promotes locomotor activity in the post-mated female. Proc R Soc B 277: 65-70.

Page 42 of 44
Ito, H., K. Fujitani, K. Usui, K. Shimizu-Nishikawa, S. Tanaka et al., 1996 Sexual orientation in Drosophila is altered by the satori mutation in the sex-determination gene fruitless that encodes a zinc finger protein with a BTB domain. Proc Natl Acad Sci U S A 93: 9687-9692.
Jordan, K. C., S. D. Hatfield, M. Tworoger, E. J. Ward, K. A. Fischer et al., 2000 Genome wide analysis of transcript levels after perturbation of the EGFR pathway in the Drosophila ovary. Dev Dyn 232: 709-724.
Jordan, K. W., K. L. Craver, M. M. Magwire, C. E. Cubilla, T. F. Mackay et al., 2012 Genome-wide association for sensitivity to chronic oxidative stress in Drosophila melanogaster. PLoS One 7: e38722.
Klepsatel, P., M. Galikova, N. De Maio, C. D. Huber and C. Schlotterer, 2013a Variation in thermal performance and reaction norms among populations of Drosophila melanogaster. Evolution 67: 3573-3587.
Klepsatel, P., M. Galikova, N. De Maio, S. Ricci, C. Schlotterer et al., 2013b Reproductive and post-reproductive life history of wild-caught Drosophila melanogaster under laboratory conditions. J Evol Biol 26: 1508-1520.
Leatherman, J. L., and S. DiNardo, 2008 Zfh-1 controls somatic stem cell self-renewal in the Drosophila testis and nonautonomously influences germline stem cell self-renewal. Cell Stem Cell 3: 44-54.
Lema, S. C., and J. Kitano, 2013 Hormones and phenotypic plasticity: Implications for the evolution of integrated adaptive phenotypes. Curr Zool 59: 506-525.
Li, M. A., J. D. Alls, R. M. Avancini, K. Koo and D. Godt, 2003 The large Maf factor traffic jam controls gonad morphogenesis in Drosophila. Nat Cell Biol 5: 994-1000.
Lippert, C., J. Listgarten, Y. Liu, C. M. Kadie, R. I. Davidson et al., 2011 FaST linear mixed models for genome-wide association studies. Nat Meth 8: 833-835.
Luo, J., J. Zuo, J. Wu, P. Wan, D. Kang et al., 2015 In vivo RNAi screen identfies candidate signaling genes required for collective cell migration in Drosophila ovary. Sci China Life Sci 58: 379-389.
Mackay, T. F., and R. F. Lyman, 2005 Drosophila bristles and the nature of quantitative genetic variation. Phil Trans R Soc B 360: 1513-1527.
Mackay, T. F., S. Richards, E. A. Stone, A. Barbadilla, J. F. Ayroles et al., 2012 The Drosophila melanogaster Genetic Reference Panel. Nature 482: 173-178.
Maimon, I., M. Popliker and L. Gilboa, 2014 Without children is required for Stat-mediated zfh1 transcription and for germline stem cell differentiation. Development 141: 2602-2610.
Markey, C. M., M. A. Coombs, C. Sonnenschein and A. M. Soto, 2003 Mammalian development in a changing environment: exposure to endocrine disruptors reveals the developmental plasticity of steroid-hormone target organs. Evol Dev 5: 67-75.
Maurano, M. T., R. Humbert, E. Rynes, R. E. Thurman, E. Haugen et al., 2012 Systematic localization of common disease-associated variation in regulatory DNA. Science 337: 1190-1195.
Mendes, C. C., and C. K. Mirth, 2016 Stage-specific plasticity in ovary size is regulated by insulin/insulin-like growth factor and ecdysone signaling in Drosophila. Genetics 202: 703-719.
Monteiro, A., X. Tong, A. Bear, S. F. Liew, S. Bhardwaj et al., 2015 Differential expression of ecdysone receptor leads to variation in phenotypic plasticity across serial homologs. PLoS Genet 11: e1005529.
Moore, L. A., H. T. Broihier, M. Van Doren, L. B. Lunsford and R. Lehmann, 1998 Identification of genes controlling germ cell migration and embryonic gonad formation in Drosophila. Development 125: 667-678.
Mulder, H. A., P. Bijma and W. G. Hill, 2007 Prediction of breeding values and selection responses with genetic heterogeneity of environmental variance. Genetics 175: 1895-1910.
O'Day, D., 2010 Genetic analysis of the function of Drosophila doublesex-related factor dmrt93B. UT GSBS Dissertations and Theses Paper 54.
Page 43 of 44
Orgogozo, V., K. W. Broman and D. L. Stern, 2006 High-resolution quantitative trait locus mapping reveals sign epistasis controlling ovariole number between two Drosophila species. Genetics 173: 197-205.
Pokrywka, N. J., H. Zhang and K. Raley-Susman, 2014 Distinct roles for hu li tai shao and swallow in cytoskeletal organization during Drosophila oogenesis. Dev Dyn 243: 906-916.
Purcell, S., B. Neale, K. Todd-Brown, L. Thomas, M. A. R. Ferreira et al., 2007 PLINK: a toolset for whole-genome association and population-based linkage analysis. American Journal of Human Genetics 81: 559-575.
R'kha, S., B. Moreteau, J. A. Coyne and J. R. David, 1997 Evolution of a lesser fitness trait: egg production in the specialist Drosophila sechellia. Genet Res 69: 17-23.
Ricardo, S., and R. Lehmann, 2009 An ABC transporter controls export of a Drosophila germ cell attactant. Science 323: 943-946.
Robertson, F. W., 1957 Studies in quantitative inheritance. X. Genetic variation of ovary size in Drosophila. J Genet 55: 410-427.
Rollmann, S. M., M. M. Magwire, T. J. Morgan, E. D. Ozsoy, A. Yamamoto et al., 2006 Pleiotropic fitness effects of the Tre1-Gr5a region in Drosophila melanogaster. Nat Genet 38: 824-829.
Ryner, L. C., S. F. Goodwin, D. H. Castrillon, A. Anand, A. Villella et al., 1996 Control of male sexual behavior and sexual orientation in Drosophila by the fruitless gene. Cell 87: 1079-1089.
Sarikaya, D. P., A. A. Belay, A. Ahuja, A. Dorta, D. A. Green et al., 2012 The roles of cell size and cell number in determining ovariole number in Drosophila. Dev Biol 363: 279-289.
Sarikaya, D. P., and C. G. Extavour, 2015 The Hippo pathway regulates homeostatic growth of stem cell niche percursors in the Drosophila ovary. PLoS Genet 11: e1004962.
Schmidt, P. S., L. Matzkin, M. Ippolito and W. F. Eanes, 2005 Geographic variation in diapause incidence, life-history traits, and climatic adaptation in Drosophila melanogaster. Evolution 59: 1721-1732.
Shorter, J., C. Couch, W. Huang, M. A. Carbone, J. Peiffer et al., 2015 Genetic architecture of natural variation in Drosophila melanogaster aggressive behavior. Proc Natl Acad Sci U S A 112: E3555-E3563.
Singh, N., H. Morlock and S. D. Hanes, 2011 The Bin3 RNA methyltransferase is required for repression of caudal translation in the Drosophila embryo. Dev Biol 352: 104-115.
Snapp, E. L., T. Iida, D. Frescas, J. Lippincott-Schwartz and M. A. Lilly, 2004 The fusome mediates intercellular endoplasmic reticulum connectivity in Drosophila ovarian cysts. Mol Biol Cell 15: 4512-4521.
Sokal, R. R., and J. Rohlf, 1995 Biometry. W. H. Freeman and Company, New York. Sokol, N. S., and L. Cooley, 2003 Drosophila filamin is required for follicle cell motility during oogenesis.
Dev Biol 260: 260-272. Sommer, R. J., and A. Ogawa, 2011 Hormone signaling and phenotypic plasticity in nematode
development and evolution. Curr Biol 21: R758-R766. Soshnev, A. A., B. He, R. M. Baxley, N. Jiang, C. M. Hart et al., 2012 Genome-wide studies of the multi-
zinc finger Drosophila Suppressor of Hairy-wing protein in the ovary. Nucleic Acids Res 40: 5415-5431.
Swarup, S., S. T. Harbison, L. E. Hahn, T. V. Morozova, A. Yamamoto et al., 2012 Extensive epistasis for olfactory behavior, sleep and waking activity in Drosophila melanogaster. Genet Res 94: 9-20.
Tu, M.-P., and M. Tatar, 2003 Juvenile diet restriction and the aging and reproduction of adult Drosophila melanogaster. Aging Cell 2: 327-333.
Van Valen, L., 1962 Study of flucutating asymmetry. Evolution 16: 125-142. Vernes, S. C., 2014 Genome wide identification of Fruitless targets suggests a role in upregulating genes
important for neural circuit formation. Sci Rep 4: 4412.

Page 44 of 44
Wang, X., J. Bo, T. Bridges, K. D. Dugan, T. Pan et al., 2006 Analysis of cell migration using whole-genome expression profiling of migratory cells in the Drosophila ovary. Dev Cell 10: 483-395.
Wayne, M. L., J. B. Hackett, C. L. Dilda, S. V. Nuzhdin, E. G. Pasyukova et al., 2001 Quantitative trait locus mapping of fitness-related traits in Drosophila melanogaster. Genet Res 77: 107-116.
Wayne, M. L., J. B. Hackett and T. F. Mackay, 1997 Quantitative genetics of ovariole number in Drosophila melanogaster. I. Segregating variation and fitness. Evolution 51: 1156-1163.
Wayne, M. L., and T. F. Mackay, 1998 Quantitative genetics of ovariole number in Drosophila melanogaster. II. Mutational variation and genotype-environment interaction. Genetics 148: 201-210.
Wayne, M. L., U. Soundararajan and L. G. Harshman, 2006 Environmental stress and reproduction in Drosophila melanogaster: starvation resistance, ovariole numbers and early age egg production. BMC Evol Biol 6: 57.
Weber, A. L., G. F. Khan, M. M. Magwire, C. L. Tabor and T. F. Mackay, 2012 Genome-wide association analysis of oxidative stress resistance in Drosophila melanogaster. PLoS One 7: e34745.
Zhou, X., M. R. Tarver and M. E. Scharf, 2007 Hexamerin-based regulation of juvenile hormone-dependent gene expression underlies phenotypic plasticity in a social insect. Development 134: 601-610.
Zwarts, L., L. Vanden Broeck, E. Cappuyns, J. F. Ayroles, M. M. Magwire et al., 2015 The genetic basis of natural variation in mushroom body size in Drosophila melanogaster. Nat Commun 6: 10115.