papor 2015 speed learning aapor panel evaluating polling accuracy final
TRANSCRIPT

SPEED LEARNING: EVALUATING POLLING
ACCURACYAAPOR Panel | May 16th, 2015
Mary McDougall | CFMC Survox
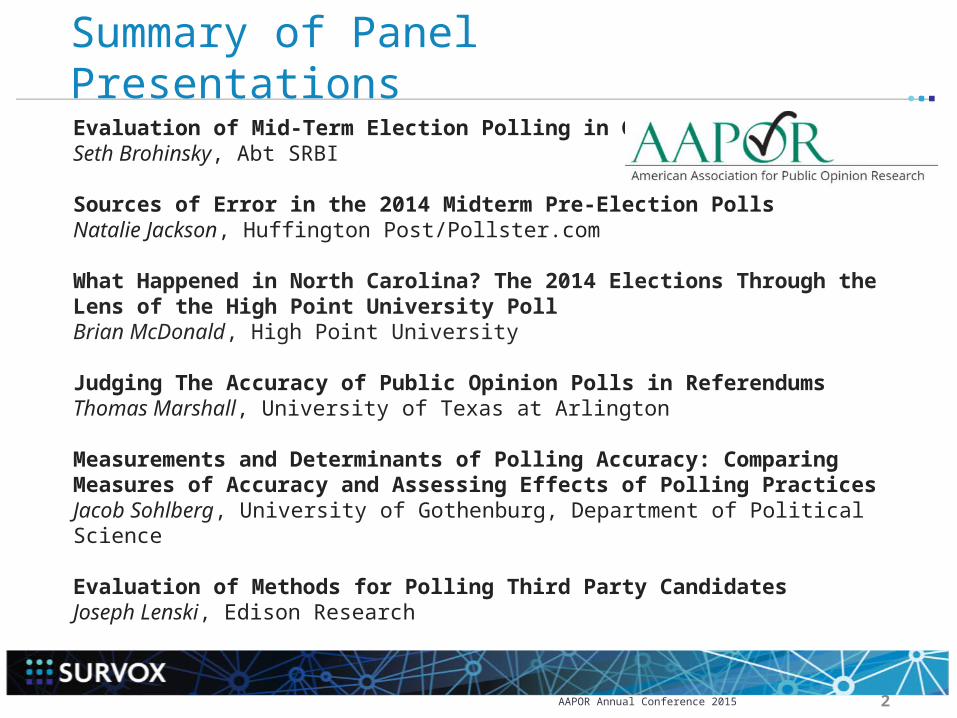
Summary of Panel Presentations
Evaluation of Mid-Term Election Polling in GeorgiaSeth Brohinsky, Abt SRBI
Sources of Error in the 2014 Midterm Pre-Election PollsNatalie Jackson, Huffington Post/Pollster.com
What Happened in North Carolina? The 2014 Elections Through the Lens of the High Point University PollBrian McDonald, High Point University
Judging The Accuracy of Public Opinion Polls in ReferendumsThomas Marshall, University of Texas at Arlington
Measurements and Determinants of Polling Accuracy: Comparing Measures of Accuracy and Assessing Effects of Polling PracticesJacob Sohlberg, University of Gothenburg, Department of Political Science Evaluation of Methods for Polling Third Party CandidatesJoseph Lenski, Edison Research
AAPOR Annual Conference 2015 2
Evaluating Polling Accuracy:
Evaluation of Mid-Term Election Polling in Georgia
Seth Brohinsky, Abt SRBICourtney Kennedy, Abt SRBI
Dean Williams, Abt SRBI
AAPOR 70th Annual ConferenceSaturday, May 16, 2015

Abt SRBI | pg 4
Seth BrohinskyProject DirectorAbt SRBI
4
Master’s Degree in Public Administration from the University of Connecticut and has directed several large-scale studies,
including all election polling for the 2012 ABC News/Washington Post Election Polls.
---------------------------
Polling challenges in Georgia
The impact of experimental weighting to improve horserace estimates for the 2014 U.S. Senate and Gubernatorial elections.
What the implications may be for the 2016 election

Abt SRBI | pg 5
2014 Georgia Senate Race Polls
Poll Date Sample MoE Perdue (R) Nunn (D) Swafford (L) Spread
Final Results -- -- -- 53.0 45.1 1.9 Perdue +7.9
RCP Average 10/27 - 11/3 -- -- 47.8 44.8 3.6 Perdue +3.0
PPP (D) 11/1 - 11/3 975 LV 3.1 46 45 5 Perdue +1
WSB-TV/Landmark 11/2 - 11/2 1500 LV 2.5 50 46 2 Perdue +4
SurveyUSA 10/30 - 11/2 591 LV 4.1 47 44 5 Perdue +3
InsiderAdvantage 10/30 - 11/2 1463 LV 2.6 48 45 3 Perdue +3
YouGov 10/25 - 10/31 1743 LV 3.2 44 42 1 Perdue +2
NBC News/Marist 10/27 - 10/30 603 LV 4.0 48 44 3 Perdue +4
WSB-TV/Landmark 10/29 - 10/29 1500 LV 2.5 47 47 3 Tie
SurveyUSA 10/24 - 10/27 611 LV 4.0 48 45 3 Perdue +3
Atlanta Journal-Constitution 10/16 - 10/23 1170 LV 3.6 44 42 6 Perdue +2
CBS News/NYT/YouGov 10/16 - 10/23 1774 LV 4.0 47 44 1 Perdue +3
InsiderAdvantage 10/21 - 10/22 704 LV 3.7 45 47 4 Nunn +2
CNN/Opinion Research 10/19 - 10/22 565 LV 4.0 44 47 5 Nunn +3
WSB-TV/Landmark 10/20 - 10/21 1000 LV 2.8 47 47 3 Tie
SurveyUSA 10/17 - 10/20 606 LV 4.1 44 46 4 Nunn +2
WRBL/Ledger-Enquirer/PMB 10/13 - 10/14 1543 LV 2.5 45 46 6 Nunn +1
Abt SRBI | pg 6
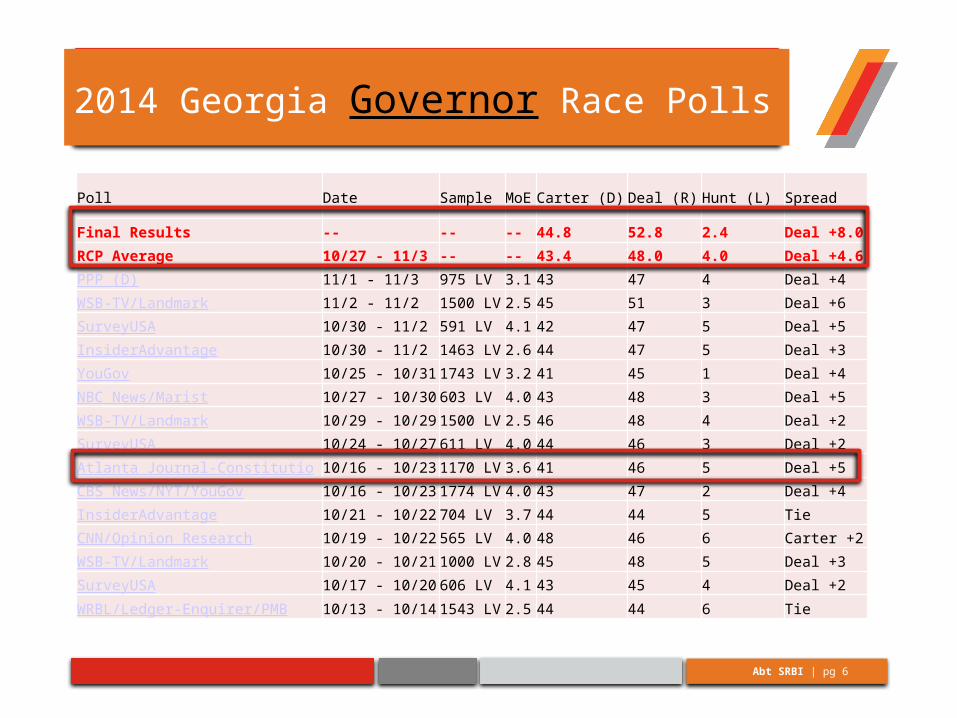
2014 Georgia Governor Race Polls
Poll Date Sample MoE Carter (D) Deal (R) Hunt (L) Spread
Final Results -- -- -- 44.8 52.8 2.4 Deal +8.0
RCP Average 10/27 - 11/3 -- -- 43.4 48.0 4.0 Deal +4.6
PPP (D) 11/1 - 11/3 975 LV 3.1 43 47 4 Deal +4
WSB-TV/Landmark 11/2 - 11/2 1500 LV 2.5 45 51 3 Deal +6
SurveyUSA 10/30 - 11/2 591 LV 4.1 42 47 5 Deal +5
InsiderAdvantage 10/30 - 11/2 1463 LV 2.6 44 47 5 Deal +3
YouGov 10/25 - 10/31 1743 LV 3.2 41 45 1 Deal +4
NBC News/Marist 10/27 - 10/30 603 LV 4.0 43 48 3 Deal +5
WSB-TV/Landmark 10/29 - 10/29 1500 LV 2.5 46 48 4 Deal +2
SurveyUSA 10/24 - 10/27 611 LV 4.0 44 46 3 Deal +2
Atlanta Journal-Constitution 10/16 - 10/23 1170 LV 3.6 41 46 5 Deal +5
CBS News/NYT/YouGov 10/16 - 10/23 1774 LV 4.0 43 47 2 Deal +4
InsiderAdvantage 10/21 - 10/22 704 LV 3.7 44 44 5 Tie
CNN/Opinion Research 10/19 - 10/22 565 LV 4.0 48 46 6 Carter +2
WSB-TV/Landmark 10/20 - 10/21 1000 LV 2.8 45 48 5 Deal +3
SurveyUSA 10/17 - 10/20 606 LV 4.1 43 45 4 Deal +2
WRBL/Ledger-Enquirer/PMB 10/13 - 10/14 1543 LV 2.5 44 44 6 Tie

Abt SRBI | pg 7
Polling Overview
2014 Polling Trends Georgia has become less
white in the last four years. Fall 2014 polling was based on
an electorate no more diverse than in 2010, the last midterm election.
– In some 2014 polls, black voters represent an even smaller share of the electorate than in 2010.
Historically mid-term elections favor the Republican candidate in Georgia.
Georgia Secretary of State Data Georgia secretary of state
data: 2010 electorate
66.3 % white → 58% by
2014
28.2 percent black
Historically, white votersturn out at a higher rate than other voters in past midterm elections.
Abt SRBI | pg 8
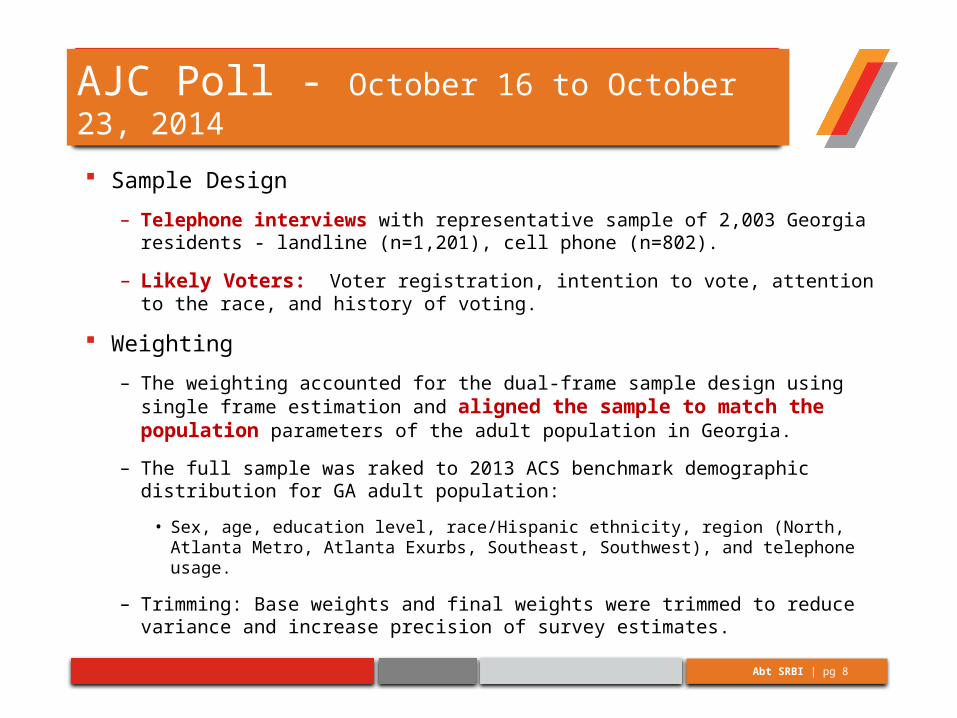
AJC Poll - October 16 to October 23, 2014
Sample Design
– Telephone interviews with representative sample of 2,003 Georgia residents - landline (n=1,201), cell phone (n=802).
– Likely Voters: Voter registration, intention to vote, attention to the race, and history of voting.
Weighting
– The weighting accounted for the dual-frame sample design using single frame estimation and aligned the sample to match the population parameters of the adult population in Georgia.
– The full sample was raked to 2013 ACS benchmark demographic distribution for GA adult population:
• Sex, age, education level, race/Hispanic ethnicity, region (North, Atlanta Metro, Atlanta Exurbs, Southeast, Southwest), and telephone usage.
– Trimming: Base weights and final weights were trimmed to reduce variance and increase precision of survey estimates.
Abt SRBI | pg 9
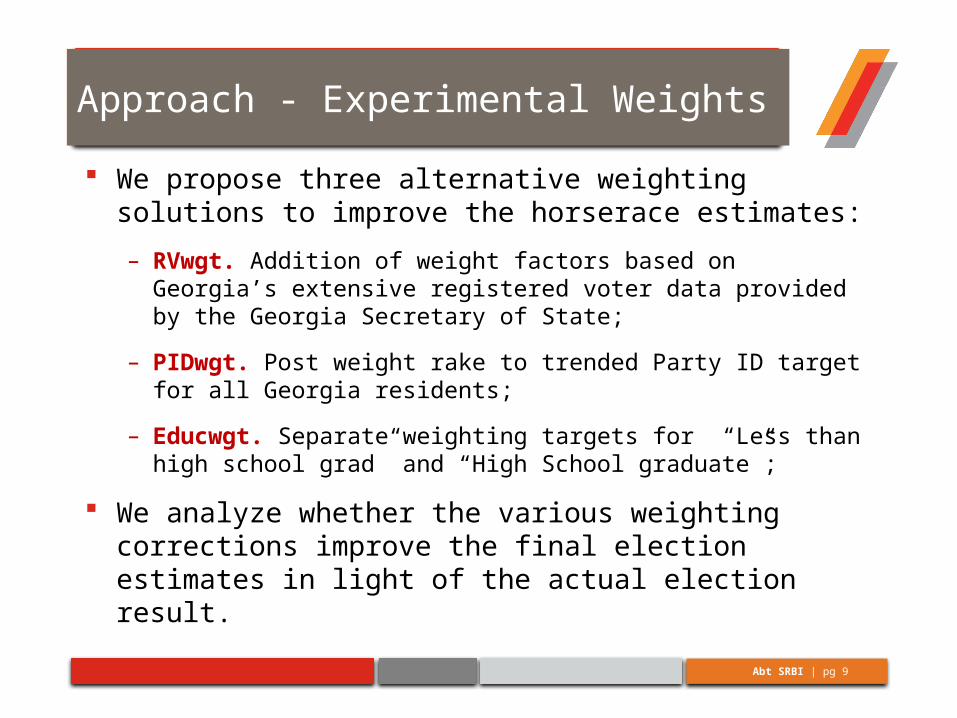
Approach - Experimental Weights
We propose three alternative weighting solutions to improve the horserace estimates:
– RVwgt. Addition of weight factors based on Georgia’s extensive registered voter data provided by the Georgia Secretary of State;
– PIDwgt. Post weight rake to trended Party ID target for all Georgia residents;
– Educwgt. Separate weighting targets for “Less than high school grad” and “High School graduate”;
We analyze whether the various weighting corrections improve the final election estimates in light of the actual election result.

Abt SRBI | pg 10
Experimental Weight 1: RVwgt
Registered Voter Weight
– Weight estimates developed from Georgia’s extensive voter history data.
– Three stage weighting process:
1. Pre-stage correction for probability of selection;
2. Balance sample demographics for all respondents on: Telephone usage (cell-only, dual-user, landline-only), education, and region (North, Atlanta Metro, Atlanta Exurbs, Southeast, Southwest);
3. Drop all Non-RV and weight only RV’s on: Race x Age and Race x Gender registered voter targets.
Abt SRBI | pg 11
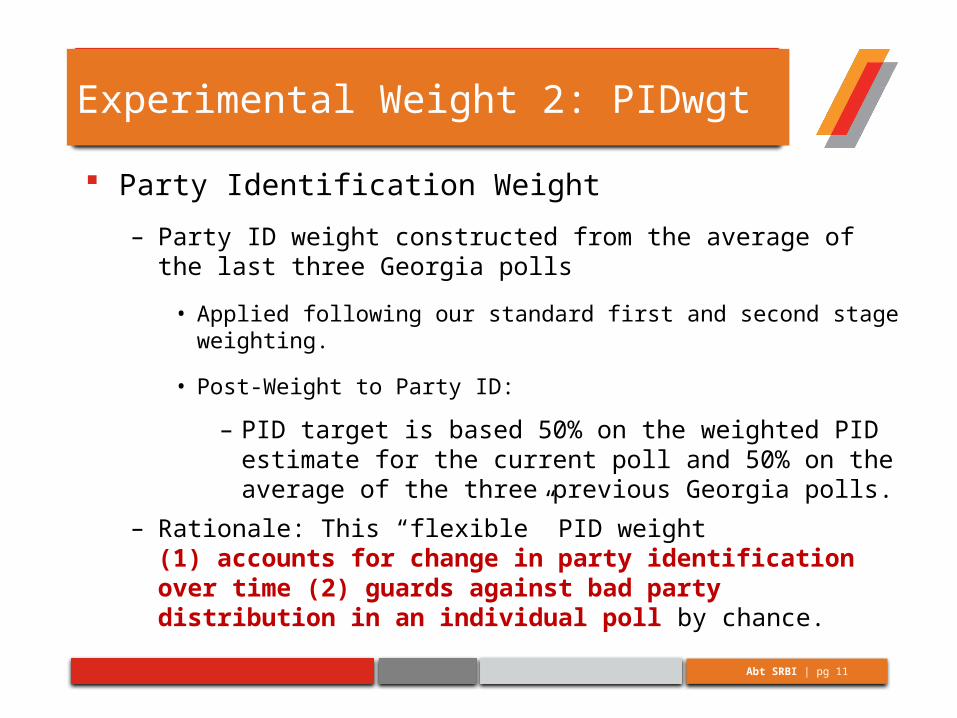
Experimental Weight 2: PIDwgt
Party Identification Weight
– Party ID weight constructed from the average of the last three Georgia polls
• Applied following our standard first and second stage weighting.
• Post-Weight to Party ID:
– PID target is based 50% on the weighted PID estimate for the current poll and 50% on the average of the three previous Georgia polls.
– Rationale: This “flexible” PID weight (1) accounts for change in party identification over time (2) guards against bad party distribution in an individual poll by chance.
Abt SRBI | pg 12
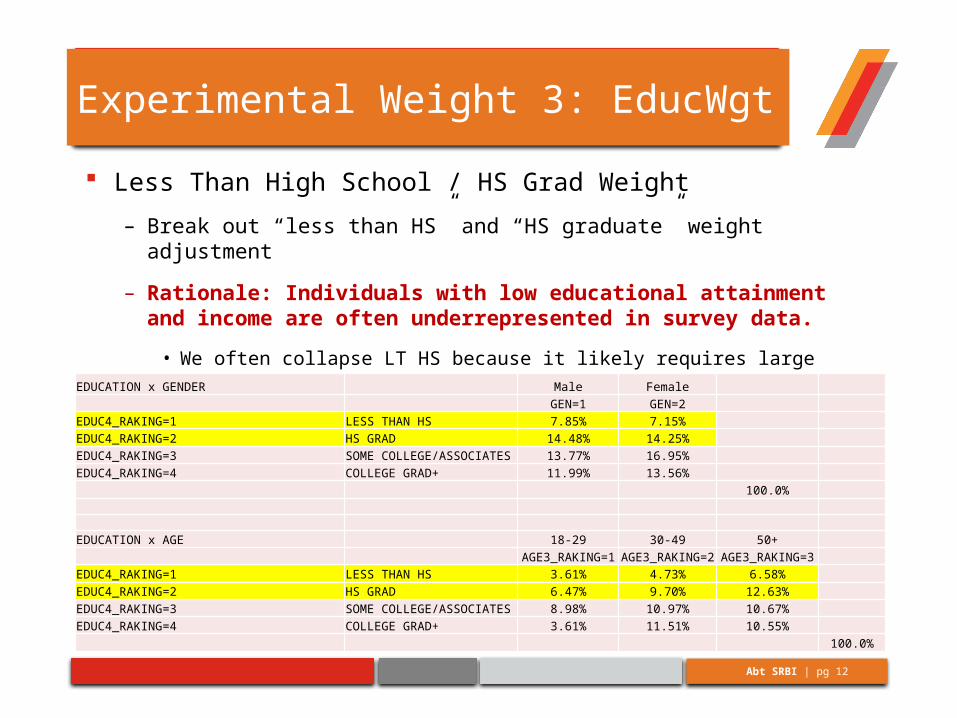
Experimental Weight 3: EducWgt
Less Than High School / HS Grad Weight
– Break out “less than HS” and “HS graduate” weight adjustment
– Rationale: Individuals with low educational attainment and income are often underrepresented in survey data.
• We often collapse LT HS because it likely requires large weights due to small base size.EDUCATION x GENDER Male Female
GEN=1 GEN=2EDUC4_RAKING=1 LESS THAN HS 7.85% 7.15%EDUC4_RAKING=2 HS GRAD 14.48% 14.25% EDUC4_RAKING=3 SOME COLLEGE/ASSOCIATES 13.77% 16.95% EDUC4_RAKING=4 COLLEGE GRAD+ 11.99% 13.56%
100.0%
EDUCATION x AGE 18-29 30-49 50+AGE3_RAKING=1 AGE3_RAKING=2 AGE3_RAKING=3
EDUC4_RAKING=1 LESS THAN HS 3.61% 4.73% 6.58%EDUC4_RAKING=2 HS GRAD 6.47% 9.70% 12.63%EDUC4_RAKING=3 SOME COLLEGE/ASSOCIATES 8.98% 10.97% 10.67%EDUC4_RAKING=4 COLLEGE GRAD+ 3.61% 11.51% 10.55%
100.0%

Abt SRBI | pg 13
Experimental Weighting - Senate
Actual Vote
Nunn (D) 45.1
Perdue (R) 53.0
Swafford (I) 1.9
Margin (R-D) 7.9
Predictive Accuracy
*Mosteller 5 (Diff in Diff)
Original Wgt
41.8
43.5
6.4
1.7
-0.12
6.20
*Mosteller 5: The (unsigned) difference of the oriented differences between predicted and actual percentage results for the top two candidates.
Abt SRBI | pg 14
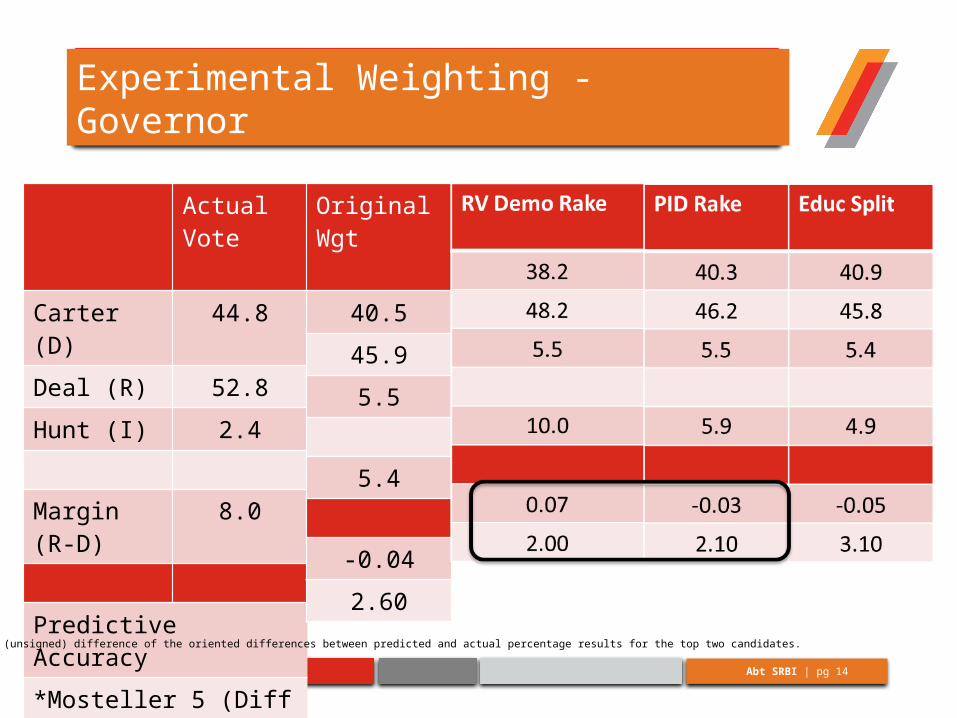
Experimental Weighting - Governor
Actual Vote
Carter (D) 44.8
Deal (R) 52.8
Hunt (I) 2.4
Margin (R-D) 8.0
Predictive Accuracy
*Mosteller 5 (Diff in Diff)
Original Wgt
40.5
45.9
5.5
5.4
-0.04
2.60
*Mosteller 5: The (unsigned) difference of the oriented differences between predicted and actual percentage results for the top two candidates.

Abt SRBI | pg 15
Recommendations
1. Registered Voter Weight
– Using state RV data can improve accuracy of pre-election poll estimates in Georgia. Enough evidence to consider an RV weight for mid-term elections.
– Limitations: may vary race to race; not all states collect and provide extensive registered voter demographic data.
2. Party Identification Weight
– Evidence of small beneficial effect from inclusion of Party ID weight in raking.
– Limitations: uncertainty about how this generalizes to other races in other states; requires recent polling to maintain accurate PID targets.
Less Than High School WeightDo not recommend separating LT HS from HS grad in the weighting procedure

16

17
Natalie JacksonData Scientist
Huffington Post Pollster
Natalie focuses on survey methods controversies, data
quality, and election forecasting
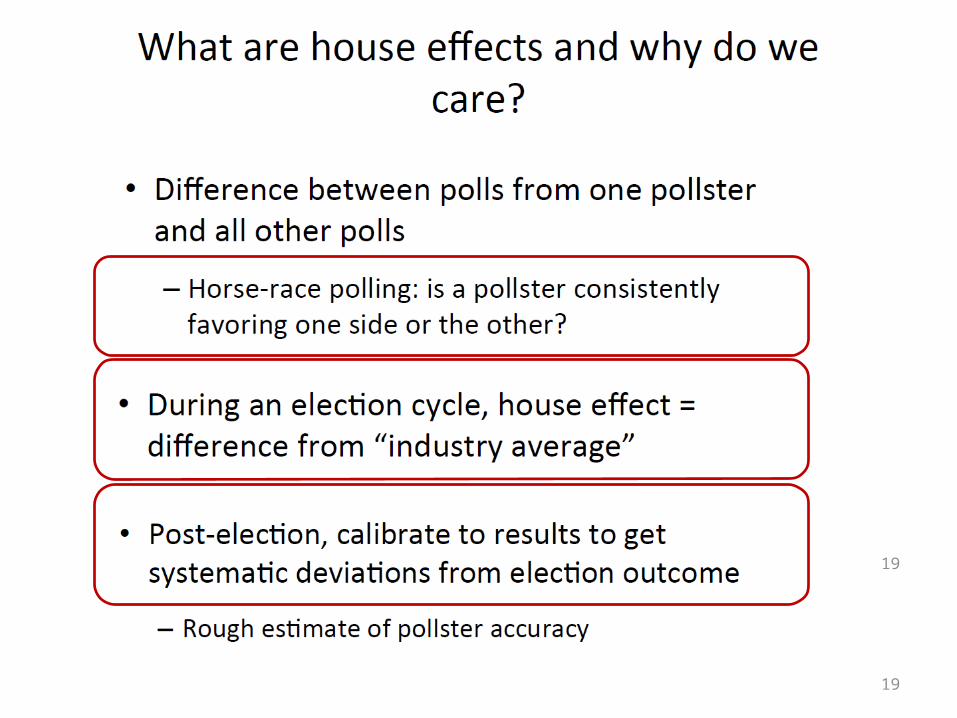
Explaining House Effects in 2014 Pre-Election Polls
What factors bias a pollster to favor one side or the other
Why is this stronger in some firms over other
Why some states are easier to poll than others

18
19
19
20
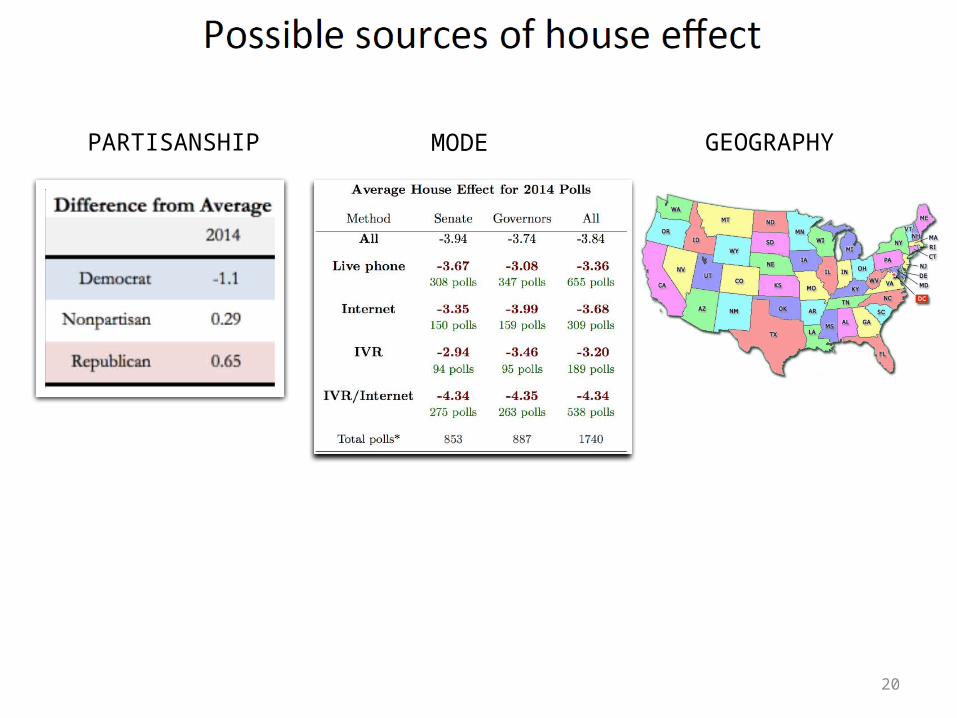
PARTISANSHIP MODE GEOGRAPHY

21

22
GEO & MODE
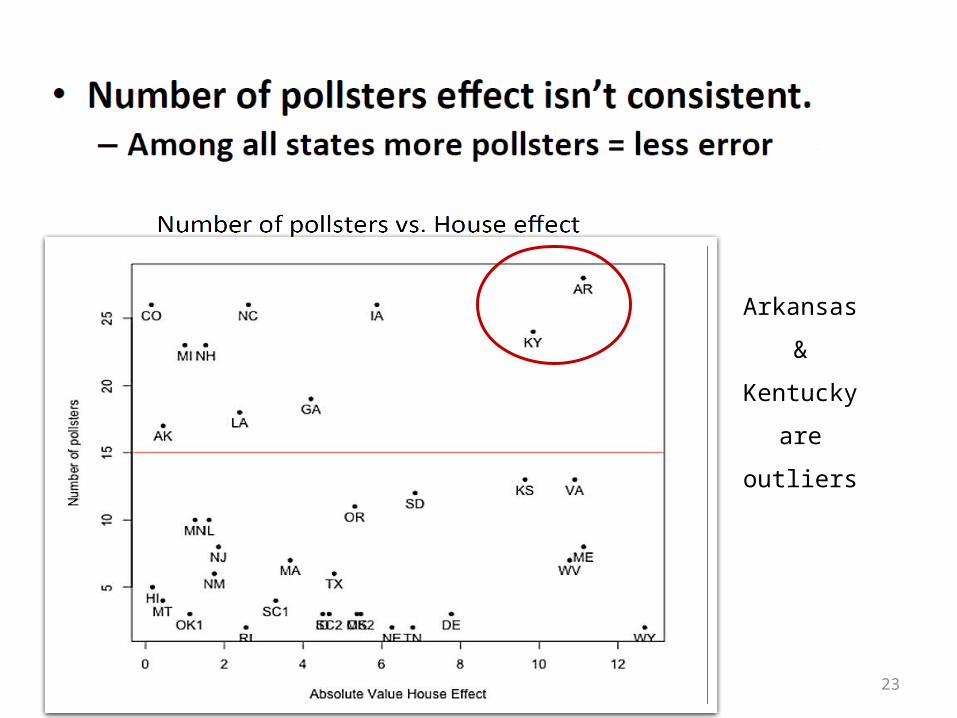
23
Arkansas
&
Kentucky
are outliers

Conclusions• Where you’re polling seems to drive error-corrected house effect
– Common sense in a midterm year. What happens in Presidential cycles•
• Can’t explain much variance with anything besides geography
– Hard to really say what differences between pollsters contribute most to errors and house effects
– So do these measures really tell us anything useful about the pollsters?[DK, more research needed!]
• What would help explain variance in house effect and rate pollsters? – A common theme: look beyond the toplines
– Transparency: provide detailed methods and crosstabs
EVALUATING POLLING ACCURACY
What Happened in North Carolina?
Brian McDonald and Martin J. KiferHPU Survey Research Center
Saturday, May 16, 2015
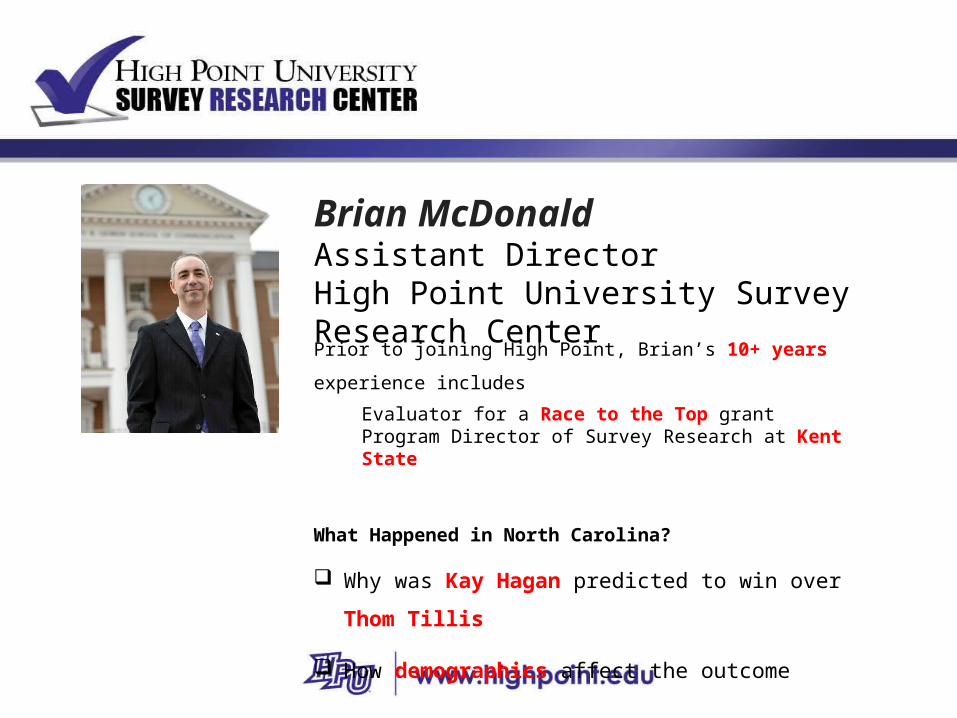
Brian McDonaldAssistant DirectorHigh Point University Survey Research Center
Prior to joining High Point, Brian’s 10+ years experience includes
Evaluator for a Race to the Top grantProgram Director of Survey Research at Kent State
What Happened in North Carolina?
Why was Kay Hagan predicted to win over Thom Tillis
How demographics affect the outcome

APPROACH
• Chose RBS for fall 2014: Encouraged by Morin (2003), Gerber and Green (2006), Shipman and Leve (2006), Mitofsky, et al (2005)
• Three polls: Sept 13 – 18 and Sept 30 – Oct 9 (live interviewer), Oct 21 – 25 (IVR, with SurveyUSA)
• Telephone Interviews: SRC specs- 42 stations, 6 days a week (Sat – Thurs), Sawtooth Wincati dialing Cisco VOIP phones

APPROACHPoll (Dates) Mode Sample (Re)Screen Sample size
(MoE)Weighting
HPU Poll 31 (9/13 – 9/18)
Live interviewer
RBS (2010 voters, 2012 voters registered after 2010, registered after 2012)
LVs were “certain” or “probably” voters in November
410 LVs (approx. 5 percent)
Race, gender, age (based on 2010 voting statistics)
HPU Poll 32 (9/30 – 10/9)
Live interviewer
RBS (2010 voters, 2012 voters registered after 2010, registered after 2012)
LVs were “certain” or “probably” voters in November
584 (approx. 4.1 percent)
Race, gender, age (based on 2010 voting statistics)
HPU Poll/Survey USA (10/21 – 10/25)
IVR plus live interviewer for cell phones
RBS (2010 voters, 2012 voters registered after 2010, registered after 2012)
Had voted or “will vote”
802 (approx. 3.3 percent)
Race, age, gender, ethnic origin or region

Poll (Dates) Horserace (Hagan –
Tillis)
Race gaps (Hagan – Tillis)
Gender gaps Party ID gaps Ideology gaps
Black White Male Female D R I C M L
HPU Poll 31 (9/13 – 9/18)
2 83 -25 -6 7 84 -77 4 -55 33 88
HPU Poll 32 (9/30 – 10/9)
-1 58 -20 -6 0 75 -77 4 -55 33 88
HPU Poll/Survey USA (10/21 – 10/25)
0 78 -23 -13 10 73 -75 -3 -66 43 76
Exit Poll -1 (real result)
93 -29 -15 12 83 -87 -7 -66 23 83
Average (after 10/20, public xtabs)
1.8 (approx. 2)
78 -22 -7 10 74 -79 -2 -57 30 77
OUTCOME – KEY FINDINGS
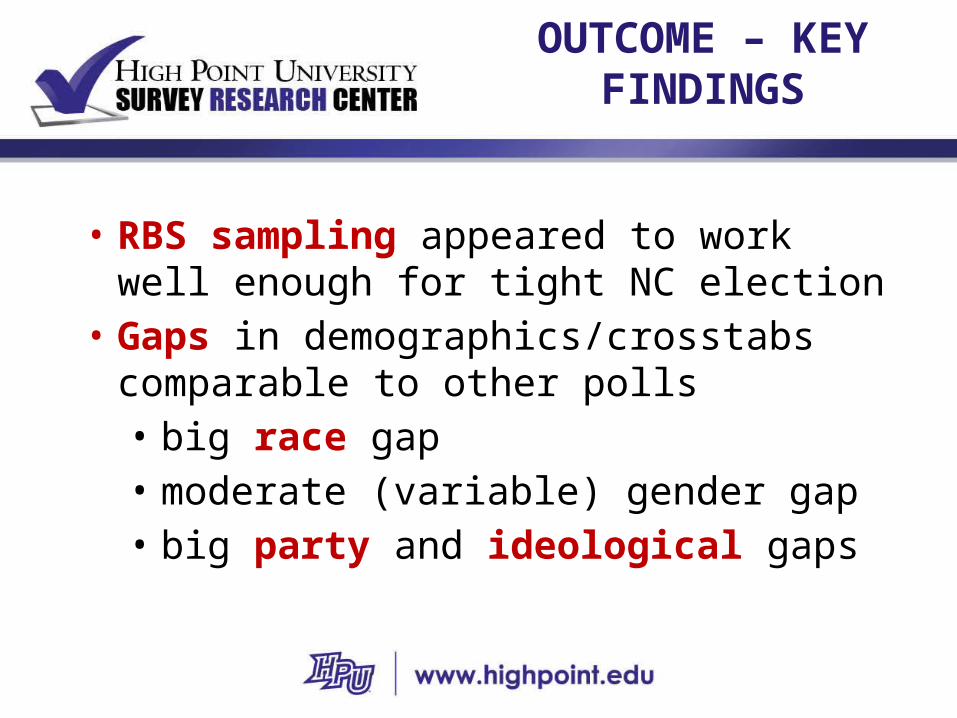
OUTCOME – KEY FINDINGS
• RBS sampling appeared to work well enough for tight NC election
• Gaps in demographics/crosstabs comparable to other polls • big race gap• moderate (variable) gender gap• big party and ideological gaps
Judging the accuracy of public opinion polls in referendums
Presentation at the 2015 AAPOR meeting -- Hollywood, FLby Thomas R. Marshall
The University of Texas at Arlington – [email protected]
31

32
Thomas MarshallProfessor of Political ScienceUniversity of Texas at Arlington
Thomas teaches classes on public opinion, campaigns and elections
• Focuses how public opinion drives public policy
• Writing a book on US public opinion & smoking policy
Judging The Accuracy of Public Opinion Polls in Referendums
Studied elections where there was a tobacco-related issue
Effect of question wording and question order on results

5 types of poll questions1. “uninformed” heads-up (baseline or tracking polls) – early
in the survey, briefly describes the ballot issue and then asks favor/oppose
2. The “strongly/somewhat favor/oppose” uninformed heads-up
3. “ballot format” heads-up (baseline or tracking) – early in the survey reads the actual ballot wording or a close paraphrasing and then asks favor/oppose
4. “informed” heads-up -- near the end of the survey following several push-format questions, and then asks favor/oppose
5. Post-election “uninformed” heads-up 33

Does a “strongly” favor/oppose question improve accuracy? No.
• Sometimes an uninformed heads-up also asks whether a favor/oppose opinion is “strongly” held.
• This format doesn’t improve accuracy. Average error for favor/oppose (only) format = 7.5%. Average error for the “strongly” format is 11% (both cf. to the tobacco control vote percentages). – For the favor/oppose format, errors usually overestimate the election-day results– For the “strongly” format the errors are usually underestimates.
• Simply averaging the two figures reduces the average error to 6.3% with a normal distribution of under- and over-estimates of the election day figures for the tobacco control side….
• This finding is not affected by the type of election (tax versus public smoking), days out, or cash spending ratio.
34

Does a “ballot format” question reduce the error in pre-election “uninformed”
heads-up? No.• Occasionally a pollster asked the short “uninformed” heads-
up immediately followed by a follow-up question with the actual (or slightly paraphrased) ballot wording, then asked a “ballot format” heads-up question.
• 9% average shift (for tobacco control)from the “uninformed” to the “ballot format” question … (with an average increase of 7% for the pro-tobacco control side)
• but … the “ballot format” question actually performs 2.4% worse than the “uninformed” question – that is, a 7.6% average error to the election results versus 5.2% for uninformed heads-up (again for the tobacco control side) 35
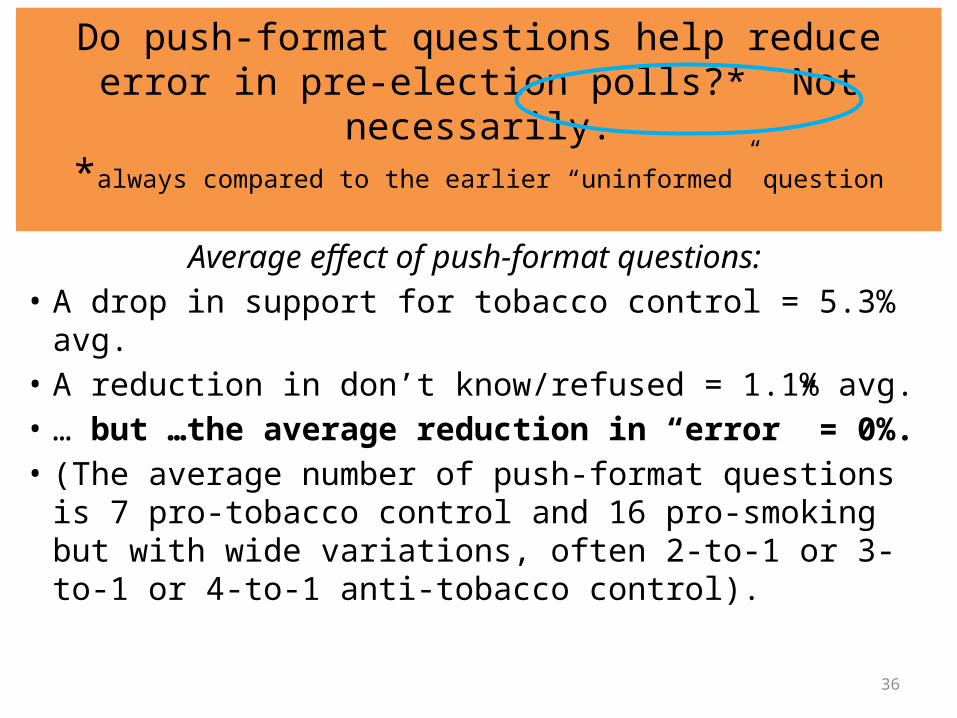
Do push-format questions help reduce error in pre-election polls?* Not necessarily.
*always compared to the earlier “uninformed” question
Average effect of push-format questions:• A drop in support for tobacco control = 5.3% avg.• A reduction in don’t know/refused = 1.1% avg.• … but …the average reduction in “error” = 0%.• (The average number of push-format questions is 7
pro-tobacco control and 16 pro-smoking but with wide variations, often 2-to-1 or 3-to-1 or 4-to-1 anti-tobacco control).
36

More on push-format questions …
• Push-format questions almost always reduce the pro-tobacco control percentage except if there are very few push format questions or if there are about the same number of pro and con questions.
• Generally, when the ratio of anti-to-pro tobacco control questions exceeds two-to-one, the forecasting accuracy does not improve. – A push-format question ratio of 1-to-1 or 2-to-1 improves
forecasting accuracy. – However, there is a wide variation in the patterns.
37
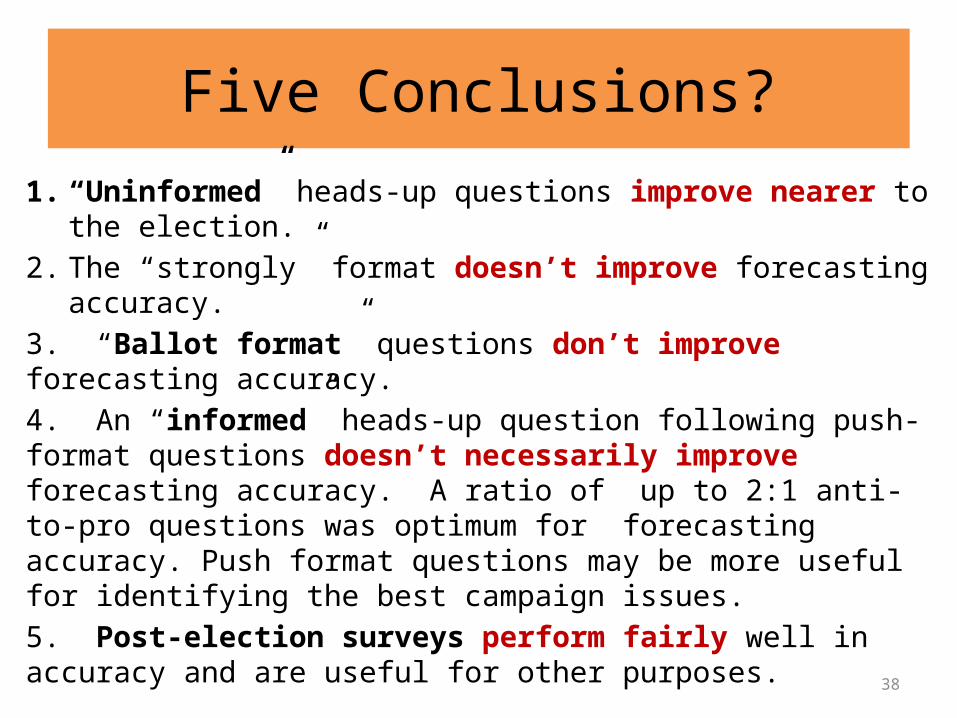
Five Conclusions?
1. “Uninformed” heads-up questions improve nearer to the election.
2. The “strongly” format doesn’t improve forecasting accuracy.3. “Ballot format” questions don’t improve forecasting accuracy.4. An “informed” heads-up question following push-format questions doesn’t necessarily improve forecasting accuracy. A ratio of up to 2:1 anti-to-pro questions was optimum for forecasting accuracy. Push format questions may be more useful for identifying the best campaign issues.5. Post-election surveys perform fairly well in accuracy and are useful for other purposes.
38

AAPOR Annual Conference 2015 39
40
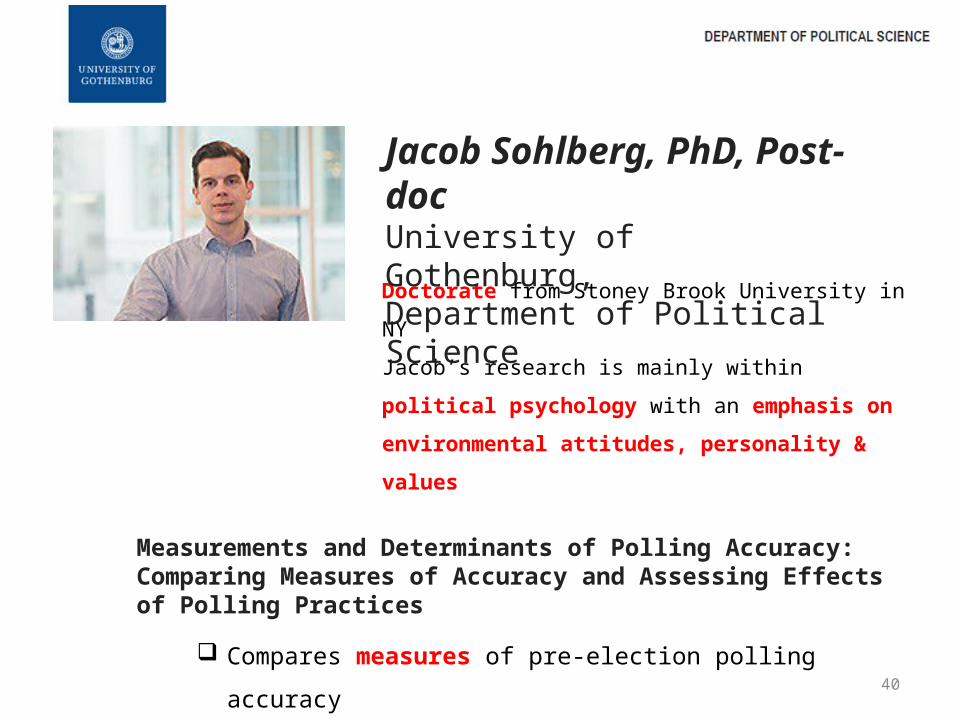
Doctorate from Stoney Brook University in NY
Jacob’s research is mainly within political psychology with an
emphasis on environmental attitudes, personality & values
Measurements and Determinants of Polling Accuracy: Comparing Measures of Accuracy and Assessing Effects of Polling Practices
Compares measures of pre-election polling accuracy
Examines factors that influence accuracy.
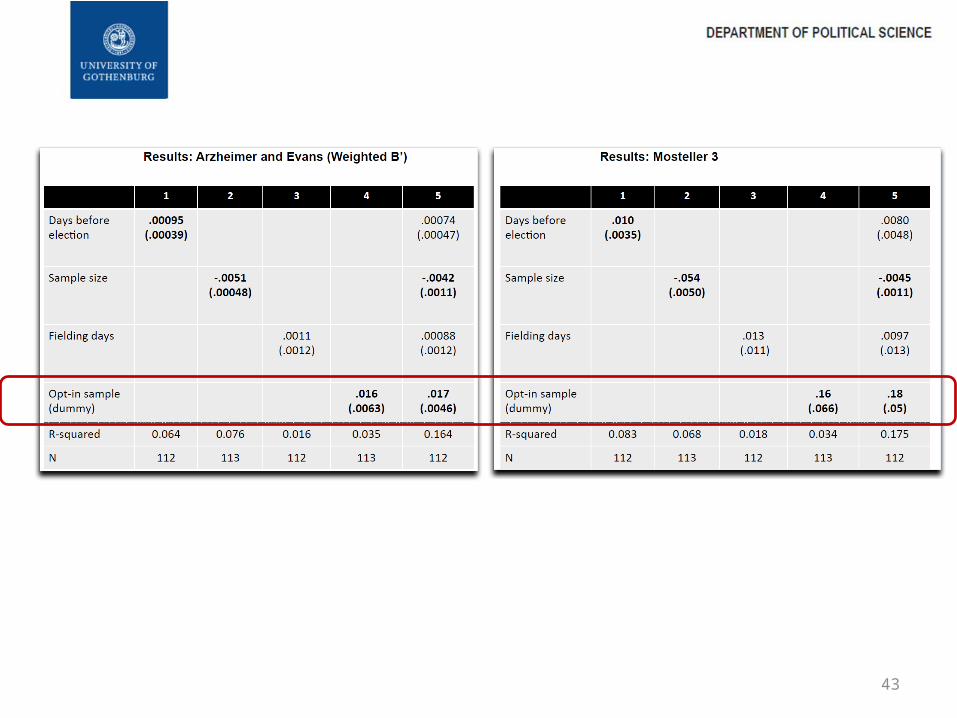
Explores opt-in versus random sampling
Jacob Sohlberg, PhD, Post-docUniversity of Gothenburg, Department of Political Science

41

42
43
44
May 16, 2015
Evaluation of MethodsFor Polling Third Party
Candidates
Joe Lenski

Joe LenskiCo-founder and Executive VP of Edison ResearchEdison Research currently conducts all exit polls for the six major news organizations comprising the National Election Pool (NEP) - ABC, CBS, CNN, Fox, NBC and the Associated Press.
Evaluation of Methods for Polling Third-Party
Candidates
Studied pre-election polls
Should 3rd party candidates be included in the poll?
Is it better to have all of them or just the top few?
How best to word the question
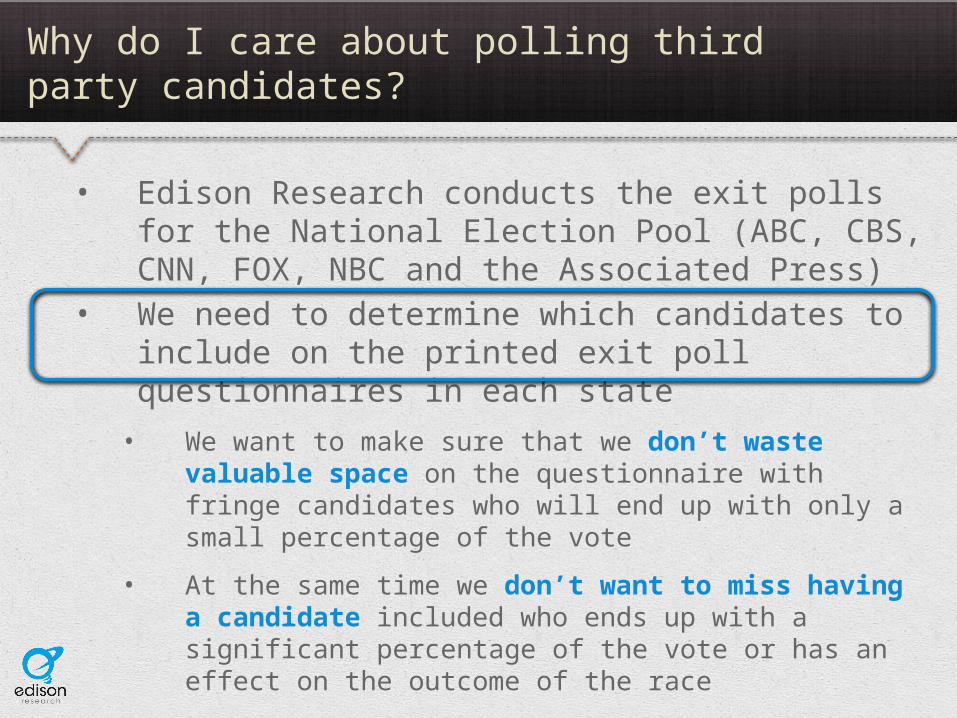
Why do I care about polling third party candidates?
• Edison Research conducts the exit polls for the National Election Pool (ABC, CBS, CNN, FOX, NBC and the Associated Press)
• We need to determine which candidates to include on the printed exit poll questionnaires in each state
• We want to make sure that we don’t waste valuable space on the questionnaire with fringe candidates who will end up with only a small percentage of the vote
• At the same time we don’t want to miss having a candidate included who ends up with a significant percentage of the vote or has an effect on the outcome of the race
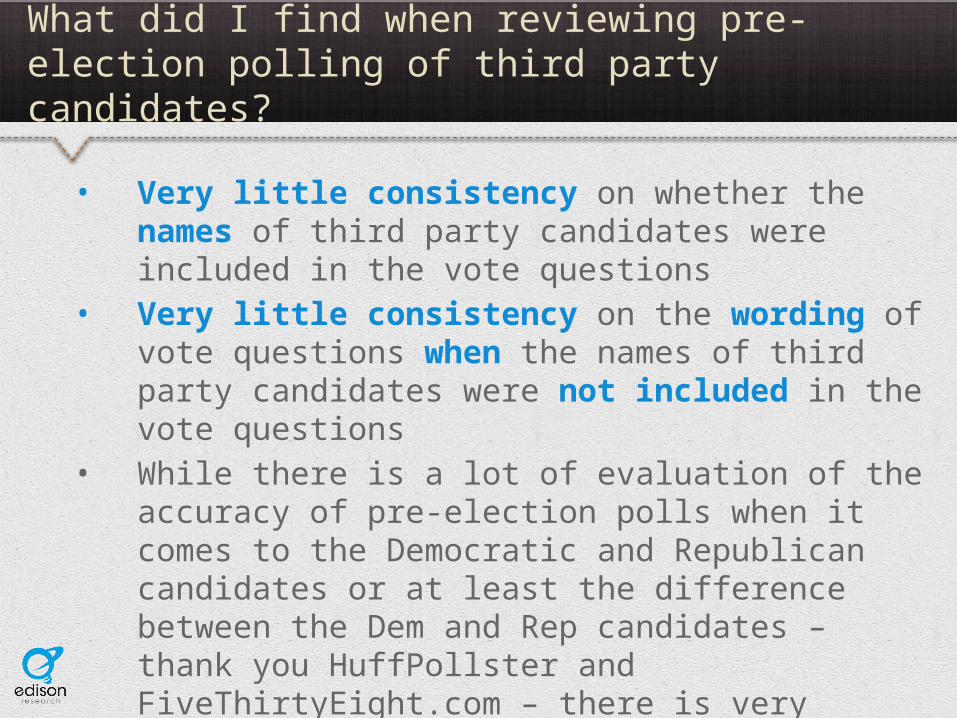
What did I find when reviewing pre-election polling of third party candidates?
• Very little consistency on whether the names of third party candidates were included in the vote questions
• Very little consistency on the wording of vote questions when the names of third party candidates were not included in the vote questions
• While there is a lot of evaluation of the accuracy of pre-election polls when it comes to the Democratic and Republican candidates or at least the difference between the Dem and Rep candidates – thank you HuffPollster and FiveThirtyEight.com – there is very little evaluation of the accuracy of pre-election polling of third party candidates

So overall how accurate was the pre-election polling reported for third party candidates?
• The overall accuracy is not bad but there is an overall tendency for pre-election polls to overstate third party candidates
• Mean directional error +0.5• Median directional error +0.3• Mean absolute error 2.1• Median absolute error 1.3• 56% overstated third party candidate• 41% understated third party candidate
• However, there are some patterns of systematic bias hidden within this data
• Note that mean average vote percentages for candidates measure was 3.5%; median was 3.1%.

Using the candidate names makes a difference
Candidate Names N Error Abs Error Over Under
Listed 942 +1.3 1.9 70% 27%Not listed 518 -1.0 2.5 31% 68%
• When the third party candidates are named in the vote question, pre-election polls tend to overestimate the vote for the third party candidates
• When the third party candidates are not named and “other” or “someone else” is used, polls tend to underestimate the vote for the third party candidates

And if a polls names third party candidates it should name all of them
Candidate Names N Error Abs Error Over Under
All listed 757 +1.1 1.7 68% 27%Only some listed 185 +2.0 3.0 78% 22%
• The pre-election polls that listed all of the third party candidates were more accurate than those that only listed some of the third party candidates
• It seems that only giving one third party candidate option when there are multiple third party candidates on the ballot inflates the numbers for the third party candidate named

Even within a polling organization, using the candidate names makes a difference
Candidate Names N Error Abs Error Over Under
Listed 28 +1.4 1.5 79% 7%Not listed 16 -2.7 2.7 0% 100%
• For example, using all 44 data points the Marist polls had a small average error on third party candidates
• However, when candidates were listed the Marist polls overestimated the third party candidates, and when the candidates were not listed the Marist polls underestimated the overall third party vote
• This pattern was also true with other polling organizations including Quinnipiac and SurveyUSA but for some reason not with the Fox News polls

Summary of Findings
• Pre-election polling for third party candidates• Overestimates the vote for third party candidates when those
candidates are named • Underestimates the total vote for third party candidates when
the candidates are not named in the survey and “other” or “someone else” is used instead
• Accuracy is better when all third party candidates are listed instead of only some of the third party candidates
• The differences in overstating or understating support for third party candidates for the most part hold even within the same polling organizations – although there are some exceptions

Recommendations for using pre-election polls for estimating vote for third party candidates
• My recommendation to aggregators is to aggregate• First, average the polls which list the third party
candidates• Second, average the “other” for polls which do not
list the third party candidates• Third, average the two averages
Race Averages N Error Abs Error Over Under
Candidates listed 94 +1.0 1.5 80% 20%Candidates not listed 59 -1.2 2.0 27% 71%

Recommendations for polling organizations for dealing with third party candidates
• Acknowledge that asking about vote for third party candidates
• Will usually inflate the third party candidates when the names are listed
• Asking about third party vote when candidates are not listed will usually understate the total third party vote
• Experiment with asking the vote questions both ways and averaging the results either by
• asking the entire sample both questions (listing and not listing the third party candidates)
• or by split-sampling and asking one-half of the sample each of the two vote questions

Polling Accuracy
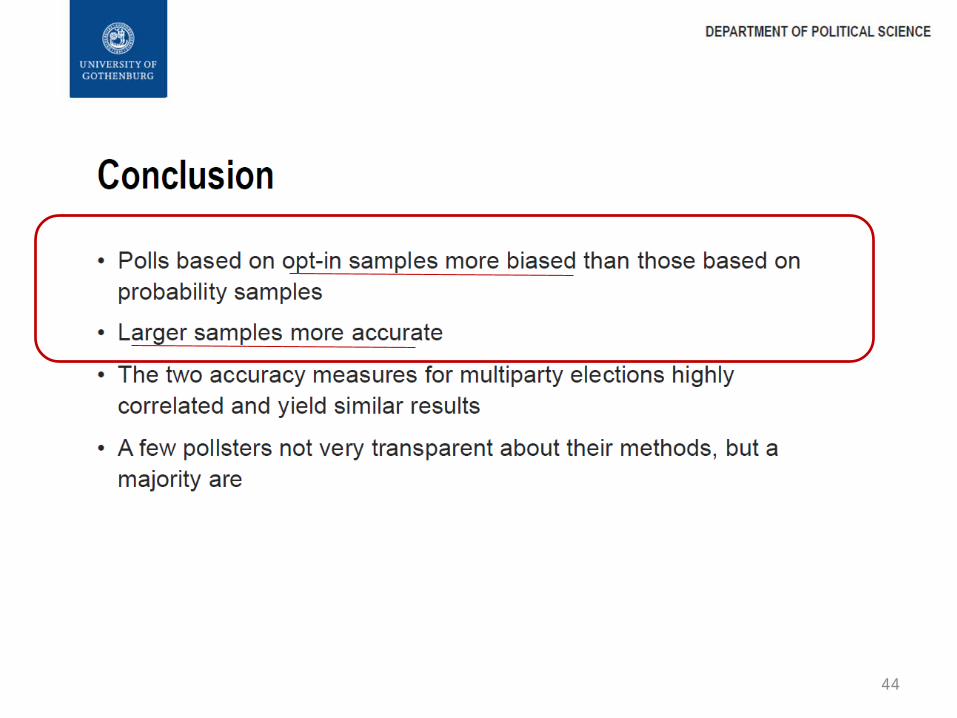
Sample RBB similar to RDD; opt-in sample introduces bias Registered Voter weighting improves accuracy Demographics matter
Poll Design Question Wording -- Little impact Third Party Candidates – significant effect
Include all names for greater accuracy
Pollster Bias?

Mary [email protected]