papor mini conference
TRANSCRIPT
PAPOR Mini ConferenceRace to Understand America: the Minority Experience and
Politics
Cailey Muñana
Special thanks to: Tresa Undem, Shakari Bylery, Keith Neuman, Hannah
Fingerhut, and Jocelyn Kiley for sharing their research
June 29, 2018

The Lives and Voices of Black America
On Politics, Race, and Policy.
Tresa Undem, PerryUndem
Shakari, Byerly, UCLA Department of Political Science, Ford Foundation Fellow
73rd Annual Meeting, American Association for Public Opinion Research
Denver, Colorado - May 18, 2018

What we know about Black public opinion and
political behavior:
• Long-recognized as having distinctively high rates of political participation, civic
engagement, and political consensus, independent of socio-economic status (Nagler and
Leighley 2013; Verba and Nie 1972)
• Data is limited, as surveys of the general population do not often include a sufficient
number of interviews to provide statistically reliable data
• Often “speak with one voice” due to persistent structural and racialized inequalities,
alongside high levels of perceived “linked fate” (Cohen and Dawson 1993; Dawson1994)
• Their collective voice is often flattened and discounted by political stakeholders and
media as being uninteresting or inconsequential
• Coverage that exists is often episodic, following civil unrest, or “backward-looking” in
the wake of major political upsets
2

Methods.
N = 1,003 Black adults 18 and older
July 18 to August 7, 2017
NORC’s AmeriSpeak panel
Margin of sampling error: + 4.2 percentage points
30-minute questionnaire
3

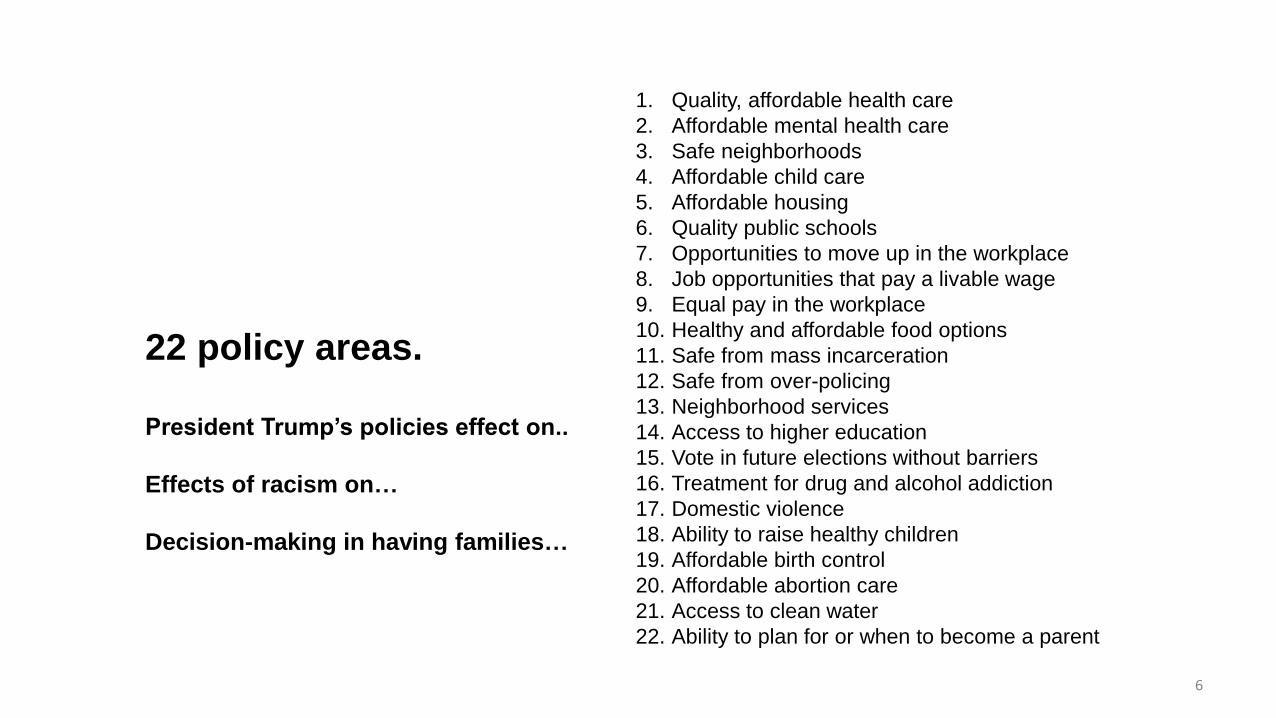
We explored…
• Perceptions of the current political environment
• Views on 22 policy issue areas as they relate to President Trump, racism, and Black families
• Experiences around families, children, and decision-making
• Sexual pressure, force, and violence
4
6
1. Quality, affordable health care
2. Affordable mental health care
3. Safe neighborhoods
4. Affordable child care
5. Affordable housing
6. Quality public schools
7. Opportunities to move up in the workplace
8. Job opportunities that pay a livable wage
9. Equal pay in the workplace
10. Healthy and affordable food options
11. Safe from mass incarceration
12. Safe from over-policing
13. Neighborhood services
14. Access to higher education
15. Vote in future elections without barriers
16. Treatment for drug and alcohol addiction
17. Domestic violence
18. Ability to raise healthy children
19. Affordable birth control
20. Affordable abortion care
21. Access to clean water
22. Ability to plan for or when to become a parent
22 policy areas.
President Trump’s policies effect on..
Effects of racism on…
Decision-making in having families…

affects the Black community’s ability to…
RACISMDo you think
% Yes
74% Have access to quality,
affordable health care
73% Have access to affordable
housing
73% Have access to quality
public schools
73% Keep children safe from
mass incarceration
80% Have equal opportunities
to move up in the
workplace
78% Have job opportunities that
pay a livable wage
76% Have equal pay in the
workplace
78% Feel safe in our
neighborhoods
74% Have access to higher
education
7

“Think about the systems in our society, such as school systems,
health care, housing, food, banking and the government.
In general, do you think these systems are set up to: give White
people more opportunities than Black people, give Black people
more opportunities than White people, or give Black and White
people equal opportunities?”
Set up to give White people more opportunities than
Black people67%
Set up for equal opportunities
30%
Set up to give Black people more opportunities
2%
Most see inequities at the core
of systems in our society.
Do you think systems in our society are…
College educated (81%)
14

35%Has had to boil
water at home
before
drinking it
35%Has had brown
water come out
of the taps at
home
55%YES TO ANY
29%Has had water
that smelled
unsafe from the
taps at home
1 in 3 Black adults has had
brown water come out of
their taps at home.
50% Say having access to
clean water has been a
factor in deciding to
become a parent.
8

44% Have been pressured
to have sex when they
did not want to
40% Have felt pressure to
take part in a sexual
act before they were
ready
39% Have the feeling, at
least once in awhile,
that other people feel
entitled to their body
32% Say someone had sex
with them without their
permission or consent
26% Were made to have
sex without a condom
when they did not
want to
21% Were made to have
oral or anal sex when
they did not want to
% of Black mothers of children under 18Base n = 224
64% have faced at least one of the above situations.
59% have faced sexual pressure or force.
9
Lack of
safety and
control over
their bodies
in the era of
#MeToo.

% of Black mothers of children
under 18Base n = 224
19
Say a woman’s ability to control whether and when
she has children is important for her and her
family’s financial security (79% very important)92%
Feel the President’s policies will have a negative
effect on the Black community’s ability to access
birth control
73%
Feel the President’s policies will have a negative
effect on the Black community’s ability to access
abortion care
72%
Feel it is “extremely” important to improve access to
affordable health care in order to make it a better
time to be a Black woman free to raise healthy
children if she chooses
70%
Could afford $10 or less for birth control46%

63% Having access to quality,
affordable health care
62% Having access to
affordable housing
64% Having access to quality
public schools
72% Having job opportunities
that pay a livable wage
65% The safety of your
neighborhood
67% Having access to higher
education
69% The amount of money in
your savings
63% Having equal opportunities
to move up in the
workplace
63% Being married
At any time in the past, have any of these things
been part of your thinking or decision-making
about whether or not to have a child?
% Yes
Black adults have weighed many
factors in deciding whether or
not to have a child.
11
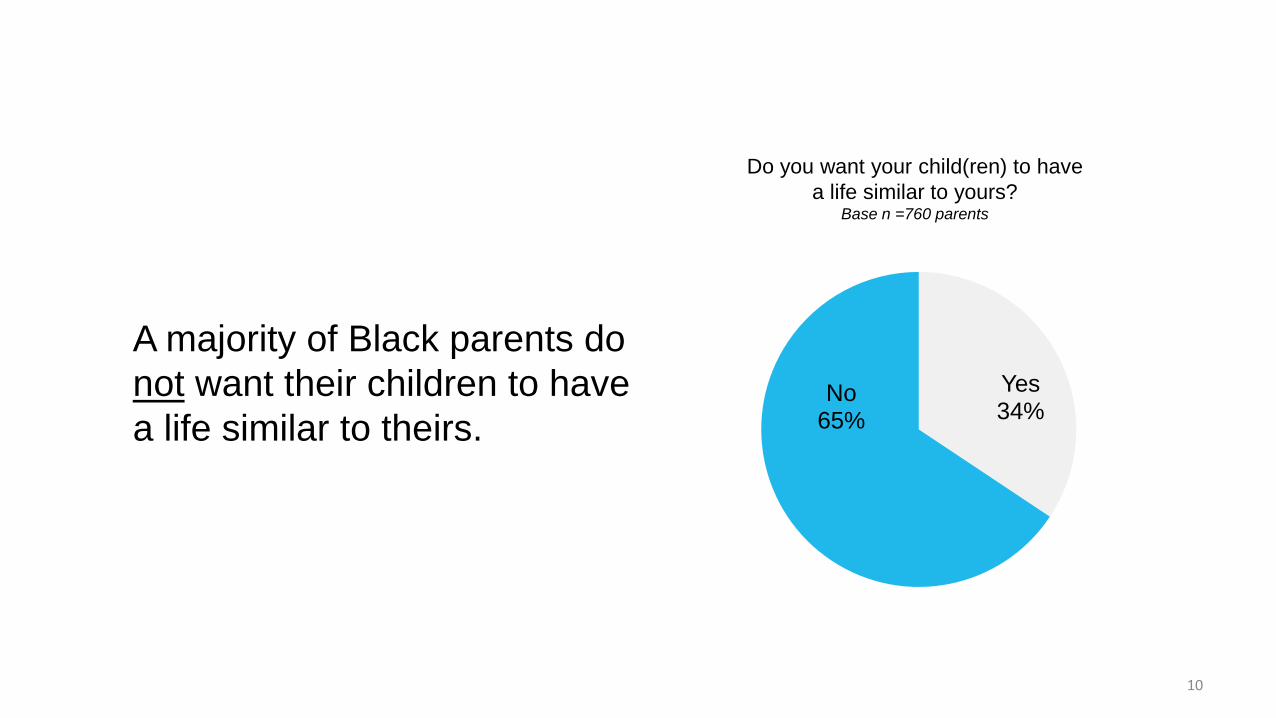
Yes34%
No65%
Do you want your child(ren) to have
a life similar to yours? Base n =760 parents
A majority of Black parents do
not want their children to have
a life similar to theirs.
10
Conclusions.
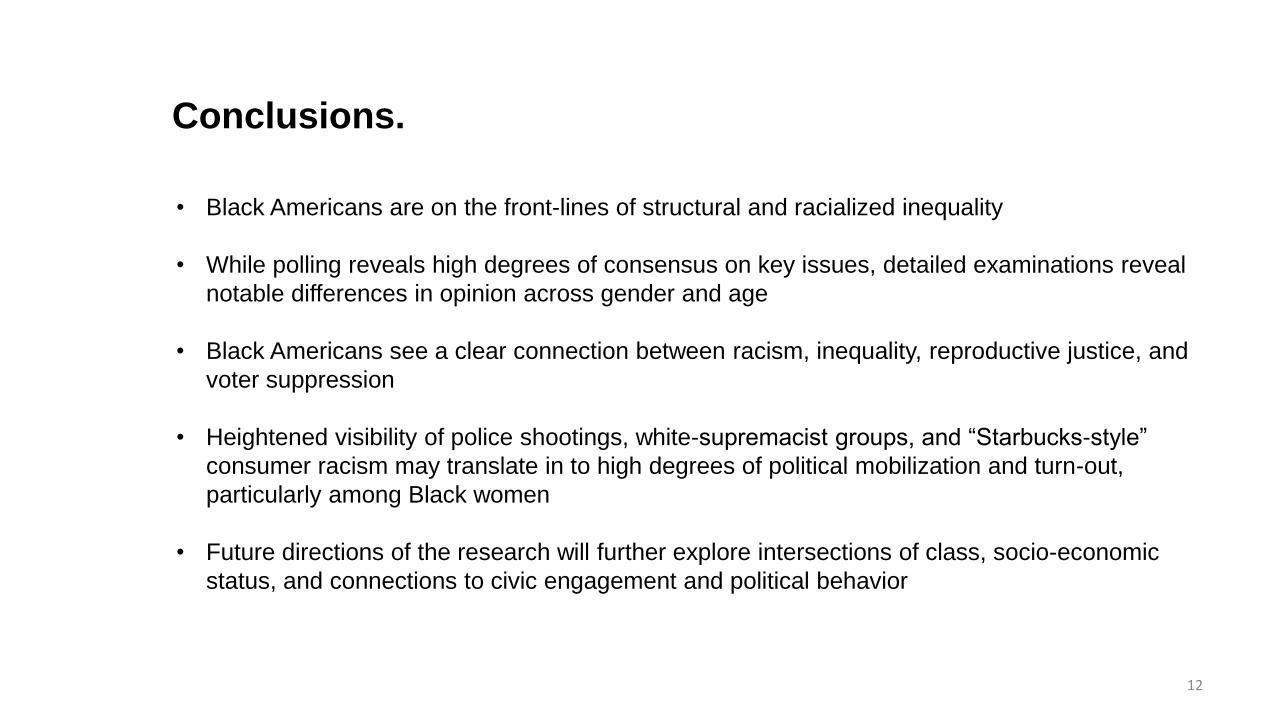
• Black Americans are on the front-lines of structural and racialized inequality
• While polling reveals high degrees of consensus on key issues, detailed examinations reveal
notable differences in opinion across gender and age
• Black Americans see a clear connection between racism, inequality, reproductive justice, and
voter suppression
• Heightened visibility of police shootings, white-supremacist groups, and “Starbucks-style”
consumer racism may translate in to high degrees of political mobilization and turn-out,
particularly among Black women
• Future directions of the research will further explore intersections of class, socio-economic
status, and connections to civic engagement and political behavior
12

Master Deck
Making a difference through community-based research: The Black Experience Project
American Association of Public Opinion Research
73rd Annual Conference
May 18, 2018
Keith Neuman
Environics Institute for Survey Research
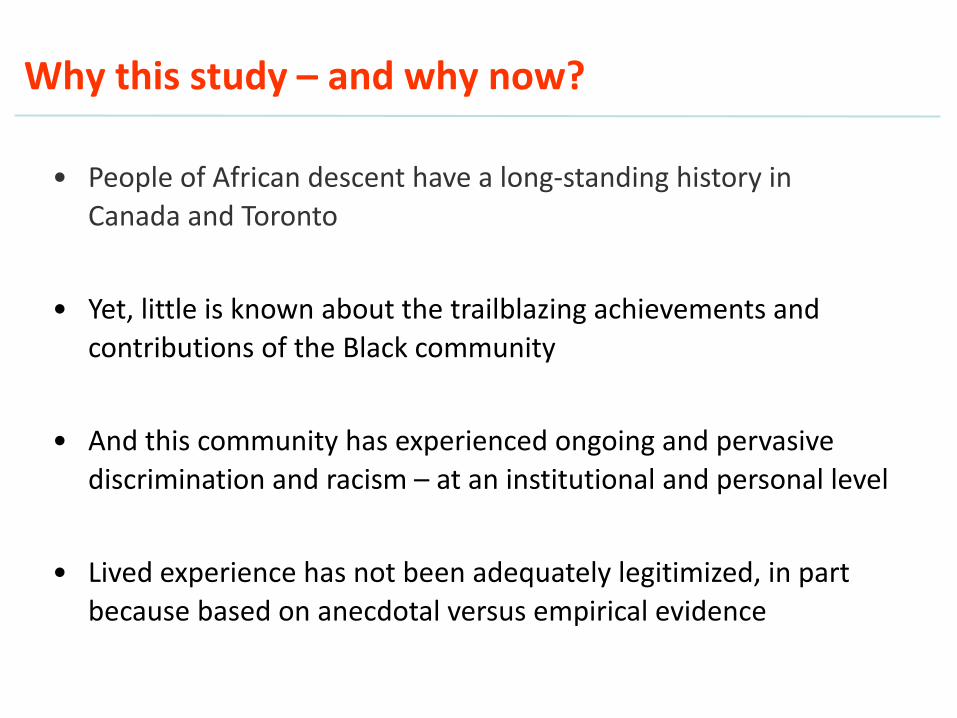
Why this study – and why now?
• People of African descent have a long-standing history in
Canada and Toronto
• Yet, little is known about the trailblazing achievements and
contributions of the Black community
• And this community has experienced ongoing and pervasive
discrimination and racism – at an institutional and personal level
• Lived experience has not been adequately legitimized, in part
because based on anecdotal versus empirical evidence

Survey implementation
• Target population: GTA residents who self-identify as Black or of African heritage
• Sample set to match GTA Black population to extent possible – based on region, age, gender, household income, and ethnic identification
• Recruitment of survey participants using quota sampling methods – extensive outreach across GTA through events, media, word-of-mouth
• In-person interviews conducted by people from the Black community – mostly youth
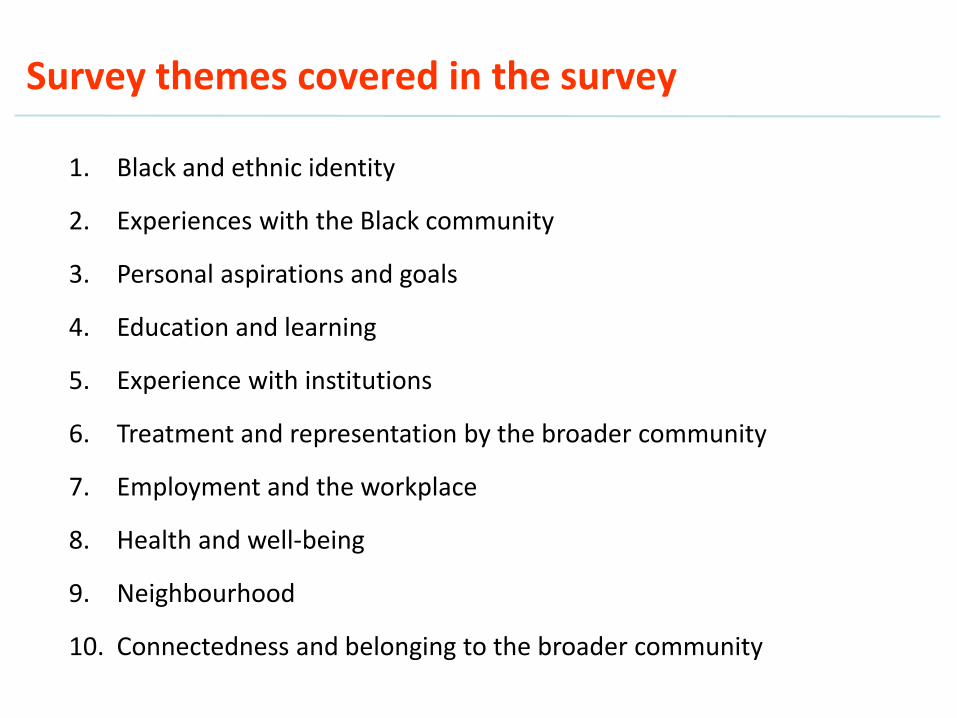
Survey themes covered in the survey
1. Black and ethnic identity
2. Experiences with the Black community
3. Personal aspirations and goals
4. Education and learning
5. Experience with institutions
6. Treatment and representation by the broader community
7. Employment and the workplace
8. Health and well-being
9. Neighbourhood
10. Connectedness and belonging to the broader community

1. Community strength & engagement
To what extent are people involved in their
communities?
What are seen as the strengths of the Black
community, and its contributions to the GTA?

Individuals define the strength of their community in terms of its perseverance in the face of adversity
Strengths of the GTA Black community (unprompted responses)
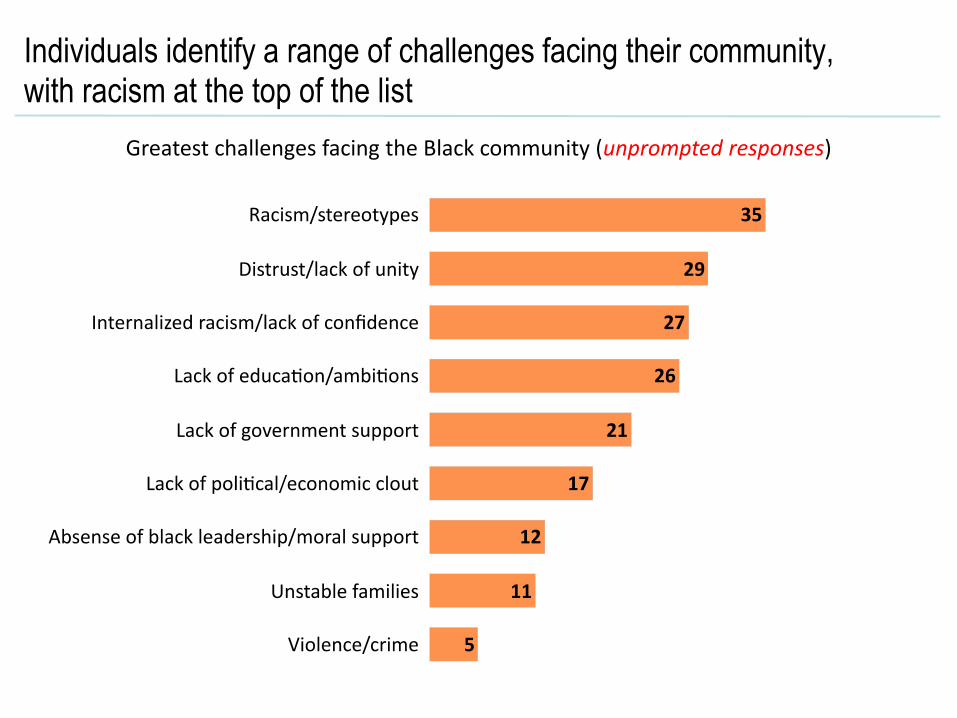
Individuals identify a range of challenges facing their community,with racism at the top of the list
Greatest challenges facing the Black community (unprompted responses)

Aspirations for the community are focused on stronger cohesion, advocacy and institution
MAJOR THEMES %
Build a stronger community/culture (unity, support, inclusiveness) 61
More political advocacy/social consciousness (equal opportunity) 35
Stronger education system/success 30
Less crime/violence/better policing 25
Stronger leadership/role models 21
Better media representation 20
Support for youth/future generations 19
Hopes for the Black community (unprompted responses)
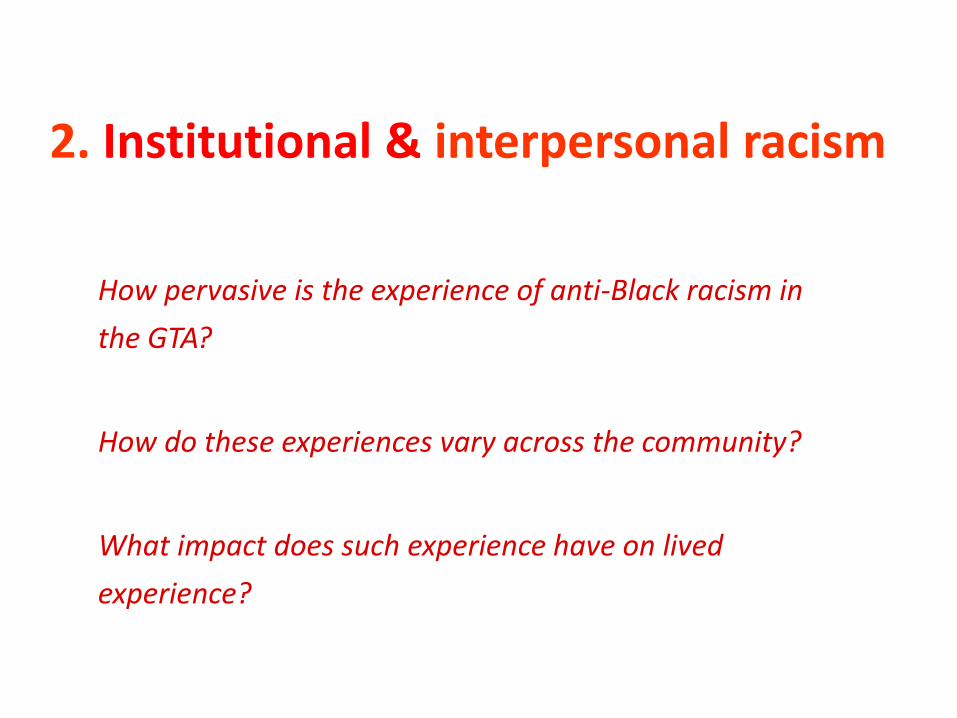
2. Institutional & interpersonal racism
How pervasive is the experience of anti-Black racism in
the GTA?
How do these experiences vary across the community?
What impact does such experience have on lived
experience?

Frequency of unfair treatment due to race, by gender and income
Discrimination and racism is an ongoing experience for Black individuals, regardless of gender and household income
$100K or more
$70K to $100K
$40K to $70K
$20K to $40K
Less than $20K
WOMEN
MEN 20 46 26 6
16 51 26 6
14 56 23 7
19 49 22 9
16 54 253
19 44 33 4
19 46 26 7
Frequently Occasionally Rarely Never

Most confront day-to-day “micro aggressions” on a regular basis,and these take many forms
Frequency of day-to-day personal experiences because of your race
Others expected your work to be inferior
Treated in overly friendly or superficial way
Others reacted to you as if theywere afraid or intimidated
Been observed or followed while in public places
Been accused of something or treated suspiciously
Been ignored or not given servicein a restaurant or store
Treated rudely or disrespectfully
Been mistaken for someone else who serves others (janitor, bellboy) 12 30 24 31
12 44 33 10
13 39 31 18
16 35 31 18
17 37 28 16
22 37 25 14
25 43 19 11
26 33 22 20
Frequently Occasionally Rarely Never
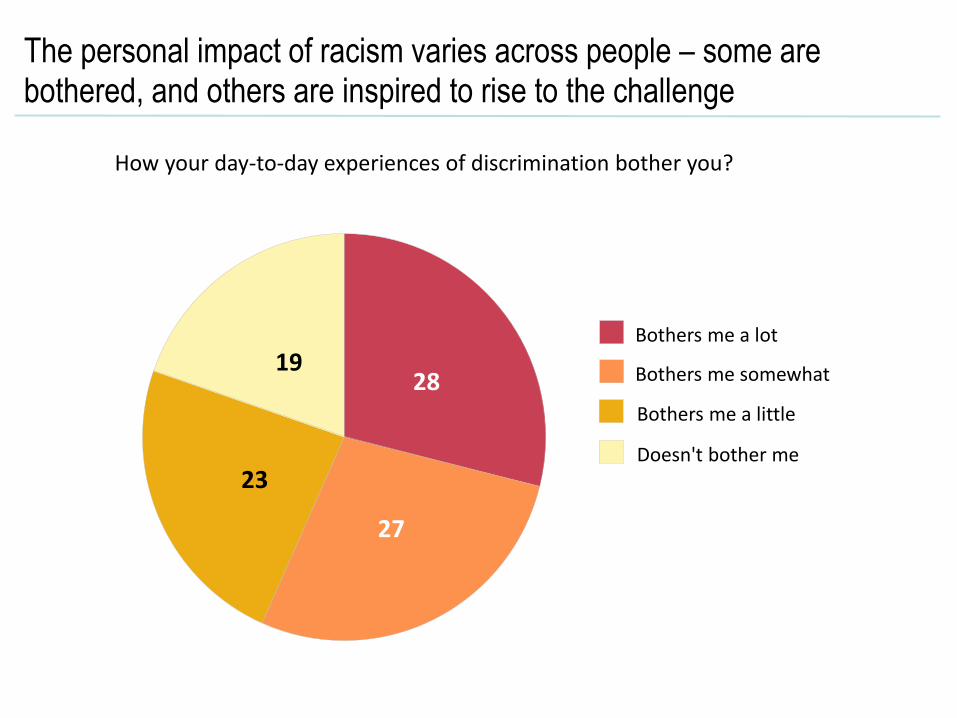
The personal impact of racism varies across people – some are bothered, and others are inspired to rise to the challenge
How your day-to-day experiences of discrimination bother you?
28
27
23
19Bothers me a lot
Bothers me somewhat
Bothers me a little
Doesn't bother me

3. Experience with police services & the criminal justice system
What are people’s experiences with police services?
What are community perspectives on how the police
are performing their role?

Most black individuals have had varied experiences with police, but more negative than positive – and especially so for men aged 25 to 44
Have you ever had an experience of … ? Total %Men aged
25 to 44 (%)
Getting stopped in public places by police 55 79
Socializing with police at social, cultural or official functions 53 64
Being helped by the police 44 39
Being harassed or treated rudely by police 38 60
Being interviewed by police as a witness to an incident 36 44
Police not responding promptly when you need them 18 23
Being arrested 15 31
Police using force against you 11 24
Lifetime personal experience with police in community and GTA

Personal experiences with police, by adequacy of income
Having a good income provides little insulation against negative experiences with police in the GTA

Performance of local police force
Individuals distinguish between the job police are doing overall, and how they treat the Black community
Ensuring the safety
of citizens in your
municipality
Treating Black
people fairly
4045
138
34
54
Good job Average job Poor job

4. Worlds apart: Perceptions of theBlack community
What is the gap between how individuals see their
community and how they are viewed by others?

Black community’s most important contribution to the GTA (unprompted responses)
Individuals believe their community contributes to the GTA in various ways, most notably in areas of culture and social influence
None/cannot say
Activism/advocacy
Involvement in education/research
Personal characteristics/energy
Community involvement/leadership
Cultural/social influence 67
36
19
18
17
7

How non-Black people in the GTA are believed to view Black people
Almost everyone believes non-Black people in the GTA have negative impressions of Black people, and few see clear progress
Verypositive
Somewhatpositive
Somewhatnegative
Verynegative
1
11
62
18
Better Same Worse
25
46
26
Non-Black people’s impression of black people
How have these impressionschanged over past decade?

What broader society should understand about Black people (unprompted responses)
There is a desire for others to see Black people as the same as everyone else, and to recognize their stereotyping and history
Other
Black community has made significant contributions to society
Greater need for acknowledgement/education of our history
There are many competent black professionals
History has affected our people's place in society
A diverse people/not at all the same
Predominant media portrayal is inaccurate
Black people are the same as everyone else 57
33
30
29
12
10
8
6

Project outcome
• Final report published in July 2017 – major public event and media
• Phase 3 outreach underway – public forums and presentations to organizations in all sectors
• Institutions and community organizations using the results for insight and guidance for policies and programs
• Other cities in Canada exploring their own version of this study
Examining the political education divide across racial groups
Hannah Fingerhut and Jocelyn Kiley

Contemporary fault line in American politics… among whites
May 18, 2018 2

WHO ARE WE TALKING ABOUT?
May 18, 2018 4
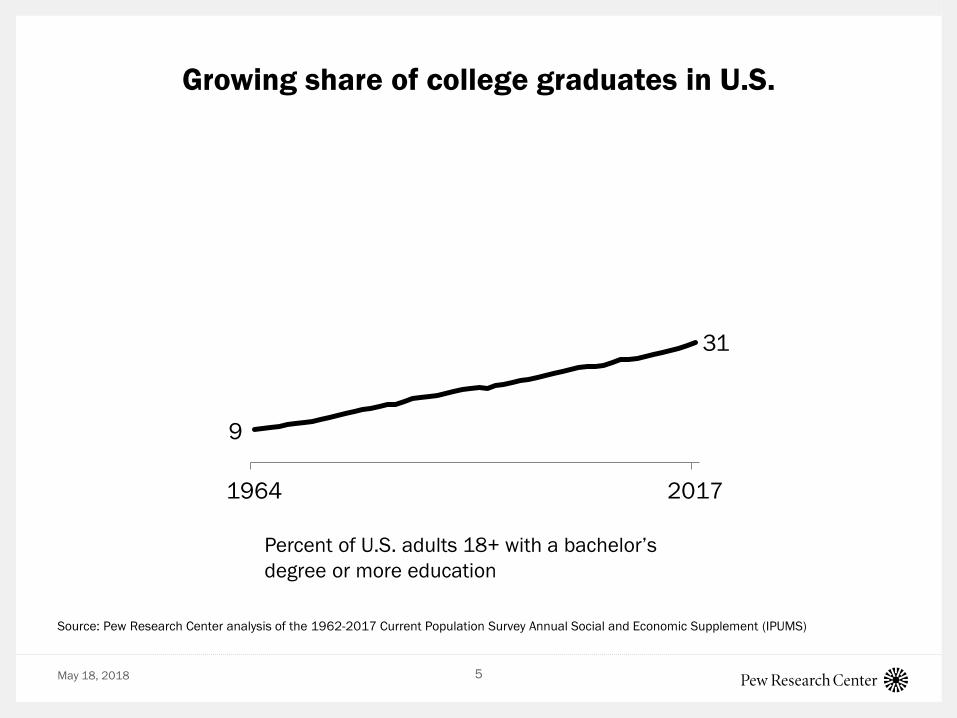
Growing share of college graduates in U.S.
May 18, 2018 5
Source: Pew Research Center analysis of the 1962-2017 Current Population Survey Annual Social and Economic Supplement (IPUMS)
Percent of U.S. adults 18+ with a bachelor’s degree or more education
9
31
1964 2017
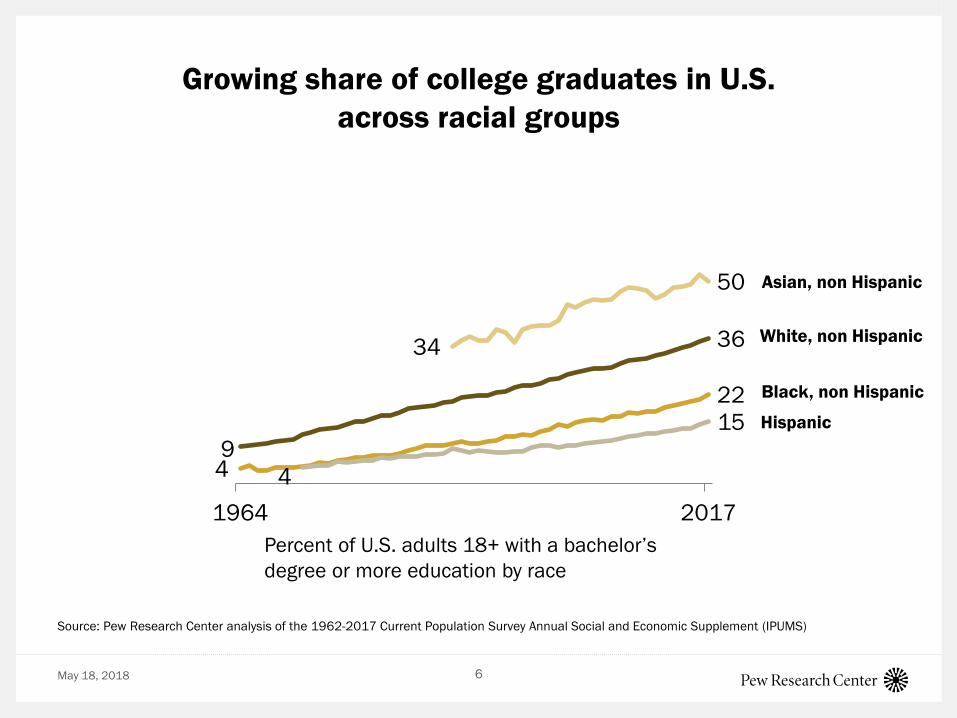
Growing share of college graduates in U.S. across racial groups
May 18, 2018 6
Source: Pew Research Center analysis of the 1962-2017 Current Population Survey Annual Social and Economic Supplement (IPUMS)
Percent of U.S. adults 18+ with a bachelor’s degree or more education by race
Asian, non Hispanic
White, non Hispanic
Black, non Hispanic
Hispanic 9
36
4
22
4
15
34
50
1964 2017
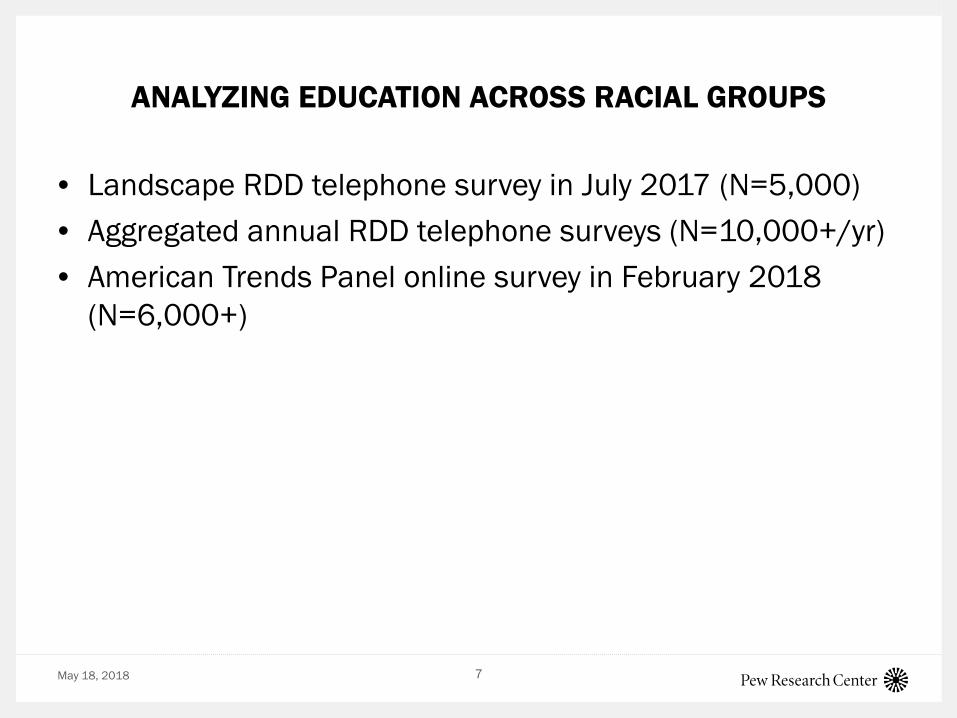
ANALYZING EDUCATION ACROSS RACIAL GROUPS
May 18, 2018 7
• Landscape RDD telephone survey in July 2017 (N=5,000) • Aggregated annual RDD telephone surveys (N=10,000+/yr) • American Trends Panel online survey in February 2018
(N=6,000+)

PARTISANSHIP
May 18, 2018 8

Differing patterns in party identification by education among whites, blacks
May 18, 2018 9
Source: Annual totals of Pew Research Center survey data (U.S. adults)
% who are…
TOTAL AMONG WHITES AMONG BLACKS AMONG HISPANICS
College grad
Non-college grad
College grad
Non-college grad
College grad
Non-college grad
College grad
Non-college grad
43 41 44 47
1994 2017
47 54
39 35
1994 2017
12 8
78 80
1994 2017
29 24
57 58
1994 2017
37 25
53 67
1994 2017
8 8
85 82
1994 2017
53 41 39 54
1994 2017
49 35 43
58
1994 2017
43 41 44 47 Republican/Lean Republican Democrat/Lean Democrat

Views of Trump, Obama
May 18, 2018 10
Source: Pew Research Center American Trends Panel, February 2018
% who rate ___ on a ‘feeling thermometer’ from 0 (coldest rating) to 100 (warmest rating)…
60
47
60
35
76
78
61
60
10
7
9
7
9
6
15
6
5
12
4
11
7
9
10
15
9
9
9
11
2
2
7
6
15
24
18
34
4
3
8
11
Coll grad+
Non coll
Coll grad+
Non coll
Coll grad+
Non coll
Coll grad+
Non coll
Among blacks
Among whites
Among Hispanics
22
33
25
44
8
8
14
15
8
7
10
10
1
2
4
5
6
12
6
14
3
6
8
14
13
10
13
10
7
6
8
12
50
36
46
22
78
76
66
53
Coll grad+
Non coll
Coll grad+
Non coll
Coll grad+
Non coll
Coll grad+
Non coll
Among blacks
Among whites
Among Hispanics
Very cold (0-24) Somewhat cold (25-49) Neutral (50) Somewhat warm (51-75) Very warm (76-100)
TRUMP OBAMA
IDEOLOGICAL AND ATTITUDINAL DIFFERENCES
May 18, 2018 13

Ideological consistency
May 18, 2018 14
Source: Pew Research Center survey of U.S. adults conducted June 8-July 9, 2017
Distribution of the public on a 10-item scale of political values

Ideological consistency
May 18, 2018 15
Source: Pew Research Center survey of U.S. adults conducted June 8-July 9, 2017
Distribution of the public on a 10-item scale of political values % who are …
12% 35% 19% 20% 34% 20% 24% 16% 11% 9% Consistently Lib Mostly Lib Mixed Mostly Conserv Consistently Conserv
12%
34%
18%
27%
25%
26%
36%
21%
32%
17%
13%
16%
8%
7%
8%
Non-college grad
College grad+
Total

Ideological consistency
May 18, 2018 16
Source: Pew Research Center survey of U.S. adults conducted June 8-July 9, 2017
Distribution of the public on a 10-item scale of political values % who are …
AMONG WHITES AMONG BLACKS
AMONG HISPANICS
12% 35% 19% 20% 34% 20% 24% 16% 11% 9% Consistently Lib Mostly Lib Mixed Mostly Conserv Consistently Conserv
11%
28%
40%
34%
40%
29%
6%
5%
2%
3%
Non-college grad
College grad+
13%
37%
42%
44%
44%
18%
1%
1%
1% Non-college grad
College grad+
12%
35%
19%
20%
34%
20%
24%
16%
11%
9%
Non-college grad
College grad+

Role of government
May 18, 2018 17
Source: Pew Research Center survey of U.S. adults conducted June 8-July 9, 2017
% who say …
34 40 36 47 19 17
33 34
56 51 54 43 72 78
56 60
Collgrad+
Noncoll
Collgrad+
Noncoll
Collgrad+
Noncoll
Collgrad+
Noncoll
Total White Black Hispanic
Poor people have hard lives because govt benefits don't go far enough
Poor people have it easy because they get govt benefits without doing anything in return
62 45
61 43
65 47 62 53
34 49 35 51
31 47 35 43
Collgrad+
Noncoll
Collgrad+
Noncoll
Collgrad+
Noncoll
Collgrad+
Noncoll
Total White Black Hispanic
Govt regulation of business is necessary to protect public interest
Govt regulation of business does more harm than good

Immigration
May 18, 2018 19
Source: Pew Research Center survey of U.S. adults conducted June 8-July 9, 2017 Source: Pew Research Center American Trends Panel, February 2018
% who say …
66 47
64 35
76 62 69 72
33 50
35 63
21 33 28 25
Collgrad+
Noncoll
Collgrad+
Noncoll
Collgrad+
Noncoll
Collgrad+
Noncoll
Total White Black Hispanic
Growing number of newcomers from other countries strengthens American society
Growing number of newcomers from other countries threatens traditional American customs, values
77 61
76 53
79 68 83 83
16 30 17 37
14 25 11 13
Collgrad+
Noncoll
Collgrad+
Noncoll
Collgrad+
Noncoll
Collgrad+
Noncoll
Total White Black Hispanic
Immigrants strengthen U.S. because of their hard work and talents
Immigrants burden U.S. because they take jobs, housing, health care

U.S. racial equality
May 18, 2018 20
Source: Pew Research Center survey of U.S. adults conducted June 8-July 9, 2017
% who say …
29 37 34 45 5 11 22 28
67 59 63 50
93 86 73 69
Collgrad+
Noncoll
Collgrad+
Noncoll
Collgrad+
Noncoll
Collgrad+
Noncoll
Total White Black Hispanic
Our country needs to continue making changes to give blacks equal rights with whites
Our country has made the changes needed to give blacks equal rights with whites

Diversity in the U.S.
May 18, 2018 21
Source: Pew Research Center American Trends Panel, February 2018
According to the U.S. Census Bureau, in the next 25 to 30 years African Americans, Latinos, and people of Asian descent will make up a majority of the population. % who say that this is …
30 21 21
9
61 44
55 45
59 58 65
64
37
48 40
45
11 19 12
26
1 6 5 8
Collgrad+
Noncoll
Collgrad+
Noncoll
Collgrad+
Noncoll
Collgrad+
Noncoll
Good for U.S. Neither good nor bad Bad for U.S.
Total White Black Hispanic

• Growing educational divide among whites in partisanship and in political values
• But many values divides by education are also seen across racial and ethnic groups
• Blacks and Hispanics are overwhelmingly Democratic groups, but we can see real differences by education in values, ideology
• Take advantage of surveys with large samples to zoom in on education breaks among blacks and Hispanics as well
• Be wary of implying values differences by education among whites are unique to whites
May 18, 2018 25
Education divides across racial groups

Key Takeaways • The voices of Black communities are often homogenized and minimized due to limited
empirical data and racial inequality
• We may be hearing and seeing Black communities in political demonstrations, but we’re
not hearing them in survey data due to small sample sizes of this population
• Black adults report that racism is still very prevalent in their day-to-day lives… in various
forms
• Black communities feel as though they are misunderstood and misrepresented
• Although adults of the same racial/ethnic group may express similar views on certain
issues, opinions differ across socioeconomic and demographic variables like gender,
age, and education
• We are seeing a distinct divide in political ideological patterns in Whites as compared to
people of other races and ethnicities
• Overall, more data is necessary to examine the nuances in public opinion in the Black
and Hispanic communities

Thank you.