pacific gas and electric company - base energy, inc. report - humboldt... · pacific gas and...
TRANSCRIPT

Pacific Gas and Electric Company
Emerging Technologies Program
Application Assessment Report #0705
Creamery MVR Energy Analysis Humboldt Creamery Fortuna, California
Issued: June 2008 Project Manager: Ryan Matley Pacific Gas and Electric Company Prepared by: Bryan Hackett, P.E. Ahmad Ganji, P.E., Ph.D. Mechanical Engineer Mechanical Engineer BASE Energy, Inc. BASE Energy, Inc.
Pacific Gas and Electric Company Emerging Technologies Program
MVR Creamery Energy Analysis BASE
i
ACKNOWLEDGEMENTS Contributions from numerous individuals and organizations have been taken to develop this report. We would like to thank Ryan Matley at PG&E for initiating and following-up the project. We would like to thank Mike Callihan and Robert Miranda from Humboldt Creamery for allowing us to perform this study in their facility, providing technical support on their equipment, helping to setup the measurement instrumentation and helping collect data throughout the study. Lee Dedini of Daqota Systems provided invaluable support in helping to setup the measurement instrumentation and collect data throughout the study. A special thanks to everyone for their interest and commitment to see this project through.
Legal Notice This report was prepared by Pacific Gas and Electric Company for exclusive use by its employees and agents. Neither Pacific Gas and Electric nor any of its employees and agents: 1) makes any written or oral warranty, expressed or implied, including, but not limited to those
concerning merchantability or fitness for a particular purpose; 2) assumes any legal liability or responsibility for the accuracy, completeness, or usefulness of
any information, apparatus, product, process, method, or policy contained herein; or 3) represents that its use would not infringe any privately owned rights, including, but not
limited to, patents, trademarks, or copyrights.
Pacific Gas and Electric Company Emerging Technologies Program
MVR Creamery Energy Analysis BASE
ii
Table of Contents 1. EXECUTIVE SUMMARY .................................................................................................. 1
1.1. Objective of Study .......................................................................................................... 1 1.2. Major Conclusions .......................................................................................................... 1 1.3. Key Findings................................................................................................................... 1
2. PROJECT BACKGROUND................................................................................................ 3 2.1. Facility Overview............................................................................................................ 3 2.2. Milk Evaporation ............................................................................................................ 3 2.3. Evaporation Systems....................................................................................................... 3 2.4. Thermal Vapor Recompression and MVR Evaporation Systems................................... 4
3. FIELD EVALUATION OF ENERGY CONSUMPTION OF MVR MILK EVAPORATION ................................................................................................................. 6
3.1. Background..................................................................................................................... 6 3.2. Overall Measurement Plan.............................................................................................. 8 3.3. Instrumentation and Measurement Systems ................................................................. 11
4. RESULTS ............................................................................................................................ 12 4.1. MVR Evaporation Measurements and Analysis........................................................... 12 4.2. Milk Evaporation System Comparison......................................................................... 12
5. CONCLUSIONS ................................................................................................................. 14 5.1. Cost Effectiveness of MVR Evaporation...................................................................... 14 5.2. Additional Benefits/Advantages of MVR Evaporation ................................................ 14
6. BIBLIOGRAPHY AND REFERENCES ......................................................................... 16 7. APPENDIX.......................................................................................................................... 17
7.1. Thermodynamic Model for MVR Evaporation ............................................................ 17 7.2. Sample Calculations from MVR Energy Analysis ....................................................... 21 7.3. Graphs of Data Recorded During MVR Monitoring .................................................... 23
Pacific Gas and Electric Company Emerging Technologies Program
MVR Creamery Energy Analysis BASE
1
1. EXECUTIVE SUMMARY
1.1. Objective of Study The specific objective of the study was to analyze the energy consumption of the mechanical vapor recompression (MVR) milk evaporation system at Humboldt Creamery. The results of the MVR energy consumption rate are compared to the energy consumption of typical multi-effect evaporators.
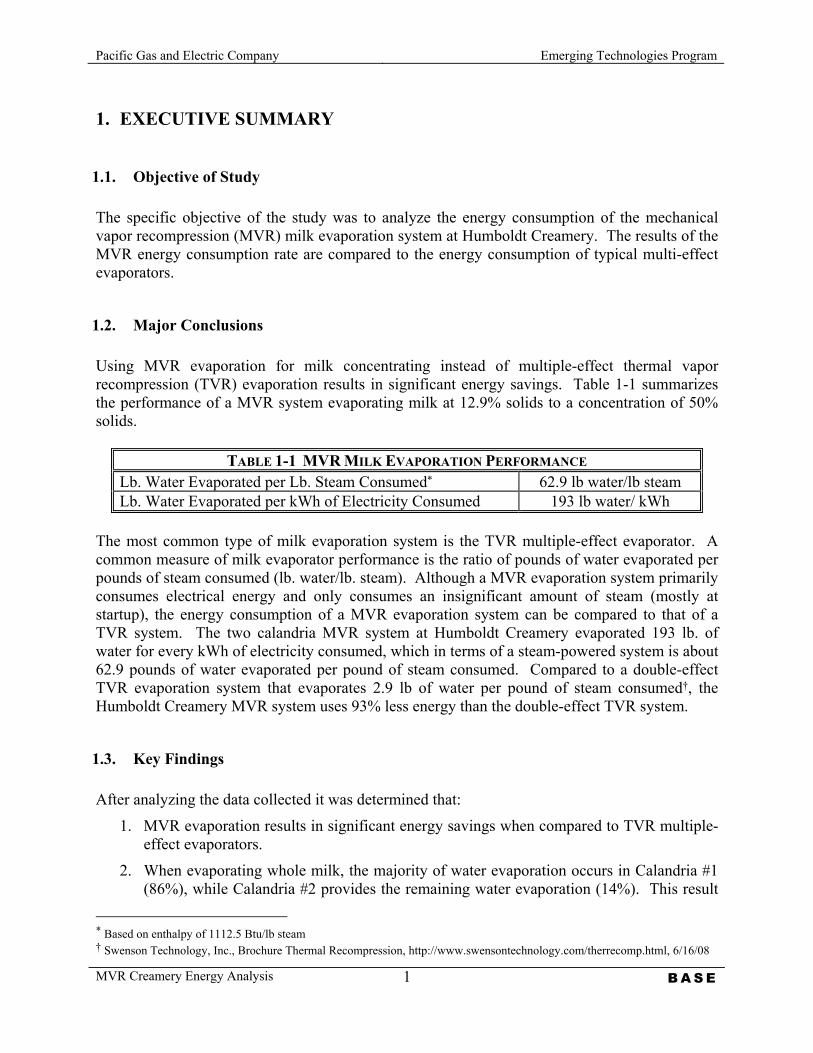
1.2. Major Conclusions Using MVR evaporation for milk concentrating instead of multiple-effect thermal vapor recompression (TVR) evaporation results in significant energy savings. Table 1-1 summarizes the performance of a MVR system evaporating milk at 12.9% solids to a concentration of 50% solids.
TABLE 1-1 MVR MILK EVAPORATION PERFORMANCE Lb. Water Evaporated per Lb. Steam Consumed* 62.9 lb water/lb steam Lb. Water Evaporated per kWh of Electricity Consumed 193 lb water/ kWh
The most common type of milk evaporation system is the TVR multiple-effect evaporator. A common measure of milk evaporator performance is the ratio of pounds of water evaporated per pounds of steam consumed (lb. water/lb. steam). Although a MVR evaporation system primarily consumes electrical energy and only consumes an insignificant amount of steam (mostly at startup), the energy consumption of a MVR evaporation system can be compared to that of a TVR system. The two calandria MVR system at Humboldt Creamery evaporated 193 lb. of water for every kWh of electricity consumed, which in terms of a steam-powered system is about 62.9 pounds of water evaporated per pound of steam consumed. Compared to a double-effect TVR evaporation system that evaporates 2.9 lb of water per pound of steam consumed†, the Humboldt Creamery MVR system uses 93% less energy than the double-effect TVR system.
1.3. Key Findings After analyzing the data collected it was determined that:
1. MVR evaporation results in significant energy savings when compared to TVR multiple-effect evaporators.
2. When evaporating whole milk, the majority of water evaporation occurs in Calandria #1 (86%), while Calandria #2 provides the remaining water evaporation (14%). This result
* Based on enthalpy of 1112.5 Btu/lb steam † Swenson Technology, Inc., Brochure Thermal Recompression, http://www.swensontechnology.com/therrecomp.html, 6/16/08
Pacific Gas and Electric Company Emerging Technologies Program
MVR Creamery Energy Analysis BASE
2
matches with the motor power draw of Fans #1 and 2, which were measured to be 205.4 kW and 3.1 kW, respectively.
3. Startup steam consumption is low and almost insignificant to overall energy consumption when MVR evaporation system is run continuously over several days.
4. Once running, MVR evaporation systems consume energy in the compression action of fans and the pumps used to transfer milk or milk concentrate.
5. Once running, minimal amounts of steam and water are used to balance evaporator (Calandria) pressure.
Pacific Gas and Electric Company Emerging Technologies Program
MVR Creamery Energy Analysis BASE
3
2. PROJECT BACKGROUND
2.1. Facility Overview Humboldt Creamery, located in Fortuna, CA produces ice cream and powdered milk from both skim and whole milk. The plant also has the capability to produce concentrated milk (50% solids) in order to convert any overflow milk to the plant into a form suitable for storage. The milk evaporation plant uses a two-effect Mechanical Vapor Recompression (MVR) evaporation system to concentrate both skim milk (9% solids) and whole milk (12 - 14% solids) into a 48% to 50% solids cream. The first effect (or calandria) is the primary evaporator, while the second effect is a “finishing” evaporator.
2.2. Milk Evaporation Milk is evaporated to remove water and concentrate its solids. Milk may be evaporated to prepare it for prolonged storage or in preparation for use as an ingredient in another food product such as ice cream. Water will evaporate from the surface of a liquid when heated to its boiling point corresponding to its local ambient pressure. At sea level (14.696 psia), the boiling point of water is 212 ºF. Exposing milk to high temperatures (212 ºF) can deteriorate its physical properties (e.g. proteins), which adversely affects its quality. Milk evaporation therefore takes place under vacuum, which means that the milk boils at a lower temperature (e.g. 135 ºF).
2.3. Evaporation Systems There are two common types of evaporators that are used in the milk industry, forced recirculation and falling film. In a forced recirculation evaporator, milk is pumped upward through a steam-heated heat exchanger, which offers a large surface to transfer heat to the milk. However, forced recirculation evaporators do not have a large liquid surface for evaporation to take place. A falling film evaporator is preferred as it offers the shortest holding time, reduced amount of product held in the evaporator, and increased surface area from which evaporation can take place. A falling film evaporator can be described as a pressure vessel with a number of vertical tubes to help increase the surface area of the milk and to heat the milk to its boiling point. Milk flows vertically down the inside surface of the tubes, while saturated steam condenses on the outside of the tubes as heat is transferred to the milk. This heat transfer section is often called the calandria, but this term can also refer to the entire evaporator. Water vapor leaves through the top of the evaporator, while the concentrated milk leaves through the bottom and discharged by a pump. Steam is introduced at the top of the heat transfer tubes, while the condensate is collected at the bottom of the tubes and removed by a pump. The evaporator vacuum can be produced by steam jet ejectors or mechanical vacuum pump. In multiple effect evaporators, water evaporated from the first effect evaporator provides the heat,

Pacific Gas and Electric Company Emerging Technologies Program
MVR Creamery Energy Analysis BASE
4
via condensation, to the second effect evaporator (and so on with additional effects). The vapor from the final effect is typically condensed in a condenser with water from a cooling tower. As water vapor from one effect is used to heat the product in the next effect, energy savings is achieved by each additional effect. Each effect operates at a lower pressure than the preceding effect, with the maximum number of effects limited by the lowest obtainable vacuum.
2.4. Thermal Vapor Recompression and MVR Evaporation Systems To reduce energy consumption, vapor removed from the milk may be compressed to a higher pressure to be used as a heat source for evaporation. In a Thermal Vapor Recompression (TVR) evaporation system, a thermo-compressor uses high-pressure steam to create a vacuum on an evaporator (e.g. 2ndt effect) and to raise the pressure (and temperature) of the vapor to be used to heat prior evaporators (e.g. 1st effect). Only a portion of the vapor from the 1st effect is recompressed by the thermo-compressor, while the remaining vapor is used to heat the next effect (e.g. 2nd effect) or to be condensed in a condenser. A simplified diagram of a 3-effect TVR evaporation system is shown in Figure 1 below.
Steam
CondensateCondensateCondensate
Condensate
MilkConcentrate
CoolingWater
MilkIn-Feed
Calandria #1 Calandria #2 Calandria #3
Thermo-compressor
Water-cooledCondenser
Figure 1 - Simplified Diagram of a 3-Effect TVR Milk Evaporation System
Pacific Gas and Electric Company Emerging Technologies Program
MVR Creamery Energy Analysis BASE
5
An MVR evaporation system is similar to a TVR system. The primary difference is that all of the vapor leaving an evaporator (calandria) is compressed, and compression is typically performed by a high-pressure fan. The high-pressure fan provides both the vacuum necessary for low boiling temperature evaporation, and the boost in vapor pressure needed to raise the steam temperature for heat transfer to the evaporators. An MVR evaporation system of this type uses no steam once the system is up to temperature and under vacuum. A simplified diagram of the MVR milk evaporation system at the test site is shown in Figure 2.
Pacific Gas and Electric Company Emerging Technologies Program
MVR Creamery Energy Analysis BASE
6
3. FIELD EVALUATION OF ENERGY CONSUMPTION OF MVR MILK EVAPORATION
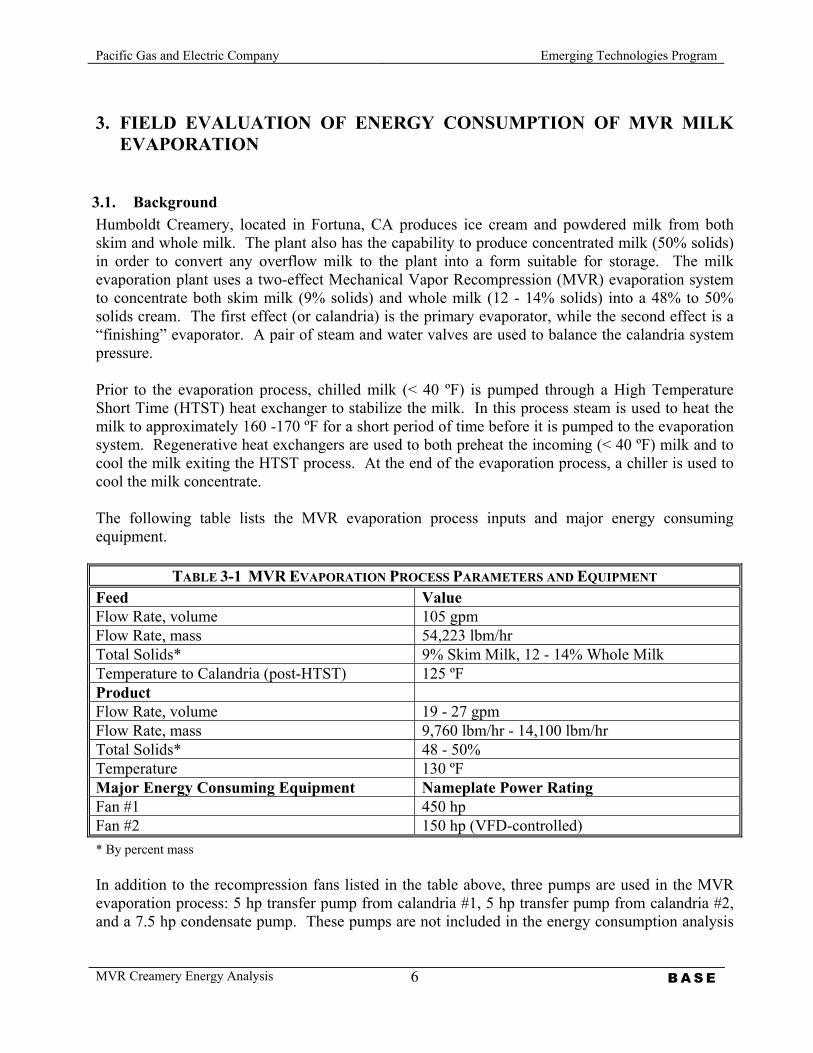
3.1. Background Humboldt Creamery, located in Fortuna, CA produces ice cream and powdered milk from both skim and whole milk. The plant also has the capability to produce concentrated milk (50% solids) in order to convert any overflow milk to the plant into a form suitable for storage. The milk evaporation plant uses a two-effect Mechanical Vapor Recompression (MVR) evaporation system to concentrate both skim milk (9% solids) and whole milk (12 - 14% solids) into a 48% to 50% solids cream. The first effect (or calandria) is the primary evaporator, while the second effect is a “finishing” evaporator. A pair of steam and water valves are used to balance the calandria system pressure. Prior to the evaporation process, chilled milk (< 40 ºF) is pumped through a High Temperature Short Time (HTST) heat exchanger to stabilize the milk. In this process steam is used to heat the milk to approximately 160 -170 ºF for a short period of time before it is pumped to the evaporation system. Regenerative heat exchangers are used to both preheat the incoming (< 40 ºF) milk and to cool the milk exiting the HTST process. At the end of the evaporation process, a chiller is used to cool the milk concentrate. The following table lists the MVR evaporation process inputs and major energy consuming equipment.
TABLE 3-1 MVR EVAPORATION PROCESS PARAMETERS AND EQUIPMENT Feed Value Flow Rate, volume 105 gpm Flow Rate, mass 54,223 lbm/hr Total Solids* 9% Skim Milk, 12 - 14% Whole Milk Temperature to Calandria (post-HTST) 125 ºF Product Flow Rate, volume 19 - 27 gpm Flow Rate, mass 9,760 lbm/hr - 14,100 lbm/hr Total Solids* 48 - 50% Temperature 130 ºF Major Energy Consuming Equipment Nameplate Power Rating Fan #1 450 hp Fan #2 150 hp (VFD-controlled) * By percent mass In addition to the recompression fans listed in the table above, three pumps are used in the MVR evaporation process: 5 hp transfer pump from calandria #1, 5 hp transfer pump from calandria #2, and a 7.5 hp condensate pump. These pumps are not included in the energy consumption analysis
Pacific Gas and Electric Company Emerging Technologies Program
MVR Creamery Energy Analysis BASE
7
of this project as it is assumed that a multiple-effect TVR evaporation system of similar capacity will have similar or slightly greater auxiliary equipment energy consumption.
Pacific Gas and Electric Company Emerging Technologies Program
MVR Creamery Energy Analysis BASE
8
3.2. Overall Measurement Plan
• BASE staff met with the PG&E Project Manager to discuss the details of the project objective and prior contacts with the plant. The team reviewed the data available that is currently monitored (or can be monitored) on-site, discussed the possibilities of additional data monitoring, and reviewed the methodology that will be used to evaluate the steam consumption, power consumption and evaporation rate.
• The team met with the plant manager of Humboldt Creamery to assess the site, operational and safety issues and review existing mechanical and electrical systems in order to design a monitoring program that can be conducted on a non-interference basis with Humboldt Creamery.
• BASE designed the details of measurement and monitoring program, presented it to the PG&E Project Manager as a draft and then finalized it for implementation.
In general the monitored parameters involved all feed stock properties, thermodynamic
properties of steam as well as processed material at each stage and power consumption of electrical equipment.
The plan includes design of instrumentation and specification of the monitoring equipment
for all required parameters. The instrumentation and associated monitoring equipment that may need to be installed or sensor signals from the existing control system that may need to be captured and recorded. A local contractor familiar with plant instrumentation and control systems was utilized in order to minimize the time and cost for installation and commissioning of monitoring equipment.
• BASE developed protocols and forms needed to inform the Creamery staff with the monitoring and collection of the required data. The protocols include an outline of the tasks that need to be performed by the site staff. The protocols include contact protocols to ensure that data is continuously gathered during the test period.
• BASE arranged for the equipment from the Pacific Energy Center (PEC) to be loaned for the duration of the monitoring period. Additional monitoring equipment was borrowed from BASE or purchased as necessary. The monitoring equipment is shown in Table 3-2.
• BASE arranged for the site visit, and with the help of Creamery staff, local technicians, and the PG&E Project Manager installed all monitoring equipment. Start-up and calibration was performed by BASE, and the initial readings were observed and compared to anticipated values. Initial placement of the logger thermocouples resulted in inconsistent readings and high risk for failure. A secondary plan for measuring vapor temperature at each side of both fans was developed and commissioned.
• After installation and commissioning of equipment, the local technician checked on the performance of the field measurements as defined in the test protocol. Preliminary data from the loggers was downloaded and emailed to BASE for review. Power measurements of Fan #2 were lower than expected and potential explanations for the situation were discussed by key BASE staff. The results were discussed with the PG&E Project Manager. A list of tests to
Pacific Gas and Electric Company Emerging Technologies Program
MVR Creamery Energy Analysis BASE
9
determine the reliability of the power measurement was sent to the local technician. Information from the local technician and Creamery staff indicated that the power measurements of Fan #2 were reasonable because it was very lightly loaded.
• Having confirmed the operation of all of the monitoring equipment, BASE asked the Creamery staff to begin sampling milk concentrations as prescribed in the monitoring protocol. It was agreed to monitor the MVR evaporation process for the period of 1/4/08 through 1/11/08.
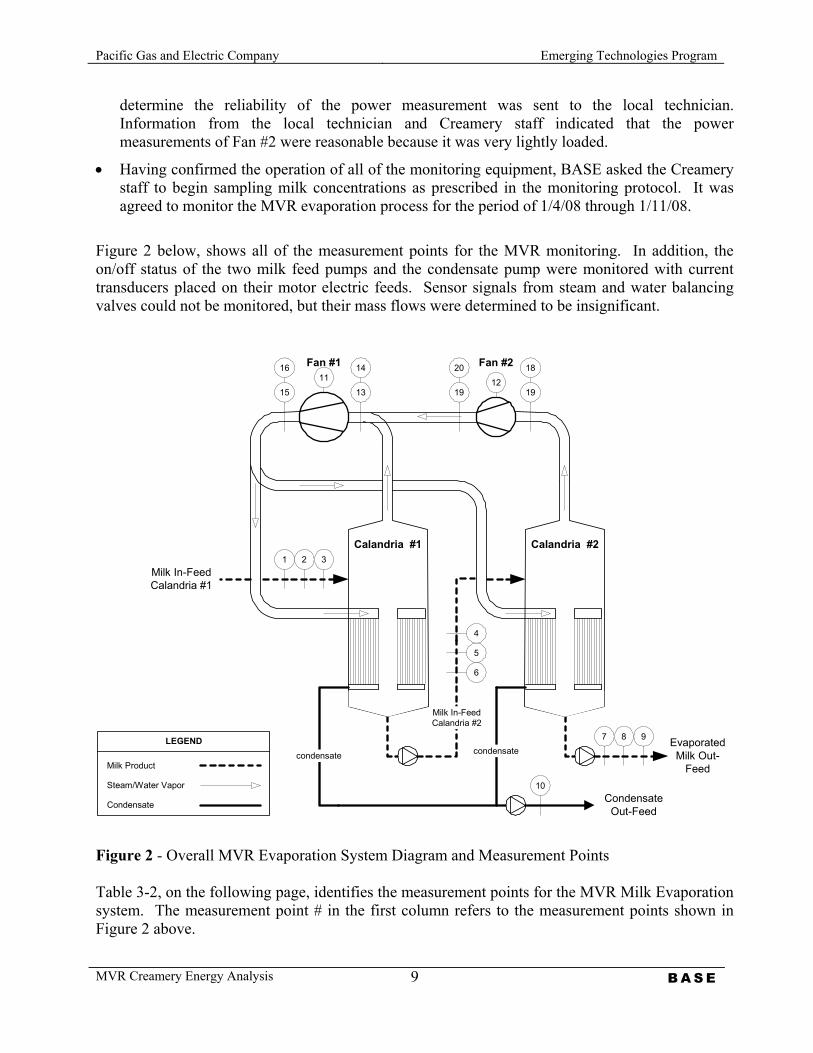
Figure 2 below, shows all of the measurement points for the MVR monitoring. In addition, the on/off status of the two milk feed pumps and the condensate pump were monitored with current transducers placed on their motor electric feeds. Sensor signals from steam and water balancing valves could not be monitored, but their mass flows were determined to be insignificant.
condensate condensate
Milk In-FeedCalandria #2
Milk In-FeedCalandria #1
EvaporatedMilk Out-
Feed
CondensateOut-Feed
Fan #2Fan #1
Calandria #2Calandria #1
Milk Product
Steam/Water Vapor
Condensate
LEGEND
15
16
13
14
19
20
19
18
1211
21 3
4
5
6
10
7 8 9
Figure 2 - Overall MVR Evaporation System Diagram and Measurement Points Table 3-2, on the following page, identifies the measurement points for the MVR Milk Evaporation system. The measurement point # in the first column refers to the measurement points shown in Figure 2 above.

Pacific Gas and Electric Company Emerging Technologies Program
MVR Creamery Energy Analysis BASE
10
TABLE 3-2 MVR EVAPORATION MEASUREMENT POINTS
Pt. Measured Parameter Measurement Method Logging Interval
1 Milk Input (Feed Stock) Concentration
Manual sampling and testing by plant staff 1 sample/4 hours
2 Milk Input Flow Rate Data log existing 4 mA signal 1 per hour
3 Milk Input Temperature Spot measurement with infrared thermometer Single measurement
4 Calandria #1 Product Concentration
Manual sampling and testing by plant staff 1 sample/4 hours
5 Calandria #1 Flow Rate Spot measurement with non-intrusive ultrasonic flow meter Single measurement
6 Calandria #1 Product Temperature
Spot measurement with infrared thermometer Single measurement
7 Calandria #2 Product Concentration
Manual sampling and testing by plant staff 1 sample/4 hours
8 Calandria #2 Flow Rate Spot measurement with non-intrusive ultrasonic flow meter Single measurement
9 Calandria #2 Product Temperature
Spot measurement with infrared thermometer Single measurement
10 Calandria Condensate Flow Rate
Spot measurement with non-intrusive ultrasonic flow meter Single measurement
11 Fan #1 Motor Power Power data logger with current transducers and voltage probes 1 per hour
12 Fan #2 Motor Power Power data logger with current transducers and voltage probes 1 per hour
13 Fan #1 Inlet Temperature Thermocouple probe and data logger 1 per hour
14 Fan #1 Inlet Pressure Pressure transducer and data logger 1 per hour
15 Fan #1 Outlet Temperature
Thermocouple probe and data logger 1 per hour
16 Fan #1 Outlet Pressure Pressure transducer and data logger 1 per hour
17 Fan #2 Inlet Temperature Thermocouple probe and data logger 1 per hour
18 Fan #2 Inlet Pressure Pressure transducer and data logger 1 per hour
19 Fan #2 Outlet Temperature
Thermocouple probe and data logger 1 per hour
20 Fan #2 Outlet Pressure Pressure transducer and data logger 1 per hour 21 Startup Steam Flow Rate Manual timing by plant staff At system startup
Pacific Gas and Electric Company Emerging Technologies Program
MVR Creamery Energy Analysis BASE
11
3.3. Instrumentation and Measurement Systems The following equipment was used to log the parameters needed for the present analysis:
• Temperature: o Onset HOBO U12-14 Thermocouple Logger with high-temperature stainless steel
thermocouple probe o Raytek ST80-IS Infrared Thermometer
• Pressure o PACE XR440 Pocket Logger with P1000-600 pressure transducer
• Power o Dent ElitePro Logger with 1000A current transducers
• Current o Onset HOBO U12-12 Logger with 50A current transducer
• Sensor Signal o PACE XR440 Pocket Logger with resistor
• Flow Meter: o GE Panametrics Flow Meter PT878 w/small pipe transducers CF-LP-2EM40NM-1
Personnel from Daqota Systems and Tyson Electrical Service who are familiar with the control and electrical systems of the plant helped in the installation of the data loggers and other measurement equipment. In addition, they made numerous visits to the plant to download data from the loggers and monitor their operation for the duration of the study.

Pacific Gas and Electric Company Emerging Technologies Program
MVR Creamery Energy Analysis BASE
12
4. RESULTS
4.1. MVR Evaporation Measurements and Analysis The MVR Evaporation system monitoring showed that when the plant was processing whole milk (12.9% solids) at a rate of 105 gpm (54,233 lb/hr), the total energy consumption rate of the evaporation system (excluding pumps) was on average 208.5 kW. A common measure of milk evaporator performance is the ratio of pounds of water evaporated per pound of steam consumed (lb. water/lb. steam). This energy consumption is entirely from the two fans and the energy is equivalent to 639 lb. of steam per hour. During the monitoring period, the amount of water removed from the milk averaged 40,234 lb. per hour, which results in a steam economy rate of 62.9 lb water/lb steam. In terms of pounds of water evaporated per electrical energy consumed, the monitored MVR system evaporated 193 lb. water for every kWh of electricity consumed. The sample calculations for these results are shown in Section 7.2. The measured data showed an average pressure increase of 0.43 psi (from 2.03 to 2.46 psia) across Fan #1, an average temperature increase of 12.6 ºF (from 128.8 to 141.4 ºF), a water vapor mass flow rate of 40,234 lb/hr, with a power input of 195.1 kW. An energy balance between system input and output energy was found to be within 1% of each other (45,602,866 Btu/hr input vs. 45,030,634 Btu/hr out). For Fan #2, one of the measurement points did not agree with the other measured data. The data showed an average pressure increase of 0.34 psi (from 2.23 to 2.57 psia), an average temperature decrease of 1.5 ºF (132.1 to 130.6 ºF), a water vapor mass flow rate of 5,735 lb/hr, with a power input of 2.8 kW. The temperature after Fan #2 should have been approximately 3.9 ºF higher than the inlet temperature. The thermocouple and data logger were checked several times to see if they were operating properly and had been installed correctly. A possible explanation for this discrepancy are radiation and conduction heat transfer from the thermocouple tip. Temperature and pressure charts for the two fans are shown in Section 7.3 of the report. The water/steam balancing valves were found to contribute less than 0.5% of the water vapor mass flow rate in the MVR system, and thus had negligible affect on system performance.
4.2. Milk Evaporation System Comparison By comparison, a double-effect TVR evaporator will evaporate approximately 2.9 lb of water for every lb. of steam consumed. In the present study, the MVR system consumed a steam energy equivalent of 93% less than the double-effect evaporator. According to another source‡, a 5-effect TVR system can have a steam economy of 7.6 lb. water/lb. steam, while a 7-effect TVR system can
‡ GEA Niro A/S, www.niro.com/niro/cmsdoc.nsf/WebDoc/ndkw5y7d46Library, Comparison of Energy Consumption in Different Evaporators, 3/5/08
Pacific Gas and Electric Company Emerging Technologies Program
MVR Creamery Energy Analysis BASE
13
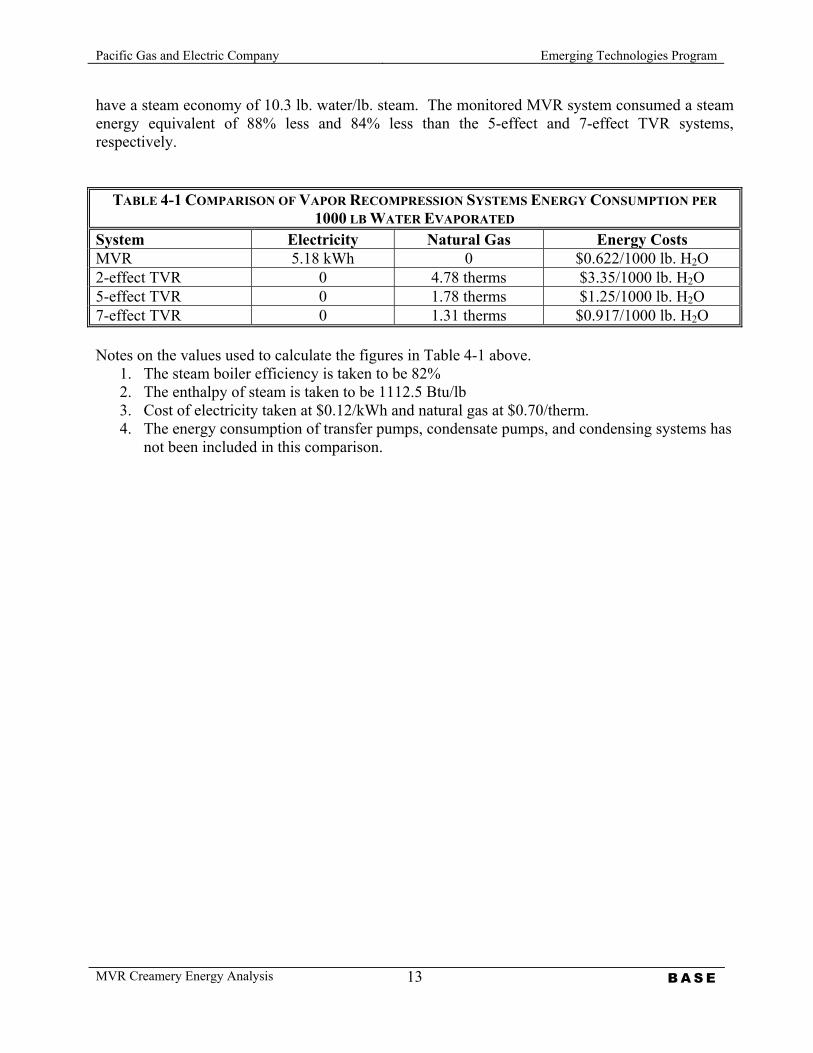
have a steam economy of 10.3 lb. water/lb. steam. The monitored MVR system consumed a steam energy equivalent of 88% less and 84% less than the 5-effect and 7-effect TVR systems, respectively.
TABLE 4-1 COMPARISON OF VAPOR RECOMPRESSION SYSTEMS ENERGY CONSUMPTION PER 1000 LB WATER EVAPORATED
System Electricity Natural Gas Energy Costs MVR 5.18 kWh 0 $0.622/1000 lb. H2O 2-effect TVR 0 4.78 therms $3.35/1000 lb. H2O 5-effect TVR 0 1.78 therms $1.25/1000 lb. H2O 7-effect TVR 0 1.31 therms $0.917/1000 lb. H2O Notes on the values used to calculate the figures in Table 4-1 above.
1. The steam boiler efficiency is taken to be 82% 2. The enthalpy of steam is taken to be 1112.5 Btu/lb 3. Cost of electricity taken at $0.12/kWh and natural gas at $0.70/therm. 4. The energy consumption of transfer pumps, condensate pumps, and condensing systems has
not been included in this comparison.
Pacific Gas and Electric Company Emerging Technologies Program
MVR Creamery Energy Analysis BASE
14
5. CONCLUSIONS
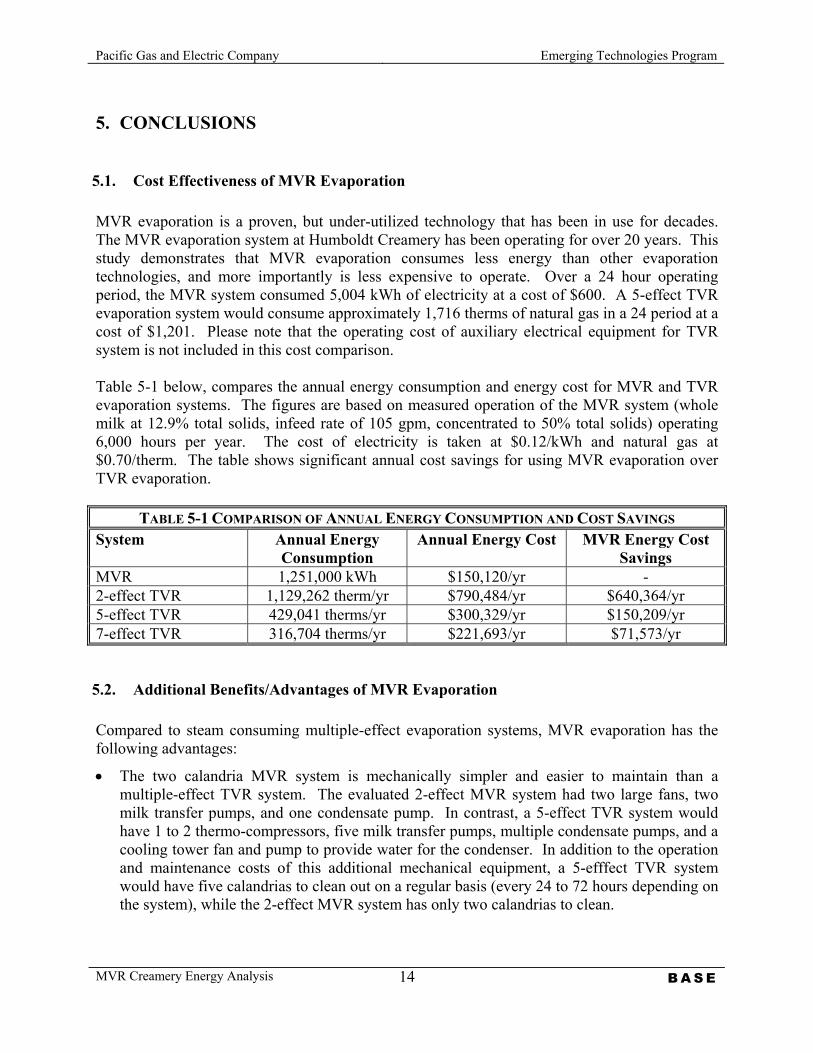
5.1. Cost Effectiveness of MVR Evaporation MVR evaporation is a proven, but under-utilized technology that has been in use for decades. The MVR evaporation system at Humboldt Creamery has been operating for over 20 years. This study demonstrates that MVR evaporation consumes less energy than other evaporation technologies, and more importantly is less expensive to operate. Over a 24 hour operating period, the MVR system consumed 5,004 kWh of electricity at a cost of $600. A 5-effect TVR evaporation system would consume approximately 1,716 therms of natural gas in a 24 period at a cost of $1,201. Please note that the operating cost of auxiliary electrical equipment for TVR system is not included in this cost comparison. Table 5-1 below, compares the annual energy consumption and energy cost for MVR and TVR evaporation systems. The figures are based on measured operation of the MVR system (whole milk at 12.9% total solids, infeed rate of 105 gpm, concentrated to 50% total solids) operating 6,000 hours per year. The cost of electricity is taken at $0.12/kWh and natural gas at $0.70/therm. The table shows significant annual cost savings for using MVR evaporation over TVR evaporation.
TABLE 5-1 COMPARISON OF ANNUAL ENERGY CONSUMPTION AND COST SAVINGS System Annual Energy
Consumption Annual Energy Cost MVR Energy Cost
Savings MVR 1,251,000 kWh $150,120/yr - 2-effect TVR 1,129,262 therm/yr $790,484/yr $640,364/yr 5-effect TVR 429,041 therms/yr $300,329/yr $150,209/yr 7-effect TVR 316,704 therms/yr $221,693/yr $71,573/yr
5.2. Additional Benefits/Advantages of MVR Evaporation Compared to steam consuming multiple-effect evaporation systems, MVR evaporation has the following advantages:
• The two calandria MVR system is mechanically simpler and easier to maintain than a multiple-effect TVR system. The evaluated 2-effect MVR system had two large fans, two milk transfer pumps, and one condensate pump. In contrast, a 5-effect TVR system would have 1 to 2 thermo-compressors, five milk transfer pumps, multiple condensate pumps, and a cooling tower fan and pump to provide water for the condenser. In addition to the operation and maintenance costs of this additional mechanical equipment, a 5-efffect TVR system would have five calandrias to clean out on a regular basis (every 24 to 72 hours depending on the system), while the 2-effect MVR system has only two calandrias to clean.

Pacific Gas and Electric Company Emerging Technologies Program
MVR Creamery Energy Analysis BASE
15
• Reduced dependency on the plant’s steam system for milk evaporation. Steam systems have many points of potential failure that require ongoing maintenance such as steam lines, pumps, and steam traps. MVR evaporation system only requires steam for a short period at startup and can run continuously for days at time afterwards.
• Steam system operating costs are significantly reduced. Reduced steam usage and operating hours will result in reduced operating and maintenance costs to the plant.

Pacific Gas and Electric Company Emerging Technologies Program
MVR Creamery Energy Analysis BASE
16
6. BIBLIOGRAPHY AND REFERENCES
1. ASHRAE Handbook - Refrigeration, ASHRAE, 2005
2. http://www.niro.com/niro/cmsdoc.nsf/WebDoc/ndkw5y4bwzLibrary, 3/10/08
3. http://www.anhydro.com/content/us/products/evaporators, 3/3/08
4. http://www.swensontechnology.com, 3/6/08
5. Walstra, Pieter, Wouter, Jan T. M., Dairy Science and Technology, CRC, 2005, 2nd Ed.
6. Spreer, Edgar, Milk and Dairy Technology, CRC, 1998
7. Walstra, Pieter, Dairy Technology: Principles of Milk Properties and Processes, CRC, 1999

Pacific Gas and Electric Company Emerging Technologies Program
MVR Creamery Energy Analysis BASE
17
7. APPENDIX
7.1. Thermodynamic Model for MVR Evaporation A MVR evaporation system is a continuous process used to reduce the moisture content of fluid milk products. A MVR evaporation system can be treated as a thermal-mechanical system in that heat (thermal energy) is used to heat the milk product to its boiling point, while vacuum (mechanical energy) is used to lower the temperature at which water evaporates (boils) from the milk product. The thermodynamic model for MVR evaporation rests on the following principles:
• Conservation of Mass
∑∑••
= ie mm
• Conservation of Energy
∑∑
++−
++=−
••••
ii
iiee
ee gzvhmgzvhmWQ22
22
Where, Q = heat transfer from system or control volume (CV), Btu/hr W = net work done on system or CV, Btu/hr me = mass flow rate exiting system or CV, lbm/hr he = enthalpy of mass exiting system or CV, Btu/lbm ve = velocity of mass exiting system or CV, ft/s g = gravitation constant, ze = elevation of mass exiting system or CV, ft mi = mass flow rate entering system or CV, lbm/hr hi = enthalpy of mass entering system or CV, Btu/lbm vi = velocity of mass entering system or CV, ft/s zi = elevation of mass entering system or CV, ft For the system monitored, the velocities are all low enough that they are taken to be zero. The increase or decrease in elevation (∆z) is taken to be insignificant. The MVR evaporation system can be understood by applying these two basic physical principles to individual processes (e.g. Calandria #1) and the system as a whole. Conservation of Mass The principle of conservation of mass for steady process can be simply stated as the difference between the mass flow rate into a system minus the mass flow rate out of a system is the change in the mass of the system. After initial startup, a MVR evaporation system is a continuous
Pacific Gas and Electric Company Emerging Technologies Program
MVR Creamery Energy Analysis BASE
18
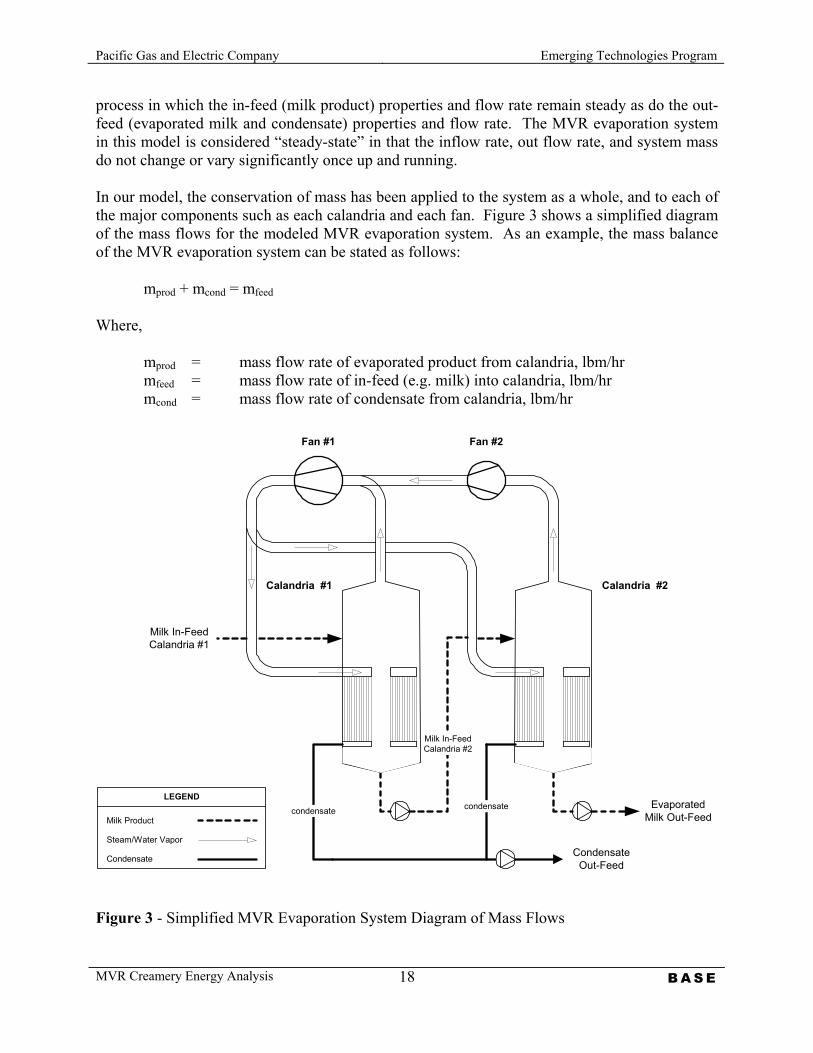
process in which the in-feed (milk product) properties and flow rate remain steady as do the out-feed (evaporated milk and condensate) properties and flow rate. The MVR evaporation system in this model is considered “steady-state” in that the inflow rate, out flow rate, and system mass do not change or vary significantly once up and running. In our model, the conservation of mass has been applied to the system as a whole, and to each of the major components such as each calandria and each fan. Figure 3 shows a simplified diagram of the mass flows for the modeled MVR evaporation system. As an example, the mass balance of the MVR evaporation system can be stated as follows: mprod + mcond = mfeed Where, mprod = mass flow rate of evaporated product from calandria, lbm/hr mfeed = mass flow rate of in-feed (e.g. milk) into calandria, lbm/hr mcond = mass flow rate of condensate from calandria, lbm/hr
condensate condensate
Milk In-FeedCalandria #2
Milk In-FeedCalandria #1
EvaporatedMilk Out-Feed
CondensateOut-Feed
Fan #2Fan #1
Calandria #2Calandria #1
Milk Product
Steam/Water Vapor
Condensate
LEGEND
Figure 3 - Simplified MVR Evaporation System Diagram of Mass Flows
Pacific Gas and Electric Company Emerging Technologies Program
MVR Creamery Energy Analysis BASE
19
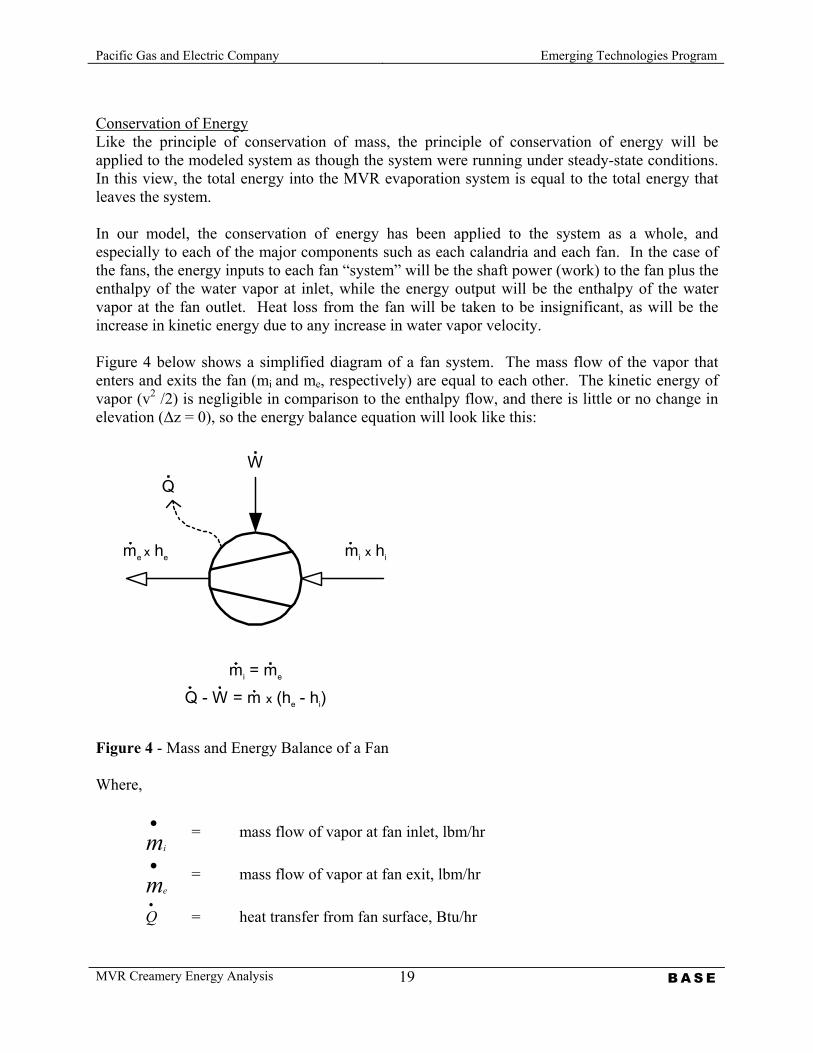
Conservation of Energy Like the principle of conservation of mass, the principle of conservation of energy will be applied to the modeled system as though the system were running under steady-state conditions. In this view, the total energy into the MVR evaporation system is equal to the total energy that leaves the system. In our model, the conservation of energy has been applied to the system as a whole, and especially to each of the major components such as each calandria and each fan. In the case of the fans, the energy inputs to each fan “system” will be the shaft power (work) to the fan plus the enthalpy of the water vapor at inlet, while the energy output will be the enthalpy of the water vapor at the fan outlet. Heat loss from the fan will be taken to be insignificant, as will be the increase in kinetic energy due to any increase in water vapor velocity. Figure 4 below shows a simplified diagram of a fan system. The mass flow of the vapor that enters and exits the fan (mi and me, respectively) are equal to each other. The kinetic energy of vapor (v2 /2) is negligible in comparison to the enthalpy flow, and there is little or no change in elevation (∆z = 0), so the energy balance equation will look like this:
Q - W = m x (he - hi)
me x he mi x hi
WQ
mi = me
Figure 4 - Mass and Energy Balance of a Fan Where,
•mi
= mass flow of vapor at fan inlet, lbm/hr
•me
= mass flow of vapor at fan exit, lbm/hr
•
Q = heat transfer from fan surface, Btu/hr
Pacific Gas and Electric Company Emerging Technologies Program
MVR Creamery Energy Analysis BASE
20
•
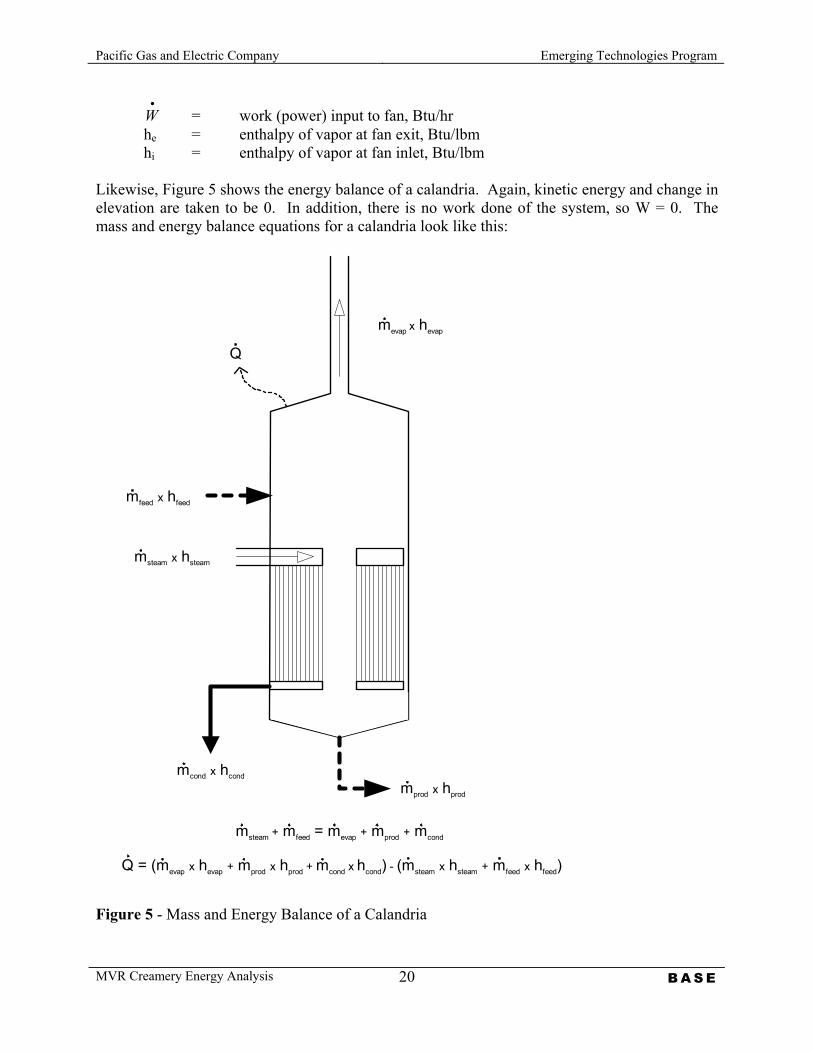
W = work (power) input to fan, Btu/hr he = enthalpy of vapor at fan exit, Btu/lbm hi = enthalpy of vapor at fan inlet, Btu/lbm Likewise, Figure 5 shows the energy balance of a calandria. Again, kinetic energy and change in elevation are taken to be 0. In addition, there is no work done of the system, so W = 0. The mass and energy balance equations for a calandria look like this:
Q
mevap x hevap
msteam x hsteam
mcond x hcond
mfeed x hfeed
mprod x hprod
Q = (mevap x hevap + mprod x hprod + mcond x hcond) - (msteam x hsteam + mfeed x hfeed)
msteam + mfeed = mevap + mprod + mcond
Figure 5 - Mass and Energy Balance of a Calandria
Pacific Gas and Electric Company Emerging Technologies Program
MVR Creamery Energy Analysis BASE
21
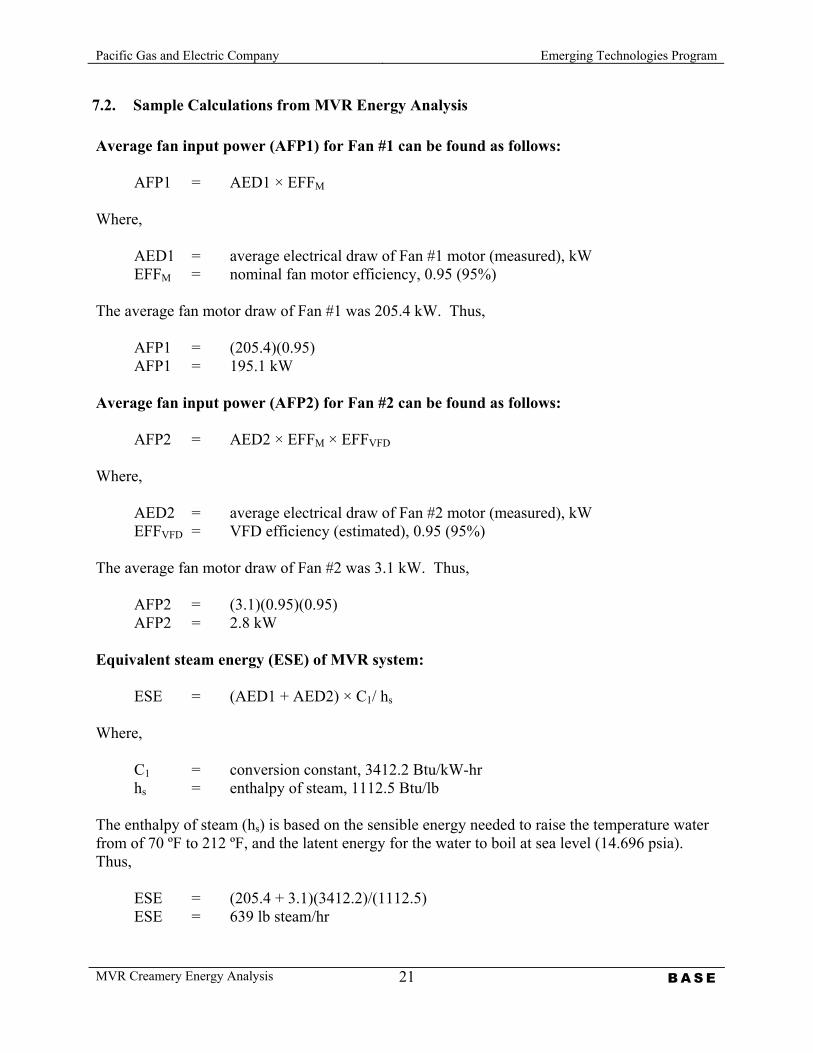
7.2. Sample Calculations from MVR Energy Analysis Average fan input power (AFP1) for Fan #1 can be found as follows: AFP1 = AED1 × EFFM Where, AED1 = average electrical draw of Fan #1 motor (measured), kW EFFM = nominal fan motor efficiency, 0.95 (95%) The average fan motor draw of Fan #1 was 205.4 kW. Thus, AFP1 = (205.4)(0.95) AFP1 = 195.1 kW Average fan input power (AFP2) for Fan #2 can be found as follows: AFP2 = AED2 × EFFM × EFFVFD Where, AED2 = average electrical draw of Fan #2 motor (measured), kW EFFVFD = VFD efficiency (estimated), 0.95 (95%) The average fan motor draw of Fan #2 was 3.1 kW. Thus, AFP2 = (3.1)(0.95)(0.95) AFP2 = 2.8 kW Equivalent steam energy (ESE) of MVR system: ESE = (AED1 + AED2) × C1/ hs Where, C1 = conversion constant, 3412.2 Btu/kW-hr hs = enthalpy of steam, 1112.5 Btu/lb The enthalpy of steam (hs) is based on the sensible energy needed to raise the temperature water from of 70 ºF to 212 ºF, and the latent energy for the water to boil at sea level (14.696 psia). Thus, ESE = (205.4 + 3.1)(3412.2)/(1112.5) ESE = 639 lb steam/hr
Pacific Gas and Electric Company Emerging Technologies Program
MVR Creamery Energy Analysis BASE
22
Steam economy (SE) of MVR system: SE = water evaporation rate / ESE SE = (40,234 lb water/hr)/(639 lb steam/hr) SE = 62.9 lb water/lb steam

Pacific Gas and Electric Company Emerging Technologies Program
MVR Creamery Energy Analysis BASE
23
7.3. Graphs of Data Recorded During MVR Monitoring
Fan #1 Inlet and Outlet Temperatures
60
70
80
90
100
110
120
130
140
150
160
1/4/0812:00 AM
1/5/0812:00 AM
1/6/0812:00 AM
1/7/0812:00 AM
1/8/0812:00 AM
1/9/0812:00 AM
1/10/0812:00 AM
1/11/0812:00 AM
1/12/0812:00 AM
Tem
pera
ture
(F)
Inlet Outlet
Fan #1 Inlet and Outlet Pressures
0
2
4
6
8
10
12
14
16
1/4/0812:00 AM
1/5/0812:00 AM
1/6/0812:00 AM
1/7/0812:00 AM
1/8/0812:00 AM
1/9/0812:00 AM
1/10/0812:00 AM
1/11/0812:00 AM
1/12/0812:00 AM
Pres
sure
(psia
)
Inlet Outlet

Pacific Gas and Electric Company Emerging Technologies Program
MVR Creamery Energy Analysis BASE
24
Fan #2 Inlet and Outlet Temperatures
60
70
80
90
100
110
120
130
140
150
160
1/4/0812:00 AM
1/5/0812:00 AM
1/6/0812:00 AM
1/7/0812:00 AM
1/8/0812:00 AM
1/9/0812:00 AM
1/10/0812:00 AM
1/11/0812:00 AM
1/12/0812:00 AM
Tem
pera
ture
(F)
Inlet Outlet
Fan #2 Inlet and Outlet Pressures
0
2
4
6
8
10
12
14
16
1/4/0812:00 AM
1/5/0812:00 AM
1/6/0812:00 AM
1/7/0812:00 AM
1/8/0812:00 AM
1/9/0812:00 AM
1/10/0812:00 AM
1/11/0812:00 AM
1/12/0812:00 AM
Pres
sure
(psia
)
Inlet Outlet

Pacific Gas and Electric Company Emerging Technologies Program
MVR Creamery Energy Analysis BASE
25
Fan #1 and 2 Operating Pressures Over 24 Hour Period
1.61.82.02.22.42.62.83.03.23.43.6
1/4/08 12:00 P
M
1/4/08 2:00
PM
1/4/08 4:00
PM
1/4/08 6:00
PM
1/4/08 8:00
PM
1/4/08 10:00 P
M
1/5/08 12:00 A
M
1/5/08 2:00
AM
1/5/08 4:00
AM
1/5/08 6:00
AM
1/5/08 8:00
AM
1/5/08 10:00 A
M
Pres
sure
(psia
)
Fan 1 InletFan 1 OutletFan 2 InletFan 2 Outlet
Fan Motor Power Draw
0
50
100
150
200
250
300
1/4/0812:00 AM
1/5/0812:00 AM
1/6/0812:00 AM
1/7/0812:00 AM
1/8/0812:00 AM
1/9/0812:00 AM
1/10/0812:00 AM
1/11/0812:00 AM
1/12/0812:00 AM
Pow
er D
raw
(kW
Fan #1 Fan #2