pacific gas and electric company® - nrc
TRANSCRIPT

Pacific Gas andElectric Company® James R. Becker Diablo Canyon Power Plant
Site Vice President Mail Code 104/5/601P 0. Box 56
August 2, 2010 Avila Beach, CA 93424
805.545.3462Internal: 691.3462PG&E Letter DCL-10-082 Fax: 805.545.6445
U.S. Nuclear Regulatory Commission11555 Rockville PikeRockville, MD 20852
Docket No. 50-275, OL-DPR-80Docket No. 50-323, OL-DPR-82Diablo Canyon Units 1 and 2Response to NRC Letter dated July 6, 2010, Request for Additional Information forthe Applicant's Environmental Report - Operating License Renewal Stage
Dear Commissioners and Staff:
By letter dated November 23, 2009, Pacific Gas and Electric Company (PG&E)submitted an application to the U. S. Nuclear Regulatory Commission (NRC) for therenewal of Facility Operating Licenses DPR-80 and DPR-82, for Diablo CanyonPower Plant (DCPP) Units 1 and 2, respectively. The application included thelicense renewal application (LRA), and Applicant's Environmental Report -
Operating License Renewal Stage.
By letter dated July 6, 2010, the NRC staff requested additional information neededto continue their review of the DCPP LRA. PG&E's response to the request foradditional information is included in Enclosure 1. Provided in Enclosure 2 is Countyof San Luis Obispo Allocation of Unitary Tax Revenue from PG&E Power PlantProperty Tax Bills for Fiscal Years 2007/08-2009/10.
PG&E makes no regulatory commitments (as defined in NEI 99-04) in this letter.
If you have any questions regarding this response, please contactMr. Terence L. Grebel, License Renewal Project Manager, at (805) 545-4160.
I declare under penalty of perjury that the foregoing is true and correct.
Executed on August 2, 2010.
Sinc rýely,
James c k eprr
A member of the STARS (Strategic Teaming and Resource Sharing) Alliance
Callaway * Comanche Peak • Diablo Canyon ° Palo Verde * San Onofre * South Texas Project * Wolf Creek W-•

Document Control DeskAugust 2, 2010Page 2
PG&E Letter DCL-10-082
pns/50328355Enclosurescc: Diablo Distributioncc/enc: Elmo E. Collins, NRC Region IV Regional Administrator
Michael S. Peck, NRC Senior Resident InspectorAndrew L. Stuyvenberg, NRC Environmental Project Manager,
License RenewalAlan B. Wang, NRC Project Manager, Office of Nuclear Reactor Regulation
A member of the STARS (Strategic Teaming and Resource Sharing) Alliance
Callaway * Comanche Peak * Diablo Canyon * Palo Verde * San Onofre e South Texas Project o Wolf Creek
Enclosure 1PG&E Letter DCL-10-082
Page 1 of 41
PG&E Response to NRC Letter dated July 6, 2010Request for Additional Information for the Applicant's
Environmental Report - Operating License Renewal Stage
Archaeological and Historic Resources RAI #1
Please provide the updated 2010 file search results that supplement the culturalresources overview prepared by Price and Trumbly (2009), including any updates toAppendix C tables and maps.
PG&E Response to Archaeological and Historic Resources RAI #1
The following tables provide a supplementary bibliography and site record summarythat are derived from the 2010 updated records search. Table 1 lists documentsassociated with cultural resources located on the Diablo Canyon Power Plant(DCPP) lands. Table 2 lists cultural resource sites identified within and near theDCPP lands and transmission corridors. The records search was completed byFar Western Anthropological Group in January and February of 2010. The studyarea lies within San Luis Obispo, Monterey, Fresno, Kings, and Kern counties.Records searches were therefore conducted at various California HistoricalResources Information System facilities including the Northwest Information Centerat Sonoma State University; the Southern San Joaquin Valley Information Center atCalifornia State University, Bakersfield; and the Central Coastal Information Centerat the University of California, Santa Barbara.

Enclosure 1PG&E Letter DCL-1 0-082
Page 2 of 41
Table 1 - Diablo Historic Properties Management Plan - 2010 Supplemental Bibliography
Date Author Title1951 Pilling, A Surface Archaeology of the Pecho Coast
1975 Hoover, R.L. Notes on Northern Chumash Ecology and Settlement Patterns (E-265)
1978 Greenwood, Surface Survey and Evaluation, SLO-2 at Diablo CanyonR.S.
1978 Greenwood, Background Research Regarding Diablo Canyon and SLO-2R.S.
1978 Greenwood, Recommendations for Cultural Resource Management at Diablo Canyon-- R.S.
1978 Greenwood, Archaeological Assessment of CA-SLO-2, Diablo Canyon, San Luis ObispoR.S. County (E-27)
1980 PG&E Archaeological Resources Management Plan Diablo Canyon Site
1987 Gibson, R.O. Results of Archaeological Surface Survey for the Port San Luis Trail Project,San Luis Obispo County, CA
1991 Jackson, R.J. Working Draft; Action Plan: Development of a Cultural Resourcesand A.G. Management Plan in Support of the Diablo Canyon Natural ResourceCaruso Management and Land Stewardship Program, San Luis Obispo County,
California1993 Wickstrom, B. A Cultural Resources Survey of Portions of Diablo Canyon Nuclear Power
and K. Plant South Property, San Luis Obispo County, CaliforniaTremaine
2006 Denardo, C. Rancho Canada de los Osos y Pecho y Islay Prehistoric Archaeological Districtand Texier, B. Nomination, San Luis Obsipo County, California
2009 Price, B.A. and Cultural Resources Overview for the Diablo Relicensing Feasibility Study, SanM. Trumbly Luis Obispo, Monterey, Fresno, Kings, and Kern Counties, California

Enclosure 1PG&E Letter DCL-10-082
Page 3 of 41
Table 2 - Supplemental Site Records Search (March 2010)Have Site Within
P-Number Trinomial Map Record? loom Type*
P-15-13725 CA-KER-07701H Buttonwillow Y Y H
P-15-13726 CA-KER-07702H Multiple Y Y H
P-15-13717 CA-KER-7698H Multiple N Y H
P-40-001137 CA-SLO-1137 Pismo Beach Y P
P-40-001379 CA-SLO-1379 Morro Bay South Y P
P-40-001381 CA-SLO-1381/H Morro Bay South Y Y H
P-40-001468 CA-SLO-1468 Port San Luis Y P
P-40-001469 CA-SLO-1469 Port San Luis Y P
P-40-001470 CA-SLO-1470 Port San Luis Y P
P-40-001509 CA-SLO-1509 Port San Luis Y P
P-40-001744 CA-SLO-1744 Morro Bay South Y P
P-40-002078 .CA-SLO-2078H Templeton Y P
P-40-000215 CA-SLO-215 Morro Bay South Y P
P-40-002393 CA-SLO-2393 Morro Bay South Y P
P-40-002466 CA-SLO-2466 Morro Bay South y Y P
P-40-002569 CA-SLO-2569 Morro Bay South Y P/H
P-40-002570 CA-SLO-2570 Morro Bay South y P
P-40-002571 CA-SLO-2571 Morro Bay South y P
P-40-002572 CA-SLO-2572 Morro Bay South Y P
P-40-002573 CA-SLO-2573 Morro Bay South Y H
P-40-002574 CA-SLO-2574 Morro Bay South Y P
P-40-002592 CA-SLO-2592 Pismo Beach Y H
P-40-002600 CA-SLO-2600 Arroyo Grande NE Y H
P-40-002601 CA-SLO-2601 Arroyo Grande NE Y P
P-40-002602 CA-SLO-2602 Arroyo Grande NE Y P
P-40-002603 CA-SLO-2603 Pismo Beach Y P
P-40-002604 CA-SLO-2604 Pismo Beach Y P
P-40-002606 CA-SLO-2606 Pismo Beach y P
P-40-002615H CA-SLO-2615/H Arroyo Grande NE Y H
P-40-000565 CA-SLO-565 Morro Bay South y P
P-40-000773 CA-SLO-773 Port San Luis Y Y P
P-40-000774 CA-SLO-774 Por-t San Luis N
P-40-000775 CA-SLO-775 Port San Luis Y P
P-40-000945H CA-SLO-945H Morro Bay South Y H

Enclosure 1PG&E Letter DCL-10-082
Page 4 of 41
Table 2 - Supplemental Site Records Search (March 2010) (continued)
Have Site WithinP-Number Trinomial Map Record? loom Type*
P-40-000957 CA-SLO-957 Morro Bay South Y H
P-40-000958 CA-SLO-958 Morro Bay South Y H
P-40-000530 CA-SLO-530 Morro Bay South Y P
P-40-040930 CA-SLO-930 Morro Bay South N H
P-40-041076 CA-SLO-1076 Pismo Beach Y H
P-40-041167 CA-SLO-1167 Morro Bay South Y Y H
P-40-041179 CA-SLO-1179 Templeton Y H
P-40-041216 CA-SLO-41216 Pismo Beach Y H
P-40-041217 CA-SLO-41217 Arroyo Grande NE Y H
P-40-041218 CA-SLO-41218 Arroyo Grande NE Y Y H
P-40-041219 CA-SLO-41219 Arroyo Grande NE Y H
P-40-041221 CA-SLO-41221 Arroyo Grande NE Y H
*P= prehistoric; H=historic

Enclosure 1PG&E Letter DCL-10-082
Page 5 of 41
Archaeological and Historic Resources RAI #2
Has Pacific Gas & Electric (PG&E) observed any change in the rate of coastalerosion in the Diablo Canyon Power Plant (DCPP) discharge cove or elsewhere onthe property since operation of the DCPP cooling system started? If so, pleaseexplain the direction and magnitude of the changes in coastal erosion rates. DoesPG&E monitor for erosion of archaeological sites, and especially for erosion ofhuman burials?
PG&E Response to Archaeological and Historic Resources RAI #2
PG&E has not observed any significant changes in the rate of coastal erosion in theDiablo Canyon Power Plant (DCPP) discharge cove or elsewhere on the propertysince the operation of the DCPP cooling system started. In 2004, a study of PattonCove, commissioned and completed by PG&E, estimated the average rate ofshoreline retreat along the sea cliff at the DCPP property is on the order ofapproximately 0.015 to 0.22 m/yr1 . This estimated rate of coastal erosion isconsistent with a recent U.S. Geological Survey (USGS) study of the Californiacoastline. The USGS study indicates that the average rate of coastal erosion alongthe Central Coast is 0.20 m/yr in the region surrounding the DCPP property2.
Annual photogrammetric surveys of the sea cliff near Patton Cove, completed from2006-2010 in accordance with Special Conditions 4 and 5 of the California CoastalCommission Coastal Development Permit No. A-3-SLO-04-035 for the PG&E drycask storage facility, have not shown significant erosion or accretion of the sea cliffwithin the study area during this time period.3
Procedure EVI.ID2, "CA-SLO-2 Site Management," requires PG&E to completemonitoring at CA-SLO-2. Photo-monitoring stations have been established tomonitor surface activities and any physical changes to site CA-SLO-2. At regularintervals, a PG&E cultural resources specialist or archaeological consultantconducts photographic monitoring. The photos are taken with comparable film,cameras, and lenses to allow adequate evaluation of the site over an extendedperiod of time. Monitoring is performed on foot. The location of eachphoto-monitoring station is shown on a topographic map of site CA-SLO-2, which is
'William Lettis & Associates, Inc.- PG&E Diablo Canyon Power Plant Shoreline Retreat Study Diablo And PattonCoves (2004)2 Hapke, C.J and D. Reid - National Assessment of Shoreline Change Part 4: Historical Coastal Cliff Retreat along
the California Coast (2007)
3 Pacific Gas and Electric Company - ISFSI Slope Stability and Shoreline Erosion Monitoring Annual.Report No. 5(2010)
Enclosure 1PG&E Letter DCL-10-082
Page 6 of 41
on file with the PG&E Land & Environmental Department. Monitoring stations maybe established or eliminated, as necessary, by the cultural resources specialist.Currently, many of the photo-monitoring stations are located in areas where coastalerosion is evident or "slumping" has been observed.
If human remains are encountered during the yearly monitoring, PG&E follows theprocedures set forth in the California State Health and Safety Code Section 7050.5.The code states that the county coroner must be notified of the find immediately andthat there shall be no disturbance of the remains until the coroner has made adetermination of origin and disposition pursuant to Public Resources Code Section5097.98. If the remains are of Native American ancestry, the county coroner willnotify the Native American Heritage Commission, which will identify and notify amost likely descendant (MLD). The MLD has the right, with permission of thelandowner or the authorized representative, to inspect the site of discovery. Onceinspected, the MLD has 48 hours to give recommendations. Theserecommendations may include scientific removal, nondestructive analysis ofremains and/or associated constituents, and reinterment at the location of discoveryor elsewhere. Final disposition of the remains and associated materials aredetermined by the landowner in consultation with the MLD.

Enclosure 1PG&E Letter DCL-10-082
Sheet 7 of 41
Archaeological and Historic Resources RAI #3
Please provide information about two most recent training events forarchaeological awareness for PG&E employees at DCPP. This informationshould include, at a minimum, dates for the training events, the number of PG&Estaff and contractors in attendance, and a description of the material andinstructions provided. Also, please indicate whether any tribal or Staterepresentatives were involved in the training, and if so, how.
PG&E Response to ArchaeoloQical and Historic Resources RAI #3
PG&E's procedure for the protection of CA-SLO-2, does not require training ofstaff on cultural resource awareness. In practice, PG&E does have a culturalresources program in place for training staff for a wide variety of projects (bothon and off of Diablo Canyon Power Plant (DCPP) lands) that utilizes web-basedtraining and provides material for tailboard meetings.
Moreover, all- ground disturbing activities undertaken on DCPP lands arereviewed by the Land Stewardship Committee. The committee, which includes aPG&E cultural resources specialist, is charged with directing land managementpractices on DCPP property. In this capacity, the designated cultural resourcesspecialist provides recommendations for avoiding impacts to cultural resourceson the property and facilitates "tailboard" meetings prior tothe start of grounddisturbing activities.
The tailboards, which are provided on an as-needed basis, raise employee andcontractor awareness of the sensitive cultural resources on the property,emphasize the need to avoid all such resources, discuss standard protectionprotocols, and clearly communicate PG&E's stewardship ethic. Thus, while aformal archaeological awareness training program for employees andcontractors is not currently in place at DCPP, resource protection is achievedthrough active participation in all projects by a PG&E Cultural ResourceSpecialist. The following examples illustrate PG&E's approach tocommunicating pertinent information regarding cultural resources on DCPPlands.
Most recently, a cultural resources tailboard was provided to a DCPP contractortasked with completing a geological reconnaissance of the property. Theproposed investigation involved mapping a specific geologic unit and occasionalcollection of in-situ rock specimens. Prior to the initiation of fieldwork, a PG&Ecultural resources specialist contacted the contract geologist via telephone andemail (June 10, 2010) in order to provide general information on the presence ofarchaeological resources within the DCPP property, notified the contractor ofstrict prohibitions on collection of specimens from within archaeological sites,

Enclosure 1PG&E Letter DCL-10-082
Sheet 8 of 41
and highlighted locations of particular concern without divulging the exactlocation of archaeological resources.
This year PG&E has hosted various events to mark the 25th anniversary ofoperation of Unit 1 at DCPP. The events have provided an opportunity toeducate facility staff on the cultural legacy represented by the resourceslocated on the property. An hour-long presentation was recently provided(May 26, 2010) to approximately 40 DCPP personnel that focused on thehistory of the property, historic and archaeological research undertaken, sitestewardship efforts, and resource awareness. The well-attended presentationemphasized the nonrenewable nature of the cultural resources on the propertyand highlighted PG&E's efforts to protect the sites. Maps depicting the generallocation of resources were used to illustrate the richness of sites within theproperty and to highlight the environments that are most sensitive. In the courseof the presentation, which was followed by a question and answer session, theLand Stewardship Committee's process for assessing DCPP ground disturbingactivities and standard protection measures were discussed.

Enclosure 1PG&E Letter DCL-10-082
Sheet 9 of 41
Archaeological and Historic Resources RAI #4
During the site audit, NRC staff noted that archaeological surveys were completedfor placement of emergency sirens. In several cases, intact archaeological sites arelocated immediately adjacent to the poles (pole location only was excavated). DoesPG&E or its contractors perform additional archaeological work in pole maintenanceor replacement scenarios? What procedures are in place to consistently treatarchaeological resources previously identified at siren locations?
PG&E Response to Archaeological and Historic Resources RAI #4
Currently the only procedure in place at Diablo Canyon Power Plant (DCPP) toreview cultural resources is EV1 .ID2, "CA-SLO-2 Site Management," which focuseson the protection of CA-SLO-2. EVI.lD2 states:
4.2 Planned CA-SLO-2 Site Maintenance Activities and New Projects
The following steps shall be followed to initiate planned CA-SLO-2 siteactivities or projects. This includes the clearing of brush surrounding theroadways as well as any roadway surface treatments, erosion repairs, andmaintenance work to structures in the area.
4.2.1 The requestor shall write a clear, concise description of theproposed activity, including location, and forward to the DCPPdirector or designee in charge of CA-SLO-2.
4.2.2 The DCPP director or designee in charge of CA-SLO-2 shalldetermine if the proposed activity is acceptable under the ARMP,based on the recommendation of the company cultural resourcesspecialist.
4.2.3 The DCPP director or designee in charge of CA-SLO-2 shallpromptly coordinate any required submittals and agency contacts,provide the activity proposer with written confirmation or denial ofthe proposed activity, and assign personnel to coordinate areamaintenance within CA-SLO-2.
4.2.4 The cultural resources specialist shall determine whether theproposed activity requires monitoring by cultural resourcespersonnel and shall advise the manager of such need.

Enclosure 1PG&E Letter DCL-10-082
Sheet 10 of 41
Additional cultural resources reviews may be required if PG&E seeks to obtainpermits, approvals, or licenses from county, state or federal agencies. As notedabove in response to Request for Additional Information #3, all projects on DCPPlands are screened by the Land Stewardship Committee to coordinate resourceprotection measures. Past archaeological studies performed on the DCPP propertyform the basis for assessing potential impacts to archaeological resources. Thesestudies are referenced to determine the extent 6f past pedestrian surveys, thespatial extent of resources, and the need for further archaeological work. PG&E hasan on-call contract in place for completing archaeological investigations andmonitoring on short notice. As such, previously identified archaeological resourcesare considered in the course of planning all ground disturbing projects, includingpole maintenance and replacement activities. Based on this assessment,monitoring and/or mitigation measure may be proposed and implemented asappropriate.
\

Enclosure 1PG&E Letter DCL-10-082
Sheet 11 of 41
Archaeological-and Historic Resources RAI #5
Please provide the total acres and percent of the PG&E lands archaeologicallysurveyed (indicate any overlap in survey boundaries, so acreage is notoverestimated in calculating the percent). Please provide the same (total acres andpercent) for all transmission line right-of-ways.
PG&E Response to Archaeological and Historic Resources RAI #5
The table below provides a summary of the survey coverage on PG&E's DiabloCanyon Power Plant (DCPP) lands, which includes the Morrow, Gates, and Midwaytransmission corridor rights-of-way (ROW). The DCPP property (including Parcel P)covers approximately 8,782 acres of which roughly 28 percent of the land has beensurveyed for cultural resources. Parcel P, where the vast majority of developmentfor the plant has occurred, has been nearly completely surveyed. Of thetransmission corridors, the Morro ROW has received the most survey coverage atjust over 21 percent of the total area, with the Midway ROW trailing slightly behindwith approximately 19.4 percent coverage. Only a small portion of the Gates ROWhas been surveyed (approximately 1.5 percent).
Table 1 - Cultural Resource Survey CoverageArea Total Total Acreage Percent Previously
Acreage Previously Surveyed SurveyedPG&E Property* (minus Parcel P) 8042.46 2243.03 27.89%Parcel P 739.92 733.15 99.09%Morro ROW (Outside PG&E 51.30 10.78 21.01%Property)Gates ROW (Outside PG&E 3298.61 49.02 1.49%Property)Midway ROW (Outside PG&E 4000.59 777.46 19.43%Property)Total** 16132.89 3813.44 23.64%*Generalized property extent
**Note: The areas used above have been cropped so that there is no overlap between them. For the purpose of this exercise, the
transmission right-of-way areas stop at the point where they touch the PG&E property boundary.

Enclosure 1PG&E Letter DCL-1 0-082
Sheet 12 of 41
Socioeconomics RAI #1
Please explain why tax payments from DCPP to San Luis Obispo County haverisen from $20.7 million in 2007-2008 to $22.3 million in 2008-2009 and $24.5million in 2009-2010 (see March 2010, 'The Local Economic Impacts ofDecommissioning the Diablo Canyon Power Plant'). Is this roughly $2 millionannual increase going to continue? What future trend does PG&E anticipate andwhy?
PG&E Response to Socioeconomics RAI #1
Tax payments are based on the company's fair market value assessed by theState of California Board of Equalization (BOE). The BOE determines fairmarket value by considering market conditions, use of the property, incomegenerated by property, replacement costs, investments in the property,regulatory climate, depreciation, and other factors.
The economic report anticipates that there will continue to be increases in taxpayments because of the on-going capital maintenance program and increasesin energy demand throughout the service territory. Recent capital projects atDCPP include the steam generator replacement project, reactor vessel headreplacement, and the independent spent fuel storage installation project (drycask storage); all of which add significant value to the unitary value determinedby the BOE as well as unitary tax allocations by San Luis Obispo County. On-going capital maintenance will be determined by on-going operations, which inturn affect valuation.

Enclosure 1PG&E Letter DCL-10-082
Sheet 13 of 41
Socioeconomics RAI #2
According to the Environmental Report (ER), annual property taxes paid to San LuisObispo County are based on the value of DCPP (see ER Section 2.7, Taxes).According to the March 2010 report to the California Public Utilities Commission,"The Local Economic Impacts of Decommissioning the Diablo Canyon PowerPlant," DCPP's assessed value is based on energy production capability ratherthan plant assets (see page 19). How is the assessed value determined? If thereare different ways of assessing the value or taxing the value of DCPP, pleasedescribe these methods.
PG&E Response to Socioeconomics RAI #2
Ad Valorem Taxes:
PG&E is a centrally assessed company under the jurisdiction of the State ofCalifornia Board of Equalization (BOE). Under current law, PG&E is notprotected by Proposition 13 and is annually reappraised at fair market value forall its properties that are owned or used as of 12:01am on Jaunary 1st.
Article XIII, Section 19 of the California State Constitution, provides the BOE theauthority to annually assess properties for companies transmitting or selling gasand electricity. Property taxes are levied and collected in the same manner ascounty assessed properties.
Property taxes are based on a fiscal year period beginning July 1st throughJune 30th. The calendar year property tax expense amount is determined byusing two fiscal period property tax amounts. For example, the 2010 calendaryear property tax is comprised of one half of fiscal year 2009-2010 and one halfof fiscal year 2010-2011.
Assessment:
PG&E is appraised annually as a unit without regard to the component parts thatmake up the unit. The method of valuation used by the BOE is referred to as theunit concept method. Currently there are two indicators of value developed bythe BOE in determining company assessments; they are the Historical Cost LessDepreciation (HCLD) indicator and the Capitalized Earnings Ability (CEA)indicator.

Enclosure 1PG&E Letter DCL-10-082
Sheet 14 of 41
1. The HCLD indicator, with some modifications, approximates rate baseand includes the historical or original acquisition cost of all property lessnontaxable items and property assessed elsewhere. This results in thetaxable historical cost. The taxable historical cost is then reduced for theregulatory accounting depreciation of the taxable property. This results inthe assessable HCLD. The value of possessory interest, franchisepayments, and/or leased properties are added together to arrive at thefinal HCLD value indicator.
2. The CEA indicator, under optimal conditions, should approximate HCLD.The CEA indicator estimates future annual income and converts thisincome into a value estimate by means of a capitalization rate. PropertyTax Rule 8 excludes property taxes, income taxes, and capital recoveryfrom the definition of gross outgo in the computation of capitalizedearnings values.
Since the company is a closely regulated public utility, the primary indicator usedby the BOE is the HCLD. However, both indicators are-considered and blendedto become the total value the BOE sets for the company.
Property Tax Drivers:
Five factors drive property taxes
1. The first factor is plant growth. Typically, the more investment the higherthe property tax.
2. The second factor is the tax rate imposed within each county. The trendover the last few years has been for the tax rate to grow within eachcounty. Larger populations in each county have resulted in more demandfor services/programs.
3. The third factor is special assessments approved by local governments.These fees typically- represent direct charges/fees imposed by newlyformed assessment districts. The fees have been growing in number anddollar amount.
4. The fourth factor is revenues. Taxable operating revenues are converted
to values.
5. The fifth factor is the valuation methodology used by the state.
Enclosure 1PG&E Letter DCL-10-082
Sheet 15 of 41
Allocation:
PG&E's unitary assessments other than land and some directly assignedproperties are allocated to the counties using an allocation factor that is basedon reproduction cost new less depreciation (RCNLD). RCNLD is an estimate ofthe current cost to replace the existing property with a new property that is anexact replica. The allocation factor is developed by the BOE and applied to theRCNLD of each piece of property to determine its allocated assessment. Theseassessments are then categorized by improvements and personal property andprovided to the counties where the assets are located. The county accepts theassessments and applies their individual county tax rate and later bills PG&E.

Enclosure 1PG&E Letter DCL-10-082
Sheet 16 of 41
Socioeconomics RAI #3
Please indicate whether the breakdown of the 2009/2010 Unitary Tax Revenueshown in Figure 4 and discussed on pages 17 to 19 in the March 2010 report,"The Local Economic Impacts of Decommissioning the Diablo Canyon PowerPlant" (provided by DCPP staff to NRC staff at the site audit) is an' accuraterepresentation of the distribution of tax revenues from DCPP to the San LuisObispo County General Fund, San Luis Coastal Unified School District, and PortSan Luis Harbor District. Can the percent distributions identified in this report beapplied for each of the tax years discussed in the DCPP ER?
PG&E Response to Socioeconomics RAI #3
The breakdown of the 2009-2010 Unitary Tax Revenue is based on PG&E'sactual 2009-2010 tax bill from San Luis Obispo County.
The values set by the State of.California Board of Equalization (BOE) are usedby county governments to levy local property taxes and determine that annualtax allocation to local entities. San Luis Obispo County allocates those taxpayments based on a unitary factor in accordance with California Revenue andTax Code 100. Based on historical unitary values and unitary factors, it isreasonable to assume the percent distributions could be applied for each of thetax years discussed in the Diablo Canyon Power Plant (DCPP) EnvironmentalReport. Included in Enclosure 2, is a copy of the unitary factors and taxallocations to different governmental and quasi-governmental entities for the2007-2008, 2008-2009, and 2009-2010 tax years. The state through the BOEestablishes the value of the asset, in this case DCPP. In turn, the county appliesits formula to distribute tax revenues to appropriate jurisdictions.
The code is available at the following web address: http://info.sen.ca.-ov/cai-bin/displavcode?section=rtc&ciroup=00001 -01 000&file=1 00-100.95

Enclosure 1PG&E Letter DCL-10-082
Sheet 17 of 41
Severe Accident Mitigation Alternatives RAI #8
Regulatory Guide 1.23, Revision 1 states that 'Whenever possible, windmeasurements should be made at locations and heights that avoid airflowmodifications by obstructions such as large structures, trees, and nearby terrain.The sensors should be located over level, open terrain at a distance of at least10 times the height of any nearby obstruction if the height of the obstructionexceeds one-half the height of the wind measurement." During the DiabloCanyon Site Audit, the NRC meteorology reviewer noted that the onsitemeteorological tower is within 250 feet of the Simulator building. Given that thebuilding height is about 35 feet - approximately the same elevation as the 10meter wind speed sensor - its proximity to the meteorological tower couldinfluence the wind speed and direction data used in the SAMA analysis. Themeteorological tower is also located within an asphalt parking lot, which couldpotentially affect the stability classification under certain meteorologicalconditions (e.g., sunny days with low windspeed). Justify that the meteorologicaldata used in the SAMA analysis (collected at 10 meters) are high quality datarepresentative of the Diablo Canyon site and are not adversely affected by thesiting of the meteorological tower.
PG&E Response to Severe Accident Mitigation Alternatives RAI #8
Effect of the Simulator Building on Wind Direction and Wind Speed
Building and Tower Locations
The location of the primary meteorological tower and the simulator building areshown in Figure 1. The primary meteorological tower was installed in 1967; thesimulator building was constructed over the period beginning in September 1983with the interior portions of the building completed in mid-1985.
The distance between the northwest corner of the simulator building and themeteorological tower is approximately 203 ft.; the distance between thesouthwest corner of the simulator building and the meteorological tower is 262 ft.Assuming the simulator building 35 ft. tall, the distance between the primarymeteorological tower and the simulator building is less than 10 building heights.

Enclosure 1PG&E Letter DCL-1 0-082
Sheet 18 of 41
Figure I - Location of the primary meteorological tower (black dot, center of picture) andthe simulator building. The map is from Google and is aligned to true north (Top ofPicture). The simulator building, the inverse L-shaped building complex, was constructedin the early 1980s directly east of the primary meteorological tower.
Wind rose plots, which show the frequency of occurrence of the hourly winddirections (wind blowing from) and the frequency of occurrence of wind speeds incertain predefined bins using telescoping bars, are prepared. These plots coverthe period before and after the simulator building is constructed. The plots arereviewed to determine if there are any obvious changes before and after buildingconstruction.

Enclosure 1PG&E Letter DCL-10-082
Sheet 19 of 41
Wind Rose Presentations
The primary met tower has wind speed and wind direction instrumentation at the10-meter level and the 76-meter level. Due to the proximity and the dimensionsof the simulator building, the 10-meter level would be the level affected by theconstruction. To analyze the potential affect on the wind rose, wind rose plots ofthe 10-meter wind speed and wind direction are prepared. The period of recordfor the primary met tower begins in May 1973; therefore, the first year ofcomplete data (i.e. January-December) is 1974. Individual wind rose based on16-cardinal wind directions (22.5 degree sectors) for each year from 1974through 1986 are presented; combined two-year wind roses based on 36-winddirections (10-degree sectors) are presented for 1981-82 (before) and (1985-86(after).
Wind Rose Description
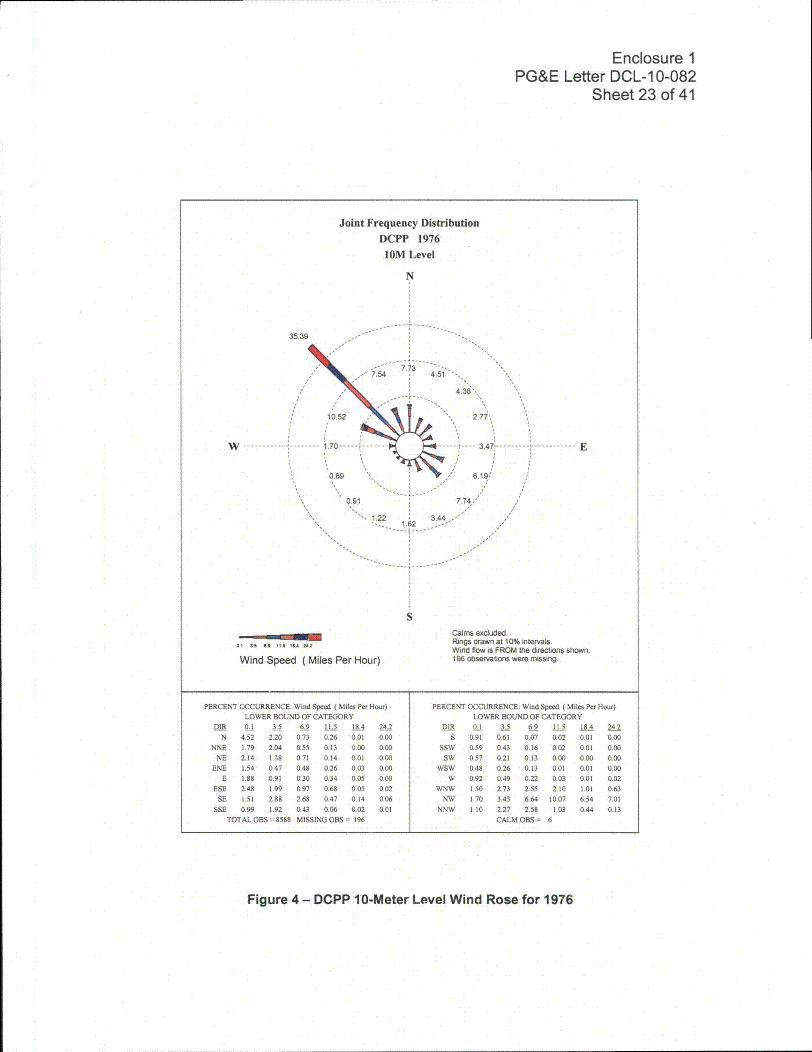
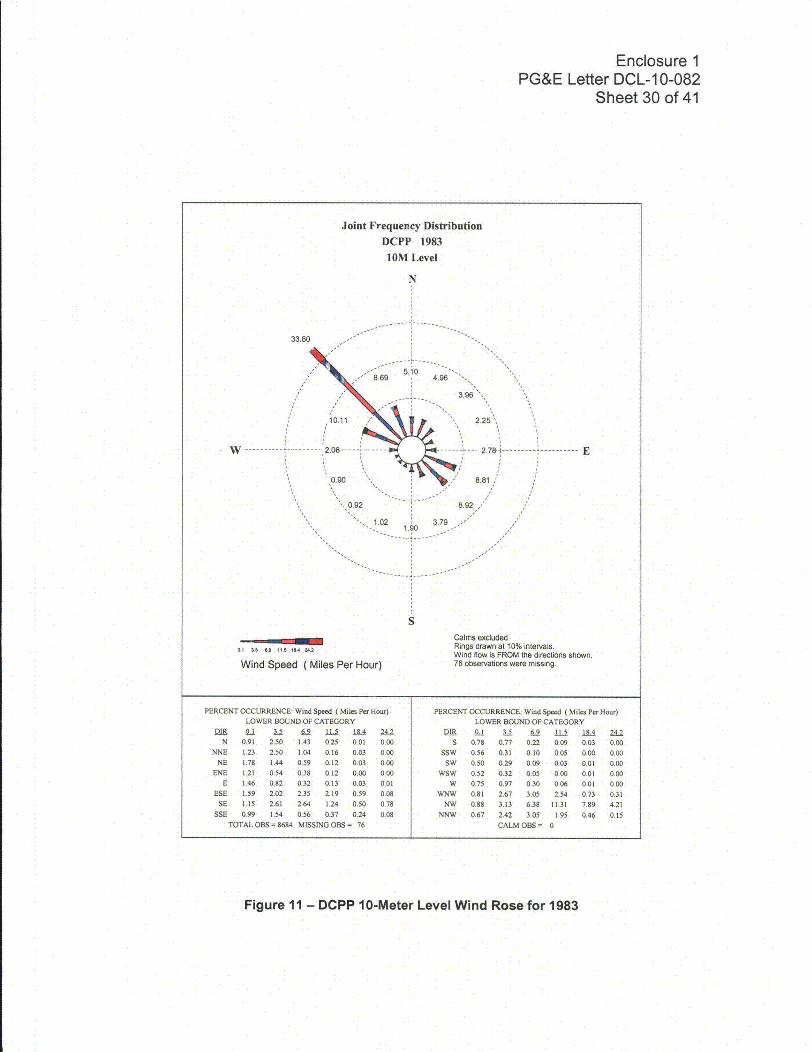
The wind rose is the method of graphically presenting the wind conditions,direction, and speed, over a period of time at a specific location. To create awind rose, average wind direction and wind speed values are logged at a site, atshort intervals, over a period of time (e.g., one week, one month, or longer). Thecollected wind data are then sorted by wind direction so that the percentage oftime that the wind was blowing from each direction can be determined. Typicallythe wind direction data is sorted into 12 or 16 equal arc segments, 30 or22.5 degrees in each segment, in preparation for plotting a circular graph inwhich the radius of each of the segments represents the percentage of time thatthe wind blew from each of the twelve 30 degree direction segments. Within thewind rose radius, the telescoping bar indicates the frequency of occurrence ofwind speed in a predefined bin. Figure 2 presents the wind rose for the 10-meterwind speed and wind direction data collected at the primary meteorological towersite for calendar year 1974. There are 16 telescoping bars emanating from thecenter of the circle. The length of the bar is proportional to the frequency of winddirections blowing from that 22.5 degree sector. Each bar is telescoping witheach segment of the bar representing the frequency of occurrence of wind speedin each of six wind speed bins. The number at the end of each bar representsthe percent of time within the year the wind direction is blowing from the directionindicated. The table at the bottom of the wind rose provides a numeric value tothe frequency of occurrence of wind speeds in each bin. In Figure 2,34.22 percent of the time in 1974 the wind direction was blowing from thenorthwest and 3.36 percent of the time the wind was blowing from the east.
Enclosure 1PG&E Letter DCL-10-082
Sheet 20 of 41
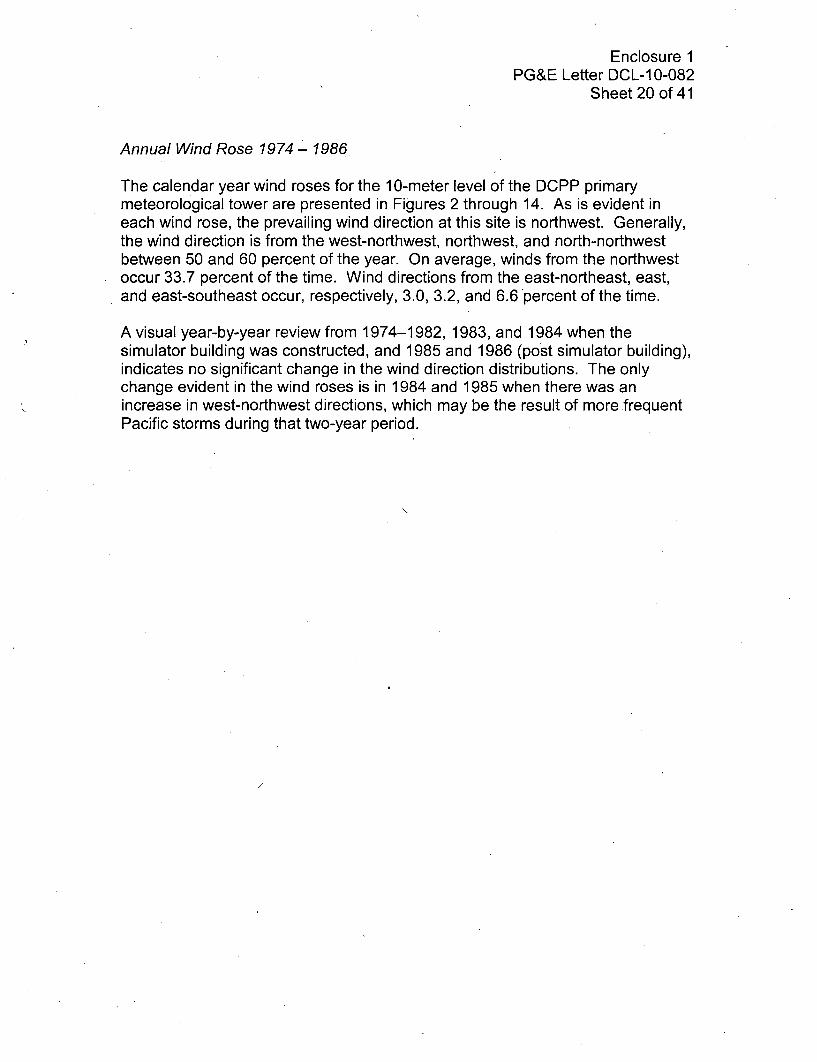
Annual Wind Rose 1974 - 1986
The calendar year wind roses for the 10-meter level of the DCPP primarymeteorological tower are presented in Figures 2 through 14. As is evident ineach wind rose, the prevailing wind direction at this site is northwest. Generally,the wind direction is from the west-northwest, northwest, and north-northwestbetween 50 and 60 percent of the year. On average, winds from the northwestoccur 33.7 percent of the time. Wind directions from the east-northeast, east,and east-southeast occur, respectively, 3.0, 3.2, and 6.6 percent of the time.
A visual year-by-year review from 1974-1982, 1983, and 1984 when thesimulator building was constructed, and 1985 and 1986 (post simulator building),indicates no significant change in the wind direction distributions. The onlychange evident in the wind roses is in 1984 and 1985 when there was anincrease in west-northwest directions, which may be the result of more frequentPacific storms during that two-year period.
K

Enclosure 1PG&E Letter DCL-1 0-082
Sheet 21 of 41
3533
Joint Frequency Distribution
DCPP 1974
10M Level
N
35.33
W--------------
- 5.75 --9.92 4.51
4. 18
9.18
1.74 ----
3.12',
---- .... 3.00'- E
0.l=.81 *, . y, 7
1.04 8.43.'
" 1.08 3.44 ,
.16,
S
Wind Speed (Miles Per Hour)
Calms excluded.Rings drawn at 10% intervals.Wind flow is FROM the directions shown.66 observations were missing.
PERCENT OCCURRENCE: Wind Speed (Miles Per Hour)LOWER BOUND OF CATEGORY
DAR 9-1 J 6.9 115 184 24.2N 114 2.35 L.73 0,51 0.02 0.01
NNE 1t25 2.02 0.99 0.23 o0o 0.00NE 1,44 1.52 0.74 0.45 0.03 0.00
ENE 1 44 0.75 0.56 0.36 0.01 0.00E 1.54 1.08 0.21 0.15 0.02 0.00
ESE L.64 2.38 1.37 1.17 0.47 0.11SE 1.29 3.45 2.27 1.05 0.17 0.21
SSE 0.82 1.61 0.41 0.33 0.11 0.15TOTAL OBS = 8694 MISSING OBS = 66
PERCENT OCCURRENCE: Wind Speed ( Miles Per Hour)LOWER BOUND OF CATEGORY
DIR U1 11 U. 115 1842 24.2S 0.66 059 0.07 0.02 0.00 0.00
SSW 069 0.29 0.06 0.05 0.00 0.00SW 0.75 0.24 0.02 0.02 0.00 0,00
WSW 0.43 0.31 0.06 0.01 0.00 0.00W 0.97 0.48 0.25 0.02 0.01 0.00
WNW 1.54 2.77 2.46 1.58 0.49 0.33NW 1.36 3.80 6.59 10.39 6.99 6.20
NNW 0.83 2.39 2.63 2.44 1.06 0.56CALM OBS = I
Figure 2 - DCPP 10-Meter Level Wind Rose for 1974

Enclosure 1PG&E Letter DCL-10-082
Sheet 22 of 41
Joint Frequency Distribution
DCPP 1975
10M Level
N
34.22
W ----- ----------
&19 512
~ 4.09'
9.91 2.61
140 465,,
.1.29 6.41
1.07 3.882.08
E
S
n.1 3.S Spe ( e PS. e H2o
Wind Speed ( Miles Per Hour)
Calms excluded.Rings drawn at 10% intervals.Wind flow is FROM the directions shown.161 observations were missing.
PERCENT OCCURRENCE: Wind Speed ( Miles Per Hour)LOWER BOUND OF CATEGORY
DIR 0-1 3.5 6.9 115 18.4 242N 1.06 1.97 1.51 0.49 0.08 0.01
NNE L01 2.43 094 0.27 0.00 0.00NE 1.60 1.52 0.87 0.08 0.01 0.00
ENE L08 0.98 0.33 0.20 0.02 0.00E 1.38 1.50 0.35 0.12 0.01 0.00
ESE 1.76 1.63 0.77 0.37 0.12 0.01SE 1.10 2.30 1.50 0.81 0.29 0.40
SSE 0.76 2.00 0.72 0.15 0.10 0.15TOTAL OBS = 8599 MISSING OBS = 161
PERCENT OCCURRENCE: Wind Speed (Miles Per Hour)LOWER BOUND OF CATEGORY
DIR 0.1 3.5 6.9 11.5 184 24.2S 0.84 0.85 0.27 0.10 0.00 0.02
SSW 0.58 0.41 0.06 0.00 0.00 0.02SW 0.66 0.48 0.09 0.02 0.01 0.02
WSW 0.60 0.55 0.16 0.08 0.00 0.00W 0.78 1.20 0.92 0.35 0.02 0.01
WNW 1.13 2.73 2,85 1.92 0.94 0.34NW 1.07 3.44 6.18 10.56 7.34 5.64
NNW 0.87 2.50 3.02 3.35 1.48 0.76CALM OBS = 0
Figure 3 - DCPP 10-Meter Level Wind Rose for 1975
Enclosure 1PG&E Letter DCL-1 0-082
Sheet 23 of 41
Joint Frequency Distribution
DCPP 1976
10M Level
N
35.39
- - -- 7.73 - - - -.54 4.51'
10,52
W ----------- ------ - i o. . .- -----. -
, 0.89 '
4.38',
, 2.7i",
-- --- 3.471 ---------
7 6. 19, '
7.74," ,/
E
0.91
1.22 3.44'- 1.62 _
S
W.1 3Sp ( 1eed (ie PHWind Speed ( Miles Per Hour)
Calms excluded.Rings drawn at 10% intervals.Wind flow is FROM the directions shown,196 observations were missing.
PERCENT OCCURRENCE: Wind Speed (Miles Per Hour)LOWER BOUND OF CATEGORY
IR 0.1 3.5 6.9 115 184 24.2N 4.52 2.20 0.73 0.26 001 0.00
NNE 1.79 2.04 0.55 0.13 0.00 0.00NE 2.14 1.38 0,71 0.14 0.01 0.00
ENE 1.54 0.47 0.48 0.26 0.03 0.00E 1.88 0.91 0.30 0.34 0.05 0.00
ESE 2.48 1.99 0.97 0.68 0.05 0.02SE 1.51 2.88 2.68 0.47 0.14 0.06
SSE 0.99 1.92 0.43 006 0.02 0.01TOTAL OBS =8588 MISSING OBS= 196
PERCENT OCCURRENCE: Wind Speed (Miles Per Hour)LOWER BOUND OF CATEGORY
018 Q-1 21 6L- 115 184 242S 0.91 0,61 0.07 0.02 0.01 0.00
SSW 0.59 0.43 0.16 0.02 0.01 0.00SW 0.57 0.21 0.13 0.00 0.00 0.00
WSW 0.48 0.26 0.13 0.01 0.01 0.00W 0.92 0.49 0.22 0.03 0.01 0.02
WNW 1.50 2.73 2.55 2.10 1.01 0.63NW 1.70 3.43 6.64 10.07 6.54 7.01
NNW 1.10 2.27 2.58 1.03 0.44 0.13CALM OBS = 6
Figure 4 - DCPP 10-Meter Level Wind Rose for 1976

Enclosure 1PG&E Letter DCL-1 0-082
Sheet 24 of 41
Joint Frequency Distribution
DCPP 1977
10M Level
N
W
37.55
-- 5618.46- 4'76-0
11 19
.1 - - - -- - -81--
0.89
0.56 7.5T
1.3 3.20-1.60
.02
3.05
.34
4-. E
Wn1 3.S (M 11. l PeA HrWind Speed ( Miles Per Hour)
Calms excluded.Rings drawn at 10% intervals.Wind flow is FROM the directions shown.201 observations were missing.
PERCENT OCCURRENCE: Wind Speed (Miles Per Hour)LOWER BOUND OF CATEGORY
DE 91 35 k9 11.5 18.4 24.2N 1.61 2.40 1.30 0.30 0.00 0.00
NNE 1.48 2.21 0.96 0.11 0.00 0.00NE 1.38 1.52 0.62 0.05 0.00 0.00
ENE 1.29 0.74 0.41 0.37 0.01 0.00E 1.46 0.90 0.27 0.36 0.06 0.00
ESE 1.85 2.16 1.18 0.90 0.20 0.06SE 1.55 3.28 1.96 0.47 0.26 0.05
SSE 1.07 1.59 0.42 0.06 0.06 0.00TOTAL OBS = 8559 MISSING OBS = 201
PERCENT OCCURRENCE: Wind Speed (Miles Per Hour)LOWER BOUND OF CATEGORY
DIR 0i1 3.5 6.9 11.5 184 242S 0.84 0.71 0.04 0.00 0.01 0.00
SSW 0.64 0.36 0.01 0.01 0.00 0.00SW 0.36 0.18 0.01 0.01 0.00 0.00
WSW 0.55 0.27 0.07 0.00 0.00 0.00W 0.72 0.71 0.27 0.08 0.00 0.02
WNW 1.09 2.86 3.04 2.61 1.19 0.41NW 1.53 4.25 7.57 10.63 7.47 6.10
NNW 1.02 2.62 2.56 1.61 0.42 0.23CALM OBS = 0
Figure 5 - DCPP 10-Meter Level Wind Rose for 1977

Enclosure 1PG&E Letter DCL-10-082
Sheet 25 of 41
Joint Frequency Distribution
DCPP 1978
10M Level
N
30.15
4.68 "
W -------
3,17
.. . --- 3.
7.02
E
1.02 -
X 1.45 4,27-2.60
8.53
S
Wind Speed (Miles Per Hour)
Calms excluded.Rings drawn at 10% intervals.Wind flow is FROM the directions shown.882 observations were missing.
PERCENT OCCURRENCE: Wind Speed ( Miles Per Hour) PERCENT OCCURRENCE: Wind Speed (Miles Per Hour)LOWER BOUND OF CATEGORY LOWER BOUND OF CATEGORY
DIR " j • . 9 1 1 2 DIR 021 U 9 11.5 14 24N 1.31 1.87 1.22 0.42 0.09 0.16 S 0.99 0.90 0.32 0.14 0.13 0.13
NNE 1.35 2.21 0.81 0.18 0.05 0.13 SSW 0.67 0.46 0.27 0.04 0.00 0.01NE 1.76 2.02 0.74 0.10 0.03 0.04 SW 0.63 0.32 0.04 0.03 0.00 0.00
ENE 1.43 0.80 0.65 025 0.03 0.01 WSW 0.48 037 0.11 0.04 0.00 0.00E 1.47 1.07 0.50 0.36 0.06 0.00 W 0.83 0.90 0.36 0.16 0.06 0.01
ESE 1.61 2.01 1.28 1.60 0.46 0.06 WNW 1.28 2.49 3.25 3.22 1.71 0,89SE 1.83 3.60 1.68 0.86 0.46 0.10 NW 1.52 363 5.23 8.72 5,99 5.05
SSE 1.14 1.82 0.79 0.34 0.15 0.03 NNW 0.96 1.90 1.95 1.89 0.69 0.30TOTAL OBS = 7878 MISSING OBS 882 CALM OBS = 0
Figure 6 - DCPP 10-Meter Level Wind Rose for 1978

Enclosure 1PG&E Letter DCL-1 0-082
Sheet 26 of 41
Joint Frequency Distribution
DCPP 1979
1OM Level
N
34.80
3.73
4.26
w ------
2.95',
-- 3,291 --------
10.10
1.50 ----- --- *1- E
0.9
6 ,,, 7.20'
90.77 9,9
1.11 4.53S 1.98 -
S
Wn 3S 6• K ( 16 P rHu
Wind Speed ( Miles Per Hour)
Calms excluded.Rings drawn at 10% intervals.Wind flow is FROM the directions shown.826 observations were missing.
PERCENT OCCURRENCER Wind Speed (Miles Per Hour)LOWER BOUND OF CATEGORY
DO UR 35 0.9 115 hA 242N 1.05 1.53 1.17 0.25 0.01 0.00
NNE 1,17 1.83 0.68 0.05 0.00 9.00NE 2,14 1.47 0.58 0,06 0.00 0.00
ENE 1.71 0.83 0.33 0.08 0.90 0.00E 2.12 0.72 0.24 0t11 0.04 906
ESE 2,34 2.18 1.41 0.95 0.28 0.04SE 1.92 3.87 2.91 0,62 0.13 0.25
SSE 1.26 2.29 0,66 0t16 0.08 0.08TOTAL OBS = 7933 MISSING OBS = 826
PERCENT OCCURRENCE: Wind Speed (Miles Per Hour)LOWER BOUND OF CATEGORY0IR 01 13 6k2 L5 18 242
S 1,07 0.76 0.05 0.03 0.05 0.03SSW 0.73 0.29 0.06 0.03 0.90 0.00
SW 0.47 0.24 0.06 0.00 0.00 0.00WSW 0.63 0.29 0.03 0.01 0.90 0.00
W 0,79 0.52 0.09 0.05 0.05 0.00WNW 1.26 2.79 2.36 2.02 1.30 0.38
NW 1.36 4.00 5.32 10.89 7.73 5.51NNW 1.06 2.14 2.71 2.26 0.74 0.21
CALM OBS = 0
Figure 7 - DCPP 10-Meter Wind Rose for 1979

Enclosure 1PG&E Letter DCL-1 0-082
Sheet 27 of 41
Joint Frequency Distribution
DCPP 1980
10M Level
N
37.91
-
w------
43966
8.39
-- 1.46--
1'.14
4.43,
2.97
- ----.. 3.22 -
6.38
8.49
E
0.92
1.15 0
S
_.3.82-
ini Sp•eed ' i' e P HWind Speed ( Miles Per Hour)
Calms excluded.Rings drawn at 10% intervals.Wind flow is FROM tMe directions shown.338 observations were missing.
PERCENT OCCURRENCE: Wind Speed (Miles Per Hour)LOWER BOUND OF CATEGORY
DIR Q 1 35 § 9 LS 184 242N 1.10 2.05 0.98 0.25 0.01 0.00
NNE 1.17 2.04 0.46 0.05 0.00 0.00NE 1.98 1,48 0.88 0.07 0.02 0.00
ENE 1.46 0.84 0.51 0.17 0.00 0.00E 1.86 0.95 0.27 0.12 0.02 0.00
ESE 2.00 2.00 1.02 1.07 0.30 0.00SE 2.01 3.00 2.25 0.70 0.40 0.13
SSE 1.02 2.18 0.44 0.12 0.07 0.00TOTAL OBS = 8446 MISSING OBS 338
PERCENT OCCURRENCE: Wind Speed (Miles Per Hour)LOWER BOUND OF CATEGORY
DIR 9-1 i U1 1L1 114 242S 1.09 0.73 0.07 0.11 0.OO 0.00
SSW 0.64 0.32 0.12 0.07 0.00 0.00SW 0.59 0,22 0.08 0.02 0.00 0.00
WSW 0.72 0.37 0.05 0.00 0.00 0.00W 0.82 0.47 0.11 0.05 0.01 0.00
WNW 1.14 2.49 2.21 1.55 0.69 0.32NW 1.26 3.86 7.35 11.19 8.68 5.58
NNW 0.98 2.65 3.13 2.05 0.53 0.26CALM OBS = 0
Figure 8 - DCPP 10-Meter Level Wind Rose for 1980

Enclosure 1PG&E Letter DCL-1 0-082
Sheet 28 of 41
Joint Frequency Distribution
DCPP 1981
IOM Level
N
37.02
10.23 ? -•.•22.
8.38
3.95,
" 23.17
... ----. 2.79 -W E
0,79 653
8.22'1.18
1.13 4.05.'-- 1.80 -...
S
W n 3.6 6 ( l Per 18.4 .2o
Wind Speed ( Miles Per Hour)
Calms excluded,Rings drawn at 10% intervals.Wind flow is FROM the directions shown.385 observations were missing.
PERCENT OCCURRENCE: Wind Speed (Miles Per Hour)LOWER BOUND OF CATEGORY
DIR 01 3.5 6.9 15 184 24.2N 1.07 2.33 1.13 0.38 0.04 0.00
NNE 1.42 1.92 0.78 0,10 0.00 0.00NE 1.89 1.53 0.47 0.07 0.00 0.00
ENE 1.54 0.87 0.42 0.25 0.04 0.01E 1.60 0.64 0.36 0.18 0.00 0.01
ESE 1.78 205 1.17 1.31 0.22 0.00SE 1.65 3.50 2.29 0.60 0.11 0.07
SSE 0.87 2.28 0.61 0.17 0.11 0,01TOTAL OBS = 8375 MISSING OBS = 385
PERCENT OCCURRENCE: Wind Speed (Miles Per Hour)LOWER BOUND OF CATEGORY
018 0. 3.3 1 .1 .Ut 114 241S 0.85 0.87 0.06 002 0.00 0.00
SSW 0.69 0.30 0.07 0.07 0.00 0.00SW 0.74 0.41 0.02 0.01 0.00 0.00
WSW 0.53 0.22 0.05 0.00 0.00 0.00W 0.88 0.62 0.06 0.05 0.00 0.00
WNW 1.27 303 2.30 1.25 0.42 0.11NW 1.37 4.53 7,20 11.49 7.11 5.33
NNW 1.05 3.08 3.25 2.03 0.70 0.12CALM OBS = I
Figure 9 - DCPP 10-Meter Level Wind Rose for 1981

Enclosure 1PG&E Letter DCL-1 0-082
Sheet 29 of 41
Joint Frequency Distribution
DCPP 1982
10M Level
N
34.70
4.51-8.26 4.15
4.70
W ------------1.76 8....
4.13',
3.71 K
l'----------- E
. .^1.16
0.83
1.04 3.672.09
6.72,"
9.46
S
Win 3.S ee (8e Per Hour)
Wind Speed ( Miles Per Hour)
Calms excluded.Rings drawn at 10% intervals.Wind flow is FROM the directions shown.199 observations were missing.
PERCENT OCCURRENCE: Wind Speed (Miles Per Hour)LOWER BOUND OF CATEGORY
DIR 9,1 3.5 69 115 14 242N 085 2.06 1.43 0.18 0.00 000
NNE 114 187 1.05 0.08 0.00 0.00NE 1.90 168 1.00 0.11 000 0.00
ENE 2.06 0.93 0.75 0.40 0.00 0.00E 2.21 0.97 0.29 0.22 0.02 0.00
ESE 1.78 2.27 1.16 1,13 0.32 0.07SE 1.41 3.96 3107 0,71 0.20 01t
SSE 1.03 2.03 0.40 0.13 005 0.03TOTAL OBS = 8561 MISSING OBS = 199
PERCENT OCCURRENCE: Wind Speed (Miles Per Hour)LOWER BOUND OF CATEGORY
DIR 0J 35 69 11 4 24S 0.93 0.77 0.15 0.22 0.01 0.00
SSW 0.54 0.30 0.09 0.11 0.00 0.00SW 050 0.23 0.07 002 0.00 0.00
WSW 0.61 0.29 0.11 0,14 0.00 0.01W 0.75 0.70 0.16 0.14 0.01 0.00
WNW 1.33 2.79 2.21 1.82 0.74 0.22NW 1.14 3.94 6.70 10.19 7.81 4.92
NNW 0.86 1.94 2.86 2.04 0.41 0.14CALM OBS = 0
Figure 10 - DCPP 10-Meter Level Wind Rose for 1982
Enclosure 1PG&E Letter DCL-1 0-082
Sheet 30 of 41
33.8
W ---------- I .....
Joint Frequency DistributionDCPP 1983
10M Level
N
0
5.108.69 4.96
3.96
10.11 2.25
-- -2.08 -- --- - - - - - - -2781-
0.90 8.81
E
0.92
"- 1.028.92"
3,79 "1.90
S
Wind Speed ( Miles Per Hour)
Calms excluded.Rings drawn at 10% intervals.Wind flow is FROM the directions shown.76 observations were missing.
PERCENT OCCURRENCE: Wind Speed ( Miles Per How)
LOWER BOUND OF CATEGORY
D15 0.1 5-5 §9 12.5 18.4 242N 0.91 2.50 1.43 0.25 0.01 0.00
NNE 1.23 2.50 1.04 0,16 0.03 0.00
NE 1.78 1.44 0.59 0.12 0.03 0.00
ENE 1.21 0.54 0.38 0.12 0.00 0.00
E 1.46 0.82 0.32 0.13 0.03 0.01
ESE 1.59 2.02 2.35 2.19 0.59 0.08
SE 1.15 2.61 264 1.24 0.50 0.78
SSE 0.99 1.54 0.56 0.37 0.24 0.08
TOTAL OBS = 8684 MISSING OBS = 76
PERCENT OCCURRENCE: Wind Speed ( Miles Per Hour)LOWER BOUND OF CATEGORY
D01 0.1 -1 09 I1 5 184 242S 0.78 0.77 0.22 0.09 0.03 0.00
SSW 0.56 0.31 0.10 0.05 0.00 0.00SW 0.50 0.29 0.09 0.03 0.01 0.00
WSW 0.52 0.32 0.05 0.00 0.01 0.00W 0.75 0.97 0.30 0.06 0.01 0.00
WNW 0,81 2.67 3.05 2.54 0.73 0.31NW 0.88 3.13 6.38 11.31 7.89 4.21
NNW 0.67 2.42 3.05 1.95 0.46 0.15CALM OBS = 0
Figure 11 - DCPP 10-Meter Level Wind Rose for 1983

Enclosure 1PG&E Letter DCL-1 0-082
Sheet 31 of 41
Joint Frequency Distribution
DCPP 1984
10M Level
N
2568
4.247.98 4.36
15,80
4.13
3.13
343-W E
4.44V
6.18
5,052.34
1.23 2229
-- -- --- -. . . ----------•
S
Wind Speed ( Miles Per Hour)
Calms excluded.Rings drawn at 10% intervals.Wind flow is FROM the directions shown.96 observations were missing.
PERCENT OCCURRENCE: Wind Speed (Miles Per Hour)LOWER BOUND OF CATEGORY
DIR 2d 21 0-9 115 184 242N 0.75 2.16 1.01 0.30 0.01 000
NNE 1.09 224 0.87 0.15 0.00 0.00NE 1.46 1.65 0.87 0.14 0.01 000
ENE 1.30 0.86 0.69 0.25 0.02 0.00E 161 1.22 041 0.17 0.01 0.00
ESE 1.58 1.99 1.15 132 0.12 0.02SE 1,28 1.95 1.27 0.47 0.07 0.02
SSE 0.64 1.34 0.07 0.12 0.09 0.03TOTALOBS-8688 MISStNGOBS- 96
PERCENT OCCURRENCE Wind Speed ( Miles Per Hour)LOWER BOUND OF CATEGORY
DIR U_1 §3 -9 115 184 242S 0.70 0.44 0.02 0.03 0.00 0.00
SSW 0.74 0.46 0.03 0.00 0.00 0.00SW 1.11 0.91 0.30 0.02 0.00 0.00
WSW 1.07 1.25 1.19 0.83 0.09 0.01W 1.09 2.01 1.66 2.18 1.14 0.44
WNW 1.25 285 3.58 3.96 2.45 1.70NW 1.00 2.95 4.22 6.94 6.09 4.48
NNW 0.67 2.21 2.67 1.90 0.38 0.15CALM OBS = 0
Figure 12 - DCPP 10-Meter Level Wind Rose for 1984

Enclosure 1PG&E Letter DCL-1 0-082
Sheet 32 of 41
Joint Frequency Distribution
DCPP 1985
10M Level
N
29.34
3.677.76 3.38
3.86
W 2.90----
1.30
1.23
2.78
-----....-- 2.7 -- 4-
%1,"" 5.65
E
1.402.26
8.43
4.51
S
Wind Speed ( Miles Per Hour)
Calms excluded.Rings drawn at 10% intervals.Wind flow is FROM the directions shown.141 observations were missing.
PERCENT OCCURRENCE: Wind Speed ( Miles Per Hour)LOWER BOUND OF CATEGORY
DIR Ul 3.5 6.9 11.5 18.4 242N 1.20 1.67 0.53 0.23 0.03 0.00
NNE 1.14 1.57 0.56 0.12 0.00 0.00NE 1.79 1.33 0.60 0.14 0.00 0.00
ENE 1.57 0.68 0.44 0.09 0.00 0.00E 1.66 0.75 0.20 0.08 0.01 0.00
ESE 2.20 2.16 0.55 0.57 0.16 0.01SE 2.38 3.52 1.88 0.55 0.12 0.00
SSE 1.47 2.36 0.50 0.09 0.09 0.00TOTAL OBS =8619 MISSING OBS= 141
PERCENT OCCURRENCE: Wind Speed (Miles Per Hour)LOWER BOUND OF CATEGORY
DIR 0.1 35 6-9 11.5 LEA 242S 1.22 0.81 0.12 0.07 0.06 0.00
SSW 0.72 0.57 0.08 0.03 0.00 0.00SW 0.73 0.45 0.05 0.00 0.00 0.00
WSW 0.71 0.44 0.10 0.3 0.01 0.00W 1.26 1.08 0.35 0.15 0.06 0.00
WNW 1,23 4.22 4.46 4.98 2.89 1.03NW 1.33 4.46 6.80 9.42 5.08 2.25
NNW 0.95 2.42 2.44 1.49 0.29 0.17CALM 03S = 0
Figure 13 - DCPP 10-Meter Level Wind Rose for 1985

Enclosure 1PG&E Letter DCL-10-082
Sheet 33 of 41
Joint Frequency Distribution
DCPP 1986
10M Level
N
4.5110.38 3.10
W --------- 2.41 ---
1.52
1.54
1.77 5.142.31
3.50
3.39
2.86-- -------
8.33
E
S
Win 3Sp ee 11.( 1 Per Hor
Wind Speed ( Miles Per Hour)
Calms excluded.Rings drawn at 10% intervals.Wind flow is FROM the directions shown.115 observations were missing.
PERCENT OCCURRENCE: Wind Speed ( Miles Per Hour)LOWER BOUND OF CATEGORY
DIt 01 3.5 § 9 t15 131 24.2N 0.86 2.08 1.28 0.28 0.01 0.00
NNE 0.93 1.43 0.54 0.20 0.00 0.00NE 1.38 1.45 0.53 0.10 0.05 0.00
ENE 1.31 118 0.67 0.23 0.00 0.00E 1.65 0.72 0,29 0.16 0.03 0.00
ESE 2.76 1.99 0.72 0.83 0.58 0.01SE 2.52 2.82 180 0.89 0.15 0.14
SSE 1.68 2.50 0.67 0.17 0.07 0.05TOTAL OBS = 8645 MISSINGOBS= 115
PERCENT OCCURRENCE: Wind Speed (Miles Per Hour)LOWER BOUND OF CATEGORY
D01 91 35 6.9 115 184 242S 1.37 0.89 0.06 0.00 0.00 0.00
SSW 0.99 0.69 0.05 0.02 0.01 0.00SW 0.68 0.65 0.16 0.05 0.00 0.00
WSW 0.64 0.50 0.27 0.12 0.00 0.00W 0.89 1.10 0.29 0.12 0.01 0.00
WNW 1.06 3.03 3.17 2.09 0.38 0.12NW 1.31 3.81 6.93 10.09 6.80 3.57
NNW 1.13 2.81 3,64 2.11 0.61 0,07CALM OBS = 0
Figure 14 - DCPP 10-Meter Level Wind Rose for 1986

Enclosure 1PG&E Letter DCL-10-082
Sheet 34 of 41
Multi Year Wind Roses - Before and After Simulator Building Construction
The data for calendar years 1981 and 1982 were combined into one file; the datafor calendar years 1985 and 1986 were also combined into one file. Two newwind roses, multi-year wind roses using 36 sectors rather than 16 sectors, werecreated to provide additional detail on the wind rose before and after simulatorbuilding construction. These two wind roses are presented in Figures 15 and 16.
In Figure 15, the period prior to simulator building construction is examined.Wind directions centered on 70, 80, 90, 100, and 110 degrees occurred 1.54,1.46, 1.35, 1.57, and 2.66 percent of the time.
In Figure 16, the 2-year period after the simulator building is completed, winddirections centered on 70, 80, 90, 100, and 110 degrees occurred 1.26, 1.22,1.06, 1.68, and 2.61 percent of the-time.
It appears that there are no significant differences between the wind roses forthese two periods.

Enclosure 1PG&E Letter DCL-1 0-082
Sheet 35 of 41
Joint Frequency Distribution
DCPP 1981-82
10M Level
N
20.26
12.573.62 2.59 19: 1.7, 2.01
W -------
6.5152.00
1.80
S 7.1 .74
47 1.64
1.03 1.46
......... ------. 0 .613 -- - - - -------- -- - - - - - 1.35 -------.
0.81 ,,,/ 1.57
.44 2.66
0.41 3i83
0.43 3.83
0.47 3.830.40, 2.63
053063 0.83 1.06164
-------- ------- E
S
W.d .Spe(9 '1' 1(i4 PH.2
Wind Speed ( Miles Per Hour)
Calms excluded.Rings drawn at 5% intervals.Wind flow is FROM the directions shown.584 observations were missing.
Figure 15 - DCPP 10-Meter Level Wind Rose for 1981-82 (Before Simulator Building)

Enclosure 1PG&E Letter DCL-1 0-082
Sheet 36 of 41
Joint Frequency Distribution
DCPP 1985-86
10M Level
N
16.80
• " .- "" 3.5 2.31 1.,71 1.57 .5 "' "
6/10 .5 ,/.58 1.33 ".
" 11.37 1.58
1693
" "3.97 1.26 '
S1.67 ," •1.22 '
1 22, --- -- -- -.. 0 -- -- - -- -- -.. .. ..-"---,, --- -- - 1.06 -1 ---------..
So82 , 1.668
059 2.61
0.68 3.39
0.63 3.790.52 3.54
0 .65 , 3.12086076 0.97 1.25189
-E
S
Wind Speed (Miles Per Hour)
Calms excluded,Rings drawn at 5% intervals.Wind flow is FROM the directions shown.256 observations were missing.
Figure 16- DCPP 10-Meter Level Wind Rose for 1985-86 (After Simulator Building)
Enclosure 1PG&E Letter DCL-10-082
Sheet 37 of 41
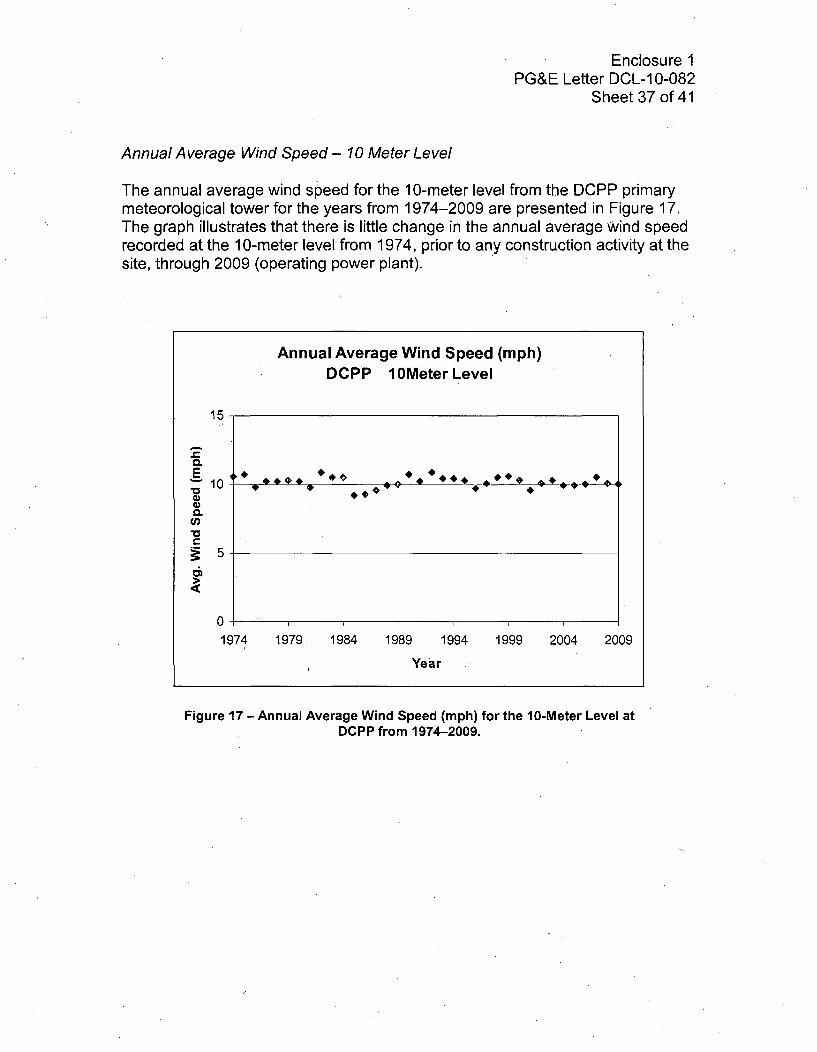
Annual Average Wind Speed - 10 Meter Level
The annual average wind speed for the 10-meter level from the DCPP primarymeteorological tower for the years from 1974-2009 are presented in Figure 17.The graph illustrates that there is little change in the annual average Wind speedrecorded at the 10-meter level from 1974, prior to any construction activity at thesite, through 2009 (operating power plant).
Annual Average Wind Speed (mph)Annual Average Wind Speed (mph)
DCPP 1OMeterLevel
15
C.
10
0 i
1974 1979 1984 1989 1994 1999 2004 2009
Year
Figure 17 - Annual Average Wind Speed (mph) for the 10-Meter Level atDCPP from 1974-2009.

Enclosure 1PG&E Letter DCL-10-082
Sheet 38 of 41
Distribution of Atmospheric Stability
Vertical and Horizontal Stability
Atmospheric stability is classified using vertical temperature difference, termedDelta-T, and/or wind direction standard deviation, termed sigma theta. At DCPP,vertical temperature difference is calculated between the 10-meter level and the76-meter level and the 107meter and 46-meter level of the primarymeteorological tower. Sigma theta, the standard deviation of the wind direction,is calculated from the wind direction measurements collected by the winddirection sensor at the 10-meter level. The delta-T defines the vertical stabilityand the sigma theta defines the horizontal stability.
DCPP Simulator Building and Parking Lot
As previously stated, the DCPP primary meteorological tower was installed onsite in the late 1960s and meteorological data exists in the archive since May1973. The DCPP simulator building was constructed in the early 1980s and it isassumed that the parking lot was most likely constructed at the same time.
AnalysisI
The DCPP primary meteorological tower data for vertical temperature(76-meter/1 0-meter) and the standard deviation of the wind direction (sigma) isanalyzed for each year from 1974-1980 (pre-simulator and parking lot) and1986-1996 (post-simulator building and parking lot) to see if there are anysignificant changes in the distribution of stability classes at the primarymeteorological tower. The results are presented in Table 1.
For the 8-year period from 1974-1980, the bulk of the vertical temperaturestability classifications fell into the neutral and slightly stable classes, 39.9 and38.8 percent, respectively. The unstable classifications accounted for around6 percent of the hours and the moderately and extremely stable classificationsaccount for around 15 percent of the hours.
For the 11-year period from 1986-1996, after the construction of the simulatorbuilding, the installation of the parking lot, and the substantial completion of thepower plant itself, the bulk of the vertical temperature stability classifications stillfall into the neutral and slight stable classes, 48.5 and 28.8 percent, respectively.The unstable classifications accounted for around 11 percent of the hours andthe moderately and extremely stable classifications account for around12 percent of the hours. The percentage difference between the two periods ispresented in Table 1.
Enclosure 1PG&E Letter DCL-10-082
Sheet 39 of 41
For the vertical temperature difference measurements, there is a sight shift fromthe stable stability classifications to the neutral and unstable stabilityclassifications. This may be associated both with the changes in the surfaceunder the primary meteorological tower (i.e., paved surface) and the presenceand proximity of structures associated with the power plant, which did not exist inthe 1974-1980 timeframe.
For the 8-year period from 1974-1980, the bulk of the horizontal stability (winddirection standard deviation or sigma theta) classifications fell into the slightlyunstable to slightly stable classes, 58.9 percent. The unstable classificationsaccounted for around 38 percent of the hours and the moderately and extremelystable classifications account for around 3 percent of the hours.
For the 11-year period from 1986-1996, after the construction of the simulatorbuilding, the installation of the parking lot, and the substantial completion of thepower plant itself, the bulk of the horizontal stability classifications still fall into theslightly unstable to slightly stable classes, 65.6 percent. The unstableclassifications now account for around 34 percent of the hours and themoderately and extremely stable classifications account for around 1 percent ofthe hours. The percentage difference between the two periods is presented inTable 1.
For horizontal stability measurements, there is a decrease in the extremestability classifications and an increase inthe neutral stability classification. Thisis most likely associated with the increases in surface roughness around theprimary meteorological tower due to the parking lot and the presence structuresassociated with the power plant, which did not exist in the 1974-1980 timeframe.

Enclosure 1PG&E Letter DCL-10-082
Sheet 40 of 41
Table 1 - Percentage Occurrence of Vertical and Horizontal Stability Class for 1974-1980(Pre-Simulator Building) and 1986-1996 (Post-Simulator Building) Observed at the PrimaryMeteorological Tower.
Delta-T
Class 1974-1980 1986-1996 DifferenceA Extremely Unstable 1.89% 3.87% 1.99%
B Moderately Unstable 1.86% 2.86% 1.01%C Slightly Unstable 2.09% 3.88% 1.79%D Neutral 39.93% 48.51% 8.58%
E Slightly Stable 38.77% 28.78% -9.98%
F Moderately Stable 9.77% 8.11% -1.66%G Extremely Stable 5.69% 3.98% -1.71%
Wind Direction SigmaTheta
Class 1974-1980 1986-1996 DifferenceA Extremely Unstable 31.48% 28.48% -3.00%B Moderately Unstable 6.57% 5.52% -1.05%
C Slightly Unstable 10.77% 9.80% -0.97%
D Neutral 21.70% 32.09% 10.39%E Slightly Stable 26.42% 23.74% -2.68%F Moderately Stable 1.56% 0.30% -1.26%
G Extremely Stable 1.51% 0.70% -0.81%

Enclosure 1PG&E Letter DCL-10-082
Sheet 41 of 41
Summary and Conclusions
The simulator building was constructed in 1983-1984 at a location directly eastof the primary meteorological tower. The distance between this building and themeteorological tower is slightly less than 10 building heights.
Wind roses, for 10-meter wind speed and direction were created to provide agraphical display of the frequency of occurrence of winds blowing from differentdirections. This was performed for each calendar year from 1974 until 1986 andthen for 2-year periods prior to and after simulator building construction.
A visual inspection of the results, focusing principally on the easterly winddirections, indicates that there are no significant changes in the distribution ofwind directions due to the simulator building construction.
For atmospheric stability, a review of the vertical delta-temperature data (verticalstability) and the wind direction sigma theta (horizontal stability) for the 8-yearperiod from 1974-1980, and the 11-year period from 1986-1996, does indicate aslight shift from the more stable classes to the neutral and unstableclassifications. For the vertical temperature, this may be associated with thepresence of a paved parking area under and surrounding the tower. The shift issmall with the increase in Stability Classes A, B, and C on the order of 3 percent,which corresponds to a decrease in the more stable classes (F and G) of around3 percent.
A shift in the horizontal stability is also noted with decreases in the extremestability classifications and an increase in the neutral stability classification. Thechange in wind direction sigma is most likely not due to the simulator building asthere frequency of occurrence of winds from that direction is quite low; however,the shifts to a more neutral classification may be associated with increasingsurface roughness surrounding the tower (i.e., parking lot) and the presence ofthe power plant structures.
Based on this analysis, there appears to be no change in the wind speed datacollected at the 10-meter level as the occurrence of winds from the direction ofthe simulator building are infrequent. There is a slight shift in the vertical stabilityclassifications and the horizontal stability classifications, which appears to beassociated with the presence of the power plant and associated structures.However, the measurements from the 10-meter level on the primarymeteorological tower are still considered representative of the current physicalconditions at the site and are valid for the Severe Accident Mitigation Alternatives(SAMA) Analysis.

Enclosure 2
County of San Luis Obispo Allocation of Unitary Tax Revenue from PG&EPower Plant Property Tax Bills for Fiscal Years 2007/08-2009/10

Enclosure 2PG&E Letter DCL-10-082
Page 1 of 4
COUNTY OF SAN LUIS OBISPOALLOCATION OF UNITARY TAX REVENUE
FROM PG&E POWER PLANT PROPERTY TAX BILLSFOR FISCAL YEARS 2007108 - 2009110
2007/2008
UNITARY
FACTOR
2007/2008
PG&E TAXES
990,000,126
$22,583,480.03
200812009
UNITARY
FACTOR
200812009
PG&E TAXES
990,000,222
$23,989,667.50
2009/2010UNITARY
FACTOR11
2009/2010
PG&E TAXES
990,000,313
$24,455,910.09FUND AGENCY
0001
00020007
0026
01660198
0213
022302270229
0231
0232
023302340235
0368
04730474
04750476
0477
04780480
04810483
General Fund
RoadsAir Pollution Control District
County Library
Garden Farms WaterSanta Maria Valley Water Cons DistCambria Community Hospital
Cayucos Sanitary DistrictArroyo GrandeAtascadero (inc 0709 sanitation)
Grover City
Morro Bay
Paso RoblesPismo Beach
San Luis ObispoCachuma Resource Conservation DistrictPort San Luis HarborCalifornia Valley Community Srvcs DistNipomo Community Services DistrictCambria Community Services DistrictSan Simeon Acres Community Srvcs DistTempleton Community Services DistrictNipomo Sewer Maintenance
Nipomo Drain Maintenance
Linne Community Services District
26.63604%
1.20099%
0.11802%
1.94566%
0.00190%0.00240%
0.01600%0.02323%
0.20133%0.27797%
0.08359%
0.93631%
0.27662%0.12446%
0.53768%
0.00185%
1.54708%
0.01059%0.02128%
0.08075%
0.00451%0.02728%
0.00061%
0.00061%
0.00067%
6,015,343.62271,224.50
26,653.75
439,397.55
429.64541.68
3,613.62
5,246.9045,467.79
62,774.60
18,876.84
211,451.7062,469.4828,107.39
121,426.14
418.48
349,383.922,392.64
4,804.87
18,235.39
1,019.30
6,160.65
137.69
137.69151.82
26.73769%1.16322%
0.11575%1.93107%
0.00211%0.00268%
0.01974%
0.02811%
0.24494%0.34292%
0.10963%
0.92982%
0.34315%
0.15748%
0.63903%
0.00183%
1.50650%
0.01106%0.02590%
0.09739%
0.00507%0.03544%
0.00074%
0.00074%
0.00082%
6,414,282.91279,052.61
27,768.04
463,257.27
506.18642.92
4,735.56
6,743.50
58,760.2982,265.3726,299.87
223,060.7382,320.54
37,778.93
153,301.17
439.01
361,404.34
2,653.26
6,213.32
23,363.54
1,216.28
8,501.94177.52
177.52
196.72
26.73769%1.16322%
0.11575%
1.93107%0.00211%
0.00268%
0.01974%0.02811%
0.24494%
0.34292%
0.10963%0.92982%
0.34315%
0.15748%
0.63903%
0.00183%
1.50650%
0.01106%0.02590%
0.09739%
0.00507%
0.03544%
0.00074%
0.00074%
0.00082%
6,538,945.43284,476.04
28,307.72
472,260.74
516.02655.42
4,827.60
6,874.56
59,902.3183,864.21
26,811.01227,395.94
83,920.4638,513.17
156,280.60
447.54
368,428.292,704.82
6*334.08
23,817.61
1,239.918,667.17
180.97180.97
200.54

PG&E LetterEnclosure 2DCL-1 0-082Page 2 of 4
200712008
UNITARYFACTOR
2007/2008PG&E TAXES990,000,126
$22.583.480.03
2008/2009
UNITARYFACTOR
2008/2009
PG&E TAXES990,000,222
$23.989,667.50
2009/2010
UNITARYFACTOR
2009/2010PG&E TAXES990,000,313
$24,455.910.09FUND AGENCY
0528
06430647
0651
0652
06540662
06750687
0693
06940723
07240725
0726
07270741
0742
07430747
0748
07500752
07550761
07730781
0803
08110825
0827
0831
0837
Grover City Street Light District #1San Luis Obispo County Flood Control DistNacimiento Water Services DistrictFlood Control Zone 1Flood Control Zone 1AFlood Control Zone 3Flood Control Zone 9
County Waterworks No. 8Nipomo Light
San Miguel CSD (Light)
County Serv Area # 23 (former San Marg Lt)County Service Area #1County Service Area #1 Zone ACounty Service Area #1 Zone BCounty Service Area #1 Zone CCounty Service Area #1 Zone D
County Service Area #7
County Service Area #7 Zone ACounty Service Area #7 Zone B
Los Osos CSD Zone ALos Osos CSD Zone BLos Osos CSD Zone D
Los Osos CSD Zone F
County Service Area #10County Service Area #12
County Service Area #16Heritage Community Service'District
San Miguel Sanitary District
Oceano Community Services DistrictCayucos Fire DistrictSan Miguel CSD (Fire)
Santa Margarita Fire DistrictArroyo Grande Cemetery District
0.01641%
0.27775%0.35012%
0.00805%
0.00067%
0.01116%0.02514%
0.00201%
0.00146%
0.00382%
0.00165%0.00043%
0.00186%
0.00097%0.00030%
0.00124%
0.00151%
0.00620%0.00154%
0.01429%
0.06874%0.00064%
0.00044%
0.00528%
0.03279%
0.00125%
0.00976%
0.00291%0.03304%
0.00689%
0.01356%
0.00624%0.00597%
3,705.95
62,725.84
79,070.01
1,817.36150.65
2,521.245,676.63
453.11
329.58
863.68372.99
96.65
419.95218.73
67.91
279.42
341.361,401.26
347.40
3,227.73
15,524.86
145.08
100.411,192.47
7,404.02
282.322,205.18
656.857,461.66
1,555.00
3,062.011,409.25
1,348.82
0.02059%
0.27626%
0.34652%
0.00827%
0.00078%
0.01311%0.02831%
0.00241%
0.00174%0.00457%
0.00178%
0.00050%
0.00214%
0.00113%0.00038%
0.00154%
0.00199%
0.00805%0.00196%
0.01571%0.08296%
0.00081%0.00050%
0.00670%
0.03160%
0.00158%0.01233%
0.00332%0.04035%
0.00869%
0.01569%
0.00685%
0.00675%
4,939.47
66,273.86
83,129.00
1,983.95
187.12
3,145.056,791.47
578.15
417.42
1,096.33427.02
119.95
513.38271.08
91.16
369.44
477.39
1,931.17470.20
3,768.78
19,901.83194.32
119.95
1,607.31
7,580.73
379.042,957.93
796.46
9,679.832,084.70
3,763.98
1,643.29
1,619.30
0.02059%
0.27626%
0.34652%
0.00827%0.00078%
0.01311%0.02831%
0.00241%
0.00174%
0.00457%0.00178%
0.00050%0.00214%
0.00113%
0.00038%0.00154%
0.00199%
0.00805%
0.00196%
0.01571%
0.08296%
0.00081%
0.00050%
0.00670%
0.03160%
0.00158%0.01233%
0.00332%0.04035%
0.00869%
0.01569%
0.00685%
0.00675%
5,035.47
67,561.90
84,744.62
2,022.50
190.76
3,206.176,923.47
589.39425.53
1,117.64435.32
122.28
523.36
276.3592.93
376.62486.67
1,968.70479.34
3,842.02
20,288.62
198.09
122.28
1,638.55
7,728.07
386.40
3,015.41
811.949,867.96
2,125.22
3,837.13
1,675.23
1,650.77

Enclosure 2PG&E Letter DCL-10-082
Page 3 of 4
2007/2008 2007/2008 2008/2009 2008/2009 2009/2010 2009/2010UNITARY PG&E TAXES UNITARY PG&E TAXES UNITARY PG&E TAXESFACTOR 990,000,126 FACTOR 990,000,222 FACTOR 990,000,313
FUND AGENCY $22,583,480.03 $23,989,667.50 $24,455,910.09
0843 Atascadero Cemetery District 0.01637% 3,697.58 0.01868% 4,481.27 0.01868% 4,568.360844 Cambria Cemetery District 0.00388% 875.68 0.00461% 1,105.92 0.00461% 1,127.420845 Cayucos-Morro Bay Cemetery District 0.08766% 19,797.74 0.08691% 20,849.42 0.08691% 21,254.630847 Paso Robles Cemetery District 0.01898% 4,285.70 0.02200% 5,277.73 0.02200% 5,380.300851 San Miguel Cemetery District 0.00400% 904.14 0.00459% 1,101.13 0.00459% 1,122.530852 SantaMargarita Cemetery District 0.00593% 1,338.89 0.00599% 1,436.98 0.00599% 1,464.910853 Shandon Cemetery District 0.00419% 946.13 0.00416% 997.97 0.00416% 1,017.370854 Templeton Cemetery District 0.00413% 931.85 0.00486% 1,165.90 0.00486% 1,188.560895 Avila Beach County Water District 0.29045% 65,594.55 0.28035% 67,255.03 0.28035% 68,562.140896 Avila County Water Improvement Dist #1 0.00816% 1,842.76 0.00964% 2,312.60 0.00964% 2,357.551205 Coast Unif (Cayucos Elem) 0.11384% 25,708.49 0.12795% 30,694.78 0.12795% 31,291.341211 Cuyama Joint Unified 0.11949% 26,984.44 0.11614% 27,861.60 0.11614% 28,403.091217 Paso Unified (Pleasant Elem) 0.01203% 2,716.92 0.01522% 3,651.23 0.01522% 3,722.191221 Paso Unifed (San Miguel Elem) 0.09114% 20,582.36 0.10721% 25,719.32 0.10721% 26,219.181223 Coast Unified 0.34325% 77,517.40 0.41089% 98,571.14 0.41089% 100,486.891225 Paso Robles Unified 1.16993% 264,210.50 1.40324% 336,632.61 1.40324% 343,175.111227 Santa Maria Joint Union High 0.00010% 21.50 0.00010% 23.99 0.00010% 24.461228 Santa Maria Joint Union Elementary 0.00012% 26.33 0.00012% 28.79 0.00012% 29.351231 Templeton Unified 0.31862% 71,954.37 0.38201% 91,642.93 0:38201% 93,424.021234 San Luis Coastal Unified 37.48453% 8,465,310.88 36.42259% 8,737,658.24 36.42259% 8,907,475.861253 Lucia Mar Unified 1.78082% 402,171.87 2.14756% 515,192.50 2.14756% 525,205.341273 Atascadero Unified 1.41438% 319,416.53 1.53387% 367,970.31 1.53387% 375,121.871293 Shandon Unified 0.24070% 54,358.89 0.24159% 57,956.64 0.24159% 59,083.031303 San Luis Obispo Co Community College 7.59050% 1,714,198.30 7.55381% 1,812,133.90 7.55381% 1,847,352.981308 County School Service 4.50289% 1,016,909.92 4.48101% 1,074,979.40 4.48101% 1,095,871.781309 Allan Hancock Joint Community College 0.01532% 3,459.03 0.01489% 3,572.06 0.01489% 3,641.490115 ERAF 9.25951% 2,091,119.72 8.97130% 2,152,185.04 8.97130% 2,194,013.06
0236 PASO REDEVELOPMENT 0.04039% 9,122.44 0.07905% 18,963.83 0.07905% 19,332.400237 FIVE CITIES REDEV 0.01375% 3,106.30 0.02419% 5,803.10 0.02419% 5,915.88
0239 ARROYO GRANDE REDEV 0.00941% 2,125.68 0.02203% 5,284.92 0.02203% 5,387.640238 GROVER BEACH REDEV 0.01091% 2,464.61 0.02227% 5,342.50 0.02227% 5,446.330251 ATASCADERO REDEV 0.03128% 7,064.23 0.06817% 16,353.76 0.06817% 16,671.59

Enclosure 2PG&E Letter DCL-10-082
Page 4 of 4
2007/2008UNITARY
FACTOR
2007/2008
PG&E TAXES990,000,126
$22.583.480.03
2008/2009
UNITARYFACTOR
2008/2009
PG&E TAXES
990,000,222
$23.989.667.50
2009/2010
UNITARY
FACTOR
2009/2010
PG&E TAXES
990,000,313
$24.455.910.09FUND AGENCY
0252 GBIE REDEVELOPMENT
TOTAL
0.00182% 411.27 ( 0.00430% 1,031.56 0.00430% 1,051.60
100.00000% $22,583,480.03 100.00000% $23,989,667.50 100.00000% $24,455,910.09
ASSESSED VALUES BY FISCAL YEAR
LANDIMPROVEMENTS
PERSON PROPERTY
NET VALUE
2007/2008
65,993,4292,015,612,857
176,741,717
2,258,348,003
2008/2009
65,993,429
2,099,436,292
233,537,029
2,398,966,750
2009/2010
65,993,429
2,262,610,081
116,987,499
2,445,591,009