pacific gas and electric company application for
TRANSCRIPT

Application: 18-02- U-39E Exhibit No.: Date: February 28, 2018 Witness(es): Various
PACIFIC GAS AND ELECTRIC COMPANY
APPLICATION FOR COMPLIANCE REVIEW OF: UTILITY-OWNED GENERATION OPERATIONS;
ELECTRIC ENERGY RESOURCE RECOVERY ACCOUNT ENTRIES; CONTRACT ADMINISTRATION; ECONOMIC DISPATCH OF ELECTRIC
RESOURCES; UTILITY-RETAINED GENERATION FUEL PROCUREMENT; AND OTHER ACTIVITIES
FOR THE PERIOD JANUARY 1 THROUGH DECEMBER 31, 2017
PREPARED TESTIMONY
PUBLIC VERSION

-i-
APPLICATION FOR COMPLIANCE REVIEW OF UTILITY OWNED GENERATION OPERATIONS, ELECTRIC ENERGY RESOURCE RECOVERY ACCOUNT ENTRIES,
CONTRACT ADMINISTRATION, ECONOMIC DISPATCH OF ELECTRIC RESOURCES, UTILITY RETAINED GENERATION FUEL PROCUREMENT,
AND OTHER ACTIVITIES FOR THE PERIOD JANUARY 1 THROUGH DECEMBER 31, 2017
TABLE OF CONTENTS
Chapter Title Witness
1 LEAST-COST DISPATCH AND ECONOMICALLY-TRIGGERED DEMAND RESPONSE
Alva J. Svoboda Franklin Fuchs
Attachment A SUMMARY OF TRIGGERED DISPATCH
FROM DEMAND RESPONSE PROGRAMS Franklin Fuchs
Attachment B SUMMARY OF 2017 CAPACITY BIDDING
PROGRAM EVENTS Franklin Fuchs
Attachment C SUMMARY OF TOTAL ENERGY
DISPATCHED FROM DEMAND RESPONSE PROGRAMS
Franklin Fuchs
2 UTILITY-OWNED GENERATION:
HYDROELECTRIC Alvin L. Thoma
Attachment A PG&E POWERHOUSES AND GENERATING
UNITS Alvin L. Thoma
3 UTILITY-OWNED GENERATION: FOSSIL
AND OTHER GENERATION Steve Royall
4 UTILITY-OWNED GENERATION: NUCLEAR Cary D. Harbor
5 COSTS INCURRED AND RECORDED IN THE
DIABLO CANYON SEISMIC STUDIES BALANCING ACCOUNT
Stuart P. Nishenko

APPLICATION FOR COMPLIANCE REVIEW OF UTILITY OWNED GENERATION OPERATIONS, ELECTRIC ENERGY RESOURCE RECOVERY ACCOUNT ENTRIES,
CONTRACT ADMINISTRATION, ECONOMIC DISPATCH OF ELECTRIC RESOURCES, UTILITY RETAINED GENERATION FUEL PROCUREMENT,
AND OTHER ACTIVITIES FOR THE PERIOD JANUARY 1 THROUGH DECEMBER 31, 2017
TABLE OF CONTENTS
(CONTINUED)
-ii-
Chapter Title Witness
6 GENERATION FUEL COSTS AND ELECTRIC PORTFOLIO HEDGING
Felipe Ibarra Michael Kowalewski Mark Mayer Yanee Pongsupapipat Alvin L. Thoma
Attachment A LETTER FROM RUBY PIPELINE OFFICER
CERTIFYING PG&E’S “MOST FAVORED NATIONS” (LOWEST RATE) STATUS
Felipe Ibarra
Attachment B GENERATION FUEL COSTS Felipe Ibarra
Michael Kowalewski Mark Mayer
Attachment C ANNUAL REPORT OF UTILITY ON THE
ACTIVITIES OF STARS ALLIANCE, LLC; UTILITY SAVINGS/AVOIDED COSTS BY STARS TEAM/PROJECT
Yanee Pongsupapipat
7 GREENHOUSE GAS COMPLIANCE
INSTRUMENT PROCUREMENT Vincent Loh
8 CONTRACT ADMINISTRATION Candice K. Chan
9 CAISO SETTLEMENTS AND MONITORING Candice K. Chan

APPLICATION FOR COMPLIANCE REVIEW OF UTILITY OWNED GENERATION OPERATIONS, ELECTRIC ENERGY RESOURCE RECOVERY ACCOUNT ENTRIES,
CONTRACT ADMINISTRATION, ECONOMIC DISPATCH OF ELECTRIC RESOURCES, UTILITY RETAINED GENERATION FUEL PROCUREMENT,
AND OTHER ACTIVITIES FOR THE PERIOD JANUARY 1 THROUGH DECEMBER 31, 2017
TABLE OF CONTENTS
(CONTINUED)
-iii-
Chapter Title Witness
10 REVIEW ENTRIES RECORDED IN THE GREEN TARIFF SHARED RENEWABLES MEMORANDUM ACCOUNT AND THE GREEN TARIFF SHARED RENEWABLES BALANCING ACCOUNT
Donna L. Barry Molly Hoyt
11 SUMMARY OF ENERGY RESOURCE
RECOVERY ACCOUNT ENTRIES FOR THE RECORD PERIOD
Lucy Fukui Armando Duran
Attachment A FINAL JOINT PROPOSAL ON POTENTIAL
VERIFICATION METHOD FOR PG&E’S GREENHOUSE GAS EMISSIONS AND WEIGHTED AVERAGE COSTS (WAC) FOR FUTURE ERRA COMPLIANCE FILING
Armando Duran
12 MAXIMUM POTENTIAL DISALLOWANCE Kelly A. Everidge
13 COST RECOVERY AND REVENUE
REQUIREMENT Lucy Fukui
Appendix A STATEMENTS OF QUALIFICATIONS Donna L. Barry
Candice K. Chan Armando Duran Kelly A. Everidge Franklin Fuchs Lucy Fukui Cary D. Harbor Molly Hoyt Felipe Ibarra Michael Kowalewski Vincent Loh Mark Mayer Stuart P. Nishenko Yanee Pongsupapipat Steve Royall Alva J. Svoboda Alvin L. Thoma

-iv-
TABLE OF ACRONYMS
Line No. Acronym Description
1 A. Application
2 A/S Ancillary Services
3 AB Assembly Bill
4 AC Alternate Current
5 AET Annual Electric True-Up
6 AFW Application for Work
7 AL Advice Letter
8 AMP Aggregator Managed Portfolio
9 ANSI American National Standards Institute
10 ARB Air Resources Board
11 ATS Applied Technology Services
12 BAV best available volume of emissions
13 BCR Bid Cost Recovery
14 BioMASSMA Biomass Memorandum Account
15 BioMAT Bioenergy Market Adjusting Tariff
16 BioRAMMA Bioenergy Renewable Auction Mechanism Memorandum Account
17 BPP Bundled Procurement Plan
18 Btu British Thermal Unit
19 Burney Burney Forest Products
20 CAISO California Independent System Operator
21 CAM Cost Allocation Mechanism
22 CAP Corrective Action Program
23 CARB California Air Resources Board
24 CBP Capacity Bidding Program
25 CCCSIP Central California Coast Seismic Imaging Project
26 CCM cylinder control module
27 CCGT Combined cycle gas turbine
28 CCSN Central Coastal Seismic Network
29 CDWR California Department of Water Resources
30 CEC California Energy Commission
31 CED ConEdison Development

-v-
Line No. Acronym Description 32 CECM Consolidated Energy Contract Management
33 CFR Code of Federal Regulations
34 CFCU Containment Fan Cooler Unit
35 CGS California Geological Survey
36 CHP Combined Heat and Power
37 CIDI Customer Inquiry, Dispute and Information
38 CNO Chief Nuclear Officer
39 CO carbon monoxide
40 CO2 carbon dioxide
41 CO2e carbon dioxide equivalent
42 COD Commercial Operation Date
43 COL Conclusion of Law
44 Commission California Public Utilities Commission
45 CPUC California Public Utilities Commission
46 CRADA Cooperative Research and Development Agreement
47 CRR Congestion Revenue Rights
48 CSA Capacity Storage Agreement
49 CSIAL Customer-Side Implementation Advice Letter
50 CSR Customer Service Representative
51 CSU California State University
52 CSUEB California State University, East Bay
53 CT Combustion Turbine
54 CTC Competition Transition Charge
55 D. Decision
56 DC Direct Current
57 DCPP Diablo Canyon Nuclear Power Plant
58 DCSSBA Diablo Canyon Seismic Studies Balancing Account
59 DLAP Default Load Aggregation Point
60 DR Demand Response
61 DSOD Division of Safety of Dams
62 ECMS Energy Contract Management and Settlements
63 ECP Employee Concerns Program
64 ECR enhanced community renewables
65 EDG Emergency Diesel Generator

-vi-
Line No. Acronym Description 66 EDMS Electronic Document Management System
67 EEI Edison Electric Institute
68 EIM Energy Imbalance Market
69 ERRA Energy Resource Recovery Account
70 EN Energy Bid
71 EPI Electricity Price Index
72 ESA Energy Storage Agreement
73 ESTAR Electric Settlements Tool for Analysis and Reporting
74 EUP Enriched Uranium Product
75 °F Degree Fahrenheit (can be used lowercase)
76 FCE FuelCell Energy
77 FERC Federal Energy Regulatory Commission
78 FF&U Franchise Fees and Uncollectibles
79 FLR Forced Loss Rate
80 FMM Fifteen-Minute Market
81 FNM Full Network Model
82 FIT Feed In Tariff
83 FOF Finding of Fact
84 FOF Forced Outage Factor
85 GCOD Guaranteed Commercial Operation Date
86 GE General Electric
87 GEP Guaranteed Energy Production
88 GFN Good Faith Negotiation
89 GHG Greenhouse Gas
90 GMC Ground Motion Characterization
91 GMC Grid Management Charges
92 GO General Order
93 GRC General Rate Case
94 GRIT Generation Risk Information Tool
95 GSP Gas Supply Plan
96 GT Gas Turbines
97 GTSR Green Tariff Shared Renewables
98 GTSRBA Green Tariff Shared Renewables Balancing Account
99 GTSRMA Green Tariff Shared Renewables Memorandum Account

-vii-
Line No. Acronym Description 100 GWh gigawatt-hour
101 HANG2 Hassayampa to North Gila
102 HRSG Heat Recovery Steam Generator
103 I&C Instrumentation and Control
104 ICE Intercontinental Exchange
105 ID&WA Irrigation District and Water Agency
106 IDWA Irrigation District Water Associations
107 IEDD Initial Expected Delivery Date
108 IFM Integrated Forward Market
109 IMHR Implied Market Heat Rate
110 IPRP Independent Peer Review Panel
111 IOU Investor-Owned Utility
112 IT Information Technology
113 KRCC Kern River Cogeneration Company
114 kV kilovolt
115 kW kilowatt
116 kWh kilowatt-hour
117 LCD Least-Cost Dispatch
118 LESS low energy seismic survey
119 LIFO Last-In First Out
120 LMP Locational Marginal Price
121 LMPM Local Market Power Mitigation
122 LSE Load Serving Entities
123 LTSA Long-Term Service Agreement
124 LTSP Long Term Seismic Program
125 MAPE Mean Absolute Percentage Error
126 MCFC Molten Carbonate Fuel Cell
127 MDC Maximum Dependable Capacity
128 MMA Major Maintenance Adder
129 MMBtu Millions of British Thermal Units
130 mmt million metric ton
131 MO Maintenance Outages
132 MPR Market Price Referent
133 MRTU Market Redesign and Technology Upgrade

-viii-
Line No. Acronym Description 134 MSG Multi-Stage Generation
135 MTCBA Modified Transition Cost Balancing Account
136 mtCO2e metric tons of carbon dioxide equivalent
137 MW megawatt
138 MWh megawatt-hour
139 NERC North American Electric Reliability Corporation
140 NGR Non-Generator Resource
141 NOx nitrogen oxide
142 NQA Nuclear Quality Assurance
143 NRC Nuclear Regulatory Commission
144 NSGBA New System Generation Balancing Account
145 NTTF Near-Term Task Force
146 O&M Operations and Maintenance
147 OBS Ocean Bottom Seismometer
148 OEM Original Equipment Manufacturer
149 OMS Outage Management System
150 OP Ordering Paragraph
151 OP7860 Operation Procedure 7860
152 ORA Office of Ratepayer Advocates
153 PCIA Power Charge Indifference Adjustment
154 PDR Proxy Demand Resource
155 PDS Project Development Security
156 PEER Pacific Earthquake Engineering Research
157 PG&E Pacific Gas and Electric Company
158 PMG permanent magnet generator
159 PO Planned Outages
160 PPA Power Purchase Agreement
161 PRG Procurement Review Group
162 PRV pressure relief valve
163 Pub. Util. Code
Public Utilities Code
164 PURPA Public Utility Regulatory Policies Act
165 PV Photovoltaic
166 QA Quality Assurance
167 QCR Quarterly Compliance Report

-ix-
Line No. Acronym Description 168 QF Qualifying Facility
169 QF/CHP Qualifying Facility and Combined Heat and Power
170 QIC Qualifying Facilities Information Center
171 QV Quality Verification
172 RA Resource Adequacy
173 RAM Renewable Auction Mechanism
174 RDRR Reliability Demand Response Resources
175 REC Renewable Energy Credits
176 REC Renewable Energy Certificate
177 REM Regulation Energy Management
178 ReMAT Renewable Market Adjusting Tariff
179 RF&U Revenue Fees and Uncollectibles
180 RFO Request for Offers
181 RMSE Root Mean Square Error
182 RPS Renewable Portfolio Standard
183 RPSCMA Renewable Portfolio Standard Cost Memorandum Account
184 RTD Real-Time Dispatch
185 RTM Real-Time Market
186 RUC Residual Unit Commitment
187 R. Rulemaking
188 SAP WM SAP Work Management
189 SB Senate Bill
190 SC Scheduling Coordinator
191 SCADA Supervisory Control and Data Acquisition
192 SCE Southern California Edison Company
193 SCEC Southern California Earthquake Center
194 SCR Selective Catalytic Reduction
195 SCUC Security Constrained Unit Commitment
196 SDG&E San Diego Gas & Electric Company
197 SFSU San Francisco State University
198 SFWPA South Feather Water and Power Agency
199 SGDP Smart Grid Demonstration Program
200 SLIC Scheduling and Logging ISO California
201 SOC State of Charge

-x-
Line No. Acronym Description 202 SOC4 Standard of Conduct 4
203 SOFC Solid Oxide Fuel Cell
204 SPPC Sierra Pacific Power Company
205 SQS Safety, Quality and Standards
206 SS Self-Scheduling
207 ST Steam Turbine
208 STARS Strategic Teaming and Resource Sharing
209 SWU Separate Working Unit
210 STES Short Term Electric Supply
211 SubLAP Sub Load Aggregation Point
212 T3 Task Tracking Tool
213 UEG Utility Electric Generation
214 UGBA Utility Generation Balancing Account
215 UOG Utility-Owned Generation
216 USGS U.S. Geological Survey
217 V Volt
218 VOC Volatile Organic Compound
219 VOM Variable Operating and Maintenance Cost
220 VP Vice President
221 WAC Weighted Average Cost
222 WM Water Management
223 WM Work Management
224 WRCC Western Regional Climate Center
225 WREGIS Western Renewable Energy Generation Information System
226 YCWA Yuba County Water Agency

PACIFIC GAS AND ELECTRIC COMPANY
CHAPTER 1
LEAST-COST DISPATCH AND ECONOMICALLY-TRIGGERED
DEMAND RESPONSE

1-i
PACIFIC GAS AND ELECTRIC COMPANYCHAPTER 1
LEAST-COST DISPATCH AND ECONOMICALLY-TRIGGERED DEMAND RESPONSE
TABLE OF CONTENTS
A. Introduction....................................................................................................... 1-1
B. Least-Cost Dispatch ......................................................................................... 1-2
1. Structure of LCD Section ........................................................................... 1-2
2. Overview of Least-Cost Dispatch in the CAISO Markets ........................... 1-3
a. Day-Ahead Markets............................................................................. 1-4
b. Real-Time Markets .............................................................................. 1-6
3. PG&E’s Bidding and Scheduling Processes .............................................. 1-7
a. Least-Cost Dispatch Guidelines and Principles ................................... 1-7
1) Least-Cost Dispatch Principles ..................................................... 1-7
2) Incremental Costs ......................................................................... 1-8
3) Self-Scheduling ........................................................................... 1-10
4) Constraints .................................................................................. 1-11
b. 2017 Least-Cost Dispatch Business Process Overview .................... 1-12
1) Load and Price Forecasts ........................................................... 1-12
2) Load Bidding ............................................................................... 1-15
3) Thermal Resource Bidding and Scheduling ................................ 1-15
4) Description of Proxy/Registered Cost Determination for Thermal Resources..................................................................... 1-17
5) Hydro Resource Bidding and Scheduling.................................... 1-18
6) Hydro Self-Scheduling Decisions ................................................ 1-21
7) Helms Pumped Storage Plant Bidding and Scheduling .............. 1-22
8) Battery Storage Bidding and Scheduling..................................... 1-24
9) Resource Bid Non-Submission ................................................... 1-25
10) Market Transactions.................................................................... 1-26
PACIFIC GAS AND ELECTRIC COMPANYCHAPTER 1
LEAST-COST DISPATCH AND ECONOMICALLY-TRIGGERED DEMAND RESPONSE
TABLE OF CONTENTS(CONTINUED)
1-ii
11) Must-Take Resources and Contracts.......................................... 1-27
12) Economic Bidding of Renewable Resources............................... 1-27
13) Bid/Award Validation ................................................................... 1-28
4. Summary Reports/Tables Annual Exception Rates ................................. 1-29
a. Incremental Cost Bid Calculation Exceptions .................................... 1-30
b. Self-Commitment Decision Exceptions.............................................. 1-31
c. Master File Data Change Exceptions ................................................ 1-32
5. Least Cost Dispatch Bidding and Scheduling Cost Impacts..................... 1-33
6. Background Summary Table.................................................................... 1-34
7. 2017 Market and Business Process Changes ......................................... 1-35
a. Demand Response Market Integration .............................................. 1-35
b. Commitment Cost Refinements......................................................... 1-36
c. Energy Imbalance Market and Operations ........................................ 1-36
d. 2017 LCD-Related Modeling and Process Changes ......................... 1-37
8. LCD Summary ......................................................................................... 1-37
C. Economically-Triggered Demand Response Programs.................................. 1-37
1. Introduction .............................................................................................. 1-37
2. Capacity Bidding Program ....................................................................... 1-39
a. Description......................................................................................... 1-39
b. Annual Summary of Results .............................................................. 1-40
1) Times and Duration of Program Dispatches................................ 1-40
2) Satisfaction of DR Program Trigger Conditions........................... 1-41
3) Non-Dispatch Occurrences ......................................................... 1-42
PACIFIC GAS AND ELECTRIC COMPANYCHAPTER 1
LEAST-COST DISPATCH AND ECONOMICALLY-TRIGGERED DEMAND RESPONSE
TABLE OF CONTENTS(CONTINUED)
1-iii
4) Dispatch Day Selection ............................................................... 1-46
3. SmartAC .................................................................................................. 1-47
4. Aggregator Managed Portfolio ................................................................. 1-47
5. Economically Dispatched Demand Response Summary ......................... 1-48
D. Conclusion...................................................................................................... 1-48

1-1
PACIFIC GAS AND ELECTRIC COMPANY1
CHAPTER 12
LEAST-COST DISPATCH AND ECONOMICALLY-TRIGGERED 3
DEMAND RESPONSE4
A. Introduction5
This chapter describes the Least-Cost Dispatch (LCD) practices and 6
procedures employed by Pacific Gas and Electric Company (PG&E or the Utility) 7
to meet its customers’ electric requirements in a least-cost manner during the 8
January 1 through December 31, 2017 record period. The testimony and 9
workpapers, taken together, provide a qualitative and quantitative demonstration 10
of LCD for each day during the record period.11
During the record period, PG&E complied with the California Public Utilities 12
Commission’s (CPUC or Commission) Standard of Conduct 4 (SOC4), relevant 13
Commission decisions, and PG&E’s 2014 Bundled Procurement Plan (BPP).114
SOC4 and the related CPUC decisions mandate that PG&E utilize its portfolio of 15
existing resources and market purchases to meet its electric load obligations 16
during the record period in a least-cost manner. In Decision (D.) 04-07-028, the 17
Commission ordered that system reliability and deliverability of power should be 18
included as part of LCD. PG&E complied with D.04-07-028 through bidding and 19
scheduling its resources into the California Independent System Operator 20
(CAISO) markets, as described below in Section B.2. The format of this chapter 21
and the associated workpapers is intended to conform with the requirements in 22
D.15-05-006, as modified by D.15-12-015, which adopted a methodology for 23
making an LCD showing in Energy Resource Recovery Account (ERRA) 24
Compliance proceedings (LCD Decisions).25
In addition, pursuant to the Settlement Agreement between PG&E and the 26
Office of Ratepayer Advocates (ORA) dated September 10, 2015, which was 27
approved by the Commission on December 15, 2016 in PG&E’s 2014 ERRA 28
Compliance proceeding (Application (A.) 15-02-023) (2014 ERRA Settlement), 29
1 PG&E’s 2014 BPP was approved in D.15-10-031 and was in effect during the 2017 record period.

1-2
this chapter also addresses agreed-upon additions to the testimony and 1
workpapers. These include the following:2
Testimony/ Workpaper
Section 2014 ERRA Settlement Requirement
B.3.b.1.d; Workpaper 6
An evaluation of PG&E’s price forecast accuracy for all days during the record period
B.3.b.4; Workpaper 1
A description of the decision-making process that PG&E performs to determine whether proxy or registered costs are selected for resources
B.3.b.8; Workpaper 2
Explanations of instances in which bids were not submitted for thermal resources
C Inclusion of PG&E’s dispatch of Demand Respond (DR) programs that have an economic trigger
The 2014 ERRA Settlement calls for: (1) an independent review of PG&E’s 3
short-term day-ahead load and price forecasts; and (2) an independent review of 4
PG&E’s hydro dispatch models, attendant processes, and dispatch results. In 5
consultation with ORA, PG&E hired consultants to conduct the independent 6
reviews. PG&E includes in this chapter descriptions and details to explain the 7
inputs and outputs of the load and price forecasts (Section B.3.b.1). Likewise, in 8
the hydro section of this chapter, PG&E includes descriptions and details to 9
explain the inputs and outputs of its hydro models (Section B.3.b.5). 10
In addition, pursuant to the Settlement Agreement between PG&E and ORA 11
dated November 16, 2016 (2015 ERRA Settlement), filed for approval in PG&E’s 12
2015 ERRA Compliance proceeding (A.16-02-019) and approved in 13
D.17-03-021, this chapter provides a demonstration of PG&E’s revisions and 14
updates of strategies based on above-normal deviations in the load and price 15
forecasts (Section B.3.b.1). Finally, this chapter includes further explanations 16
regarding renewable resource opportunity costs, and an explanation of 17
economic curtailment for PG&E’s renewable resources (Section B.3.b.11). 18
Section B of this chapter addresses LCD, and Section C addresses 19
economically-triggered Demand Response (DR).20
B. Least-Cost Dispatch21
1. Structure of LCD Section22
PG&E will demonstrate in this Section B and in the accompanying 23
workpapers that during the record period it correctly performed LCD. The 24

1-3
format of PG&E’s testimony and workpapers is based on the LCD Decisions 1
and consists of the following:2
Section Subject
B.2 Overview of Least-Cost Dispatch in the CAISO markets
B.3 PG&E’s Bidding and Scheduling Processes
B.4 Summary Reports/Tables – Annual Exception Rates
B.5 Least Cost Dispatch Bidding and Scheduling Cost Impacts
B.6 Background Summary Table
B.7 2017 Market and Business Process Changes
B.8 LCD Summary
PG&E is also providing detailed workpapers that are formatted 3
consistent with, and provide the information required by, the LCD Decisions.4
2. Overview of Least-Cost Dispatch in the CAISO Markets5
During the record period, PG&E managed its portfolio of contracted and 6
utility-owned resources consistent with SOC4, relevant Commission 7
decisions, and its 2014 BPP.8
SOC4 was initially adopted by the Commission in 2002, at a time when 9
all CAISO generation resource schedules were either directly matched by 10
the utilities to their customer loads, or procured and matched to forecast 11
customer loads via bilateral trades. However, as the Commission explained 12
in D.11-10-002 Finding of Fact (FOF) 1, “[o]n April 1, 2009, the CAISO 13
began implementation of [MRTU], which substantially changed the 14
least-cost dispatch processes of SCE and other utilities.” As the 15
Commission has noted, since 2009, “[t]he regulated energy utility is 16
responsible for scheduling and bidding its generation to the CAISO, but 17
once that is done, it is the CAISO’s responsibility to dispatch the 18
generation.”2 Thus, an overview of the CAISO markets is essential to LCD. 19
Since April 1, 2009, the CAISO operated day-ahead and real-time 20
markets, enabling market participants to offer or procure energy and 21
Ancillary Services (A/S) in the CAISO control area. The CAISO markets 22
2 D.14-05-023, FOF 15.
1-4
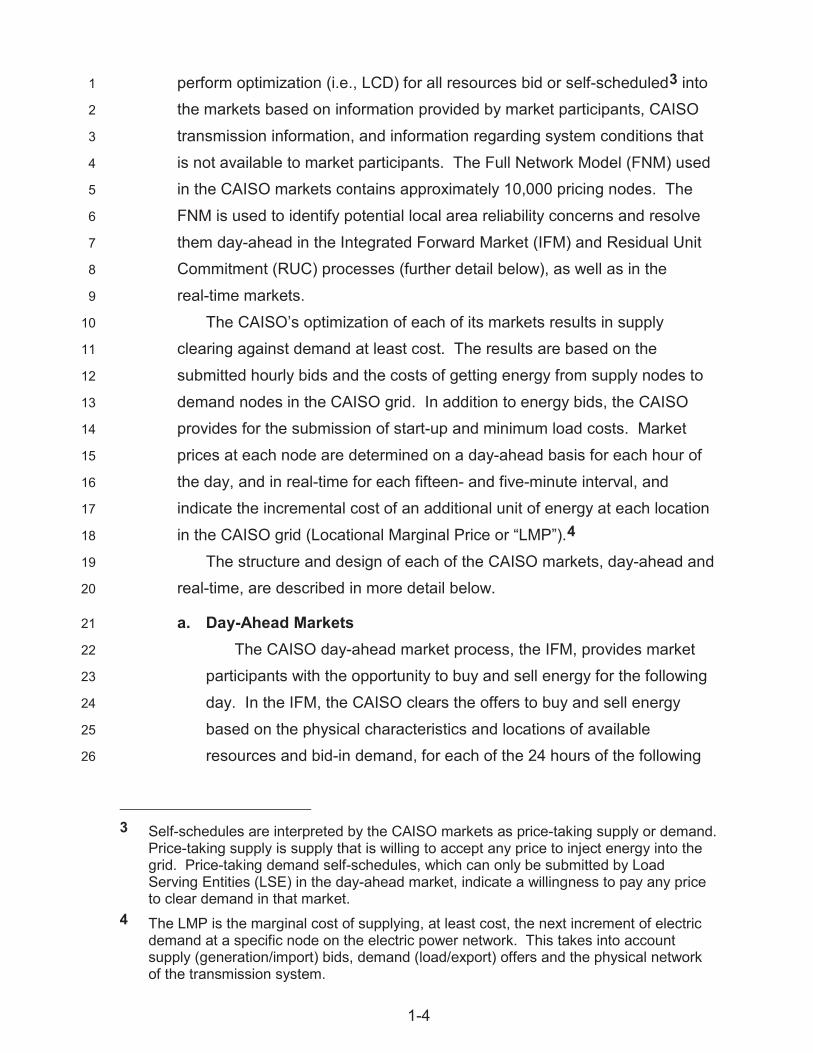
perform optimization (i.e., LCD) for all resources bid or self-scheduled3 into 1
the markets based on information provided by market participants, CAISO 2
transmission information, and information regarding system conditions that 3
is not available to market participants. The Full Network Model (FNM) used 4
in the CAISO markets contains approximately 10,000 pricing nodes. The 5
FNM is used to identify potential local area reliability concerns and resolve 6
them day-ahead in the Integrated Forward Market (IFM) and Residual Unit 7
Commitment (RUC) processes (further detail below), as well as in the 8
real-time markets.9
The CAISO’s optimization of each of its markets results in supply 10
clearing against demand at least cost. The results are based on the 11
submitted hourly bids and the costs of getting energy from supply nodes to 12
demand nodes in the CAISO grid. In addition to energy bids, the CAISO 13
provides for the submission of start-up and minimum load costs. Market 14
prices at each node are determined on a day-ahead basis for each hour of 15
the day, and in real-time for each fifteen- and five-minute interval, and 16
indicate the incremental cost of an additional unit of energy at each location 17
in the CAISO grid (Locational Marginal Price or “LMP”).418
The structure and design of each of the CAISO markets, day-ahead and 19
real-time, are described in more detail below.20
a. Day-Ahead Markets21
The CAISO day-ahead market process, the IFM, provides market 22
participants with the opportunity to buy and sell energy for the following 23
day. In the IFM, the CAISO clears the offers to buy and sell energy 24
based on the physical characteristics and locations of available 25
resources and bid-in demand, for each of the 24 hours of the following 26
3 Self-schedules are interpreted by the CAISO markets as price-taking supply or demand. Price-taking supply is supply that is willing to accept any price to inject energy into the grid. Price-taking demand self-schedules, which can only be submitted by Load Serving Entities (LSE) in the day-ahead market, indicate a willingness to pay any price to clear demand in that market.
4 The LMP is the marginal cost of supplying, at least cost, the next increment of electric demand at a specific node on the electric power network. This takes into account supply (generation/import) bids, demand (load/export) offers and the physical network of the transmission system.

1-5
day, and establishes LMPs for each of the approximately 10,000 nodes 1
within the CAISO system. The CAISO also uses the IFM to procure A/S 2
(regulation up, regulation down, spinning reserve and non-spinning 3
reserve) to ensure system reliability for the next day. Energy market 4
and A/S procurement are performed simultaneously using the CAISO’s 5
Security Constrained Unit Commitment algorithm, which minimizes total 6
costs based on submitted bids, the CAISO’s A/S requirements, and the 7
constraints on power flows imposed by the control area’s large and 8
complex transmission network.9
The CAISO’s market model recognizes load pockets that may be 10
exposed to local market power. The CAISO performs a Local Market 11
Power Mitigation (LMPM) process that identifies suppliers with local 12
market power and mitigates their supply bids to competitive default 13
bid levels.14
Because not all forecast load bid into the IFM will necessarily clear 15
in the market, the CAISO performs a second phase of the day-ahead 16
market process, the RUC, after the IFM to ensure that sufficient capacity 17
has an obligation to bid into real time to meet the CAISO’s own forecast 18
of control area load.19
LCD requires PG&E to bid or schedule its generation portfolio such 20
that it is generally dispatched to serve PG&E customer load if the 21
variable operating costs of the resources are lower than the alternative 22
CAISO market cost of energy. PG&E meets this requirement by offering 23
PG&E owned and contracted resources into the day-ahead market at 24
incremental cost,5 with the resulting awards of schedules determined by 25
the CAISO without regard to whether the scheduled resources are 26
PG&E controlled or from the other market participants.27
The CAISO should dispatch resources such that those with lowest 28
incremental costs are scheduled to meet PG&E customer loads at least 29
cost. In general, day-ahead prices have been more predictable and less 30
volatile than real-time prices. Thus, procuring the majority of energy to 31
5 Incremental cost refers to the variable costs of providing energy and does not include fixed costs that do not vary with output.

1-6
serve PG&E’s customer load in the day-ahead market enables LCD 1
while avoiding the volatility associated with real-time prices.62
b. Real-Time Markets3
The Real-Time Market is comprised of several overlapping market 4
processes, producing financially and/or physically binding awards and 5
prices that are used for energy and A/S settlements. 6
The Hour-Ahead Scheduling Process is an hour-ahead, non-binding 7
process run that runs every hour to yield feasible block schedules for8
imports and exports (permitting “tagging,” i.e., scheduling of supporting 9
transmission capacity across multiple balancing authorities) and 10
advisory (non-binding) price and internal schedule results.11
The Fifteen-Minute Market (FMM) process was introduced with 12
Federal Energy Regulatory Commission (FERC) Order 76413
implementation in 2014. The FMM process runs for successive 14
fifteen-minute intervals with updated CAISO forecasts of intermittent 15
resources and loads, and yields import/export schedules and financially 16
binding prices for all resources (imports, exports, and convergence bids 17
as well as CAISO balancing area resources). As in the day-ahead 18
markets, the LMPM process is run prior to each FMM run. Differences 19
between the day-ahead awards and FMM awards are settled at the 20
FMM prices. 21
Finally, the five-minute RTD process runs with updated CAISO 22
five-minute load and intermittent resource forecasts, to yield five-minute 23
prices, and physically binding dispatches for all internal resources. 24
Differences between the FMM awards and Real-Time Dispatch (RTD) 25
awards are settled at the RTD prices. Imbalances between RTD awards 26
and actual deliveries are priced at the RTD prices in each five-minute 27
interval. 28
6 The CAISO ultimately clears all control area demand physically in the real-time markets: this is fundamental to its mandate to serve California’s electricity needs reliably.

1-7
3. PG&E’s Bidding and Scheduling Processes1
a. Least-Cost Dispatch Guidelines and Principles2
1) Least-Cost Dispatch Principles3
As explained in the Commission-approved 2014 BPP that was 4
in effect during the record period, PG&E has adopted the following 5
seven principles to guide its procurement and LCD activities:76
PG&E aims to minimize the total cost of energy required to meet 7
load and A/S requirements, subject to regulatory, legal, 8
operational, contractual, and financial requirements.9
PG&E’s scheduling and bidding process considers all 10
regulatory, legal, safety, operational, contractual and 11
financial requirements. Subject to these requirements, the 12
scheduling and bidding process aims to provide the CAISO 13
flexibility in dispatching the resources across the day-ahead and 14
real-time markets.15
PG&E supports LCD by explicitly considering the incremental 16
costs of all resources available to it in scheduling or bidding 17
decisions.18
PG&E integrates any local area reliability requirements, 19
day-ahead scheduling requirements, and deliverability 20
requirements into its scheduling or bidding decisions.21
The CAISO markets perform LCD for all resources 22
bid/scheduled into the markets based on information provided 23
by all market participants, transmission information that is solely 24
available to the CAISO, and information regarding system 25
conditions that are solely available to the CAISO.26
The parameters and forecasts that PG&E has ability to control 27
with regard to LCD are the following: PG&E load forecast; 28
market price forecast; incremental heat rate; and Master File 29
submission. These parameters and forecasts are used in the 30
calculation of submitted bids and/or schedules.31
7 See also 2014 BPP, Appendix K.

1-8
LCD activities are subject to forecast and market uncertainties, 1
including those associated with actual customer loads, behavior 2
of other market participants, actual energy deliveries from 3
Qualifying Facilities (QF) and intermittent resources, non-public 4
transmission constraints, and CAISO reliability-based 5
discretionary decisions.6
PG&E followed the principles described above during the record 7
period. The principles described above remain essential for 8
achieving LCD and meeting all safety, regulatory, legal, operational 9
and financial requirements associated with PG&E’s portfolio. 10
For resources with bidding rights, PG&E bids these resources 11
into the CAISO markets based on their incremental costs or 12
opportunity costs.8 By bidding its resources into the CAISO 13
markets at their incremental or opportunity costs, PG&E enables 14
total procurement to meet customer demand in the CAISO markets 15
to be at the least cost. Resources with contractual or physical 16
constraints that limit their ability to be bid are self-scheduled into the 17
CAISO markets. 18
2) Incremental Costs19
With resources that have flexibility to be dispatched, PG&E 20
schedules9 or bids resources into the CAISO markets at the 21
incremental cost of providing energy, considering the variable 22
operating cost of its resources and the market price forecast. 23
Resource costs that increase or decrease depending on how the 24
resource runs are properly treated as incremental costs. Fixed 25
costs that are not affected by how resources are dispatched, such 26
as capital investment costs or contract capacity payments, are 27
treated as sunk costs and therefore not incorporated into energy 28
bids. For resources with energy or starts constraints, incremental 29
8 For those resources with energy, curtailment, or starts limitations, the opportunity cost reflects the value of not being able to use the resource’s flexibility in a future time period.
9 Schedules commonly refer to self-schedules whereas bids refer to price-quantity offers to sell or buy in the CAISO markets.

1-9
costs may also include the opportunity cost of not using the 1
resource in the future.2
Incremental costs are categorized as: (1) start-up costs; 3
(2) minimum load costs; and (3) incremental energy costs. Start-up 4
costs are the costs to start up a resource and bring it to its minimum 5
operating level; for Multi-Stage Generation (MSG)10 resources, 6
“state transition costs” representing the start-up of resource subunits 7
are similar to startup costs. An additional opportunity cost 8
component may be added to start-up costs when a limit on cycling is 9
expected to be binding over a period of months or years.10
Minimum load costs are the costs to operate a resource at its 11
minimum operating level for one hour.12
Minimum load, start-up, and transition costs may include fuel 13
costs and Greenhouse Gas (GHG) costs as well as variable 14
Operations and Maintenance (O&M) costs, and documented Major 15
Maintenance Adder costs of inspections and overhauls that are 16
incurred, under warranty or other contract provisions, based on run 17
hours or cycles. 18
Incremental energy bid costs include those incremental or 19
opportunity costs that vary directly with the generation of each 20
additional megawatt-hour (MWh) above the minimum operating 21
point. For example, fuel costs and variable O&M costs vary directly 22
with energy output.23
Resources with no explicit fuel cost, such as hydroelectric 24
plants, are bid/scheduled based on their opportunity costs, which 25
are equivalent to fuel costs in their effect on bids. Hydroelectric 26
watersheds operate subject to complex constraints on minimum and 27
maximum canal flows, minimum and maximum reservoir storages, 28
and restrictions on changes in flow and storage, which may depend 29
on season. These constraints include FERC powerhouse license 30
requirements, safety, maintenance, and environmental constraints, 31
10 MSG resources are described in further detail in the “Thermal Resource Bidding and Scheduling” section of this chapter.

1-10
constraints due to emergency drought declaration, and limits due to 1
uncontrollable inflows into the watershed from natural sources or 2
other water entities. For hydro resources, the opportunity cost is the 3
future value of water. It may be more prudent and lower cost in the 4
long run to defer hydro generation to higher value future periods 5
rather than using it in the current day to receive a price below its 6
opportunity cost.7
In addition to its large (in number, total capacity, and total 8
energy) portfolio of utility-owned thermal, hydro, and solar 9
resources, PG&E also bids and schedules contracts under tolling 10
agreements, and intermittent and other renewables resources. 11
Incremental costs of tolling agreements are based on contract 12
terms, reflecting the actual costs of dispatch paid by PG&E’s 13
customers.14
Renewable resources for which PG&E has contractual bidding 15
and scheduling rights are bid pursuant to Appendix K of the 16
2014 BPP.17
3) Self-Scheduling18
A portion of PG&E’s supply portfolio is must-take11 or 19
must-run,12 due to safety, environmental and license constraints, 20
regulatory requirements, contract terms (e.g., certain renewable 21
11 Regulatory Must-Take Generation is defined as generation from the following resources that the relevant Scheduling Coordinator (SC) schedules directly with the CAISO as Regulatory Must-Take Generation: (1) Generation from Generating Units subject to (a) an Existing QF Contract or an Amended QF Contract, or (b) a QF Power Purchase Agreement (PPA) for a QF 20 megawatts (MW) or smaller pursuant to a mandatory purchase obligation as defined by federal law; (2) Generation delivered from a Combined Heat and Power (CHP) Resource needed to serve its host thermal requirements up to RMTMax in any hour; and (3) Generation from nuclear units. SeeCAISO Conformed Tariff, November 30, 2016.
12 Regulatory Must-Run Generation is defined as Generation Hydro Spill Generation and Generation which is required to run by applicable federal or California laws, regulations, or other governing jurisdictional authority. See CAISO Conformed Tariff, November 30, 2016. Such requirements include, but are not limited to, hydrological flow requirements, environmental requirements, such as minimum fish releases, fish pulse releases and water quality requirements, irrigation and water supply requirements, or the requirements of solid waste Generation, or other Generation contracts specified or designated by the jurisdictional regulatory authority as it existed on December 20, 1995, or as revised by federal or California law or Local Regulatory Authority.

1-11
resources and QF resources) or because it is inherently non-1
dispatchable (e.g., run-of-river hydro with no reservoir controls). 2
Because such generation is inflexible, PG&E self-schedules 3
must-take supply in the day-ahead market and then modifies these 4
self-schedules in real-time if the forecast of generation has changed.5
A relatively small number of PG&E’s contracts, tolling 6
agreements, and the Puget Exchange have dispatch flexibility on an 7
earlier contractual timeline from the CAISO markets, and hence 8
must be self-scheduled by PG&E and cannot be bid into the market. 9
The best price forecast available at the time of the scheduling 10
decision is used in PG&E optimization program runs to determine 11
the best self-schedules of these resources.12
In addition to must-take and must-run resources and bilateral 13
contracts which are purely self-scheduled, other resources are 14
periodically or partially self-scheduled for particular purposes. 15
Self-schedules may be used when testing is to be performed on 16
resources, or when resources such as hydro plants need to be run 17
above their minimum operating limits in order to ensure that water is 18
not spilled or is used according to operating constraints. Resources 19
may also be “self-committed,” which refers to instances in which a 20
resource is self-scheduled at minimum, and its remaining available 21
capacity is bid into the markets.22
4) Constraints23
a) Operational Constraints24
In addition to meeting load obligations at minimum cost, 25
PG&E also incorporates safety, operational, physical, legal, 26
regulatory, and environmental constraints into bidding and 27
scheduling decisions.28
One example of operational constraints are those imposed 29
by FERC licenses on the operations of PG&E’s hydroelectric 30
system. For example, FERC licenses may include 31
requirements for fish and wildlife maintenance (e.g., flows for 32
fish and water quality that bypass generators and thus produce 33

1-12
no electricity), recreation (e.g., seasonal minimum reservoir 1
water levels), and safety (e.g., constraints on reservoir 2
drawdowns). Such considerations may not be readily apparent 3
in a cost-only analysis of PG&E’s bidding and scheduling 4
decisions.5
b) Local Area Reliability and Delivery Constraints6
D.04-07-028 mandated that utilities consider local area 7
reliability and “deliverability” of energy to serve load in its 8
bidding and scheduling decisions, in addition to minimizing 9
costs. PG&E complied with D.04-07-028 through bidding and 10
scheduling its resources into the CAISO markets. The CAISO 11
considers local area reliability and deliverability in its dispatch 12
decisions.13
b. 2017 Least-Cost Dispatch Business Process Overview14
PG&E’s daily LCD business processes encompass the forecasting 15
of loads and prices, the bidding of customer demand and PG&E-16
scheduled supply, and the validation and analysis of market results. 17
Each of these processes is described in the following sections.18
1) Load and Price Forecasts19
a) Load Forecast Process20
PG&E’s LCD processes use a vendor-supplied short-term 21
area load forecast. The inputs to the short-term load forecast 22
are actual historical loads for the PG&E system based on 23
Supervisory Control and Data Acquisition (SCADA), provided at 24
an hourly granularity; and actual and forecast temperatures for 25
six representative weather stations in the PG&E service 26
territory, provided by external weather forecast vendors. 27
Under special circumstances either the inputs to the vendor 28
model, or the model outputs, may be modified by PG&E in order 29
to correct for failures in data communications or special 30
circumstances (i.e., holiday periods) that are not captured 31
adequately by the forecast model.32

1-13
The outputs of the short-term load forecast are an hourly 1
forecast of load for the PG&E area for the current day and out to 2
six days in the future; and as a check on the inputs, an hourly 3
forecast of composite area temperatures used to develop the 4
load forecast.5
The “seven-day” hourly-load forecast provided by the 6
vendor is adjusted to produce a forecast of PG&E’s bundled 7
customer load. The PG&E area load forecast is adjusted by 8
subtracting estimates of transmission losses, municipal loads in 9
the area, and forecasts of Direct Access and Community Choice 10
Aggregation loads in the PG&E area. PG&E uses this 11
seven-day short-term forecast of bundled customer load in 12
creating load bids for each of the next six days. 13
b) Evaluation of Load Forecast Accuracy14
In this section PG&E provides an evaluation of the accuracy 15
of its day-ahead load forecast during the record period.16
The most common metric used to evaluate the relative 17
quality of load forecasts in the utility industry is Mean Absolute 18
Percentage Error (MAPE). This metric measures both the 19
magnitude and frequency of errors, and is similar to the Root 20
Mean Square Error (RMSE) metric except that it puts a higher 21
weight on larger errors relative to RMSE. The metric is 22
expressed as a percentage of some value. In the case of load 23
forecasts, MAPE is expressed as a percentage of actual hourly 24
load.25
Average MAPE of the short-term load forecast was slightly 26
above 2 percent during the record period. Unusually high 27
deviations (e.g., above 5 percent), which occurred on 6 days 28
(most associated with holidays and weekends) were reviewed 29
and discussed with the vendor to determine the source of 30
errors, and depending on that analysis resulted in adjustments 31
to the forecast model itself by the vendor.32

1-14
c) Price Forecast Process1
PG&E uses its price forecast for the following purposes. An 2
hourly next-day price forecast is used to determine self-3
schedules in the day-ahead market for those resources where 4
Self-Scheduling is required by contract terms or operational 5
requirements (as in the case of hydro resources subject to flow 6
constraints). A longer-term price forecast, ranging from several 7
days up to two years, is used for resources with opportunity 8
costs. The longer-term price forecast is needed to estimate the 9
relative value of dispatching the resources next day versus at 10
later points in time.11
In previous years, PG&E’s short-term price forecast was 12
based on a regression of recent loads and gas prices against 13
hourly electric prices. The coefficients of the regression were 14
recalculated (or “recalibrated”) frequently to use the most recent 15
data on actual loads and prices. 16
Beginning in 2016, PG&E evaluated an alternative approach 17
to price forecasting. PG&E evaluated using a vendor of a 18
neural network forecast to 19
provide an independently produced forecast on demand. Over 20
six months, PG&E measured the accuracy of the vendor 21
forecast versus its own and determined that the vendor forecast 22
(i) was measurably, and consistently, more accurate on average 23
than PG&E’s internal forecast; (ii) responded more quickly to 24
changes in the “shape” of prices (for example, which hours were 25
highest or lowest); and (iii) required less manual intervention by 26
analysts than PG&E’s own forecast.27
Accordingly, during 2017, PG&E transitioned from its own 28
regression-based forecast model to the vendor neural-network 29
based forecast model, completing the transition mid-year. The 30
transition, in addition to improving the accuracy of the short-term 31
price forecast, streamlined business processes and reduced the 32
need for manual intervention. During the record period PG&E 33

1-15
continued to review the reasonableness of the daily forecasts 1
produced by the vendor.2
d) Evaluation of Price Forecast Accuracy3
In this section, PG&E provides an evaluation of the 4
accuracy of its day-ahead price forecast during the record 5
period using the metric of mean average percentage error, or 6
MAPE.13 Taken together this section and Workpaper 6 offer 7
PG&E’s evaluation of its day-ahead price forecast accuracy as 8
requested by ORA in the 2014 ERRA Settlement.9
As described above, PG&E switched to using a vendor price 10
forecast in 2017.11
The MAPE on average before the model switch was 12
18.6 percent and the average after the switch was 10.4 percent. 13
2) Load Bidding14
The CAISO day-ahead markets offer LSEs, such as PG&E, the 15
capability to bid some or all of their forecast loads into a day-ahead16
market, to try to reduce the total cost of serving these loads.17
PG&E evaluates the relative costs of serving customer loads in 18
the day-ahead versus real-time markets, based on actual past 19
market outcomes that provide insights into future outcomes. 20
21
22
3) Thermal Resource Bidding and Scheduling23
PG&E’s portfolio of dispatchable thermal power plants (all using 24
natural gas as their primary, if not exclusive, fuel) are either owned 25
by PG&E or contracted from counterparties through tolling 26
agreements.27
D.02-12-069 provides that, “prohibited utility conduct under this 28
standard includes any action that results in preference to 29
utility-retained generation resources or the utility’s own negotiated 30
13 Daily MAPE = | | .

1-16
contracts.”14 PG&E makes no distinction between its own 1
resources and contracted resources in its bidding practices: All 2
resources are bid or self-scheduled into the CAISO markets based 3
on their incremental costs, recognizing safety, regulatory, legal, 4
operational, and financial requirements. 5
PG&E-owned plants and tolling agreement plants that can be 6
bid into the CAISO markets are bid at incremental cost consistent 7
with operational and contract constraints, as described in 8
Section 3.a.2. The incremental cost of energy consists of 9
incremental fuel costs and any other costs that vary between the 10
minimum and maximum points of a plant’s operating range.11
The incremental cost of minimum load is similarly estimated as 12
the minimum load fuel cost and any other costs that are incurred in 13
every hour that the plant runs (for example, hourly operating 14
charges included or imputed in plant long-term service agreements). 15
The incremental cost of starting a plant (or in the case of a multi-unit 16
plant, starting a unit at the plant) is estimated as the fuel and other 17
inputs required for a start along with other costs incurred for every 18
start (such as start charges included or imputed in plant long-term 19
service agreements).20
In its portfolio, PG&E has a number of MSG resources, which 21
are resources that have multiple operating configurations that can 22
be characterized as having distinct operating parameters. Often 23
these resources require time and/or incur costs to move from 24
one configuration operating range to another. For example, 25
combined cycle gas turbine (CCGT) plants consist of a steam 26
turbine (ST) and multiple gas turbines (GT) run in combination so 27
that GT waste heat can be used to power the ST. Dispatch of 28
CCGT plants therefore requires consideration of the cycling (startup 29
and shutdown) of individual turbines. In order to better represent 30
this consideration in the CAISO markets, to help combined cycle 31
plants better comply with CAISO dispatch instructions, and to better 32
14 D.02-12-069 at pp. 62-63.

1-17
represent multiple GTs at a single location (which would otherwise 1
be treated as a single resource with a continuous dispatch range) 2
the CAISO developed the MSG resource model. The MSG model 3
was used by PG&E during the record period to model PG&E’s 4
portfolio of fossil generation CCGT plants.5
4) Description of Proxy/Registered Cost Determination for 6
Thermal Resources7
The section describes PG&E’s procedures for evaluating proxy 8
versus registered cost determination for the small set of resources 9
allowed to make such a determination, so that taken together this 10
section and the workpapers offer complete documentation of the 11
proxy/registered cost determination for thermal resources as 12
requested by ORA in the 2014 ERRA Settlement. 13
In addition to energy bids, the CAISO provides for the 14
submission of start-up and minimum load costs. The CAISO 15
enables certain gas fired resources to submit minimum load and 16
start-up cost parameters either as “proxy” costs or “registered” 17
costs. Proxy costs are calculated by the CAISO as the product of a 18
fuel use times a fuel cost index plus other costs. Registered costs 19
are required to be a single dollar value for no less than 30 days at a 20
time, and can reflect both fuel and a facility’s specific non-fuel costs 21
including longer-term maintenance costs that vary with number of 22
starts or number of hours running at minimum load. Registered 23
costs are capped at 1.5 times a CAISO calculation of proxy fuel 24
costs, performed when cost changes are submitted to the CAISO 25
Master File.26
CAISO changes made in 2015 eliminated the registered cost 27
option for all but use-limited gas-fired resources, where use limits 28
had to be documented and accepted by CAISO for each such 29
resource. An example of a use limit is a limit on the emissions from 30
a power plant, expressed as a limit on the number of “cycles” 31
(startups and shutdowns of turbines) at the plant over a rolling 32
1-year period. 33

1-18
In the portfolio of thermal resources or tolling agreements with 1
PG&E as SC, five were qualified as use-limited in 2017. These 2
resources have constraints on starts or run hours.3
During the last week of each month, the five qualified 4
use-limited resources are evaluated to determine the cost basis 5
election of either proxy or registered. The proxy cost option is the 6
default choice given that the commitment costs can be updated 7
daily, but the projected CAISO proxy costs are compared to the 8
projected forecast costs to check if the proxy costs are sufficient. 9
The projected CAISO proxy costs are calculated based on the 10
CAISO proxy gas prices, GHG prices, gas transport adders, and 11
default Variable Operating and Maintenance (VOM) adders for the 12
operating month. The projected forecast costs are based on the 13
latest gas forward prices, GHG forward prices, gas transport adders, 14
and PPA VOM adders. If the projected proxy costs are so low that 15
the projected forecast costs are higher by , then the 16
registered cost basis will be chosen instead.17
During 2017, for every month PG&E used the proxy cost option 18
to determine the commitment cost basis for each of the five use-19
limited thermal resources.20
5) Hydro Resource Bidding and Scheduling21
Hydro generation is energy-limited due to the limited and 22
uncertain availability of water. Water in reservoirs from natural 23
inflows may be considered a limited zero-cost fuel, except in the 24
case of pumped storage hydro (where pumping water uphill to serve 25
as future fuel requires the purchase of electricity from the CAISO 26
markets, but effectively makes the fuel limited only by the cycling 27
capability and reservoir capacities of the plant).28
To the extent that the availability of water can be controlled, it is 29
prudent to store water so as to generate when the power is most 30
valuable, ultimately those times with the highest hourly prices in the 31
CAISO’s day-ahead and real-time markets. Thus, least-cost 32
hydroelectric dispatch is achieved in the CAISO markets by 33
bidding/scheduling hydro resources based on their estimated 34

1-19
opportunity costs (which reflect their energy limitations and forecasts 1
of the future value of water not used in the current scheduling 2
period). CAISO also allows hydro resources to bid limits on total 3
energy dispatched in a single day. If bid, hydro resources should be 4
dispatched only when energy is available and the LMP meets or 5
exceeds the estimated opportunity costs. Depending on operating 6
constraints (such as safety, FERC license requirements, 7
recreational use requirements, or environmental restrictions), some 8
hydro generation is self-scheduled or bid at a price close to zero, to 9
indicate that some flow through the watersheds is not controllable, 10
except possibly by diverting it from particular plants (“spilling” the 11
water) and thus losing any opportunity to generate with it at 12
these plants.13
Hydro resources have their highest value to customers when 14
they either realize high market prices, offsetting customer costs in 15
high-price periods, or when they have the effect of avoiding high 16
prices. Avoided costs are evaluated based on comparison to 17
historical periods or forecasts of future periods to estimate the risk of 18
high-market prices or capacity shortage. In addition, the energy and 19
capacity markets provide short-term price signals, in the form of 20
high A/S or capacity prices, that also help identify high-risk, 21
high-value periods.22
LCD of PG&E’s hydroelectric resources requires that 23
uncertainties in future hydrological system conditions (stream flows, 24
precipitation, temperatures, etc.) and uncertainties in the future 25
value of energy and A/S be incorporated into planning models over 26
future seasons. PG&E’s operation of energy-limited resources, 27
such as hydro, involves decisions that may span multiple months 28
and years. Hydro conditions, end-of-year reservoir target levels, 29
market conditions, and scheduled plant outages affect the 30
optimization of hydro operations in the “short term,” meaning 31
two years or less. Sufficient storage is required to allow for dry year 32
(drought) conditions for the year after the current year. The 33
two-year cycle is used because using either too much or too little 34

1-20
water from the large reservoirs in PG&E’s hydro system may leave 1
the system vulnerable to either drought or storm conditions in the 2
following year.3
a) Modeling Inputs4
The inputs to PG&E’s mid-term hydro planning models are: 5
– Static characteristics of generators, reservoirs and canals 6
and the network configurations of the watersheds;7
– Energy and A/S price forecasts;8
– Reservoir storage inflow forecasts;9
– Outage schedules of generators (and at Helms pumped 10
storage plant, the pumps);11
– Reservoir storage initial volumes;12
– Other reservoir operational constraints; and13
– Canal/waterway flow constraints.14
b) Modeling Outputs15
Outputs of the mid-term hydro planning model consist of: 16
– Hourly MW schedules for all represented plants; 17
– Hourly A/S schedules for A/S capable plants; 18
– Forecast energy and A/S revenues; 19
– Forecast water releases from reservoirs and resulting 20
storage levels; 21
– Flows on all canals/waterways; and22
– Forecasted water values.23
c) Implementation and Use of Modeling Results24
Mid-term hydro planning models generate forecasts of 25
optimal water plans for each of PG&E’s watersheds using 26
assumptions about forward prices, considering safety, physical, 27
operational, and license constraints. The models produce 28
decisions on target reservoir storages, and end-of-month water 29
values, over the entire water planning horizon, as well as 30
nominal hydro generation schedules at each PG&E 31
powerhouse. The most recently generated water plans 32
provide guidance in planning the storage and drafting of 33

1-21
reservoirs, maintenance of hydro powerhouses, and 1
assumptions about availability of hydro generation and A/S 2
over the model’s horizon.3
The nearest term outputs of the mid-term hydro planning 4
models are their end-of-month target reservoir storage levels 5
and marginal water values for the current and following months 6
of the model’s optimization horizon. These targets and water 7
values are used as starting points in shorter-term hydro 8
optimization. PG&E uses a combination of network optimization 9
models and water balance spreadsheet models to forecast 10
week-ahead powerhouse operations at each dispatchable 11
powerhouse. Thus, the network optimization and water balance 12
models forecast bids or schedules of hydro resources based on 13
the most current information on end-of-month reservoir targets, 14
water values, actual hydro conditions, and CAISO market 15
energy and A/S prices.16
Multi-day hydro operations forecasts, based on forecasts of 17
prices and hydro inputs such as inflows, are translated into 18
next-day preferred operating schedules for each powerhouse. 19
The opportunity costs associated with departing from these 20
preferred schedules depend on the nature of the constraints on 21
operations, if any. These opportunity costs, along with the 22
end-of-month water values associated with reservoir planning 23
targets, are used to calculate bids to adjust up or down from the 24
preferred schedule levels (in case of no flexibility, the preferred 25
schedules become self-schedules). Bids and schedules are 26
submitted to the CAISO.27
6) Hydro Self-Scheduling Decisions28
In this section, PG&E includes a description of the rationales for 29
hydro self-schedules during the record period in order to provide 30
additional information on the operational constraints in the hydro 31
LCD process as requested by ORA in the ERRA 2014 Settlement. 32
Each self-schedule is done for one of the following three reasons:33

1-22
a) Self-Scheduling Required During and After Storms1
Under certain storm conditions, much or all of PG&E’s 2
hydroelectric system can become effectively “run of river” hydro, 3
meaning that it cannot be controlled by dispatch decisions. 4
Under such conditions, PG&E’s hydro is represented in the 5
market systems by self-scheduled forecast hourly generation in 6
the markets.7
b) Self-Scheduling in Other Conditions With Limited Operating 8
Flexibility9
Constraints on the hydroelectric system for irrigation, 10
recreation, environmental, or safety reasons may be expressed 11
in terms of minimum flows or minimum releases from reservoirs; 12
such constraints may in general require flows through 13
powerhouses that exceed the rated minimum flows, thus 14
requiring self-schedules at levels above minimum generating 15
level for specific hydro resources. Additionally, limited 16
capacities of small forebay reservoirs may require minimum 17
guaranteed powerhouse flows, implemented as self-schedules, 18
to ensure the safe operation of those small reservoirs.19
c) Self-Commitment to Indicate Preferred Ancillary Service 20
Providing Resources21
Hydroelectric resources supply a significant amount of 22
PG&E’s supply of A/S, including regulation and spinning 23
reserves. In cases where experience shows that price signals 24
alone may result in excessive cycling of resources to provide 25
A/S, PG&E may elect to self-schedule particular hydro 26
resources to ensure that A/S are provided in the most efficient 27
and effective way.28
7) Helms Pumped Storage Plant Bidding and Scheduling29
The Helms Pumped Storage Plant (Helms) is a located on the 30
Kings River watershed, situated between an upper reservoir, 31
Courtright Lake, and lower reservoir, Lake Wishon. It has three 32
generators that can be reversed to act as pumps, and has an 33

1-23
installed generation capacity of 1,212 MW and a pump capacity of 1
930 MW. Helms has the capability of increasing its Courtright 2
forebay (Courtright) reservoir storage by pumping water from the 3
Lake Wishon uphill to Courtright. Helms is subject to physical 4
hydrological operating constraints and hydro uncertainties like any 5
other of PG&E’s hydro resources.156
LCD of Helms requires evaluation of the opportunity cost of 7
stored water and, in addition, requires that pumping be evaluated 8
based on the benefits of incremental generation. LCD of Helms also 9
requires evaluation of how best to use the generating capacity of the 10
plant, which can provide reserves and regulation as well as energy. 11
Because reserves generally have highest value in the same periods 12
that energy has highest value, total costs to customers are 13
minimized when the Helms schedule has maximum value 14
considering both energy and reserves. The plant may therefore not 15
be dispatched to its maximum generation output in the market, so 16
that its undispatched capacity may provide high value A/S.17
The mid-term hydro planning optimization model is used to 18
determine reservoir storage targets and water values for Courtright 19
(forebay) and Wishon (afterbay) reservoirs on a monthly basis 20
through the end of the year following the current year. Reservoir 21
planning for Helms differs from that on other watersheds in that 22
inflows to the afterbay can be pumped to the forebay for later use; 23
and mid-term planning model outputs therefore include a pumping 24
plan over the horizon of the model.25
Short-term hydro planning for Helms is based on the mid-term 26
month-end reservoir targets and water values, as it is for other 27
watersheds. Adjustments within the month are made based on 28
realized inflows as well as short-term price forecasting. The 29
resulting preferred operating schedules for Helms may include some 30
pumping and some generation and A/S. Additional pumping may be 31
15 For more information on Helms in the context of PG&E’s Hydroelectric System and PG&E’s Portfolio Management, see “Chapter 2: Utility-Owned Generation: Hydroelectric.”

1-24
economic in the short term if additional generation and A/S (above 1
the forecast/preferred schedule) is valuable enough; likewise, 2
additional generation and/or A/S may be economic in the short term 3
if additional pumping is at low enough cost (the LMP paid for 4
pumping energy). This incremental ability to pump and generate or 5
provide A/S is included in the bids submitted for Helms to the 6
CAISO markets.7
8) Battery Storage Bidding and Scheduling8
During the record period, PG&E continued to bid its 9
dispatchable storage batteries to test CAISO software capabilities 10
and limitations and to identify feasible charge/discharge cycles. 11
PG&E’s two owned battery resources participated in the CAISO 12
markets and were used to evaluate several potential models of 13
market revenue maximization. 14
Two market models were available in the CAISO markets during 15
the record period. The Non-Generator Resource (NGR) market 16
model allows a combination of energy bids and A/S bids to receive 17
CAISO market awards. The NGR model constrains charge and 18
discharge to keep the battery between minimum and maximum 19
State of Charge (SOC) limits. 20
The Regulation Energy Management (REM) market model 21
allows batteries to bid only to provide regulation up and down in the 22
CAISO markets. Under this model, a battery can bid regulation up 23
and down in one or more hours, but it cannot bid or self-schedule 24
energy. The CAISO is responsible for maintaining the SOC of a 25
REM battery at approximately 50 percent to the extent feasible. If 26
the resource’s SOC makes it impossible to regulate, the resource 27
will still receive its regulation capacity payments, even though it is 28
unable to physically regulate until its SOC makes regulation 29
possible again.30
The incremental cost of battery discharge is based on the 31
battery’s cycling efficiency and cost of charging. After testing, 32
PG&E determined that the advantages of having the CAISO 33
manage the SOC in the REM model did not outweigh the benefits of 34

1-25
energy arbitrage value possible under the NGR model. Accordingly, 1
both batteries were bid using the NGR market model for the majority 2
of the year.3
Overall, the purpose of operating the batteries in the market 4
combined the objectives of maximizing revenues from the resources 5
under a known strategy (e.g., bidding the resources into the 6
regulation markets) and testing new approaches that might yield 7
new sources of value or have application to future operations of 8
batteries in the CAISO markets (e.g., representing customer-side 9
uses of the batteries or distribution-level operating restrictions). 10
11
12
13
14
15
16
9) Resource Bid Non-Submission17
In this section, PG&E provides a description of the rationales for 18
thermal resource bid non-submission during the record period. 19
“Thermal resource bid non-submission” here means non-submission 20
of bids in periods when a resource is not on outage, i.e., not 21
explicitly limited by a clearance in the CAISO’s Outage Management 22
System (OMS). Resources on outage are not included here, 23
because they may or may not have bids created for them, 24
depending on whether bids are created as a backup to address 25
unexpected early returns from outage. Workpaper 2 provides 26
additional detailed explanations for instances in which bids were not 27
submitted for thermal resources. Taken together, this section and 28
the workpapers offer complete documentation of thermal bid 29
non-submission decisions as requested by ORA in the 2014 ERRA 30
Settlement.31
Gas-fired and other fossil fuel thermal plants are in general 32
subject to limits (e.g., emissions limits) that translate into limits on 33
startups and shutdowns over each year and over subperiods, 34

1-26
potentially even daily subperiods, of the year. To stay within the 1
limits and to guarantee the availability of some thermal resources to 2
serve customers in the periods of the year with expected highest 3
need, PG&E reserves the right not to bid some or all of the resource 4
capacity in other periods of the year, subject to meeting all 5
Resource Adequacy (RA) and other contractual or reliability 6
constraints on the resource.7
10) Market Transactions8
Bilateral transactions in the CAISO day-ahead markets take 9
two forms: (1) financial transactions, known as “inter-SC trades” or 10
“bilateral swaps,” which trade the difference between a fixed price 11
and the CAISO’s day-ahead IFM prices at a given location without 12
involving any delivery of energy to the grid; and (2) physical 13
transactions at the intertie points (also known as scheduling points), 14
which require physical scheduling of an import or export and are 15
settled in the CAISO day-ahead market just as other supplies or 16
demands are settled.17
Day-ahead financial bilateral transactions (i.e., within the CAISO 18
balancing area) and bilateral physical transactions (i.e., at CAISO 19
interties) were used to settle existing energy procurement contracts. 20
During the record period, PG&E continued to close its financial and 21
physical positions by transacting in the CAISO markets, with the 22
important exceptions of imports from, and exports to, outside of the 23
CAISO control area.24
Imports and exports require physical scheduling into the CAISO 25
markets, “tagging” to match schedules across balancing authority 26
control areas, and a separate bilateral financial settlement with 27
counterparties outside of the CAISO control area. PG&E imports 28
included energy associated with renewable contracts, 29
energy required to meet RA targets, and the long-term Puget 30
Exchange contract.31

1-27
11) Must-Take Resources and Contracts1
Must-take resources, unlike dispatchable resources, have no 2
flexibility in the delivery of energy; whatever energy they produce 3
must be taken by the transmission grid. The exception for 4
must-take resources is when transmission constraints make it 5
physically impossible for the power to flow. Must-take 6
resources include:7
i) Existing Qualifying Facilities: PG&E’s existing QF PPAs allow 8
QFs to decide what level of generation to provide. Existing QF 9
PPAs are considered must-take resources;10
ii) Combined Heat and Power: Contracts allow certain CHP 11
resources to determine the level of supply they will provide;12
iii) Renewable energy contracts and resources without bidding 13
rights for economic dispatch;14
iv) Diablo Canyon Power Plant (DCPP);15
v) Existing/Legacy Contracts: PG&E had obligations to purchase 16
or exchange power under existing contracts which were settled 17
as financial inter-SC trades; and18
vi) Must-Run Hydro Generation: Certain power plants have 19
environmental, licensing or physical requirements that require 20
continuous operations.21
During the record period, there were 22
. These are discussed in 23
Section 5.24
12) Economic Bidding of Renewable Resources25
During the record period, PG&E’s portfolio included utility 26
owned and contracted renewable resources with economic 27
bidding capabilities and rights described in PG&E’s 2014 BPP. 28
Economic bidding of these resources captures the opportunity 29
costs associated with the contractual and the operational 30
constraints of these resources.31
In all cases of economic bidding of renewable resources, 32
33
34

1-28
1
2
3
4
5
6
7
8
Economic curtailment of renewables occurs when market 9
prices fall to, or below, 10
. Thus, the market, not 11
PG&E, ultimately determines when these resources are 12
economically curtailed.13
Some renewable resources have economic dispatch rights 14
for only a limited number of hours per contract year, for example 15
100 hours. 16
17
18
19
20
21
22
23
24
25
26
13) Bid/Award Validation27
PG&E reviews the results of each day’s CAISO day-ahead 28
market. Market results in the form of resource schedules are 29
examined to verify that day-ahead schedules are feasible, to 30
determine the additional operational flexibility that can be offered in 31
the real-time markets, to verify that the schedules are consistent 32
with market prices (or at a minimum, with the CAISO tariffs), and to33

1-29
check the accuracy of PG&E’s forecast of generation and costs prior 1
to the market against the actual results of the market.2
Forecasts inherently do not perfectly match actual results. 3
PG&E continually assesses the accuracy of its forecasts to improve 4
the quality of forecast results.5
If day-ahead schedules are not physically deliverable, PG&E 6
adjusts them in real-time and performs an analysis to determine the 7
reason for any infeasibility. In addition to correcting infeasible 8
schedules (i.e., re-scheduling or rebidding in the real-time markets), 9
corrective action is taken when possible with respect to future days’ 10
bidding and scheduling.11
When total market revenues earned over the course of a day 12
based on the awards by the CAISO do not cover the generating 13
unit’s bids, units are eligible to receive Bid Cost Recovery (BCR) 14
payments. PG&E validates that expected BCR is received in these 15
cases, or if not, that PG&E has communicated its concerns and/or 16
disputes of BCR calculations to CAISO.17
When issues with market results are identified, whether 18
immediately after publication of day-ahead market results or at any 19
later point in time, management is informed and, when appropriate, 20
a ticket is registered with the CAISO’s Issues Management System 21
(also known as Customer Inquiry, Dispute and Information (CIDI)) 22
for resolution. Persistent issues not remedied through normal CIDI 23
ticket resolution or settlement dispute resolution may be identified 24
for resolution either by changes in bidding and scheduling strategy 25
or through CAISO market design or regulatory channels.26
4. Summary Reports/Tables Annual Exception Rates27
Table 1-1 below highlights an index which maps LCD data requirements 28
with PG&E’s demonstration.29

1-30
TABLE 1-1INDEX OF LCD DATA REQUIREMENTS(a) AND PG&E’S RESPONSES
Line No. CPUC/ORA Metric PG&E’s Response
1 Commitment Cost Decisions Testimony: Section B.3.b.4; B.4.cWorkpaper: 1
2 Bid Cost Calculations Testimony: Section B.3.a.2; B.4.aWorkpaper: 2
3 Self-Commitment Testimony: Section B.4.bWorkpaper: 3
4 Dispatchable Hydro Resources Testimony: Section B.3.b.5Workpaper: 4
5 Background Summary Testimony: Section B.5Workpaper: 5
6 Highest Energy Value Days Workpaper: 6
7 Load Bid Testimony: Section B.3.b.2Workpaper: 7
8 Business Processes and Software Documentation
Workpaper: 8
9 Evaluation of PG&E’s Price Forecast Accuracy
Testimony: Section B.3.b.1 Workpaper: 6
10 Decision Making Process for Proxy vs. Registered Costs
Testimony: Section B.3.b.4; B.4.cWorkpaper: 1
11 Explanation of Thermal Bids Not Submitted
Testimony: Section B.3.b.9Workpaper: 2
_______________
(a) Per the LCD Decisions and the 2014 ERRA Settlement.
Additionally, consistent with the LCD Decisions, PG&E is providing the 1
tables below which document the annual summaries of exception rates for 2
incremental cost bid calculations, self-commitment decisions, and Master 3
File data changes. PG&E has work procedures and systems that are 4
intended to detect and prevent internal errors before the fact, and such 5
procedures and systems are subject to continuous improvement as new and 6
unanticipated events occur. 7
a. Incremental Cost Bid Calculation Exceptions8
All bids submitted to the CAISO are reported in PG&E’s confidential 9
workpapers for Chapter 1 under the folder “Bid Sheets.” There are 10
individual files for each resource with a tab for Energy Bid, A/S, and 11
RUC. For dispatchable thermal resources, the actual incremental bid 12

1-31
cost submitted to the CAISO is compared against the calculated cost, 1
using incremental heat rates, VOM cost adders, GHG costs, and natural 2
gas prices. In 2017, 724,557 bids were submitted to the CAISO for 3
gas-fired dispatchable resources, of which 0.32 percent of the awarded 4
bids were found to have a variance (Workpaper 2). 5
Table 1-2 below summarizes the error and potential cost impact for 6
incremental bid cost calculation variances for dispatchable thermal 7
resources during the record period.8
TABLE 1-2INCREMENTAL BID COST CALCULATION VARIANCE – ANNUAL SUMMARY
Line No. Description
No. of Significant Variances
(in Hours) > $0.10% of Total Bid Hour Count
Potential Cost
Impact $
1 User Error 2,210 0.31% –2 External to PG&E 96 0.01 –
3 Total 2,306 0.32% –_______________
Reference: Workpaper 2: Bid Cost Calculation: Table 2.1 – Annual Bid Cost Calculation Variance – Annual 2017.
During the record period, bids submitted with a significant variance 9
(greater than $0.10/MWh) had no cost impact. Additional details, 10
including a description of the variances and corrective actions, can be 11
found in Workpaper 2.12
b. Self-Commitment Decision Exceptions13
The reasons for self-commitment during the record period are 14
described in Section 3 above, “PG&E’s Bidding and Scheduling 15
Processes.”16
Table 1-3 below summarizes exceptions associated with daily 17
self-commitment decisions for dispatchable thermal resources for the 18
record period.19

1-32
TABLE 1-3SELF-COMMITMENT DECISION VARIANCE – ANNUAL SUMMARY
Line No.
Reason Code Description
Total Count (Hour)
Total MWh Energy Self-Committed
1 – –2 User Error 192 1,440
3 Total 192 1,440_______________
Reference: Workpaper 3: Self Commitment: Table 3.1 – Self Commitment –Annual Report.
During the record period, the vast majority of instances of 1
self-commitment were due to non-discretionary, unit testing purposes. 2
However, there was one instance noted in Table 1-3 where exceptions 3
took place. Details regarding these exceptions and the corrective 4
actions are shown in Section 5 and Workpaper 3. 5
c. Master File Data Change Exceptions6
The Master File describes the detailed characteristics of resources. 7
As described in Section 3, “PG&E’s Bidding and Scheduling Processes,” 8
the proxy or registered costs are intended to reflect start-up and 9
minimum load costs and cannot be changed for at least 30 days. This 10
information is used in CAISO’s optimization to commit units. For the 11
record period, the registered and proxy costs were reviewed, and 12
exceptions are noted below, along with potential cost impact due to lost 13
BCR, in Table 1-4. There were no exceptions for the record period. 14
Additional information is included in Workpaper 1.15

1-33
TABLE 1-4 PROXY VS. REGISTERED COST EXCEPTIONS – ANNUAL SUMMARY
Line No.
No. of Times Proxy Used
No. of Times Registered
Used
No. of Incorrect
SubmissionsPotential
Cost Impact
1 Startup 72 – – –2 Min Load 72 – –
3 Total 144 – – –
4 % of Total Startup and Min Load Submissions
100% – –
_______________
Reference: Workpaper 1: Commitment Cost Decisions (xlsx); Table 1.1 – Annual Summary.
5. Least Cost Dispatch Bidding and Scheduling Cost Impacts1
2
3
TABLE 1-5 BIDDING AND SCHEDULING EVENTS WITH IMPACT
4
5
6
7
8
9
10
11
In response to these events, PG&E improved processes/tools and 12
conducted training to help prevent similar events from occurring again. 13
14
15

1-34
1
2
PG&E has incorporated 3
additional checks 4
to help prevent a similar event from occurring again.5
The dynamic management of LCD for an increasingly complex supply 6
portfolio creates inevitable challenges to perfect execution. The 7
Commission has made clear that the Utility is not to be held to a “perfection” 8
standard with respect to LCD. PG&E bids and schedules a large portfolio of 9
about 350 resources, each of which may have individual operational and 10
contract parameters. PG&E demonstrates in this testimony and the 11
supporting workpapers that it bids and schedules resources, and procures 12
energy for customers, so as to (1) minimize CAISO procurement costs and 13
(2) offset energy supply costs with market revenues. PG&E submitted over 14
2,422,900 hourly Day-Ahead bids and self schedules for 15
16
, result from approximately 200 hourly 17
bids of the 2,422,900, or 0.008 percent of bids. PG&E considers this error 18
rate and cost impacts described in this testimony to be within a reasonable 19
manager standard, especially seen in the context of the overall gains to 20
customers of its least cost dispatch processes. In addition, PG&E has 21
instituted rigorous checks to monitor errors and has subjected our internal 22
processes to ever increasing scrutiny.23
6. Background Summary Table24
Table 1-6 below provides a summary of schedule and dispatch data for 25
the record period, corresponding to the requirement in the LCD Decisions. 26
The table reflects an annual summary by resource type (and divided into 27
dispatchable and non-dispatchable resources) for capacity, day-ahead self-28
schedule (SS) awards and day-ahead market awards.29

1-35
TABLE 1-6 BACKGROUND SUMMARY – ANNUAL REPORT
Line No. Dispatchable
Total Capacity (MWh)(a)
Total Unavailable Capacity (MWh)(b)
Total DA SS Awards (MWh)
Total DA Market Awards
(MWh)
1 CHP2 Hydro3 QF4 Renewable(c)
5 Solar6 Storage7 Wind8 Thermal9 Dispatchable Total
Non-DispatchableTotal Capacity
(MWh)(a)
Total Unavailable Capacity(MWh)(b)
Total DA SS Awards (MWh)
Total DA Market Awards
(MWh)
10 CHP11 FIT12 Hydro13 QF14 Renewable(c)
15 Solar16 Wind17 Nuclear18 Non-Dispatchable Total
19 Grand Total_______________
(a) Capacity (MWh) is calculated using the resource’s P-Max MW multiplied by the number of hours in a day during the applicable time period.
(b) Total Unavailable Capacity represents the total capacity unavailable due to planned or forced outages reported in OMS.
(c) The renewable category consists mainly of biomass, biogas, and geothermal resources.
Reference: Workpaper 5: Background Summary (xlsx); Table 5.1 – Annual Report.
7. 2017 Market and Business Process Changes1
PG&E participates in CPUC proceedings and CAISO initiatives on 2
changes to market design and implementation and then integrates market 3
changes to internal processes. Below is a summary of major market 4
initiatives, changes to PG&E’s resource mix, business process changes and 5
LCD-related modeling and process changes. 6
a. Demand Response Market Integration7
In compliance of the CPUC Rulemaking 13-09-011, PG&E 8
completed enabling one Reliability Demand Response Resources 9

1-36
(RDRR) Program (the Base Interruptible Program) to respond to the 1
CAISO real-time market on May 1, 2017. The implementation allowed 2
PG&E to call the underlying retail program to meet CAISO real-time 3
market dispatches. The bid quantity of RDRR is based on a customer 4
availability forecast provided by a vendor product. The bid price is 5
within the CAISO tariff price range of 95-100 percent of the bid cap.6
Under the same CPUC rulemaking, PG&E was to complete its 7
efforts for all other DR programs (Capacity Bidding Program (CBP), 8
SmartAC™) to be bid as Proxy Demand Resource (PDR) in the CAISO 9
Day-Ahead Market by January 1, 2018. The bid quantity of PDR is 10
based on customer availability forecast provided by the same vendor 11
product as RDRR and the bid price is based on the short-term price 12
forecast.13
b. Commitment Cost Refinements14
There was one change in the Commitment Cost policy that impacted 15
how PG&E bids resources. On December 1, 2017, the CAISO made a 16
small modification to the Electricity Price Index (EPI) for resources with 17
electric usage on startup. The EPI is used for resources with auxiliary 18
power needs on startup as part of the proxy start-up cost calculation. 19
The EPI retail price was modified from time-of-use (peak, off-peak) 20
prices to daily prices. PG&E updated its systems and business 21
processes to conform with this change.22
c. Energy Imbalance Market and Operations23
In 2014 and 2015, the CAISO implemented its Energy Imbalance 24
Market (EIM), integrating two PacifiCorp balancing areas and the NV 25
Energy balancing area into the CAISO real-time markets processes. On 26
October 1, 2016, the CAISO integrated the Puget Sound Energy and 27
Arizona Public Service balancing areas into the EIM. On October 1, 28
2017, the CAISO integrated Portland Gas and Electric into the EIM. The 29
EIM implementation did not require changes to bidding systems during 30
the record period, so PG&E’s review of the market changes focused on 31
the visibility and correctness of market results and new public market 32

1-37
data sources, participation in stakeholder processes, verification of 1
settlements correctness, and participation in CAISO market simulations.2
As further background on the EIM and integration, the day-ahead 3
market processes did not change and continued to be limited to 4
representing internal CAISO supply and demand, and interchanges at 5
boundary tie points of the CAISO balancing area. However, in real time, 6
the “footprint” of the market expanded substantially, with the aim of 7
enabling increased efficient, automated energy trading between the 8
Balancing Areas. A significant expansion of the detailed network model 9
(FNM expansion) used by the CAISO in evaluating electric network 10
transmission accompanied the EIM. The expanded FNM includes 11
information on resources, load and interchange schedules in other 12
Balancing Authority Areas to avoid uncontrolled “loop flows” that reduce 13
the efficiency of transmission within the CAISO markets.14
d. 2017 LCD-Related Modeling and Process Changes15
During the record period, PG&E did not have additional significant 16
LCD- related modeling or process changes other than what has been 17
described above.18
8. LCD Summary19
Section B, “Least-Cost Dispatch” provides a detailed discussion of the 20
CAISO markets, LCD guidelines and principles, PG&E’s resource-specific 21
LCD processes, and LCD documentation and process improvements. 22
PG&E managed its portfolio according to LCD principals and within a 23
reasonable manager standard, with an overall error rate of 0.1 percent.1624
The detailed workpapers supporting this chapter provide all of the actual 25
detailed input and output, information for each day during the record period 26
that demonstrates that PG&E achieved LCD for each day. 27
C. Economically-Triggered Demand Response Programs28
1. Introduction29
This section addresses PG&E’s dispatch of DR programs with an 30
economic trigger during the record period, as directed by the LCD 31
16 The error rate associated with cost impacts is 0.008 percent, as described in Section 5.

1-38
Decisions. Specifically, these decisions require PG&E to include in this 1
application metrics proposed by ORA concerning the dispatch of 2
DR programs with economic triggers. For purposes of this section, the 3
term “dispatch” refers to times when PG&E activates a DR program to 4
reduce load.5
PG&E utilized its DR portfolio during the record period to provide load 6
reductions that enhanced reliability, and reduced peak demand and 7
associated prices. For the record period, dispatch of DR resources was 8
well aligned with periods of high load and high prices. Instances in which 9
economic triggers were met, but DR resources were not dispatched were 10
due to operational constraints of the programs, or due to opportunity costs 11
associated with “customer fatigue,” extraordinary heatwaves and/or 12
congestion conditions that affected resources. During the record year, 13
PG&E operated two DR programs which have economic triggers, the 14
Capacity Bidding Program (CBP) and the SmartAC Program. The 15
Aggregator Managed Portfolio (AMP), which also had an economic trigger, 16
was discontinued on December 31, 2016.17
The remainder of this section consists of the following subsections:18
1) A description of the CBP and a summary of its dispatch during the 19
record period. This includes information about when the program’s 20
trigger conditions were forecasted to be met and when the programs 21
were dispatched. Also included is an explanation of non-dispatch 22
decisions, including the instances when CBP triggers were met but not 23
dispatched, and a description of PG&E’s opportunity cost methodology.24
2) A description of the SmartAC Program, which can be, but was not, 25
economically dispatched during the record period.26
3) A description of the AMP, which was economically dispatched in 27
previous record years, but was closed on December 31, 2016.28
4) Economically Dispatched Demand Response Summary.29
Table 1-7 below provides specific references to testimony or 30
attachments to this chapter that address ORA’s metrics.31

1-39
TABLE 1-7INDEX OF ORA’S METRICS AND PG&E’S RESPONSES
Line No.
ORA’s Metric PG&E’s Response
1 1A Section 2.b.1), Attachment 1A2 1B Attachment 1A3 1C Section 2.b.3), Attachment 1A4 2 Section 2.b.2), Attachment 1B5 3A Attachment 1C6 3B Attachment 1C7 3C Attachment 1C8 4 Section 2.b.3), Attachment 1A9 5 Section 2.b.3)
10 6A Section 2.b.4)11 6B Section 2.b.4)12 6C Section 2.b.4)13 7 Section 2.b.3)
2. Capacity Bidding Program1
a. Description2
The CBP is a voluntary DR program that offers customers capacity 3
and energy payments for being on standby to reduce load and for 4
reducing energy consumption when requested by PG&E. Customers 5
enroll through a third-party aggregator and participate in either a 6
day-ahead notification product or a day-of notification product. CBP 7
operates from May through October, between the hours of 11 a.m. and 8
7 p.m. It is dispatched geographically by Sub Load Aggregation Point 9
(SubLAP). The length of a dispatch is one to four hours. 10
CBP can be dispatched for the following reasons: when PG&E’s 11
procurement stack is expected to require the dispatch of electric 12
generation facilities with heat rates of 15,000 British Thermal Unit 13
(Btu)/kilowatt-hour (kWh) or greater for the day-ahead market and the 14
CAISO day-ahead market price exceeds $70/MWh; when PG&E 15
receives a market award for a PDR bid or dispatch instruction from the 16
CAISO; when PG&E forecasts that generation resources or electric 17
system capacity may not be adequate; or when forecasted temperature 18
for a Load Zone exceeds the temperature threshold for the Load Zone. 19
The $70/MWh price trigger, implemented on June 1, 2017, was 20
designed to target five economic CBP events per month, to provide 21
transparency to aggregators and customers, and to reduce the number 22

1-40
of dispatch exceptions. In 2017, both the $70/MWh price trigger and the 1
15,000 Btu/kWh heat rate trigger had to be met to dispatch a CBP 2
event. PG&E’s dispatch tools were expanded to determine when the 3
CAISO day-ahead market price exceeded the price $70/MWh trigger for 4
each program hour in each SubLAP. 5
b. Annual Summary of Results6
1) Times and Duration of Program Dispatches7
During the record period, PG&E dispatched resources in its 8
CBP Day-Ahead and CBP Day-Of programs on 47 occasions. All 9
dispatches resulted from exceeding both the 15,000 Btu/kWh trigger 10
and the $70/MWh trigger. The number of 2017 CBP events was 11
close to the number of combined CBP and AMP events in previous 12
years (49 in 2016 and 52 in 2015). During the record period, the 13
CBP met trigger conditions 52 fewer hours than 2016. Nonetheless, 14
it was dispatched 14 more hours during the record period. The 15
implementation of the price trigger on June 1, 2017 resulted in 16
greater utilization of CBP resources, as discussed in further 17
detail below.18
Table 1-8 below provides additional detail and a comparison of 19
CBP event count and frequency for 2013 through 2017.20
TABLE 1-8CAPACITY BIDDING PROGRAM DEMAND RESPONSE PROGRAM DISPATCH
Line No. Year
Capacity Bidding Program
Day-Ahead Total Events/Hours
Day-of Total Events/Hours
1 2013 5/20 5/192 2014 11/41 15/603 2015 16/63 18/724 2016 16/58 19/69 5 2017 22/67 25/71
During the record period, PG&E conducted more than 40 formal 21
event dispatch decision-making meetings (Tailboards) in addition to 22
many informal limited scope discussions. During the Tailboards and 23
discussions, PG&E reviewed meteorological forecasts, CAISO and 24

1-41
PG&E peak demand and implied heat rate forecasts, the CAISO’s 1
published day-ahead energy price, and other market and qualitative 2
information. Using this information, PG&E matched its DR 3
dispatches to times of greatest need, from both a pricing and a 4
peak demand perspective, including both PG&E and CAISO 5
system peaks.6
Attachment 1A provides a summary of: (a) the times and 7
duration that all programs were dispatched; (b) all cases where CBP 8
trigger conditions were forecast to be met and all cases where these 9
trigger conditions were actually met; and (c) a list of occurrences 10
when DR resources met program triggers but were not dispatched, 11
along with an explanation of the reason for non-dispatch.12
2) Satisfaction of DR Program Trigger Conditions13
Table 1-9 below summarizes the annual number of hours CBP 14
was dispatched in each SubLAP compared to the annual number of 15
hours that CBP was available. Also included is the annual number 16
of events dispatched compared to the maximum number of 17
events allowed.1718
17 The maximum number of events was established in Resolution E-4819 and implemented on June 1, 2017.

1-42
TABLE 1-9ANNUAL CAPACITY BIDDING PROGRAM HOURS DISPATCHED
LineNo. Load Zone
Number of Hours
Day-Ahead Trigger
Was Met
Total Day-Ahead
Event Hours
Dispatched
Number of Day-Ahead
Events
Number of Hours Day-Of Trigger
Was Met
Total Day-Of Event Hours
Dispatched
Number of Day-Of Events
Maximum Allowable
Event Hours/Year(a)
Maximum AllowableNumber of
Events/ Year(b)
1 PGCC 88 64 21 90 64 23 180 302 PGEB 95 64 21 97 68 24 180 303 PGF1 81 62 20 80 60 22 180 304 PGFG 91 47 15 94 61 20 180 305 PGHB 82 64 21 83 63 22 180 306 PGKN 83 64 21 80 60 22 180 307 PGNB 91 47 15 94 61 20 180 308 PGNC 85 52 17 82 55 18 180 309 PGNP 86 64 21 87 64 23 180 30
10 PGP2 89 64 21 90 64 23 180 3011 PGSB 89 64 21 90 64 23 180 3012 PGSF 87 62 20 90 64 23 180 3013 PGSI 81 62 20 80 60 22 180 3014 PGST 92 67 22 89 63 23 180 3015 PGZP 83 64 21 80 60 22 180 30
_______________
(a) CBP program dispatch is limited to 30 hours per month for the 6-month program period.(b) CBP program dispatch is limited to five events per month for the 6-month program period.
Attachment 1B provides monthly tables showing the number of 1
hours when PG&E forecasted that trigger criteria would be reached, 2
hours in which trigger conditions were reached in the same 3
time period, actual hours dispatched, and the number of events 4
dispatched.5
3) Non-Dispatch Occurrences6
a) Summary7
Despite the closure of the AMP program and trigger 8
conditions being met less often, PG&E dispatched 9
approximately the same number of events and event hours in 10
2017 as in 2016. While each SubLAP experienced 11
approximately 25 hours during the 2017 CBP season when 12
triggers were met but resources were not dispatched (see 13
Table 1-10 below), there were on average 10 percent fewer 14
hours of non-dispatch across all SubLAPs compared to 2016. 15
Additional information about the reasons for non-dispatch is 16
provided further below.17

1-43
TABLE 1-10CAPACITY BIDDING PROGRAM HOURS IN WHICH TRIGGER MET
BUT RESOURCE NOT DISPATCHED
Line No. Load Zone
Day-Ahead Hours
Day-Of Hours
1 PGCC 24 262 PGEB 31 293 PGF1 19 204 PGFG 44 335 PGHB 18 206 PGKN 19 207 PGNB 44 338 PGNC 33 279 PGNP 22 23
10 PGP2 25 2611 PGSB 25 2612 PGSF 25 2613 PGSI 19 2014 PGST 25 2615 PGZP 19 20
Attachment 1C provides a detailed summary of total energy 1
actually dispatched as a proportion of maximum available 2
energy for each DR program. This comparison provides both 3
percentage and nominal MWh terms.4
b) Explanation of the Basis for a Decision Not to Dispatch5
As discussed above, PG&E’s tariffs allow for, but do not 6
require, dispatch when triggers are reached. While PG&E 7
increased the utilization of its DR resources in 2017, there were 8
instances in which PG&E did not dispatch CBP resources when 9
triggers were met.10
During the record period, there were two general reasons 11
that PG&E did not dispatch CBP when the program triggers 12
were met. First, operational constraints embedded in the tariff 13
can impact dispatch. Second, because DR resources are 14
customer-impacting and use-limited, PG&E may choose to not 15
dispatch so that the resource may be used at a different and 16
more highly valued time. This latter reason is referred to as 17
“opportunity cost” and captures the “customer fatigue” issues 18
discussed in Section C.2.b.3)b)ii below.19

1-44
In the 2014 ERRA Settlement, PG&E agreed to provide 1
definitions of “operational constraints” and “opportunity cost” as 2
reasons for not dispatching DR programs when economic 3
triggers are met.18 These definitions are provided in 4
Sections C.2.b.3)b)i and C.2.b.3)b)ii below, respectively. 5
PG&E also agreed to provide guidelines for situations in 6
which “customer fatigue” may occur. This is included in 7
Section C.2.b.3)b)ii.8
i) Operational Constraints Related to DR Dispatch9
PG&E defines a DR “operational constraint” as a 10
constraint based on limitations included in the DR tariff(s). 11
The primary operational constraints for CBP are the total12
hour limitation and number of events on monthly basis, and 13
also the hour limitation on a per-call basis. For example, 14
the CBP program is limited to 30 hours per month and 15
five events per month.1916
In 2017, had heat rate triggers been the sole 17
determinant of when dispatch conditions were met, then 18
there would have been more instances of meeting dispatch 19
conditions.20 Adding the price trigger requirement 20
($70/MWh) to the heat rate requirement resulted in fewer 21
instances of dispatch conditions being met, but also 22
significantly reduced the number of dispatch exceptions, 23
and resulted in a greater number of events and event hours 24
than occurred in 2016. 25
While maximum available tariff hours provide the 26
primary operational constraint on dispatch, tariff design also27
may create additional operational constraints. One example 28
18 2014 ERRA Settlement, ¶¶ 3.2, 3.6.19 The CBP tariff specifies that the program is only available during the summer
(May-October) DR season. This also would be considered an operational constraint when compared to year-round DR programs.
20 The 15,000 Btu/kWh heat rate resulted in a strike price ranging from $46.05-51.92/MWh in 2017, significantly less than the $70/MWh price trigger.

1-45
of this type of constraint is the customer notification 1
requirements included in each tariff. Under the CBP tariff in 2
effect during the record period, PG&E had to notify its 3
day-ahead CBP participants by 3 p.m. on the day before it 4
planned to dispatch the program.21 However, on five days 5
of the record period, the CAISO did not send its day-ahead 6
forecast information to PG&E in time to make these 7
dispatch decisions. The notification requirements in the 8
CBP tariff therefore acted as an operational constraint on 9
those days. PG&E still awaits approval from the 10
Commission to extend this notification time until 4 p.m. to 11
alleviate much of this constraint.12
ii) Opportunity Costs as Related to DR Dispatch13
Generally, “opportunity cost” is the potential lost future 14
value associated with calling a DR program at a certain 15
point in time and, therefore, eliminating the option to use it 16
at a future time. Opportunity costs arise from two issues. 17
First, there are maximum hour limits on the number of 18
times a DR resource may be called in the DR program 19
season, so dispatching a resource today may result in the 20
resource not being available during a future time of need. 21
Decisions to dispatch or not to dispatch DR programs are 22
made in PG&E’s DR Tailboard. In these meetings, heat 23
rate and price levels in relation to their respective triggers 24
are considered along with an assessment of opportunity 25
costs that are estimated by taking into account market price 26
forecasts, weather forecasts, and historical experience with 27
system conditions. If the opportunity cost suggests that 28
there could be greater value in dispatching the resource at a 29
21 “PG&E will notify the affected Aggregators by 3:00 p.m. on a day-ahead basis of a CBP Event for the following business day. Notices will be issued by 3:00 p.m. on the business day immediately prior to a NERC holiday or weekend if a CBP Event is planned for the first business day following the NERC holiday or weekend.”

1-46
later date, then the resource may not be dispatched even if 1
the heat rate and price triggers have been met.2
The second issue that creates opportunity cost is 3
“customer fatigue,” which occurs at the individual customer 4
level rather than at the program level. Participation in DR 5
events can cause a participating customer to make 6
significant changes to energy use, such as shutting down a 7
manufacturing line that in turn may result in sending home 8
employees. There are a limited number of times within a 9
demand response season that customers are willing to 10
make such sacrifices for the current level of compensation. 11
If customers are dispatched too frequently or for too long of 12
periods, then it could result in “customer fatigue,” which is a 13
reduction in participation rates due to the customer 14
perceiving the costs of participating exceeding the benefits15
of participating. 16
Some of PG&E’s largest DR customers have provided 17
consistent feedback to PG&E that dispatch frequency has 18
seriously impacted their business operations and requested 19
that dispatch only occur if necessary. As a result, PG&E 20
generally does not dispatch DR events for more than 21
three days in a row, which was agreed to in the 2014 22
ERRA Settlement.23
4) Dispatch Day Selection24
For the record period, PG&E’s DR event dispatch helped to 25
minimize its overall portfolio costs. As demonstrated in 26
Table 1-10 below, PG&E employed its DR resources during highly 27
valuable hours.28

1-47
TABLE 1-11AVERAGE DLAP PRICE FOR FORECASTED TRIGGER EVENT DAYS
AND ACTUAL DISPATCH DAYS
Line No.
Average Hourly DLAP Price During
Actual Dispatch Events
($/MWh)
Average Hourly Potential DLAP Price From All Times When
Trigger Conditions Were Forecasted (Dispatched or Not)
($/MWh) $ (A) – (B) (A)/(B) (%)(A) (B)
1
As indicated in Table 1-11, the average hourly Default Load 1
Aggregation Point (DLAP) price for events actually dispatched in the 2
2017 record period was /MWh, whereas the average hourly 3
potential DLAP price from all time periods when DR program 4
triggers were forecasted to be met by PG&E was /MWh. 5
This further underscores that PG&E optimized its dispatch of DR 6
resources to deliver load reductions during the most valuable hours 7
of the 2017 DR Season. Where triggers were met and PG&E opted 8
not to dispatch, such opportunity cost decisions were made in order 9
to utilize the resources at times of higher prices and greater need.10
3. SmartAC11
PG&E’s SmartAC Program is a voluntary DR program in which PG&E 12
installs a device to temporarily cycle a customer’s AC compressor. 13
SmartAC can be dispatched by order of the CAISO during emergency or 14
near-emergency situations, when the CAISO day-ahead price for the PG&E 15
DLAP exceeds $1,000 per MWh, or during program testing. 16
There were no instances in which the SmartAC price trigger was 17
forecasted to be reached during the record period. PG&E did test SmartAC 18
16 times during the record period, for 57 hours of dispatch. Additionally, 19
SmartAC customers dually enrolled in PG&E’s SmartRate™ Program were 20
dispatched for the 14 SmartRate events, to help reduce load. Since these 21
were not economic dispatches, however, SmartAC is not discussed further 22
in this chapter. 23
4. Aggregator Managed Portfolio24
PG&E’s AMP closed on December 31, 2016. Therefore, it will no longer 25
be included in the ERRA Compliance proceeding. 26

1-48
5. Economically Dispatched Demand Response Summary1
PG&E utilized the CBP, the only economically dispatched program 2
during the record period, to provide load reductions that enhanced reliability 3
and reduced peak demand and associated prices. DR resources were well 4
aligned with high load and price time periods. While PG&E did not dispatch 5
its DR resources each time an economic trigger was met, instances of non-6
dispatch were due to operational constraints of the programs or due to 7
opportunity costs associated with customer impact. 8
D. Conclusion9
In compliance with the LCD Decisions and 2014 ERRA Settlement, this 10
chapter and the associated work papers have demonstrated that PG&E:11
Achieved LCD during the record period; and12
Reasonably utilized, integrated and improved the dispatch for economic 13
DR resources during the record period.14
PG&E has fully complied with the Commission decisions addressing LCD 15
practices during the record period, and has provided testimony and workpapers 16
that are consistent with the LCD Decisions to satisfy PG&E’s prima facie17
burden of proof to demonstrate that it achieved LCD. This testimony and the 18
confidential workpapers for Chapter 1 demonstrate that PG&E dispatched 19
its resources in a manner consistent with LCD requirements during the 20
record period.21
PG&E also utilized its DR portfolio during the record period to provide load 22
reductions that enhanced reliability and reduced peak demand and associated 23
prices. In addition, PG&E has provided the information and metrics required by 24
the LCD Decisions for LCD and its economically-triggered DR Programs. 25
Finally, where applicable, the Chapter 1 testimony and workpapers satisfy the 26
requirements of the 2014 ERRA Settlement.27

PACIFIC GAS AND ELECTRIC COMPANY
CHAPTER 1
ATTACHMENT A
SUMMARY OF TRIGGERED DISPATCH FROM
DEMAND RESPONSE PROGRAMS

Atta
chm
ent A
- Tr
igge
rs M
et -
DR
Pro
gram
Dis
patc
hed
Dat
e Tr
igge
r Con
ditio
n W
as F
orec
ast
to b
e M
etTy
pe o
f Tr
igge
rPr
ogra
mLo
catio
n Fo
reca
st S
tart
Ti
me
Fore
cast
End
Tim
eTr
igge
r Was
M
et?
Res
ourc
eD
ispa
tche
d?
Tota
l Cap
acity
of
Prog
ram
Ava
ilabl
e fo
r Dis
patc
h
Fore
cast
ed A
vaila
ble
Load
For
the
Prog
ram
B
eing
Dis
patc
hed
Act
ual L
oad
Ach
ieve
dD
urat
ion
of
Dis
patc
h
5/22
/201
7H
eat R
ate
Day
Ahe
ad
PGC
C, P
GEB
, PG
HB,
PG
KN, P
GN
C, P
GN
P,
PGP2
, PG
SB, P
GST
, PG
ZP5:
00 P
M7:
00 P
MYe
sYe
s2
5/22
/201
7H
eat R
ate
Day
Of
All S
ubla
ps3:
00 P
M7:
00 P
MYe
sYe
s4
5/23
/201
7H
eat R
ate
Day
Ahe
adAl
l Sub
laps
3:00
PM
7:00
PM
Yes
Yes
4
5/23
/201
7H
eat R
ate
Day
Of
PGC
C, P
GEB
, PG
FG,
PGH
B, P
GN
B, P
GN
P,
PGP2
, PG
SB, P
GSF
3:00
PM
7:00
PM
Yes
Yes
46/
16/2
017
Pric
eD
ay O
fPG
EB, P
GFG
, PG
NB
3:00
PM
7:00
PM
Yes
Yes
46/
19/2
017
Pric
eD
ay A
head
All S
ubla
ps3:
00 P
M7:
00 P
MYe
sYe
s4
6/19
/201
7Pr
ice
Day
Of
All S
ubla
ps3:
00 P
M7:
00 P
MYe
sYe
s4
6/20
/201
7Pr
ice
Day
Ahe
adAl
l Sub
laps
3:00
PM
7:00
PM
Yes
Yes
46/
20/2
017
Pric
eD
ay O
fAl
l Sub
laps
3:00
PM
7:00
PM
Yes
Yes
46/
22/2
017
Pric
eD
ay A
head
All S
ubla
ps3:
00 P
M7:
00 P
MYe
sYe
s4
6/22
/201
7Pr
ice
Day
Of
All S
ubla
ps3:
00 P
M7:
00 P
MYe
sYe
s4
6/23
/201
7Pr
ice
Day
Ahe
adPG
NC
, PG
ST4:
00 P
M7:
00 P
MYe
sYe
s3
6/23
/201
7Pr
ice
Day
Of
PGN
C, P
GST
4:00
PM
7:00
PM
Yes
Yes
37/
7/20
17Pr
ice
Day
Ahe
adAl
l Sub
laps
4:00
PM
7:00
PM
Yes
Yes
37/
7/20
17Pr
ice
Day
Of
All S
ubla
ps4:
00 P
M7:
00 P
MYe
sYe
s3
7/27
/201
7Pr
ice
Day
Ahe
adAl
l Sub
laps
6:00
PM
7:00
PM
Yes
Yes
17/
27/2
017
Pric
eD
ay O
fAl
l Sub
laps
6:00
PM
7:00
PM
Yes
Yes
17/
31/2
017
Pric
eD
ay A
head
All S
ubla
ps5:
00 P
M7:
00 P
MYe
sYe
s2
7/31
/201
7Pr
ice
Day
Of
All S
ubla
ps5:
00 P
M7:
00 P
MYe
sYe
s2
8/1/
2017
Pric
eD
ay A
head
All S
ubla
ps4:
00 P
M7:
00 P
MYe
sYe
s3
8/1/
2017
Pric
eD
ay O
fAl
l Sub
laps
3:00
PM
7:00
PM
Yes
Yes
48/
2/20
17Pr
ice
Day
Ahe
adAl
l Sub
laps
3:00
PM
7:00
PM
Yes
Yes
48/
2/20
17Pr
ice
Day
Of
All S
ubla
ps3:
00 P
M7:
00 P
MYe
sYe
s4
8/28
/201
7Pr
ice
Day
Ahe
adAl
l Sub
laps
3:00
PM
7:00
PM
Yes
Yes
48/
28/2
017
Pric
eD
ay O
fAl
l Sub
laps
3:00
PM
7:00
PM
Yes
Yes
48/
29/2
017
Pric
eD
ay A
head
All S
ubla
ps3:
00 P
M7:
00 P
MYe
sYe
s4
8/29
/201
7Pr
ice
Day
Of
All S
ubla
ps3:
00 P
M7:
00 P
MYe
sYe
s4
8/31
/201
7Pr
ice
Day
Ahe
adAl
l Sub
laps
3:00
PM
7:00
PM
Yes
Yes
48/
31/2
017
Pric
eD
ay O
fAl
l Sub
laps
3:00
PM
7:00
PM
Yes
Yes
49/
1/20
17Pr
ice
Day
Ahe
adAl
l Sub
laps
3:00
PM
7:00
PM
Yes
Yes
49/
1/20
17Pr
ice
Day
Of
All S
ubla
ps3:
00 P
M7:
00 P
MYe
sYe
s4
9/5/
2017
Pric
eD
ay O
fAl
l Sub
laps
5:00
PM
7:00
PM
Yes
Yes
29/
11/2
017
Pric
eD
ay O
fAl
l Sub
laps
5:00
PM
7:00
PM
Yes
Yes
29/
26/2
017
Pric
eD
ay O
fAl
l Sub
laps
6:00
PM
7:00
PM
Yes
Yes
19/
27/2
017
Pric
eD
ay A
head
All S
ubla
ps6:
00 P
M7:
00 P
MYe
sYe
s1
9/27
/201
7Pr
ice
Day
Of
All S
ubla
ps6:
00 P
M7:
00 P
MYe
sYe
s1
9/28
/201
7Pr
ice
Day
Ahe
adAl
l Sub
laps
6:00
PM
7:00
PM
Yes
Yes
1
10/6
/201
7Pr
ice
Day
Of
PGC
C, P
GEB
, PG
F1,
PGFG
, PG
KN, P
GN
B,
PGN
P, P
GP2
, PG
SB,
PGSF
, PG
SI, P
GST
, PG
ZP,
6:00
PM
7:00
PM
Yes
Yes
1
10/1
6/20
17Pr
ice
Day
Of
PGC
C, P
GEB
, PG
F1,
PGH
B, P
GKN
, PG
NP,
PG
P2, P
GSB
, PG
SF,
PGSI
, PG
ST, P
GZP
, 5:
00 P
M7:
00 P
MYe
sYe
s2
10/1
7/20
17Pr
ice
Day
Ahe
ad
PGC
C, P
GEB
, PG
F1,
PGH
B, P
GKN
, PG
NP,
PG
P2, P
GSB
, PG
SF,
PGSI
, PG
ST, P
GZP
, 5:
00 P
M7:
00 P
MYe
sYe
s2
10/1
7/20
17Pr
ice
Day
Of
PGC
C, P
GEB
, PG
F1,
PGH
B, P
GKN
, PG
NP,
PG
P2, P
GSB
, PG
SF,
PGSI
, PG
ST, P
GZP
, 5:
00 P
M7:
00 P
MYe
sYe
s2
1-AtchA-1

Atta
chm
ent A
- Tr
igge
rs M
et -
DR
Pro
gram
Dis
patc
hed
Dat
e Tr
igge
r Con
ditio
n W
as F
orec
ast
to b
e M
etTy
pe o
f Tr
igge
rPr
ogra
mLo
catio
n Fo
reca
st S
tart
Ti
me
Fore
cast
End
Tim
eTr
igge
r Was
M
et?
Res
ourc
eD
ispa
tche
d?
Tota
l Cap
acity
of
Prog
ram
Ava
ilabl
e fo
r Dis
patc
h
Fore
cast
ed A
vaila
ble
Load
For
the
Prog
ram
B
eing
Dis
patc
hed
Act
ual L
oad
Ach
ieve
dD
urat
ion
of
Dis
patc
h
10/1
8/20
17Pr
ice
Day
Ahe
ad
PGC
C, P
GEB
, PG
F1,
PGH
B, P
GKN
, PG
NP,
PG
P2, P
GSB
, PG
SF,
PGSI
, PG
ST, P
GZP
, 5:
00 P
M7:
00 P
MYe
sYe
s2
10/1
8/20
17Pr
ice
Day
Of
PGC
C, P
GEB
, PG
F1,
PGH
B, P
GKN
, PG
NP,
PG
P2, P
GSB
, PG
SF,
PGSI
, PG
ST, P
GZP
, 6:
00 P
M7:
00 P
MYe
sYe
s1
10/2
3/20
17Pr
ice
Day
Of
PGC
C, P
GEB
, PG
F1,
PGH
B, P
GKN
, PG
NP,
PG
P2, P
GSB
, PG
SF,
PGSI
, PG
ST, P
GZP
, 5:
00 P
M7:
00 P
MYe
sYe
s2
10/2
4/20
17Pr
ice
Day
Ahe
ad
PGC
C, P
GEB
, PG
F1,
PGH
B, P
GKN
, PG
NP,
PG
P2, P
GSB
, PG
SF,
PGSI
, PG
ST, P
GZP
, 4:
00 P
M7:
00 P
MYe
sYe
s3
10/2
5/20
17Pr
ice
Day
Ahe
ad
PGC
C, P
GEB
, PG
F1,
PGH
B, P
GKN
, PG
NP,
PG
P2, P
GSB
, PG
SF,
PGSI
, PG
ST, P
GZP
, 3:
00 P
M7:
00 P
MYe
sYe
s4
10/2
6/20
17Pr
ice
Day
Ahe
ad
PGC
C, P
GEB
, PG
F1,
PGH
B, P
GKN
, PG
NP,
PG
P2, P
GSB
, PG
SF,
PGSI
, PG
ST, P
GZP
, 3:
00 P
M7:
00 P
MYe
sYe
s4
1-AtchA-2

PACIFIC GAS AND ELECTRIC COMPANY
CHAPTER 1
ATTACHMENT B
SUMMARY OF 2017 CAPACITY BIDDING PROGRAM EVENTS

Atta
chm
ent B
. N
umbe
r of h
ours
whe
n PG
&E fo
reca
sted
that
trig
ger c
riter
ia w
ould
be
reac
hed,
act
ual h
ours
reac
hed,
and
act
ual h
ours
dis
patc
hed
Cap
acity
Bid
ding
Pro
gram
/Day
-Ahe
ad
Load
Zon
eFo
reca
sted
Rea
ched
Act
ual
Hou
rsD
ispa
tche
d
Num
ber o
fEv
ents
Dis
patc
hed
Load
Zon
eFo
reca
sted
Rea
ched
Act
ual
Hou
rsD
ispa
tche
d
Num
ber o
fEv
ents
Dis
patc
hed
Load
Zon
eFo
reca
sted
Rea
ched
Act
ual
Hou
rsD
ispa
tche
d
Num
ber o
fEv
ents
Dis
patc
hed
PGC
C12
126
2PG
CC
1515
123
PGC
C6
66
3PG
EB15
156
2PG
EB19
1912
3PG
EB6
66
3PG
F14
44
1PG
F115
1512
3PG
F16
66
3PG
FG10
104
1PG
FG19
1912
3PG
FG6
66
3PG
HB
66
62
PGH
B15
1512
3PG
HB
66
63
PGK
N6
66
2PG
KN
1515
123
PGK
N6
66
3PG
NB
1010
41
PGN
B19
1912
3PG
NB
66
63
PGN
C6
66
2PG
NC
1818
154
PGN
C6
66
3PG
NP
99
62
PGN
P15
1512
3PG
NP
66
63
PGP2
1212
62
PGP2
1515
123
PGP2
66
63
PGSB
1212
62
PGSB
1515
123
PGSB
66
63
PGSF
1010
41
PGSF
1515
123
PGSF
66
63
PGSI
44
41
PGSI
1515
123
PGSI
66
63
PGST
1212
62
PGST
1818
154
PGST
66
63
PGZP
66
62
PGZP
1515
123
PGZP
66
63
Load
Zon
eFo
reca
sted
Rea
ched
Act
ual
Hou
rsD
ispa
tche
d
Num
ber o
fEv
ents
Dis
patc
hed
Load
Zon
eFo
reca
sted
Rea
ched
Act
ual
Hou
rsD
ispa
tche
d
Num
ber o
fEv
ents
Dis
patc
hed
Load
Zon
eFo
reca
sted
Rea
ched
Act
ual
Hou
rsD
ispa
tche
d
Num
ber o
fEv
ents
Dis
patc
hed
Load
Zon
eFo
reca
sted
Rea
ched
Act
ual
Hou
rsD
ispa
tche
d
Num
ber o
fEv
ents
Dis
patc
hed
PGC
C24
2419
5PG
CC
1111
63
PGC
C20
2015
5PG
CC
8888
6421
PGEB
2424
195
PGEB
1111
63
PGEB
2020
155
PGEB
9595
6421
PGF1
2525
195
PGF1
1111
63
PGF1
2020
155
PGF1
8181
6220
PGFG
2525
195
PGFG
1111
63
PGFG
2020
00
PGFG
9191
4715
PGH
B25
2519
5PG
HB
1111
63
PGH
B19
1915
5PG
HB
8282
6421
PGK
N25
2519
5PG
KN
1111
63
PGK
N20
2015
5PG
KN
8383
6421
PGN
B25
2519
5PG
NB
1111
63
PGN
B20
200
0PG
NB
9191
4715
PGN
C25
2519
5PG
NC
1111
63
PGN
C19
190
0PG
NC
8585
5217
PGN
P25
2519
5PG
NP
1111
63
PGN
P20
2015
5PG
NP
8686
6421
PGP2
2525
195
PGP2
1111
63
PGP2
2020
155
PGP2
8989
6421
PGSB
2525
195
PGSB
1111
63
PGSB
2020
155
PGSB
8989
6421
PGSF
2525
195
PGSF
1111
63
PGSF
2020
155
PGSF
8787
6220
PGSI
2525
195
PGSI
1111
63
PGSI
2020
155
PGSI
8181
6220
PGST
2525
195
PGST
1111
63
PGST
2020
155
PGST
9292
6722
PGZP
2525
195
PGZP
1111
63
PGZP
2020
155
PGZP
8383
6421
May
June
July
Aug
ust
Sept
embe
rO
ctob
erA
nnua
l
1-AtchB-1

Atta
chm
ent B
. N
umbe
r of h
ours
whe
n PG
&E fo
reca
sted
that
trig
ger c
riter
ia w
ould
be
reac
hed,
act
ual h
ours
reac
hed,
and
act
ual h
ours
dis
patc
hed
Cap
acity
Bid
ding
Pro
gram
/Day
-Of
Load
Zon
eFo
reca
sted
Rea
ched
Act
ual
Hou
rsD
ispa
tche
d
Num
ber o
fEv
ents
Dis
patc
hed
Load
Zon
eFo
reca
sted
Rea
ched
Act
ual
Hou
rsD
ispa
tche
d
Num
ber o
fEv
ents
Dis
patc
hed
Load
Zon
eFo
reca
sted
Rea
ched
Act
ual
Hou
rsD
ispa
tche
d
Num
ber o
fEv
ents
Dis
patc
hed
PGC
C14
148
2PG
CC
1515
123
PGC
C6
66
3PG
EB17
178
2PG
EB19
1916
4PG
EB6
66
3PG
F14
44
1PG
F115
1512
3PG
F16
66
3PG
FG14
148
2PG
FG19
1916
4PG
FG6
66
3PG
HB
88
82
PGH
B15
1512
3PG
HB
66
63
PGK
N4
44
1PG
KN
1515
123
PGK
N6
66
3PG
NB
1414
82
PGN
B19
1916
4PG
NB
66
63
PGN
C4
44
1PG
NC
1818
154
PGN
C6
66
3PG
NP
1111
82
PGN
P15
1512
3PG
NP
66
63
PGP2
1414
82
PGP2
1515
123
PGP2
66
63
PGSB
1414
82
PGSB
1515
123
PGSB
66
63
PGSF
1414
82
PGSF
1515
123
PGSF
66
63
PGSI
44
41
PGSI
1515
123
PGSI
66
63
PGST
1010
41
PGST
1818
154
PGST
66
63
PGZP
44
41
PGZP
1515
123
PGZP
66
63
Load
Zon
eFo
reca
sted
Rea
ched
Act
ual
Hou
rsD
ispa
tche
d
Num
ber o
fEv
ents
Dis
patc
hed
Load
Zon
eFo
reca
sted
Rea
ched
Act
ual
Hou
rsD
ispa
tche
d
Num
ber o
fEv
ents
Dis
patc
hed
Load
Zon
eFo
reca
sted
Rea
ched
Act
ual
Hou
rsD
ispa
tche
d
Num
ber o
fEv
ents
Dis
patc
hed
Load
Zon
eFo
reca
sted
Rea
ched
Act
ual
Hou
rsD
ispa
tche
d
Num
ber o
fEv
ents
Dis
patc
hed
PGC
C26
2620
5PG
CC
1010
105
PGC
C19
198
5PG
CC
9090
6423
PGEB
2626
205
PGEB
1010
105
PGEB
1919
85
PGEB
9797
6824
PGF1
2626
205
PGF1
1010
105
PGF1
1919
85
PGF1
8080
6022
PGFG
2626
205
PGFG
1010
105
PGFG
1919
11
PGFG
9494
6120
PGH
B26
2620
5PG
HB
1010
105
PGH
B18
187
4PG
HB
8383
6322
PGK
N26
2620
5PG
KN
1010
105
PGK
N19
198
5PG
KN
8080
6022
PGN
B26
2620
5PG
NB
1010
105
PGN
B19
191
1PG
NB
9494
6120
PGN
C26
2620
5PG
NC
1010
105
PGN
C18
180
0PG
NC
8282
5518
PGN
P26
2620
5PG
NP
1010
105
PGN
P19
198
5PG
NP
8787
6423
PGP2
2626
205
PGP2
1010
105
PGP2
1919
85
PGP2
9090
6423
PGSB
2626
205
PGSB
1010
105
PGSB
1919
85
PGSB
9090
6423
PGSF
2626
205
PGSF
1010
105
PGSF
1919
85
PGSF
9090
6423
PGSI
2626
205
PGSI
1010
105
PGSI
1919
85
PGSI
8080
6022
PGST
2626
205
PGST
1010
105
PGST
1919
85
PGST
8989
6323
PGZP
2626
205
PGZP
1010
105
PGZP
1919
85
PGZP
8080
6022
Aug
ust
Sept
embe
rO
ctob
erA
nnua
l
May
June
July
1-AtchB-2

PACIFIC GAS AND ELECTRIC COMPANY
CHAPTER 1
ATTACHMENT C
SUMMARY OF TOTAL ENERGY DISPATCHED FROM
DEMAND RESPONSE PROGRAMS

Atta
chm
ent C
. Num
ber o
f hou
rs d
ispa
tche
d, e
nerg
y di
spat
ched
and
max
imum
ene
rgy
avai
labl
e
Cap
acity
Bid
ding
Pro
gram
/Day
-Ahe
ad
May
June
July
Load
Zon
eH
ours
Dis
patc
hed
(a)
Tota
l Ene
rgy
Dis
patc
hed
(MW
h)
(b) M
axim
um
Ener
gyA
vaila
ble
(Avg
MW
X
30 h
rs)
(c) =
(a)/(
b)
%Lo
ad Z
one
Hou
rsD
ispa
tche
d
(a)
Tota
l Ene
rgy
Dis
patc
hed
(MW
h)
(b) M
axim
um
Ener
gyA
vaila
ble
(Avg
MW
X
30 h
rs)
(c) =
(a)/(
b)
%Lo
ad Z
one
Act
ual H
ours
Dis
patc
hed
(a)
Tota
l Ene
rgy
Dis
patc
hed
(MW
h)
(b) M
axim
um
Ener
gyA
vaila
ble
(Avg
MW
X
30 h
rs)
(c) =
(a)/(
b)
%PG
CC
620
%PG
CC
1240
%PG
CC
*6
0%PG
EB6
20%
PGEB
1240
%PG
EB6
20%
PGF1
413
%PG
F112
40%
PGF1
620
%PG
FG4
13%
PGFG
*12
0%PG
FG6
20%
PGH
B6
20%
PGH
B*
120%
PGH
B*
60%
PGK
N6
20%
PGK
N12
40%
PGK
N6
20%
PGN
B4
13%
PGN
B12
40%
PGN
B6
20%
PGN
C*
60%
PGN
C*
150%
PGN
C*
60%
PGN
P6
20%
PGN
P12
40%
PGN
P6
20%
PGP2
620
%PG
P2*
120%
PGP2
*6
0%PG
SB6
20%
PGSB
1240
%PG
SB6
20%
PGSF
*4
0%PG
SF12
40%
PGSF
620
%PG
SI*
40%
PGSI
*12
0%PG
SI*
60%
PGST
*6
0%PG
ST15
50%
PGST
620
%PG
ZP*
60%
PGZP
1240
%PG
ZP*
60%
* No
part
icip
atin
g cu
stom
ers
* No
part
icip
atin
g cu
stom
ers
* No
part
icip
atin
g cu
stom
ers
Aug
ust
Sept
embe
rO
ctob
erA
nnua
l
Load
Zon
eH
ours
Dis
patc
hed
(a)
Tota
l Ene
rgy
Dis
patc
hed
(MW
h)
(b) M
axim
um
Ener
gyA
vaila
ble
(Avg
MW
X
30 h
rs)
(c) =
(a)/(
b)
%Lo
ad Z
one
Hou
rsD
ispa
tche
d
(a)
Tota
l Ene
rgy
Dis
patc
hed
(MW
h)
(b) M
axim
um
Ener
gyA
vaila
ble
(Avg
MW
X
30 h
rs)
(c) =
(a)/(
b)
%Lo
ad Z
one
Hou
rsD
ispa
tche
d
(a)
Tota
l Ene
rgy
Dis
patc
hed
(MW
h)
(b) M
axim
um
Ener
gyA
vaila
ble
(Avg
MW
X
30 h
rs)
(c) =
(a)/(
b)
%Lo
ad Z
one
Hou
rsD
ispa
tche
d
(a)
Tota
l Ene
rgy
Dis
patc
hed
(MW
h)
(b) M
axim
um
Ener
gyA
vaila
ble
(Avg
MW
X
30 h
rs)
(c) =
(a)/(
b)
%PG
CC
*19
0%PG
CC
*6
0%PG
CC
1550
%PG
CC
6430
%PG
EB19
63%
PGEB
620
%PG
EB*
150%
PGEB
6424
%PG
F119
63%
PGF1
620
%PG
F115
50%
PGF1
6233
%PG
FG19
63%
PGFG
620
%PG
FG0
0%PG
FG47
29%
PGH
B*
190%
PGH
B*
60%
PGH
B*
150%
PGH
B64
20%
PGK
N19
63%
PGK
N6
20%
PGK
N*
150%
PGK
N64
27%
PGN
B19
63%
PGN
B6
20%
PGN
B0
0%PG
NB
4725
%PG
NC
*19
0%PG
NC
*6
0%PG
NC
*0
0%PG
NC
*52
0%PG
NP
1963
%PG
NP
620
%PG
NP
1550
%PG
NP
6435
%PG
P219
63%
PGP2
620
%PG
P215
50%
PGP2
6440
%PG
SB19
63%
PGSB
*6
0%PG
SB15
50%
PGSB
6435
%PG
SF19
63%
PGSF
620
%PG
SF15
50%
PGSF
6239
%PG
SI*
190%
PGSI
*6
0%PG
SI*
150%
PGSI
*62
0%PG
ST19
63%
PGST
620
%PG
ST*
150%
PGST
6743
%PG
ZP*
190%
PGZP
*6
0%PG
ZP*
150%
PGZP
6440
%* N
o pa
rtic
ipat
ing
cust
omer
s* N
o pa
rtic
ipat
ing
cust
omer
s* N
o pa
rtic
ipat
ing
cust
omer
s* N
o pa
rtic
ipat
ing
cust
omer
s
1-AtchC-1
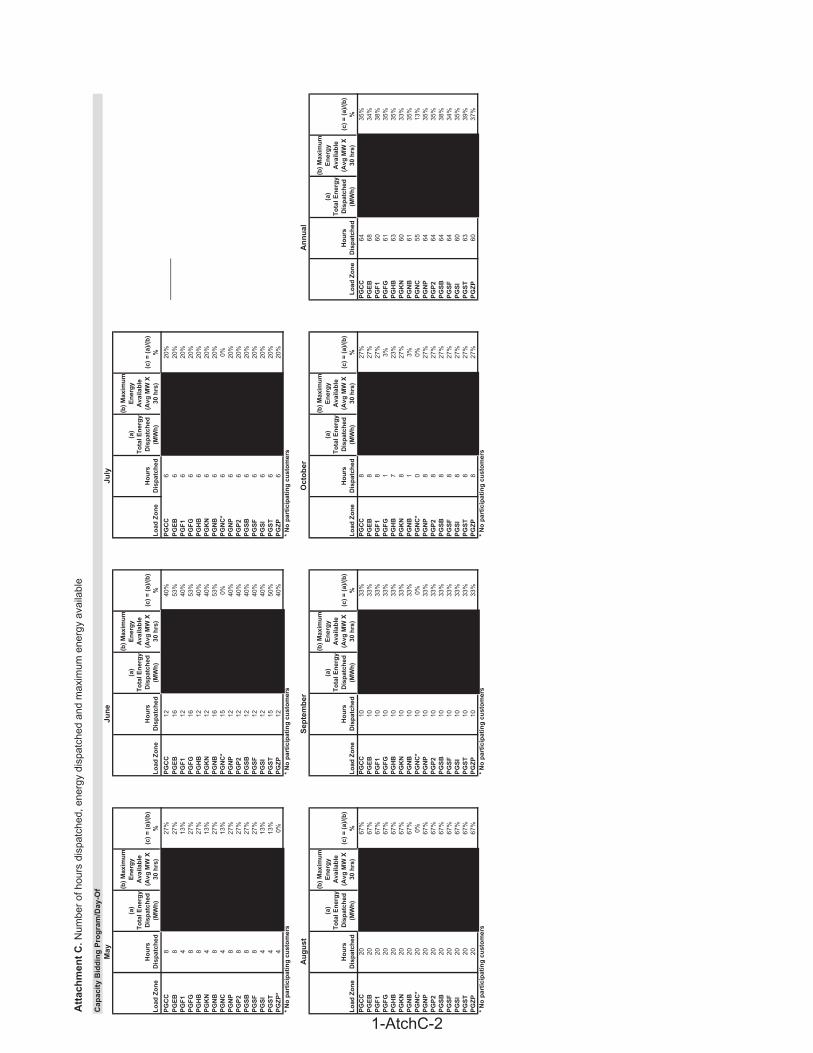
Atta
chm
ent C
. Num
ber o
f hou
rs d
ispa
tche
d, e
nerg
y di
spat
ched
and
max
imum
ene
rgy
avai
labl
e
Cap
acity
Bid
ding
Pro
gram
/Day
-Of
May
June
July
Load
Zon
eH
ours
Dis
patc
hed
(a)
Tota
l Ene
rgy
Dis
patc
hed
(MW
h)
(b) M
axim
um
Ener
gyA
vaila
ble
(Avg
MW
X
30 h
rs)
(c) =
(a)/(
b)
%Lo
ad Z
one
Hou
rsD
ispa
tche
d
(a)
Tota
l Ene
rgy
Dis
patc
hed
(MW
h)
(b) M
axim
um
Ener
gyA
vaila
ble
(Avg
MW
X
30 h
rs)
(c) =
(a)/(
b)
%Lo
ad Z
one
Hou
rsD
ispa
tche
d
(a)
Tota
l Ene
rgy
Dis
patc
hed
(MW
h)
(b) M
axim
um
Ener
gyA
vaila
ble
(Avg
MW
X
30 h
rs)
(c) =
(a)/(
b)
%PG
CC
827
%PG
CC
1240
%PG
CC
620
%PG
EB8
27%
PGEB
1653
%PG
EB6
20%
PGF1
413
%PG
F112
40%
PGF1
620
%PG
FG8
27%
PGFG
1653
%PG
FG6
20%
PGH
B8
27%
PGH
B12
40%
PGH
B6
20%
PGK
N4
13%
PGK
N12
40%
PGK
N6
20%
PGN
B8
27%
PGN
B16
53%
PGN
B6
20%
PGN
C4
13%
PGN
C*
150%
PGN
C*
60%
PGN
P8
27%
PGN
P12
40%
PGN
P6
20%
PGP2
827
%PG
P212
40%
PGP2
620
%PG
SB8
27%
PGSB
1240
%PG
SB6
20%
PGSF
827
%PG
SF12
40%
PGSF
620
%PG
SI4
13%
PGSI
1240
%PG
SI6
20%
PGST
413
%PG
ST15
50%
PGST
620
%PG
ZP*
40%
PGZP
1240
%PG
ZP6
20%
* No
part
icip
atin
g cu
stom
ers
* No
part
icip
atin
g cu
stom
ers
* No
part
icip
atin
g cu
stom
ers
Aug
ust
Sept
embe
rO
ctob
erA
nnua
l
Load
Zon
eH
ours
Dis
patc
hed
(a)
Tota
l Ene
rgy
Dis
patc
hed
(MW
h)
(b) M
axim
um
Ener
gyA
vaila
ble
(Avg
MW
X
30 h
rs)
(c) =
(a)/(
b)
%Lo
ad Z
one
Hou
rsD
ispa
tche
d
(a)
Tota
l Ene
rgy
Dis
patc
hed
(MW
h)
(b) M
axim
um
Ener
gyA
vaila
ble
(Avg
MW
X
30 h
rs)
(c) =
(a)/(
b)
%Lo
ad Z
one
Hou
rsD
ispa
tche
d
(a)
Tota
l Ene
rgy
Dis
patc
hed
(MW
h)
(b) M
axim
um
Ener
gyA
vaila
ble
(Avg
MW
X
30 h
rs)
(c) =
(a)/(
b)
%Lo
ad Z
one
Hou
rsD
ispa
tche
d
(a)
Tota
l Ene
rgy
Dis
patc
hed
(MW
h)
(b) M
axim
um
Ener
gyA
vaila
ble
(Avg
MW
X
30 h
rs)
(c) =
(a)/(
b)
%PG
CC
2067
%PG
CC
1033
%PG
CC
827
%PG
CC
6435
%PG
EB20
67%
PGEB
1033
%PG
EB8
27%
PGEB
6834
%PG
F120
67%
PGF1
1033
%PG
F18
27%
PGF1
6038
%PG
FG20
67%
PGFG
1033
%PG
FG1
3%PG
FG61
35%
PGH
B20
67%
PGH
B10
33%
PGH
B7
23%
PGH
B63
35%
PGK
N20
67%
PGK
N10
33%
PGK
N8
27%
PGK
N60
33%
PGN
B20
67%
PGN
B10
33%
PGN
B1
3%PG
NB
6135
%PG
NC
*20
0%PG
NC
*10
0%PG
NC
*0
0%PG
NC
5513
%PG
NP
2067
%PG
NP
1033
%PG
NP
827
%PG
NP
6435
%PG
P220
67%
PGP2
1033
%PG
P28
27%
PGP2
6435
%PG
SB20
67%
PGSB
1033
%PG
SB8
27%
PGSB
6438
%PG
SF20
67%
PGSF
1033
%PG
SF8
27%
PGSF
6434
%PG
SI20
67%
PGSI
1033
%PG
SI8
27%
PGSI
6035
%PG
ST20
67%
PGST
1033
%PG
ST8
27%
PGST
6339
%PG
ZP20
67%
PGZP
1033
%PG
ZP8
27%
PGZP
6037
%* N
o pa
rtic
ipat
ing
cust
omer
s* N
o pa
rtic
ipat
ing
cust
omer
s* N
o pa
rtic
ipat
ing
cust
omer
s
1-AtchC-2

PACIFIC GAS AND ELECTRIC COMPANY
CHAPTER 2
UTILITY-OWNED GENERATION: HYDROELECTRIC

2-i
PACIFIC GAS AND ELECTRIC COMPANYCHAPTER 2
UTILITY-OWNED GENERATION: HYDROELECTRIC
TABLE OF CONTENTS
A. Introduction....................................................................................................... 2-1
B. Overview of PG&E’s Hydroelectric System ...................................................... 2-2
1. Hydro System Characteristics.................................................................... 2-2
2. Hydro Operations and Maintenance Organization ..................................... 2-4
a. Shasta Area......................................................................................... 2-4
b. DeSabla Area ...................................................................................... 2-5
c. Central Area ........................................................................................ 2-5
d. Kings-Crane Valley Area ..................................................................... 2-5
e. Helms Pumped Storage Facility .......................................................... 2-6
f. Support Organizations......................................................................... 2-6
1) Hydro Licensing and Compliance.................................................. 2-6
2) Safety, Quality and Standards....................................................... 2-7
3) Water Management....................................................................... 2-7
4) Project Execution .......................................................................... 2-7
5) Planning ........................................................................................ 2-8
C. Hydro Portfolio Management............................................................................ 2-8
1. Overview.................................................................................................... 2-8
2. Operational Planning................................................................................ 2-10
a. Environmental/Regulatory Considerations Affecting Operations ....... 2-10
b. Management of Water Resources ..................................................... 2-11
c. Outage Planning................................................................................ 2-11
1) Planned Outages ........................................................................ 2-12
2) Maintenance Outages ................................................................. 2-13
3. Conventional Hydro Portfolio Operation................................................... 2-13

PACIFIC GAS AND ELECTRIC COMPANYCHAPTER 2
UTILITY-OWNED GENERATION: HYDROELECTRIC
TABLE OF CONTENTS(CONTINUED)
2-ii
4. Helms Pumped Storage Operation .......................................................... 2-14
5. Internal Controls....................................................................................... 2-15
a. Guidance Documents ........................................................................ 2-15
b. Operating Plans................................................................................. 2-16
c. Operations Reviews .......................................................................... 2-16
d. Incident Reporting Process................................................................ 2-16
e. Corrective Action Program................................................................. 2-17
f. Outage Planning and Scheduling Processes..................................... 2-17
1) Planning and Scoping ................................................................. 2-18
2) Scheduling .................................................................................. 2-19
3) Outage Execution........................................................................ 2-20
g. Project Management Process............................................................ 2-23
h. Design Change Process .................................................................... 2-23
D. Operational Results ........................................................................................ 2-23
1. Energy Production ................................................................................... 2-24
2. Outages ................................................................................................... 2-25
a. Scheduled Outages ........................................................................... 2-26
b. Forced Outages................................................................................. 2-26
1) January-February Winter Storm-Related Forced Outages.......... 2-27
2) Forced Outages Unrelated to the January-February Winter Storms......................................................................................... 2-45
E. Conclusion...................................................................................................... 2-53

2-1
PACIFIC GAS AND ELECTRIC COMPANY1
CHAPTER 22
UTILITY-OWNED GENERATION: HYDROELECTRIC3
A. Introduction4
In compliance with Decision (D.) 14-01-011, this chapter addresses the 5
operation of Pacific Gas and Electric Company’s (PG&E) utility-owned 6
hydroelectric facilities, and outages that occurred at these facilities during the 7
2017 record year.8
PG&E’s utility-owned hydroelectric portfolio was operated in a reasonable 9
manner during the record period. PG&E’s hydro-generating portfolio consists of 10
66 powerhouses with 106 generating units. The system operates under 11
25 Federal Energy Regulatory Commission (FERC) licenses, which govern the 12
operation of 102 of the generating units at 64 powerhouses. Four generating 13
units are at two non-FERC jurisdictional powerhouses. PG&E’s 14
hydro-generating portfolio has an aggregate nameplate capacity of 15
3,892.2 megawatts (MW) and produces an average of about 11 terawatt-hours 16
of energy in a normal precipitation year.17
PG&E’s 66 hydro powerhouses are located on 15 rivers and four tributaries 18
of the Sierra Nevada, Cascade and Coastal mountain ranges. This is a unique 19
set of facilities that was built between 1898 and 1986. Most of the dams and 20
powerhouses have been in service for well over 50 years, and some of the water 21
collection and transport systems were used for gold mining and consumptive 22
water prior to the development of these hydro-generating facilities.23
The system collectively includes the following ancillary support facilities: 24
98 reservoirs, 73 diversions, 170 dams, 173 miles of canals, 43 miles of flumes, 25
132 miles of tunnels, 65 miles of pipe (penstocks, siphons, and low head pipes), 26
four miles of natural waterways, and approximately 140,000 acres of fee-owned 27
land. It also includes switchyards, switching centers that remotely control 28
generation facilities, administrative buildings, fleet, multiple modes of 29
communication, materials and supplies inventories, office equipment, and other 30
miscellaneous instrumentation and monitoring equipment. PG&E’s authority to 31
divert and store water for power generation is based on 89 water right licenses 32
or interim permits, and 160 Statements of Water Diversion and Use.33

2-2
PG&E’s hydro plants produce low cost and clean energy, high value 1
ancillary services and peaking capacity to meet customers’ needs. PG&E has 2
demonstrated its ability to optimize these generation facilities through efficient 3
use of water resources and continuing environmental stewardship.4
PG&E’s system of dams, reservoirs, and water collection facilities enables 5
PG&E to store runoff and aquifer flows and then subsequently use the water to 6
generate power when customers need it most. This “shaping” of the available7
generation is performed both seasonally (for example, by storing more water in 8
the spring and releasing water from the reservoirs during high value hot summer 9
days) and day to day (for example, generating more during hours of peak 10
system demand—typically weekday late-afternoons and evenings—and less at 11
night and on weekends). In general, the highest value of PG&E-owned 12
generation is likely to be when PG&E’s demand is greatest and intermittent 13
renewables are not available, and hydro generation can contribute significantly 14
toward reducing the amount of power that has to be purchased during these 15
higher priced hours.16
Hydroelectric generating units typically start up quickly, have fast ramp 17
rates, and can easily, quickly, and economically vary output in response to 18
changing customer loads and system conditions. In addition, hydro-generating 19
units can operate at no load or low load with much higher efficiency than the 20
alternative fossil fueled peaking plants. Finally, because a large portion of 21
California's non fossil-fueled electricity resources consist of non-dispatchable 22
energy sources such as wind, solar, nuclear and regulatory “must-take” 23
generation, the California Independent System Operator (CAISO) relies on 24
PG&E’s hydro resources to satisfy a large portion of its operating reserve 25
requirements.26
B. Overview of PG&E’s Hydroelectric System27
1. Hydro System Characteristics28
Hydroelectric generation converts the potential energy contained in 29
falling water to electricity. In general, water from precipitation runoff and30
aquifer flows is collected at a high elevation and through various water 31
collection, storage and conveyance systems is delivered to the powerhouse 32
penstock where it drops to the powerhouse elevation. The water, under 33

2-3
pressure from the elevation drop, is directed through or against the turbine 1
runner causing the turbine and coupled generator to rotate and produce 2
electricity. The major system components consist of:3
Water Collection Facilities – Reservoirs and dams including stream 4
diversions;5
Water Conveyance Facilities – Tunnels, canals, flumes, natural 6
waterways, conduits and penstocks utilized to direct the water from 7
collection points to the powerhouse;8
Powerhouses – Structures containing the turbines, generators and 9
associated equipment used to produce electricity; and10
Auxiliary Equipment – Transmission lines and associated switchyard 11
equipment to transmit the electricity to the grid.12
PG&E’s hydro-generation portfolio can be segregated into 13
three categories based on the characteristics of the water supply to the 14
powerhouse:15
Run-of-the-River Powerhouses – These powerhouses generally have 16
little or no water storage facilities and rely on stream/river diversions, 17
with small impoundments, to direct the water into the water conveyance 18
system. The powerhouse is operated based on the flow available to be 19
diverted from the river. Once diverted, the water travels through various 20
water conveyance facilities, such as canals, flumes, tunnels, natural 21
waterways, and conduits to the penstock.22
Reservoir Storage Powerhouses – Powerhouses that have significant 23
water storage facilities are not limited to run based on the available river 24
flow, but can store runoff and aquifer flows and then subsequently use 25
the water to generate power when customers need it most. Generally, 26
these powerhouses have less water conveyance assets either because 27
they are located close to the dams or have a single large tunnel 28
delivering water to the penstock(s). Because of their large 29
impoundments and hydro’s ability to quickly come online and ramp up to 30
full capacity, these powerhouses can be used for peaking during high 31
demand power periods.32
Pumped Storage Powerhouse – PG&E has one pumped storage 33
powerhouse, Helms Pumped Storage Facility (Helms). Helms is a 34

2-4
reservoir storage powerhouse, situated between an upper reservoir, 1
Courtright Lake, and a lower reservoir, Lake Wishon, with 2
three generators that can be reversed to act as pumps. During off-peak 3
hours, when energy prices are lower, the pumping mode is utilized to 4
pump water back up to Courtright Lake to be reused during the next 5
cycle. The ability to pump the water back up to the storage reservoir 6
allows the water resource to be reused during peak demand hours. 7
Helms also provides renewable integration benefits such as regulation 8
up and down, load following, operating reserves (backup), shaping, and 9
management of system over-generation conditions that result from 10
excess renewables generation during off-peak and partial-peak periods.11
2. Hydro Operations and Maintenance Organization12
PG&E’s Power Generation organization is responsible for managing the 13
hydro-generating portfolio. The Hydro Operations and Maintenance (O&M) 14
organization is responsible for facility O&M and works side by side with the 15
other Power Generation and PG&E Energy Supply support organizations to 16
provide safe, reliable, cost-effective and environmentally responsible 17
generation. Hydro O&M is organized geographically into five areas. These 18
areas consist of logical groupings of facilities that enable efficient oversight, 19
control and management of O&M. The powerhouses are operated from 20
seven switching centers located throughout the system. Six of the switching 21
centers are located at powerhouses and one is located in Fresno. A full 22
listing of powerhouses and individual units is included in Attachment 2A.23
The Hydro Areas (from North to South) and the Power Generation 24
support organizations are described below, and the information is then 25
summarized in Table 2-1.26
a. Shasta Area27
The Shasta Area manages 16 powerhouses with 28 generating 28
units and has an installed capacity of 809.9 MW. The powerhouses 29
have in-service dates spanning from 1903-1981. The facilities are 30
situated on six different watersheds in Shasta and Tehama counties. 31
There are two switching centers in Shasta, located at Pit 3 Powerhouse 32

2-5
and Pit 5 Powerhouse. The Shasta Area headquarters is located in 1
Burney with a satellite headquarters in Manton.2
b. DeSabla Area3
The DeSabla Area manages 15 powerhouses with 27 generating 4
units and has an installed capacity of 785.7 MW. The powerhouses 5
have in-service dates spanning from 1900-1985. The facilities are 6
situated on five different watersheds in Plumas and Butte counties, and 7
on one watershed located in Mendocino County. There is one switching 8
center in DeSabla located at Rock Creek Powerhouse. The 9
DeSabla Area headquarters is located at Rodgers Flat (near Oroville) 10
with satellite headquarters at Camp One (near Paradise) and 11
Potter Valley (near Ukiah).12
c. Central Area13
The Central Area manages 21 powerhouses with 28 generating14
units and has an installed capacity of 522.6 MW. The powerhouses 15
have in-service dates spanning from 1902-1986. The facilities are 16
situated on eight different watersheds in Nevada, Placer, El Dorado, 17
Amador, Tuolumne and Merced counties. There are three switching 18
centers in the Central Area located at Drum Powerhouse, Wise 19
Powerhouse and Tiger Creek Powerhouse. The Central Area 20
headquarters is located in Auburn with satellite headquarters at Alta, 21
Angels Camp, Tiger Creek (near Jackson) and Sonora.22
d. Kings-Crane Valley Area23
The Kings-Crane Valley Area manages 13 powerhouses with 24
20 generating units and has an installed capacity of 562 MW. The 25
powerhouses have in-service dates spanning from 1906-1983. The 26
facilities are situated on six different watersheds in Madera, Fresno, 27
Tulare and Kern counties. The Kings-Crane Valley switching center is 28
located at the Fresno Operating Center. The Kings-Crane Valley Area 29
headquarters is located in Auberry with a satellite headquarters at 30
Balch Camp (east of Clovis).31

2-6
e. Helms Pumped Storage Facility1
This Area consists of the Helms facility with three pump-generator 2
units and an installed capacity of 1,212 MW. Helms was placed in 3
service in 1984. Helms is operated from the powerhouse and is not 4
under the jurisdiction of a separate switching center. Helms is located in 5
Fresno County and has a headquarters facility at the project site.6
TABLE 2-1HYDRO GENERATION AREA DETAILS
Line No. Area
No. of Powerhouses
No. of Units MW
No. of FERC
LicensesNo. of Dams
Usable Storage
(acre-feet)Tunnels (Miles)
Canals (Miles)
Flumes (Miles)
1 Shasta 16 28 809.9 6 44 200,714 27.9 44.5 4.62 DeSabla 15 27 785.7 6 32 1,427,239 34.2 48.4 7.43 Central 21 28 522.6 6 71 423,732 37.3 71.3 29.44 Kings Crane
Valley13 20 562.0 6 17 51,866 28.6 8.8 2.0
5 Helms 1 3 1,212.0 1 6 252,404 3.9 N/A N/A
6 Total 66 106 3,892.2 25 170 2,355,955 131.9 173.0 43.4
f. Support Organizations7
The Hydro O&M organization works side by side with other Power 8
Generation support organizations to provide safe, reliable, cost-effective 9
generation to California in an environmentally responsible manner.10
Power Generation’s centralized organization provides oversight, 11
direction and support to ensure that critical resources, personnel and 12
technical information and advice are available to support O&M. This 13
includes a centralized management team that provides the following 14
services and expertise:15
1) Hydro Licensing and Compliance16
Hydro Licensing and Compliance manages PG&E’s 25 FERC 17
hydropower licenses and related water rights, permits and 18
agreements. It has the primary responsibility for FERC relicensing19
and for managing license compliance in partnership with 20
Hydro O&M.21

2-7
2) Safety, Quality and Standards1
Safety, Quality and Standards (SQS) is focused on six key 2
functional areas to ensure that Power Generation is focused on 3
public and employee safety; that processes are smart and simple; 4
and that work is performed to high quality and in compliance with all 5
standards and procedures that govern the Power Generation 6
business. Those key areas are:7
Public and Employee Safety;8
Facilities Safety;9
Standards;10
Process;11
Quality; and12
Documentation and Records.13
Technical employees provide direct support for the safe,14
reliable, compliant, and efficient operation of PG&E’s hydroelectric 15
generating units. O&M Specialists act as consultants to the Hydro 16
O&M organization, offering expertise in methods and procedures to 17
help assure compliance with O&M standards.18
In addition, SQS manages the Facility Safety Program for dams 19
and water conveyance facilities to assure compliance with FERC 20
and California Division of Safety of Dams (DSOD) regulations.21
3) Water Management22
Water Management (WM), within the Hydro Licensing 23
Department, supports the Hydro O&M operations through the 24
utilization of sophisticated computer models to schedule the 25
hydroelectric resources based on the latest hydro-meteorological 26
data, forecasts of stream flow runoff, and pricing forecasts. 27
WM produces a calendar year hydro generation forecast.28
4) Project Execution29
Project Execution combines engineering, project management 30
and construction services into an integrated department that 31
manages project work in addition to supporting routine O&M 32
operations. These organizations are:33

2-8
Programs and Designs1
Programs and Designs provides civil, electrical and 2
mechanical engineering and design services for projects at all 3
powerhouses, switchyards, dams, water conveyance systems 4
and appurtenant facilities throughout the PG&E hydro system, 5
as well as for many of the partnership Irrigation Districts and 6
Water Agencies facilities.7
Project Engineering8
Project Engineering provides project management and 9
engineering services to Power Generation projects throughout 10
PG&E's hydro territory. Project work includes both capital and 11
expense safety, reliability, regulatory and efficiency 12
improvement projects. Project Engineering also provides 13
engineering services in support of routine hydro O&M work.14
Construction15
Construction is a mobile construction organization that 16
handles major maintenance and construction projects 17
throughout the hydro system. With both a civil construction 18
group and an electrical-mechanical group, this organization 19
constructs and/or makes major repairs on a wide variety of 20
hydro facilities.21
5) Planning22
Planning supports the Hydro O&M operations by providing a 23
systemwide look into the condition of PG&E’s assets, dovetailing 24
specific equipment program investment strategies with the Power 25
Generation organization’s long-term investment strategy. This 26
allows PG&E to make data-driven investment decisions to improve 27
the safety and reliability of its generating assets.28
C. Hydro Portfolio Management29
1. Overview30
The PG&E hydro portfolio is a complex system composed of many 31
facilities with interrelated operational parameters. Many powerhouses are in 32
“river-chains” where the water is most optimally used sequentially through 33
2-9
the powerhouses as it moves downriver. This requires coordinated 1
operations to assure each powerhouse is online to utilize the water flow as 2
it arrives, without spilling past the powerhouse. Operation of the hydro 3
portfolio also has to take into account the FERC license-mandated minimum 4
and maximum flows and ramping rates on the river to assure compliance 5
with license conditions. Management of this complex portfolio relies on the 6
integration of information and expertise from multiple organizations.7
PG&E is committed to providing safe utility service to its customers. 8
As part of this commitment, PG&E reviews its operations, including 9
operation of its hydro facilities, to identify and mitigate, to the extent 10
possible, potential safety risks to the public, PG&E’s workforce and its 11
contractors. As it operates and maintains its hydro generation facilities, 12
PG&E follows its internal controls to ensure public, workplace, and 13
contractor safety. For example, PG&E’s Employee Code of Conduct 14
describes the safety of the public, employees and contractors as PG&E’s 15
highest priority. PG&E’s commitment to a safety-first culture is reinforced 16
with its Safety Principles, PG&E’s Safety Commitment, Personal Safety 17
Commitment and Keys to Life. These tools were developed in collaboration 18
with PG&E employees, leaders, and union leadership, and are intended to 19
provide clarity and support as employees strive to take personal ownership 20
of safety at PG&E. Additionally, PG&E seeks all applicable regulatory 21
approvals from governmental authorities with jurisdiction to enforce laws 22
related to worker health and safety, impacts to the environment, and public 23
health and welfare.24
As part of PG&E’s Safety Commitment, PG&E follows recognized best 25
practices in the industry. PG&E operates each of its generation facilities in 26
compliance with all local, state and federal permit and operating 27
requirements such as state and federal Occupational Safety and Health 28
Administration requirements and the California Public Utilities Commission’s 29
General Order 167. As discussed below, PG&E does this by using 30
internal controls to help manage the operations and maintenance of its 31
generation facilities.32
With regard to employee safety, Power Generation employees develop 33
a safety action plan each year. This action plan focuses on various items 34

2-10
such as training and qualifications, contractor safety, human performance, 1
approaches to reduce or eliminate recordable injuries and motor vehicle 2
incidents, approaches to sharing safety best practices, and actions to 3
improve the safety culture of the organization.4
With regard to public safety, PG&E continues to develop and implement 5
a comprehensive public safety program that includes: (1) public education, 6
outreach and partnership with key agencies; (2) improved warning and 7
hazard signage at hydro facilities; (3) enhanced emergency response 8
preparedness, training, drills and coordination with emergency response 9
organizations; and (4) safer access to hydro facilities and lands, including 10
trail access, physical barriers, and canal escape routes.11
Fundamental to a strong safety culture is a leadership team that 12
believes every job can be performed safely and seeks to eliminate barriers 13
to safe operations. Equally important is the establishment of an empowered 14
grass roots safety team that can act to encourage safe work practices 15
among peers. Power Generation’s grass roots team is led by bargaining 16
unit employees from across the organization who work to include safety best 17
practices in all the work they do. These employees are closest to the 18
day-to-day work of providing safe, reliable, and affordable energy for 19
PG&E’s customers and are best positioned to implement changes that can 20
improve safety performance.21
2. Operational Planning22
a. Environmental/Regulatory Considerations Affecting Operations23
PG&E’s operation of its hydro system is governed by the 24
25 Operating Licenses issued by FERC, which contain over 500 discrete 25
operating conditions. PG&E safely and reliably operates the system in 26
compliance with all FERC license conditions and all local, state, and 27
federal regulations. In addition, operations are constrained by many 28
conditions imposed by U.S. Forest Service agreements, the DSOD 29
regulations, contractual obligations, water diversion rights and other 30
regulations. PG&E’s hydro projects deliver water at 54 locations for 31
consumption by 39 different user groups under water delivery 32
agreements that contain additional constraints on how the projects are 33

2-11
operated. There are defined minimum and maximum flow requirements 1
in most river reaches below PG&E’s reservoirs and powerhouses. Any 2
changes in the flows have to be performed in compliance with 3
prescribed ramp rates. Reservoirs have both minimum and maximum 4
storage requirements which often vary depending upon the time of year.5
b. Management of Water Resources6
Water resources are fuel for the hydro powerhouses and the 7
efficient management of these resources is paramount to the operations 8
of the hydro portfolio. The WM organization forecasts runoff and 9
provides guidance for scheduling hydroelectric resources consistent with 10
all regulatory rules, agreements, contracts, environmental regulations 11
and recreational needs.12
WM scheduling consultants employ a number of sophisticated 13
computer modeling programs to forecast runoff. These programs use 14
inputs from the current hydrologic state of the watershed (snowpack, 15
current runoff and aquifer outflows), an updated 10-day weather 16
forecast, and the long-range weather forecast, with appropriate 17
probability factors, to compile monthly and daily runoff forecasts that are 18
used to develop optimized monthly water release schedules. The 19
monthly water release schedules are used as guidance by PG&E’s 20
Short Term Electric Supply (STES) organization and Hydro O&M in 21
operating the reservoirs, water conveyance systems and powerhouses.122
c. Outage Planning23
PG&E has formal outage planning and scheduling processes for its 24
generation assets. Management control over the planning and 25
scheduling of outages is a key process for prudent management of 26
PG&E’s generation facilities. The planning and scheduling processes 27
include management approval points for the base yearly outage 28
schedule as well as for any changes to the schedule. Details of the 29
outage planning and scheduling processes are included under Internal 30
1 For further details, see Chapter 1.

2-12
Controls in Section C.5 below. Scheduled outages are classified into 1
one of two groups: (1) Planned Outages; or (2) Maintenance Outages.2
1) Planned Outages3
Planned Outages (PO) are part of the normal course of 4
maintaining a generating facility. Due to the age of PG&E’s hydro 5
portfolio assets and the complexity of the water collection and 6
conveyance systems, and in order to assure that the generating 7
facilities are reliable during periods of high electric demand, most 8
hydro units are scheduled for one PO each year. These POs are 9
typically scheduled during periods of lower electric demand when 10
market prices are lower.11
These outages are for the purpose of accomplishing annual 12
recurring routine maintenance work, equipment repairs that require 13
an outage, minor project work and condition assessment to 14
ascertain risk. Examples of typical annual maintenance tasks 15
include time-based equipment overhauls; time-based equipment 16
inspections; North American Electric Reliability Corporation (NERC) 17
compliance testing; turbine component lubrication, adjustment and 18
repairs; generator inspection and repairs; relay performance tests; 19
annual auto tests; and condition assessment measurements and 20
readings. The need for scheduled maintenance is well documented 21
in PG&E’s past general rate case applications. If major capital 22
projects requiring an outage are planned, the annual outages are 23
modified to accommodate that work.24
Scheduling of POs is an iterative process spanning several 25
years with input from many stakeholders and quarterly submissions 26
to the CAISO. As described in Section C.5.f., the processes for 27
planning and scheduling annual POs demonstrate that POs are 28
scheduled sufficiently in advance, have an adequate duration for 29
planning and preparation, have controls to manage changes, and 30
have reasonable management oversight to assure that units are 31
promptly returned to service.32

2-13
2) Maintenance Outages1
Maintenance Outages (MO) are taken when there is an 2
emerging need for maintenance that can be deferred beyond the 3
end of the next weekend, but requires a capacity reduction before 4
the next PO. Some examples of typical MOs include replacing 5
generator brushes; cleaning brush rigging; performing auto tests; 6
troubleshooting tests; transmission line work; monthly routine minor 7
maintenance; monthly gate travel tests; and out-of-tolerance 8
equipment adjustments.9
MOs must be scheduled with the CAISO a minimum of 72 hours 10
in advance of the unit being taken out of service. Many MOs for 11
routine monthly activities are scheduled much further in advance to 12
assure proper planning and preparation. Every attempt is made to 13
include all maintenance items in the annual PO for each unit, but 14
there are some systems and equipment that must be serviced or 15
tested more frequently, and at times there are issues that emerge 16
between POs that cannot be deferred until the next annual outage.17
3. Conventional Hydro Portfolio Operation18
PG&E’s 65 conventional powerhouses are operated from seven19
around-the-clock switching centers. Six of the switching centers are at 20
powerhouses and one is located in Fresno. Switching center operators 21
receive day-ahead dispatch instructions from PG&E’s STES organization. 22
Operators review the day-ahead schedules and verify that they are 23
attainable. Any operational constraints that may interfere with running the 24
unit to the dispatch schedule are reviewed with STES, and if necessary, the 25
dispatch instructions are adjusted. The conventional hydro powerhouses 26
are operated in accordance with the final dispatch directions provided 27
by STES.28
During daily operations, there is close communication between the 29
operators and STES’s real-time energy desk. Through the Supervisory 30
Control and Data Acquisition (SCADA) system, operators remotely start 31
units, vary the loading and stop units in accordance with dispatch 32
instructions. They continuously monitor and adjust the operations of the 33
units at the powerhouses, the canal flows and levels, the reservoir levels, 34

2-14
the instream flow releases and other pertinent operating parameters. Any 1
operational issues that require a unit to deviate from the dispatch schedule 2
are communicated to the real-time desk, and operators make adjustments in 3
the unit’s operation in accordance with the directions received back from the 4
real-time desk.5
Roving operators visit the remote, unmanned powerhouses to perform 6
station reads and operational checks that cannot be performed through 7
SCADA. They also perform minor maintenance and adjustments, such as 8
lubricating equipment, checking oil reservoirs on equipment, and cleaning 9
strainers. Roving operators are also dispatched to perform remote unit 10
start-ups that cannot be handled through the SCADA system. At the 11
six powerhouses housing switching centers, the switching center operators 12
perform the duties of the roving operators for those local units.13
Water system operators manage the operations of the water delivery 14
systems that feed the powerhouses and make adjustments in the reservoir 15
and canal operations for instream flow releases and water deliveries to 16
third parties. In concert with the switching center operators monitoring 17
SCADA, the water system operators assure safe canal flows and reservoir 18
levels while meeting dispatch requirements.19
4. Helms Pumped Storage Operation20
Helms is operated around-the-clock from a control room in the 21
powerhouse. Similar to conventional powerhouse dispatch described 22
above, the Helms operators receive day-ahead dispatch instructions from23
STES. These instructions include both generating and pumping directions. 24
Operators review the day-ahead schedules and verify that they are 25
attainable. Any operational constraints that may interfere with running the 26
unit to the dispatch schedule, either in generating or pumping mode, are 27
reviewed with STES and if necessary the dispatch instructions are adjusted. 28
Helms is operated in accordance with the final dispatch directions provided 29
by STES.30
Helms has a significant influence on grid stability, and the CAISO’s daily 31
requirements can cause the dispatch of the Helms units to be changed 32
many times throughout the day. Helms operators and the STES real-time 33

2-15
desk stay in constant communication and the operators adjust the unit’s 1
operation in accordance with instruction from the real-time desk.2
Helms operators, similar to roving operators described in Section C.3,3
complete the system reads and operational checks that cannot be 4
performed through SCADA and perform minor maintenance and 5
adjustments in the powerhouse.6
5. Internal Controls7
Internal controls are a means by which an organization’s resources are 8
directed, monitored, and measured. PG&E defines internal controls as a 9
process or set of processes that take into consideration an organization's 10
structure, work and authority flows, people and management information 11
systems and are designed to help the organization accomplish specific 12
goals or objectives.13
PG&E has many internal controls in place to manage the O&M of its 14
generation assets, including its hydro facilities. These controls include: 15
(1) guidance documents; (2) operating plans; (3) operations reviews; 16
(4) an incident reporting process; (5) a Corrective Action Program (CAP); 17
(6) outage planning and scheduling processes; (7) a project management 18
process; and (8) a design change process. Each of these controls is 19
discussed below.20
a. Guidance Documents21
The guidance documents applicable to hydro operations include 22
PG&E Policy, PG&E Utility Standard Practices, PG&E Utility 23
Procedures, and Power Generation-specific guidance documents. 24
Power Generation-specific guidance documents include Standards, 25
Procedures and Bulletins. These guidance documents cover virtually all 26
aspects of safety, operations, maintenance, planning, environmental 27
compliance, regulatory compliance, emergency response, work 28
management, inspection, testing and other areas. Each guidance 29
document describes the purpose of the document, the details of the 30
actions and/or processes covered by the document, management’s 31
roles and responsibilities, and the date the document became effective.32

2-16
b. Operating Plans1
The hydro switching centers have operating plans to assure that the 2
powerhouses are operated in conformance with license conditions and 3
all other local, state and federal regulations. There are also specific 4
operating plans developed for operating the powerhouses in the 5
extreme conditions of summer and winter. The plans specify how 6
operation of the facilities is adjusted to take into account the impacts of 7
the seasons. For example, the summer plan addresses operational 8
issues related to excessive heat and increased public recreation in, 9
around and downstream of PG&E facilities. The winter plan addresses 10
operational issues related to heavy rainfall, increased river and stream 11
runoff and snow conditions.12
c. Operations Reviews13
Operations reviews are periodically performed at hydro 14
powerhouses and switching centers by the SQS organization. The 15
purpose of the operations reviews is to assure that PG&E’s generation 16
facilities are operated in a safe and efficient manner and that they are in 17
compliance with standard operating and clearance procedures.18
An operations review evaluates the overall operation of a 19
powerhouse against a variety of Power Generation’s guidance 20
documents to assure that standard operating practices are being 21
followed and the powerhouse is in full regulatory and environmental 22
compliance. The results of the review are shared with management and 23
any identified violations require an immediate response and correction.24
d. Incident Reporting Process25
The incident reporting process is intended to document problems, 26
activities and events that impact or could potentially impact the 27
performance of systems that assure: (1) public safety; (2) facility safety, 28
reliability, availability, and protection of property; and/or 29
(3) environmental or regulatory compliance. By thoroughly analyzing 30
significant problem events that occur in the operation and maintenance 31
of PG&E’s facilities, PG&E can report to various regulatory agencies as 32
required, identify possible precursors to repetitive or more serious 33

2-17
problems, understand root causes, and communicate and apply lessons 1
learned to other facilities and personnel.2
e. Corrective Action Program3
The CAP is designed to document and track corrective actions and 4
commitments. The CAP includes problem identification, cause 5
determination, reporting, development of corrective actions and 6
corrective action implementation tracking.7
PG&E’s Power Generation organization has implemented a CAP 8
that utilizes SAP notifications and orders to track and document the 9
following: actions that are necessary or have been taken as a result of 10
audit and/or inspection findings, deviations identified in incident reports, 11
regulatory non-compliance issues, engineering deviations and other 12
systemwide issues.13
f. Outage Planning and Scheduling Processes14
The hydro outage schedule is developed to communicate when 15
various powerhouse units will be unavailable due to maintenance or 16
project work. Shown on the schedule are annual maintenance outages, 17
project-specific outages and combination outages encompassing both 18
project and maintenance tasks. The hydro outage schedule for a given 19
outage year is developed through an iterative process, over several 20
years, as projects and maintenance tasks are identified by field 21
employees, management, project managers and others. Except for 22
outages with scopes of work demanding long durations or units that 23
have little or no water to run, no outages are planned during the peak 24
summer generation season. Also, every effort is made to limit the 25
number and duration of outages in the off-peak shoulder months.26
The yearly outage schedule is not a static document. The schedule 27
is fluid and adaptable to changing requirements for outages. PG&E’s 28
STES organization, the CAISO, and others utilize the schedule to make 29
plans regarding resource allocation, replacement power and restrictions 30
on the system. Therefore, changes in the schedule, particularly in the 31
short term, are discouraged. However, it is inevitable that due to the 32
dynamic nature of the hydro system, changes will be required. 33

2-18
Changes to the schedule may be required based on many factors, 1
including weather conditions, resource constraints, changes in project 2
scope or schedule, and/or emergent work. Depending on the proximity 3
to the outage start date, changes to the scope and schedule require 4
different levels of management review and approval. Before outage 5
changes are approved, consideration is given to the impacts of the 6
change on issues such as: effects on equipment reliability, replacement 7
power costs, water deliveries, possible by-pass spills, resources and 8
impacts to other scheduled outages.9
For an individual outage, an outage management plan is developed 10
prior to the start of the outage. Depending on the size and duration of 11
the outage, an outage management plan can be as simple as a list of 12
work orders extracted from the SAP Work Management (SAP WM) 13
system, or as complex as a critical path, resource-loaded work 14
execution plan detailing each task for a project as well as preventative 15
and corrective maintenance work orders. The development of an 16
outage management plan can be broken down into three distinct, but 17
interrelated, processes: (1) Planning and Scoping; (2) Scheduling; 18
and (3) Outage Execution.19
1) Planning and Scoping20
The planning and scoping process entails determining which 21
work is to be executed during the outage. This includes 22
preventative maintenance work orders, corrective work orders for 23
repairs on equipment and/or facilities and project-specific asset 24
replacements or major refurbishments. During this process, the 25
required resources to execute the work and the duration of all work 26
activities are identified.27
Power Generation utilizes SAP WM as the tool to manage 28
preventative and corrective work. Preventative maintenance work 29
orders, sometimes referred to as recurring work, encompass routine 30
maintenance work performed at established intervals. Corrective 31
work orders, sometimes referred to as trouble tags, refer to work 32
identified to correct an issue that is limiting the ability of the 33
equipment or facility to efficiently perform its design function. The 34

2-19
SAP WM system is the electronic repository where preventative and 1
corrective work is identified, tracked, organized and managed. The 2
system utilizes maintenance libraries to generate recurring work 3
orders against a piece of equipment at the appropriate frequency as 4
specified by PG&E. Corrective work orders are created in the 5
system by the crews or individuals identifying the problem.6
The planning and scoping process begins two to three years 7
prior to the outage and continues until outage execution.8
2) Scheduling9
The scheduling process includes determining the timing of the 10
start of the outage, as well as the appropriate duration. Outage 11
timing and durations are influenced by many factors, including but 12
not limited to: capital and maintenance work to be performed, 13
system operation constraints, powerhouse elevation, time of year, 14
weather conditions, water storage requirements, downstream water 15
user requirements, size of unit, labor resources available to perform 16
work, configuration of hydro system (close coupled to dam or long 17
water delivery system), effects on other powerhouses, CAISO 18
constraints, transmission system issues, distribution system issues 19
and FERC license conditions.20
Table 2-2 below provides the timeline for the outage scheduling 21
process.22

2-20
TABLE 2-2OUTAGE SCHEDULING PROCESS
Steps Timing Process Description
1. 2 to 3 Years Prior to Outage Year
A preliminary annual outage schedule for the outage year isprepared 2 to 3 years in advance. This preliminary schedule is created using historical outage durations and timing data for each watershed, powerhouse and unit. There is no formal approval of this preliminary schedule. The local O&M supervisors review the preliminary schedule and recommend changes.
2. 1 to 2 Years Prior to Outage Year
Each annual outage on the schedule is adjusted/revised over the next 1 to 2 years as more information becomes available about routine maintenance tasks, non-routine maintenance requirements, and/or project work that must be performed during the outage. During this preliminary phase, requested changes are made to the schedule and reviewed by PG&E Generation Supervisors for powerhouses under their control.
3. 3 Months Prior to the Start of the Outage Year
On a quarterly basis, PG&E submits to the CAISO a planned outage schedule that details the outages planned for the following 15 months. In October of the year prior to the outage year, the planned outage schedule is submitted to the CAISO to set the base outage schedule. After this submission, any requests for changes to individual outages are submitted to the responsible Area Manager and/or Hydro O&M Director for approval. The level of management approval is dictated by the proximity of the request to the outage start date. These internal approvals are required before the changes are submitted to the CAISO.
4. Changes During an Outage
Changes to the duration of an outage can occur during an outage due to emerging work, unforeseen problems or other issues. Requests for outage extensions require the approval of the Hydro O&M Director.
3) Outage Execution1
The outage execution process encompasses not only 2
performing the work planned for the outage, but also complying with 3
the many sub-processes for notifications and approvals between the 4
outage stakeholders and lessons learned. These include:5
Notifications to and approvals from the CAISO to separate the 6
unit(s) from the grid;7
Clearance procedures covering the steps required to 8
electrically, hydraulically and mechanically clear the units and 9
facilities (i.e., put them in a safe condition) for the outage work 10
to proceed;11
Notifications and approvals for any changes in the outage due 12
to emerging work or changed conditions;13

2-21
Restoration procedures to restore the unit to service when the 1
outage work is completed. This includes complying with the 2
steps in the switch log and any start-up procedure for new or 3
refurbished equipment;4
Notifications to and approvals from the CAISO to restore the 5
unit to service and connect to the grid at the completion of 6
the outage; and7
Collection of lessons learned at the completion of the outage for 8
incorporation into processes and procedures.9
Table 2-3 provides the timeline for the outage execution 10
process.11

2-22
TABLE 2-3OUTAGE EXECUTION PROCESS
Steps Timing Process Description
1. Prior to Outage Start Date
An Application for Work (AFW) covering the planned outage is submitted to the STES organization’s Outage Coordinator. Once the AFW has been reviewed and approved internally, it is submitted to the CAISO through the Scheduling and Logging ISO California (SLIC) system for preliminary approval.Switching Center Operators write detailed step-by-step switching logs for clearing the units. These logs detail all the clearance points for the outage and the tasks that need to be performed, and the order in which they must be performed, to make the unit or facility safe for outage work to begin.
2. Outage Start Date The STES organization’s Real-Time Desk, working off the list of preliminary approved outages, contacts the CAISO for final approval that the unit can be separated from the grid and communicates that approval to the Switching Center Operators.Once approval has been obtained, an operator, working in concert with the Switching Center, executes the steps in the Switching Log to clear the unit or facility.
3. During the Outage PG&E employees and/or contractor resources are utilized to execute the prioritized maintenance work and any project work in accordance with the outage plan and in compliance with PG&E standards.Emerging work that is identified during the outage is evaluated and prioritized against other ongoing work. If it is determined that the emerging work must be completed during the current outage, the work is added to the outage plan. Adding emergent work to the outage plan is often necessary to prevent a future forced outage. If emerging work requires an outage extension, approval of the Hydro O&M Director is required. Notification of an outage extension is communicated to the CAISO through the SLIC system.Both the Switching Log for restoring the unit and a start-upprocedure, covering all the requirements for testing newly installed equipment, are written.
4. Return to Service Date
When all outage work has been completed, the process of restoring the unit to service begins. This entails a series of standard unit tests that must be performed before the unit can be released for service and a start-up procedure if there is newly installed equipment. Once complete, an operator, working in concert with the Switching Center, executes the steps in the Switching Log to restore the unit to service.
The Switching Center Operators contact the Real-Time Desk when the unit has been restored and the Real-Time Desk notifies the CAISO through the SLIC system that the unit has been restored to service.At the completion of the outage, the information gathered while performing the maintenance work during the outage is utilized to update maintenance libraries in SAP WM and refine the details and timing of future maintenance tasks.

2-23
The three processes detailed above are highly interrelated. 1
Outage scheduling is dependent on planning and scoping. As the 2
defined outage scope changes, the outage schedule is continuously 3
reviewed and updated based on that changed scope. Conversely, if 4
outside influences require the outage timing or duration to change, 5
the scope of work is reviewed and adjusted to fit the revised 6
timeframe. During outage execution, emerging work may require an 7
outage extension, which could, in turn, impact the planning and 8
scheduling of outages on other units or facilities.9
g. Project Management Process10
Project work is controlled through the project management process. 11
Each project has an assigned Project Manager who has responsibility 12
for the project scope, cost and schedule, and who coordinates and 13
manages the project from inception to closeout. Project management 14
procedures and tools are in place to provide Power Generation project 15
managers and job leaders guidelines for successfully achieving the 16
project objective of each project they manage. These procedures are 17
intended to be applicable to all types, sizes and phases of Power 18
Generation projects, and are anticipated to improve the consistency and 19
quality of project management throughout Power Generation. Project 20
Managers are responsible for regular project reporting to management.21
h. Design Change Process22
Design changes are controlled through the design change process. 23
The design change process is the process for proposing, evaluating, 24
and implementing changes to the design of structures, systems, and 25
equipment at PG&E’s hydro-generating facilities. It includes the process 26
for requesting design changes; reviewing and approving design change27
requests; implementing design changes; closing out design changes; 28
and revising design change notices.29
D. Operational Results30
PG&E operates its diverse hydro system as a portfolio. The following 31
section discusses the operational results for the hydro portfolio. The operational 32

2-24
results achieved by PG&E’s hydro portfolio demonstrate that PG&E’s hydro 1
resources were operated in a reasonable manner during the record period.2
1. Energy Production3
The energy production at hydro generation facilities is dependent on the4
available water supplies in any given year. Just as natural gas is fuel for a 5
fossil fuel generating station, water from precipitation, snowmelt, and aquifer 6
outflows is the fuel for hydro-generating facilities. The hydro fuel supply in 7
any given year is dependent on several factors including meteorological 8
conditions in the current year, snowpack, aquifer outflows during the year, 9
the amount of water storage carryover in reservoirs from the previous year 10
and FERC license conditions. The changing meteorological conditions each 11
year and the ongoing changes in aquifer outflows result in a yearly variation 12
in the fuel supply that directly impacts the energy output each year.13
As FERC-jurisdictional hydro projects, many of PG&E’s projects have 14
recently completed relicensing efforts, where the operation of the project 15
must adhere to increasingly strict and complex license requirements that 16
seek to balance the many beneficial uses of the water resource. To respond 17
to these mandated demands on the water resources (such as stream flows 18
for fish, frogs and other species, recreation (including white water rafting), 19
consumptive water uses, and other purposes), some of the hydro fuel 20
bypasses the generating assets and is lost for the production of energy.21
PG&E’s hydro generating assets produced significant amounts of 22
electricity during the 2017 record period. The total generation for the 23
portfolio for the 2017 record year was 10,578 gigawatt-hours (GWh) of 24
energy, which is a 32 percent increase to the 2016 production of 8,016 GWh25
of energy. The main drivers for the energy increase include an increase in 26
statewide April 1 snowpack to 163 percent of average (in terms of water 27
content), from 86 percent of average in 2016,2 and an increase in 28
2 April 1 has historically been considered the time of peak snow accumulation in the season. Percentages are based on snow sensor data, with 94 stations reporting statewide.

2-25
precipitation to 187 percent of the 30-year average precipitation, from 1
114 percent in the 2016 water year.32
The generation production results for 2017 underscore the fact that data 3
for any single year should not be viewed alone, but rather should be 4
considered in light of the hydro-meteorological conditions during the year. 5
The biggest driver of generation in any given year is directly related to the 6
quality of the water year as well as the snowpack.7
2. Outages8
Consistent with previous Energy Resource Recovery Account 9
compliance proceedings, PG&E is providing general information regarding 10
scheduled outages that were 24 hours or more in duration, and specific 11
information regarding each forced outage that was longer than 24 hours in 12
duration, for facilities that are 25 MW or greater in size. PG&E has provided 13
additional, detailed information concerning the outages that occurred during 14
the record period to the Office of Ratepayer Advocates (ORA) in response to 15
ORA’s Master Data Request.16
One of the key industry metrics used to gauge the operating 17
performance of generating units is the Forced Outage Factor (FOF). FOF is 18
a ratio of the hours a unit is forced out of operation to the total hours in the 19
operation period (i.e., month, year). The high number of storm-related 20
forced outages related to extreme precipitation events in January and 21
February of 2017 raised the hydro portfolio 2017 FOF to 6.90 percent, worse 22
than the industry benchmark of 3.08 percent.4 Table 2-4 includes the hydro 23
portfolio FOF for the past five years compared to the latest industry 24
benchmark.5 Excluding storm-related outages, the hydro portfolio 25
2017 FOF was 1.86 percent, significantly better than the benchmark.26
3 Percentages are based on PG&E’s 15-station precipitation year index. A water year is designated by the calendar year in which it ends. The 2017 water year ran from July 1, 2016 to June 30, 2017. Previous years follow the same logic.
4 The industry benchmark is the 2012-2016 NERC GADS Generating Unit Statistical Brochure 4. The brochure and derivation of the forced outage benchmark is included in PG&E’s workpapers.
5 The combined hydro and fossil portfolio 2017 FOF was 5.38 percent, worse than the combined hydro and fossil industry benchmark of 2.77 percent. Excluding storm-related outages, the combined portfolio 2017 FOF was 1.55 percent, better than the industry benchmark.

2-26
TABLE 2-4HYDRO PORTFOLIO FORCED OUTAGE FACTOR
Line No. Year FOF (%)
BenchmarkFOF (%)
1 2010 2.082 2011 2.833 2012 9.764 2013 2.805 2014 1.446 2015 1.217 2016 1.368 2017 1.86(a) 3.08
_______________
(a) Excludes storm-related outages; FOF is 6.90 percent when including storm-related outages.
a. Scheduled Outages1
PG&E’s hydro portfolio had 101 scheduled outages 24 hours or 2
greater in duration during the record period. Of this total, 71 were 3
planned outages and 30 were maintenance outages.6 This is an 4
average of just under one scheduled outage per unit across the hydro 5
portfolio.6
b. Forced Outages7
PG&E devotes a great deal of attention to its equipment in its O&M 8
practices. Given that the average age of PG&E’s 106 unit hydro 9
portfolio is about 79 years, and 92 of the 106 units are older than 10
50 years (24 units are over 100 years old), it is to be expected that 11
PG&E, similar to any other generator, will experience some forced 12
outages of its hydro units. Some of these outages are related to 13
unanticipated equipment malfunctions while others are related to 14
external events such as lightning strikes, wildfire, storm-induced 15
transmission line interruptions, debris in the water, or even vandalism. 16
In addition, NERC logging requirements require that unit starts and 17
stops that accompany testing performed after a planned outage be 18
coded as individual forced outages.19
6 A description of the general nature and scope of planned outages and maintenance outages is provided in Section C.2.c. above.

2-27
During forced outages, one of PG&E’s primary goals is to bring the 1
unit back on line safely and expediently. Additionally, PG&E often 2
examines components associated with the specific equipment that 3
failed. This examination helps inform PG&E as to whether modifications 4
or repairs should be made to those components, either at the unit where 5
the outage occurred or at other units with similar components. While 6
this might extend the time before a unit is returned to service, it can 7
potentially avoid a future forced outage.8
During the record period, there were 85 forced outages with 9
durations longer than 24 hours occurring at 42 different units with a 10
powerhouse capacity of 25 MW or greater. The outages have been 11
grouped into those related to the January-February winter storms and 12
those that are unrelated to such storms. 13
1) January-February Winter Storm-Related Forced Outages14
The winter of 2016-17 was one of the wettest on record in 15
Northern California. As of March 2, 2017, the precipitation gauges16
located throughout PG&E-managed hydro territories averaged 17
221.3 percent of normal for that date. Snowpack, based on 18
98 reporting automated snow sensors, had water equivalent/content 19
readings of 183 percent of normal Statewide, 157 percent of normal 20
for the north Sierra, 190 percent of normal for the central Sierra, and 21
200 percent of normal for the southern Sierra.22
There were two periods during the winter when precipitation 23
intensities brought excessive amounts over short periods of time. 24
These included:25
1) January 4, 2017 – January 11, 2017: 24 inches compared to 26
the 4 inches precipitation historical average during the same 27
8-day period (PG&E hydro weighted precipitation at 28
15 representative stations).29
2) February 1, 2017 – February 10, 2017: 28 inches compared to 30
the 5 inches precipitation historical average during the same 31
10-day period (PG&E hydro weighted precipitation at 32
15 representative stations).33

2-28
The extreme precipitation events in the winter of 2016-2017 led 1
to high water flows, debris flows, and turbidity on a number of 2
PG&E’s river systems, resulting in numerous landslides, road 3
failures, and 58 forced outages with durations longer than 24 hours 4
at powerhouses with a capacity of 25 MW or greater. A detailed 5
description of these storm-related forced outages is included in 6
powerhouse alphabetical order below.7
a) Bucks Creek Powerhouse8
On January 9, 2017, at 9:10 a.m., Unit 2 was forced out of 9
service due to low bearing cooling water flows. Unit 1 was 10
forced out of service for the same reason at 10:22 a.m. The 11
bearing cooling water intake is covered by a screen to prevent 12
large material from being pumped into the system. Inside the 13
powerhouse, a strainer system removes any smaller material. 14
The strainer system is manually cleaned by PG&E operators. 15
This cooling water system was overwhelmed by the high 16
turbidity levels of the Feather River, resulting in debris building 17
up at the strainer faster than the operator could remove it. High 18
runoff from early January storms caused numerous upstream 19
landslides, significantly raising the turbidity level of the water. 20
PG&E cleaned the intake screen and strainers and returned 21
Unit 2 to service on January 10, 2017, at 3:33 p.m. Unit 1 was 22
returned to service at 8:56 p.m. on January 10, 2017.23
On January 10, 2017, at 8:59 p.m., Unit 2 was again forced 24
out of service due to low bearing cooling water flows. A PG&E 25
operator manually cleaned the cooling water strainers but the 26
strainers clogged again right away when the cooling water 27
system was restarted. Once the river flows receded around 28
January 15, the cooling water pit was exposed and PG&E 29
discovered that the cooling water pit was filled with sediment. 30
On January 17, a PG&E crew was onsite to remove sediment 31
from the cooling water pit and trough, clean sediment from the 32
cooling water pressure regulating valve, and flush the unit 33

2-29
bearing cooling water piping. PG&E completed these activities 1
on January 18, 2017, returning the unit to service at 4:52 p.m.2
On January 17, 2017, at 11:38 a.m., Unit 1 was forced out3
of service to clean the bearing cooling water system. A PG&E 4
crew was onsite to remove sediment from the cooling water pit 5
and trough, clean sediment from the cooling water pressure 6
regulating valve, and flush the unit bearing cooling water piping. 7
PG&E completed the activities on January 18, 2017, returning 8
the unit to service at 4:49 p.m.9
On February 7, 2017, at 10:46 a.m., Unit 1 was removed 10
from service due to low bearing cooling water flows caused by 11
the February storm event. Unit 2 was removed from service at 12
10:47 a.m. for the same reason. High flows in the North Fork 13
Feather River deposited significant sediment in the powerhouse 14
cooling water pit and trough. The sediment in the trough was 15
clogging the unit cooling water system. On February 12, the 16
river flows had receded and the pit and trough located in the 17
tailrace of the powerhouse became accessible. A PG&E crew 18
was onsite to remove sediment from the cooling water pit and 19
trough, clean sediment from the cooling water pressure 20
regulating valve, and flush the unit bearing cooling water piping. 21
PG&E completed these activities on February 15, 2017, 22
returning Unit 1 to service at 2:58 p.m. and Unit 2 to service 23
at 3:01 p.m.24
On February 17, 2017, at 1:01 a.m., Unit 2 tripped offline 25
due to an alarm at the penstock shutoff valve (PSV) that 26
indicated it was drifting to a closed position. The roving 27
operator reported the issue that day, but crews were not 28
dispatched to the valve house until the weather permitted on 29
February 22. Under normal conditions, this outage would be 30
expected to be resolved by the end of the working day. As a 31
result, PG&E separated the cause of the outage into two parts, 32
the first being due to the penstock shutoff valve and the second 33
due to storm conditions. The storm condition portion of the 34

2-30
outage is marked as having begun on February 17, 2017, at 1
5:30 p.m., at the end of the crew shift. PG&E was able to reach 2
the valve house on February 22, replace the PSV position 3
switches, and return the unit to service at 7:02 p.m.4
On February 20, 2017, at 7:14 a.m., Unit 1 tripped offline 5
due to an alarm at the PSV that indicated it was drifting to a 6
closed position. The roving operator reported the issue that 7
day, but crews were not dispatched to the valve house until the 8
weather permitted on February 22. Under normal conditions, 9
this outage would be expected to be resolved by the end of the 10
working day. As a result, PG&E separated the cause of the 11
outage into two parts, the first being due to the penstock shutoff 12
valve and the second due to storm conditions. The storm 13
condition portion of the outage is marked as having begun on 14
February 20, 2017, at 5:30 p.m., at the end of the crew shift. 15
PG&E was able to reach the valve house on February 22, 16
replace the PSV position switches, and return the unit to service 17
at 7:01 p.m.18
b) Butt Valley Powerhouse19
On January 8, 2017, at 12:43 p.m., the Butt Valley unit was 20
forced offline due to a fault on the 115 kV Caribou/Palermo 21
transmission line. Storm conditions had caused trees to make 22
contact with the line. The trees were cleared and the line was 23
restored to service. PG&E tested and returned the unit to 24
service on January 14, 2017 at 5:14 p.m.25
c) Caribou 1 Powerhouse 26
On January 8, 2017, at 5:15 p.m., Units 1 through 3 were 27
unavailable due to a trip in the 115 kV Caribou/Palermo 28
transmission line. Storm conditions had caused trees to make 29
contact with the line. The trees were cleared and the line was 30
restored to service. The units were all returned to service on 31
January 9, 2017 at 5:36 p.m.32

2-31
d) Caribou 2 Powerhouse 1
On January 8, 2017, at 5:15 p.m., Units 4 and 5 were 2
unavailable due to a trip in the 230 kV Caribou/Table Mountain 3
transmission line. Storm conditions had caused trees to make 4
contact with the line. The trees were cleared and the line was 5
restored to service. Unit 4 was returned to service on 6
January 13, 2017 at 7:02 a.m. and Unit 5 was returned to 7
service on January 13, 2017 at 9:04 a.m.8
e) Cresta Powerhouse9
On January 8, 2017, at 2:13 p.m., Units 1 and 2 were forced 10
out of service due to high flows caused by early January storms. 11
At the time, North Fork Feather River flows exceeded 12
30,000 cubic feet per second (cfs), as measured downstream of 13
Cresta Dam at NF-56. The units and dam were removed from 14
service to prevent damage to the facilities during high river 15
flows, consistent with the DeSabla Hydro Winter Storm16
procedure.7 The procedure requires that the powerhouse 17
facility be shut down if flows exceed 30,000 cfs at NF-56. 18
Following the receding of river flows, Unit 1 was returned to 19
service on January 13, 2017 at 11:05 a.m. and Unit 2 was 20
returned to service at 11:12 a.m. 21
On February 7, 2017, at 7:52 a.m., Units 1 and 2 were 22
removed from service due to high flows caused by early 23
February storms. At the time, North Fork Feather River flows 24
exceeded 30,000 cfs, as measured downstream of Cresta Dam 25
at NF-56. The units and dam were removed from service to 26
prevent damage to the facilities during high river flows, 27
consistent with the DeSabla Hydro Winter Storm procedure. 28
The procedure requires that the powerhouse facility be shut 29
down if flows exceed 30,000 cfs at NF-56. Following the 30
receding of river flows, Unit 1 was returned to service on 31
7 DeSabla Hydro Winter Storm Procedures 2016-2017 is provided in PG&E’s workpapers.

2-32
February 13, 2017 at 1:52 p.m. and Unit 2 was returned to 1
service at 1:54 p.m.2
f) Electra Powerhouse3
On January 8, 2017, at 7:21 p.m., Unit 1 was removed from 4
service due to high flows caused by early January storms. 5
Units 2 and 3 were removed from service at 7:25 p.m. for the 6
same reason. The units were shut down when the river 7
elevation exceeded the tailrace wall elevation to prevent high 8
river water levels from flooding the galleries. Following the 9
receding of the water, PG&E found the tailrace was filled with 10
sediment that needed to be removed prior to return to service.11
PG&E removed the sediment and returned Unit 1 to service on 12
January 23, 2017 at 4:18 p.m., returned Unit 2 to service at 13
4:27 p.m., and returned Unit 3 to service at 4:35 p.m.14
g) James B. Black Powerhouse15
On February 6, 2017, at 6:10 p.m., Unit 1 tripped offline due 16
to a transmission line outage. At 6:17 p.m., the transmission 17
line was restored to service, but the unit remained offline. High 18
runoff from the early February storms caused landslides on both 19
of the access roads to the powerhouse, preventing PG&E 20
operators from accessing the powerhouse and returning the unit 21
to service. The landslides prevented access to the powerhouse 22
until February 10. PG&E operators returned the unit to service 23
on February 10, 2017 at 10:36 a.m.24
h) Kerckhoff 1 Powerhouse25
On February 7, 2017, at 5:24 p.m., Units 1 and 3 were 26
removed from service due to high flows caused by early 27
February storms. The units were removed from service to 28
prevent damage to the facilities during high river flows, 29
consistent with the San Joaquin Watershed Common Operating 30
2-33
Guideline.8 Following the receding of river flows, the units were 1
brought online on February 13, 2017 at 12 p.m.2
On February 19, 2017, at 6:36 p.m., Units 1 and 3 were 3
removed from service due to low bearing cooling water flows. 4
Cooling water provided via the penstock contained significant 5
amounts of debris due to the February storms, which constantly 6
clogged the cooling water strainer. As a result, PG&E operators 7
were not able to keep up with cleaning the strainers. Following 8
abatement of storm conditions, Unit 1 was returned to service 9
on February 24, 2017 at 12:15 p.m. and Unit 3 was returned to 10
service at 12:33 p.m.11
i) Kerckhoff 2 Powerhouse12
On January 10, 2017, at 3:56 p.m., Unit 1 was removed 13
from service due to low bearing cooling water flows. Cooling14
water provided via the penstock contained significant amounts 15
of debris due to the January storms, which constantly clogged 16
the cooling water strainer. As a result, PG&E operators were 17
not able to keep up with cleaning the strainers. Following 18
abatement of storm conditions, the units were brought online the 19
next day at 4:08 p.m.20
On February 7, 2017, at 4:13 p.m., Unit 1 was removed 21
from service due to high flows caused by the early February 22
storms. The unit was removed from service to prevent damage 23
to the facilities during high river flows, consistent with the San 24
Joaquin Watershed Common Operating Guideline. Following 25
the receding of river flows, the unit was brought online on 26
February 13, 2017 at 1:08 p.m.27
j) Pit 5 Powerhouse28
The early January and February weather events caused 29
extremely high water in the Pit River watershed that resulted in 30
numerous landslides, road failures, and inundation of the Pit 531
8 San Joaquin Watershed Common Operating Guideline is provided in PG&E’s workpapers.

2-34
Powerhouse. These conditions caused a number of forced 1
outages on the powerhouses located in the Pit River, which are 2
described below.3
On January 18, 2017, at 7:09 p.m., Units 3 and 4 were 4
forced out of service due to an elevated reading on the neutral 5
overvoltage relay. The neutral overvoltage relay detects a 6
ground fault on a generator and is part of the stator ground fault 7
protection scheme. Upon detection of a ground fault, the relay 8
activates the 86E lockout relay, tripping the units to prevent any 9
electrical damage. 10
An ice dam had formed on the roof of the powerhouse due 11
to heavy snow. During the early January storms, high runoff led 12
to high water levels which overtopped the roof, causing water to 13
leak into the common bus duct works and eventually trip the 14
units offline. PG&E removed the ice dam and replaced the 15
cracked insulators on the copper bus penetration through the 16
wall. Unit 3 was returned to service on January 28, 2017 at 17
7:14 p.m. Unit 4 was returned to service on January 30, 2017 at 18
5:24 p.m.19
On February 4, 2017, Pit 5 Powerhouse was ordered to be 20
evacuated due to numerous landslides both above and below 21
the access road, caused by high runoff from early February 22
storms. The Pit 5 operators were relocated to the Pit 323
Switching Center, where a backup operating system had been 24
installed to allow remote control and monitoring of the various 25
powerhouses and facilities under the Pit 5 Switching Center’s26
jurisdiction. The Pit 5 access road became impassable on 27
February 5 due to multiple landslides. The four units at Pit 528
Powerhouse remained operational at the time of the evacuation.29
On February 6, 2017, at 7:34 p.m., Unit 1 was forced out of 30
service due to low bearing cooling water flows. The bearing 31
cooling water intake is located in the tailrace sump for the unit. 32
A screen around the pump intake prevents large material from 33
being pumped into the system. Inside the powerhouse, a 34

2-35
strainer system removes any smaller material. This cooling 1
water system was overwhelmed by the high turbidity levels of 2
the Pit River. High runoff from the February storms caused 3
numerous upstream landslides, raising the turbidity level of the 4
water. The unit was out of service when the Pit 5 powerhouse 5
flooded on February 9, as described below.6
On February 9, 2017 at 12:19 p.m., 12:29 p.m., and 7
12:34 p.m. respectively, Units 2, 3 and 4 were forced out of 8
service due to powerhouse flooding. Unit 1 was already out of 9
service, as explained above. The flooding occurred due to 10
record-setting precipitation.11
At its peak on February 9, the atmospheric river event912
reached 5.19 inches of precipitation in 24 hours. River flows 13
exceeded 36,000 cfs, as measured at gauging station PH-27, 14
causing significant accumulation of gravel debris at and 15
downstream of the powerhouse and resulting in increased river 16
elevations at the powerhouse. The river elevation at Pit 517
Powerhouse is estimated to have reached an all-time high 18
elevation of 1457.3 feet, reaching to near the ceiling level of the 19
basement. For reference, the historical maximum recorded 20
flood elevation at the powerhouse had been 1442 feet.21
PG&E completed an Apparent Cause Evaluation (ACE) of 22
the Pit 5 powerhouse flooding in October 2017.10 Per the 23
powerhouse engineering design drawing,11 flows were 24
expected to have to reach about 75,000 cfs for the tailrace 25
9 Per the National Oceanic and Atmospheric Administration (NOAA), “atmospheric rivers are relatively long, narrow regions in the atmosphere—like rivers in the sky—that transport most of the water vapor outside of the tropics. When atmospheric rivers make landfall, they often release this water vapor in the form of rain or snow. Those that contain the largest amounts of water vapor and the strongest winds can create extremerainfall and floods, often by stalling over watersheds vulnerable to flooding. On average, about 30-50% of annual precipitation in the west coast states occurs in just a few atmospheric river events.” (http://www.noaa.gov/stories/what-are-atmospheric-rivers).
10 Pit 5 Storm Damage ACE is provided in PG&E’s workpapers.11 Attachment 8 to the Pit 5 Storm Damage ACE contains an image of the original drawing
print of the powerhouse cross section featuring elevations and design water levels.

2-36
water level to rise to 1457.3 feet. However, the massive volume 1
of debris carried by the river accumulated in the tailrace section, 2
which significantly raised tailrace water levels above the design 3
levels for a given flow rate.12 The powerhouse has multiple 4
potential sources of water intrusion at elevation 1453.4 feet, via 5
multiple basement floor penetrations that are open and vent to 6
the atmosphere, as well as the #3 ejector piping discharge line. 7
When the river level exceeded this elevation on its way to a 8
maximum elevation of 1457.3 feet, the powerhouse began 9
flooding.10
The corrective actions detailed in the Pit 5 Storm Damage 11
ACE include:12
Complete dredging project to mitigate debris accumulation 13
at Pit 5 powerhouse.14
Evaluate other hydro facilities to identify where a similar 15
event could occur.16
Complete repairs to Pit 5 access roads to include larger 17
diameter culverts.18
Perform an engineering evaluation on the building 19
penetration leakage and structure seepage. This should 20
include an evaluation of the basement floor penetrations 21
and their intended purpose and if the current elevation of 22
the piping is appropriate for expected external water levels. 23
This should also include an evaluation of the leakage 24
around the penstock and other bulkhead penetrations.25
Perform an engineering evaluation on ejector system design 26
criteria and whether this system should have additional 27
engineering controls such as a check valve to mitigate 28
backflow potential.29
Evaluate hydro facilities with similar system configurations 30
with piping open to the tailrace and no backflow restriction, 31
12 Attachment 3 to the Pit 5 Storm Damage ACE contains a photograph showing the large volume of material deposited in the tailrace area.

2-37
and whether the systems should have additional 1
engineering controls such as a check valve to mitigate 2
backflow potential.3
Restoration of the powerhouse required major efforts in 4
road clearing and rebuilding, tailrace dredging and clearing out 5
the mud and debris that accumulated inside the flooded 6
powerhouse.7
The geology above the powerhouse and along the 8
seven miles of access road from Big Bend Road to the 9
powerhouse has historically been susceptible to landslides due 10
to the colluvium makeup. Snow accumulation from 11
January 2017 storms combined with historic rainfall caused 12
accelerated snow melt and led to multiple landslides as well as 13
road washouts on the Pit 5 Powerhouse and Pit 5 Valve House 14
Roads. Several locations along the roads failed, preventing 15
access to the Pit 5 Powerhouse, Pit 5 Valve House and 16
James B. Black Powerhouse. As a first step, PG&E removed 17
debris, and cleared and reestablished ditches and drainage 18
improvements to allow construction crews to safely access the 19
road sites and begin road reconstruction work. Road 20
reconstruction included construction of slope stability 21
improvements such as rock slope protection, mechanically 22
stabilized earth, and concrete or soldier pile walls depending on 23
location. PG&E replaced washed out culvert crossings for 24
drainages and creek crossings, and restored a section of slope 25
that had failed between the surge chamber access road and 26
valve house access road.27
In addition to the material deposited in the tailrace by the 28
storm, the extended powerhouse outage also led to additional 29
material build-up throughout the spring as higher flows 30
continued to deposit material that would normally be transported 31
downriver if the powerhouse units were online. PG&E 32
estimated that over 100,000 cubic yards of material needed to 33
be dredged, starting from the tailrace, and extending 34

2-38
approximately 1,000 feet downstream of the powerhouse. The 1
additional material needed to be dredged to allow for unit 2
operation. Material also needed to be removed from the stoplog 3
gates and draft tubes before unit operation could be restored.4
PG&E initiated powerhouse restoration efforts by pumping 5
out the water in the powerhouse, cleaning the station and 6
disposing of all contaminated material. About 800 gallons of oil 7
was stored at or below the flooded sub-basement and basement 8
levels of the powerhouse. The flooding damaged the turbine 9
shut-off valve control panels, cooling water control panels, 10
elevated neutral transformers, and station distribution and 11
lighting. PG&E replaced all of that equipment and refurbished 12
the turbine pit mechanical assemblies. In the turbine pit are all 13
the wicket gate assemblies, the top of the head cover and the 14
turbine guide bearing. The turbine guide bearing and lubrication 15
systems were dismantled, purged, flushed and inspected. All of 16
the mechanical assemblies that operate the wicket gates were 17
dismantled to allow the upper wicket bushings to be removed, 18
cleaned, inspected, and re-installed. Various bolts, studs and 19
nuts on the gate assemblies, head covers, draft tubes and gland 20
rings were all cleaned and greased to mitigate corrosion. Any 21
packing exposed to flood waters and contaminated sediment 22
was replaced to mitigate scoring of any rotating or sliding shafts.23
Unit 1 was returned to service on October 5, 2017 at 24
9:41 p.m. Unit 2 was returned to service on November 4, 2017 25
at 2:49 p.m. Unit 3 was returned to service on December 13, 26
2017 at 5:27 p.m. Unit 4 remained on forced outage at the end 27
of the Reporting Period and was returned to service on 28
January 5, 2018 at 4:25 p.m.29
On November 10, 2017, at 8:31 a.m., Unit 2 was forced out 30
of service as part of flood restoration efforts to restore damage 31
caused by the January and February 2017 storms. The unit 32
was forced out of service to allow divers to enter the tailrace to 33
clear debris and seal stop log gates in the Unit 3 draft tube. 34

2-39
Following completion of this activity, Unit 2 was returned to 1
service on November 12, 2017 at 4:40 p.m.2
k) Pit 6 Powerhouse3
On February 10, 2017, at 10:36 a.m., Units 1 and 2 were 4
forced out of service due to concerns about excessive5
storm-related woody debris accumulating at the powerhouse. 6
On January 8, the Pit 6 access road was heavily damaged 7
by a landslide. Access to the facility was limited to foot access 8
around the slide area. During the January and February storms, 9
the powerhouse had to be manned 24/7 to keep the bearing 10
cooling water intake screens clean. During the early February 11
storms, numerous landslides occurred on the Pit River upstream 12
of Pit 6 Powerhouse. These landslides caused numerous whole 13
trees to enter the river and collect at the log boom at the Pit 614
forebay. The log boom eventually failed on February 9 due to 15
the pressure applied by the trees. PG&E evacuated the 16
operator from Pit 6, forced the units out of service, and fully 17
opened the spillway gates to pass the trees downstream without 18
clogging the spillway. 19
Following water level abatement, Unit 2 was returned to 20
service on February 25, 2017 at 4:52 a.m. While attempting to 21
return Unit 1 to service in late February, PG&E discovered a 22
broken shear pin on one of the wicket gates. The wicket gates 23
control the flow of water to the turbine. Each wicket gate is 24
hinged using a shear pin that is designed to shear or break to 25
prevent damage if there is woody debris caught in the wicket 26
gate while it is closed. PG&E replaced the shear pin and 27
returned Unit 1 to service on March 2, 2017 at 6:14 p.m.28
On February 25, 2017, at 11:55 a.m., following an outage 29
on the 12-kV overhead line leading to transformer bank 3, Unit 230
was separated from the grid. The line outage was caused by a 31
tree falling on the line due to storm conditions. Unit 2 is set to 32
automatically black start and auto-parallel to the system if the 33
12-kV line fails. After the 12-kV line failed and Unit 2 started, it 34

2-40
was separated from the 230-kV transmission line to provide 1
power in-house until the 12-kV overhead line was returned to 2
service. PG&E’s electrical operations returned the overhead 3
line to service and Unit 2 was returned to service on February 4
27, 2017 at 10:50 a.m.5
l) Pit 7 Powerhouse6
On February 10, 2017, at 11:06 a.m., Unit 1 was forced out 7
of service due to concerns about excessive storm-related woody 8
debris accumulating at the powerhouse. Unit 2 was forced out 9
at 11:09 a.m. for the same reason. Similar to Pit 6, numerous 10
landslides occurred on the Pit River upstream of the Pit 711
Powerhouse during the early February storm. These landslides 12
caused numerous whole trees to enter the river and collect at 13
the log boom at the Pit 6 forebay. As described above, the Pit 614
log boom eventually failed on February 9 due to the pressure 15
applied by the trees. The Pit 7 log boom also failed due to the 16
pressure applied by the trees. PG&E forced the Pit 7 units out 17
of service, and fully opened the spillway gates to pass the trees 18
downstream without clogging the spillway. Following water level 19
abatement, Unit 2 was returned to service on February 28, 2017 20
at 11:40 a.m. Unit 1 was returned to service on March 1, 2017 21
at 6:05 p.m.22
m) Poe Powerhouse23
On January 8, 2017, at 3:50 p.m., Unit 1 was removed from 24
service due to high flows caused by the early January storms. 25
Unit 2 was removed from service at 3:52 p.m. for the same 26
reason. At the time, North Fork Feather River flows exceeded 27
45,000 cfs, as measured downstream of Poe Dam at NF-23. 28
The units and dam were removed from service to prevent 29
damage to the facilities during high river flows, consistent with 30
the DeSabla Hydro Winter Storm procedure. The procedure 31
requires that the powerhouse facility be shut down if flows 32
exceed 45,000 cfs at NF-23. Following the receding of river 33

2-41
flows, Unit 1 was returned to service on January 15, 2017 at 1
9:48 a.m. and Unit 2 was returned to service at 9:53 a.m.2
On February 7, 2017, at 7:40 a.m., Unit 1 was removed 3
from service due to high flows caused by the early February 4
storms. Unit 2 was removed from service at 7:42 a.m. for the 5
same reason. At the time, North Fork Feather River flows 6
exceeded 45,000 cfs, as measured downstream of Poe Dam at 7
NF-23. The units and dam were removed from service to 8
prevent damage to the facilities during high river flows, 9
consistent with the DeSabla Hydro Winter Storm procedure.10
The procedure requires that the powerhouse facility be shut 11
down if flows exceed 45,000 cfs at NF-23. Following the 12
receding of river flows, Unit 1 was returned to service on 13
February 18, 2017 at 8:40 a.m. and Unit 2 was returned to 14
service at 8:44 a.m.15
On February 21, 2017, at 12:33 a.m., Unit 2 was removed 16
from service due to low bearing cooling water flows. Unit 1 was 17
removed from service at 12:36 a.m. for the same reason. The 18
bearing cooling water intake is covered by a screen to prevent 19
large material from being pumped into the system. Inside the 20
powerhouse, a strainer system removes any smaller material. 21
For Poe, the strainer system includes both auto strainer and 22
manual strainer lines. The auto strainers feature backflush 23
valves designed to keep the line from plugging with debris.24
Both lines were overwhelmed by the high turbidity levels of the 25
Feather River, resulting in debris building up at the strainer 26
faster than the system could remove it. On February 24, the 27
flows had receded in the river and the debris in the water had 28
reduced to the point where the cooling water strainers could 29
reliably clean the water for the bearing cooling system. Unit 130
was returned to service on February 24, 2017 at 10:27 a.m. and 31
Unit 2 was returned to service at 10:31 a.m.32

2-42
n) Rock Creek Powerhouse1
On January 8, 2017, at 5:55 p.m., Unit 1 was removed from 2
service due to high flows caused by early January storms. 3
Unit 2 was removed from service at 5:58 p.m. for the same 4
reason. At the time, North Fork Feather River flows exceeded 5
30,000 cfs, as measured downstream of Rock Creek Dam at 6
NF-57. The units and dam were removed from service to 7
prevent damage to the facilities during high river flows, 8
consistent with the DeSabla Hydro Winter Storm procedure.9
The procedure requires that the powerhouse facility be shut 10
down if flows exceed 30,000 cfs at NF-57. Following the 11
receding of river flows, Unit 1 was returned to service on 12
January 12, 2017 at 6:59 p.m. and Unit 2 was returned to 13
service at 7:19 p.m.14
On February 7, 2017, at 9:02 a.m., Unit 1 was removed 15
from service due to high flows caused by early February storms. 16
Unit 2 was removed from service at 9:04 p.m. for the same 17
reason. At the time, North Fork Feather River flows exceeded 18
30,000 cfs, as measured downstream of Rock Creek Dam at 19
NF-57. The units and dam were removed from service to 20
prevent damage to the facilities during high river flows, 21
consistent with the DeSabla Hydro Winter Storm procedure. 22
The procedure requires that the powerhouse facility be shut 23
down if flows exceed 30,000 cfs at NF-57. Following the 24
receding of river flows, Unit 1 was returned to service on25
February 13, 2017 at 11:29 a.m. and Unit 2 was returned to 26
service at 7:02 p.m.27
o) Salt Springs Powerhouse28
On February 8, 2017, at 6:29 p.m., Units 1 and 2 were 29
removed from service at the request of PG&E’s transmission 30
line of business. A transmission tower on the 115-kV line 31
slipped on its foundation due to a mudslide related to the 32
February storm events. PG&E repaired the tower and Unit 133

2-43
was returned to service on February 11, 2017 at 3:37 p.m. 1
Unit 2 was returned to service at 3:40 p.m. the same day.2
p) Stanislaus Powerhouse3
On January 5, 2017, at 6:00 a.m., Unit 1 was removed from 4
service due to low bearing cooling water flows. The bearing 5
cooling water intake is covered by a screen to prevent large 6
material from being pumped into the system. Inside the 7
powerhouse, a strainer system removes any smaller material. 8
The strainer system is manually cleaned by PG&E operators. 9
This cooling water system was overwhelmed by the high 10
turbidity levels of the Stanislaus River, resulting in debris 11
building up at the strainer faster than the operator could remove 12
it. High runoff from early January storms caused numerous 13
upstream landslides, raising the turbidity level of the water. 14
PG&E cleaned the intake screen and strainers and returned the 15
unit to service on January 9, 2017 at 10:34 a.m.16
On January 9, 2017, at 3:11 p.m., Unit 1 was removed from 17
service due to low bearing cooling water flows. High runoff from 18
early January storms caused numerous upstream landslides, 19
raising the turbidity level of the water. PG&E cleaned the intake 20
screen and strainers and returned the unit to service on 21
January 13, 2017 at 9:56 a.m.22
On February 20, 2017, at 9:44 a.m., Unit 1 was removed 23
from service due to low bearing cooling water flows. High runoff 24
from February storms caused numerous upstream landslides, 25
raising the turbidity level of the water. PG&E cleaned the intake 26
screen and strainers and returned the unit to service on 27
February 22, 2017 at 1:48 p.m.28
On February 23, 2017, at 10:04 a.m., Unit 1 was removed 29
from service due to low bearing cooling water flows. High runoff 30
from February storms caused numerous upstream landslides, 31
raising the turbidity level of the water. PG&E cleaned the intake 32
screen and strainers and returned the unit to service on 33
February 27, 2017 at 10:47 a.m.34

2-44
q) Tiger Creek Powerhouse1
On February 7, 2017, at 10:39 a.m., Unit 2 was removed 2
from service due to a large mudslide occurring in the forebay 3
canal during the early February storms. Access to the 4
powerhouse was restricted because the powerhouse and5
afterbay dam access roads were damaged by landslides and 6
overflows of the drainage facilities during the same February 7
storms. The storms also damaged 300 feet of canal foundation. 8
Both road repair work and canal repair work were required in 9
order to return the unit to service. 10
Road repair work included upper slope excavation (move 11
roadway inward), lower slope excavation (remove and replace 12
saturated road subbase), installation of rock rip-rap revetment 13
on the shoulder of the road, and installation of gabion walls 14
where more suitable. Various sites required removal and 15
replacement of asphalt concrete (pavement) surface. Canal 16
repair work included removal of mudslide debris, drainage 17
improvements, installation of a reinforced concrete retaining wall 18
and slope erosion control measures including rock revetments. 19
The unit was returned to service on April 10, 2017 at 9:25 a.m.20
On February 13, 2017, at 9:40 a.m., Unit 1 was removed 21
from service to allow repair of the forebay canal. Between 22
February 7, when Unit 2 was removed from service, and 23
February 13, partial canal flow was available and deemed 24
necessary to allow debris to be transported downstream. The 25
flow was routed through Unit 1 during this time period. 26
Following partial repair of the canal, Unit 2 was returned to 27
operation, again utilizing partial canal flow. Unit 1 remained out 28
of service for the duration of the canal repair work because the 29
canal could not support the flow required to operate both units. 30
When the canal restoration work was completed, Unit 1 was 31
returned to service on June 1, 2017 at 9:25 a.m.32

2-45
2) Forced Outages Unrelated to the January-February Winter 1
Storms2
A detailed description of the 27 forced outages not related to the 3
January and February winter storms is included in powerhouse 4
alphabetical order below.5
a) Balch 1 Powerhouse6
On March 14, 2017, at 4 p.m., Unit 1 was removed from 7
service following a routine generator brush rigging cleaning, 8
where PG&E discovered one of the bearing slinger rings was 9
wedged and could not be rotated before unit startup. Further 10
investigation revealed a damaged slinger ring. The slinger ring 11
is used to provide bearing lubrication by rotating freely on the 12
shaft to “sling” oil to the top of a horizontal bearing in a 13
non-pressurized oil system. The damaged ring was removed 14
from service and an on-hand spare was installed. The unit was 15
returned to service the next day at 8:38 p.m.16
b) Butt Valley Powerhouse17
On July 15, 2017, at 7:56 p.m., the Butt Valley unit went 18
from 36 MW load to 0 MW load without a corresponding 19
command to change load. PG&E placed the unit under manual 20
control and attempted to raise and lower the load, but the unit 21
was unresponsive. The unit tripped offline at 8:23 p.m. due to 22
an elevated reading on the neutral over/under voltage relay. 23
PG&E investigated and found a burned coil at the governor 24
complete shutdown solenoid, which helps control wicket gate 25
operation. PG&E replaced the coil and associated wiring, and 26
tested the solenoid, wicket gate operations and SCADA 27
commands. The unit was returned to service on July 19, 2017 28
at 7:53 p.m.29
On August 7, 2017, at 7:28 a.m., the Butt Valley unit tripped 30
offline. PG&E investigated and found a damaged oil spill 31
prevention (OSP) pump gear box. While the unit was tripping 32
offline, the exciter breaker also malfunctioned, remaining in a 33

2-46
partial closed/open position. PG&E replaced the OSP pump 1
gear box, cleaned the exciter breaker linkage, and tested and 2
returned the unit to service on August 9, 2017 at 1:02 a.m.3
c) Caribou 1 Powerhouse 4
On January 10, 2017, at 9:59 a.m., Unit 2 was forced out of 5
service due to the needle “A” deflector being in-stream at full 6
load. PG&E found that the needle "A" deflector position DigiPID7
control module in the governor had failed. The DigiPID is a 8
digital proportional integral derivative controller utilized to control 9
the position of the deflector. PG&E repaired the DigiPID control 10
module, and tested and returned the unit to service on 11
January 13, 2017 at 12:28 p.m.12
On July 27, 2017, at 9:40 a.m., Unit 1 experienced governor 13
issues and was forced out of service. The governor oil pumps 14
were cycling on and off with high oil pressure spikes due to low 15
nitrogen levels. PG&E added nitrogen to the pumps to stabilize 16
the pressure. PG&E tested and returned the unit to service the 17
next day at 3:36 p.m.18
On July 30, 2017, at 6:04 p.m., Unit 3 was forced out of 19
service due to the needle “B” deflector not responding. PG&E 20
found that the needle "B" deflector position DigiPID control 21
module in the governor had failed. PG&E repaired the DigiPID 22
control module, and tested and returned the unit to service the 23
next day at 6:35 p.m.24
On October 11, 2017, at 4:10 a.m., Unit 1 tripped offline due 25
to low cooling water pressure. A PG&E investigation revealed 26
broken nitrogen lines in the cooling water pressure regulator. 27
PG&E replaced the lines and returned the unit to service on 28
October 16, 2017 at 2 p.m.29
On November 5, 2017, at 10:33 p.m., Unit 2 tripped offline 30
due to transmission issues on the 500-kV line. The unit was 31
returned to service the next day at 10:34 p.m.32

2-47
d) Drum 1 Powerhouse1
On January 19, 2017, at 3:24 p.m., Unit 3 was removed 2
from service due to governor trouble. While attempting to adjust 3
load on the unit, the DC control breaker to the governor needles 4
control tripped open and no load control to the unit was 5
available. PG&E inspected the governor and found that the 6
upstream needle control motor had failed. PG&E removed, 7
re-wound, replaced and tested the motor. The unit was 8
returned to service on January 22, 2017 at 10:51 a.m. 9
On May 4, 2017 at 2:00 p.m., Units 3 and 4 were removed 10
from service following the discovery of several leaks on the 11
common #2 penstock during a routine inspection. The leaks 12
were located on a dead-end section of penstock that formerly 13
connected common penstocks #1 and #2 in an old 14
configuration. The “new” configuration dates back to around 15
1927. The dead-ends are capped with steel spherical heads. 16
These heads corroded over time, eventually leaking where 17
sufficient deterioration had occurred. The penstock was drained 18
and cleared for further inspection and repair. The preparation 19
for repair included installing temporary access into the building 20
housing the dead-end sections, pumping down some standing 21
water, and cleaning the outside surface of the spherical heads. 22
The repair included welding metal plates into place over the 23
leaks. Following repair, the penstock was filled and Drum 124
Units 3 and 4 were returned to service on May 25, 2017 at 25
3:04 p.m.26
On May 6, 2017 at 2:30 p.m., Units 1 and 2 were removed 27
from service as a precautionary measure following the discovery 28
of leaks on the common #2 penstock servicing Drum Units 329
and 4. PG&E expanded the scope of inspection to include the 30
common #1 penstock. Leaks similar to those discovered in the31
common #2 penstock were also found in the common #1 32
penstock, which were again due to deterioration in the steel 33
spherical heads. The penstock was drained, cleared, inspected 34

2-48
and repaired. Following repair, the penstock was filled and 1
Drum 1 Units 1 and 2 were returned to service on May 26, 2017 2
at 6:49 p.m.3
On May 28, 2017 at 8:44 a.m., Unit 1 tripped offline due to a 4
blown leather packing seal on the downstream needle valve. 5
The leather seal allows the ball joint to articulate during 6
movement of the needle valve. PG&E replaced the blown 7
leather seal and the Unit was returned to service on May 31, 8
2017 at 2:29 p.m.9
On September 8, 2017, at 9:28 p.m., Unit 3 tripped offline 10
due to high exciter temperature readings. PG&E investigated 11
and discovered that the cooling fan inside the exciter cabinet 12
had failed. PG&E replaced the fan and returned the unit to 13
service on September 11, 2017 at 11:43 a.m.14
e) Electra Powerhouse15
On August 8, 2017, at 11:47 p.m., Unit 3 was forced offline 16
because of governor trouble. PG&E operators were unable to 17
control the load output of the unit and took the unit offline to 18
investigate. A detailed inspection revealed that the pistons that 19
port oil to the governor were clogged. PG&E cleaned the 20
pistons and returned the unit to service on August 10, 2017 at 21
1:01 p.m.22
f) Haas Powerhouse23
On September 7, 2017, at 10:49 a.m., Unit 1 experienced 24
an out of sync event and tripped offline. The unit was 25
scheduled for an annual exercise with PG&E electric operations, 26
whereby the unit is separated from the grid and switched to 27
carry local load for the 70kV Woodchuck line. This is done 28
annually to test circuit breaker 212, the high voltage breaker for 29
the powerhouse. During the exercise, the circuit breaker was 30
closed but the unit was out of phase, or sync, with the local area 31
system and tripped offline to protect the generator. 32

2-49
Upon investigation, PG&E determined that the unit was out 1
of phase with the substation due to incorrect wiring. During a 2
previous planned outage, PG&E had installed new 3
auto-synchroscope devices, which help PG&E monitor the 4
degree to which the unit generator and the power system are 5
synchronized with each other. The wiring at the unit was 6
updated based on substation drawings that were later found to 7
be incorrect. The auto-synchroscope devices were 8
disconnected from the generator. Rewiring of the devices is 9
scheduled to be completed and tested during the next 10
planned outage.11
The remainder of the outage consisted of testing the unit to 12
ensure proper functionality when it was returned to service. 13
PG&E completed this testing and returned the unit to service the 14
next day at 7:36 p.m.15
g) Helms Powerhouse16
On March 21, 2017, at 11:15 p.m., Helms Unit 1 was 17
removed from service. PG&E inspectors found a leak in the 18
Unit 1 west side six-inch equalizing line. The equalizing line is 19
located inside the headcover, which is a confined space 20
requiring a permit for entry. PG&E had spare parts onsite and 21
completed repair welding of the pipe. The unit was returned to 22
service on March 24, 2017 at 1:35 a.m. PG&E completed an 23
ACE Report of the equalizing line failure.1324
h) Kerckhoff 1 Powerhouse 25
On May 7, 2017, at 1:27 p.m., Units 1 and 3 were forced out 26
of service. The station service switchgear tripped in the open 27
position and could not be reliably reset by the operator. PG&E 28
cleaned and repaired the breaker. Unit 3 was returned to 29
service the next day at 3:49 p.m. and Unit 1 was returned to 30
service at 3:55 p.m.31
13 2017 Helms Unit 1 Equalizing Line Failure ACE is provided in the PG&E workpapers.

2-50
On December 4, 2017, at 9:48 a.m., Unit 3 was forced out 1
of service due to a water leak in the cooling water supply line. 2
The line failed due to corrosion. PG&E replaced the failed 3
section of pipe and returned the unit to service the next day at 4
10:03 a.m.5
i) Pit 1 Powerhouse 6
On March 23, 2017, at 7 p.m., Unit 2 was unable to return to 7
service following a scheduled generator and turbine inspection 8
due to erratic vibration measurements. Starting in January, 9
PG&E had observed erratic vibrations and monitored the unit 10
until a scheduled shutdown on March 10. At that time, PG&E 11
determined that the vibrations were electrically influenced; when 12
a field was applied the vibration increased and when it was 13
removed the vibration significantly decreased. PG&E scheduled 14
another outage for March 23, with a visual inspection of the 15
stator core leading to the decision to keep the unit out of service 16
until approved for operation. PG&E brought in Applied 17
Technology Services (ATS) and an outside contractor to inspect 18
the unit and monitor it with precision equipment. The unit was 19
inspected and placed back into service for ATS to record certain 20
operating parameters. The vibration was not as erratic and the 21
unit was released back to service with all monitoring equipment 22
still in place. The unit returned to service on March 31, 2017 at 23
11:45 a.m. A planned outage was scheduled for October 2017 24
and was still in progress at the end of the 2017 record period. 25
The stator core will be rewound and repaired, resolving the 26
vibration issue.27
j) Pit 4 Powerhouse28
On May 19, 2017, at 3:37 p.m., Unit 2 was unable to return 29
to service during initial testing following conclusion of a turbine 30
overhaul project. During testing, the lower guide bearing 31
temperature was observed to be rising faster than the other 32
bearings. Once the predetermined temperature limit was 33

2-51
reached, the unit was shut down. PG&E examined the lower 1
guide bearing and discovered that it had failed, or “wiped,” 2
coming into direct contact with the shaft journal. PG&E 3
investigated and determined that the bearing wipe was caused 4
by a shift in the turbine headcover extension, and thus, the 5
turbine shaft alignment with the lower guide bearing, due to 6
insufficient constraint by headcover extension bolts. The bolts 7
were replaced with fit bolts. The new bolts provide additional 8
constraint due to their interference fit with the headcover and 9
headcover extension. Also, the headcover extension was put 10
back into alignment and the lower guide bearing was replaced.11
Additional issues with the turbine shutoff valve closure caused12
by a faulty pressure switch; turbine guide bearing work due to 13
anticipated heat issues; and a faulty mercury switch, delayed 14
the unit’s return to service until September 7, 2017, at 15
11:25 a.m. An independent root cause evaluation is being 16
performed by ABS Consulting for the outage. It is unavailable at 17
the time of this testimony submittal but is expected to be 18
complete shortly thereafter.19
On November 8, 2017, at 7 p.m., Unit 1 was unable to 20
return to service following maintenance work on the governor 21
pilot valve due to a collapsed governor accumulator float. When 22
attempting to return the unit to service PG&E discovered that 23
the governor oil pump clapper valve was not operating correctly. 24
The governor accumulator was then drained and PG&E 25
discovered that the clapper valve oil level accumulator float had 26
collapsed. PG&E replaced the governor accumulator float and 27
returned the unit to service the next day at 7:01 p.m.28
k) Pit 6 Powerhouse 29
On August 21, 2017, at 10:09 p.m., Unit 1 tripped offline due 30
to a fault at the main transformer. Upon inspection, PG&E 31
determined that the transformer had failed beyond repair. 32
PG&E ordered a temporary replacement transformer to allow 33
the plant to continue operating while a permanent transformer 34

2-52
was designed, fabricated, delivered and installed, a process that 1
takes approximately two years. PG&E installed the replacement 2
transformer and returned the unit to service on November 8, 3
2017 at 8:15 p.m. PG&E initiated a failure inspection of the 4
transformer. The contractor’s report is included in PG&E’s 5
workpapers.14 The contractor’s report states that the failure 6
was most likely due to the advanced age of the transformer.7
l) Poe Powerhouse 8
On May 17, 2017, at 8:10 p.m., Unit 2 was forced out of 9
service due to a catastrophic failure of a rotor fan blade. The 10
rotor fan blades are required to provide cooling to the generator 11
and auxiliary parts. The rivets that join fan blade number 21 to 12
the mounting bracket failed while in service. Failure of the rivets 13
on the fan blade resulted in significant damage to the generator 14
stator and field windings. The fault currents caused by the 15
failure also caused damage to the bearing babbitt material. 16
PG&E completed an ACE report of the outage.15 The 17
evaluation revealed that the cause of the failure was vibration 18
induced by air vortices bouncing between the top plate of the 19
fan shroud and the fan blades. The air vortices were introduced 20
from air passing across the 3/4 inch abandoned CO2 piping 21
located inside the fan shroud. More details on the air vortices 22
are provided in the ACE. Recommendations listed in the ACE 23
will extend to units with fan blades that are the same design as 24
those used at Poe Powerhouse Unit 2.25
Due to the findings of the ACE, the fan shroud was returned 26
to its original state. All piping and mounting brackets were 27
removed and all windows that were cut into the shroud were 28
welded shut. The top fan blades were replaced, the bearings 29
were replaced, two field poles were refurbished, six stator coils 30
14 Field Service Report – Pit 6 Powerhouse Unit 1 Failure Inspection is provided in PG&E’s workpapers.
15 Poe Powerhouse Fan Blade Failure ACE is provided in PG&E’s workpapers.

2-53
were beyond repair and removed from the circuit. Following 1
completion of testing, the unit was returned to service on 2
August 10, 2017 at 11:25 p.m.3
m) Salt Springs Powerhouse4
On June 9, 2017, at 2:38 p.m., Unit 2 was removed from 5
service due to arcing generator brushes found during a routine 6
inspection. A PG&E brush rigging specialist was contacted to 7
investigate the cause. On June 14, the brush rigging specialist 8
examined the unit, replacing and adjusting the brushes as 9
needed. The unit was returned to service on June 14, 2017 at 10
11:46 a.m.11
E. Conclusion12
In compliance with D.14-01-011, this chapter addresses the operation of 13
PG&E’s utility-owned hydroelectric facilities, and outages that occurred at these 14
facilities during the 2017 record year. It demonstrates that PG&E's utility-owned 15
hydroelectric portfolio was operated in a reasonable manner during the 16
record period.17
PG&E has a comprehensive management structure, with numerous internal 18
controls, to prudently oversee the operation of a large, geographically dispersed, 19
and complex hydro system. Scheduled outages were planned sufficiently in 20
advance to allow adequate preparation time and were efficiently executed to 21
assure prompt return to service.22
PG&E’s hydro resources were operated in a reasonable manner as 23
demonstrated by the 2017 record year FOF results being better than the industry 24
average when excluding the January and February storm-related outages.25
PG&E acted reasonably in resolving forced outages in a timely manner.26
PACIFIC GAS AND ELECTRIC COMPANY
CHAPTER 2
ATTACHMENT A
PG&E POWERHOUSES AND GENERATING UNITS

PACIFIC GAS AND ELECTRIC COMPANYCHAPTER 2
UTILITY OWNED GENERATION: HYDROELECTRICAttachment A Table of Hydro Generating Units at 2017 End of Year
LineNo. Powerhouse Name and Unit Basic type and /
or configuration Management Area Specific physical location Capacity Date in
service1 ALTA POWERHOUSE UNIT #1 Conv Hydro Central Alta, CA 1.0 11/7/19022 BALCH PH 1 UNIT 1 Conv Hydro Kings Crane Valley Balch Camp, CA 34.0 2/20/19273 BALCH PH 2 UNIT 2 Conv Hydro Kings Crane Valley Balch Camp, CA 52.5 11/26/19584 BALCH PH 2 UNIT 3 Conv Hydro Kings Crane Valley Balch Camp, CA 52.5 11/26/19585 BELDEN POWERHOUSE Conv Hydro DeSabla Belden, CA 125.0 9/14/19696 BUCKS CREEK PH UNIT #1 Conv Hydro DeSabla Storrie, CA 33.0 3/4/19287 BUCKS CREEK PH UNIT #2 Conv Hydro DeSabla Storrie, CA 32.0 3/4/19288 BUTT VALLEY POWERHOUSE Conv Hydro DeSabla Belden, CA 41.0 12/31/19589 CARIBOU #1 POWERHOUSE UNIT #1 Conv Hydro DeSabla Belden, CA 25.0 5/6/1921
10 CARIBOU #1 POWERHOUSE UNIT #2 Conv Hydro DeSabla Belden, CA 25.0 5/6/192111 CARIBOU #1 POWERHOUSE UNIT #3 Conv Hydro DeSabla Belden, CA 25.0 5/6/192112 CARIBOU #2 POWERHOUSE UNIT #4 Conv Hydro DeSabla Belden, CA 60.0 11/9/195813 CARIBOU #2 POWERHOUSE UNIT #5 Conv Hydro DeSabla Belden, CA 60.0 11/9/195814 CENTERVILLE PH UNIT NO.1 Conv Hydro DeSabla Chico, CA 5.5 5/1/190015 CENTERVILLE PH UNIT NO.2 Conv Hydro DeSabla Chico, CA 0.9 5/1/190016 CHILI BAR POWERHOUSE UNIT #1 Conv Hydro Central Placerville, CA 7.0 3/22/196517 COLEMAN PH UNIT NO.1 Conv Hydro Shasta Anderson, CA 13.0 6/19/197918 COW CREEK PH UNIT NO.1 Conv Hydro Shasta Millville, CA 0.9 1/1/190719 COW CREEK PH UNIT NO.2 Conv Hydro Shasta Millville, CA 0.9 1/1/190720 CRANE VALLEY PH UNIT 1 Conv Hydro Kings Crane Valley North Fork, CA 0.9 7/4/191921 CRESTA POWERHOUSE UNIT #1 Conv Hydro DeSabla Storrie, CA 35.0 11/23/194922 CRESTA POWERHOUSE UNIT #2 Conv Hydro DeSabla Storrie, CA 35.0 1/15/195023 DE SABLA PH UNIT NO.1 Conv Hydro DeSabla Magalia, CA 18.5 2/28/196324 DEER CREEK PH UNIT #1 Conv Hydro Central Nevada City, CA 5.7 5/6/190825 DRUM POWERHOUSE #1, UNIT #1 Conv Hydro Central Alta, CA 13.2 11/26/191326 DRUM POWERHOUSE #1, UNIT #2 Conv Hydro Central Alta, CA 13.2 11/26/191327 DRUM POWERHOUSE #1, UNIT #3 Conv Hydro Central Alta, CA 13.1 11/26/191328 DRUM POWERHOUSE #1, UNIT #4 Conv Hydro Central Alta, CA 14.5 11/26/191329 DRUM POWERHOUSE #2, UNIT #5 Conv Hydro Central Alta, CA 49.5 12/18/196530 DUTCH FLAT POWERHOUSE UNIT #1 Conv Hydro Central Alta, CA 22.0 3/29/194331 ELECTRA POWERHOUSE UNIT #1 Conv Hydro Central Jackson, CA 31.0 6/29/194832 ELECTRA POWERHOUSE UNIT #2 Conv Hydro Central Jackson, CA 31.0 6/29/194833 ELECTRA POWERHOUSE UNIT #3 Conv Hydro Central Jackson, CA 36.0 6/29/194834 HAAS PH UNIT 1 Conv Hydro Kings Crane Valley Balch Camp, CA 72.0 12/23/195835 HAAS PH UNIT 2 Conv Hydro Kings Crane Valley Balch Camp, CA 72.0 12/23/195836 HALSEY POWERHOUSE UNIT #1 Conv Hydro Central Auburn, CA 11.0 12/6/191637 HAMILTON BRANCH PH UNIT #1 Conv Hydro DeSabla Penninsula Village, CA 2.4 1/1/192138 HAMILTON BRANCH PH UNIT #2 Conv Hydro DeSabla Penninsula Village, CA 2.4 1/2/192139 HAT CREEK PH 1 UNIT 1 Conv Hydro Shasta Burney, CA 8.5 8/22/192140 HAT CREEK PH 2 UNIT 1 Conv Hydro Shasta Burney, CA 8.5 9/28/192141 HELMS POWERHOUSE UNIT 1 Pumped Storage Helms Shaver Lake, CA 404.0 6/30/198442 HELMS POWERHOUSE UNIT 2 Pumped Storage Helms Shaver Lake, CA 404.0 6/30/198443 HELMS POWERHOUSE UNIT 3 Pumped Storage Helms Shaver Lake, CA 404.0 6/30/198444 INSKIP PH UNIT NO.1 Conv Hydro Shasta Manton, CA 8.0 10/9/197945 JAMES B. BLACK PH UNIT #1 Conv Hydro Shasta Big Bend, CA 86.0 2/17/196646 JAMES B. BLACK PH UNIT #2 Conv Hydro Shasta Big Bend, CA 86.0 12/17/196547 KERCKHOFF PH 1 UNIT 1 Conv Hydro Kings Crane Valley Auberry, CA 12.6 8/6/192048 KERCKHOFF PH 1 UNIT 3 Conv Hydro Kings Crane Valley Auberry, CA 12.8 8/6/192049 KERCKHOFF PH 2 UNIT 1 Conv Hydro Kings Crane Valley Auberry, CA 155.0 5/6/198350 KERN CANYON PH UNIT 1 Conv Hydro Kings Crane Valley Bakersfield, CA 11.5 8/8/192151 KILARC PH UNIT NO.1 Conv Hydro Shasta Whitmore, CA 1.6 10/1/190352 KILARC PH UNIT NO.2 Conv Hydro Shasta Whitmore, CA 1.6 5/2/190453 KINGS RIVER PH UNIT 1 Conv Hydro Kings Crane Valley Balch Camp, CA 52.0 3/7/1962
2-AtchA-1

PACIFIC GAS AND ELECTRIC COMPANYCHAPTER 2
UTILITY OWNED GENERATION: HYDROELECTRICAttachment A Table of Hydro Generating Units at 2017 End of Year
LineNo. Powerhouse Name and Unit Basic type and /
or configuration Management Area Specific physical location Capacity Date in
service54 LIME SADDLE PH UNIT NO.1 Conv Hydro DeSabla Oroville, CA 1.0 8/1/190655 LIME SADDLE PH UNIT NO.2 Conv Hydro DeSabla Oroville, CA 1.0 8/1/190656 NARROWS POWERHOUSE #1 UNIT #1 Conv Hydro Central Grass Valley, CA 12.0 12/29/194257 NEWCASTLE POWERHOUSE UNIT #1 Conv Hydro Central Auburn, CA 11.5 10/28/198658 OAK FLAT POWERHOUSE UNIT #1 Conv Hydro DeSabla Belden, CA 1.3 11/2/198559 PHOENIX POWERHOUSE UNIT #1 Conv Hydro Central Sonora, CA 2.0 2/20/194060 PIT PH 1 UNIT 1 Conv Hydro Shasta Burney, CA 30.5 2/28/192261 PIT PH 1 UNIT 2 Conv Hydro Shasta Burney, CA 30.5 2/28/192262 PIT PH 3 UNIT 1 Conv Hydro Shasta Burney, CA 23.3 7/15/192563 PIT PH 3 UNIT 2 Conv Hydro Shasta Burney, CA 23.3 7/15/192564 PIT PH 3 UNIT 3 Conv Hydro Shasta Burney, CA 23.4 7/15/192565 PIT PH 4 UNIT 1 Conv Hydro Shasta Big Bend, CA 47.5 10/1/195566 PIT PH 4 UNIT 2 Conv Hydro Shasta Big Bend, CA 47.5 10/1/195567 PIT PH 5 UNIT 1 Conv Hydro Shasta Big Bend, CA 40.0 4/29/194468 PIT PH 5 UNIT 2 Conv Hydro Shasta Big Bend, CA 40.0 4/29/194469 PIT PH 5 UNIT 3 Conv Hydro Shasta Big Bend, CA 40.0 4/29/194470 PIT PH 5 UNIT 4 Conv Hydro Shasta Big Bend, CA 40.0 4/29/194471 PIT PH 6 UNIT 1 Conv Hydro Shasta Montgomery Creek, CA 40.0 8/14/196572 PIT PH 6 UNIT 2 Conv Hydro Shasta Montgomery Creek, CA 40.0 8/14/196573 PIT PH 7 UNIT 1 Conv Hydro Shasta Montgomery Creek, CA 56.0 9/10/196574 PIT PH 7 UNIT 2 Conv Hydro Shasta Montgomery Creek, CA 56.0 9/10/196575 POE POWERHOUSE UNIT #1 Conv Hydro DeSabla Storrie, CA 60.0 10/26/195876 POE POWERHOUSE UNIT #2 Conv Hydro DeSabla Storrie, CA 60.0 10/26/195877 POTTER VALLEY UNIT 1 Conv Hydro DeSabla Potter Valley, CA 4.5 4/1/190878 POTTER VALLEY UNIT 3 Conv Hydro DeSabla Potter Valley, CA 2.0 4/1/190879 POTTER VALLEY UNIT 4 Conv Hydro DeSabla Potter Valley, CA 2.7 4/1/190880 ROCK CREEK POWERHOUSE UNIT #1 Conv Hydro DeSabla Storrie, CA 63.0 3/1/195081 ROCK CREEK POWERHOUSE UNIT #2 Conv Hydro DeSabla Storrie, CA 63.0 3/16/195082 SALT SPRINGS PH UNIT #1 Conv Hydro Central Pioneer, CA 11.0 6/15/193183 SALT SPRINGS PH UNIT #2 Conv Hydro Central Pioneer, CA 33.0 4/24/195384 SAN JOAQUIN 1A PH UNIT 1 Conv Hydro Kings Crane Valley North Fork, CA 0.4 3/12/191985 SAN JOAQUIN 2 PH UNIT 1 Conv Hydro Kings Crane Valley North Fork, CA 3.2 9/29/191786 SAN JOAQUIN 3 PH UNIT 1 Conv Hydro Kings Crane Valley North Fork, CA 4.2 8/17/192387 SOUTH PH UNIT NO.1 Conv Hydro Shasta Manton, CA 7.0 12/8/197988 SPAULDING PH #1, UNIT #1 Conv Hydro Central Emigrant Gap, CA 7.0 5/8/192889 SPAULDING PH #2, UNIT #1 Conv Hydro Central Emigrant Gap, CA 4.4 7/16/192890 SPAULDING PH #3, UNIT #1 Conv Hydro Central Emigrant Gap, CA 5.8 2/21/192991 SPRING GAP POWERHOUSE UNIT #1 Conv Hydro Central Long Barn, CA 7.0 9/16/192192 STANISLAUS POWERHOUSE UNIT #1 Conv Hydro Central Vallecito, CA 91.0 3/11/196393 TIGER CREEK PH UNIT #1 Conv Hydro Central Pioneer, CA 29.0 8/1/193194 TIGER CREEK PH UNIT #2 Conv Hydro Central Pioneer, CA 29.0 8/1/193195 TOADTOWN PH UNIT NO.1 Conv Hydro DeSabla Mogalia, CA 1.5 4/22/198696 TULE RIVER PH UNIT 1 Conv Hydro Kings Crane Valley Springville, CA 3.2 1/21/191497 TULE RIVER PH UNIT 2 Conv Hydro Kings Crane Valley Springville, CA 3.2 1/21/191498 VOLTA 1 PH UNIT NO.1 Conv Hydro Shasta Manton, CA 9.0 4/4/198099 VOLTA 2 PH UNIT NO.2 Conv Hydro Shasta Manton, CA 0.9 10/30/1981
100 WEST POINT PH UNIT #1 Conv Hydro Central Pioneer, CA 14.5 11/21/1948101 WISE POWERHOUSE #1, UNIT #1 Conv Hydro Central Auburn, CA 14.0 3/4/1917102 WISE POWERHOUSE #2, UNIT #1 Conv Hydro Central Auburn, CA 3.2 12/12/1986103 WISHON PH 1 UNIT 1 Conv Hydro Kings Crane Valley North Fork, CA 5.0 9/20/1910104 WISHON PH 1 UNIT 2 Conv Hydro Kings Crane Valley North Fork, CA 5.0 9/20/1910105 WISHON PH 1 UNIT 3 Conv Hydro Kings Crane Valley North Fork, CA 5.0 9/20/1910106 WISHON PH 1 UNIT 4 Conv Hydro Kings Crane Valley North Fork, CA 5.0 9/20/1910
3,892.2
2-AtchA-2

PACIFIC GAS AND ELECTRIC COMPANY
CHAPTER 3
UTILITY-OWNED GENERATION: FOSSIL AND OTHER
GENERATION

3-i
PACIFIC GAS AND ELECTRIC COMPANY CHAPTER 3
UTILITY-OWNED GENERATION: FOSSIL AND OTHER GENERATION
TABLE OF CONTENTS
A. Introduction ....................................................................................................... 3-1
1. Fossil-Fuel Generating Stations ................................................................. 3-2
a. Gateway Generating Station ................................................................ 3-2
b. Colusa Generating Station ................................................................... 3-2
c. Humboldt Bay Generating Station ....................................................... 3-3
2. Fuel Cell Facilities ...................................................................................... 3-3
a. CSU East Bay Fuel Cell Facility .......................................................... 3-3
b. SFSU Fuel Cell Facility ........................................................................ 3-3
3. Solar Stations ............................................................................................. 3-4
a. Vaca Dixon Solar Station ..................................................................... 3-4
b. Westside Solar Station ........................................................................ 3-4
c. Stroud Solar Station ............................................................................ 3-4
d. Five Points Solar Station ..................................................................... 3-5
e. Huron Solar Station ............................................................................. 3-5
f. Cantua Solar Station ........................................................................... 3-5
g. Giffen Solar Station ............................................................................. 3-5
h. Gates Solar Station ............................................................................. 3-6
i. West Gates Solar Station .................................................................... 3-6
j. Guernsey Solar Station........................................................................ 3-6
B. Fossil and Solar Operations and Maintenance Organization ............................ 3-6
C. Internal Controls ............................................................................................... 3-8
1. Guidance Documents................................................................................. 3-9
2. Operations Reviews ................................................................................. 3-10
3. Incident Reporting Process ...................................................................... 3-10

PACIFIC GAS AND ELECTRIC COMPANY
CHAPTER 3 UTILITY-OWNED GENERATION: FOSSIL AND OTHER GENERATION
TABLE OF CONTENTS
(CONTINUED)
3-ii
4. Corrective Action Program ....................................................................... 3-10
5. Outage Planning and Scheduling Processes ........................................... 3-11
a. Planning and Scoping ........................................................................ 3-12
b. Scheduling ......................................................................................... 3-12
c. Outage Execution .............................................................................. 3-13
6. Design Change Process .......................................................................... 3-14
D. Operational Results ........................................................................................ 3-14
1. Energy Production ................................................................................... 3-14
2. Outages ................................................................................................... 3-16
a. Gateway Generating Station .............................................................. 3-17
1) Scheduled Outages ..................................................................... 3-17
2) Forced Outages .......................................................................... 3-18
b. Colusa Generating Station ................................................................. 3-18
1) Scheduled Outages ..................................................................... 3-18
2) Forced Outages .......................................................................... 3-18
c. Humboldt Bay Generating Station ..................................................... 3-19
1) Scheduled Outages ..................................................................... 3-19
2) Forced Outages .......................................................................... 3-19
E. Conclusion ...................................................................................................... 3-23

3-1
PACIFIC GAS AND ELECTRIC COMPANY 1
CHAPTER 3 2
UTILITY-OWNED GENERATION: FOSSIL AND OTHER 3
GENERATION 4
A. Introduction 5
In compliance with Decision (D.) 14-01-011, this chapter addresses the 6
operation of Pacific Gas and Electric Company’s (PG&E) utility-owned 7
fossil-fuel, fuel cell, and photovoltaic (PV) facilities during the 2017 record year. 8
PG&E’s utility-owned fossil-fuel, fuel cell, and PV portfolio was operated in a 9
reasonable manner during the record period. During the record period, PG&E 10
owned, operated and maintained three fossil-fuel generating stations, two fuel 11
cell facilities, and 10 ground-mounted PV solar stations.1 12
The three fossil-fuel generating stations are Gateway Generating Station 13
(Gateway), Colusa Generating Station (Colusa), and Humboldt Bay Generating 14
Station (Humboldt). Gateway entered commercial operations in January 2009. 15
Humboldt entered commercial operations in September 2010, followed by 16
Colusa in December 2010. These three generating facilities have a combined 17
maximum normal operating capacity of 1,400 megawatts (MW). 18
PG&E’s small fuel cell facilities are the California State University (CSU) 19
East Bay Fuel Cell Facility and the San Francisco State University (SFSU) Fuel 20
Cell Facility. The fuel cells were in service periodically throughout the record 21
period. These fuel cells were installed pursuant to PG&E’s application to install 22
fuel cells on state-owned property approved in D.10-04-028. 23
The 10 ground-mounted PV generating stations are Vaca Dixon, Westside, 24
Stroud, Five Points, Huron, Cantua, Giffen, Gates, West Gates, and Guernsey 25
Solar Stations. These facilities were built as part of the utility-owned generation 26
(UOG) portion of PG&E’s 5-year solar PV Program approved in D.10-04-052. 27
All of PG&E’s solar stations entered into commercial operations prior to the 28
record period. 29
1 PG&E also owns three small PV facilities in San Francisco that entered commercial
operations in 2007. Because these facilities total less than 300 kilowatts (kW), PG&E has not addressed them in this testimony.
3-2
1. Fossil-Fuel Generating Stations 1
a. Gateway Generating Station 2
Gateway is a 530 MW combined cycle power plant consisting of 3
two General Electric (GE) Frame 7FA combustion turbine 4
(CT)-generators, each with its own Vogt-NEM heat recovery steam 5
generator (HRSG), and a single GE steam turbine (ST)-generator. In 6
this standard 2 × 1 configuration, each CT generates power and 7
exhausts directly into its own HRSG where the exhaust heat is captured 8
and generates steam for use in the ST. The exhaust steam leaves the 9
turbine and is condensed for reuse in an air-cooled condenser. Air 10
emissions are controlled through the use of Dry Low Nitrogen Oxide 11
(NOx) combustion coupled with Selective Catalytic Reduction (SCR) 12
systems. For each HRSG, two catalyst systems are used to reduce 13
NOx, carbon monoxide (CO), and Volatile Organic Compound (VOC) 14
production. Additionally, Gateway is equipped with a capacity 15
enhancing technology to improve output during peak generation periods. 16
Duct burners are used to increase steam production in the HRSGs 17
resulting in increased ST output. The duct burners allow Gateway to 18
increase its output by approximately 50 MW above the 530 MW nominal 19
capacity. 20
b. Colusa Generating Station 21
Colusa is a 530 MW combined cycle power plant consisting of 22
two GE Frame 7FA CTs, each with its own HRSG, and a single GE ST. 23
In this standard 2 × 1 configuration, each CT generates power and 24
exhausts directly into its own HRSG where the exhaust heat is captured 25
and generates steam for use in the ST. The exhaust steam leaves the 26
turbine and is condensed for reuse in an air-cooled condenser. Air 27
emissions are controlled through the use of Dry Low NOx combustion 28
coupled with SCR systems. For each HRSG, two catalyst systems are 29
used to reduce NOx, CO and VOC production. Additionally, Colusa is 30
equipped with a capacity enhancing technology to improve output during 31
peak generation periods. Duct burners are used to increase steam 32
production in the HRSGs resulting in increased ST output. The duct 33

3-3
burners allow Colusa to increase its output by approximately 127 MW 1
above the 530 MW nominal capacity. 2
c. Humboldt Bay Generating Station 3
Humboldt is a 163 MW reciprocating engine power plant consisting 4
of 10 Wartsila 18V50 DF natural gas-fired reciprocating engines. Each 5
engine has 18 cylinders, each with a bore of 50 centimeters, and 6
operates at 514 revolutions per minute. Each engine is designed to run 7
on natural gas with 1 percent of total fuel input provided by low sulfur 8
distillate as the pilot fuel. The engines are also designed to run on low 9
sulfur distillate or biodiesel. Each engine is equipped with a separate 10
independent closed loop cooling system. Emission control is 11
accomplished through the use of SCR. Similar to Gateway and Colusa, 12
two catalyst systems are used to reduce NOx, CO, and VOC production. 13
2. Fuel Cell Facilities 14
a. CSU East Bay Fuel Cell Facility 15
The CSU East Bay Fuel Cell facility is a 1.4 MW facility located on 16
the campus of CSU East Bay in Hayward, California. There is one fuel 17
cell at this facility. This fuel cell uses Molten Carbonate Fuel Cell 18
(MCFC) technology and was manufactured by FuelCell Energy (FCE). 19
This facility provides electricity to PG&E’s electrical grid and waste heat 20
for the university’s use. 21
A fuel cell is an electrochemical conversion process that produces 22
electricity from fuel and an oxidant, which react in the presence of an 23
electrolyte. Molten carbonate is used as the electrolyte in a MCFC. The 24
MCFC technology reforms hydrogen from natural gas to power the fuel 25
cell. Within the MCFC stack, an electrochemical reaction occurs 26
between the hydrogen (the fuel) and oxygen (the oxidant) to generate 27
Direct Current (DC) electricity, heat and water. The DC electricity is 28
converted by an inverter into Alternate Current (AC) for supplying the 29
PG&E electrical grid. 30
b. SFSU Fuel Cell Facility 31
The SFSU Fuel Cell facility is a 1.6 MW facility located on the 32
campus of SFSU in San Francisco, California. There are two fuel cells 33

3-4
at this facility. The first fuel cell, like CSU East Bay, is rated at 1.4 MW, 1
uses MCFC technology, and was manufactured by FCE. This fuel cell 2
provides electricity to PG&E’s electrical grid and also provides waste 3
heat for the university’s use. The second fuel cell is rated at 200 kW, 4
uses Solid Oxide Fuel Cell (SOFC) technology, and was manufactured 5
by Bloom Energy. The Bloom fuel cell provides electricity to PG&E’s 6
electrical grid. 7
The SOFC technology converts natural gas into a hydrogen rich gas 8
and then, using silica as the electrolyte, induces an electrochemical 9
reaction between the hydrogen (the fuel) and oxygen (the oxidant) to 10
generate DC electricity. The DC electricity is fed to an inverter, which 11
converts the DC power to AC for supplying the PG&E electrical grid. 12
The SOFC utilizes the heat that is generated internally to improve 13
electric efficiency. 14
3. Solar Stations 15
a. Vaca Dixon Solar Station 16
Vaca Dixon is a 2 MW PV solar station located in Vacaville, 17
California, on a 16-acre site. The solar station includes 9,672 solar 18
modules that provide DC energy; five inverters that convert the DC 19
energy to AC; one transformer that increases the voltage from 20
480 volts (V) to 12.47 kilovolts (kV); and other equipment such as a 21
communications enclosure, two weather stations, and electrical 22
switchgear. 23
b. Westside Solar Station 24
Westside is a 15 MW PV solar station located near Five Points, 25
California, on a 200-acre site. The solar station includes over 26
66,000 solar modules that provide DC energy; 30 inverters that convert 27
the DC energy to AC; 15 transformers that increase the voltage from 28
440 V to 12.47 kV; and other equipment such as a communications 29
enclosure, two weather stations, and electrical switchgear. 30
c. Stroud Solar Station 31
Stroud is a 20 MW PV solar station located near Helm, California, 32
on a 201-acre site. The solar station includes 88,000 solar modules that 33

3-5
provide DC energy; 40 inverters that convert the DC energy to AC; 1
20 transformers that increase the voltage from 440 V to 12.47 kV; and 2
other equipment such as a communications enclosure, two weather 3
stations, and electrical switchgear. 4
d. Five Points Solar Station 5
Five Points is a 15 MW PV solar station located near Five Points, 6
California, on a 162-acre site. The solar station includes over 7
75,000 solar modules that provide DC energy; 24 inverters that convert 8
the DC energy to AC; 12 transformers that increase the voltage from 9
320 V to 12.47 kV; and other equipment such as a communications 10
enclosure, two weather stations, and electrical switchgear. 11
e. Huron Solar Station 12
Huron is a 20 MW PV solar station located near Huron, California, 13
on a 145-acre site. The solar station includes over 90,000 solar 14
modules that provide DC energy; 40 inverters that convert the DC 15
energy to AC; 10 transformers that increase the voltage from 420 V to 16
12.47 kV; and other equipment such as a communications enclosure, 17
two weather stations, and electrical switchgear. 18
f. Cantua Solar Station 19
Cantua is a 20 MW PV solar station located near Cantua Creek, 20
California, on a 171-acre site. The solar station includes approximately 21
110,000 solar modules that provide DC energy; 32 inverters that convert 22
the DC energy to AC; 16 transformers that increase the voltage from 23
320 V to 12.47 kV; and other equipment such as a communications 24
enclosure, two weather stations, and electrical switchgear. 25
g. Giffen Solar Station 26
Giffen is a 10 MW PV solar station located near Cantua Creek, 27
California, on a 97-acre site. The solar station includes close to 28
55,000 solar modules that provide DC energy; 16 inverters that convert 29
the DC energy to AC; 8 transformers that increase the voltage from 30
320 V to 12.47 kV; and other equipment such as a communications 31
enclosure, two weather stations, and electrical switchgear. 32

3-6
h. Gates Solar Station 1
Gates is a 20 MW PV solar station located on a 120-acre site, 2
adjacent to the Huron Solar Station near Huron, California. The solar 3
station includes 91,490 solar modules that provide DC energy; 4
28 inverters that convert the DC energy to AC; 31 transformers that 5
increase the voltage from 420 V to 12.47 kV; and other equipment such 6
as a communications enclosure, two weather stations, and electrical 7
switchgear. 8
i. West Gates Solar Station 9
West Gates is a 10 MW PV solar station located on a 60-acre site, 10
near Huron, California. The solar station includes over 45,752 solar 11
modules that provide DC energy; 14 inverters that convert the DC 12
energy to AC; 14 transformers that increase the voltage from 420 V to 13
12.47 kV; and other equipment such as a communications enclosure, 14
two weather stations, and electrical switchgear. 15
j. Guernsey Solar Station 16
Guernsey is a 20 MW PV solar station located on a 120-acre site, 17
near Hanford, California. The solar station includes 89,400 solar 18
modules that provide DC energy; 20 inverters that convert the DC 19
energy to AC; 27 transformers that increase the voltage from 420 V to 20
12.47 kV; and other equipment such as a communications enclosure, 21
two weather stations, and electrical switchgear. Guernsey also includes 22
single axis trackers that move the solar modules to optimize their 23
position with the sun. 24
B. Fossil and Solar Operations and Maintenance Organization 25
The Fossil and Solar Operations and Maintenance (O&M) organization is 26
responsible for managing PG&E’s fossil, solar PV and fuel cell generating assets 27
to provide safe, reliable, cost-effective and environmentally responsible 28
generation. Most of the fossil portion of the O&M organization is located at the 29
three generating stations. Most of the PV and fuel cell portion of the 30
organization is located at two separate locations—Antioch and Caruthers. The 31
remainder of the fossil, solar PV and fuel cell O&M staff is headquartered in 32
San Francisco. 33

3-7
PG&E’s Safety, Quality and Standards (SQS) organization provides direct 1
support to the Fossil and Solar O&M organization for the safe, reliable, 2
compliant, efficient operation of PG&E’s fossil generating units. O&M 3
Specialists in the SQS organization act as consultants to the Fossil and Solar 4
O&M organization, offering expertise in methods and procedures to help assure 5
compliance with operating and maintenance standards. 6
PG&E’s Environmental Services organization also provides direct support to 7
the Fossil and Solar O&M organization, with a focus on regulatory compliance. 8
Environmental consultants are located at each of the fossil-fuel generating 9
stations and at or near the PV and fuel cell facilities and support the facility staff. 10
PG&E utilizes contract services for much of its major maintenance work at 11
its fossil-fuel generating stations and PV and fuel cell facilities. For Gateway 12
and Colusa, Long-Term Service Agreements (LTSA)2 for the CTs and STs are 13
provided by GE, the Original Equipment Manufacturer (OEM) for the CTs and 14
STs. Also, PG&E has entered into O&M agreements with the fuel cells’ OEMs. 15
PG&E is committed to providing safe utility service to its customers. As part 16
of this commitment, PG&E reviews its operations, including operation of its fossil 17
and other generation facilities, to identify and mitigate, to the extent possible, 18
potential safety risks to the public, PG&E’s workforce and its contractors. As it 19
operates and maintains its fossil and other generation facilities, PG&E follows its 20
internal controls to ensure public, workplace, and contractor safety. For 21
example, PG&E’s Employee Code of Conduct describes the safety of the public, 22
employees and contractors as PG&E’s highest priority. PG&E’s commitment to 23
a safety-first culture is reinforced with its Safety Principles, PG&E’s Safety 24
Commitment, Personal Safety Commitment and Keys to Life. These tools were 25
developed in collaboration with PG&E employees, leaders, and union leadership 26
and are intended to provide clarity and support as employees strive to take 27
personal ownership of safety at PG&E. Additionally, PG&E seeks all applicable 28
regulatory approvals from governmental authorities with jurisdiction to enforce 29
laws related to worker health and safety, impacts to the environment, and public 30
health and welfare. 31
2 LTSAs are also known as Contractual Services Agreements.

3-8
As part of PG&E’s Safety Commitment, PG&E follows recognized best 1
practices in the industry. PG&E operates each of its generation facilities in 2
compliance with all local, state and federal permit and operating requirements 3
such as state and federal Occupational Safety and Health Administration 4
requirements and the California Public Utilities Commission’s (CPUC) General 5
Order (GO) 167. As discussed below, PG&E does this by using internal controls 6
to help manage the O&M of its generation facilities. 7
With regard to employee safety, Power Generation employees develop a 8
safety action plan each year. This action plan focuses on various items such as 9
training and qualifications, contractor safety, human performance, approaches to 10
reduce or eliminate recordable injuries and motor vehicle incidents, approaches 11
to sharing safety best practices, and actions to improve the safety culture of the 12
organization. 13
With regard to public safety, PG&E continues to develop and implement a 14
comprehensive public safety program that includes public education, outreach 15
and partnership with key agencies, and enhanced emergency response 16
preparedness, training, drills and coordination with emergency response 17
organizations. 18
Fundamental to a strong safety culture is a leadership team that believes 19
every job can be performed safely and seeks to eliminate barriers to safe 20
operations. Equally important is the establishment of an empowered grass roots 21
safety team that can act to encourage safe work practices among peers. Power 22
Generation’s grass roots team is led by bargaining unit employees from across 23
the organization who work to include safety best practices in all the work they 24
do. These employees are closest to the day-to-day work of providing safe, 25
reliable, and affordable energy for PG&E’s customers and are best positioned to 26
implement changes that can improve safety performance. 27
C. Internal Controls 28
GO 167 sets forth standards that govern the O&M of power plants. The 29
purpose of GO 167 is “to implement and enforce standards for the maintenance 30
and operation of electric generating facilities and power plants so as to maintain 31
and protect the public health and safety of California residents and businesses, 32
to ensure that electric generating facilities are effectively and appropriately 33
maintained and efficiently operated, and to ensure electrical service reliability 34

3-9
and adequacy.”3 The standards set forth in GO 167 include operation 1
standards, maintenance standards, and logbook standards. PG&E 2
accomplishes compliance with GO 167 through the use of various internal 3
controls, and through audits by the CPUC. GO 167 was set in place post energy 4
crisis by the CPUC as a way to enforce prudent practices in the availability of the 5
fossil fleet for California. 6
Internal controls are a means by which an organization’s resources are 7
directed, monitored, and measured. PG&E defines internal controls as a 8
process or set of processes that take into consideration an organization’s 9
structure, work and authority flows, people and management information 10
systems and are designed to help the organization accomplish specific goals or 11
objectives. 12
PG&E has many internal controls in place to manage the O&M of its 13
generation assets. These controls include: (1) guidance documents; 14
(2) operations reviews; (3) an incident reporting process; (4) a corrective action 15
program; (5) an outage planning and scheduling process; and (6) a design 16
change process. Each of these controls is discussed below. 17
1. Guidance Documents 18
The guidance documents applicable to PG&E’s fossil and solar 19
operations include PG&E Policy, PG&E Utility Standard Practices, PG&E 20
Utility Procedures, and Power Generation-specific guidance documents. 21
Power Generation-specific guidance documents include Standards, 22
Procedures and Bulletins. In addition, the fossil-fuel generating stations and 23
fuel cell and PV facilities have site-specific procedures. These guidance 24
documents cover virtually all aspects of safety, operations, maintenance, 25
planning, environmental compliance, regulatory compliance, emergency 26
response, work management, inspection, testing and other areas. Each 27
guidance document describes the purpose of the document, the details of 28
the actions and/or processes covered by the document, management’s roles 29
and responsibilities, and the date the document became effective. 30
3 CPUC, GO 167, Section 1.0 Purpose.

3-10
2. Operations Reviews 1
Operations reviews are performed at each of the three fossil-fuel 2
generating stations each year and periodically at remote facilities such as 3
the solar stations and fuel cells by the SQS organization. The purpose of 4
the operations review is to assure that PG&E’s generation facilities are 5
operated in a safe and efficient manner and that they are in compliance with 6
standard operating and clearance procedures. 7
By thoroughly reviewing fossil and solar operations, PG&E can identify 8
possible precursors to more serious problems. The plant managers are 9
provided a report on the overall operational health of their generating 10
stations, with recommendations based on safety, best operating practices, 11
latest operating technologies, training, and reducing the overall cost of 12
production. The recommendations are then implemented on a priority basis 13
within a reasonable time frame. This control enhances PG&E’s ability to 14
improve operations by promoting safe operating practices and verifying 15
compliance with emergency and standard operating and clearance 16
procedures. Operations reviews were completed for Gateway, Colusa, 17
Humboldt, Caruthers Headquarters, Cantua, Gates and West Gates in 2017. 18
3. Incident Reporting Process 19
The incident reporting process is intended to document problems, 20
activities and events that impact or could potentially impact the performance 21
of systems that assure: (1) public safety; (2) facility safety, reliability, 22
availability, and protection of property; and/or (3) environmental or 23
regulatory compliance. By thoroughly analyzing significant problem events 24
that occur in the O&M of PG&E’s facilities, PG&E can report to various 25
regulatory agencies as required, identify possible precursors to repetitive or 26
more serious problems, understand root causes, and communicate lessons 27
learned to other facilities and personnel. 28
4. Corrective Action Program 29
The Corrective Action Program (CAP) documents and tracks corrective 30
actions and commitments. The CAP includes problem identification, cause 31
determination, reporting, development of corrective actions and corrective 32
action implementation tracking. 33

3-11
The CAP for PG&E’s Power Generation organization utilizes SAP 1
notifications and orders to track and document actions that are necessary or 2
have been taken as a result of audit and/or inspection findings, deviations 3
identified in incident reports, regulatory non-compliance issues, engineering 4
deviations and other systemwide issues. 5
5. Outage Planning and Scheduling Processes 6
The outage schedule is developed to communicate when various 7
generating stations will be unavailable due to maintenance or project work. 8
Annual maintenance outages, project-specific outages and combination 9
outages encompassing both project and maintenance tasks are shown on 10
the schedule. The outage schedule for a given outage year is developed 11
through an iterative process, over several years, as projects and 12
maintenance tasks are identified by field employees, management, project 13
managers and others. Typically, no outages are planned during the peak 14
summer generation season. Also, every effort is made to limit the number 15
and duration of outages in the off-peak shoulder months. 16
The yearly outage schedule is not a static document. The schedule is 17
fluid and adaptable to changing requirements for outages. PG&E’s Energy 18
Policy and Procurement organization, the California Independent System 19
Operator (CAISO) and others utilize the schedule to make plans regarding 20
resource allocation, replacement power and restrictions on the system. 21
Therefore, changes in the schedule, particularly in the short term, are 22
discouraged. However, it is inevitable that due to the dynamic nature of the 23
PG&E system, changes will be required. Changes to the schedule may be 24
required based on many factors, including weather conditions, resource 25
constraints, changes in project scope or schedule, and/or emergent work. 26
Depending on the proximity to the outage start date, changes to the scope 27
and schedule require different levels of review and approval. Before outage 28
changes are approved, consideration is given to the impacts of the change 29
on issues such as: effects on equipment reliability, replacement power 30
costs, resources and other scheduled outages. 31
An outage plan is developed prior to the start of the outage. Depending 32
on the size and duration of the outage, an outage plan can be as simple as 33
a list of work orders extracted from the SAP Work Management (SAP WM) 34

3-12
system, or as complex as a critical path, resource-loaded work execution 1
plan detailing each task for a project as well as preventative and corrective 2
maintenance work orders. The development of an outage plan can be 3
broken down into three distinct, but interrelated, processes: (1) planning 4
and scoping; (2) scheduling; and (3) outage execution. 5
a. Planning and Scoping 6
The planning and scoping process entails determining which work is 7
to be executed during the outage. This includes preventative 8
maintenance work orders, corrective work orders for repairs on 9
equipment and/or facilities and project-specific asset replacements or 10
major refurbishments. During this process, the required resources to 11
execute the work and the durations of all work activities are identified. 12
PG&E utilizes SAP WM as the tool to manage preventative and 13
corrective work. Preventative maintenance work orders, sometimes 14
referred to as recurring work, encompass routine maintenance work 15
performed at established intervals. Corrective work orders, sometimes 16
referred to as trouble tags, refer to work identified to correct an issue 17
that is limiting the ability of the equipment or facility to efficiently perform 18
its design function. The SAP WM system is the electronic repository 19
where preventative and corrective work is identified, tracked, organized 20
and managed. The system utilizes maintenance libraries to generate 21
recurring work orders against a piece of equipment at the appropriate 22
frequency as specified by PG&E. Corrective work orders are created in 23
the system by the crews or individuals identifying the problem. 24
The planning and scoping process occurs over a 2- to 3-year period 25
leading up to the outage start date. 26
b. Scheduling 27
The scheduling process includes determining the timing of the start 28
of the outage, as well as the appropriate duration. Outage timing and 29
durations are influenced by many factors, including but not limited to: 30
capital and maintenance work to be performed, system operation 31
constraints, time of year, labor resources available to perform work, 32
CAISO constraints, and transmission system issues. 33

3-13
The scheduling process occurs in conjunction with the scoping and 1
planning process over a 2- to 3-year timeframe. A base preliminary 2
outage schedule is developed from historical outage durations and 3
timing, and OEM recommended frequency based on service hours 4
and/or the number of equipment starts/stops. This schedule is refined 5
over time as the scoping and planning process provides updated 6
information regarding the work to be performed during the outages. 7
In October of the year prior to the outage year, the planned outage 8
schedule is submitted to the CAISO to set the base outage schedule. 9
After this submission, any requests for changes to individual outages 10
are submitted to the responsible plant manager and/or fossil O&M 11
director for approval. The level of management approval is dictated by 12
the proximity of the request to the outage start date. These internal 13
approvals are required before the changes are submitted to the CAISO. 14
c. Outage Execution 15
The outage execution process encompasses not only performing 16
the work planned for the outage, but also following many sub-processes 17
for notifications to and approvals by stakeholders. These include: 18
Notifications to and approvals from the CAISO to separate the 19
unit(s) from the grid. 20
Energy isolation procedures covering the steps required to 21
electrically, hydraulically and mechanically clear the units and 22
facilities (i.e., put them in a safe condition) for the outage work 23
to proceed. 24
Notifications and approvals for any changes in the outage due to 25
emerging work or changed conditions. 26
Restoration procedures to restore the unit to service when the 27
outage work is completed. This includes complying with the steps in 28
the energy isolation procedure and any start-up procedure for new 29
or re-furbished equipment. 30
Notifications to and approvals from the CAISO to restore the unit to 31
service and connect to the grid at the completion of the outage. 32
The three processes detailed above are highly interrelated. Outage 33
scheduling is dependent on planning and scoping. As the defined 34

3-14
outage scope changes, the outage schedule is continuously reviewed 1
and updated based on that changed scope. Conversely, if outside 2
influences require the outage timing or duration to change, the scope of 3
work is reviewed to determine if it can be adjusted to fit the revised 4
timeframe, or if the outage scheduling needs to be moved. During 5
outage execution, emerging work may require an outage extension, 6
which could, in turn, impact the planning and scheduling of outages on 7
other units or facilities. 8
6. Design Change Process 9
Design changes are controlled through the design change process. 10
The design change process is the process for proposing, evaluating, and 11
implementing changes to the design of structures, systems, and equipment 12
at PG&E’s generating facilities. It includes the process for requesting design 13
changes; reviewing and approving design change requests; implementing 14
design changes; closing out design changes; and revising design 15
change notices. 16
D. Operational Results 17
This section examines the operational results during the 2017 record period 18
by reviewing the energy production, fuel usage, and reliability of the fossil-fuel 19
generating stations and the energy production and fuel usage of the PV facilities. 20
The 2017 outages are also reviewed for facilities larger than 25 MW. 21
1. Energy Production 22
The output of Gateway, Colusa, and Humboldt typically varies 23
throughout the day in response to CAISO market awards and dispatch 24
instructions. 25
During 2017, PG&E’s fuel cells were typically self-scheduled in the 26
CAISO markets to run at maximum production. The fuel cells operate at 27
extremely high temperatures (in excess of 1,200 degrees Fahrenheit). 28
When a fuel cell’s output is cycled, the temperature of the fuel cell stack 29
cycles. Since the useful life of a fuel cell stack is reduced with each thermal 30
cycle, PG&E minimizes thermal cycles by running the fuel cells as base 31
loaded resources. 32

3-15
PG&E’s fossil-fuel generating stations provided approximately 1
5,706,889 megawatt-hours (MWh) of energy during the 2017 record period. 2
To generate this amount of energy, the fossil-fuel generating stations burned 3
42,424,631 Million British Thermal Units (MMBtu) of natural gas and 4
27,087 MMBtu of distillate fuel. The resulting net plant heat rate for the 5
fossil-fuel generating stations in 2017 was 7,439 Btu/kilowatt-hours (kWh) as 6
shown in Table 3-1 below.4 7
TABLE 3-1 FOSSIL GENERATION 2017 ENERGY PRODUCTION
Line No. Station
Net Generation (MWh)
Fuel Usage (MMBtu)
Average Net Heat Rate (Btu/kWh)
1 Gateway 2,779,066 20,354,041 7,324 2 Colusa 2,496,298 18,253,302 7,312 3 Humboldt 431,525 3,844,375 8,909
4 Total 5,706,889 42,451,719 7,439 (average)
During 2017, PG&E’s PV generating facilities were included in the 8
CAISO market in accordance with the appropriate CAISO tariff provisions 9
relating to these types of intermittent renewable facilities, and as a result 10
were typically operated at maximum production.5 PG&E’s PV generating 11
facilities provided approximately 297,694 MWh of energy during the 2017 12
record period. 13
D.10-04-052 approving PG&E’s 5-year solar PV Program links PG&E’s 14
recovery of its O&M costs for its PV facilities in its General Rate Cases to 15
the performance of the PV facilities. The decision states that, should the 16
average performance of PG&E’s PV UOG systems fall below 80 percent of 17
expected output, it will weigh heavily in favor of disallowing or refunding 18
some of the O&M costs to ratepayers.6 The PV facilities operated at 19
90.8 percent of the expected output during the 2017 record period. PG&E 20
4 Net plant heat rate is equal to the amount of fuel consumed (Btu) divided by the net
generation (kWh). 5 Nine of PG&E’s PV generation facilities are capable of being curtailed for economic
dispatch purposes. 6 D.10-04-052, Ordering Paragraph 7.

3-16
reduced power output on (curtailed) many of its PV generation facilities 1
during 2017 (at the request of the CAISO and for economic dispatch 2
purposes). Had PG&E not reduced output as directed, PG&E’s PV facilities 3
would have operated at 97.3 percent of the expected output during the 2017 4
record period. 5
2. Outages 6
PG&E’s fossil-fuel generating stations experienced two different types of 7
outages during the record period: (1) scheduled outages; and (2) forced 8
outages. 9
Scheduled outages include both planned outages and maintenance 10
outages. Planned outages are typically scheduled prior to the start of the 11
year. PG&E’s combined cycle plants, Gateway and Colusa, typically 12
schedule planned outages in the spring and fall of each year to address 13
preventive and corrective maintenance issues. Maintenance outages are 14
scheduled when needed throughout the year to perform testing or routine 15
maintenance, or to perform non-emergency repairs when the outage can be 16
deferred beyond the end of the next weekend, but requires a capacity 17
reduction before the next planned outage. Humboldt schedules planned 18
outages for larger scope and duration routine engine maintenance that is 19
hour-based. Humboldt schedules maintenance outages for smaller scope 20
and duration routine engine maintenance that is hour-based. 21
Forced outages occur when equipment suddenly fails and the unit 22
immediately trips, or when the repair need is so urgent that the unit is 23
required to come off line before the end of the next weekend. 24
Consistent with previous Energy Resource Recovery Account 25
compliance proceedings, PG&E is providing general information regarding 26
Scheduled Outages that were 24 hours or more in duration, and specific 27
information regarding each Forced Outage that was longer than 24 hours in 28
duration, for facilities that are 25 MW or greater in size. PG&E provides 29
additional, detailed information concerning the outages that occurred during 30
the record period to the Office of Ratepayer Advocates (ORA) in response to 31
ORA’s Master Data Request. 32
During forced outages, one of PG&E’s primary goals is to bring the unit 33
back on line safely and expediently. Additionally, PG&E often examines 34

3-17
components associated with the specific equipment that failed. This 1
examination helps inform PG&E as to whether modifications or repairs 2
should be made to those components, either at the unit where the outage 3
occurred, or at other units with similar components. While this might extend 4
the time before a unit is returned to service, it can potentially avoid a future 5
forced outage. 6
One of the key industry metrics used to gauge the operating 7
performance of generating units is the Forced Outage Factor (FOF). FOF is 8
a ratio of the hours a unit is forced out of operation to the total hours in the 9
operation period (i.e., month, year). The fossil portfolio 2017 FOF was 10
0.55 percent. This FOF is significantly better than the industry benchmark of 11
1.80 percent. Table 3-2 includes the fossil portfolio FOF for the past 12
five years compared to the industry benchmark.7 13
TABLE 3-2 FOSSIL PORTFOLIO FORCED OUTAGE FACTOR
Line No. Year FOF (%)
Latest Benchmark
1 2012 0.88 2 2013 0.11 3 2014 4.20 4 2015 0.79 5 2016 0.31 6 2017 0.55 1.80
a. Gateway Generating Station 14
1) Scheduled Outages 15
Gateway executed two planned outages in 2017 that lasted 16
24 hours or more. The first planned outage included a CT bore 17
scope inspection, ST L0 blade inspections, plant instrumentation 18
upgrades, boiler feed pump overhauls, valve rebuilds, HRSG 19
maintenance, and catalyst inspections. Generator step-up 20
transformer protection relay replacements were begun in the first 21
7 The industry benchmark is the 2012-2016 North American Electric Reliability
Corporation Generating Availability Data System Generating Unit Statistical Brochure. It is included in PG&E’s workpapers.

3-18
planned outage and completed in the second planned outage, 1
during which PG&E also performed various inspections, routine 2
maintenance and minor corrective work. 3
Gateway did not experience any maintenance outages in 2017 4
lasting 24 hours or more in duration. 5
2) Forced Outages 6
Gateway did not experience any forced outage in 2017 lasting 7
longer than 24 hours in duration. 8
b. Colusa Generating Station 9
1) Scheduled Outages 10
Colusa executed two planned outages in 2017 that lasted 11
24 hours or more in duration. In the first planned outage PG&E 12
performed maintenance on all three exciters, the steam bypass 13
valve, the boiler feed water control valve, the HRSG blowdown 14
valve, and the HRSG tubes, and also performed other minor routine 15
maintenance and corrective work. PG&E also performed 16
inspections on the HRSG catalysts, pressure vessels, and CTs, 17
including the CT R0 blades. In the second planned outage, PG&E 18
performed various inspections, including pressure piping weld 19
inspections, transformer inspections, and fire system inspections. 20
PG&E made repairs to the high energy piping, HRSG exhaust and 21
HRSG pin seal, and implemented a high energy piping pipe 22
surveillance program. Routine maintenance and minor corrective 23
work including penetration seal replacements was also completed. 24
Colusa did not experience any maintenance outages in 2017 25
lasting 24 hours or more in duration. 26
2) Forced Outages 27
On June 1, 2017, at 10:08 a.m., Colusa was removed from 28
service to allow PG&E to investigate a leak identified on the auxiliary 29
steam piping. The investigation revealed a cracked flange, likely 30
caused by thermal fatigue. A replacement flange was procured and 31
delivered the same day. PG&E replaced the flange and returned 32
the unit to service on June 2, 2017 at 2:45 p.m. 33

3-19
c. Humboldt Bay Generating Station 1
1) Scheduled Outages 2
The preventative maintenance schedule at Humboldt is based 3
on service hours of each engine. Maintenance is necessary for 4
each engine at 1,000, 2,000, 4,000, 6,000, 8,000, 12,000, 18,000 5
and 24,000 hour intervals. The 12,000 and 18,000 hour overhauls 6
are the most extensive and take the most time to plan for and 7
complete. As mentioned earlier, Humboldt schedules planned 8
outages for larger scope and duration engine maintenance, and 9
schedules maintenance outages for smaller scope and duration 10
engine maintenance. Since Humboldt is a 10-engine facility, 11
another engine is typically available to back up an engine that is out 12
of service for an outage. 13
Humboldt executed one planned outage in 2017 lasting 14
24 hours or more in duration. Humboldt experienced 15
26 maintenance outages lasting 24 hours or longer on its 16
10 engines in 2017. 17
The planned outage was for an 18,000-hour major overhaul on 18
Unit 3. 19
The maintenance outages were scheduled primarily to conduct 20
routine inspections and preventative maintenance. Routine 21
preventative maintenance is required on the engines in order to 22
assure reliable service in the future. 23
2) Forced Outages 24
Humboldt experienced 14 forced outages lasting longer than 25
24 hours in 2017. This equates to an average of just over 26
one forced outage per unit in 2017. 27
a) Units 1-3 28
On April 10, 2017, at 8:20 a.m., Unit 1 was forced offline 29
due to a blown rupture disc8 at the SCR inlet. PG&E replaced 30
8 A rupture disc is a non-reclosing pressure-relief device that protects the engine exhaust
from high pressure conditions.

3-20
the rupture disc and tested and restored the unit to service on 1
April 12, 2017 at 12 p.m. 2
On June 21, 2017, at 6:22 p.m., Units 1, 2 and 3 were 3
unable to generate due to the outgoing feeder breaker tripping 4
offline. PG&E investigated the breaker and determined that the 5
trip of the overcurrent ground relay was a result of a 6
combination of factors: large primary currents fed through a 7
small current transformer core, primary currents not centered in 8
the window-type current transformer, and the window-type 9
current transformer being square shaped (as opposed to round). 10
The combination resulted in stray magnetic fields causing local 11
current transformer saturation. The stray magnetic fields 12
created enough current to trip the extremely sensitive 13
secondary 51G element of the overcurrent ground relay. 14
PG&E determined that disabling the 51G element for ground 15
overcurrent relay and replacing its functionality with the 16
59G function would provide the protection without causing 17
similar trips. The units were returned to service on June 23, 18
2017 at 2:35 p.m. 19
On July 9, 2017, at 7:02 p.m., Unit 3 tripped offline due to a 20
breaker opening on the differential current relay. PG&E 21
investigated and found that the differential current relay had 22
failed and needed to be replaced. PG&E replaced the relay, 23
tested the unit, and returned it to service on July 13, 2017 at 24
3:38 p.m. 25
On November 8, 2017, at 7 a.m., Unit 3 was forced out of 26
service from a maintenance outage due to damaged camshaft 27
bearings. After observing particles in the lube oil filter, PG&E 28
decided to schedule an outage for an inspection. During the 29
inspection, several of the camshaft bearings were found to be 30
scored. PG&E then initiated a forced outage to remove the 31
camshaft segments, replace the bearings, and investigate the 32
cause of the damage. 33

3-21
During the investigation of the cause of the bearing scoring, 1
PG&E discovered that the charge air receiver pulsation damper 2
had failed. PG&E subsequently removed the heads to remove 3
and replace the damper. After removing the heads, PG&E 4
found that the heads were leaking water and oil into the 5
cylinders. PG&E believes that the cause of the leaking heads 6
was poor workmanship by the OEM during the planned outage 7
earlier in the year. The replacement of the heads was the 8
critical path in the return to service of this unit. As of the end of 9
2017, the OEM was in the process of replacing the heads. A 10
total of 18 heads will be replaced. The unit remained out of 11
service through the end of 2017. 12
On November 20, 2017, at 8:05 a.m., Unit 2 was forced 13
offline due to water leaking into the crankcase. PG&E 14
investigated and identified a head gasket leak on cylinder A7. 15
PG&E repaired the leak and returned the unit to service on 16
November 23, 2017 at 9 a.m. 17
On December 3, 2017, at 6:05 a.m., Unit 1 tripped offline. 18
PG&E investigated the cause of the trip and found that one of 19
the two speed sensors on the flywheel was not operating 20
properly. PG&E replaced both speed sensors and returned the 21
unit to service the next day at 9:01 a.m. 22
b) Unit 4 23
On July 27, 2017, at 9:10 a.m., Unit 4 tripped offline due to 24
an activation of the oil mist detector. Oil mist detectors help 25
prevent fires and explosions by detecting minute concentrations 26
of oil in the crankcase of each cylinder. PG&E inspected the 27
unit and found that cylinder B9 was leaking water into the 28
crankcase around the liner. PG&E replaced the O-ring, tested 29
the unit, and returned it to service on July 29, 2017 at 30
10:20 a.m. 31
On December 4, 2017, at 9:39 a.m., Unit 4 was forced 32
offline due to a failed rupture disc. During PG&E’s routine 33
inspection with the unit on-line, the operator heard an unusual 34

3-22
sound. The operator investigated the source of the sound and 1
identified a failed rupture disc on the engine exhaust and forced 2
the unit out of service. Scaffolding was erected and PG&E 3
replaced the rupture disc and returned the unit to service the 4
next day at 3:50 p.m. 5
c) Unit 5 6
On December 4, 2017, at 8:50 a.m., Unit 5 was forced 7
offline due to a failed rupture disc. During PG&E’s routine 8
inspection with the unit on-line, the operator heard an unusual 9
sound. The operator investigated the source of the sound and 10
identified a failed rupture disc on the engine exhaust and forced 11
the unit out of service. Scaffolding was erected and PG&E 12
replaced the rupture disc and returned the unit to service the 13
next day at 12:05 p.m. 14
d) Unit 7 15
On May 13, 2017, at 8:35 a.m., Unit 7 failed during start-up 16
because cylinder A7 would not maintain the required 17
temperature. PG&E replaced the gas valve, cylinder control 18
module (CCM) A3 and the knock sensor connection. The CCM 19
is a computer that sends firing signals to the cylinders based on 20
the signals from the engine’s master control module. Each 21
CCM controls three cylinders, with CCM A3 controlling the 22
A7 cylinder. The knock sensor measures detonation in the 23
cylinder. The unit was tested and returned to service the next 24
day at 3 p.m. 25
e) Unit 8 26
On October 17, 2017, at 7:54 a.m., Unit 8 was shut down 27
due to a failed rupture disc. PG&E replaced the rupture disc 28
and returned the unit to service the next day at 4:26 p.m. 29
f) Unit 10 30
On June 24, 2017, at 5:38 a.m., Unit 10 tripped offline due 31
to erratic exhaust gas temperatures measured at cylinder A8. 32

3-23
PG&E replaced the CCM A3, which controls cylinder A8. The 1
unit was tested and returned to service the next day at 9:11 p.m. 2
E. Conclusion 3
In compliance with D.14-01-011, this chapter addresses the operation of 4
PG&E’s utility-owned fossil-fuel, fuel cell, and PV facilities, and outages that 5
occurred at these facilities during the 2017 record year. It demonstrates that 6
PG&E’s utility-owned fossil-fuel and PV portfolio was operated in a reasonable 7
manner during the record period. 8
PG&E has in place a comprehensive management structure, with adequate 9
internal controls, to prudently oversee the operation of its fossil-fuel generating 10
stations and PV facilities. PG&E’s compliance with the operations standards, 11
maintenance standards, and logbook standards set forth in GO 167 are further 12
evidence that PG&E’s fossil and solar portfolio was operated in a reasonable 13
manner. In addition, scheduled outages were planned sufficiently in advance to 14
allow adequate preparation time and were executed efficiently to assure prompt 15
return to service. 16
PG&E’s fossil portfolio was operated in a reasonable manner as 17
demonstrated by the 2017 record year FOF results being significantly better than 18
the industry average and by the small number of forced outages. PG&E acted 19
reasonably in resolving forced outages in a timely manner. 20

PACIFIC GAS AND ELECTRIC COMPANY
CHAPTER 4
UTILITY-OWNED GENERATION: NUCLEAR

4-i
PACIFIC GAS AND ELECTRIC COMPANYCHAPTER 4
UTILITY-OWNED GENERATION: NUCLEAR
TABLE OF CONTENTS
A. Introduction....................................................................................................... 4-1
B. DCPP’s Operations Organization ..................................................................... 4-1
C. DCPP System Management............................................................................. 4-2
1. Procedures................................................................................................. 4-2
2. Corrective Action Program......................................................................... 4-2
3. Outage Planning and Scheduling Process................................................. 4-3
4. Project Management.................................................................................. 4-4
5. Quality Assurance Program ....................................................................... 4-5
D. Operational Results .......................................................................................... 4-5
1. Capacity Factor and Energy Production..................................................... 4-5
2. Outages ..................................................................................................... 4-7
a. Unit 1 ................................................................................................... 4-9
b. Unit 2 ................................................................................................... 4-9
c. Outage-Related Violations From Nuclear Regulatory Commission ..... 4-9
E. Conclusion...................................................................................................... 4-10

4-1
PACIFIC GAS AND ELECTRIC COMPANY1
CHAPTER 42
UTILITY-OWNED GENERATION: NUCLEAR3
A. Introduction4
In compliance with Decision (D.) 14-01-011, this chapter addresses the 5
operation of Pacific Gas and Electric Company’s (PG&E) utility-owned nuclear 6
facility, and outages that occurred at this facility during the 2017 record year.7
PG&E’s utility-owned nuclear facility was operated in a reasonable manner 8
during the record period. During the record period, PG&E owned, operated and 9
maintained one nuclear generating facility, the Diablo Canyon Power Plant 10
(DCPP), located nine miles northwest of Avila Beach in San Luis Obispo County. 11
DCPP consists of twin pressurized water reactors, Units 1 and 2, rated at a 12
nominal 1,122 megawatts (MW) and 1,118 MW, respectively.13
All nuclear activities are regulated and overseen daily by the Nuclear 14
Regulatory Commission (NRC) to ensure that the facility is operated within 15
federal regulations.16
B. DCPP’s Operations Organization17
PG&E’s Nuclear Generation organization, led by the Vice President Nuclear 18
Generation and Chief Nuclear Officer (CNO), has responsibility for all activities 19
necessary for safe operation of the station. The Station Director, the Senior 20
Director, Nuclear Services, the Director of Business Operations, the Director of 21
Quality Verification (QV), and the Manager of Employee Concerns Program 22
(ECP) report to the CNO.23
The Station Director is responsible for operations, maintenance, and nuclear 24
work management. Operations Services, Maintenance Services, Nuclear Work 25
Management, Chemistry and Radiation Protection, Learning and Performance 26
Improvement report to the Station Director. The Senior Director, Nuclear 27
Services is responsible for providing engineering and design services, project 28
management, security, the emergency response program, regulatory and risk 29
programs, and performance improvement. The Director of Business Operations 30
is responsible for business planning. The Director of QV is responsible for 31
independent oversight of nuclear activities. Finally, the Manager of ECP32
administers the ECP required by NRC regulations.33

4-2
C. DCPP System Management1
Plant safety is essential to the successful operation of a nuclear power 2
station. Nuclear plants that focus on cost and production at the expense of 3
safety may be required by the NRC to shut down for extended periods of time to 4
correct safety problems. PG&E has remained focused on plant safety and 5
equipment reliability by pursuing critical projects in expense and capital even as 6
it pursues cost control efforts. Due to PG&E’s effective balancing of plant safety 7
and reliability, DCPP has performed well with reliability maintained at extremely 8
high levels to the benefit of PG&E’s customers.9
PG&E has many internal controls in place to manage the operations and 10
maintenance of DCPP. These controls include: (1) procedures; (2) a Corrective 11
Action Program (CAP); (3) an outage planning and scheduling process; (4) a12
project management process; and (5) a Quality Assurance (QA) Program. Each 13
of these controls is discussed below.14
1. Procedures15
Procedures cover virtually all aspects of safety, operations, 16
maintenance, planning, environmental compliance, regulatory compliance, 17
emergency planning, work management, inspection, testing and other 18
areas. Each procedure describes the purpose of the document, the details 19
of the actions and/or processes covered by the document, management’s 20
roles and responsibilities, and the date the document became effective.21
2. Corrective Action Program22
The CAP is the main process that DCPP uses to identify, analyze, and 23
resolve plant problems, and is required by the regulations of the NRC.124
Elements of the program include issue identification, issue significance 25
reviews, various levels of cause analysis up to root cause analysis, 26
corrective action development and implementation, and performance 27
trending and monitoring. The program is used to develop corrective actions 28
to prevent recurrence of problems.29
1 See 10 Code of Federal Regulations (CFR) 50, Appendix B.
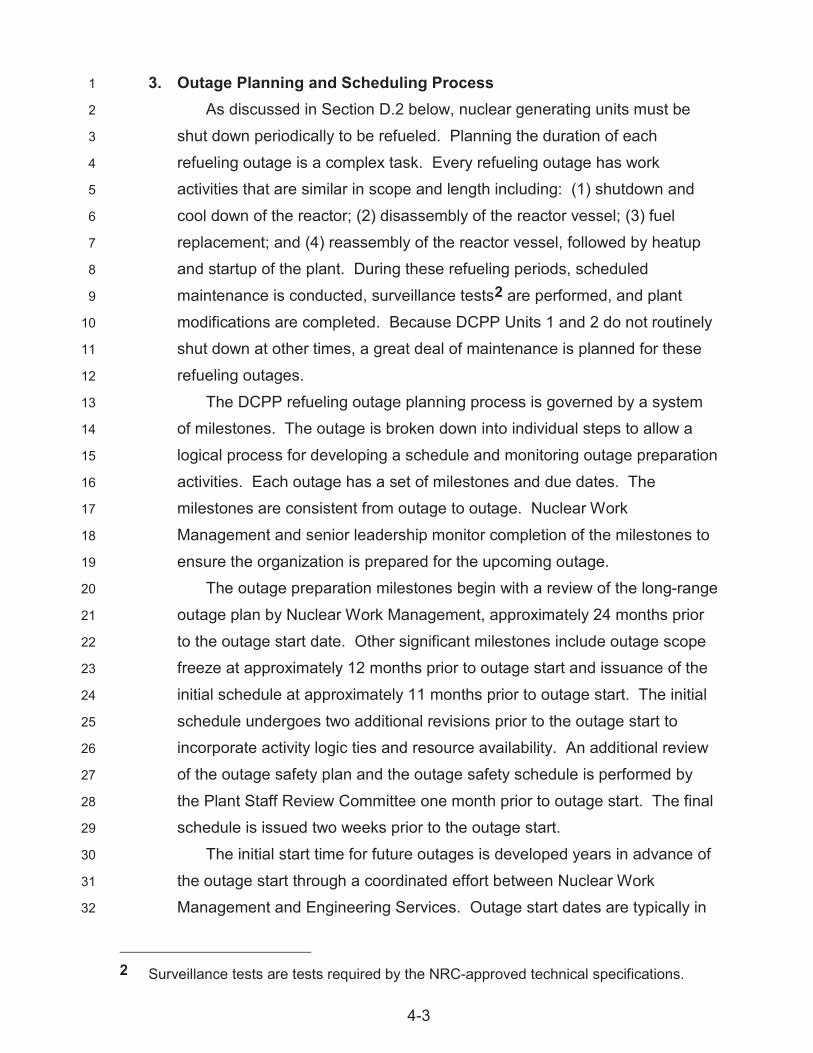
4-3
3. Outage Planning and Scheduling Process1
As discussed in Section D.2 below, nuclear generating units must be 2
shut down periodically to be refueled. Planning the duration of each 3
refueling outage is a complex task. Every refueling outage has work 4
activities that are similar in scope and length including: (1) shutdown and 5
cool down of the reactor; (2) disassembly of the reactor vessel; (3) fuel 6
replacement; and (4) reassembly of the reactor vessel, followed by heatup 7
and startup of the plant. During these refueling periods, scheduled8
maintenance is conducted, surveillance tests2 are performed, and plant 9
modifications are completed. Because DCPP Units 1 and 2 do not routinely 10
shut down at other times, a great deal of maintenance is planned for these 11
refueling outages.12
The DCPP refueling outage planning process is governed by a system 13
of milestones. The outage is broken down into individual steps to allow a 14
logical process for developing a schedule and monitoring outage preparation 15
activities. Each outage has a set of milestones and due dates. The 16
milestones are consistent from outage to outage. Nuclear Work 17
Management and senior leadership monitor completion of the milestones to 18
ensure the organization is prepared for the upcoming outage.19
The outage preparation milestones begin with a review of the long-range 20
outage plan by Nuclear Work Management, approximately 24 months prior 21
to the outage start date. Other significant milestones include outage scope 22
freeze at approximately 12 months prior to outage start and issuance of the 23
initial schedule at approximately 11 months prior to outage start. The initial 24
schedule undergoes two additional revisions prior to the outage start to 25
incorporate activity logic ties and resource availability. An additional review 26
of the outage safety plan and the outage safety schedule is performed by 27
the Plant Staff Review Committee one month prior to outage start. The final 28
schedule is issued two weeks prior to the outage start.29
The initial start time for future outages is developed years in advance of 30
the outage start through a coordinated effort between Nuclear Work 31
Management and Engineering Services. Outage start dates are typically in 32
2 Surveillance tests are tests required by the NRC-approved technical specifications.

4-4
the spring or fall to support operation during the summer months and are 1
coordinated with reactor fuel core cycle length (currently from 18 to 2
20 months on each unit). This planning minimizes years in which an outage 3
occurs on both Units 1 and 2. The outage initial start date is then 4
coordinated through PG&E’s Energy Policy and Procurement organization, 5
well in advance of the actual outage start date.6
All key steps necessary to determine the duration of a refueling outage 7
are developed through the milestone process discussed above. In the 8
outage schedule, some “float” hours are included to accommodate any 9
minor issues that arise during the outage. The float hours are intended to 10
assure that the unit is returned to service as planned in the outage schedule.11
Nuclear Work Management, through the milestone structure, identifies 12
most of the outage design scope (including both major and minor items) 13
approximately 22 months prior to the outage start. This scope is reviewed 14
and approved by station leadership and is finalized 20 months prior to the 15
outage start. Required preventive maintenance items are identified and 16
approved by Engineering Services 15 months prior to the outage start. 17
Preventive maintenance items are items that are needed on a recurring 18
frequency to ensure a safe and reliable plant. Examples of preventive 19
maintenance include motor overhauls, valve refurbishments and instrument 20
calibrations. 21
Once the outage scope milestone is completed, there is a process for 22
incorporating late scope additions and scope deletions. For significant 23
scope items or challenges to the scope, approval by a Readiness Review 24
Board, consisting of upper management and chaired by the Station Director, 25
is required. These items are presented to the board and either approved as 26
scope addition or rejected. This process is utilized for all refueling outages 27
at DCPP and was accordingly used to develop and modify the outage scope 28
for the 2017 Unit 1 1R20 refueling outage discussed in Section D.2 below.29
4. Project Management30
Project work is controlled through the project management process. 31
Projects are assigned a project manager who has responsibility for the 32
project scope, cost and schedule, and coordinates and manages the project 33
from inception to closeout. Project management procedures and tools are in 34

4-5
place to provide Nuclear Generation project managers with guidelines for 1
successfully achieving the project objective of each project they manage. 2
These procedures are intended to be applicable to all project types, sizes 3
and phases, and are anticipated to improve the consistency and quality of 4
project management throughout Nuclear Generation. Project managers are 5
responsible for regular project reporting to management.6
5. Quality Assurance Program7
QA audits, assessments, reviews and inspections are required by the 8
NRC. These processes evaluate plant activities to ensure they are being 9
performed in accordance with NRC QA program requirements and other 10
recognized industry standards. Quality oversight activities at DCPP are 11
performed in accordance with the following regulations: 10 CFR 50, 12
Appendix B; NRC Regulatory Guide 1.33 (that endorses American National 13
Standards Institute (ANSI) N18.7); NRC Regulatory Guide 1.44 (that 14
endorses ANSI N45.2.12); NRC Regulatory Guide 1.58 (that endorses 15
ANSI N45.2.6); and NRC Regulatory Guide 1.123 (that endorses 16
ANSI N45.2.13). 17
QV has overall responsibility for independent quality oversight of 18
DCPP plant operations, maintenance, radiation protection, chemistry, 19
emergency planning, environmental protection plan, fitness for duty, 20
engineering, design, procurement, outage management, work control, and 21
strategic projects. The work performed by the QV section includes 22
independent QA audits, assessments, reviews, quality control inspections, 23
welding nondestructive examinations, source assessments, and24
supplier audits.25
D. Operational Results26
1. Capacity Factor and Energy Production27
DCPP is consistently operated at 100 percent (or full) power level. 28
Regular cycling of DCPP is not performed. This is consistent with the 29
operation of most nuclear power plants in the United States, which are 30
operated as baseload units. When a plant is taken off-line for any reason, 31
regulatory-required testing must be performed before the plant can be 32

4-6
returned to service, which extends the time period to return to service 1
beyond the time required to conduct repairs.2
There are a number of factors that can affect the megawatt-hour (MWh) 3
output of a nuclear facility, such as scheduled refueling outages, routine 4
turbine generator valve testing, ocean cooling water temperature, ocean 5
cooling water system tunnel cleaning, curtailments, and forced outages. 6
The capacity factor3 and net generation4 for the record period for DCPP 7
Units 1 and 2 are shown below in Table 4-1.8
TABLE 4-1NUCLEAR GENERATION 2017 ENERGY PRODUCTION
Line No. DCPP Unit Capacity Factor
Net Generation(MWh)(a)
1 1 83% 8,198,2842 2 100% 9,728,167
_______________
(a) The net generation values reflect preliminary CAISO data. Final 2017 generation values will be available in April 2018.
Electric power industry generation unit performance calculations are9
based on “Maximum Dependable Capacity” (MDC). This value is 10
determined for each generating unit based on extensive unit operational 11
testing and engineering analysis by the plant staff. MDC is the maximum 12
amount of power a unit can produce during average worst case natural13
operating conditions.514
The MDC values for DCPP Units 1 and 2 are 1,122 MW and 1,118 MW, 15
respectively. As shown in Table 4-1 above, the 2017 capacity factors for 16
Unit 1 and Unit 2 were 83 percent and 100 percent, respectively. In 2017, 17
Unit 1 had a planned Baffle Bolt Replacement Refueling Outage (1R20), 18
3 Capacity factor is a measure of actual generation compared to potential generation (based on operating a unit 24 hours a day every day of the reporting period, and established Net Maximum Dependable Capacity values of 1,122 MW for Unit 1and 1,118 MW for Unit 2).
4 Net generation (MWh) is equal to gross generation minus the amount of energy consumed by the plant, as reported by PG&E to the California Independent System Operator (CAISO).
5 The NRC’s definition of MDC can be found at: https://www.nrc.gov/reading-rm/basic-ref/glossary/maximum-dependable-capacity-gross.html.

4-7
resulting in a lower capacity factor for Unit 1 than for Unit 2. DCPP Units 11
and 2 did not experience any unplanned shutdowns or forced losses of a 2
duration greater than 24 hours throughout the entire 2017 record period.3
Combined, DCPP Units 1 and 2 generated 17,926,451 MWh of energy 4
with an average capacity factor of 91.5 percent (for the record period) 5
against a planned target of 87.7 percent.6 The 2016 industry average 6
capacity factor was 92.3 percent.7 DCPP’s exceptional performance was 7
the result of no forced outages during the record period, and completion of 8
the planned Unit 1 1R20 Baffle Bolt Replacement Refueling Outage 14 days9
ahead of the planned schedule. As explained in Section D.2.a. below, the 10
Unit 1 1R20 Baffle Bolt Replacement Refueling Outage was 16 days shorter 11
than the 2017 industry average for this type of outage. 12
As demonstrated above, DCPP’s performance resulted in safe and 13
reliable generation for PG&E’s customers, with high levels of availability and 14
zero forced outages longer than 24 hours in duration. In addition, 15
completion of the Unit 1 1R20 Baffle Bolt Replacement Refueling Outage 16
ahead of schedule allowed for 14 days of additional DCPP generation to 17
PG&E’s customers.18
2. Outages19
Nuclear generating facilities can experience generation losses due to: 20
(1) refueling (planned) outages; (2) maintenance outages; (3) forced 21
outages; and (4) curtailments. Refueling outages and maintenance outages 22
are both classified as scheduled outages. Each of these types of outages is 23
discussed below.24
Nuclear generating units are unique in that they must be shut down 25
periodically to be refueled. The consumption of this set amount of fuel is 26
what establishes the operating duration of a fuel cycle and scheduling of a 27
refueling outage. Nuclear units schedule necessary maintenance and 28
6 The 88 percent planned target capacity factor accounted for the scheduled Unit 1 1R20Baffle Bolt Replacement Refueling Outage that is discussed in Section D.2.a. below.
7 Industry capacity factors are available from the U.S. Energy Information Administration Electric Power Monthly report, Table 6.7.B. The November 2017 report identifies 2016 U.S. average capacity factor of 92.3 percent (https://www.eia.gov/electricity/monthly/epm_table_grapher.php?t=epmt_6_07_b).

4-8
projects within the refueling outages. After a nuclear unit is refueled it can 1
then be operated until the next refueling outage. The planned duration of a 2
refueling outage is established based on the duration required to refuel the 3
reactor, the scope of maintenance required for the specific outage, and the 4
scope of projects required to be implemented for regulatory or plant 5
improvement activities. 6
Maintenance outages are scheduled when needed throughout the year 7
to perform testing, routine maintenance, or non-emergency repairs when the 8
repairs can be deferred beyond the end of the next weekend, but require a 9
capacity reduction before the next scheduled refueling outage.10
Forced outages are generally the result of equipment malfunctions or 11
unexpected ocean conditions that restrict the plant’s ocean cooling water 12
intake system. When a forced outage occurs, the primary objective is to 13
repair the item that led to the outage or protect plant equipment from 14
damage resulting from restricted ocean cooling water flow. While 15
minimizing the outage period is important, a certain amount of work is 16
required for every forced shutdown. This includes surveillance testing as 17
well as complying with all regulatory requirements and emergent 18
maintenance requirements that cannot be deferred to a later period.19
A curtailment is when a unit is not operating at 100 percent capacity. A 20
curtailment could be the result of required surveillance testing that must be 21
performed at a power level less than 100 percent, routine maintenance that 22
requires a unit to be at less than 100 percent, such as cleaning of the ocean 23
cooling water system to remove biological growth, emergent maintenance 24
items that require the unit to be at a reduced power level, or an operational 25
decision to reduce power due to external influences such as significant 26
swells that could impact the ability of a unit to remain operational.27
Further detail concerning refueling outages, maintenance outages, and 28
forced outages that occurred during the record period for DCPP Units 129
and 2 is discussed below. Consistent with previous Energy Resource 30
Recovery Account compliance proceedings, PG&E is providing general 31
information regarding Scheduled Outages that were 24 hours or more in 32
duration, and specific information regarding each Forced Outage that was 33
longer than 24 hours in duration. PG&E has provided additional, detailed 34

4-9
information concerning the outages that occurred during the record period to 1
the Office of Ratepayer Advocates (ORA) in response to ORA’s Master Data 2
Request.3
a. Unit 14
During 2017, Unit 1 conducted a planned 1R20 Baffle Bolt 5
Replacement Refueling Outage from April 23, 2017 at 00:01 through 6
June 23, 2017 at 00:01. This outage was scheduled for a duration of 7
75 days. The actual Unit 1 1R20 outage duration was 61 days, 14 days 8
ahead of the planned schedule.9
A baffle bolt replacement refueling outage is an outage that includes 10
a major project of inspecting and replacing, as needed, the baffle bolts 11
that secure the reactor core plate that houses the nuclear fuel. The 12
activities required to perform this project are extensive, which makes the 13
refueling outage longer than usual. Baffle bolt inspection and 14
replacement is performed due to an industry and regulatory (NRC) 15
concern that nuclear plant operators ensure that the integrity of the core 16
plate remains within design requirements. 17
The industry average duration for a baffle bolt replacement refueling 18
outage through the end of 2017 was 77 days. As explained above, the19
DCPP Unit 1 1R20 Baffle Bolt Replacement Refueling Outage was 20
scheduled for 75 days and was completed in 61 days, which was shorter 21
than the industry average duration for this type of outage. Completing 22
the outage safely and ahead of schedule allowed PG&E’s customers to 23
benefit from Unit 1 generation 16 days sooner than if Unit 1’s refueling 24
outage had been of industry average duration.25
Unit 1 did not experience any forced outages that were longer than 26
24 hours in duration.27
b. Unit 228
Unit 2 experienced no scheduled or forced outages of a duration 29
greater than 24 hours during 2017.30
c. Outage-Related Violations From Nuclear Regulatory Commission31
There were no NRC violations issued to DCPP in 2017 affecting 32
outage durations. However, there were two Non-Cited Violations during 33

4-10
the Unit 1 1R20 Baffle Bolt Replacement Refueling Outage. Both 1
Non-Cited Violations were of very low safety significance. 2
The first Non-Cited Violation was for not properly obtaining Shift 3
Manager approval when starting work on a job activity during the 4
outage, which resulted in securing a redundant system from service 5
without Shift Manager approval per procedure. Corrective actions 6
included coaching involved personnel, reviewing a communication with 7
additional staff members, and enhancing procedures to provide greater 8
clarity on the standard and to strengthen control of valve position 9
through use of a physical barrier (seal).10
The second Non-Cited Violation was for not expanding the scope of 11
weld reviews for a flaw identified in the previous refueling outage. As an 12
immediate corrective action, PG&E identified and inspected four 13
additional welds assigned to the same degradation mechanism 14
identified in the prior refueling outage, as required by the risk-informed 15
in-service inspection program. This issue was also entered into the 16
DCPP CAP.17
E. Conclusion18
In compliance with D.14-01-011, this chapter addresses the operation of 19
PG&E’s utility-owned nuclear facility, and outages that occurred at this facility 20
during the 2017 record year. It demonstrates that DCPP was operated in a 21
reasonable manner during the record period.22
PG&E has a comprehensive management structure, with numerous internal 23
controls, to prudently oversee the operation of DCPP. The 2017 year-end24
DCPP total plant capacity factor was 91.5 percent, which exceeded the 2017 25
target of 87.7 percent and was slightly lower than the 2016 industry average 26
capacity factor of 92.3 percent. In addition, DCPP experienced no unplanned 27
shutdowns that were greater than 24 hours in duration. Finally, the Unit 128
planned 1R20 Baffle Bolt Replacement Refueling Outage was planned 29
sufficiently in advance to allow adequate preparation and was efficiently 30
executed to assure prompt return to service. This outage lasted 61 days 31
compared to the scheduled 75-day duration, and was completed 16 days sooner 32
than the nuclear industry average duration of 77 days for this type of outage. 33

4-11
This allowed PG&E to deliver 16 more days of generation from Unit 1 to its 1
customers during 2017 than it would have under the industry average.2
In sum, DCPP was operated in a reasonable manner in 2017 as 3
demonstrated by PG&E’s completion of the Unit 1 1R20 Baffle Bolt Replacement 4
Refueling Outage 16 days sooner than the industry average duration, and the 5
absence of forced outages on either Unit resulting from PG&E’s methodical 6
operational focus on maintenance. 7

PACIFIC GAS AND ELECTRIC COMPANY
CHAPTER 5
COSTS INCURRED AND RECORDED IN THE DIABLO CANYON
SEISMIC STUDIES BALANCING ACCOUNT

5-i
PACIFIC GAS AND ELECTRIC COMPANYCHAPTER 5
COSTS INCURRED AND RECORDED IN THE DIABLO CANYON SEISMIC STUDIES BALANCING ACCOUNT
TABLE OF CONTENTS
A. Introduction....................................................................................................... 5-1
B. Description of Costs Incurred ........................................................................... 5-2
C. The Costs Recorded in the DCSSBA Are Reasonable and Consistent With D.12-09-008, D.14-08-032 and D.17-05-013............................................ 5-3
1. AB 1632 Seismic Studies........................................................................... 5-3
a. Ocean Bottom Seismometer................................................................ 5-4
b. AB 1632 Project Management............................................................. 5-4
2. CPUC Independent Peer Review Panel..................................................... 5-5
3. LTSP.......................................................................................................... 5-5
a. Seismic Source Studies....................................................................... 5-6
b. Ground-Motion Studies........................................................................ 5-7
c. LTSP Project Management.................................................................. 5-8
D. Conclusion........................................................................................................ 5-9

5-1
PACIFIC GAS AND ELECTRIC COMPANY1
CHAPTER 52
COSTS INCURRED AND RECORDED IN THE DIABLO CANYON 3
SEISMIC STUDIES BALANCING ACCOUNT4
A. Introduction5
In Decision (D.) 10-08-003, the California Public Utilities Commission 6
(CPUC or Commission) granted Pacific Gas and Electric Company’s (PG&E)7
request to comply with the California Energy Commission’s (CEC) 8
recommendation to perform additional seismic studies in and around the 9
Diablo Canyon Nuclear Power Plant (DCPP) as part of the relicensing process.10
Decision 12-09-008 authorized PG&E to record in the Diablo Canyon Seismic 11
Studies Balancing Account (DCSSBA) and recover in rates its actual costs of 12
implementing the DCPP seismic activities up to $64.25 million. As discussed in 13
D.12-09-008, these activities have a genesis in Assembly Bill (AB) 1632, and are 14
sometimes referenced as PG&E’s AB 1632 seismic studies.15
In D.12-09-008, the Commission directed that costs incurred and recorded 16
in the DCSSBA should be recovered in PG&E’s annual Energy Resource 17
Recovery Account (ERRA) proceedings, and indicated that PG&E should 18
provide support for the amounts actually incurred and recorded in the DCSSBA, 19
consistent with PG&E’s request in Application (A.) 10-01-014 and in any 20
subsequent Tier 3 advice letters. Additionally, the Commission directed PG&E 21
to provide support in the ERRA proceedings for costs recorded in the 22
Independent Peer Review Panel (IPRP) subaccount of the DCSSBA.23
Decision 14-08-032, the Commission decision authorizing PG&E’s 24
2014-2016 General Rate Case (GRC) revenue requirement, directed PG&E to 25
remove $4.84 million in Long-Term Seismic Program (LTSP) costs from the 26
2014 revenue requirement for the purposes of the 2014-2016 GRC and transfer 27
the LTSP costs to the DCSSBA. Decision 17-05-013, the Commission decision 28
authorizing PG&E’s 2017-2019 GRC revenue requirement, adopted a settlement 29
agreement under which PG&E agreed to remove $4.2 million in LTSP costs from 30
the 2017-2019 revenue requirement and to continue the practice of recording 31
annual seismic studies costs to the DCSSBA. The LTSP costs are subject to 32

5-2
the same annual ERRA Compliance proceeding and Tier 3 Advice Letter 1
provisions adopted for the DCSSBA in D.12-09-008.2
In 2015, AB 361 added Section 712 to the California Public Utilities Code, 3
which requires the Commission to continue the IPRP until August 26, 2025.4
The costs for the DCPP seismic activities recorded in the DCSSBA during5
2017 total $4.52 million:1 (1) $0.52 million for AB 1632 activities;6
(2) $0.01 million for IPRP costs; and (3) $3.99 million for LTSP activities. PG&E 7
is seeking review and approval of these expenditures. As discussed below, 8
these costs were reasonably incurred. Accordingly, PG&E requests authority to 9
transfer $4.52 million from the DCSSBA to the Utility Generation Balancing 10
Account (UGBA), for recovery from customers as described in Chapter 13.11
B. Description of Costs Incurred12
PG&E has completed the AB 1632 seismic studies identified in D.12-09-008. 13
The final report from the studies was issued on September 10, 2014. Through 14
2017, PG&E has incurred a total of $54.6 million in AB 1632-related expenses, 15
below the $64.25 million cap set by D.12-09-008.16
The AB 1632 costs recorded in the DCSSBA during 2017 were incurred for 17
activities related to operations and maintenance (O&M) of the Point Buchon 18
Ocean Bottom Seismometer (OBS) array and project management costs.19
Costs recorded in the DCSSBA for the CPUC IPRP during 2017 were 20
related to IPRP meetings, review of PG&E documents related to the AB 1632 21
and LTSP studies, and the preparation of IPRP Reports.22
The LTSP costs recorded in the DCSSBA in 2017 were incurred to:23
(1) conduct seismic source studies including earthquake and geodetic 24
monitoring; and (2) conduct ground motion studies including: (a) continue 25
development of new models and methods required for implementation of a fully 26
non-ergodic ground-motion model for the Central California coast region; 27
(b) continue development of improved methods for numerical simulations of 28
ground motions, and perform 1-D simulations for large earthquakes at short 29
distances to constrain source scaling; (c) develop a 3-D crustal model for the 30
Central California coast region and perform 3-D simulations; (d) initiate 31
development of methods supporting fault-rupture hazard assessment; and 32
1 Total may not tie precisely to amounts presented in Chapter 13 because of rounding.
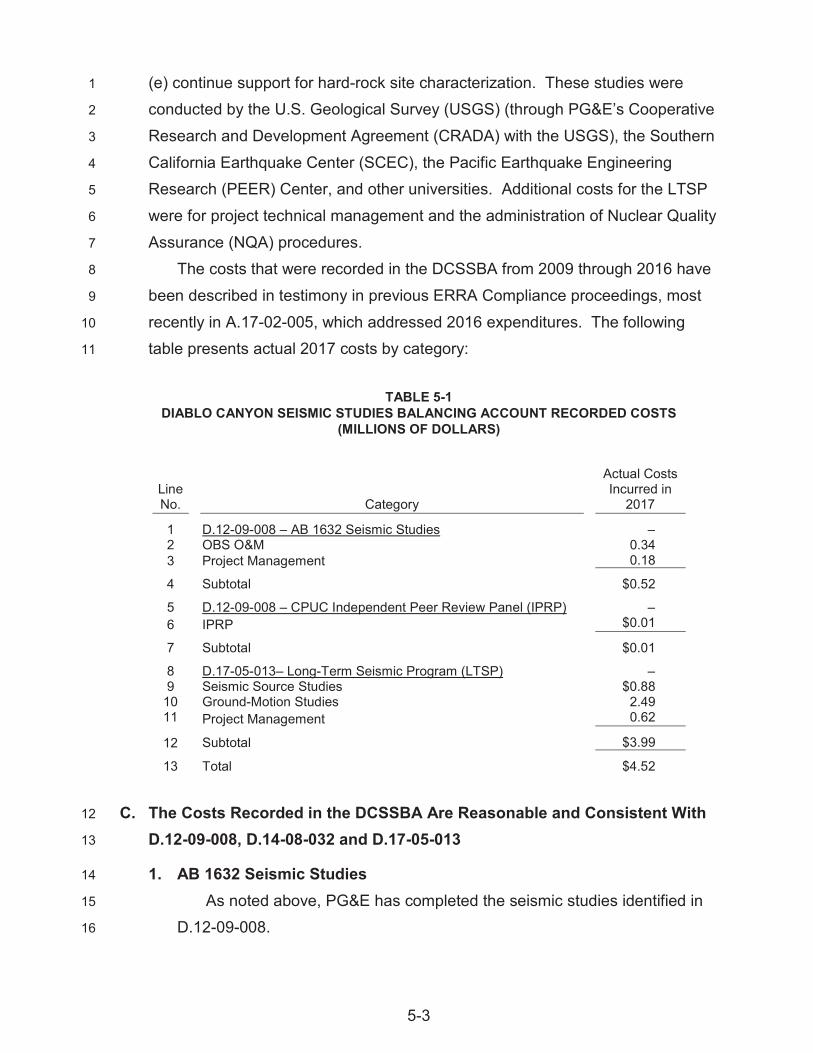
5-3
(e) continue support for hard-rock site characterization. These studies were 1
conducted by the U.S. Geological Survey (USGS) (through PG&E’s Cooperative 2
Research and Development Agreement (CRADA) with the USGS), the Southern 3
California Earthquake Center (SCEC), the Pacific Earthquake Engineering 4
Research (PEER) Center, and other universities. Additional costs for the LTSP 5
were for project technical management and the administration of Nuclear Quality 6
Assurance (NQA) procedures.7
The costs that were recorded in the DCSSBA from 2009 through 2016 have 8
been described in testimony in previous ERRA Compliance proceedings, most 9
recently in A.17-02-005, which addressed 2016 expenditures. The following 10
table presents actual 2017 costs by category:11
TABLE 5-1DIABLO CANYON SEISMIC STUDIES BALANCING ACCOUNT RECORDED COSTS
(MILLIONS OF DOLLARS)
Line No. Category
Actual Costs Incurred in
2017
1 D.12-09-008 – AB 1632 Seismic Studies –2 OBS O&M 0.343 Project Management 0.18
4 Subtotal $0.52
5 D.12-09-008 – CPUC Independent Peer Review Panel (IPRP) –6 IPRP $0.01
7 Subtotal $0.01
8 D.17-05-013– Long-Term Seismic Program (LTSP) –9 Seismic Source Studies $0.88
10 Ground-Motion Studies 2.4911 Project Management 0.62
12 Subtotal $3.99
13 Total $4.52
C. The Costs Recorded in the DCSSBA Are Reasonable and Consistent With 12
D.12-09-008, D.14-08-032 and D.17-05-01313
1. AB 1632 Seismic Studies14
As noted above, PG&E has completed the seismic studies identified in15
D.12-09-008.16

5-4
a. Ocean Bottom Seismometer1
PG&E continued to operate the OBS array approved in 2
D.12-09-008. Six new autonomous OBS instruments were delivered in 3
May 2016 to replace the previous OBS array at no cost to PG&E. 4
Four new OBS units were deployed offshore, one unit was repurposed 5
and installed at the Central Coast Seismic Network (CCSN) Alexander 6
Ranch site, and one unit was held in reserve as a spare.7
PG&E incurred and recorded costs totaling $0.34 million for OBS8
activities in 2017. These costs were associated with the semi-annual 9
retrieval, maintenance, and redeployment of the autonomous OBS 10
array, as well as the submittal of necessary documentation to California 11
state agencies (e.g., amendments to the lease and post-installation 12
survey reporting required by the California State Lands Commission). 13
PG&E concluded the OBS monitoring program in November 2017 and 14
transitioned to local on-call storage for the OBS instruments. This 15
option will enable PG&E to quickly redeploy the instruments in the event 16
of a significant offshore earthquake. Future costs associated with 17
redeployment will be recorded as part of LTSP activities under 18
the DCSSBA.19
b. AB 1632 Project Management20
The seismic activities described above required project 21
management during 2017. This category of costs includes PG&E 22
oversight of project activities, employee-related labor costs, and NQA23
management. There are several departments within PG&E that incur 24
internal labor costs to support the AB 1632 projects and interact with the 25
IPRP, including Geosciences (i.e., Project Manager, Technical Director, 26
Quality Assurance (QA) Manager), External Communications, 27
Government Regulatory Relations, Procurement and Reprographic 28
Services. There are also outside contractors who provide project 29
management support, graphic services, and NQA management and 30
oversight.31
Project management costs incurred and recorded to the DCSSBA 32
for AB 1632-related activities during 2017 total $0.18 million.33

5-5
2. CPUC Independent Peer Review Panel1
Funding of the IPRP is included as a separate subaccount in the 2
DCSSBA. In D.10-08-003, the CPUC established the IPRP, whose 3
members include the CPUC, CEC, California Geological Survey (CGS),4
California Coastal Commission, California Seismic Safety Commission, and 5
the City and County of San Luis Obispo. Since its inception, the IPRP has 6
reviewed and commented on PG&E’s seismic study plans, held public 7
meetings, participated in the federal and state permitting processes required 8
to perform the seismic studies, and issued 12 written reports addressing 9
PG&E’s seismic study activities.10
In previous years, the IPRP has focused on review of seismic hazard 11
studies prepared in response to AB 1632. IPRP comments and review 12
helped evaluate the AB 1632 Central California Coast Seismic Imaging 13
Project (CCCSIP) report and its incorporation into seismic hazard 14
evaluations submitted to the Nuclear Regulatory Commission (NRC). 15
Following completion of the CCCSIP and acceptance of the seismic hazard 16
evaluations by the NRC, the IPRP has continued to review seismic hazard 17
studies conducted under the DCPP LTSP. 18
PG&E is responsible for the IPRP costs. During 2017, PG&E received 19
invoices from the IPRP totaling $0.01 million. Given Public Utilities Code 20
Section 712’s requirement that the Commission continue the IPRP until 21
August 2025, PG&E anticipates that it may incur costs going forward for the 22
IPRP involvement with issues raised by the CCCSIP report and studies 23
conducted under the LTSP. PG&E will record those costs in the IPRP 24
subaccount of the DCSSBA.25
3. LTSP26
PG&E’s DCPP LTSP began in 1985. The LTSP was established to 27
satisfy DCPP License Condition, Item 2.C.(7), which required reevaluation of 28
the seismic design bases for DCPP. Following the NRC review of the LTSP 29
report, where the NRC concluded that PG&E had met DCPP License 30
Condition 2.C.(7) (NUREG-0675, Supplement No. 34, June 1991), PG&E 31
made the following commitments: (1) continue to maintain a strong 32
geosciences and engineering staff to keep abreast of new geological, 33
seismic, and seismic engineering information and evaluate such information34

5-6
with respect to its significance to DCPP; and (2) continue to operate a 1
strong-motion accelerometer array and the CCSN. These commitments are 2
documented in Section 2.5 of the DCPP Facility Safety Analysis Report 3
(Geology and Seismology).4
Each year, PG&E performs studies to support these commitments.5
Project selection is based on criteria that consider significance to the 6
seismic hazard, past and present projects addressing the same parameter, 7
benefits-to-costs, and the likelihood of success.8
The activities of PG&E’s LTSP during 2017 are described in more 9
detail below.10
a. Seismic Source Studies11
The CCSN was installed in 1987 as part of the LTSP to monitor 12
earthquake activity in the central coast region. The network has been 13
systematically upgraded and now consists of 15 digital, 3-component 14
seismographic stations located primarily along the coast, from 15
Piedras Blancas to Point Sal. These are continuous recording 16
instruments, and the data are telemetered to a central recorder in 17
San Francisco and to the USGS. 2017 activities included O&M of the 18
seismographic stations and working with the CGS and USGS on 19
earthquake locations, interpretations and data archiving.20
PG&E incurred and recorded costs in the DCSSBA totaling 21
$0.88 million in 2017 for LTSP seismic source studies. These costs 22
included funding to outside contractors and labor costs for individual 23
PG&E scientists to conduct seismic source study research. PG&E will 24
continue to incur costs for seismic source studies as part of the LTSP.25
Upholding PG&E’s LTSP commitment requires work to continually 26
improve the models that are used for seismic source characterization 27
and ground motion characterization. Toward this end, in addition to the 28
seismic monitoring described above, geologic and geophysical studies 29
are conducted to examine alternative models of likely long-term 30
earthquake behavior on faults. Such efforts include collaborative 31
monitoring of crustal motions along the central California coast ranges 32
using Geographic Positioning System arrays (through the PG&E/USGS 33
CRADA), examination of global empirical data on earthquake ruptures 34

5-7
and their relationship to fault segment boundaries or fault intersections, 1
and evaluation of physical earthquake simulation models to inform 2
PG&E about how faults may behave at time scales much greater than 3
the historical record.4
Other LTSP-related source characterization efforts include 5
evaluation of submarine landslides to better understand the potential for 6
landslide generated tsunamis offshore DCPP, integration of the AB 1632 7
3-D Low Energy Seismic Survey data for the Hosgri and Shoreline fault 8
zones into earthquake source characterization models, continuing to 9
study how best to model the frequency distribution of earthquake sizes 10
on faults, the identification and characterization of active faults using 11
alignments of micro-seismicity, and participation in field studies of 12
significant international earthquakes analogous to those in California 13
through the National Science Foundation-sponsored Geotechnical 14
Extreme Events Reconnaissance Program.15
b. Ground-Motion Studies16
As part of PG&E’s LTSP commitment, PG&E conducts 17
ground-motion studies and associated research to continue to support 18
improvements to the ground-motion models. The main effort is to 19
quantify and validate the reduction of uncertainty in the median ground 20
motion by developing improved source and site-specific (non-ergodic) 21
ground-motion models to replace the current (partially non-ergodic) 22
ground-motion models. Current partially non-ergodic models include 23
site-specific site response effects but do not include source/site-specific 24
path and source effects.25
Developing non-ergodic models for the repeatable path effects 26
requires collecting local ground-motion data and 3-D velocity structure 27
data. With models for both the 1-D and 3-D velocity structures,28
earthquake source effects can be removed from the numerical 29
simulations, and path effects can be isolated and modeled. The 30
numerical simulation results are then checked by comparisons with the 31
observed ground-motion data in the region.32
The ground-motion tasks funded in 2017 associated with the plan to 33
transition from partially non-ergodic to fully non-ergodic ground-motion 34

5-8
models are categorized into four groups: (1) non-ergodic empirical 1
models, which include (a) the development of a new non-ergodic ground 2
motion model for California whose coefficients vary as a function of the 3
site and earthquake location, and (b) the development of a hazard 4
computation code capable of handling non-ergodic source, path and 5
site-effects components; (2) 1-D simulations for ergodic models, which 6
aim at constraining ground-motion scaling for sites close to large 7
earthquakes, and that include the continuation of the SCEC Broad-Band 8
Platform improvement and validation effort for kinematic models; (3) 3-D9
simulations of path effects which include tomographic inversions, 10
3-D crustal modeling, simulations runs, and validation of simulations for11
the Los Angeles area; and (4) fault rupture hazard, aimed at improving 12
the estimate of surface rupture at specific locations along the faults.13
Additional ground-motion tasks funded in 2017 addressed:14
(1) continued analysis of fragile geologic features near DCPP that can 15
be used to test the hazard results over time periods of thousands to tens 16
of thousands of years; (2) the development of models to address the 17
high-frequency amplification in hard-rock sites at the surface and at 18
depth; and (3) the characterization of ground motion for creeping faults 19
through dynamic simulations analysis.20
PG&E incurred and recorded costs in the DCSSBA totaling 21
$2.49 million in 2017 in connection with ground-motion activities. These 22
costs included funding to the USGS, SCEC, PEER, and other 23
institutions and labor costs for individual PG&E scientists conducting 24
ground-motion research.25
PG&E will continue to incur costs to conduct ground-motion studies 26
in future years as part of the transition from the partially non-ergodic 27
methods previously used to fully non-ergodic ground-motion 28
modeling approaches. 29
c. LTSP Project Management30
The ongoing LTSP activities require ongoing project management. 31
This category of costs includes the costs of: (1) PG&E labor and 32
personnel; and (2) QA management and oversight.33

5-9
LTSP project management costs incurred and recorded totaled 1
$0.62 million in 2017. These costs include PG&E labor to oversee work 2
performed by the USGS, PEER, SCEC and other contractors; database 3
management; QA-management; and employee-related costs. PG&E 4
will continue to incur costs for LTSP project management at a 5
sustained level.6
D. Conclusion7
The $4.52 million in costs recorded to the DCSSBA during 2017 for the 8
seismic studies described in this testimony are consistent with the costs and 9
programs approved by the Commission in D.12-09-008, and with the costs 10
required to be recorded in the DCSSBA by D.14-08-032 and D.17-05-013.11
As demonstrated by this testimony, these costs were reasonably incurred. 12
Accordingly, the Commission should authorize PG&E to transfer $4.52 million 13
from the DCSSBA to the UGBA for recovery from customers as described in 14
Chapter 13.15

PACIFIC GAS AND ELECTRIC COMPANY
CHAPTER 6
GENERATION FUEL COSTS AND
ELECTRIC PORTFOLIO HEDGING
6-i
PACIFIC GAS AND ELECTRIC COMPANYCHAPTER 6
GENERATION FUEL COSTS ANDELECTRIC PORTFOLIO HEDGING
TABLE OF CONTENTS
A. Introduction....................................................................................................... 6-1
B. Gas Procurement ............................................................................................. 6-1
1. Portfolio Overview...................................................................................... 6-1
2. Natural Gas Procurement .......................................................................... 6-2
a. PG&E Generation................................................................................ 6-2
b. PG&E Tolling Agreements................................................................... 6-2
c. PG&E’s Gas Supply Transactions Are Fully Compliant with Commission Guidance......................................................................... 6-5
1) PG&E Transacted Using Approved Products for Purchase or Sale........................................................................................... 6-5
2) PG&E Transacted Using Approved Procurement Processes........ 6-6
3) PG&E Transacted Within BPP Procurement Limits ...................... 6-6
4) PG&E Consulted With Its PRG as Required ................................. 6-6
d. Compliance with Ruby Pipeline Decision Requirements ..................... 6-7
C. Distillate Expenses ........................................................................................... 6-8
D. Water Purchased for Power ............................................................................. 6-8
E. Nuclear Fuel Expenses .................................................................................... 6-8
F. Nuclear Fuel Carrying Costs .......................................................................... 6-10
G. STARS Alliance.............................................................................................. 6-10
H. Electric Portfolio Hedging ............................................................................... 6-11
1. Background.............................................................................................. 6-11
2. All Transactions Complied with Approved Products and Approved Transaction Processes............................................................................. 6-11
3. PG&E Consulted with the PRG as Required............................................ 6-11
4. Transaction Compliance Reports............................................................. 6-12

PACIFIC GAS AND ELECTRIC COMPANYCHAPTER 6
GENERATION FUEL COSTS ANDELECTRIC PORTFOLIO HEDGING
TABLE OF CONTENTS(CONTINUED)
6-ii
5. PG&E Compliance with Its Hedging Targets............................................ 6-12
a. PG&E’s Hedging Positions, as Measured Against the Hedging Targets, Were Compliant with the Adopted Hedging Plan................. 6-12
b. PG&E’s Portfolio Position Has Been Fundamentally Affected by the Load Shift to Community Choice Aggregators............................. 6-13
c. PG&E’s Hedging Activities During the Record Period Were Compliant with the Hedging Plan....................................................... 6-13
6. PG&E Transacted Within BPP Procurement Limits ................................. 6-14
I. Internal Procedures and Controls................................................................... 6-15
1. Segregation of Duties............................................................................... 6-15
2. Risk Management Policies....................................................................... 6-15
3. Prescriptive Hedging Plan........................................................................ 6-16
4. Controls Framework................................................................................. 6-16
J. Conclusion...................................................................................................... 6-17

6-1
PACIFIC GAS AND ELECTRIC COMPANY1
CHAPTER 62
GENERATION FUEL COSTS AND3
ELECTRIC PORTFOLIO HEDGING4
A. Introduction5
This chapter reviews actions taken by Pacific Gas and Electric Company 6
(PG&E) regarding generation fuel procurement for:7
PG&E-owned conventional generation;8
PG&E tolling agreements;9
Hydroelectric; and10
Diablo Canyon Nuclear Power Plant (DCPP).11
PG&E engaged in fuel procurement activities in a manner consistent with:12
its California Public Utilities Commission (CPUC or Commission)-approved 13
procurement plans; Nuclear Fuel Procurement Plan; and Commission decisions 14
addressing procurement.15
In addition, consistent with Decision (D.) 12-05-010, Ordering Paragraph 16
(OP) 3, PG&E is also providing in this chapter a report concerning its activities 17
and operating costs associated with the STARS Alliance, LLC (STARS Alliance).18
Finally, this chapter reviews PG&E’s implementation of its 19
Commission-approved Electric Portfolio Hedging Plan (Hedging Plan) during the 20
record period from January 1 to December 31, 2017. Consistent with 21
D.11-07-039, OP 3, PG&E is also providing in this chapter a high-level 22
discussion of its internal procedures and controls for ensuring compliance with 23
its Hedging Plan.24
B. Gas Procurement25
1. Portfolio Overview26
PG&E manages natural gas procurement for its portfolio of gas-fired 27
generators, including power plants owned by PG&E and generators 28
contracted to PG&E under tolling agreements. PG&E describes its gas 29
procurement activities in the section below.30

6-2
2. Natural Gas Procurement1
a. PG&E Generation2
PG&E owned six natural gas-fired generating facilities in commercial 3
operation during the record period: Humboldt Bay Generating Station 4
(Humboldt), Gateway Generating Station (Gateway); Colusa Generating 5
Station (Colusa); and three utility-owned fuel cell generating units: 6
one at California State University, East Bay (CSUEB Fuel Cell) and 7
two at San Francisco State University (SFSU Fuel Cells). Humboldt 8
primarily burns natural gas1 and is capable of burning distillate fuel oil 9
during gas curtailments or emergencies. These facilities are listed in 10
Table 6-1 below.11
TABLE 6-1PG&E-OWNED GENERATION FACILITIES
Line No. Name Location
Capacity (megawatts
(MW)) Technology
Heat Rate(Millions of British
Thermal Units (MMBtu)/megawatt-hours(MWh))
1 Gateway Antioch, CA 530 Combined Cycle Gas Turbine
7.2
2 Colusa Maxwell, CA 530 Combined Cycle Gas Turbine
7.2
3 Humboldt Eureka, CA 163 Reciprocating Engines
9.1
4 CSUEB Fuel Cell Hayward, CA 1.4 Fuel Cell 8.0(a)5 SFSU Fuel Cells San Francisco, CA 0.2 Fuel Cell 6.6(a)6 SFSU Fuel Cells San Francisco, CA 1.4 Fuel Cell 8.0(a)
_______________
(a) Manufacturers estimated heat rate.
b. PG&E Tolling Agreements12
In addition to the gas-fired generating facilities it owns, PG&E’s 13
electric portfolio includes numerous tolling agreements for gas-fired 14
generators. A tolling agreement is an agreement for generating capacity 15
and electric energy where the buyer delivers fuel to the seller and the 16
1 When burning natural gas, the units at Humboldt require a small amount of distillate fuel for ignition.

6-3
seller delivers electric energy to the buyer.2 In this case, PG&E 1
(as buyer) delivers natural gas to the owner of the generating facility 2
(the seller) and in exchange receives energy and other services. 3
PG&E dispatches these tolled facilities according to least-cost dispatch 4
principles. These agreements are listed in Table 6-2.5
2 Tolling agreements are structured arrangements that can include a variety of services including capacity, energy, and ancillary services.

6-4
TABLE 6-2PG&E’S TOLLING AGREEMENTS IN 2017
Line No. Name Location Counterparty
Capacity(MW) Technology
Heat Rate (MMBtu/MWh)
1 Badger Creek Limited Bakersfield Badger Creek Limited 42 Simple Cycle Combustion Turbine (CT)
9.4 – 10.5
2 Bear Mountain Limited Bakersfield Bear Mountain Limited 42 Simple Cycle CT 9.4 – 10.53 Calpine Peakers Various Calpine Energy Services, L.P. 495 Simple Cycle CT 10.5 - 12.84 Chalk Cliff Limited Taft Chalk Cliff Limited 42 Simple Cycle CT 9.4 – 10.55 Double C Limited Bakersfield Double C Limited 47 Simple Cycle CT 10.36 GWF Energy Hanford Hanford GWF Energy LLC 96 Simple Cycle CT 10.1 – 12.97 GWF Energy Henrietta Henrietta GWF Energy LLC 96 Simple Cycle CT 10.1 – 12.98 GWF Tracy Tracy GWF Energy LLC 323 Combined Cycle 7.8 – 8.59 High Sierra Limited Bakersfield High Sierra Limited 47 Simple Cycle CT 10.310 Kern Front Limited Bakersfield Kern Front Limited 47 Simple Cycle CT 10.311 Live Oak Limited Bakersfield Live Oak Limited 42 Simple Cycle CT 9.4 – 10.512 Los Esteros Critical Energy Facility San Jose Los Esteros Critical Energy Facility, LLC 294 Combined Cycle 8.0-9.413 Mariposa Byron Mariposa Energy 194 Simple Cycle CT 9.9 – 11.714 Marsh Landing Generating Station Antioch NRG Marsh Landing, LLC 801 Simple Cycle CT 10.2 – 12.815 McKittrick Limited McKittrick McKittrick Limited 42 Simple Cycle CT 9.4 – 10.516 O.L.S. Energy-Agnews, Inc. San Jose O.L.S. Energy-Agnews 28 Combined Cycle 8.817 Oroville Cogen Oroville Oroville Cogeneration, L.P. 8 Reciprocating Engine 14.0 – 15.018 Panoche Energy Center Firebaugh Panoche Energy Center, LLC 399 Simple Cycle CT 9.3 – 13.819 Ripon Ripon AltaGas Ripon Energy Inc. 46 Simple Cycle CT 9.4 – 10.420 Russell City Energy Center Hayward Russell City Energy Company, LLC 601 Combined Cycle 7.2 – 8.021 Starwood Power Midway Firebaugh Starwood Power-Midway, LLC 118 Simple Cycle CT 10.7–12.0

6-5
c. PG&E’s Gas Supply Transactions Are Fully Compliant with 1
Commission Guidance2
PG&E’s [Bundled Procurement Plan (“BPP”)] establishes upfront 3achievable standards and criteria for PG&E’s procurement activities 4and the recovery of procurement costs.35
With respect to natural gas procurement activities, these standards 6
and criteria include approved products, approved procurement methods, 7
approved procurement limits, and specify when consultation with the 8
Procurement Review Group (PRG) is required.9
In 2017, PG&E’s gas procurement activities met these standards 10
and criteria. A high-level review of compliance is provided in this section 11
and a detailed demonstration is provided in each of PG&E’s 12
2017 Quarterly Compliance Reports (QCR), which are included in 13
PG&E’s workpapers to PG&E’s Prepared Testimony. The confidential 14
attachments to the QCRs detail all of PG&E’s transactions for physical 15
gas supply, including product type and method of transaction. 16
1) PG&E Transacted Using Approved Products for Purchase 17
or Sale18
All of PG&E’s electric portfolio transactions for natural gas in 19
2017 were for products approved in PG&E’s 2014 BPP.4 These 20
products are found in Table A-3, Sheet 43 of PG&E’s 2014 BPP. 21
PG&E utilized following products in 2017:22
Natural Gas Physical Supply (Spot and Term);23
Physical Options on Natural Gas Supply; and,24
Gas Storage, including parking and lending.25
Table 6B-1 in Attachment B details total costs allocated to and 26
volumes burned at each generator in PG&E’s portfolio. Attachments 27
to PG&E’s 2017 QCRs detail each transaction, including 28
product type.529
3 2014 BPP, Section I, Sheet 1.4 PG&E’s 2014 BPP, which was approved in D.15-10-031, is included as part of PG&E’s
Chapter 6 confidential workpapers.5 The 2017 QCRs are included as part of PG&E’s Chapter 6 confidential workpapers.

6-6
2) PG&E Transacted Using Approved Procurement Processes1
All of PG&E’s electric portfolio transactions for natural gas in 2
2017 used procurement processes and methods approved in 3
PG&E’s 2014 BPPs. These procurement processes are found in 4
Table B-1, Sheet 56 of PG&E’s 2014 BPP. All of the transaction 5
processes PG&E used in 2017 are listed below:6
Bilateral Transactions, short-term (three months or less);7
Transparent Exchanges, including brokers; and8
Electronic Solicitations.9
For day-ahead transactions—for gas deliveries the next 10
business day, or next few business days, in the event of a weekend 11
or holiday)—bilateral and transparent exchange transactions were 12
the most common procurement process used by PG&E. For 13
longer-term transactions, most were conducted via transparent 14
exchanges and electronic solicitations. The 2014 BPP defines an 15
electronic solicitation as any competitive process where products 16
are requested from the market6 including e-mail, instant message, 17
auction platforms, telephone survey and may also be informed by 18
market prices on transparent exchanges and from brokers. 19
Attachments to PG&E’s 2017 QCRs detail each physical gas 20
transaction, including its procurement method.21
3) PG&E Transacted Within BPP Procurement Limits22
PG&E’s compliance with the 2014 BPP Pipeline Capacity 23
Procurement Limits7 is demonstrated in Table 6B-2 and compliance 24
with the Natural Gas Storage Limits8 is demonstrated in Table 6B-3.25
4) PG&E Consulted With Its PRG as Required26
PG&E is required to consult its PRG for transactions with 27
delivery periods greater than three months. For certain 28
transactions, PG&E may preview the plan or strategy prior to 29
execution, and then share the transactions executed at the next 30
6 2014 BPP, Sheet 51.7 2014 BPP, Appendix C, Section B.2, Sheets 75-76.8 2014 BPP, Appendix C, Section B.3, Sheets 76-77.

6-7
quarterly PRG meeting.9 PG&E made all required consultations 1
with its PRG as follows:2
PG&E reviewed with the PRG transactions with duration longer 3
than three months on:4
1) December 13, 2016, for the first quarter of 2017 5
(January 1-March 31, 2017);6
2) March 21, 2017, for the second quarter of 2017 7
(April 1-June 30, 2017);8
3) June 20, 2017 for the third quarter of 2017 9
(July 1-September 30, 2017); and10
4) September 19, 2017, for the fourth quarter of 2017 11
(October 1-December 31, 2017).12
In these quarterly consultations, PG&E also shared with the 13
PRG, as required by D.15-10-031, any transactions executed 14
according to the previously shared strategy or plan. A copy of each 15
PRG presentation is included in the confidential attachments to the 16
QCR, which are included as workpapers for PG&E’s Prepared 17
Testimony.18
d. Compliance with Ruby Pipeline Decision Requirements19
In its decision approving the Ruby Pipeline contract, the 20
Commission required that:21
[w]henever PG&E seeks Commission approval to recover Ruby 22Pipeline costs, PG&E shall certify that it is paying the lowest 23rate available under the Precedent Agreement. 24This certification may take the form of (a) a sworn declaration 25signed by an officer of PG&E or Ruby under penalty of perjury, 26or (b) any other form deemed acceptable by the Commission.1027
To comply with this requirement, PG&E is providing as 28
Attachment 6A to this chapter a letter from an officer of Ruby Pipeline 29
confirming that the “Most Favored Nations” provision in the PG&E 30
transportation contract with Ruby was not triggered with any other 31
shipper(s) in 2017, that is, PG&E received the lowest rate available to a 32
firm shipper with a term of one year or longer.33
9 D.15-10-031, OP 1h.10 D.08-11-032, OP 3.

6-8
C. Distillate Expenses1
In addition to natural gas, PG&E also purchases distillate as a pilot and 2
backup fuel at Humboldt. Humboldt consists of 10 reciprocating engines, 3
16.3 MW each, that burn a mix of natural gas as primary fuel and distillate as 4
pilot fuel. During times of limited natural gas delivery to the Humboldt area, the 5
units are able to burn 100 percent distillate. During the record period, PG&E 6
consumed distillate fuel for Humboldt at a total cost of $418,949. The 7
calculation is performed on industry acceptable practice of Last-In First Out 8
(LIFO) basis. The LIFO method was first approved by the Commission in Advice 9
Letter 1153-E associated with the Energy Cost Adjustment Clause (precursor to 10
Energy Resource Recovery Account (ERRA)) balancing account.11
D. Water Purchased for Power12
PG&E makes payments to various entities to obtain water for use in PG&E’s 13
hydro generation powerhouses, supplementing what is available from normal 14
inflows. These include water purchases and headwater payments. In addition, 15
PG&E pays water rights fees to the State Water Resources Control Board. 16
PG&E made water-for-power payments totaling $1,864,279 during the record 17
period. Generation benefits are not necessarily coincident within the time period 18
when the payments are made. For example, payment for a water diversion or 19
purchase may occur months after the water was obtained or used.20
E. Nuclear Fuel Expenses21
The framework for PG&E’s 2017 nuclear fuel procurement activity is 22
articulated in the Nuclear Fuel Procurement Plan included in PG&E’s 2014 BPP, 23
Appendix F. Nuclear fuel expenses are based on the amortization of the costs 24
of the in-core fuel, the actual cycle burn-up rate for the re-load, and the Diablo 25
Canyon Power Plant’s monthly generation. Each fuel re-load includes: the 26
costs of uranium; conversion services; enrichment services; fabrication; and 27
state and local use taxes, with the total costs dependent on the specific core 28
design. Table 6-3 reflects component coverage targets in PG&E’s 2014 BPP.29

6-9
TABLE 6-3 SUMMARY OF PG&E’S 2014 BPP NUCLEAR FUEL COMPONENT COVERAGE TARGETS
Table 6-411 reflects PG&E’s strategic inventory coverage targets. 1
TABLE 6-4 SUMMARY OF PG&E’S NUCLEAR FUEL STRATEGIC INVENTORY COVERAGE TARGETS
For the period of January 1 through December 31, 2017, DCPP’s recorded 2
nuclear fuel expenses for this period were . 3
During the period January 1 through December 31, 2017, DCPP’s Unit 1 4
completed its 20th cycle of operation and underwent a 61-day refueling outage. 5
The Unit started its 21st cycle of operation upon completion of the planned 6
outage. The average annual capacity factor for Unit 1 during 2017 was 7
83.3 percent. The total Unit 1 nuclear fuel expense for 2017 was . 8
During the period January 1 through December 31, 2017, DCPP’s Unit 29
continued to operate in its 20th cycle of operation. The average annual capacity 10
11 Strategic Inventory percentage is based on Separative Work Unit.

6-10
factor for Unit 2 during 2017 was 99.7 percent. The total Unit 2 nuclear fuel 1
expense for 2017 was . 2
Miscellaneous fuel expenses for 2017 include costs associated with a new 3
loss-of-coolant analysis which will be required to satisfy changing regulations by 4
the Nuclear Regulatory Commission. Nuclear Fuel Contracts executed during 5
the record period are included in Table 6B-6. The transactions were consistent 6
with the Commission-approved Nuclear Fuel Procurement Plan.7
Pursuant to D.05-09-006, PG&E agreed to provide certain information on 8
Fuelco activities and operating costs to the Commission in the annual ERRA9
compliance review proceeding. D.05-09-006 also directed PG&E to expand its 10
annual report on interactions with Fuelco to include any activities undertaken 11
outside the scope of Fuelco’s general purposes to monitor the full impact on 12
ratepayers of PG&E’s participation in Fuelco. The required data has been 13
compiled and provided in Tables 6B-4 and 6B-5. The current composition of 14
Fuelco includes Ameren Missouri and PG&E, with expenses shared on an equal 15
50 percent basis. 16
F. Nuclear Fuel Carrying Costs17
Nuclear fuel inventory carrying costs are recovered through ERRA at the 18
short-term interest rate. The nuclear fuel inventory carrying costs for 201719
are . 20
G. STARS Alliance21
OP 3 of D.12-05-010 directed PG&E to provide a report concerning its 22
activities and operating costs associated with PG&E’s participation in the 23
STARS Alliance. The objective of the STARS Alliance is to increase efficiency 24
and to reduce costs related to the operation of the members’ nuclear power 25
generation facilities. The other anticipated benefits include more efficiently 26
coordinating the purchase and location of assets necessary to ensure 27
purchasing power and effective responses to potential disruption in operations, 28
and collectively to achieve the safest and most efficient generation of electricity 29
from nuclear units.30
PG&E provides as Attachment C-1 the Annual Report of Utility on the 31
Activities of the STARS Alliance for the recorded and budget year 2017 in the 32
format required by the Commission in D.12-05-010, Appendix A. 33

6-11
Attachment C-2 also specifies the Utility Savings/Avoided Costs by STARS 1
Team/Project as required by D.12-05-010. The cost of the STARS Alliance 2
allocated to PG&E was $456,281, with the savings/avoided costs of $16,374,988 3
for all four STARS Alliance members. Based on the results for 2017, if not for 4
PG&E’s participation in the STARS Alliance, the costs to operate DCPP would 5
have been higher. Treatment of cost recovery and avoided cost aspects of 6
PG&E’s participation in the STARS Alliance is an aspect of PG&E’s General 7
Rate Case proceeding.8
H. Electric Portfolio Hedging9
1. Background10
PG&E’s 2014 BPP Hedging Plan was approved on October 22, 2015. 11
PG&E continued implementing the plan during 2017. PG&E demonstrates 12
compliance with its Hedging Plan in this section.13
2. All Transactions Complied with Approved Products and Approved 14
Transaction Processes15
During 2017, all PG&E financial transactions used only approved 16
products (2014 BPP, Appendix A, Table A-1 for electric products and 17
Table A-4 for gas products), and approved procurement processes 18
(2014 BPP, Appendix B, Table B-1). Each transaction and its approved 19
product type and transaction process is included in PG&E’s QCR filings, and 20
also summarized in Tables 6B-7 through 6B-10.21
3. PG&E Consulted with the PRG as Required22
As required by the BPP, PG&E consulted its PRG prior to executing 23
hedging transactions beyond three months in duration. PG&E reviewed with 24
the PRG its planned execution of hedges on:25
1) December 13, 2016, for hedging activities in the first quarter of 2017 26
(January 1-March 31, 2017);27
2) March 21, 2017, with a minor correction March 21, 2017, for hedging 28
activities in the second quarter of 2017 (April 1-June 30, 2017);29
3) June 20, 2017, for hedging activities in the third quarter of 2017 30
(July 1-September 30, 2017); and31
4) September 19, 2017, for hedging activities in the fourth quarter of 2016 32
(October 1-December 31, 2017).33

6-12
In each of these quarterly consultations, PG&E also shared with the 1
PRG, as required by D.15-10-031, any transactions executed according to 2
the previously shared strategy or plan. A copy of each PRG presentation is 3
included in the confidential attachments to the QCR, which are included as 4
workpapers for PG&E’s Prepared Testimony.5
4. Transaction Compliance Reports6
Transaction Compliance Reports, which are included in Attachment L of 7
each QCR, demonstrate that each financial transaction complies with each 8
of the applicable provisions of the Hedging Plan, and also with the 2014 9
BPP procurement limits. The Hedging Plan includes seven provisions that 10
can apply to each transaction, depending on the type of product transacted. 11
The compliance reports demonstrate how the transaction complied with 12
each of these provisions. 13
5. PG&E Compliance with Its Hedging Targets14
a. PG&E’s Hedging Positions, as Measured Against the Hedging 15
Targets, Were Compliant with the Adopted Hedging Plan16
As detailed in Section C.2 of the Hedging Plan, PG&E’s compliance 17
with the Plan, as measured against the Hedging Targets, is judged at 18
the end of 19
20
12 21
22
232425
Table 6B-11 demonstrates that PG&E’s hedging positions complied 26
with the Hedging Plan, as measured against the Hedging Targets, as of 27
28
29
30
31
12 PG&E’s 2014 BPP Hedging Plan, Section C.2, Hedging Targets.

6-13
1
2
b. PG&E’s Portfolio Position Has Been Fundamentally Affected by the 3
Load Shift to Community Choice Aggregators4
5
6
7
8
9
10
11
12
13
14
15
16
c. PG&E’s Hedging Activities During the Record Period Were 17
Compliant with the Hedging Plan 18
19
20
21
2223242526
1327
28
29
30
31
32
33
13 2014 BPP Hedging Plan, Section C.2., Measuring Hedge Coverage.

6-14
1
2
3
4 5 6 7 8 9
1011121314
1415
16
17
18
19202122
1523
24
25
26
27
28
29
30
6. PG&E Transacted Within BPP Procurement Limits31
PG&E’s 2014 BPP includes limits on electric energy and natural gas 32
procurement.16 These limits apply to all fixed-price energy and gas 33
contracts beyond prompt month. Figures 6B-1 and 6B-2 demonstrate PG&E 34
14 2014 BPP Hedging Plan, Section D.2, Unusual Events, Market Dislocations, and Emergencies
15 PG&E’s 2014 BPP Hedging Plan, Section C.2, Hedging Targets and Limits, emphasis added.
16 2014 BPP, Appendix C, Sections A.2 and B.1, Sheets 68-75.

6-15
compliance with these limits at the end of 2017. The compliance reports 1
included in each QCR demonstrate compliance for every transaction.2
I. Internal Procedures and Controls3
Consistent with D.11-07-039, OP 3, PG&E provides the following high-level 4
discussion of its internal procedures and controls for ensuring compliance with 5
its Hedging Plan. PG&E employs the following system of internal procedures 6
and controls to ensure compliance:7
1. Segregation of Duties8
2. Risk Management Policies9
3. Prescriptive Hedging Strategies10
4. Controls Framework11
1. Segregation of Duties12
PG&E separates the duties of executing, monitoring and tracking, and 13
settling hedging transactions among its Front Office, Middle Office and 14
Back Office. The Middle Office reports to the Chief Risk Officer, while the 15
Front Office and Back Office report to the Senior Vice President, Energy 16
Policy and Procurement.17
The Front Office is responsible for negotiating and executing 18
transactions that comply with the Hedging Plan and internal controls; and 19
ensuring the terms of the transaction are captured in PG&E’s trade 20
capture system.21
The Middle Office reviews each transaction for completeness and 22
accuracy and also establishes and manages several of the trading controls 23
in the Controls Framework. The Middle Office also reports the status of 24
hedging programs and portfolio risk measures to PG&E senior 25
management.26
The Back Office confirms non-cleared transactions with counterparties 27
and settles transactions after delivery or expiration. The Back Office is also 28
responsible for managing existing contracts.29
2. Risk Management Policies30
PG&E maintains Risk Management Policies and Standards that provide 31
guidelines to the PG&E Front, Middle and Back Offices on management and 32
control of risks associated with fluctuations in electricity and gas prices and 33

6-16
counterparty credit exposure. PG&E’s Corporation Risk Policy Committee 1
and Utility Risk Management Committee are delegated, from the Board of 2
Directors, the responsibility for ensuring that PG&E management adheres to 3
the Risk Policies and Standards. PG&E’s Middle Office monitors 4
compliance with these policies and standards and regularly measures and 5
reports market and portfolio risk to the committees.6
3. Prescriptive Hedging Plan7
PG&E’s Hedging Plan is prescriptive, that is, it specifies which positions 8
are to be hedged, which products are to be used, and the timeline for 9
execution. The Hedging Plan is periodically updated and changes are 10
implemented after final CPUC approval is received, and after internal 11
processes are modified to ensure that the updated Hedging Plan can be 12
monitored for consistency with the CPUC-approved plan and internal 13
governance requirements.14
4. Controls Framework15
The Controls Framework is centered on assuring data quality and 16
completeness, guiding trading activities with an electronic model, and 17
monitoring trader activity relative to authorized plans and counterparty credit 18
limits. Controls are separated into six categories:19
1) Electronic Model – PG&E uses an electronic model to guide its financial 20
traders in implementing the Hedging Plan. The model includes the 21
long- and short positions in PG&E’s portfolio and applies each of the 22
provisions of the Hedging Plan to these positions to determine for the 23
current trading month which products should be traded and the quantity 24
of each product. The model is refreshed overnight after each trading 25
day to ensure the portfolio positions are current. The model is 26
developed by the Middle Office in consultation with the Front Office and 27
is validated for accuracy by a separate, independent team of qualified 28
analysts also in the Middle Office.29
2) Trade Limits – PG&E sets limits on its Front Office trading activities to 30
help ensure that its traders comply with its approved Hedging Plan. 31
PG&E breaks down the annual Hedging Plan trading limits approved by 32
its risk committees into monthly limits for monitoring trading activities.33
6-17
3) Trade Preview – Prior to execution, PG&E traders preview all trades in 1
an electronic blotter system that tests each trade against their monthly 2
trade limits and counterparty credit limits. PG&E traders are not allowed 3
to execute trades that are not pre-approved by this system.4
4) Trade Capture – PG&E traders are required to enter all completed 5
transactions into a trade capture system on the day the transaction is 6
executed. PG&E’s Middle Office reviews all trades to ensure that they 7
are captured accurately in the trade capture system.8
5) Transaction Monitoring – PG&E’s risk management system provides 9
reports that monitor compliance with the risk management policies and 10
trading limits. In addition, the system tracks counterparty-credit11
exposure.12
6) Compliance Reports – PG&E developed an automated compliance 13
report that demonstrates compliance of its electric and gas financial 14
hedge trades. The report demonstrates that all the trades executed on 15
a specified trading day comply with each provision of PG&E’s 16
Hedging Plan.17
J. Conclusion18
The preceding discussion demonstrates that PG&E procured fuel for its 19
utility-owned generation facilities and tolling agreements, acquired water for 20
hydroelectric generation, and procured nuclear fuel for DCPP consistent with the 21
2014 BPP and Commission decisions addressing procurement. In addition, the 22
preceding discussion demonstrates that PG&E’s electric portfolio hedging 23
activities complied with its Hedging Plan and the 2014 BPP.24

PACIFIC GAS AND ELECTRIC COMPANY
CHAPTER 6
ATTACHMENT A
LETTER FROM RUBY PIPELINE OFFICER CERTIFYING PG&E’S
“MOST FAVORED NATIONS” (LOWEST RATE) STATUS

6-AtchA-1

PACIFIC GAS AND ELECTRIC COMPANY
CHAPTER 6
ATTACHMENT B
GENERATION FUEL COSTS

6-AtchB-1
PACIFIC GAS AND ELECTRIC COMPANY1
CHAPTER 62
ATTACHMENT B3
GENERATION FUEL COSTS 4
TABLE 6B-1 SUMMARY OF 2017 PG&E GAS DELIVERIES BY FACILITY OR TOLLING AGREEMENT
Line No. Generating Facility
Volume(a)
(Million MMBtu)
ERRACost(b)
($ Millions)
1 Oroville Cogen2 O.L.S. Energy-Agnews, Inc.3 PG&E - Gateway4 PG&E - Humboldt5 Calpine Peakers Feather River6 Calpine Peakers Yuba City7 PG&E Colusa - Maxwell8 Calpine Creed Energy Center9 Calpine Goose Haven Peaker
10 Calpine Wolfskill Peaker11 Calpine Lambie Energy Center12 Calpine King City Peaker13 Calpine Gilroy Energy Center14 Calpine Los Esteros15 GWF Tracy 16 Ripon Generation Station17 Panoche Energy Center18 Starwood Power Midway19 PG&E Fuel Cell - Hayward20 PG&E Fuel Cell - San Francisco21 Mariposa 22 NRG - Marsh Landing23 Calpine Russell City24 GWF Energy Hanford 25 GWF Energy Henrietta 26 Double C Limited 27 High Sierra Limited 28 Kern Front Limited 29 Badger Creek30 Bear Mountain31 Chalk Cliff32 Live-Oak33 McKittrick
34 Total
35 Total Unit Cost ($/MMBtu)_______________
(a) Some values for volume appear as zero due to rounding.(b) ERRA costs from Table 12-2.

6-AtchB-2
TABLE 6B-2 2017 DEMONSTRATION OF COMPLIANCE WITH
2014 BPP PIPELINE CAPACITY PROCUREMENT LIMITS(a)
Line No. Year
Actual Capacity(MMBtu/day)
Limits(b)
(MMBtu/day)
1 20172 20183 20194 20205 20216 20227 20238 2024
_______________
(a) PG&E's actual pipeline capacity holdings were allless than the 2014 BPP limits therefore PG&E wascompliant with the Pipeline Capacity ProcurementLimits in 2017.
(b) 2014 BPP, Appendix C, Table C-10, Sheet 76.
TABLE 6B-32017 DEMONSTRATION OF COMPLIANCE WITH
2014 BPP STORAGE CAPACITY PROCUREMENT LIMITS(a)
Line No. Year
Actual Withdrawal Capacity
(MMBtu/day)
Withdrawal Capacity Limit(b)
(MMBtu/day)
Actual Injection Capacity
(MMBtu/day)
Injection Capacity Limit(b)
(MMBtu/day)
Actual Inventory (million MMBtu)
Inventory Limit(b)
(million MMBtu)
1 20172 20183 20194 20205 20216 20227 20238 2024
______________
(a) PG&E's actual Withdrawal, Injection, and Inventory capacity holdings were all less than the 2014 BPPlimits therefore PG&E was compliant with the Storage Capacity Procurement Limits in 2017.
(b) 2014 BPP, Appendix C, Table C-10, Sheet 76.(c)

6-AtchB-3
TABLE 6B-4 ANNUAL REPORT OF PACIFIC ENERGY FUELS COMPANY ON THE ACTIVITIES OF FUELCO, LLC
ADMINISTRATIVE COSTS ASSOCIATED WITH THE PROCUREMENTOF NUCLEAR FUEL AND FUEL-RELATED PRODUCTS OR SERVICES
Line No. Description
Recorded Year2017
Budget Year2017
1 Total Common Costs(a)
2 Out of Pocket
3 Labor
4 Total Fuelco
5 PG&E/PEFCO Share %6 PG&E/PEFCO Share $7 Special Project Costs8 Out of Pocket(b)
9 Labor
10 Total Fuelco
11 PG&E %(c)
12 PG&E $(c)
13 Total PG&E Share $_______________
(a) Currently expensed on Fuelco books.(b) 2018 subscriptions capitalized as deferred charges on
Fuelco books.(c) Reflects composite participation in one or more projects.

6-AtchB-4
TAB
LE 6
B-5
N
UC
LEAR
FU
EL A
ND
FU
EL-R
ELAT
ED P
RO
DU
CTS
OR
SER
VIC
ESPR
OC
UR
ED B
Y PG
&E/
PEFC
O T
HR
OU
GH
FU
ELC
O (R
ECO
RD
YEA
R 2
017)
(TO
TAL
CO
ST –
$M
ILLI
ON
S)
Line
N
o.C
ontra
ctD
eliv
ery
Dat
ePr
oduc
tU
nit P
rice
Tota
l C
ost
Con
tract
D
urat
ion
Fuel
coTi
tle(Y
/N)
Mar
ket U
nit
Pric
e At
C
ontra
ct(a
,c)
Cur
rent
M
arke
t Uni
t Pr
ice(b
)

6-AtchB-5
TABLE 6B-6 NUCLEAR FUEL CONTRACTS EXECUTED IN 2017
(WITH DELIVERIES BEYOND 2017) (MILLIONS OF DOLLARS)
Line No. Contract No.
Execution Date
Term of Services Services Amount
TABLE 6B-7 SUMMARY OF PG&E ELECTRIC PORTFOLIO GAS FINANCIALTRANSACTIONS LISTED BY 2014 BPP APPROVED PRODUCT
Line No. Product
2014 BPP Table A-4
Line Number
Volume(Million MMBtu)
Notional Value
($ Millions)Number of
Trades
1 Natural Gas Futures 22 Natural Gas Futures (Basis) 23 Financial Options (Calls) and Swaptions 3
4 Total Transacted
Totals may not match sum of components due to rounding.
TABLE 6B-8 SUMMARY OF PG&E ELECTRIC PORTFOLIO GAS FINANCIAL
TRANSACTIONS LISTED BY 2014 BPP APPROVED TRANSACTION PROCESS
Line No. Product
2014 BPP Table B-1
Item Number
Volume(Million MMBtu)
Notional Value
($ Millions)Number of
Trades
1 Transparent Exchanges (Electronic Trading) 62 Transparent Exchanges (Voice Brokers) 63 Electronic Solicitations (IM or Voice) 10
4 Total Transacted
Totals may not match sum of components due to rounding.

6-AtchB-6
TABLE 6B-9 SUMMARY OF PG&E ELECTRIC PORTFOLIO ELECTRICITY FINANCIAL
TRANSACTIONS LISTED BY 2014 BPP APPROVED PRODUCT
Line No. Product
2014 BPP Table A-1
Line Number
Volume(GWh)
Notional Value
($ Millions)Number of
Trades
1 Electricity Futures 13
2 Total Transacted
TABLE 6B-10 SUMMARY OF PG&E ELECTRIC PORTFOLIO ELECTRICITY FINANCIAL
TRANSACTIONS LISTED BY 2014 BPP APPROVED TRANSACTION PROCESS
Line No. Product
2014 BPP Table B-1
Item Number
Volume(GWh)
Notional Value
($ Millions)Number of
Trades
1 Transparent Exchanges (Electronic Trading) 62 Transparent Exchanges (Voice Brokers) 6
3 Electronic Solicitations (IM or Voice) 10
4 Total Transacted

6-AtchB-7
TABLE 6B-11 COMPLIANCE WITH 2014 BPP HEDGING TARGETS
$ MILLIONS
Line No. Position 1 2 3 4 5 6
_______________
Note: Table 6B-11 provides PG&E's electric portfolio position at the end of the Plan Year,

6-AtchB-8
FIGURE 6B-1 DEMONSTRATION OF COMPLIANCE
WITH 2014 BPP ELECTRICAL ENERGY PROCUREMENT LIMITS
_______________
Note:

6-AtchB-9
FIGURE 6B-2 DEMONSTRATION OF COMPLIANCE
WITH 2014 BPP NATURAL GAS PROCUREMENT LIMITS
_______________
Note:

PACIFIC GAS AND ELECTRIC COMPANY
CHAPTER 6
ATTACHMENT C
ANNUAL REPORT OF UTILITY ON
THE ACTIVITIES OF STARS ALLIANCE, LLC
UTILITY SAVINGS/AVOIDED COSTS BY
STARS TEAM/PROJECT

Recorded Year 2017 Budget Year 2017
Total Common Costs (1)Labor, Benefits, & Bonus $ 356,265 $ 364,800 Travel Expenses $ 329,484 $ 544,835 Non-travel Meals $ 43,122 $ 25,000
Sub-Total Labor, Benefits & Bonus $ 728,871 $ 934,635 Contractor Support $ 330,707 $ 294,400 Legal $ 210,003 $ 126,500 Office Supplies & Expenses $ 79,946 $ 32,000 Building Lease/Utilities $ 229,311 $ 240,000 Communications $ 18,217 $ 30,000 Insurance $ 7,604 $ 16,000 Infrastructure $ 112,839 $ 145,654 Office Furniture & Equipment $ 95,155 $ 17,396 Computer Equipment $ 12,470 $ 8,850
Total STARS Alliance $ 1,825,123 $ 1,845,435 Utility Share (%) 25% 25%Utility Share ($) $ 456,281 $ 461,359
Total Utility Share $ 456,281 $ 461,359
(1) Currently expensed on STARS Alliance books.
ATTACHMENT C
ANNUAL REPORT OF UTILITY ON THE ACTIVITIES OF STARS ALLIANCE, LLCRECORDED YEAR 2017 AND BUDGET YEAR 2017
(All Data in Whole Numbers)
6-AtchC-1

STARS TotalEmergency Planning Peer Team $ 207,411Regulatory Affairs Peer Team $ 42,880Supply Chain (STARS Contracts) $ 12,221,425Rebates $ 3,903,272
Total Savings / Avoided Costs $ 16,374,988
UTILITY SAVINGS / AVOIDED COSTS BY STARS TEAM / PROJECT(All Data in Whole Numbers)
Teams / Projects may change annually based upon the needs of the Utility and STARS
6-AtchC-2

PACIFIC GAS AND ELECTRIC COMPANY
CHAPTER 7
GREENHOUSE GAS COMPLIANCE
INSTRUMENT PROCUREMENT

7-i
PACIFIC GAS AND ELECTRIC COMPANYCHAPTER 7
GREENHOUSE GAS COMPLIANCEINSTRUMENT PROCUREMENT
TABLE OF CONTENTS
A. Introduction and Bundled Procurement Plan Background................................ 7-1
B. Background Information ................................................................................... 7-2
1. Assembly Bill 32 Cap-and-Trade Program................................................. 7-2
2. Electric Sector GHG Emissions ................................................................. 7-3
3. PG&E’s GHG Compliance Instrument Procurement Authority ................... 7-4
C. PG&E’s GHG Procurement Activity During the Record Period......................... 7-4
1. Facilities Comprising PG&E’s Direct GHG Costs....................................... 7-5
2. PG&E’s GHG Procurement Activity ........................................................... 7-5
3. PG&E’s GHG CARB Auction Procurement Activity.................................... 7-6
4. PG&E’s GHG Market Transactions Procurement Activity .......................... 7-7
D. PG&E Complied With the GHG Procurement Plan .......................................... 7-8
1. 2014 BPP GHG Procurement Strategy...................................................... 7-8
2. Procurement Limits for GHG Products....................................................... 7-8
E. Conclusion...................................................................................................... 7-10

7-1
PACIFIC GAS AND ELECTRIC COMPANY1
CHAPTER 72
GREENHOUSE GAS COMPLIANCE3
INSTRUMENT PROCUREMENT4
A. Introduction and Bundled Procurement Plan Background5
The California Air Resources Board (CARB) Cap-and-Trade regulation 6
established requirements for emissions reporting and compliance 7
demonstrations by covered entities. Pacific Gas and Electric Company (PG&E)8
has a need to procure greenhouse gas (GHG) compliance instruments to satisfy 9
its compliance obligation as a covered entity and to fulfill certain contractual 10
requirements.11
This chapter describes the GHG compliance instrument procurement 12
activities undertaken by PG&E, pursuant to its 2014 Bundled Procurement Plan 13
(BPP) during the January 1 through December 31, 2017 record period.114
PG&E’s 2014 BPP addresses the means, strategies, and limits applicable to 15
PG&E’s procurement of GHG compliance instruments. 16
This testimony and supporting workpapers demonstrate that PG&E’s 2017 17
GHG compliance instrument procurement activities complied with the 18
requirements established in the 2014 BPP. This testimony also describes 19
PG&E’s bundled electric GHG procurement regulatory framework to illustrate 20
those requirements impacting PG&E’s management of its GHG procurement 21
plan. Specifically:22
Section B describes the regulatory authority impacting PG&E’s GHG 23
procurement, including: (1) an overview of the CARB Cap-and-Trade 24
Program to regulate GHG emissions; (2) a description of CARB 25
requirements to calculate GHG emissions for covered entities in the electric 26
generation sector; and (3) a summary of the regulatory authority the 27
California Public Utilities Commission (Commission) provides to PG&E to 28
procure GHG compliance instruments on behalf of its bundled electric 29
portfolio.30
1 The 2014 BPP was approved by the Commission in Decision (D.) 15-10-031.

7-2
Section C describes the resources that comprised PG&E’s direct physical 1
obligation to procure compliance instruments during the record period, 2
including those emissions generated by Utility-Owned Generation (UOG) 3
and imported electricity, as well as any PG&E contracts with physical 4
settlement of GHG compliance instruments, and describes the means by 5
which PG&E procured GHG compliance instruments, including an 6
accounting of PG&E’s GHG procurement activities during the record period 7
related to PG&E’s direct physical obligation.8
Section D shows that PG&E complied with the requirements set forth in the 9
2014 BPP to procure GHG compliance instruments, including limits on GHG 10
compliance instrument procurement.11
Together, this testimony and the supporting workpapers demonstrate that 12
PG&E’s 2017 GHG compliance instrument procurement activities complied with 13
its 2014 BPP.214
B. Background Information15
This section describes CARB and Commission requirements relevant to 16
PG&E’s procurement of GHG compliance instruments for the bundled electric 17
portfolio. This section also establishes that GHG procurement activities are 18
reviewed for compliance with the 2014 BPP in this proceeding.19
1. Assembly Bill 32 Cap-and-Trade Program20
Assembly Bill 32 is California’s landmark GHG legislation that requires 21
the reduction of statewide GHG emissions to 1990 levels by 2020. To this 22
end, the CARB promulgated a statewide Cap-and-Trade regulation that 23
established a market based price for GHG emissions.24
For the electric generation sector, covered entities include operators of 25
any facility that annually emits at least 25,000 metric tons of carbon dioxide 26
equivalents (mtCO2e).3 Facilities are required to obtain and surrender 27
compliance instruments equivalent to the GHG emissions for each such 28
facility. Importers of electricity into California are also responsible for 29
obtaining and surrendering compliance instruments for GHG emissions 30
2 See 2014 BPP, Appendices C and G.3 Units of GHG are typically measured in terms of mtCO2e.

7-3
deemed to be associated with electricity imports for purposes of compliance 1
with Cap-and-Trade.2
There are two types of compliance instruments: (1) allowances, which 3
are limited tradable authorizations created by CARB to emit up to 1 mtCO2e;4
and (2) offset credits, which are tradable compliance instruments issued by 5
CARB that represent verified reductions of 1 mtCO2e from projects whose 6
emissions or avoided emissions are not from a source covered under the7
Cap-and-Trade Program. For compliance purposes, an offset credit and an 8
allowance have limited differences. Allowances have a unique vintage year 9
and each vintage may be used in the vintage year issued or in future years,10
but future vintage allowances may not be used to satisfy any compliance 11
obligations prior to the vintage year. For example, 2019 vintage allowances 12
can be used to fulfill 2019 or 2020 obligations, but not 2016 obligations.13
Unlike an allowance, an offset credit is not limited by vintage and can be 14
utilized for any surrender year. However, an entity can only use offset 15
credits to meet up to 8 percent of its compliance obligation in any 16
compliance period. In addition, CARB’s Cap-and-Trade regulation allows 17
CARB to invalidate an offset credit for errors, regulatory violations, or fraud.418
2. Electric Sector GHG Emissions19
For the electric generation sector, CARB requires specific 20
methodologies to calculate emissions from electricity generating facilities 21
located in the state of California (in-state facilities) and a separate 22
methodology is required to calculate emissions for electricity imported into 23
the state of California (imported electricity). For in-state electric generation24
facilities, carbon dioxide equivalent (CO2e) compliance obligations are 25
calculated based upon the combustion of fossil fuel used, and not the 26
electrical energy produced. PG&E’s UOG facilities and all facilities 27
associated with its tolling contracts are entirely located in the state of 28
California. For imported electricity, CO2e emissions are calculated based on 29
the electrical energy imported. The compliance obligation associated with 30
4 In event of invalidation, CARB requires the party holding the offset to replace within six months of notification.

7-4
imported electricity emissions may be further reduced through adjustments1
for certain renewables procurement and qualified exports.2
3. PG&E’s GHG Compliance Instrument Procurement Authority3
On April 19, 2012, the Commission issued D.12-04-046, authorizing 4
PG&E to procure GHG compliance instruments and requiring PG&E to 5
update its 2010 BPP to incorporate the modifications made in that decision, 6
including annual procurement limits. Following that decision, PG&E 7
amended its 2010 BPP to include a GHG Procurement Plan approved by 8
the Commission in late 2012.5 PG&E’s GHG Procurement Plan was 9
subsequently modified in 2014 to reflect changes in regulatory and market 10
conditions.6 In October 2015, the Commission issued D.15-10-031, 11
approving PG&E’s 2014 BPP, which included an amended GHG 12
Procurement Plan and GHG Procurement Limits.13
PG&E’s 2014 BPP addresses the GHG-related procurement authority 14
necessary for PG&E to comply with the obligations associated with the 15
Cap-and-Trade Program. It establishes that PG&E has a need to procure 16
GHG compliance instruments to satisfy its compliance obligation as a 17
covered entity and to fulfill certain contractual requirements. PG&E’s 2014 18
BPP further addresses the means and strategies by which PG&E procures 19
GHG compliance instruments and the limits applicable to such procurement20
and those annual GHG Procurement Limits associated with GHG 21
compliance instrument procurement.22
C. PG&E’s GHG Procurement Activity During the Record Period23
Section B describes the regulatory authority and Commission proceedings 24
to review GHG compliance instrument procurement activities. Section C details 25
the resources in PG&E’s bundled electric portfolio which required PG&E to 26
engage in the GHG compliance instrument procurement activities reviewed in 27
5 In October 2012, the Commission issued Resolution E-4544, approving PG&E’s 2010 BPP, authorizing PG&E to procure allowances and offsets.
6 In December 2013, PG&E filed Advice Letter 4331-E concerning updates to its GHG Plan to reflect updated market and regulatory conditions. Resolution E-4660approved certain changes requested by Advice Letter 4331-E, and PG&E filed Advice Letter 4499-E to comply with the resolution. Advice Letter 4499-E was approved on October 15, 2014.

7-5
this proceeding. This section also details PG&E’s procurement activity in the 1
record period, and describes the actions PG&E took to comply with its 2014 BPP 2
during the course of that procurement.3
1. Facilities Comprising PG&E’s Direct GHG Costs4
PG&E may procure compliance instruments associated with qualifying 5
UOG, imported electricity, and certain tolling facilities where GHG 6
obligations associated with the contract are physically-settled with 7
compliance instruments.78
During the record period, PG&E procured compliance instruments for 9
anticipated GHG obligations related to imported electricity and three of its 10
UOG electric generation facilities: (1) Colusa Generating Station; (2) 11
Gateway Generation Station; and (3) Humboldt Bay Generation Station. 12
During the record period, PG&E did not procure GHG compliance 13
instruments to satisfy contractual obligations to its tolling counterparties 14
because PG&E did not have contractual obligations to physically procure 15
GHG compliance instruments for its tolling counterparties. 16
17
.818
2. PG&E’s GHG Procurement Activity19
Emissions allowances are issued by CARB, and CARB sells allowances 20
through quarterly auctions. CARB also issues offsets credits pursuant to 21
specific protocols set forth in the Cap-and-Trade Regulation. In addition, 22
compliance instruments are available for purchase bilaterally or through the 23
market. 24
25
26
7 Monthly invoices associated with these contracted facilities are available as part of Master Data Request 58 and provide detail concerning fuel quantities associated withPG&E’s physical settlement of GHG.
8

7-6
TABLE 7-1 TRANSACTIONS EXECUTED DURING RECORD PERIOD
TABLE 7-2 PG&E’S PROCURED GHG COMPLIANCE INSTRUMENTS IN THE 2017 RECORD PERIOD
Line No. Procured GHG Compliance Instruments
Quantity (MTCO2e) Cost ($)
Average Cost per Compliance
Instrument (Calculated)
1 Allowances Procured from CARB Auctions2 Allowances Procured from Third Parties
3 Allowances Total
4 Offsets Procured from Third-Parties5 Instruments with Future Vintages procured in the Record
Period (Do not qualify for the current Cap-and-Trade compliance period of 2015-2017)
6 Total Instruments Procured that qualify for the current Cap-and-Trade compliance period of 2015-2017
7 Total Instruments Procured in 2017
3. PG&E’s GHG CARB Auction Procurement Activity1
CARB holds quarterly auctions of current vintage and future vintage2
allowances. The current vintage auction may include allowances of any 3
vintage that can be used in the current year. During the record period,4
CARB made available current vintage allowances (i.e., 2017 vintage and 5
unsold earlier vintage allowances) and future vintage (i.e., 2020)6
allowances. Each quarterly auction has a published settlement price.7
Annually, CARB sets a floor price for its auctions. In 2017, the floor price 8
was $13.57 per allowance.99
9 https://www.arb.ca.gov/cc/capandtrade/auction/auction_archive.htm.

7-7
1
2
3
10 4
5
6
7
8
9
10
11
12
13
14
15
16
17
4. PG&E’s GHG Market Transactions Procurement Activity18
19
.20
21
22
23
24
25
26
27
28
10

7-8
D. PG&E Complied With the GHG Procurement Plan1
This Section D demonstrates that PG&E’s procurement complied with its 2
2014 BPP. First, PG&E’s GHG procurement adhered to the relevant elements 3
of and strategies established in the 2014 BPP. This section also demonstrates 4
that PG&E’s GHG procurement activities complied with the limits established in 5
the 2014 BPP.6
1. 2014 BPP GHG Procurement Strategy7
PG&E’s 2014 BPP includes elements of PG&E’s GHG procurement 8
strategy.11 The strategy defines how PG&E will participate in the GHG 9
market to procure necessary compliance instruments to comply with the 10
Cap-and-Trade Program and meet physical contractual obligations. 11
12
13
14
15
16
17
18
19
20
21
22
2. Procurement Limits for GHG Products23
The 2014 BPP includes GHG Purchase Limits.12 The GHG Purchase 24
Limit establishes the maximum amount of GHG products PG&E may 25
purchase in the current year to fulfill its “direct compliance obligation,” 26
defined as the tons of emissions for which PG&E has an obligation to retire 27
allowances on its own behalf as a regulated entity under CARB’s 28
Cap-and-Trade Program, and/or is otherwise obligated to procure for a 29
third party. A “purchase” is defined as taking title of the GHG product 30
11 See 2014 BPP, Appendix G, Section D, Sheets 133-144.12 See 2014 BPP, Appendix C, Section C, Sheets 77-81 (regarding GHG
procurement limits).

7-9
(i.e., allowance or offset) when it is delivered. Thus, forward purchases 1
count against the procurement limit when the product is delivered, which 2
may not be the same year the transaction is executed.3
Tables 7-3 demonstrate that PG&E transacted within its 2017 GHG 4
Purchase Limit established by its 2014 BPP. Specifically, Table 7-3 shows 5
that GHG procurement by PG&E in 2017 did not exceed the GHG 6
Purchase Limit.137
As set forth in D.12-04-046 and in the 2014 BPP, PG&E’s GHG 8
Purchase Limit is calculated as: 9
LCY = A + (100% * FDCY) + (60% * FDCY+1) + (40% * FDCY+2) + 10
(20% * FDCY+3)11
Where: 12
– L is the maximum number of GHG Products PG&E can purchase for13
purposes of meeting its direct compliance obligation;14
– CY is Current Year, i.e., the year in which PG&E is transacting in the15
market;16
– A is PG&E’s net remaining compliance obligation to date, calculated as17
the sum of the actual emissions for which PG&E is responsible for18
retiring GHG Products (or obligated to purchase for a third party) up to19
the Current Year, minus the total GHG Products PG&E has purchased20
up to the Current Year that could be retired against those obligations;21
and22
– FD is PG&E’s “forecasted compliance obligation” or the projected23
amount of emissions for which PG&E is responsible for retiring GHG24
Products (or obligated to purchase for a third party) calculated using an25
Implied Market Heat Rate (IMHR) that is two-standard deviations above26
the expected IMHR.27
13 2014 BPP, Sheet 81.

7-10
TABLE 7-3 2017 GHG PRODUCTS PURCHASED BY PG&E COMPARED TO GHG LIMIT
MILLION MTCO2E
As shown in Table 7-3, PG&E’s purchases of GHG compliance 1
instrument products did not exceed the GHG Purchase Limit of 2
. The quarterly PRG presentations concerning GHG compliance 3
instrument procurement and attachments included in each Quarterly 4
Compliance Report also demonstrate that PG&E complied with its GHG 5
Purchase Limit.14 These documents are included as confidential 6
workpapers to support PG&E’s Prepared Testimony in this proceeding. 7
The PRG presentations are also included.8
E. Conclusion9
This chapter, as well as information included in PG&E’s workpapers to this 10
chapter, demonstrates that during the 2017 record period, PG&E’s procurement 11
of GHG compliance instruments complied with the requirements the 2014 BPP 12
because PG&E utilized the means, strategies and limits described therein.13
14 See Fourth Quarter 2017 Bundled Electric GHG Update, p. 8, included with Fourth Quarter GHG Workpapers.
PACIFIC GAS AND ELECTRIC COMPANY
CHAPTER 8
CONTRACT ADMINISTRATION

8-i
PACIFIC GAS AND ELECTRIC COMPANYCHAPTER 8
CONTRACT ADMINISTRATION
TABLE OF CONTENTS
A. Introduction....................................................................................................... 8-1
B. Contract Management and Electric Settlement Process .................................. 8-1
1. Overview.................................................................................................... 8-1
2. Contract Review, Interpretation and Administration ................................... 8-2
3. Active Compliance Monitoring.................................................................... 8-3
4. Construction Monitoring and Performance Testing .................................... 8-4
a. Construction Monitoring and Safety..................................................... 8-4
b. Performance Testing ........................................................................... 8-5
5. Settlement and Payment............................................................................ 8-5
6. Dispute Resolution..................................................................................... 8-7
7. Tools, Systems and Controls ..................................................................... 8-8
C. Contract Administration During the Record Period......................................... 8-10
1. Procurement Programs and Solicitations................................................. 8-10
a. Solar Photovoltaic.............................................................................. 8-10
b. ReMAT .............................................................................................. 8-11
c. BioMAT.............................................................................................. 8-11
d. Energy Storage.................................................................................. 8-12
e. Resource Adequacy .......................................................................... 8-12
f. Renewable Energy Sales .................................................................. 8-12
2. Contracts Executed.................................................................................. 8-13
3. Project Development and Construction Monitoring Results ..................... 8-13
4. Contracts That Began Delivery ................................................................ 8-13
5. Contract Amendments, Consents to Assignment and Other Agreements.................................................................................... 8-14

PACIFIC GAS AND ELECTRIC COMPANYCHAPTER 8
CONTRACT ADMINISTRATION
TABLE OF CONTENTS(CONTINUED)
8-ii
6. Force Majeure Claims.............................................................................. 8-14
7. Disputes ................................................................................................... 8-14
a. Alpaugh 50, LLC; Alpaugh North, LLC; CED Corcoran Solar, LLC; and CED White River Solar, LLC (PG&E Log Nos. 33R118, 33R119, 33R121, 33R122)................................................................ 8-14
b. Hecate Energy Molino LLC (PG&E Log No. 40S003)........................ 8-15
c. Coalinga Cogeneration Company (PG&E Log No. 25C124QTR)...... 8-15
d. Panoche Energy Center (PG&E Log No. 33B076) ............................ 8-15
e. Global Ampersand, LLC, El Nido Biomass Facility and Chowchilla Biomass Facility (PG&E Log Nos. 33R016 and 33R017) .................. 8-15
8. Contracts That Expired or Terminated ..................................................... 8-16
D. Other Matters ................................................................................................. 8-16
1. Poco Power, LLC v. PG&E ...................................................................... 8-16
2. Orion Solar I, LLC (PG&E Log No. 33R162) ............................................ 8-17
3. Thermal Energy Development Corporation (PG&E Log No. 16P054)...... 8-17
E. Request for Approval of Amendments............................................................ 8-17
1. Crockett Cogeneration Co (PG&E Log No. 01C045) ............................... 8-18
F. Conclusion...................................................................................................... 8-18

8-1
PACIFIC GAS AND ELECTRIC COMPANY1
CHAPTER 82
CONTRACT ADMINISTRATION3
A. Introduction4
Pacific Gas and Electric Company’s (PG&E) Energy Contract Management 5
and Settlements (ECMS) Department administers PG&E’s energy procurement 6
contracts and payments with counterparties. 7
During the record period, PG&E complied with the California Public Utilities 8
Commission’s (CPUC or Commission) Standard of Conduct 4 (SOC4), adopted 9
in Decision (D.) 02-10-062 and elaborated on in D.02-12-069, D.02-12-074, 10
D.03-06-076, and D.05-01-054, regarding prudent contract administration. This 11
chapter describes PG&E’s contract administration practices, changes that 12
occurred to the contracts administered, and the results achieved with regard to 13
contract administration during the record period. The monthly energy purchases14
and costs incurred during the record period are shown in Table 8-1 at the end of 15
this chapter.16
In this chapter, PG&E will demonstrate that it complied with SOC4 with 17
regards to prudent contract administration during the record period by providing:18
1. An overview of ECMS processes, including contract administration during 19
the developing and operational phases of a contract, with descriptions of 20
tools, systems and controls. Additional information about ECMS processes, 21
tools, systems and controls is provided in PG&E’s confidential workpapers 22
for Chapter 8.23
2. A summary of contract activities that occurred during the record period 24
including: (1) programs and solicitations; (2) contracts executed; (3) project 25
development and construction monitoring; (4) contracts that began delivery, 26
(5) contract amendments, consents to assignment and other transactions; 27
(6) force majeure claims; (7) disputes, (8) contracts that expired or 28
terminated; (9) other matters, and (10) amendments requiring approval.29
B. Contract Management and Electric Settlement Process30
1. Overview31
Once a contract or transaction is executed, administration and 32
settlement of the contract or transaction becomes the responsibility33

8-2
of ECMS. ECMS uses a number of tools, systems, and controls to 1
administer contracts, and follows processes and procedures to ensure that 2
transactions, new contracts, and amendments to existing contracts are 3
implemented and administered consistently with the terms and conditions 4
contained in each agreement. In general, ECMS processes involve:5
Contract review, interpretation, and administration;6
Active compliance monitoring;7
Construction monitoring and performance testing;8
Settlement and payment;9
Dispute resolution; and10
Tools, systems, and controls.11
Each of these processes is described in more detail below.12
2. Contract Review, Interpretation and Administration13
Prior to contract execution, Contract Managers review each proposed14
transaction and work with the assigned Settlements Analyst and15
Commercial Lead for the transaction to ensure that agreements can be16
administered by ECMS.17
The ECMS Director approves each proposed transaction on behalf of 18
ECMS, as applicable, after the Commercial Lead provides a summary of the 19
transaction and discusses unique provisions. ECMS staff summarizes the20
transaction from a contract administration perspective and answers any21
questions.22
Once a contract is executed, assigned Contract Managers review the23
contract to determine the actions required to ensure compliance with the 24
provisions that are either PG&E’s or the counterparty’s responsibility.25
Contract Managers enter contract deadlines, requirements and tasks in the 26
Task Tracking Tool (T3) and review data entries in the Consolidated Energy 27
Contract Management (CECM) Database. Contract Managers meet28
with key internal groups to review these documents, respond to questions,29
obtain uniform understanding of the terms of each transaction, and meet 30
with the assigned Settlements Analyst to review contract provisions31
regarding payment prior to the commercial operation date and the first 32
settlement month, and following initial delivery of contracted products.33

8-3
In addition to this contract review, ECMS reviews and interprets the 1
contract throughout its term in response to specific questions from other2
PG&E business groups, or as issues arise. Contract Managers also provide3
support and guidance to the business groups on the use of the ECMS tools 4
and systems.5
3. Active Compliance Monitoring6
PG&E ensures compliance with contract terms by continual monitoring 7
of contract requirements throughout the contract term. Such activities 8
involve tracking contract milestones and deadlines, ensuring that PG&E and 9
the contract counterparties comply with all contract provisions, and 10
monitoring performance for projects that are already delivering contracted 11
products to PG&E. ECMS reviews construction progress reports for 12
contracts that have construction milestones and verifies the commercial 13
operation date certification by the counterparties’ independent licensed 14
engineers, as applicable. PG&E also specifically monitors Renewable 15
Portfolio Standard (RPS) contracts consistent with the Commission’s 16
request that each utility ensure that Renewable Energy purchases are from 17
an Eligible Renewable Energy Resource, as defined in California Public 18
Utilities Code Section 399.12.19
During the record period, ECMS and other groups in Energy Policy and 20
Procurement conducted the following active monitoring activities in relation 21
to renewable generation from RPS contracts:22
Periodic review of the California Energy Commission (CEC) website and 23
verification that the counterparty’s facility is pre-certified as a renewable 24
resource before the facility begins delivering electricity to PG&E, and 25
remains fully-certified throughout the delivery term.26
Verification that counterparty’s account is set up in the Western 27
Renewable Energy Generation Information System (WREGIS). Review 28
and verification of Renewable Energy Certificate (REC) transfers from a 29
facility to PG&E via the WREGIS website and verification that metered 30
volumes generated by RPS certified facilities match the REC quantities 31
received. PG&E works with counterparties and WREGIS to identify why 32
any REC deficits occurred and resolve REC deficits. If REC deficits are 33

8-4
unresolved, then PG&E will adjust invoices as applicable under the 1
Power Purchase Agreements (PPA).2
Verification that the counterparties delivering to PG&E attest in each 3
invoice submitted to PG&E that the facilities in connection to their 4
contracts remain: (1) certified by the CEC as a California RPS eligible 5
resource; and (2) registered with WREGIS as a Generating Unit (as 6
defined in the WREGIS Operating Rules). 7
4. Construction Monitoring and Performance Testing8
a. Construction Monitoring and Safety9
Contract Managers and Engineers monitor the development of 10
counterparty energy projects, generally from contract execution through 11
commercial operation. Typically, a contract requires the counterparty to 12
provide written progress reports on the project’s development status to 13
PG&E on a monthly or quarterly basis. The assigned Engineer and14
Contract Manager review these reports. When further information is 15
deemed necessary, a follow-up conference call with counterparty 16
personnel and a site inspection may be conducted to ensure that PG&E 17
has an accurate understanding of project status.18
During construction monitoring, PG&E reviews and tracks 19
development activities, including: site control; permitting;20
interconnection; financing; construction; and safety. Local, state, and 21
federal agencies that have review and approval authority over the 22
generation facilities are charged with enforcing safety, environmental,23
and other regulations for the project, including decommissioning.24
Safety is also addressed as part of a generator’s interconnection 25
process, which requires testing for safety and reliability of the 26
interconnected generation. PG&E’s general practice is to declare that 27
a facility under contract has commenced deliveries under the contract 28
only after the interconnecting utility and the California Independent 29
System Operator (CAISO) have concluded such testing and given 30
permission to commence commercial operations.31

8-5
b. Performance Testing1
Some contracts require the counterparty to periodically demonstrate 2
the performance capabilities of the applicable generating station(s) 3
through testing. Engineers witness performance tests of counterparties’ 4
generating stations. Performance testing typically determines a facility’s 5
full-load generating capacity and heat rate. Performance test-related 6
activities include developing test procedures, witnessing tests, and 7
reviewing and approving test reports/results. The test results are 8
reported to various organizations within PG&E.9
5. Settlement and Payment10
The Electric Settlements section within ECMS is responsible for 11
ensuring the proper settlement of all contracts in PG&E’s electric portfolio,12
including: RPS contracts; Tolling agreements; Qualifying Facility (QF) 13
Must-Take agreements; agreements from the Qualifying Facility and 14
Combined Heat and Power (QF/CHP) Settlement; Feed-In Tariff (FIT) 15
agreements; Resource Adequacy (RA) purchase agreements; Irrigation 16
Districts and Water Agencies (ID&WA) legacy contracts; and Power Trading 17
Master agreements.18
The purpose of the settlement process is to ensure that all contract 19
payments are in accordance with the terms and conditions of each contract,20
and that these costs are fully documented and properly reported in PG&E’s 21
financial systems. The settlement process includes: the collection and 22
validation of generation; generator scheduling, and outage data; 23
the collection of pricing from market indices; the calculation and generation 24
of invoices; and the preparation of payment data for the Accounts Payable 25
Department. Settlement data is collected from various sources, including:26
PG&E’s metering systems; the CAISO; other PG&E departments; various 27
price indices; and the generators themselves. The settlements cycle 28
generally takes up to 25 calendar days to process all invoices through 29
calculation, approval, and payment.30
After each month’s settlement activities are complete, Electric 31
Settlements prepares additional financial and other reports.32
Electric Settlements also oversees process improvements on other 33
information systems in Energy Policy and Procurement so that the 34

8-6
Information Technology tools are maintained to keep pace with additional 1
contract requirements. Additional responsibilities include: maintaining and 2
testing Energy Policy and Procurement’s internal controls in accordance 3
with Sarbanes-Oxley requirements; and acting as the principal liaison to 4
PG&E’s Corporate Accounting Department concerning energy-related 5
disclosures for compliance reporting purposes.6
Electric Settlements currently has four distinct areas of responsibility:7
(1) RPS Settlements; (2) Tolling Settlements; (3) QF/CHP and FIT 8
Settlements; (4) and CAISO Settlements and Reporting. These functions 9
and the tools that support these functions are described below:10
RPS Settlements: Responsible for invoice validation and payment 11
processing of all RPS contracts, bilateral purchase and sales contracts 12
which include Power Trading Master agreements (including all electric 13
financial instruments), and RA purchase agreements.14
Tolling Settlements: Responsible for the invoice validation and 15
payment processing of all conventional natural gas tolling contracts and 16
the quarterly Greenhouse Gas (GHG) invoices from the California Air 17
Resources Board.18
QF/CHP and FIT Settlements: Responsible for administering and 19
settling the QF Must-Take agreements, ID&WA legacy contracts, and 20
the form agreements that arose from the QF/CHP Settlement and were21
approved by the CPUC in D.10-12-035. In addition, this group settles 22
the FIT agreements promulgated by California Assembly Bill (AB) 1969, 23
AB 1613, Senate Bill (SB) 32 Renewable Market Adjusting Tariff 24
(ReMAT), and SB 1122 Bioenergy Market Adjusting Tariff (BioMAT).25
CAISO Settlements and Reporting: Responsible for validation, 26
settlement and reporting of procurement costs and generation revenues 27
associated with PG&E’s participation in the CAISO electricity markets as 28
described in Chapter 9. Provides reporting data and analysis to internal29
organizations for the monthly Corporate Accounting close, the30
Controller’s Gross Margin Analysis, WREGIS data submittal, RPS31
reports, the 10-Q/10-K processes, GHG and various internal and 32
external requests using the following tools:33

8-7
– Qualifying Facilities Information Center (QIC): The QIC system 1
is a tool used to administer QF contracts. QIC is a database for 2
information about each QF contract, including: delivery and 3
payment history; scheduled maintenance outages; performance 4
factors; curtailment information; and meter data. Electric 5
Settlements also uses QIC to generate payment invoices.6
This system is in the process of being replaced by OpenLink 7
Endur described below.8
– OpenLink Endur: The OpenLink Endur system provides a module 9
for managing, invoicing, and reporting all power trading activities.10
Electric Settlements uses the Endur system to review generation 11
data and to invoice transactions. This system is gradually being 12
phased in to replace QIC described above. In 2017, AB 1969, 13
ReMAT, QF/CHP, and about three quarters of RPS bilateral 14
contracts were settled in the Endur system. The remaining 15
contracts are expected to be migrated from QIC to Endur in 2018.16
– Electric Settlements Tool for Analysis and Reporting (ESTAR):17
ESTAR is used to manage complex contracts currently not 18
supported in the QIC system. This system collects unit specific 19
temperature and gas meter data to calculate the gas balancing 20
true-up adjustments for Tolling Agreements. This tool is also used 21
to calculate payment amounts for contracts not yet programmed in 22
Endur. Currently, ESTAR interfaces with the QIC system, which 23
prepares monthly invoices for each counterparty. Upon full 24
implementation, ESTAR calculations will work with the Endur 25
system.26
For a detailed description of the processes that Settlements uses, refer 27
to the confidential workpapers that accompany this chapter (see “Electric 28
Settlements’ Payment Guidelines”).29
6. Dispute Resolution30
ECMS manages any disputes that arise in connection with the contracts. 31
PG&E’s policy is to initially pursue resolution of issues through discussions. 32
If a contract issue cannot be resolved through initial discussions, ECMS may 33
conduct negotiations directly with the counterparty to resolve the dispute, as 34

8-8
prescribed per the contract. If such discussions and negotiations are 1
unsuccessful and formal litigation or arbitration becomes necessary, PG&E 2
develops and pursues resolution strategies consistent with the best interests 3
of customers. ECMS supports such discussions and negotiations and works 4
with PG&E’s Law Department and other internal stakeholders, as applicable, 5
in resolving contract disputes. These activities include support for discovery 6
and developing positions and proposals for dispute resolution.7
7. Tools, Systems and Controls8
ECMS uses a number of tools and systems that serve as controls in the 9
contract management and electric settlements process. These tools and 10
systems help ensure that contracts are prudently administered according to 11
their terms and conditions, and that there is continuity in ECMS for the entire 12
length of the contract term, which is important given that many of PG&E’s 13
contracts have terms of up to 30 years.14
Furthermore, these tools, systems and controls play a key role in 15
helping ECMS document, maintain and report contract information for the 16
purpose of providing data to both internal and external stakeholders.17
Upon execution of a contract, an assigned lead creates or updates 18
a record within ECMS tools and systems (e.g., CECM Database, as defined 19
below). The lead requests that the assigned Contract Managers review their 20
entries for completeness. For contract data that changes (e.g., project 21
status), ECMS, along with other PG&E departments (e.g., Energy Policy and 22
Procurement, Market and Credit Risk Management, etc.), reviews the data 23
for consistency.24
The primary tools, systems and controls used by ECMS are described 25
below:26
Master Contract List: A complete listing of all of the contracts 27
administered by ECMS. The list: (1) is used only by internal 28
stakeholders (e.g., Energy Policy and Procurement, Law, Internal Audit, 29
etc.); (2) contains links to documents stored in the Electronic Document 30
Management System (EDMS) and Documentum (D2) (described 31
below); and (3) includes the assigned Contract Manager and 32
Settlements Analyst for each contract.33
8-9
Electronic Document Management System (EDMS) and 1
Documentum (D2): PG&E’s legacy and replacement electronic 2
document storage systems: EDMS and D2 are web-based electronic 3
document storage systems that contain documents pertaining to our 4
contracts, and are secure storage and retrieval systems. Contract 5
Managers use EDMS and D2 to archive and access electronic copies of 6
documents. These documents include executed contract documents 7
and significant correspondence. Upon completed migration of all 8
documents from EDMS into the D2 system, EDMS will be9
decommissioned.10
Consolidated Energy Contract Management (CECM) Database: A11
database containing information about contracts executed by Energy 12
Policy and Procurement including, but not limited to: Western System13
Power Pool and Edison Electric Institute (EEI) master enabling 14
agreements; tolling and renewable agreements; energy storage, QF, 15
CHP, and other must-take contracts. The CECM Database contains 16
information such as: type of energy products; critical milestones;17
regulatory and permitting status; pricing; and credit information 18
(as applicable). The CECM Database allows for a more accurate and 19
efficient compilation of information for various internal and external 20
reports, such as the Transaction Tracking List, and various regulatory 21
reports (e.g., Energy Division Monthly RPS Database).22
Task Tracking Tool (T3): A milestone tracking system within the 23
CECM Database. T3 integrates the contractual milestone dates that are 24
managed in the CECM Database and eliminates the need to track, 25
manage, and update the same contractual milestone dates in a separate 26
system. Updates made to contractual dates and milestones in the 27
CECM Database are automatically reflected in T3. T3 also: (1) tracks 28
contractual deadline requirements, and tasks related to the29
management of contracts; (2) provides automatically-scheduled 30
notifications and escalations to Contract Managers and their supervisors31
in order for action to be taken well-in-advance of contractual deadlines; 32
and (3) ensures that tasks and obligations are tracked through to their 33
resolution.34

8-10
Transaction Tracking List: A chronological listing of executed 1
contracts, as well as subsequent transactions (e.g., amendments, letter 2
agreements, etc.), including a short description of the transaction. 3
The Transaction Tracking List is a tool used in preparing recurring 4
reports as it tracks contract execution dates, advice letter filings, and 5
CPUC approvals for relevant agreements.6
Scheduling Protocols: Contract-specific reports summarizing basic 7
contract information, such as: contract quantity; delivery point; contact 8
information; scheduling terms; and operational parameters for PG&E’s 9
contracted generation.10
Contract Management Intranet Site (SharePoint): An intranet site, 11
maintained and controlled by ECMS, which facilitates the sharing of 12
contract information with other stakeholders within PG&E. The following 13
tools and systems reside on or can be accessed from the Contract 14
Management SharePoint site: Master Contract List; EDMS/D2; CECM 15
Database; T3; Transaction Tracking List; Scheduling Protocols.16
C. Contract Administration During the Record Period17
This section discusses the administration of contracts that were in or added 18
to PG&E’s portfolio during the record period, and any significant changes to 19
these contracts that occurred.20
1. Procurement Programs and Solicitations21
This section describes PG&E’s solicitations and procurement programs 22
which had procurement activity during the record period.23
a. Solar Photovoltaic24
Pursuant to D.14-11-042, PG&E issued the 2016 Photovoltaic (PV)25
Request for Offers (RFO) for PG&E’s PV Program on December 7, 26
2016. PG&E sought to procure 68.75 megawatts (MW) of the 27
137.5 MW remaining PV capacity from new and existing PV facilities 28
during this solicitation. During the record period, PG&E executed 29
three PPAs pursuant to the 2016 PV RFO totaling 60 MW.30
PG&E issued the 2017 PV RFO for PG&E’s PV Program on 31
December 20, 2017. PG&E is seeking to procure 77.5 MW from new 32
8-11
and existing PV facilities. The execution of selected PPAs is targeted 1
for May 2018.2
b. ReMAT3
Pursuant to D.12-05-035 and D.13-05-034, PG&E issued bi-monthly 4
auctions during the record period for the ReMAT program. PG&E was 5
allocated 218.8 MW of the 750 MW total statewide goal to procure from 6
small distributed generation qualifying as “eligible renewable energy 7
resources” up to 3 MW in project size. PG&E executed ReMAT PPAs 8
totaling 6.17 MW during the record period. The ReMAT program 9
currently has 30.89 MW of total capacity from executed, non-terminated 10
ReMAT PPAs.11
On December 6, 2017, the U.S. District Court for the Northern12
District of California (Court) granted summary judgment in favor of13
Winding Creek Solar LLC (Winding Creek), in the case Winding Creek 14
Solar LLC v. Michael Peevey, et al. The Court determined that ReMAT 15
is not compliant with the federal Public Utilities Regulatory Policy Act 16
(PURPA). On January 3, 2018, the CPUC filed a motion to stay the17
Court’s order pending the CPUC’s appeal of the order. As of the date of 18
this filing, PG&E has suspended the execution of new ReMAT PPAs in 19
accordance with a directive received from the CPUC in a letter dated 20
December 15, 2017.21
c. BioMAT22
Pursuant to D.14-12-081 and D.15-09-004, PG&E issued bi-monthly 23
auctions during the record period for the BioMAT program Category 124
(biogas from wastewater treatment, municipal organic waste diversion, 25
food processing, and codigestion) and Category 2 (biogas from dairy 26
and other agricultural bioenergy), and monthly auctions for Category 327
(biogas or biomass using byproducts of sustainable forest 28
management). PG&E was allocated 111 MW of the 250 MW total IOU 29
procurement target from bioenergy resources. During the record period, 30
PG&E executed four BioMAT PPAs for a total of 3.85 MW. The BioMAT 31
program currently has 5.45 MW of total capacity from executed, non-32
terminated BioMAT PPAs.33

8-12
As described above, the CPUC advised in its December 15, 2017,1
letter that it is evaluating the implications of the Winding Creek decision 2
for the BioMAT program. In the interim, and as of the date of this filing, 3
PG&E has suspended the execution of new BioMAT PPAs until further 4
direction.5
d. Energy Storage6
Pursuant to D.13-10-040, PG&E issued the 2016 Energy Storage 7
RFO in November 2016 to procure towards PG&E’s overall target of 8
580 MW of energy storage resources. The 2016 RFO solicited offers for 9
energy storage at the transmission, distribution, and customer 10
connected domains. During the record period, PG&E executed 11
four front-of-the-retail-meter Capacity Storage Agreements (CSA), and 12
one behind-the-retail-meter CSA. PG&E filed an application seeking 13
Commission approval of the agreements resulting from the 2016 RFO14
on December 1, 2017. The Energy Storage program currently has 15
procured 185 MW of total capacity from executed, non-terminated 16
Energy Storage Agreements (ESA). 17
e. Resource Adequacy18
Pursuant to D.04-10-035, D.05-10-042 and D.12-04-046, PG&E 19
held RFOs in each quarter of the 2017 period for RA contracts. The 20
ensuing RA purchase and sale contracts were in compliance with 21
PG&E’s Bundled Procurement Plan and all executed contracts were 22
reported in PG&E’s Quarterly Compliance Reports.23
f. Renewable Energy Sales24
Pursuant to D. 16-12-04, PG&E issued the Renewable Energy 25
Sales Solicitation in January 2017 to sell excess Bundled RPS energy 26
and Renewable Energy Certificates (RECs). The ensuing Renewable 27
Energy Sale contracts were in compliance with PG&E’s 2016 RPS Plan 28
and followed the strategy described in the Sales Framework in 29
Appendix J of the 2016 RPS Plan.30

8-13
2. Contracts Executed1
The list below summarizes the number of contracts executed during the 2
record period. A detailed listing of the contracts executed during the record 3
period can be found in Tables 8-2 and 8-3 at the end of this chapter.4
CONTRACTS EXECUTED
Line No. Type of Contract
Number of Contracts Executed
1 BioMAT 42 EEI Master 43 Energy Storage 54 QF/CHP Settlement Agreements 45 ReMAT 66 Resource Adequacy 257 RPS 8
8 Total 56
3. Project Development and Construction Monitoring Results5
ECMS monitors the construction of projects under development, and 6
tracks contract milestones and deadlines, including construction start dates 7
and commercial operation dates. In addition, ECMS reviews periodic written 8
reports from developers, and when additional action is advisable, conducts 9
conference calls with developers, and inspects project sites. During the 10
record period, several counterparties exercised permitted extensions of 11
contract milestones or missed key PPA milestones, as reported in 12
Tables 8-4 and 8-5 at the end of this chapter.13
4. Contracts That Began Delivery14
The list below summarizes the number of contracts that began 15
delivering during the record period. A detailed listing of the contracts that16
began delivering during the record period can be found in Table 8-6 located 17
at the end of this chapter.18

8-14
CONTRACTS THAT BEGAN DELIVERY
Line No. Type of Contract
Number of Contracts
That Began Delivery
Total Contract
Size (MW)
1 GTSR – PG&E Solar Choice 5 28.252 QF/CHP Settlement Agreements 4 18.53 ReMAT 6 6.2114 RPS 18 219.2
5 Total 33 272.161
5. Contract Amendments, Consents to Assignment and 1
Other Agreements2
Contracts that had amendments, Consent to Assignments, and other 3
similar agreements executed during the record period are listed in Table 8-74
located at the end of this chapter.5
6. Force Majeure Claims6
A force majeure is an instance when unforeseeable circumstances 7
occur that prevent one or both parties from fulfilling the contract according to 8
the contract language. PG&E responds to force majeure claims by 9
reviewing the contract as well as the facts surrounding the force majeure 10
claim. The force majeure claims addressed during the record period are 11
listed in Table 8-8 located at the end of this chapter.12
7. Disputes13
This section describes matters in which PG&E and a counterparty 14
engaged in a dispute resolution process provided for under the agreement. 15
a. Alpaugh 50, LLC; Alpaugh North, LLC; CED Corcoran Solar, LLC;16
and CED White River Solar, LLC (PG&E Log Nos. 33R118, 33R119, 17
33R121, 33R122)18
On May 12, 2016, ConEdison Development (CED) initiated the 19
dispute resolution process for: Alpaugh 50, LLC; Alpaugh North, LLC; 20
CED Corcoran Solar, LLC; and CED White River Solar, LLC. CED 21
claimed that all four facilities were being curtailed in excess of the 22
50-hour dispatch down limits in the PPAs, asserting that participating 23
transmission owner-related outages were the main cause of the 24
outages. PG&E and CED engaged in multiple dispute resolution 25

8-15
discussions during the record period. This dispute is ongoing and has 1
not been resolved at the time of this filing.2
b. Hecate Energy Molino LLC (PG&E Log No. 40S003)3
On December 30, 2016, Hecate Energy initiated the dispute 4
resolution process under its ESA. The dispute was resolved during the 5
2017 record period, but prior to PG&E’s filing of its 2016 ERRA 6
Compliance testimony. Therefore, PG&E addressed this dispute and 7
the resolution in its 2016 ERRA Compliance testimony.8
c. Coalinga Cogeneration Company (PG&E Log No. 25C124QTR)9
On May 25, 2017, Coalinga Cogeneration Company (Coalinga) 10
initiated the dispute resolution process under the PPA. Coalinga 11
disputed PG&E’s denial of Coalinga’s June 2016 claim of force majeure12
related to failure of a third-party crude oil pipeline, which resulted in a 13
reduction of Coalinga’s capacity payments. PG&E and Coalinga 14
engaged in multiple dispute resolution meetings during the record 15
period. This dispute is ongoing and has not been resolved at the time of 16
this filing.17
d. Panoche Energy Center (PG&E Log No. 33B076)18
On October 19, 2017, Panoche Energy Center, LLC (Panoche) 19
initiated the dispute resolution process under the PPA, regarding 20
PG&E’s calculation of monthly contract capacity adjustments under the 21
PPA. PG&E and Panoche engaged in multiple dispute resolution 22
discussions during the record period. This dispute is ongoing and has 23
not been resolved at the time of this filing.24
e. Global Ampersand, LLC, El Nido Biomass Facility and Chowchilla 25
Biomass Facility (PG&E Log Nos. 33R016 and 33R017)26
On November 16, 2017, Global Ampersand, LLC (Global) initiated 27
the dispute resolution process for the El Nido Biomass Facility and the 28
Chowchilla Biomass Facility, regarding multiple payment issues related 29
to scheduling and outage notification. PG&E and Global engaged in 30
management negotiations during the record period. This dispute is 31
ongoing and has not been resolved at the time of this filing.32

8-16
8. Contracts That Expired or Terminated1
The list below summarizes the number of contracts that were expired or 2
terminated during the record period. A detailed listing of the contracts that 3
expired or terminated during the record period can be found in Table 8-9 at 4
the end of this chapter.5
CONTRACTS THAT EXPIRED OR TERMINATED
Line No. Type of Contract
Number of Contracts Expired
Number of Contracts
Terminated
1 Conventional/Tolling 2 02 EEI Master 0 13 Energy Storage 0 24 QF 11 105 QF/CHP Settlement Agreements 1 06 ReMAT 0 47 Renewable and Non-Renewable
Energy 1 0
8 RPS 6 1
9 Total 21 18
D. Other Matters6
In addition to the matters described above, this section describes other 7
matters that occurred during the record period.8
1. Poco Power, LLC v. PG&E9
On December 12, 2016, Poco Power, LLC (Poco) applied for a ReMAT 10
PPA in the as-available non-peaking product type. However, since the 11
proposed project was a solar facility, PG&E determined that the project was 12
ineligible for the as-available non-peaking product type. Poco resubmitted 13
its application with a product type of as-available peaking, and is currently in 14
the queue for an as-available peaking ReMAT PPA. However, on May 1, 15
2017, Poco filed a complaint against PG&E with the CPUC, alleging that 16
PG&E had incorrectly determined that the project was ineligible for the 17
as-available non-peaking product type. On November 17, 2017, PG&E and 18
Poco resolved the complaint for a nominal amount. No costs associated 19
with this complaint were recorded in ERRA.20

8-17
2. Orion Solar I, LLC (PG&E Log No. 33R162)1
During a change of ownership of the project (Orion) during the record 2
period, PG&E identified that PG&E had inadvertently retained in 3
project development security and in excess daily delay 4
damages after the project achieved commercial operation on April 14, 2014.5
Under the PPA, these amounts should have been returned to Orion after the 6
project achieved commercial operation. On September 20, 2017, PG&E 7
returned the amounts owed plus interest to Orion. PG&E does not book the 8
collection or return of project development security to the ERRA balancing 9
account. PG&E books the collection of daily delay damages to ERRA, so 10
the return of the excess daily delay damages plus interest (which together 11
totaled ) was booked to the ERRA balancing account.12
3. Thermal Energy Development Corporation (PG&E Log No. 16P054)13
Thermal Energy's PPA requires the facility to meet its Firm Capacity 14
requirement. Thermal Energy failed to meet the minimum performance 15
requirement by September 1, 2014 and 16
17
18
19
PG&E and 20
Thermal Energy have been in discussions during the record period 21
. This issue has not yet been resolved.22
E. Request for Approval of Amendments23
PG&E requests that the Commission approve the following contract 24
amendments that were executed during the record period. PG&E is not 25
requesting express approval of each amendment entered into during the record 26
period. Many amendments are routine and/or administrative in nature and are 27
approved as a part of PG&E’s contract administration during the record period. 28
Other amendments have been submitted to the Commission for review and 29
approval in separate applications or advice letters. PG&E is requesting express 30
Commission approval of certain contract amendments that are not separately 31
approved through another Commission mechanism or process. Copies of the 32
amendments for which PG&E is seeking approval in this Application, described 33

8-18
in this Section E, are included in PG&E’s confidential workpapers for this 1
chapter. 2
1. Crockett Cogeneration Co (PG&E Log No. 01C045)3
PG&E is requesting Commission review and approval in this ERRA filing 4
of April 7, 2017, and April 28, 2017, letter agreements with Crockett 5
Cogeneration (Log No. 01C045).6
PG&E identified an immediate opportunity to decrease the cost of its 7
generation portfolio and provide customer savings 8
as the CAISO market 9
continued to sustain relatively low prices during the spring of 2017 due to 10
high levels of precipitation during the 2016–2017 winter. On April 7, 2017,11
PG&E and Crockett Cogeneration L.P., executed a “Letter Agreement 12
” whereby Crockett 13
. On April 28, 2017, PG&E and Crockett agreed 14
to .15
F. Conclusion16
The above testimony describes PG&E’s contract administration practices, 17
changes that occurred to the contracts administered, and the results achieved 18
with regard to contract administration during the record period, and 19
demonstrates that PG&E’s contract administration during the record period was 20
reasonable and in compliance with SOC4.2122

8-19
TAB
LE 8
-1
ENER
GY
PUR
CH
ASES
AN
DC
OST
SJA
NU
ARY
1, 2
017
THR
OU
GH
DEC
EMB
ER 3
1,20
17
Line
No
.De
scri
ptio
nJa
n-17
Feb-
17M
ar-1
7A
pr-1
7M
ay-1
7Ju
n-17
Jul-1
7A
ug-1
7Se
p-17
Oct
-17
Nov-
16De
c-17
Tota
l1 2
Tota
l Ene
rgy
(MW
h)16
,106
,656
3To
tal P
aym
ents
($)
$2,1
84,2
03,2
69
4Q
ualif
ying
Fac
ility
and
CHP
Gen
erat
ion
5To
tal E
nerg
y (M
Wh)
3,75
2,78
8
6To
tal P
aym
ents
($)
$290
,104
,651
7Co
nven
tiona
l Gen
erat
ion
8To
tal E
nerg
y (M
Wh)
6,94
0,56
8
9To
tal P
aym
ents
($)
$858
,668
,535
10O
ther
Mus
t-Tak
es
11To
tal E
nerg
y (M
Wh)
135,
571
12To
tal P
aym
ents
($)
2$1
2,07
0,20
5
13To
tal E
nerg
y (M
Wh)
26,9
35,5
83
14To
tal P
aym
ents
($)
$3,3
45,0
46,6
60
1A
djus
tmen
ts fo
r GTS
R co
sts
and
volu
mes
are
not
refle
cted
in th
is ta
ble
2Ne
gativ
e nu
mbe
r due
to re
vers
al o
f acc
rual
to a
ctua
l invo
ice
amou
nt p
aid
Rene
wab
le G
ener
atio
n 1

8-20
TABLE 8-2 CONTRACT ADMINISTRATION
CONTRACTS EXECUTED DURING RECORD PERIOD 2017
Line No. Date PG&E Log Number Project Name Capacity (MW) Contract Type1 1/9/2017 33R407RM Arbuckle Mountain Hydro 0.335 ReMAT2 1/31/2017 33R408RM Grasshopper Flat 1.1 ReMAT3 2/28/2017 04H061QPA4 Indian Valley Hydro 2.9 PURPA4 2/28/2017 13H001QPA El Dorado Hydro (Montgomery Creek) 2.8 PURPA5 3/8/2017 33R409RM Silver Springs 0.6 ReMAT6 4/28/2017 33R410 3 Phases Renewables Inc. 1 0 RPS7 4/28/2017 33R411 Direct Energy Business Marketing , LLC 1 0 RPS8 4/28/2017 33R412 EDF Trading North America, LLC 1 0 RPS9 4/28/2017 33R413 Exelon Generation Company, LLC 1 0 RPS10 4/28/2017 33R414 Peninsula Clean Energy Authority 1 0 RPS11 5/8/2017 33B232 Peninsula Clean Energy Authority N/A EEI Master12 5/18/2017 33R415RM Eagle Solar 3 ReMAT13 6/12/2017 33R416BIO San Luis Obispo AD 0.853 BioMAT14 6/21/2017 33R417RM Sutters Mill Hydroelectric Plant 0.13 ReMAT15 7/21/2017 33R418RM Angels Powerhouse 1 ReMAT16 7/24/2017 01C084QAA Berkeley Cogeneration 9.9 As Available17 9/22/2017 33R419 RE Gaskell West 3 20 RPS18 9/22/2017 33R420 RE Gaskell West 4 20 RPS19 9/22/2017 33R421 RE Gaskell West 5 20 RPS20 10/25/2017 33B230 Silicon Valley Clean Energy Authority N/A EEI Master21 10/25/2017 33B234 The Energy Authority (TEA) N/A EEI Master
22 10/25/2017 33B235 Marin Clean Energy, a California Joint Powers Authority N/A EEI Master
23 11/6/2017 33R422BIO ABEC #2 LLC 1 BioMAT24 11/6/2017 33R423BIO ABEC #3 LLC 1 BioMAT25 11/6/2017 33R424BIO ABEC #4 LLC 1 BioMAT26 11/8/2017 40S007 Calstor, LLC 10 Energy Storage27 11/8/2017 40S008 Sierra Energy Storage 10 Energy Storage28 11/8/2017 40S009 Cascade Energy Storage 25 Energy Storage29 11/8/2017 40S010 Kingston Energy Storage 50 Energy Storage30 11/8/2017 40S011 Diablo Energy Storage 50 Energy Storage31 11/30/2017 04H061QPA5 Indian Valley Hydro 2.9 PURPA
1 Sale of energy and renewable energy credits (RECs).

8-21
TABLE 8-3 CONTRACT ADMINISTRATION
RESOURCE ADEQUACY EXECUTED DURING RECORD PERIOD 2017
Line No. Date PG&E Log Number Project Name1 1/19/2017 33B022P02 Shell Energy North America (US), L.P.2 4/7/2017 33B231P01 Peninsula Clean Energy Authority3 4/12/2017 33B226P02 Sonoma Clean Power Authority4 4/14/2017 33B007P01 Exelon Generation Company, LLC5 4/26/2017 33B113P01 3 Phases Renewables Inc.6 5/10/2017 33B232P01 Peninsula Clean Energy Authority7 6/14/2017 33B022P03 Shell Energy North America (US), L.P.8 6/16/2017 33B022P04 Shell Energy North America (US), L.P.9 7/20/2017 33B113P02 3 Phases Renewables Inc.10 8/16/2017 33B233P01 Direct Energy Business Marketing, LLC11 9/18/2017 33B038P01 NRG Power Marketing LLC12 9/28/2017 33B022Q01 Shell Energy North America (US), L.P.13 10/26/2017 33B113Q01 3 Phases Renewables Inc.14 10/26/2017 33B200Q01 EDF Trading North America, LLC15 10/27/2017 33B021Q01 City of Santa Clara dba Silicon Valley Power16 10/27/2017 33B226Q01 Sonoma Clean Power Authority17 10/27/2017 33B230Q01 Silicon Valley Clean Energy Authority18 10/27/2017 33B233Q01 Direct Energy Business Marketing, LLC19 10/27/2017 33B234Q01 The Energy Authority, Inc.20 10/27/2017 33B235Q01 Marin Clean Energy21 10/31/2017 33B202Q01 Commercial Energy of Montana Inc.22 10/31/2017 33B232Q01 Peninsula Clean Energy Authority23 11/28/2017 33B005Q01 BP Energy Company24 11/30/2017 33B037P01 NextEra Energy Marketing, LLC25 12/12/2017 33B005Q02 BP Energy Company

8-22
TAB
LE 8
-4
CO
NTR
ACT
ADM
INIS
TRAT
ION
PER
MIT
TED
EXT
ENSI
ON
SD
UR
ING
REC
OR
D P
ERIO
D 2
017
Line
N
o.D
ate
of
Req
uest
PG&
E Lo
g N
umbe
rPr
ojec
t Nam
eC
ontr
act T
ype
Des
crip
tion
11/
17/2
017
33R
363
CED
Oro
Lom
a So
lar P
roje
ct A
RPS
GC
OD
* was
ext
ende
d fro
m 1
/20/
2017
to 2
/28/
2017
.2
1/17
/201
733
R36
5Av
enal
Sol
ar P
roje
ct A
RPS
GC
OD
was
ext
ende
d fro
m 1
/20/
2017
to 2
/28/
2017
.3
1/17
/201
733
R36
6C
ED O
ro L
oma
Sola
r Pro
ject
BR
PSG
CO
D w
as e
xten
ded
from
1/2
0/20
17 to
2/2
8/20
17.
41/
17/2
017
33R
368
Aven
al S
olar
Pro
ject
BR
PSG
CO
D w
as e
xten
ded
from
1/2
0/20
17 to
2/2
8/20
17.
53/
9/20
1733
R37
3RM
Roc
k C
reek
SB32
/ReM
ATG
CO
D w
as e
xten
ded
from
3/1
1/20
17 to
4/1
1/20
17.
63/
15/2
017
33R
376
Aspi
ratio
n So
lar G
RPS
GC
OD
was
ext
ende
d fro
m 5
/30/
17 to
7/3
0/17
.7
5/9/
2017
33R
376
Aspi
ratio
n So
lar G
RPS
GC
OD
was
ext
ende
d fro
m 7
/30/
17 to
11/
30/1
7.8
6/2/
2017
33R
387
San
Joaq
uin
1AR
PS9
7/13
/201
733
R38
6Sa
n Jo
aqui
n 1B
GTS
R -
PG&E
Sol
ar C
hoic
e (G
T)10
9/19
/201
733
R40
4Bu
rney
For
est P
rodu
cts
RPS
IED
D**
was
ext
ende
d fro
m 1
0/1/
17 to
10/
31/1
7.11
10/2
4/20
1733
R40
6W
heel
abra
tor S
hast
aR
PSIE
DD
was
ext
ende
d fro
m 1
2/1/
17 to
12/
31/1
7.
*Gua
rent
eed
Com
mer
ical
Ope
ratio
n D
ate
(GC
OD
)**
Initia
l Exp
ecte
d D
elive
ry D
ate
(IED
D)

8-23
TAB
LE 8
-5
CO
NTR
ACT
AD
MIN
ISTR
ATIO
NM
ISSE
D M
ILES
TON
ES D
UR
ING
REC
OR
D P
ERIO
D 2
017
Line
N
o.
Orig
inal
M
ilest
one
Dat
ePG
&E
Log
Num
ber
Proj
ect N
ame
Con
trac
t Ty
peM
ilest
one
Dat
e of
Eve
ntD
escr
iptio
n
13/
11/2
017
33R
370R
M22
45 G
entry
ReM
ATG
uara
ntee
d C
OD
3/20
/17
Term
inat
ed
24/
20/2
017
33R
360R
M22
75 H
atte
sen
ReM
ATG
uara
ntee
d C
OD
4/28
/17
Term
inat
ed
310
/31/
2017
33R
404
Burn
ey F
ores
t Pro
duct
s, A
Joi
nt V
entu
reR
PSIn
itial E
nerg
y D
elive
ry
Dat
e11
/1/2
017
Achi
eved
IE
DD

8-24
TABLE 8-6 CONTRACT ADMINISTRATION
CONTRACTS THAT BEGAN DELIVERING DURING RECORD PERIOD 2017
Line No. Date PG&E Log Number Project Name
Capacity (MW) Contract Type
1 2/24/2017 33R363 CED Oro Loma Solar Project A 10 RPS2 3/1/2017 13H001QPA El Dorado Hydro (Montgomery Creek) 2.8 PURPA3 3/10/2017 33R365 Avenal Solar Project A 7.9 RPS4 3/10/2017 33R368 Avenal Solar Project B 7.9 RPS5 3/10/2017 33R366 CED Oro Loma Solar Project B 10 RPS6 3/14/2017 33R407RM Arbuckle Mountain Hydro 0.335 ReMAT7 3/15/2017 04H061QPA4 Indian Valley Hydro 2.9 PURPA8 3/30/2017 33R373RM Rock Creek 2.796 ReMAT9 4/21/2017 33R362 Portal Ridge Solar C Project 11.4 RPS10 5/2/2017 33R375 Westside Solar 20 RPS11 5/15/2017 33R403RM Matthews Dam Hydro 1.35 ReMAT12 6/17/2017 33R410 3 Phases Renewables Inc. 1 0 RPS13 6/17/2017 33R411 Direct Energy Business Marketing , LLC 1 0 RPS14 6/17/2017 33R412 EDF Trading North America, LLC 1 0 RPS15 6/17/2017 33R413 Exelon Generation Company, LLC 1 0 RPS16 6/17/2017 33R414 Peninsula Clean Energy Authority 1 0 RPS17 8/1/2017 01C084QAA Berkeley Cogeneration 9.9 As Available18 8/15/2017 33R409RM Silver Springs 0.6 ReMAT19 8/22/2017 33R418RM Angels Powerhouse 1 ReMAT20 8/25/2017 33R364 Sunray 2 20 RPS21 10/17/2017 33R417RM Sutters Mill Hydroelectric Plant 0.13 ReMAT22 10/27/2017 33R376 Aspiration Solar G 9 RPS23 11/1/2017 33R404 Burney Forest Products 29 RPS24 12/1/2017 04H061QPA5 Indian Valley Hydro 2.9 PURPA25 12/2/2017 33R406 Wheelabrator Shasta 34 RPS26 12/20/2017 33R383 Bayshore Solar A 2 20 RPS27 12/20/2017 33R384 Bayshore Solar B 2 20 RPS28 12/20/2017 33R385 Bayshore Solar C 2 20 RPS29 12/26/2017 33R382 Bakersfield PV 1 2 5.25 GTSR - PG&E Solar Choice30 12/27/2017 33R388 Bakersfield Industrial 1 2 1 GTSR - PG&E Solar Choice31 12/27/2017 33R392 RE Tranquillity 8 Amarillo 2 20 GTSR - PG&E Solar Choice32 12/28/2017 33R389 Delano Land 1 2 1 GTSR - PG&E Solar Choice33 12/28/2017 33R390 Manteca Land 1 2 1 GTSR - PG&E Solar Choice
1 Sale of energy and renewable energy credits (RECs). 2 The project began deliveries during the record period, but will not start the delivery term until after the record period.

8-25
TABLE 8-7 CONTRACT ADMINISTRATION
CONTRACT AMENDMENTS AND CONSENTS TO ASSIGNMENT DURING RECORD PERIOD 2017

8-26
TABLE 8-7 CONTRACT ADMINISTRATION
CONTRACT AMENDMENTS AND CONSENTS TO ASSIGNMENT DURING RECORD PERIOD 2017(CONTINUED)

8-27
TABLE 8-8 CONTRACT ADMINISTRATION
FORCE MAJEURE CLAIMS DURING RECORD PERIOD 2017
Line No.
Date of Claim
PG&E Log Number Project Name
Contract Type Date Closed Description
1 9/1/2016 33R063 Ivanpah Unit 1 RPS 3/10/20172 9/1/2016 33R064 Ivanpah Unit 3 RPS 3/10/20173 9/1/2016 33R088 High Plains Ranch III RPS 5/30/2017
4 12/29/2016 33R056 Topaz Solar Farm RPS 2/21/20175 2/9/2017 33R093 Geysers RPS 5/31/2017
6 2/14/2017 33B116 Oroville Tolling Agreement Tolling 5/3/2017
7 2/24/2017 33R074 SFWP - Sly Creek / Kelly Ridge RPS Pending
8 2/24/2017 33R140 El Dorado Irrigation District RPS 6/23/20179 2/27/2017 25C164 PE - KES Kingsburg QF 3/7/2017
10 3/31/2017 33R063 Ivanpah Unit 1 RPS 5/26/2017
11 3/31/2017 33R064 Ivanpah Unit 3 RPS 5/26/2017
12 5/15/2017 33R052 High Plains Ranch II RPS 5/30/2017
13 5/15/2017 33R088 High Plains Ranch III RPS 5/30/2017
14 10/4/2017 33R402RM Mini Hydro ReMAT Pending
15 10/9/2017 33R093 Geysers RPS Pending
16 10/11/2017 33R402RM Mini Hydro ReMAT Pending
17 10/11/2017 33B112 Bear Mountain Limited Tolling 11/9/2017
18 10/16/2017 12C020 Greenleaf Unit #1 QF Pending
19 11/15/2017 33R402RM Mini Hydro ReMAT Pending

8-28
TABLE 8-9 CONTRACT ADMINISTRATION
CONTRACTS THAT EXPIRED OR TERMINATED DURING RECORD PERIOD 2017
Line No. Date
PG&E Log Number Project Name Contract Type Description
1 1/4/2017 13H015 Mega Renewables (Hatchet Creek) QF Expired2 1/23/2017 16P002 Pacific-Ultrapower Chinese Station QF Expired3 1/31/2017 10P005 HL Power QF Terminated4 2/2/2017 19P005 DG Fairhaven Power QF Expired5 2/21/2017 13H017 Mega Renewables (Bidwell Ditch) QF Expired6 2/27/2017 13H001 El Dorado Hydro (Montgomery Creek) QF Expired7 3/1/2017 33R369RM 2042 Baldwin ReMAT Terminated8 3/9/2017 33R371RM 2257 Campbell ReMAT Terminated9 3/20/2017 33R370RM 2245 Gentry ReMAT Terminated10 4/16/2017 33R012 Buena Vista Wind Project RPS Expired11 4/28/2017 33R360RM 2275 Hattesen ReMAT Terminated12 5/3/2017 40S006 Stem Energy Northern CA, LLC Energy Storage Terminated13 5/14/2017 19H051 Humboldt Bay MWD QF Terminated14 5/31/2017 19C010 Humboldt Redwood Company QF Terminated15 5/31/2017 25C016 Algonquin Power Sanger LLC QF Terminated16 6/12/2017 33R361 Maricopa West Solar RPS Terminated17 6/20/2017 33B079 JR Simplot Conventional Expired18 6/28/2017 40S002 Energy Nuevo Storage Farm Energy Storage Terminated19 6/30/2017 33B219 Merced Irrigation District Conventional Expired20 7/26/2017 01C084 PE - Berkeley, Inc. QF Expired21 8/14/2017 13H036 Mega Renewables (Silver Springs) QF Expired22 9/7/2017 15P028 Rio Bravo Rocklin QF Terminated23 9/7/2017 25P026 Rio Bravo Fresno QF Terminated24 9/25/2017 16W011A Cogeneration Capital Association QF Expired25 9/25/2017 16W173 Cogen Capital (Altamont Power) QF Expired26 9/30/2017 33R411 Direct Energy Business Marketing , LLC 1, 2 RPS Expired27 9/30/2017 33R412 EDF Trading North America, LLC 1, 2 RPS Expired28 9/30/2017 33R413 Exelon Generation Company, LLC 1, 2 RPS Expired29 9/30/2017 33R414 Peninsula Clean Energy Authority 1, 2 RPS Expired30 10/16/2017 13H006 Sutter's Mill QF Terminated31 10/31/2017 04H061QPA4 Indian Valley Hydro PURPA Expired32 10/31/2017 13C038 Burney Forest Products QF Terminated33 11/24/2017 06H159 David O. Harde QF Terminated34 11/30/2017 33B056 Conoco Phillips Company EEI Master Terminated35 12/1/2017 13P045 Wheelabrator Shasta QF Terminated36 12/31/2017 06W146B EDF Renewable Windfarm V, Inc. (70 MW - B) QF Expired37 12/31/2017 06W148 EDF Renewable Windfarm V, Inc. (10 MW) QF Expired
38 12/31/2017 33R252 / 33B210
PCWA - French Meadows / Oxbow / Hell Hole / Middle Fork / Ralston
Renewable and Non-Renewable Energy Expired
39 12/31/2017 33R410 3 Phases Renewables Inc. 1 RPS Expired
1 Sale of energy and renewable energy credits (RECs).2 Due to the dependency on a confirmed date for fulfillment of the contract energy quantity and associated RECs, this expiration was not captured in the Q3 QCR Attachment H table of Expirations and Terminations.

PACIFIC GAS AND ELECTRIC COMPANY
CHAPTER 9
CAISO SETTLEMENTS AND MONITORING

9-i
PACIFIC GAS AND ELECTRIC COMPANY CHAPTER 9
CAISO SETTLEMENTS AND MONITORING
TABLE OF CONTENTS
A. Introduction ....................................................................................................... 9-1
B. CAISO Market Costs ........................................................................................ 9-1
1. Day-Ahead Market ..................................................................................... 9-2
2. Real-Time Market ...................................................................................... 9-2
3. Congestion Revenue Rights ...................................................................... 9-3
4. Bid Cost Recovery ..................................................................................... 9-3
5. Other .......................................................................................................... 9-3
C. Grid Management Charges .............................................................................. 9-4
D. FERC Fees ....................................................................................................... 9-4
E. PG&E CAISO Market Cost Validation Business Process ................................. 9-4
F. Additional Items ................................................................................................ 9-5
1. Good Faith Negotiation .............................................................................. 9-5
2. Non-ERRA Memorandum Accounts........................................................... 9-6
G Conclusion ........................................................................................................ 9-7

9-1
PACIFIC GAS AND ELECTRIC COMPANY 1
CHAPTER 9 2
CAISO SETTLEMENTS AND MONITORING 3
A. Introduction 4
This chapter describes the procurement costs and revenues associated with 5
Pacific Gas and Electric Company’s (PG&E) participation in the California 6
Independent System Operator (CAISO) electricity markets, both Day-Ahead and 7
Real-Time. PG&E receives revenue for electric generation provided to the 8
CAISO markets and is charged for demand representing PG&E’s bundled 9
customer load. The costs and revenues described here reflect the portion of 10
PG&E’s electric supply portfolio, for which PG&E is the Scheduling Coordinator 11
(SC). SCs are entities authorized by the CAISO to schedule and bid power on 12
behalf of CAISO market participants. SCs also make and receive market 13
payments and have the ability to validate and dispute market charges with the 14
CAISO. The CAISO Settlements Department is responsible for fulfilling this 15
payment and validation role within PG&E. 16
CAISO net charges eligible for ERRA cost recovery in 2017 17
totaled $317,320,385. This included charges for Market Costs ($260,886,980), 18
Grid Management Charges ($50,950,476) and FERC Fees ($5,482,929). 19
Beginning in November 2017, CAISO market revenue included $2,138,538 for 20
two resources, Burney Forest Products and Wheelabrator Shasta, being booked 21
to non-ERRA memorandum accounts as discussed below in Section E2.1 22
B. CAISO Market Costs 23
During the January 1 to December 31, 2017 record period, PG&E incurred a 24
net expense of $260,886,980 for participation in the CAISO markets. This is 25
representative of the cost of serving PG&E’s bundled customer load through the 26
CAISO markets netted against the revenues received for PG&E’s supply 27
resources. The aspects of the CAISO’s markets described in this section 28
represent the large majority of this cost. 29
1 See Chapter 9 Workpaper for more detail.

9-2
1. Day-Ahead Market 1
The CAISO runs a Day-Ahead Market for energy and Ancillary Services 2
(A/S), referred to as the Integrated Forward Market (IFM). Total Day-Ahead 3
Market purchases and sales of energy netted to a charge of $200,892,641 4
for the record period. PG&E’s electric supply portfolio receives revenues for 5
awarded energy and capacity through these markets. PG&E is also 6
charged for the amount of demand scheduled and bid on behalf of PG&E’s 7
bundled customer load. In addition to the energy and A/S markets, the 8
CAISO also runs a Residual Unit Commitment (RUC) process after the IFM. 9
If needed, the CAISO procures additional capacity through this process. 10
Based on the CAISO’s procurement through the IFM and RUC, it may be 11
necessary to collect additional funds, or market uplifts, from market 12
participants based on their net market positions. These uplift charges are 13
often based on the amount of demand a market participant has in the 14
CAISO’s markets. This amount includes charges for energy purchased for 15
PG&E’s bundled customer load, A/S portfolio obligations, and market uplifts 16
needed to maintain cash neutrality for the CAISO. These charges are offset 17
by revenues for awarded energy and A/S schedules for PG&E’s portfolio 18
generation. 19
2. Real-Time Market 20
The CAISO’s Real-Time Market (RTM) includes the costs and revenues 21
related to the dispatch of energy, unscheduled bundled customer load and 22
procurement of A/S. The RTM is comprised of 5-minute dispatch and 23
settlement and the Fifteen-Minute Market (FMM) resulting from the 24
implementation of Federal Energy Regulatory Commission (FERC) 25
Order 764 beginning in 2014. RTM purchases and sales of energy netted to 26
a charge of $59,718,936 in 2017. Also included are the financial 27
settlements related to intertie awards, for both imports and exports, which 28
are generated through the Hour-Ahead Scheduling Process and the FMM. 29
The dispatch of energy in Real-Time is settled through the use of imbalance 30
energy charge codes. Dispatches are paid or charged through the 31
Instructed Imbalance Charge Code mechanism, while deviations from 32
schedule or dispatch are settled through the Uninstructed Imbalance Charge 33

9-3
Code mechanism. Similar to the Day-Ahead Market, market uplifts are 1
utilized to fund any revenue shortfalls in the RTM. 2
3. Congestion Revenue Rights 3
Congestion Revenue Rights (CRR) are financial instruments that allow 4
the holder to hedge congestion costs in the IFM. CRRs are defined 5
between any two nodes in the CAISO transmission network model. 6
The revenue (or shortfall) associated with a CRR on a path is the difference 7
between the congestion component of the source Locational Marginal Price 8
(LMP) and the congestion component of the sink LMP. CRRs, with their 9
associated cash flows, enable Load Serving Entities (LSE), such as PG&E, 10
to mitigate potential congestion costs associated with the price the CAISO 11
charges to serve LSE loads. CRRs are acquired through a yearly and 12
monthly allocation and auction process. CRR credits to PG&E in 2017 13
totaled $10,204,764. 14
4. Bid Cost Recovery 15
In situations where generation resources do not fully recover their costs 16
through the markets, the CAISO utilizes the Bid Cost Recovery (BCR) 17
mechanism to further compensate resources. Generation that is committed 18
by the CAISO is entitled to fully recover bid costs, startup costs, and 19
minimum load costs associated with the specific resource. A BCR payment 20
will be made if a resource is not fully compensated for these costs across a 21
full trade day and across all markets. The CAISO utilizes market uplifts to 22
procure the funds required for BCR payments to generators. PG&E’s 23
electric portfolio both, receives revenue for its generation resources, and 24
is also subject to the BCR uplift charges based on portfolio positions 25
and demand. BCR netted to a credit of $5,646,881 in 2017. 26
5. Other 27
Other charges of $16,127,048 included Unaccounted for Energy, 28
Convergence Bidding, Ancillary Services, Day-Ahead Integrated Forward 29
Market Credit Allocation, Real-Time Imbalance Energy Offset and other 30
miscellaneous categories. 31

9-4
C. Grid Management Charges 1
Grid Management Charges (GMC) are comprised of daily and monthly 2
charges, which are assessed to market participants for the purpose of 3
recovering all of the CAISO’s operating costs. The CAISO currently has 4
incorporated three cost service-based GMCs, a fixed Transmission Ownership 5
Rights GMC, as well as four transactional and administrative GMCs. The cost 6
services GMC consist of: (1) a Market Services Charge; (2) a System 7
Operations Charge; and (3) a CRR Services Charge. The four transactional 8
fees consist of: (1) a Bid Segment Fee; (2) a CRR Transaction Fee; (3) an 9
Inter-SC Trade Transaction Fee; and (4) a SC ID Charge. All of these GMCs 10
represent the various ways market participants interact with the CAISO on a 11
day-to-day basis. PG&E was charged $50,950,476 in GMCs during the record 12
period. 13
D. FERC Fees 14
FERC fees are allocated to CAISO market participants in accordance with 15
the CAISO Tariff. The fees represent estimated and actual FERC operating 16
costs for its electric regulatory program. The CAISO allocates the fees to each 17
market participant based on their use of the CAISO grid. PG&E was 18
allocated $5,482,929 in FERC fees during the record period. 19
E. PG&E CAISO Market Cost Validation Business Process 20
The CAISO utilizes over 200 charge codes to settle its markets and the 21
various instruments and products associated with those markets. The CAISO 22
publishes multiple iterations of settlement statements that market participants 23
are able to download and validate prior to invoicing. Settlement statements are 24
published for each trade date. SCs are able to dispute these statements if 25
errors are discovered. 26
PG&E utilizes a shadow settlement tool for the charge code validation and 27
dispute process. PG&E loads the necessary CAISO statements and supporting 28
inputs for shadow settlement into the shadow system and runs estimates for 29
CAISO charge codes. PG&E then uses the information in the shadow system to 30
validate charge codes for CAISO settlement statements. A charge code dispute 31
may be necessary when, after validating the different charge codes by 32
comparing CAISO settlement statements with the shadow estimates, there is a 33

9-5
discrepancy. This process is conducted for each trade date to ensure that 1
CAISO is accurately settling the market. Once a dispute is filed with CAISO, 2
it can be denied or accepted. If accepted, the correction usually appears in the 3
next published version of the settlement statement. 4
F. Additional Items 5
1. Good Faith Negotiation 6
In 2016 Chapter 9 Energy Resource Recovery Account (ERRA) 7
Compliance Testimony, PG&E discussed an outstanding Good Faith 8
Negotiation (GFN) with the CAISO relating to an April 14-16, 2016 market 9
event at Agua Caliente, a contracted resource. The event was precipitated 10
by the CAISO invoking Operation Procedure 7860 (OP7860) for the 11
stranded generation of Agua Caliente due to an outage on the Hoodoo 12
Wash – North Gila transmission line. OP7860 was created to allow Agua 13
Caliente to generate when it is isolated from the CAISO grid. Under 14
OP7860, PG&E followed one of the listed options exporting and importing 15
Agua Caliente's power at Palo Verde in Arizona to re-enter the CAISO 16
Balancing Authority through an alternate route at Devers. Due to both high 17
congestion at North Gila and high negative Day-Ahead prices, this action 18
resulted in net charges of $2.4 million to PG&E over the period. PG&E 19
disputed the charges with the CAISO but the dispute was denied. 20
Subsequently, PG&E initiated a GFN on July 27, 2016, to address the 21
disputed charges through an alternate resolution process and also 22
requested the CAISO to clarify its future use of OP7860. 23
From August 2016 through June 2017, both PG&E and the CAISO 24
conducted due diligence, and held several meetings to better understand 25
the specific operating factors surrounding the April 14-16, 2016 event at 26
Agua Caliente. One outcome of these discussions was PG&E successfully 27
convincing the CAISO to retire OP7860 effective April 28, 2017, arguing that 28
it gave no additional scheduling options or guidance that otherwise would 29
not be available during a transmission outage. 30
On June 27, 2017, the CAISO finalized its GFN conclusion, reaffirming 31
that its modeling of the Day-Ahead Market had been correct and in 32
accordance with the CAISO Tariff. Congestion had resulted from the 33

9-6
transmission outage at North Gila-Hoodoo Wash combining with a second 1
event - an unanticipated de-rate of a 500 kilovolt line at Hassayampa to 2
North Gila (HANG2) originating outside the CAISO footprint by Arizona 3
Public Service. Agua Caliente had settled not on the contract path wheeling 4
from Palo Verde, as PG&E originally assumed, but on actual operating flows 5
from HANG2. Based on the additional information obtained through the 6
GFN, PG&E concurred with the CAISO conclusion that the settlement costs 7
for Agua Caliente had been accurately calculated for this event in dispute. 8
2. Non-ERRA Memorandum Accounts 9
Beginning in November 2017, PG&E financial reporting began recording 10
non-ERRA market revenues and costs in Bioenergy Renewable Auction 11
Mechanism Memorandum Account (BioRAMMA) and Biomass 12
Memorandum Account (BioMASSMA), two new memorandum accounts 13
established to track electric procurement costs associated with Power 14
Purchase Agreements (PPA) that were executed to comply with California 15
Public Utilities Commission (CPUC) Resolutions E-4770 and E-4805. These 16
resolutions ordered the large investor-owned utilities to procure a share of 17
capacity from existing biomass facilities that use specific forest fuels stocks 18
under the Governor's Proclamation on Tree Mortality and the Drought 19
(October 30, 2015). PG&E was required to procure at least 20 megawatts 20
(MW) from this solicitation and subsequently executed one PPA with Burney 21
Forest Products (Burney). Total 2017 BioRAMMA CAISO market revenues 22
were $1,306,713. PG&E executed a second PPA with Wheelabrator Shasta 23
to meet its remaining compliance obligation under Resolution E-4805. The 24
market revenues for the Wheelabrator Shasta contract were recorded in 25
BioMASSMA. Since the capacity procured pursuant to the Burney PPA was 26
27 MW, 20 MW of the total procurement were attributable to meeting the 27
requirements of Resolution E-4770 and recorded to BioRAMMA, while the 28
remaining 7 MW were attributed to meeting the requirements of 29
Resolution E-4805 and recorded in BioMASSMA. Total 2017 BioMASSMA 30
market revenues were $831,825. The disposition of the memo accounts' 31
balances into a new Tree Mortality Non-Bypassable Charge balancing 32
account will occur upon its approval by the CPUC currently anticipated 33
toward the end of 2018. 34

9-7
G Conclusion 1
The above testimony describes the CAISO costs that were incurred during 2
the record period and demonstrates that these costs were reasonable and 3
prudently incurred. 4

PACIFIC GAS AND ELECTRIC COMPANY
CHAPTER 10
REVIEW ENTRIES RECORDED IN THE GREEN TARIFF SHARED
RENEWABLES MEMORANDUM ACCOUNT AND THE GREEN
TARIFF SHARED RENEWABLES BALANCING ACCOUNT

10-i
PACIFIC GAS AND ELECTRIC COMPANY CHAPTER 10
REVIEW ENTRIES RECORDED IN THE GREEN TARIFF SHARED RENEWABLES MEMORANDUM ACCOUNT AND THE GREEN TARIFF SHARED RENEWABLES
BALANCING ACCOUNT
TABLE OF CONTENTS
A. Introduction ..................................................................................................... 10-1
B. Green Tariff Shared Renewables Memorandum Account .............................. 10-2
1. Description of Costs Incurred ................................................................... 10-2
2. Program Management ............................................................................. 10-3
3. IT/Billing System Work ............................................................................. 10-3
4. Energy Procurement ................................................................................ 10-4
5. Contact Center Operations ...................................................................... 10-4
6. Outreach .................................................................................................. 10-4
C. Green Tariff Shared Renewables Balancing Account..................................... 10-4
1. Background .............................................................................................. 10-4
2. Rate Design Overview ............................................................................. 10-6
3. Balancing Account Entries for the Record Period .................................... 10-8
D. Conclusion ...................................................................................................... 10-8

10-1
PACIFIC GAS AND ELECTRIC COMPANY 1
CHAPTER 10 2
REVIEW ENTRIES RECORDED IN THE GREEN TARIFF SHARED 3
RENEWABLES MEMORANDUM ACCOUNT AND THE GREEN 4
TARIFF SHARED RENEWABLES BALANCING ACCOUNT 5
A. Introduction 6
In this chapter, Pacific Gas and Electric Company (PG&E) presents its 2017 7
recorded Green Tariff Shared Renewables (GTSR) administrative and marketing 8
costs for reasonableness review, as directed by the California Public Utilities 9
Commission (CPUC or Commission) in Decision (D.) 15-01-051, the Decision 10
Approving Green Tariff Shared Renewables Program for San Diego Gas & 11
Electric Company, Pacific Gas and Electric Company, and Southern California 12
Edison Company Pursuant to Senate Bill 43. In addition, PG&E is presenting 13
costs and revenues recorded to the Green Tariff Shared Renewables Balancing 14
Account (GTSRBA) for review to ensure compliance with applicable tariffs1 and 15
Commission directives, as required in D.15-01-051.2 16
Senate Bill (SB) 43 requires the three large electrical utilities to implement 17
the GTSR Program. SB 43 further requires that participating customers pay the 18
administrative and marketing costs of the GTSR Program.3 The 19
Investor-Owned Utilities (IOU) are collecting administrative costs, as well 20
as marketing costs, from GTSR customers through specific charges. 21
In D.15-01-051, the Commission required that administrative and marketing 22
costs be tracked in a memorandum account and be subject to reasonableness 23
review in each IOU’s annual ERRA compliance review. Costs that are found not 24
to be reasonable cannot be collected from customers participating in the 25
1 GTSRBA – Electric Preliminary Statement GR:
http://www.pge.com/tariffs/tm2/pdf/ELEC_PRELIM_GR.pdf. 2 D.15-01-051, Finding of Fact (FOF 137): Coordinating review of true-up of GTSR
charges and credits with the Energy Resource Recovery Account (ERRA) process will provide greater certainty that entries to the GTSR accounts are stated correctly and are consistent with Commission decisions and Conclusion of Law (COL 59): It is appropriate for an IOU to provide a summary and true-up of costs and revenues against charges and credits applied to GTSR customers on an annual basis, either through the IOU’s annual ERRA process or in a separate application.
3 D.15-01-051, p. 108.

10-2
program and will be borne by shareholders. Program startup costs that are 1
found to be reasonable can be amortized.4 2
In D.15-10-051, the CPUC approved two program offerings under the 3
GTSR: (1) a “green tariff” (which PG&E began offering to customers in 4
January 2016 under the program name “PG&E’s Solar Choice”); and (2) an 5
“enhanced community renewables” (ECR) offering—which PG&E opened for 6
developer participation in November 2015 and is called “Regional Renewable 7
Choice.” In D.16-05-006, the Decision Addressing Participation of Enhanced 8
Community Renewables Projects in the Renewable Auction Mechanism and 9
Other Refinements to the Green Tariff Shared Renewables Program, the 10
Commission provided further refinements to both programs. 11
B. Green Tariff Shared Renewables Memorandum Account 12
1. Description of Costs Incurred 13
In 2017, PG&E incurred $1 million in expenses in order to implement 14
and manage the GTSR Program. These expenses can be broken down into 15
five major categories: (1) program management; (2) Information 16
Technology (IT)/billing system; (3) energy procurement; (4) contact center 17
operations; and (5) outreach. The recorded expenses, by category, are 18
shown in Table 10-1. The expenses were recorded into a memorandum 19
account in accordance with D.15-01-051.5 PG&E implemented careful 20
tracking of administrative and marketing costs through the use of internal 21
order numbers in order to maintain non-participant indifference of 22
such costs.6 23
4 D.15-01-051, p. 113. 5 D.15-01-051, COL 58, p. 178. 6 PG&E is providing workpapers for this chapter which provide additional detail.

10-3
TABLE 10-1 GTSR MEMO ACCOUNT 2017 RECORDED COSTS
Line No. Description Amount
1 Program Management $257,199 2 IT/Billing System 11,620 3 Energy Procurement 116,740 4 Contact Center Operations 46,004 5 Outreach 576,291
6 Total $1,007,854
2. Program Management 1
PG&E incurred $257,199 in 2017 in program management labor to 2
implement and manage the GTSR Program. The activities associated with 3
this work included ensuring compliance with all regulatory requirements, 4
implementing customer-facing changes to rates and tariffs, overseeing the 5
contact center and billing operations functions, addressing customer 6
inquiries, managing Green-e Energy compliance, and filing approximately 7
two dozen required reports. The program management function also 8
managed the external advisory board and ran four advisory board meetings 9
in 2017. 10
This category of expenses also included basic project management 11
functions, such as: developing budgets and detailed schedules; establishing 12
internal reports; and managing regular team meetings. Finally, this category 13
of work included financial planning and analysis for the program, as 14
well as incidental administrative charges, such as the Green-e Energy 15
certification fee. 16
3. IT/Billing System Work 17
PG&E incurred $11,620 in 2017 in expenses associated with 18
implementing and maintaining the IT and billing system work for the GTSR 19
Program. In 2017 the work entailed only minor maintenance and 20
enhancements of the IT and billing system functionality. 21
The back-end billing system functionality enables: determination of 22
customer eligibility; enrollment and de-enrollment; calculation of appropriate 23
charges; bill presentment; and all associated revenue accounting and 24
reporting. The functionality also enables Customer Service Representatives 25

10-4
(CSR) to view customized bill impacts for customers, and provides CSRs 1
the ability to enroll and de-enroll customers. Finally, the customer-facing 2
website and energy portal enable customers to self-serve at a lower cost to 3
the program by viewing the same customized bill impact information online, 4
and to enroll in or de-enroll from the program directly. 5
4. Energy Procurement 6
PG&E incurred $116,740 in energy procurement expenses associated 7
with implementation of the GTSR. This work included annual program 8
forum planning and participation, a filing to allow participation of Distributed 9
Energy Resource Provider aggregations, two ECR solicitations, addressing 10
issues from executed PPAs in the RAM 6 solicitation, and additional 11
miscellaneous program support. 12
This category of work also included the planning and execution of 13
ongoing contract management, settlements, and reporting work, as well as 14
renewable energy credit tracking, reporting, and retirement. 15
5. Contact Center Operations 16
PG&E incurred $46,004 in contact center operations expenses in 2017. 17
These included supporting customer inquiries, enrollment and de-enrollment 18
in the GTSR Program through the contact centers. It also included 19
maintenance of contact center tools and resources, such as the Interactive 20
Voice Response system and the CSR tools, to better support customers in 21
learning about or enrolling in the program. 22
6. Outreach 23
PG&E incurred $576,291 in contract and labor costs in development of 24
outreach strategies and tactical plans in 2017. This included development 25
and deployment of acquisition and retention tactics: digital advertisements; 26
paid social media; e-mails; direct mail; bill inserts; small and large 27
commercial business sales support; website; and integrating the solar 28
choice message within other relevant communications. 29
C. Green Tariff Shared Renewables Balancing Account 30
1. Background 31
As discussed above, the Commission approved D.15-01-051, 32
implementing the GTSR Program in January 2015. PG&E’s program 33

10-5
includes two GTSR electric rate schedules: Schedule-EGT, Green Tariff 1
Program, and Schedule E-ECR, Enhanced Community Renewables 2
Program. Under E-GT, customers purchase energy supplies via a portfolio 3
of new solar photovoltaic (PV) generation facilities sized 0.5 to 20 MW 4
located within PG&E’s service area and under contract with PG&E. In 2017, 5
no customers took service under the E-ECR tariff. Consistent with the 6
legislative requirement that non-participating customers remain indifferent to 7
the GTSR Program, the Commission determined that each IOU is required 8
to establish a balancing account to track the costs and revenues of the 9
program.7 10
The purpose of the GTSRBA is to track revenues received and actual 11
expenses incurred to procure renewable generation resources for customers 12
participating in the GTSR Program, taking service under the Green Tariff 13
Rate (Schedule E-GT) and the Enhanced Community Renewable 14
(Schedule E-ECR). During the record period, customers only took service 15
under the E-GT option. An overview the GTSRMA and GTSRBA are shown 16
in Table 10-2 below. 17
7 D.15-01-051, p. 129; FOF 145, “A balancing account will allow the IOU to track revenue
under and over collection of GTSR costs using balancing account ratemaking standards.”

10-6
TABLE 10-2 MEMORANDUM AND BALANCING ACCOUNTS
2. Rate Design Overview 1
Table 10-3 below provides the framework for how the credit and charge 2
components are included in the E-GT tariff option, by illustrating where each 3
of the components is reflected in the rates shown in the tariff and how the 4
tariff rates are presented on customers’ bills. As shown in the tables below, 5
the rate components will roll-up to either to the Solar Charge, Power Charge 6
Indifference Adjustment (PCIA) Program Charge or the Program Charge – 7
Other (generation-related). 8

10-7
TABLE 10-3 ALLOCATION OF CHARGES AND CREDITS
Revenues billed under the E-GT option are credited to the GTSRBA 1
account. Specifically, billed revenues to be credited to the account are as 2
follows: 3
Solar Generation; 4
Program Charge – PCIA; and 5
Program Charge – Other. 6
Expenses for the E-GT option recorded to the GTRSBA include solar 7
generation expenses, the PCIA Program Charge, and a Program Charge for 8
the other expenses (generation-related), net of marketing and administration 9
costs. Expenses for the solar generation charge are recorded (debited) to 10
the GTSRBA for interim pool of resources used to support the program and 11
are similarly credited from ERRA. As described in the preliminary statement 12

10-8
the debit to GTSRBA based on the solar generation rate, excluding 1
Franchise Fees and Uncollectibles (FF&U) accounts expense, multiplied by 2
customer usage, in kilowatt-hour (kWh).8 3
Expenses for the generation-related program charge were similarly be 4
credited from ERRA and debited to the GTSRBA based on the generation 5
related program charge, less allowance for FF&U accounts expense, 6
multiplied by customer usage, in kWh. 7
The class average generation revenue credit on customer bills was 8
allocated to the generation balancing accounts based on PG&E’s 9
Preliminary Statement I allocations. The generation revenue credits will 10
offset the otherwise applicable schedule’s generation revenues, recorded to 11
the generation accounts. 12
3. Balancing Account Entries for the Record Period 13
Table 10-4 summarizes the balancing account entries for the record 14
period. As described above, the billed revenues and expense recorded to 15
the account follow the categories illustrated in Table 1-3 above, for both 16
billed revenues and expenses incurred. In addition to recording expenses to 17
the account, in December 2017, PG&E recorded a true-up entry to reflect 18
actual cost incurred for the interim pool resources for 2016 and for 2017 19
costs through November 2017. 20
D. Conclusion 21
In this chapter, PG&E described its 2017 recorded administrative and 22
outreach expenses for the GTSR Program. PG&E’s workpapers include more 23
detailed information regarding the specific, recorded administrative and outreach 24
expenses. PG&E requests that the Commission review and approve that 25
its 2017 recorded administrative and outreach expenses are reasonable. 26
Additionally, this chapter presents PG&E’s entries to the GTSRBA for 27
compliance review. PG&E requests that the Commission find the entries were 28
made to the GTSRBA in compliance with the applicable tariffs and Commission 29
directives.30
8 Revisions to the Preliminary Statement Part CP, Energy Resource Recovery Account,
and Preliminary Statement Part I, Rate Schedule Summary, were made to accommodate entries associated with the GTSR Program.

10-9
TABLE 10-4 BALANCING ACCOUNT ENTRIES
Tariff Line Item DR/CR Tariff Description Jan-17 Feb-17 Mar-17 Apr-17 May-17 Jun-17 Jul-17 Aug-17 Sep-17 Oct-17 Nov-17 Dec-17 FY 2017 YTD
4.a CR A credit entry to the revenue from the E-GT Solar Charge Rate, excluding rf&u (283,702) (227,986) (294,401) (205,382) (226,060) # (234,970) (233,963) (292,983) (288,868) (270,378) (274,226) (315,984) (3,148,901)
4.b CR A credit entry equal to revenue from the E-GT Program Charge rate, excluding the marketing and administrative component of the program charge and excluding rf&u (95,857) (93,604) (117,800) (85,634) (92,194) # (97,618) (99,495) (122,817) (119,979) (112,453) (113,491) (132,768) (1,283,710)
4.c CR A credit entry equal to revenue from the E-ECR Program Charge rate, excluding the market and administrative component of the program charge, and excluding rf&U
Current Month Unbilled Revenue
E-GT Solar Charge Unbilled revenue, excluding rf&u (212,034) (205,603) (211,008) (195,687) (215,552) # (203,701) (216,867) (229,991) (228,447) (241,901) (270,285) (301,169) (2,732,245) Reversal of Prior Month E-GT Solar Charge Unbilled net revenue 204,147 212,034 205,603 211,008 196,210 # 215,090 203,701 216,867 229,991 228,447 241,901 270,285 2,635,285 E-GT / E-ECR Program Charge Unbilled revenue, excluding rf&u (68,107) (66,241) (67,743) (63,124) (69,357) # (65,540) (69,750) (73,970) (73,474) (77,802) (86,930) (96,864) (878,902)
Reversal of Prior Month E-GT / E-ECR Solar Charge Unbilled net revenue 45,537 68,107 66,241 67,743 63,296 # 69,205 65,540 69,750 73,970 73,474 77,802 86,930 827,595 Net Revenues (410,015.18) (313,293.62) (419,107.36) (271,077.31) (343,655.52) (317,534.67) (350,833.26) (433,143.99) (406,806.79) (400,612.85) (425,229.22) (489,569.34) (4,580,879)
Expenses - Solar Charge and Program Charge (includes PCIA)
4.d DR or CR
A debit or credit entry to reflect the solar generation expense associated with the interimpool of renewable resources used to support GTSR Program, if applicable, equal to theSolar Charge rate associated with these resources, excluding the allowance for rf&u,multiplied by the kWh delivered under the program to E-GT customers for the month.
291,589 221,555 299,806 190,062 245,401 223,581 247,129 306,107 287,324 283,832 302,610 346,868 3,245,862
4.e DR or CRA debit or credit entry equal to costs associated with renewable generation resourcesprocured to serve customers participating in GTSR Program and taking service underschedule E-GT.
-
4.f DR or CR
A debit or credit entry to reflect the Program Charge expense associated with the GTSRProgram, excluding marketing and administrative expenses, for customers taking serviceunder Schedule E-GT, equal to the program Charge rate, excluding rf&u, multiplied by thekWh delivered under the program to the E-GT customers for the month.
118,427 91,738 119,302 81,016 98,255 93,954 103,705 127,037 119,483 116,781 122,619 142,702 1,335,017
4.g DR or CR
A debit or credit entry to reflect the Program Charge expense associated with the GTSRProgram, excluding marketing and administrative expenses, for customers taking serviceunder Schedule E-ECR, equal to the Program Charge rate, excluding rf&u, multiplied by thekWh delivered under the program to the E-ECR customers for the month.
-
-
True-up Entries
4.h DR
A debit or credit entry associated with the interim pool of renewable resources equal to thedifference between the Solar Charge rate associated with these resources, excluding heallowance for rf&u, and the actual weighted average solar cost for the interim pool ofrenewable resources, multiplied by the kWh delivered under the program to E-GTcustomers.
9,600 9,600
4.i CR
A debit or credit entry associated with two components of the Program Charge - CaliforniaIndependent System Operator (CAISO) Grid Management Charges (GMC) and WesternRenewable Energy Generation Information System (WREGIS) expenses -equal to thedifference between forecasted rate per kWh for these components and the actual rate perkWh for these components, if applicable, multiplied by the kWh delivered under the programto the E-GT customers and the subscription level in kWh delivered to the E-ECR customers.
-
GTSRBA Monthly Expense 410,015 313,294 419,107 271,077 343,656 317,535 350,833 433,144 406,807 400,613 425,229 499,169 4,590,479
GTSRBA Monthly Activity Before Interest - - - - 0 - - - - - - 9,600 9,600
4.j DR/CR
A monthly entry equal to interest on the average balance in the account at the beginning ofthe month and the balance after the above entries, at a rate equal to one-twelfth of the rateon three-month Commercial Paper for the previous month, as reported in the FederalReserve Statistical Release, H.15 or its successor.
59 64 61 69 73 76 88 94 94 95 97 103 973
GTSRBA Beginning Balance 95,486 95,545 95,608 95,670 95,739 95,812 95,888 95,976 96,070 96,164 96,259 96,356 95,486 GTSRBA Ending Balance 95,545 95,608 95,670 95,739 95,812 95,888 95,976 96,070 96,164 96,259 96,356 106,058 106,058
Billed Revenues - Net
The following revenue entries shall be made each month:
The following expense entries shall be made each month:
The true-up entries shall be made annually as data becomes available:

PACIFIC GAS AND ELECTRIC COMPANY
CHAPTER 11
SUMMARY OF ENERGY RESOURCE RECOVERY ACCOUNT
ENTRIES FOR THE RECORD PERIOD

11-i
PACIFIC GAS AND ELECTRIC COMPANY CHAPTER 11
SUMMARY OF ENERGY RESOURCE RECOVERY ACCOUNT ENTRIES FOR THE RECORD PERIOD
TABLE OF CONTENTS
A. Introduction ..................................................................................................... 11-1
B. The Energy Revenue Recovery Account ........................................................ 11-1
C. Greenhouse Gas Costs in the ERRA Balancing Account ............................... 11-3
1. Authority to Record Costs to ERRA ......................................................... 11-3
2. PG&E’s Greenhouse Gas Cost Recording Process ................................. 11-3
a. PG&E’s Process for Recording of Direct GHG Costs ........................ 11-3
b. PG&E’s Process for Recording Financially Settled GHG Emissions Costs ................................................................................ 11-5
D. Updated Trigger Amount for 2017 .................................................................. 11-5
E. PG&E’s Solar Choice Program ....................................................................... 11-6
F. Renewables Portfolio Standard Cost Memorandum Account ......................... 11-6
G. Variance Analysis ........................................................................................... 11-6
H. Conclusion ...................................................................................................... 11-7

11-1
PACIFIC GAS AND ELECTRIC COMPANY 1
CHAPTER 11 2
SUMMARY OF ENERGY RESOURCE RECOVERY ACCOUNT 3
ENTRIES FOR THE RECORD PERIOD 4
A. Introduction 5
This chapter presents the accounting entries made to Pacific Gas and 6
Electric Company’s (PG&E) Energy Resource Recovery Account (ERRA) for the 7
period January 1 through December 31, 2017 (record period). This testimony 8
demonstrates that the entries to the ERRA comply with the recovery 9
requirements adopted by the California Public Utilities Commission (CPUC 10
or Commission). 11
B. The Energy Revenue Recovery Account 12
The ERRA is a balancing account that was established in Rulemaking 13
(R.) 01-10-024, pursuant to Decision (D.) 02-10-062, Ordering Paragraph 14
(OP) 14, as modified by D.02-12-074. The purpose of the ERRA is to record the 15
actual electric procurement costs and ERRA revenues for recovery of those 16
costs, pursuant to D.02-10-062 and D.02-12-074, as well as Public Utilities Code 17
(Pub. Util. Code) Section 454.5(d)(3). As defined in D.02-10-062, as modified by 18
D.02-12-074, costs recorded in the ERRA include the cost of Utility-Owned 19
Generation (UOG) fuels, Qualifying Facility (QF) contracts, inter-utility contracts, 20
California Independent System Operator (CAISO) charges, irrigation district 21
contracts and other power purchase agreements, bilateral contracts, forward 22
hedges, pre-payments and collateral requirements associated with electric 23
procurement and ancillary services, along with other authorized power 24
procurement costs.1 Revenues from surplus power sales are also recorded in 25
1 As described in Chapter 9, “CAISO Settlements and Monitoring,” page 9-6, PG&E
began recording non-ERRA market revenues and costs in memorandum accounts.

11-2
the ERRA.2 The ERRA excludes costs associated with non-fuel UOG costs.3 1
PG&E’s ERRA forecast revenue requirement and associated rates are filed 2
annually in June in a separate CPUC proceeding. 3
D.03-07-030 in the Direct Access Suspension R.02-01-011 determined that 4
the calculation of the ongoing Competition Transition Charge (CTC) in 2004 and 5
in future years would be set in the ERRA Forecast proceeding. Costs that are 6
eligible to be collected as an Ongoing CTC are defined in Pub. Util. Code 7
Section 367(a), including QF purchase power contracts and other historical 8
purchase power obligations; these costs are recorded and recovered through 9
the ERRA. Above-market costs that are determined to be eligible for recovery 10
as an Ongoing CTC are credited out of ERRA and recovered through the 11
Modified Transition Cost Balancing Account. 12
D.06-07-029 and D.07-09-044 approved guidelines for allocation of costs 13
and benefits for resources authorized for the Cost Allocation Mechanism (CAM), 14
which recovers the net capacity costs for resources providing Resource 15
Adequacy benefits. D.10-12-035 subsequently authorized recovery of net 16
capacity costs for certain contracts arising from the QF and Combined Heat and 17
Power Settlement. Both of these resource types are recovered through the 18
CAM rate and recorded to the New System Generation Balancing Account 19
(NSGBA). The Commission authorized the CAM effective January 1, 2012.4 20
Net capacity costs that are eligible for recovery through the CAM are credited 21
out of ERRA and recovered through the NSGBA. 22
In OP 19 of D.02-12-074, the Commission directed the three California 23
Investor-Owned Utilities (IOU) to submit ERRA balancing account activity 24
reports (ERRA activity reports) each month to the Energy Division no later than 25
20 days following the end of the month. These monthly reports provide the 26
Commission with an opportunity to review monthly transactions in advance of 27
2 D.02-12-074 modified D.02-10-062 to include the Electric Energy Transaction
Administration costs in the General Rate Case (GRC) proceedings. 3 As set forth in Appendix D of D.02-10-062, the capital-related revenue requirement
associated with PG&E’s UOG (Diablo Canyon, fossil-fueled plants, and hydroelectric facilities) are recovered through base rates in PG&E’s GRC proceedings. Non-fuel variable operations and maintenance costs are also recovered through the base rates established in GRC proceedings.
4 D.11-12-031, OP 1.

11-3
the annual ERRA Compliance Review application.5 As of December 31, 2017, 1
the balance in the ERRA was under-collected by $70.6 million. Table 11-2 2
summarizes the monthly accounting entries made to the ERRA from January 1 3
through December 31, 2017. 4
On January 16, 2014, the Commission issued D.14-01-011, which among 5
other things approved a settlement agreement between PG&E and Office of 6
Ratepayer Advocates (ORA).6 Section 2.4.3 of the settlement agreement 7
provided that PG&E perform an accounting audit of the ERRA at least once 8
every four years. The first audit covered the January 1, 2013 to December 31, 9
2013 record period. Thus, the January 1, 2017 to December 31, 2017 record 10
period is subject to an audit. PG&E is in process of determining the timing of 11
this audit and will present the results of the audit to ORA once the audit is 12
complete. 13
C. Greenhouse Gas Costs in the ERRA Balancing Account 14
1. Authority to Record Costs to ERRA 15
In OP 10 of D.12-04-046, PG&E was granted authority to recover the 16
costs incurred for greenhouse gas (GHG) compliance instrument 17
transactions through ERRA. Direct GHG costs are recorded pursuant to 18
accounting procedure 5.ah.7,8 Direct GHG costs are those costs related to 19
PG&E’s physical procurement of GHG compliance instruments consistent 20
with its BPP authority. 21
2. PG&E’s Greenhouse Gas Cost Recording Process 22
a. PG&E’s Process for Recording of Direct GHG Costs 23
As explained below, the costs associated with PG&E’s purchases of 24
GHG compliance instruments in a given year will not agree to the costs 25
recorded in the ERRA for the same year. If PG&E were to participate in 26
the quarterly Air Resources Board (ARB) auction, those compliance 27
5 A full set of these 2017 reports are included in PG&E’s confidential workpapers. 6 OP 1 of D.14-01-011 approved the Settlement Agreement. 7 See PG&E’s Electric Preliminary Statement Part CP, ERRA at Sheet 8, available at
http://www.pge.com/tariffs/tm2/pdf/ELEC_PRELIM_CP.pdf. 8 Any applicable broker fees are included in this line item. PG&E is authorized to use
brokers for GHG procurement in its Bundled Procurement Plan (BPP).

11-4
instruments would be recorded to PG&E’s inventory when auction 1
results are released.” GHG compliance instruments and offset credits 2
purchased from other third-party sellers is recorded to PG&E’s inventory 3
when they are received. When GHG emissions are recognized as 4
expense, as described below, the associated cost of compliance 5
instruments are recorded in ERRA at the Weighted Average Cost 6
(WAC) of the inventory.9 7
For any given month, the emissions expense charged to ERRA 8
reflects the product of: (1) the best available volume of emissions (BAV) 9
associated with PG&E’s Direct GHG obligations; and (2) the WAC of 10
GHG compliance instruments in PG&E’s inventory that can be used to 11
satisfy this obligation. 12
The monthly BAV represents PG&E’s best available emissions 13
quantities for the month. After the dispatch month, the emissions are 14
estimated by measuring the quantity of fossil fuels combusted by a 15
generating unit and converting it to GHG emissions equivalent 16
(i.e., millions of metric tons of emissions).10 The BAV is adjusted in 17
subsequent months by “true-ups” or “true-downs” to take into account 18
better information that PG&E receives concerning previous month 19
emissions quantities. 20
The WAC is calculated for each specified compliance period. The 21
WAC is calculated by dividing the total costs associated with purchasing 22
GHG compliance instruments for PG&E’s electric portfolio over time by 23
the number of available compliance instrument units held in inventory for 24
the applicable compliance period. Compliance instruments held in 25
inventory are segregated by their eligible compliance periods (based on 26
the vintage year). This methodology is done in accordance with 27
generally accepted accounting practices. 28
9 When the cost, or debit, is recorded in the ERRA, a corresponding entry, a credit, is
recorded to a liability account, reflecting PG&E’s liability to surrender GHG compliance instruments to the ARB. The inventory and liability accounts are reduced when the GHG compliance instruments have been surrendered to the ARB and/or transferred to a third party.
10 For natural gas generation units, PG&E utilizes a conversion factor of 0.053 metric tons of carbon dioxide equivalent ($/mtCO2e) per Million British Thermal Units.

11-5
The Accounting expense is then determined by comparing the total 1
change in the expected gross emissions expense inception to date less 2
the total cumulative recorded emissions expense inception to date. The 3
emissions expense is based on the current WAC of inventory 4
($/mtCO2e) multiplied by emissions volumes ($/mtCO2e). 5
PG&E and ORA have recently reached a settlement on a verification 6
methodology for purposes of facilitating a transparent and efficient audit 7
as it relates to the recording of Direct GHG costs. The Final Joint 8
Proposal on Potential Verification Method for PG&E’s GHG Emissions 9
and WAC for Future ERRA Compliance Filings is attached as 10
Attachment A. 11
b. PG&E’s Process for Recording Financially Settled GHG Emissions 12
Costs 13
As noted in Chapter 7, Greenhouse Gas Compliance Instrument 14
Procurement, PG&E has the option to elect financial settlement of GHG 15
emissions obligations with some of its tolling counterparties.11 In these 16
cases, GHG emission costs are embedded within the contract payments 17
made to the counterparty and therefore recorded in the same ERRA 18
accounting procedure as the contract costs. For example, financially 19
settled tolling agreement costs for both the contract and GHG emissions 20
payments made to the counterparty are recorded in the ERRA pursuant 21
to accounting procedure 5.p for bilateral contracts. 22
D. Updated Trigger Amount for 2017 23
On March 30, 2017, PG&E submitted Advice Letter (AL) 5040-E requesting 24
that the Commission approve PG&E’s 2017 ERRA Trigger amount of 25
$279 million and the threshold amount of $349 million. The trigger amount is the 26
maximum allowable forecast over- or under-collection before an IOU would be 27
required to file an expedited application for a rate change and is equal to 28
4 percent of the prior year’s generation revenues, excluding the revenues 29
associated with the California Department of Water Resources (CDWR.) The 30
threshold amount is equal to 5 percent of the prior year’s generation revenues, 31
11 See Chapter 7, Section C.1., p. 7-5.

11-6
excluding the revenues associated with the CDWR. The CPUC approved 1
AL 5040-E with an effective date of March 30, 2017. 2
E. PG&E’s Solar Choice Program 3
The Green Tariff Shared Renewables (GTSR) Program became effective 4
January 1, 2016. Consistent with the legislative requirement that 5
non-participating customers remain indifferent to the GTSR Program, the 6
Commission determined that each IOU is required to establish a balancing 7
account to track the costs and revenues of the program. ERRA accounting 8
procedures 5.al, 5.am, 5.an, 5.ao, 5.ap and 5.aq enable the transfer of costs 9
between ERRA and the GTSR balancing accounts. In addition, the IOUs are 10
required to establish a memorandum account to track the program 11
administrative and marketing costs. Chapter 10 of PG&E’s Prepared Testimony 12
includes a presentation of administrative and marketing costs incurred in the 13
GTSR Memorandum Account in 2017 that are subject to reasonableness review 14
in this proceeding. 15
F. Renewables Portfolio Standard Cost Memorandum Account 16
The Renewables Portfolio Standard Cost Memorandum Account (RPSCMA) 17
was established to track third-party consultant costs incurred by the CPUC and 18
paid by PG&E in connection with the CPUC’s implementation and administration 19
of the Renewables Portfolio Standard (RPS) as authorized in D.06-10-050.12 20
The CPUC’s Energy Division reviews and approves invoices it receives from 21
independent consultants. PG&E pays the invoiced amount and records the 22
costs in the RPSCMA, and D.06-10-050 authorizes PG&E to request recovery in 23
rates through the ERRA application or other proceeding as authorized by the 24
Commission.13 In 2017, the Energy Division staff did not submit any invoices to 25
PG&E for payment of consulting services. 26
G. Variance Analysis 27
In Table 11-1, PG&E provides a summary of the ERRA procurement costs 28
recorded in the current record review period compared to the forecast included 29
12 Renewable Portfolio Standard Cost Memorandum Account Preliminary Statement:
http://www.pge.com/tariffs/tm2/pdf/ELEC_PRELIM_EL.pdf. 13 D.06-10-050, OP 8.

11-7
in its 2017 ERRA Forecast November Update Application, approved by the 1
Commission in D.16-12-038.2
TABLE 11-12017 ACTUAL RECORDED COSTS COMPARED TO APPROVED FORECAST
Line No. Description
Electric Preliminary Statement Part CP
Accounting ProcedureReference
2017Actual
Recorded
2017Approved Forecast Variance
1 UOG Hydro (incl. IDWA) 5.l and 5.s2 Nuclear Fuel 5.m and 5.y3 QF Contracts 5.n, 5.o, 5.ae & 5.ag4 Post-2002 RPS Eligible 5.r5 Fuel for UOG/NonUOG Gen
(Including Large Hydro), Bilateral Contracts, and Direct GHG Procurement Costs
5.j, 5.k, 5.p and 5.ah
6 Net Market Purchase 5.c and 5.t
7 Subtotal
8 Bilateral Demand Response 5.x9 Hedging Cost 5.q
10 CAISO-Related Cost 5.i, 5.z, and 5.ac11 Other Cost 5.v, 5.w, 5.aa, 5.ad,
5.ak, 5.al, 5.ap12 CTC & CAM Credits 5.g, 5.h, and 5.af
13 Total Procurement Cost Recorded in ERRA(a)
$3,879.2 $4,083.2 $(204.0)
_______________
(a) Some totals may not add precisely because of rounding.
As Table 11-1 indicates, PG&E’s procurement costs recorded in ERRA were 3
$204.0 million lower than forecasted primarily due to lower than forecast load 4
and market prices.5
A more detailed variance analysis of forecasted and actual amounts is 6
included in PG&E’s confidential workpapers for Chapter 11.7
H. Conclusion8
PG&E has complied with the Commission’s directives and has appropriately 9
recorded entries to the ERRA. PG&E requests that upon verification and review 10
of the costs and revenues recorded to the ERRA the Commission find the ERRA 11
entries presented in Table 11-2 for the record period are reasonable and in 12
compliance with Commission decisions.13

TABL
E 11
-2EN
ERG
Y R
ESO
UR
CE
REC
OVE
RY
ACC
OU
NT
FOR
TH
E YE
AR E
ND
ING
DEC
EMBE
R 3
1, 2
017
Tarif
f Li
ne
Item
DR/C
RTa
riff D
escr
iptio
nJa
n-17
Feb-
17M
ar-1
7Ap
r-17
May
-17
Jun-
17Ju
l-17
Aug-
17Se
p-17
Oct
-17
Nov-
17De
c-17
FY 2
017
YTD
5.a.
CRA
cred
iten
tryeq
ual
toth
ere
venu
efro
mth
eER
RA
rate
com
pone
ntfro
mbu
ndle
dcu
stom
ers
durin
gth
em
onth
,ex
DXu
ding
the
allo
wan
cefo
rFr
anch
ise
Fees
and
Unc
olle
ctib
le (F
F&U
) Acc
ount
s ex
pens
e;
Bille
d R
even
ues
Cur
rent
Mon
th U
nbille
d R
even
ueR
ever
sal o
f Prio
r Mon
th U
nbille
d R
even
ueG
ross
Rev
enue
s
Less
: FF
&U F
acto
r
Rev
enue
s N
et o
f FF&
U
(30
4,65
6,36
1.26
)
(251
,719
,221
.42)
(2
86,6
78,2
16.6
4)
(277
,633
,268
.35)
(2
96,2
56,2
27.1
4)
(329
,015
,684
)
(390
,255
,781
)
(357
,132
,109
)
(318
,627
,115
)
(265
,911
,909
)
(241
,859
,781
)
(261
,061
,191
)
(3,5
80,8
06,8
65)
5.b.
CRA
cred
iten
tryeq
ualt
oR
MR
and
anci
llary
serv
ices
reve
nues
from
PG&E
-ow
ned
gene
ratio
nfa
cilit
ies;
5.c.
CRA
cred
iten
tryeq
ual
tosu
rplu
ssa
les
reve
nues
allo
cate
dto
PG&E
per
the
Ope
ratin
gAg
reem
ent b
etw
een
PG&E
and
the
DW
R, i
f app
licab
le;
5.d.
CRA
cred
it en
try e
qual
to re
venu
es re
ceiv
ed fr
om S
ched
ule
TBC
C;
5.e.
CRA
cred
it en
try e
qual
to re
venu
e as
soci
ated
with
des
igna
ted
sale
s;
5.f.
DRA
debi
tent
ryeq
ualt
one
gativ
eon
e(-
1)tim
esth
ePo
wer
Cha
rge
Indi
ffere
nce
Adju
stm
ent
(PC
IA)l
ess
the
DW
Rfra
nchi
sefe
e,pu
rsua
ntto
D.0
6-07
-030
,exD
Xudi
ngth
eal
low
ance
for
Fran
chis
e Fe
es a
nd U
ncol
lect
ible
(FF&
U) A
ccou
nts
expe
nse.
5.g.
CRA
cred
iten
tryeq
ualt
oth
eco
sts
for
ongo
ing
CTC
asso
ciat
edw
ithQ
Fob
ligat
ions
and
PPA
oblig
atio
ns, a
bove
the
mar
ket b
ench
mar
k cu
rrent
ly a
dopt
ed b
y th
e C
omm
issi
on;
5.h.
DRA
debi
ten
tryeq
ual
tone
gativ
eab
ove-
mar
ket
cost
s,th
atar
eap
plie
dto
posi
tive
abov
e-m
arke
t cos
ts in
the
MTC
BA;
5.i.
DRA
debi
t ent
ry e
qual
to th
e am
ount
pai
d fo
r ISO
-rela
ted
char
ges;
5.j.
DRA
debi
tent
ryeq
ualt
oth
esu
mfo
rth
em
onth
ofth
epr
oduc
tof
:(1
)th
eM
illion
sof
Briti
shTh
erm
alU
nits
(MM
Btu)
ofna
tura
lga
sbu
rned
daily
for
all
purp
oses
atPG
&E’s
foss
ilpl
ants
;an
d(2
)th
atda
y’s
wei
ghte
d-av
erag
eco
stof
gas
ona
Util
ityEl
ectri
cG
ener
atio
n(U
EG) p
ortfo
lio b
asis
($/M
MBt
u);
5.k.
DRA
debi
tent
ryeq
ualt
oth
esu
mfo
rth
em
onth
ofth
epr
oduc
tof:
(1)
the
barr
els
ofdi
stilla
tean
dhe
avy
fuel
oil
burn
edda
ilyfo
ral
lpu
rpos
esat
the
foss
ilpl
ants
;an
d(2
)th
atda
y’s
wei
ghte
d-av
erag
e co
st o
f dis
tilla
te o
r fue
l oil
per b
arre
l on
a “la
st-in
-firs
t-out
” (LI
FO) b
asis
;
5.l.
DRA
debi
tent
ryeq
ualt
oth
ehy
droe
lect
ricfu
elex
pens
es.
The
fuel
expe
nses
inD
Xude
wat
erpu
rcha
se c
osts
for t
he h
ydro
elec
tric
plan
ts;
5.m
.DR
A de
bit e
ntry
equ
al to
fuel
exp
ense
s fo
r the
Dia
blo
Can
yon
NuD
Xear
Pow
er P
lant
;
5.n.
DRA
debi
ten
tryeq
ual
toto
tal
cost
sas
soci
ated
with
QF
oblig
atio
nsth
atar
eel
igib
lefo
rre
cove
ry a
s an
ong
oing
CTC
;
5.o.
DRA
debi
ten
tryeq
ualt
oto
talc
osts
asso
ciat
edw
ithQ
Fob
ligat
ions
that
are
not
elig
ible
for
reco
very
as
an o
ngoi
ng C
TC;
5.p.
DRA
debi
t ent
ry e
qual
to b
ilate
ral c
ontra
ct o
blig
atio
ns;
5.q.
DRA
debi
t ent
ry e
qual
to h
edgi
ng c
ontra
ct o
blig
atio
ns;
5.r.
DRA
debi
tent
ryeq
ualt
ore
new
able
cont
ract
oblig
atio
nsan
dfe
esas
soci
ated
with
parti
cipa
ting
in W
REG
IS;
5.s.
DRA
debi
tent
ryeq
ualt
oco
sts
asso
ciat
edw
ithirr
igat
ion
dist
rictc
ontra
cts
and
othe
rpur
chas
epo
wer
obl
igat
ions
, exc
ludi
ng W
APA
but i
nclu
ding
cap
acity
con
tract
obl
igat
ions
;
5.t.
DRA
debi
t ent
ry e
qual
to s
pot m
arke
t pur
chas
es;
5.u.
DRA
debi
t ent
ry e
qual
to s
yste
m to
lling
or c
apac
ity c
ontra
ct o
blig
atio
ns;
5.v.
DR/C
RA
debi
t or c
redi
t ent
ry e
qual
to p
re-p
aym
ents
and
cre
dit a
nd c
olla
tera
l pay
men
ts, i
nDXu
ding
al
lass
ocia
ted
fees
,fo
rpr
ocur
emen
tpu
rcha
sean
d,if
appl
icab
le,
reim
burs
emen
tsof
pre-
paym
ents
, cre
dit a
nd c
olla
tera
l pay
men
ts;
5.w
.DR
A de
bit e
ntry
equ
al to
any
oth
er p
ower
cos
ts a
ssoc
iate
d w
ith p
rocu
rem
ent;
5.x.
DRA
debi
tent
ryeq
ualt
oin
cent
ive
paym
ents
rela
ted
toau
thor
ized
bila
tera
ldem
and
resp
onse
agre
emen
ts;
5.y.
DRA
mon
thly
entry
equa
lto
the
inte
rest
onth
em
onth
lynu
DXe
arfu
elin
vent
ory
atth
ebe
ginn
ing
ofth
em
onth
and
one-
half
the
bala
nce
ofth
ecu
rren
tmon
th’s
activ
ity,m
ultip
lied
ata
rate
equa
lto
one-
twel
fthof
the
rate
onth
ree-
mon
thC
omm
erci
alPa
perf
orth
epr
evio
usm
onth
, as
repo
rted
in th
e Fe
dera
l Res
erve
Sta
tistic
al R
elea
se, H
.15
or it
s su
cces
sor;
5.z.
DR/C
RA
cred
it or
deb
it en
try e
qual
to th
e re
venu
es o
r cos
ts re
late
d to
CR
Rs;
5.aa
.DR
Ade
bit
entry
equa
lto
the
incr
emen
tal
IEco
sts
thro
ugh
2014
rela
ted
toR
FOs
seek
ing
term
sof
less
than
five
year
s.Af
ter
2014
,ade
bite
ntry
equa
lto
allI
Eco
sts
rela
ted
toal
lR
FOs;
5.ab
.DR
A de
bit e
ntry
equ
al to
act
ual w
ave
ener
gy p
roje
ct (W
aveC
onne
ct) e
xpen
ditu
res
5.ac
.DR
/CR
A cr
edit
or d
ebit
entry
equ
al to
the
reve
nues
or c
osts
rela
ted
to c
onve
rgen
ce b
iddi
ng;
5.ad
.DR
Ade
bite
ntry
equa
lto
pow
erpu
rcha
sepa
ymen
tspr
ovid
edto
elig
ible
Net
Ener
gyM
eter
ing
cust
omer
sfo
ren
ergy
prod
uced
byon
-site
gene
ratio
nin
exce
ssof
cons
umpt
ion
over
a12
-m
onth
perio
d.Po
wer
purc
hase
paym
ents
may
inD
Xude
addi
tiona
lco
mpe
nsat
ion
for
rene
wab
le a
ttrib
utes
whe
re a
pplic
able
.
5.ae
.DR
A de
bit e
ntry
equ
al to
the
capa
city
and
ene
rgy
cost
s fo
r QF/
CH
P Pr
ogra
m c
ontra
cts.
5.af
.CR
Acr
edit
entry
equa
lto
the
netc
apac
ityco
sts
reco
rded
inth
eQ
F/C
HP
Prog
ram
and
Mar
shLa
ndin
g su
bacc
ount
s of
the
New
Sys
tem
Gen
erat
ion
Bala
ncin
g Ac
coun
t (N
SGBA
).
5.ag
.DR
/CR
Ade
bit
orcr
edit
entry
equa
lto
the
cost
orre
venu
eas
soci
ated
with
com
bine
dhe
atan
dpo
wer
syst
ems
auth
oriz
edin
D.0
9-12
-042
,D.1
0-12
-055
and
D.1
1-04
-03
3,an
dde
fined
inPG
&E’s
tarif
fs E
-CH
P, E
-CH
PS, a
nd E
-CH
PSA;
11-8

TABL
E 11
-2EN
ERG
Y R
ESO
UR
CE
REC
OVE
RY
ACC
OU
NT
FOR
TH
E YE
AR E
ND
ING
DEC
EMBE
R 3
1, 2
017
(CO
NTI
NU
ED)
Tarif
f Li
ne
Item
DR/C
RTa
riff D
escr
iptio
nJa
n-17
Feb-
17M
ar-1
7Ap
r-17
May
-17
Jun-
17Ju
l-17
Aug-
17Se
p-17
Oct
-17
Nov-
17De
c-17
FY 2
017
YTD
5.ah
.DR
Ade
bit
entry
equa
lto
the
GH
Gpr
ocur
emen
tco
sts
for
PG&E
’sG
HG
com
plia
nce
inst
rum
ent t
rans
actio
ns u
nder
the
Cal
iforn
ia c
ap-a
nd-tr
ade
prog
ram
pur
suan
t to
AB 3
2.
5.ai
.CR
Acr
edit
entry
equa
lto
one-
twel
fthof
the
auth
oriz
edfo
reca
sted
dire
ctan
din
dire
ctG
HG
cost
s, d
efer
red
for f
utur
e re
cove
ry in
rate
s.
5.aj
.DR
Ade
bit
entry
equa
lthe
auth
oriz
eden
ergy
stor
age
proc
urem
ent
eval
uatio
npr
ogra
mfu
ndam
ount
aut
horiz
ed in
D.1
4-10
-045
.
5.ak
.DR
Acr
edit
orde
bit
entry
tore
flect
the
sola
rge
nera
tion
expe
nse
asso
ciat
edw
ithth
ein
terim
pool
of r
enew
able
reso
urce
s
5.al
.DR
Acr
edit
orde
bite
ntry
tore
flect
the
Prog
ram
Cha
rge
expe
nse
asso
ciat
edw
ithth
eG
TSR
prog
ram
5.am
.DR
Acr
edit
orde
bit
entry
tore
flect
Prog
ram
Cha
rge
expe
nse
asso
ciat
edw
ithth
eG
TSR
prog
ram
5.an
.DR
Ade
bito
rcr
edit
entry
equa
lto
expe
nses
asso
ciat
edw
ithth
eG
TSR
Prog
ram
’sEn
hanc
edC
omm
unity
Sol
ar (E
CR
) opt
ion
reso
urce
s th
at is
uns
ubsc
ribed
5.ao
.DR
Ade
bit
orcr
edit
entry
totra
nsfe
rex
pens
esfro
mth
eG
TSR
BAfo
rre
new
able
reso
urce
spr
ocur
ed
5.aq
.DR
Ade
bite
ntry
equa
lto
the
year
-end
bala
nce
trans
ferr
edfro
mth
eLo
ng-T
erm
Proc
urem
ent
Plan
Tec
hnic
al A
ssis
tanc
e M
emor
andu
m A
ccou
nt (L
TAM
A).
ERRA
Mon
thly
Act
ivity
Bef
ore
Inte
rest
(65,
316,
402)
(
31,8
00,5
44)
(
60,8
87,2
39)
(
42,0
34,2
97)
(
23,9
09,1
25)
1
00,0
46,7
87
38,9
67,7
63
81,2
88,7
21
41,9
94,6
95
26,7
60,2
50
(
41,6
69,3
30)
(
49,9
63,9
52)
(26
,522
,672
)-
-5.
ap.
DR/C
RA
mon
thly
entry
equa
lto
inte
rest
onth
eav
erag
eba
lanc
ein
the
acco
unta
tthe
begi
nnin
gof
the
mon
than
dth
eba
lanc
eaf
tert
heab
ove
entri
es,a
tara
teeq
ualt
oon
e-tw
elfth
ofth
era
teon
thre
e-m
onth
Com
mer
cial
Pape
rfo
rth
epr
evio
usm
onth
,as
repo
rted
inth
eFe
dera
lR
eser
ve S
tatis
tical
Rel
ease
, H.1
5 or
its
succ
esso
r.
Begi
nnin
g Ba
lanc
e
9
6,75
9,36
8
31
,480
,997
(308
,748
)
(61
,226
,359
)
(103
,320
,223
)
(127
,317
,981
)
(27
,332
,521
)
11
,628
,118
92
,967
,806
135
,074
,568
161
,980
,799
120
,453
,792
96,7
59,3
68
Endi
ng B
alan
ce
3
1,48
0,99
7
(308
,748
)
(61
,226
,359
)
(103
,320
,223
)
(127
,317
,981
)
(27
,332
,521
)
11
,628
,118
92
,967
,806
135
,074
,568
161
,980
,799
120
,453
,792
70
,591
,762
70,5
91,7
62
11-9
PACIFIC GAS AND ELECTRIC COMPANY
CHAPTER 11
ATTACHMENT A
FINAL JOINT PROPOSAL ON POTENTIAL VERIFICATION
METHOD FOR PG&E’S GREENHOUSE GAS EMISSIONS AND
WEIGHTED AVERAGE COSTS FOR FUTURE ERRA
COMPLIANCE FILING

11-AtchA-i
PACIFIC GAS AND ELECTRIC COMPANY CHAPTER 11
ATTACHMENT A FINAL JOINT PROPOSAL ON POTENTIAL VERIFICATION METHOD FOR
PG&E’S GREENHOUSE GAS EMISSIONS AND WEIGHTED AVERAGE COSTS FOR FUTURE ERRA COMPLIANCE FILING
TABLE OF CONTENTS
A. Definitions of Terms Based on D.14-10-033 ........................................ 11-AtchA-1
B. PG&E's Proposed Definitions of Terms ............................................... 11-AtchA-1
C. Attachments A and B ........................................................................... 11-AtchA-2
D. ORA's Sample ..................................................................................... 11-AtchA-4
E. PG&E's Response to ORA Sample ..................................................... 11-AtchA-4

11-AtchA-1
PACIFIC GAS AND ELECTRIC COMPANY 1
CHAPTER 11 2
ATTACHMENT A 3
FINAL JOINT PROPOSAL ON POTENTIAL VERIFICATION METHOD 4
FOR PG&E’S GREENHOUSE GAS EMISSIONS AND WEIGHTED 5
AVERAGE COSTS FOR FUTURE ERRA COMPLIANCE FILING 6
A. Definitions of Terms Based on D.14-10-033 7
1) Recorded Direct GHG Costs: 8
The recorded direct Greenhouse Gas (GHG) costs include two 9 variables: (a) total direct emissions, and (b) costs of compliance 10 instruments purchased to satisfy this liability. Recorded year direct 11 GHG costs represent the actual costs for Utility-Owned Generation 12 (UOG) and imports, tolls and other contracts for which the utility has 13 responsibility for cap-and trade costs.1,2 14
2) Recorded: 15
We use the term “recorded” to describe both the actual cost and 16 revenue amounts recorded, and the estimate of indirect GHG costs 17 embedded in electricity prices.3 18
3) Direct Emissions: 19
Direct emissions should be calculated on an annual basis based on 20 monthly dispatched resources using methodologies consistent with the 21 Auction Rate Bond regulations for measuring GHG emissions.4 22
B. PG&E's Proposed Definitions of Terms 23
1) “December Close” means represents the best available information/data 24
(i.e., Weighted Average Costs (WAC), emissions volumes, etc.) for the 25
1 D.14-10-033, p.18. 2 D.14-10-033, p.18. Also, Footnote 24, states: “The specific terms of a utility’s contract
may specify whether the utility provides physical compensation (a transfer of compliance instruments) or financial compensation (payment to the entity for the cost of the applicable compliance instruments) for the cap-and-trade costs. Physical settlement is a direct cost, but the utilities can choose to report financially settled tolling agreements as direct or indirect costs. Financially settled qualifying facility contracts where the financial obligation is embedded in the market price of energy purchases or within the specific contract terms for energy payment may be categorized as indirect GHG costs.” D.14-10-033, p. 18.
3 D.14-10-033, Footnote 10, p. 8. 4 D.14-10-033, p. 18.

11-AtchA-2
entire Record Year as of the month ended December, as available during 1
the month end accounting close. 2
2) “Direct Physical GHG Costs” means those actual costs resulting from Pacific 3
Gas and Electric Company’s (PG&E) need to procure GHG compliance 4
instruments in connection with (1) UOG facilities; (2) certain tolling 5
agreements where PG&E elects to physically settle contractual GHG 6
obligations; and (3) electricity imports. Direct Physical GHG Costs are 7
recorded to the Energy Resource Recovery Account (ERRA) Balancing 8
Account Line Item 5 ah. 9
3) “Direct Physical GHG Emissions” are GHG emissions associated with (1) 10
UOG facilities; (2) certain tolling agreements where PG&E elects to 11
physically settle contractual GHG obligations; and (3) electricity imports. 12
4) “Financial GHG Costs” are GHG costs associated with PG&E's tolling 13
agreements and other contracts for which PG&E elects to financially settle 14
contractual GHG obligations or contract with financial settlement specifically 15
for GHG costs. Financial GHG Costs are recorded to ERRA Balancing 16
Account Line Items other than Line Item 5 ah. 17
5) “Financially Settled GHG Emissions” are GHG emissions associated with 18
PG&E's tolling agreements and other contracts for which PG&E elects to 19
financially settle contractual GHG obligations or contracts with financial 20
settlement specifically for GHG costs. 21
6) “PG&E’s Electric Portfolio” includes those UOG or electric generation 22
facilities contracted to PG&E. PG&E’s Electric Portfolio does not include 23
resources use to serve PG&E’s natural gas utility customers. 24
7) “Record Year” refers to the calendar year addressed in an ERRA 25
Compliance Application. 26
C. Attachments A and B 27
In its 2017 and subsequent ERRA Compliance Applications, PG&E is to 28
complete and submit Template C of Attachment C, and Modified Template D-2 29
of Attachment D of D.15-01-024 (See Attachments A and B, respectively 30
provided at the end of this document). Information used to populate 31
Attachments A and B will be as of the close of the Record Year, which is the 32
best available information at the time of December close, and so will not 33
necessarily be identical to tables provided in the ERRA Forecast Proceeding. 34

11-AtchA-3
Information and recorded entries made after December close will not be used to 1
populate information presented in Attachments A and B. 2
1) To support PG&E’s WAC and Direct Physical GHG Costs for the Record 3
Year, PG&E will submit tables in substantially the form of Attachment A as a 4
workpaper to its ERRA Compliance Application. 5
The purpose of Attachment A, Table 1, is to calculate the WAC of 6
compliance instruments of PG&E’s Electric Portfolio.5 WAC is not impacted 7
by financial settlement of contractual GHG obligations. Attachment A, Table 8
1 will be submitted as an active spreadsheet showing all calculations and 9
formulas used. 10
The purpose of Attachment A, Table 2 is to support the applied WAC for 11
monthly Direct Physical GHG Costs of PG&E’s Electric Portfolio. 12
Attachment A, Table 2 will be partially submitted as an active spreadsheet 13
showing all calculations and formulas used. 14
PG&E’s official system of record to calculate the WAC of compliance 15
instruments is Endur. While PG&E can replicate calculations performed in 16
Endur to produce the WAC, numbers calculated in the spreadsheet provided 17
may vary from the official record due to rounding in the Endur system versus 18
the spreadsheet. 19
2) To support PG&E’s recorded monthly Direct Physical GHG Costs and 20
Financial GHG Costs as of the Record Year’s December Close, PG&E will 21
submit a table in substantially the form of Attachment B, as a workpaper (in 22
a spreadsheet format) to its ERRA Compliance Application 23
Included in the spreadsheet (Attachment B), PG&E will provide separate 24
tabs for each of line 2 through line 7, including monthly GHG emissions for 25
5 For definition of recorded direct GHG costs, Refer to section 4.2.1 and Footnote 24 of
D.14-10-033, page 18. D.14-10-033 (page 18) states: “Recorded Direct GHG costs represent the actual costs for utility owned generation and imports, tolls and other contracts for which the utility has responsibility for cap-and-trade costs.” Footnote 24 of the Decision states: “The specific terms of a utility’s contract may specify whether the utility provides physical compensation (a transfer of compliance instruments) or financial compensation (payment to the entity for the cost of the applicable compliance instruments) for the cap-and-trade costs. Physical settlement is a direct cost, but the utilities can choose to report financially settled tolling agreements as direct or indirect costs. Financially settled qualifying facility contracts where the financial obligation is embedded in the market price of energy purchases or within the specific contract terms for energy payment may be categorized as indirect GHG costs.”

11-AtchA-4
the record year, for each source contributing to the total emissions per 1
category recorded as of December close. For example: Line 2 would 2
include 12 months entries for each of PG&E's three UOG facilities. 3
ORA will use PG&E's data provided in Attachment B to draw its sample 4
(See Section 3). 5
D. ORA's Sample 6
The purpose of the sampling approach is for ORA to perform a thorough 7
review and verification of PG&E’s calculations of GHG emissions and associated 8
GHG costs for the Record Year under review. 9
The sample will be based on data submitted by PG&E in Attachment B 10
(Modified Template D-2 of Attachment D of D.15-01-024). 11
Provided that PG&E submits a completed Attachment B at the time it files its 12
ERRA Compliance Application, ORA will draw and provide the sample to PG&E 13
no later than a month from the date PG&E files its ERRA Compliance 14
Application. 15
E. PG&E's Response to ORA Sample 16
No later than three weeks from the date ORA provides the Sample to PG&E, 17
PG&E will provide the information listed in Section 5.1 through Section 5.3 to 18
ORA. 19
5.1) PG&E's GHG Emissions Recorded During the Record Period From Its 20
UOG Facilities, Specified Imports and Unspecified Imports 21
a. Calculations of GHG Emissions 22
PG&E to provide detailed calculations of GHG emissions (in an 23
active spreadsheet format, showing all calculations, assumptions and 24
formulas used), by source for each of the months sampled by ORA. 25
PG&E’s official system of record to calculate the GHG emissions is 26
Endur. While PG&E can replicate calculations performed in Endur to 27
produce the sampled month’s emissions volume, numbers calculated in 28
the spreadsheet provided may have variances due to rounding in the 29
Endur system versus the spreadsheet. 30
b. Supporting Evidence 31
PG&E to demonstrate that the methodology used to calculate the 32
GHG emissions is consistent with the draft emissions calculated under 33

11-AtchA-5
the California Air Resources Board Mandatory Reporting Regulation. 1
Supporting evidence will be calculated using the UOG facility’s gas 2
burns during the record period and an emission factor from the facility’s 3
previous year’s Mandatory Reporting Regulation verified report. 4
5.2) PG&E's GHG Emissions Recorded During the Record Year From Its 5
Physically-Settled Contracts and/or Tolling Agreements 6
a. Calculations of GHG Emissions: 7
PG&E to provide detailed calculations of GHG emissions, for each 8
source for each of the months provided in ORA's sample. 9
PG&E will use a spreadsheet in a format similar to the spreadsheet 10
provided by PG&E labelled “Data Request 15 (GHG volumes and 11
costs)” in response to ORA's Data Request 15 Q-2.2); with the addition 12
of one data point: GHG unit cost (such as ICE forward price etc.). 13
For ease of reference, the following Table 11-1 for information on 14
physically-settled contracts provides the fields that should be included to 15
populate the spreadsheet: 16
TABLE 11-1
Source Name Unit Log
number Contract Type
(Tolling/QF/Other)
Emission Date
(Year and Month)
GHG Emissions (MTCO2e)
Physically-Settled
Contracts: Unit GHG
Cost ($/MTCO2e)
GHG Costs
($)
ERRA Tariff line item
b. Supporting Evidence: 17
Invoices showing final settled emissions data and payments. 18
References and excerpts from contracts showing settlement terms 19
covering the calculations of GHG emissions and costs. (See examples 20
from PG&E responses to ORA DR 15, A.17-02-005) 21
5.3) PG&E's Recorded GHG Emissions Recorded During the Record Year 22
From Its Financially-Settled Contracts and/or Tolling Agreements 23
a. Calculations of GHG Emissions and Costs 24
PG&E to provide detailed calculations of GHG emissions and 25
associated costs for each source for each of the months provided in 26
ORA's sample. PG&E will use a spreadsheet in a format similar to the 27
spreadsheet provided by PG&E labelled "Data Request 15 (GHG 28

11-AtchA-6
volumes and costs)" in response to ORA's Data Request 15 Q-2.2); with 1
the addition of one data point: GHG unit cost (such as ICE forward 2
price etc.). 3
For ease of reference, see the following Table 11-2 for information 4
on financially-settled contracts provides the fields that should be 5
included to populate the spreadsheet: 6
TABLE 11-2
Source Name Unit Log
number Contract Type
(Tolling/QF/Other)
Emission Date (Year and
Month)
GHG Emissions (MTCO2e)
Physically-Settled
Contracts: Unit GHG
Cost ($/MTCO2e)
GHG Costs
($)
ERRA Tariff line item
b. Supporting Evidence 7
Invoices showing settled emissions data and payments during the 8
record period. 9
References and excerpts from contracts showing settlement terms 10
covering the calculations of GHG emissions and costs. 11
(See examples from PG&E responses to ORA DR 15, A.17-02-005) 12 13

11-AtchA-7
ATTACHMENT A TABLE 1: REPORTING TEMPLATE TO CALCULATE WEIGHTED AVERAGE COST (WAC) OF
COMPLIANCE INSTRUMENTS IN RECORD YEAR
Month Transaction
Date Transaction
Type Quantity Cost
($/MT)
Sales Price ($)
Total Cost ($)
Inventory Balance
($)
Total Qty in
Inventory WAC
No Formula
No Formula No Formula No Formula
Formula No Formula
Formula Formula Formula Formula
TABLE 2: PG&E RECORDED DIRECT PHYSICAL GHG COSTS IN ERRA (TARIFF LINE ITEM 5.AH.)
Month MM-YY
End of Month WAC Supported by Table 1
Monthly Emissions (MT) Fixed Number, No Formula
End of Month WAC * Monthly Emissions $Formula
Balancing Account Entry with adjustment (as recorded to line 5ah) (Refer to Note 4)
Fixed Number, No Formula (supported by Accounting Entries)
Notes: (1) “Attachment A” reflects Template C of Attachment C of D. 15-01-024. When filing “Attachment
A,” PG&E will follow the definitions and conventions as required in Template C of Attachment C of D. 15-01-024. PG&E will clearly identify and provide explanation including supporting calculations of any entries deviating from the requirements in Template C of Attachment C of D. 15-01-024.
(2) “Attachment A” or Template C of Attachment C of D. 15-01-024 is based (amongst other data) on running weighted average costs of compliance instruments held in inventory since the inception of the program (i.e. since the First Compliance Period under the Cap-and-Trade Program).
(3) PG&E is to provide “Attachment A” in an active spreadsheet format i.e., showing all calculations and formulas used.
(4) PG&E is to provide references and explanation including calculations to any hard entries (not resulting from a calculation or not linked to a referenced calculation).
(5) PG&E is to provide calculations including supporting data used to produce entries recorded under “Balancing Account Entry with adjustment (as recorded to line 5ah),” as applicable. Note; however, the supporting documentation provided for the monthly entries may differ in future years as PG&E will rely on Endur’s automation process to post the monthly entries. Accounting will provide calculations or reconciliations to demonstrate the GHG emissions expenses recorded during each month as reported, to line 5ah, was appropriately calculated. For definitions and descriptions, refer to Attachment C of D. 15-01-024. Attachment A and resulting WAC calculation are confidential.

11-AtchA-8
ATTACHMENT B
Modified Template D-2: Annual GHG Emissions and Associated Costs(a)
ERRA Compliance Application for Record Period Under Review (GHG Emissions Recorded in January through December of Record Year)
Line Description
1 Direct GHG Emissions (MTCO2e)
2 Utility Owned Generation (UOG) 3 Physically Settled Tolling
Agreements
4 Energy Imports (Specified) 5 Energy imports (Unspecified) 6 Physically Settled Qualifying Facility
(QF) Contracts
Financially Settled GHG Emissions (MT CO2e)
7 Contracts with Financial Settlement
8 Subtotal
15 GHG Costs ($)
16 Direct Physical GHG Costs
17 Direct GHG Costs - Financial Settlement
______________
(a) As of December, Close of Record Year. Any information recorded or available after December Close will not be reflected in Attachment B.
Notes: (1) "Attachment B" is a modified version of Template D-2 of Attachment D of D. 15-01-024. When
filing "Attachment B," PG&E will follow the definitions and conventions as required in Template D-2 of Attachment D of D. 15-01-024. PG&E will clearly identify and provide explanation including supporting calculations of any entries deviating from the requirements in Template D-2 of Attachment D of D. 15-01-024.
(2) PG&E’s Note: Multiplying monthly WACs shown in Table A and monthly physical emissions shown in Table B will not necessarily replicate monthly accounting entries to ERRA line item 5 ah due to PG&E’s utilization of gross-on, gross-off accounting.
PACIFIC GAS AND ELECTRIC COMPANY
CHAPTER 12
MAXIMUM POTENTIAL DISALLOWANCE
12-i
PACIFIC GAS AND ELECTRIC COMPANY CHAPTER 12
MAXIMUM POTENTIAL DISALLOWANCE
TABLE OF CONTENTS
A. Introduction ..................................................................................................... 12-1
B. Calculation Methodology for Maximum Potential Disallowance ...................... 12-1
C. Calculation of Maximum Potential Disallowance ............................................ 12-2
D. Conclusion ...................................................................................................... 12-3

12-1
PACIFIC GAS AND ELECTRIC COMPANY 1
CHAPTER 12 2
MAXIMUM POTENTIAL DISALLOWANCE 3
A. Introduction 4
The purpose of this chapter is to present the maximum potential 5
disallowance calculation for Standard of Conduct 4 (SOC4) violations for the 6
January 1-December 31, 2017 record period. SOC4 states that: 7
…the utilities shall prudently administer all contracts and generation 8 resources and dispatch the energy in a least-cost manner.1 9
Pacific Gas and Electric Company (PG&E) agreed to provide this chapter in 10
its Settlement Agreement with the Office of Ratepayer Advocates in the 2014 11
Energy Resource Recovery Account (ERRA) Compliance proceeding 12
(Application (A.) 15-02-023) (Settlement Agreement).2 By providing this 13
testimony, PG&E is not explicitly or implicitly indicating that there were any 14
SOC4 violations during the January 1-December 31, 2017 record period. 15
Rather, PG&E does not believe that there were any SOC4 violations, but is 16
providing this calculation consistent with the Settlement Agreement. 17
B. Calculation Methodology for Maximum Potential Disallowance 18
PG&E’s SOC4 is limited to the administration of contracts and generation 19
resources and to the dispatch of energy in a least-cost manner. Expenses that 20
are included under SOC4: contract negotiation and management; dispatch of 21
Utility-Owned Generation (UOG) and third-party resource; and fuel costs to UOG 22
facilities. There are costs at issue in this proceeding that do not fall under the 23
purview of SOC4, such as the costs for UOG replacement energy or seismic 24
studies cost. 25
SOC4 is limited in scope and, accordingly, the potential for disallowance is 26
also limited. In Decision (D.) 02-12-074, the California Public Utilities 27
Commission (Commission) adopted a limit for potential disallowances of SOC4 28
in Ordering Paragraph (OP) 25. The maximum potential disallowance risk is 29
1 D.02-10-062, pp. 50-52. 2 Settlement Agreement, p. 9. The Settlement Agreement was approved at the
Commission on December 20, 2016 in D.16-12-045.

12-2
equal to two times PG&E’s annual procurement administrative expenditures.3 1
The Commission further defined that “annual procurement administrative 2
expenditures” include costs “related to DWR contract administration, 3
utility-related generation, renewables, QFs, demand-side resources, and any 4
other procurement resources.”4 In D.03-06-067, the Commission modified 5
OP 25 to state that the specific dollar amounts for each utility shall be reviewed 6
in each General Rate Case (GRC) or cost of service proceeding.5 7
C. Calculation of Maximum Potential Disallowance 8
Each year, the maximum potential disallowance risk is based on PG&E’s 9
procurement related administrative expenses and is determined by the most 10
recently adopted GRC decision. On May 18, 2017, the Commission adopted 11
$60.289 million as part of the 2017 GRC Settlement in D.17-05-013. The 12
$60.289 million includes costs comprised of four Major Work Categories (MWC) 13
to support expenses for the Energy Procurement and Policy organization as 14
illustrated in Table 12.1. 15
TABLE 12-1 2017 GRC ADOPTED SETTLEMENT
(MILLIONS OF DOLLARS)
Old Cost Model
New Cost Model
Line No. MWC MWC Description
2017 Adopted
Settlement
2017 Imputed Regulatory
Values
1 CT Acquire and Manage Electric Supply $53,702 $39,218
2 CV Acquire and Manage Gas Supply 4,343 3,239
3 AB Misc. Expense/Support 2,784 1,577
4 CY Manage Electric Grid Operations (GII) – –
5 $60,289 $44,034
The 2017 GRC adopted funding levels do not provide the granularity of the 16
MWC expense line items. Therefore, to calculate PG&E’s maximum 17
3 D.02-12-074, pp. 77-78, OP 25. 4 Id., p. 55. 5 D.03-06-067, p. 23, OP 3.

12-3
disallowance, PG&E uses the Budget Report submitted on July 10, 2017, 1
in compliance with the 2017 GRC D.17-05-013.6 2
Since PG&E’s 2017 GRC was filed, PG&E has changed its cost allocation 3
methodology. As a result, the 2017 GRC decision and adopted values reflect 4
the old cost model allocation methodology which included “fully-loaded” labor 5
cost. To properly compare the adopted level, the adopted values were 6
converted to the new cost allocation methodology, which includes labor plus 7
minimal labor-related overheads. The translated adopted amounts are also 8
referred to as Imputed Regulatory Values. The net result is the reduction from 9
$60.289 million to $44.034 million7 for the relevant MWCs. 10
Thus, the maximum potential disallowance for PG&E’s 2017 ERRA 11
Compliance Review Application is $88.068 million, which is two times 12
$44.034 million. 13
D. Conclusion 14
PG&E requests that the Commission approve its calculation of the maximum 15
potential disallowance provided in this chapter. 16
6 D.17-05-13, p. 233. 7 July 10, 2017 Budget Report, Appendix B, p. AppB-4, lines 83, 85-87, lists PG&E’s
MWCs AB, CT and CV expenses for the Energy Procurement and Policy organization. A copy of the Budget Report has been included as part of the Chapter 12 workpapers.

PACIFIC GAS AND ELECTRIC COMPANY
CHAPTER 13
COST RECOVERY AND REVENUE REQUIREMENT

13-i
PACIFIC GAS AND ELECTRIC COMPANY CHAPTER 13
COST RECOVERY AND REVENUE REQUIREMENT
TABLE OF CONTENTS
A. Introduction ..................................................................................................... 13-1
B. Incremental Costs and Revenue Requirement ............................................... 13-1
C. Cost Recovery for the Diablo Canyon Seismic Studies Balancing Account ... 13-2
D. Conclusion ...................................................................................................... 13-2

13-1
PACIFIC GAS AND ELECTRIC COMPANY 1
CHAPTER 13 2
COST RECOVERY AND REVENUE REQUIREMENT 3
A. Introduction 4
The purpose of this chapter is to present the 2017 revenue requirement and 5
describe the associated cost recovery proposal for costs recorded in 2017 in the 6
Diablo Canyon Seismic Studies Balancing Account (DCSSBA). Specifically, in 7
this chapter Pacific Gas and Electric Company (PG&E) presents the revenue 8
requirement associated with the costs recorded in the DCSSBA for which PG&E 9
is seeking approval in this proceeding, and proposes to continue the currently 10
adopted cost recovery mechanism for the DCSSBA. 11
B. Incremental Costs and Revenue Requirement 12
PG&E is seeking recovery of a revenue requirement totaling $4.741 million 13
for Diablo Canyon seismic study costs. The revenue requirement is comprised 14
of the actual recorded costs presented in Chapter 5 plus interest and an amount 15
for Revenue Fees and Uncollectibles (RF&U). The electric RF&U factor 16
currently in effect is 0.011389.1 The RF&U amount will be updated to reflect the 17
RF&U factor in effect at the time the California Public Utilities Commission 18
(CPUC or Commission) approves a decision in this filing. Table 13-1 below 19
summarizes the total revenue requirements requested by PG&E in this 20
proceeding. 21
1 See Attachment 2 of Advice 3894-G/5159-E which updated PG&E’s RF&U factor
pursuant to Decision (D.) 17-05-013.

13-2
TABLE 13-1 INCREMENTAL DIABLO CANYON SEISMIC STUDIES BALANCING ACCOUNT COSTS
(THOUSANDS OF NOMINAL DOLLARS)
Line No. Revenue Requirements 2017
1 DCSSBA (Chapter 5) $4,529(a) 2 Interest During the Record Period 159 3 Placeholder RF&U(b) 53
4 Total Revenue Requirement $4,741 _______________
(a) Totals may not tie precisely to amounts in Chapter 5 because of rounding.
(b) The placeholder RF&U is calculated using the 2018 factor as approved in Advice 3894-G/5159-E. This amount will be updated using the adopted factor in place at the time of approval by the Commission.
See Chapter 5 for a discussion of costs recorded to the DCSSBA and 1
PG&E’s authority to recover these costs. 2
C. Cost Recovery for the Diablo Canyon Seismic Studies Balancing Account 3
Consistent with the approach PG&E has proposed in previous ERRA 4
compliance proceedings, and which the Commission has adopted, most recently 5
in D.17-03-021 in PG&E’s 2015 ERRA Compliance proceeding,2 PG&E 6
proposes that the actual costs from the DCSSBA, plus an allowance for RF&U, 7
be transferred to the Utility Generation Balancing Account (UGBA), or its 8
successor, as part of the Annual Electric True-Up (AET) for recovery 9
through rates. 10
D. Conclusion 11
PG&E requests that the CPUC approve recovery of a revenue requirement 12
totaling $4.741 million associated with costs recorded in the DCSSBA through 13
the Utility Generation Balancing Account. The total revenue requirement will be 14
adjusted to reflect the final RF&U amount based on the adopted RF&U factor in 15
place at the time this application is approved by the Commission. 16
2 See, D.17-03-021, pp. 8-9, and Ex. PG&E-1, p. 14-5, from that proceeding
(A.16-02-019).

PACIFIC GAS AND ELECTRIC COMPANY
APPENDIX A
STATEMENTS OF QUALIFICATIONS

DLB-1
PACIFIC GAS AND ELECTRIC COMPANY 1
STATEMENT OF QUALIFICATIONS OF DONNA L. BARRY 2
Q 1 Please state your name and business address. 3
A 1 My name is Donna L. Barry, and my business address is Pacific Gas and 4
Electric Company, 77 Beale Street, San Francisco, California. 5
Q 2 Briefly describe your responsibilities at Pacific Gas and Electric Company 6
(PG&E). 7
A 2 I am a Regulatory Principal in Rates and Regulatory Analytics Department 8
within the Regulatory Affairs organization. I am responsible for developing 9
testimony and analysis to support proceedings filed at the California Public 10
Utilities Commission on matters related to energy procurement and 11
cost recovery. 12
Q 3 Please summarize your educational and professional background. 13
A 3 I received my Bachelor of Science degree in Civil Engineering from 14
Washington State University and a Master’s degree in Business 15
Administration from Santa Clara University. 16
I began my career with PG&E in 1989 as an Engineer in the Engineering 17
and Construction Business Unit’s Gas Construction Department managing 18
gas distribution and pipeline replacement construction projects. From there, 19
I took an assignment in the Gas Supply Business Unit in the Gas 20
Engineering and Construction (GEC) Department as a Project Manager, 21
managing three gas backbone transmission projects before joining the Gas 22
Planning section in GEC where I analyzed the reliability of local transmission 23
and distribution systems. I subsequently joined the Cost of Service section 24
in the Rates Department where I performed Cost of Service studies and 25
marginal cost analyses supporting various gas and electric rate applications. 26
I joined the Electric Restructuring Cost Recovery section of the Revenue 27
Requirements Department in 2001 and Electric Energy Revenue and 28
Analysis and Ratemaking section in 2002. I was a Principal Case Manager 29
and Witness for the Energy Resource Recovery Account (ERRA) Forecast 30
and ERRA Compliance Review proceedings between 2003 and 2014 31
responsible for case managing and testimony development. The 32
department and section were renamed as the Energy Supply Proceedings 33

DLB-2
Department in 2012. In 2014, I moved to the Revenue Requirements and 1
Analysis Department and moved to my current position in Rates and 2
Regulatory Analytics in 2017. 3
Q 4 What is the purpose of your testimony? 4
A 4 I am sponsoring the following testimony in PG&E’s 2017 Energy Resource 5
Recovery Account Compliance Review Proceeding: 6
Chapter 10, “Review Entries Recorded in the Green Tariff Shared 7
Renewables Memorandum Account and the Green Tariff Shared 8
Renewables Balancing Account”: 9
Section C, “Green Tariff Shared Renewables Balancing Account.” 10
Q 5 Does this conclude your statement of qualifications? 11
A 5 Yes, it does. 12

CKC-1
PACIFIC GAS AND ELECTRIC COMPANY 1
STATEMENT OF QUALIFICATIONS OF CANDICE K. CHAN 2
Q 1 Please state your name and business address. 3
A 1 My name is Candice K. Chan, and my business address is Pacific Gas and 4
Electric Company, 245 Market Street, San Francisco, California. 5
Q 2 Briefly describe your responsibilities at Pacific Gas and Electric Company 6
(PG&E). 7
A 2 I am currently the Director of the Energy Contract Management and 8
Settlements section of the Energy Policy and Procurement Department, 9
responsible for managing back office contract management and settlement 10
operations associated with electric and gas procurement. 11
Q 3 Please summarize your educational and professional background. 12
A 3 I earned a Bachelor of Arts degree in Communication Studies, with a 13
specialization in Business Administration from the University of California, 14
Los Angeles, and a Master’s degree in Business Administration from the 15
Haas School of Business at the University of California, Berkeley. In 2002, 16
I joined PG&E as a Manager of Performance Management in the Shared 17
Services organization, responsible for: consulting on financial analysis; 18
reporting; operational performance metrics and management; performance 19
data systems; and performance improvement initiatives. In 2004, I joined 20
PG&E’s Finance Department, leading the business planning function for 21
Shared Services. From 2006-2009, I served as the Program Director and 22
Chief of Staff to the Office of the President and Chief Executive Officer, 23
managing: key operational planning; and governance and communication 24
activities on behalf of the senior executive team. In 2009, I joined the 25
Energy Procurement Department in my current role. 26
Q 4 What is the purpose of your testimony? 27
A 4 I am sponsoring the following testimony in PG&E’s 2017 Energy Resource 28
Recovery Account Compliance Review Proceeding: 29
Chapter 8, “Contract Administration”; and 30
Chapter 9, “CAISO Settlements and Monitoring.” 31
Q 5 Does this conclude your statement of qualifications? 32
A 5 Yes, it does. 33

AD-1
PACIFIC GAS AND ELECTRIC COMPANY 1
STATEMENT OF QUALIFICATIONS OF ARMANDO DURAN 2
Q 1 Please state your name and business address. 3
A 1 My name is Armando Duran, and my business address is Pacific Gas and 4
Electric Company, 77 Beale Street, San Francisco, California. 5
Q 2 Briefly describe your responsibilities at Pacific Gas and Electric Company 6
(PG&E). 7
A 2 I am the Accounting Manager in the Energy Accounting Department within 8
the Corporate Accounting organization at PG&E. In this position, I am 9
responsible for overseeing the Direct Greenhouse Gas Expense accounting 10
transactions recorded to the Energy Resource Recovery Account balancing 11
account, as well as various accounting transactions recorded to other 12
applicable balancing accounts as authorized in regulatory cases before the 13
California Public Utilities Commission. 14
Q 3 Please summarize your educational and professional background. 15
A 3 I received my Bachelor of Science degree in Business Administration, 16
emphasis in Accounting, from California State University, Sacramento in 17
1985. I earned a Certified Public Accountant certificate in the state of 18
California in 1990. 19
I joined PG&E in 1986, and have held various positions within Customer 20
Billing, Internal Audit, and the Corporate Accounting Department. I have 21
over 32 years of regulated utility accounting and regulatory experience from 22
having held positions of increasing responsibility at PG&E in the Controller’s 23
organization. 24
Q 4 What is the purpose of your testimony? 25
A 4 I am sponsoring the following testimony in PG&E’s 2017 Energy Resource 26
Recovery Account Compliance Review Proceeding: 27
Chapter 11, “Summary of Energy Resource Recovery Account Entries 28
for the Record Period.” 29
Q 5 Does this conclude your statement of qualifications? 30
A 5 Yes, it does. 31

KAE-1
PACIFIC GAS AND ELECTRIC COMPANY 1
STATEMENT OF QUALIFICATIONS OF KELLY A. EVERIDGE 2
Q 1 Please state your name and business address. 3
A 1 My name is Kelly A. Everidge, and my business address is Pacific Gas and 4
Electric Company, 77 Beale Street, San Francisco, California. 5
Q 2 Briefly describe your responsibilities at Pacific Gas and Electric Company 6
(PG&E). 7
A 2 I am the Director of the Strategy and Policy Risk, Compliance and Reporting 8
Department. I am responsible for overseeing cost recovery and regulatory 9
compliance policies, with a focus on California Public Utilities Commission, 10
Federal Energy Regulatory Commission and North American Electric 11
Reliability standards and obligations affecting PG&E’s energy procurement 12
activities. In addition, I am responsible for ensuring the Energy Policy and 13
Procurement organization’s compliance with the Securities and Exchange 14
Commission reporting requirements, Section 404 of the Sarbanes-Oxley 15
Law, all internal audit recommendations, and systems and process 16
improvement. 17
Q 3 Please summarize your educational and professional background. 18
A 3 I joined Energy Policy and Procurement from Business Finance, where 19
I was responsible for managing the business planning function, including 20
budget, forecasting, operational performance analysis, and strategic 21
planning. I joined PG&E in 1997, and have held various roles of increasing 22
scope and responsibility. I spent five years in Energy Policy and 23
Procurement, where I served as Director, Energy Contract Management and 24
Settlements and Chief of Staff, responsible for contract management, 25
settlement, payments, and financial reporting operations associated with 26
electric and gas procurement. Prior to joining Energy Policy, I served in 27
roles within the Risk Management and Finance organizations, and managed 28
front, middle, and back office functions at PG&E's former subsidiary, the 29
National Energy Group. I received a Bachelor of Science degree in Finance 30
from California State University, Sacramento, and a Master’s degree in 31
Business Administration from Golden Gate University, San Francisco. 32

KAE-2
Q 4 What is the purpose of your testimony? 1
A 4 I am sponsoring the following testimony in PG&E’s 2017 Energy Resource 2
Recovery Account Compliance Review proceeding: 3
Chapter 12, “Maximum Potential Disallowance.” 4
Q 5 Does this conclude your statement of qualifications? 5
A 5 Yes, it does. 6

FF-1
PACIFIC GAS AND ELECTRIC COMPANY 1
STATEMENT OF QUALIFICATIONS OF FRANKLIN FUCHS 2
Q 1 Please state your name and business address. 3
A 1 My name is Franklin Fuchs, and my business address is Pacific Gas and 4
Electric Company, 245 Market Street, San Francisco, California. 5
Q 2 Briefly describe your responsibilities at Pacific Gas and Electric Company 6
(PG&E). 7
A 2 I am a Manager in the Demand Response Department within the Customer 8
Care organization at PG&E. In this position, my responsibilities include the 9
overall administration of PG&E’s Demand Response programs, which 10
include the Capacity Bidding Program, Base Interruptible Program, 11
SmartAC™, Optional Binding Mandatory Curtailment Program, and 12
Scheduled Load Reduction Program, and oversight of PG&E’s Demand 13
Response Auction Mechanism. 14
Q 3 Please summarize your educational and professional background. 15
A 3 I have a Bachelor of Arts degree in Environmental Studies from the 16
University of Colorado, a Bachelor of Science degree in Finance from the 17
University of Louisville, and a Masters of Business Administration from the 18
University of Texas. I also am a holder of the right to use the Chartered 19
Financial Analyst® designation. I have approximately 13 years of 20
experience in the energy industry with approximately four years of utility 21
experience. I have held positions in commodity forecasting and analysis, 22
customer account management, marketing and strategy, and the 23
development of PG&E’s Risk Informed Budget Allocation framework. 24
Q 4 What is the purpose of your testimony? 25
A 4 I am sponsoring the following testimony in PG&E’s 2017 Energy Resource 26
Recovery Account Compliance Review proceeding: 27
Chapter 1, “Least-Cost Dispatch and Economically-Triggered 28
Demand Response”: 29
Section A, “Introduction”; and 30
Section C, “Economically-Triggered Demand Response Programs.” 31
Q 5 Does this conclude your statement of qualifications? 32
A 5 Yes, it does. 33

LGF-1
PACIFIC GAS AND ELECTRIC COMPANY 1
STATEMENT OF QUALIFICATIONS OF LUCY G. FUKUI 2
Q 1 Please state your name and business address. 3
A 1 My name is Lucy G. Fukui, and my business address is Pacific Gas and 4
Electric Company, 77 Beale Street, San Francisco, California. 5
Q 2 Briefly describe your responsibilities at Pacific Gas and Electric Company 6
(PG&E). 7
A 2 I am the Manager of Regulatory Analysis and Forecasting in the Energy 8
Accounting Department within the Corporate Accounting organization at 9
PG&E. In this position, I am responsible for overseeing and advising on 10
cost recovery. I am also responsible for leading various reporting activities 11
on the monthly accounting entries made into the Energy Resource Recovery 12
Account balancing account, in compliance with California Public Utilities 13
Commission directives. 14
Q 3 Please summarize your educational and professional background. 15
A 3 I received my Bachelor of Science degree in Business Administration, 16
emphasis in Accounting, with a minor in Computer Science, from the 17
University of San Francisco. I earned a Certified Public Accountant 18
certificate in the state of California in 1990. 19
Prior to joining PG&E in 1991, I was an Auditor with Deloitte and Touche 20
and an Accounting Manager for a small software company. I have over 21
20 years of regulated utility accounting and regulatory experience from 22
having held positions of increasing responsibility at PG&E, in the Controller’s 23
and Regulatory Affairs organizations. 24
Q 4 What is the purpose of your testimony? 25
A 4 I am sponsoring the following testimony in PG&E’s 2017 Energy Resource 26
Recovery Account Compliance Review proceeding: 27
Chapter 11, “Summary of Energy Resource Recovery Account Entries 28
for the Record Period”; and 29
Chapter 13, “Cost Recovery and Revenue Requirement.” 30
Q 5 Does this conclude your statement of qualifications? 31
A 5 Yes, it does. 32

CDH-1
PACIFIC GAS AND ELECTRIC COMPANY 1
STATEMENT OF QUALIFICATIONS OF CARY D. HARBOR 2
Q 1 Please state your name and business address. 3
A 1 My name is Cary D. Harbor, and my business address is Pacific Gas and 4
Electric Company, Diablo Canyon Power Plant. 5
Q 2 Briefly describe your responsibilities at Pacific Gas and Electric Company 6
(PG&E). 7
A 2 I am the Director of Nuclear Business Operations for the newly-created 8
Nuclear Line of Business (LOB); in this capacity I am responsible for the 9
Nuclear LOB strategic and integrated planning, General Rate Case 10
activities, Risk Assessment and Mitigation Phase, and matrixed 11
organizations including business finance and supply chain. 12
Q 3 Please summarize your educational and professional background. 13
A 3 I received a Bachelor of Science degree in Nuclear Engineering from 14
University of California, Santa Barbara, in 1989. I joined PG&E in 1989 as a 15
Power Production Engineer in the Engineering Department. I have since 16
held positions as the Supervisor of Regulatory Services, Operations Shift 17
Foreman/Manager (Senior Reactor Operator licensed by the Nuclear 18
Regulatory Commission), Performance Improvement Manager, Quality 19
Verification Director, Nuclear Maintenance and Construction Services 20
Director and the Director of Compliance Alliance and Risk for our nuclear 21
plant operations, and the Director of Generation Compliance, Risk and 22
Business Planning for the Generation LOB. Additionally, I was a witness in 23
PG&E’s 2012, 2013, 2014, 2015, and 2016 Energy Resource Recovery 24
Account Compliance Review proceedings. 25
Q 4 What is the purpose of your testimony? 26
A 4 I am sponsoring the following testimony in PG&E’s 2017 Energy Resource 27
Recovery Account Compliance Review proceeding: 28
Chapter 4, “Utility-Owned Generation: Nuclear.” 29
Q 5 Does this conclude your statement of qualifications? 30
A 5 Yes, it does. 31

MH-1
PACIFIC GAS AND ELECTRIC COMPANY 1
STATEMENT OF QUALIFICATIONS OF MOLLY HOYT 2
Q 1 Please state your name and business address. 3
A 1 My name is Molly Hoyt, and my business address is Pacific Gas and Electric 4
Company, 245 Market Street, San Francisco, California. 5
Q 2 Briefly describe your responsibilities at Pacific Gas and Electric Company 6
(PG&E). 7
A 2 I manage the Community Renewables team in the Customer Energy 8
Solutions – Clean Energy Programs organization. In this role, I oversee the 9
development and management of PG&E’s Solar Choice and Regional 10
Renewable Choice programs. 11
Q 3 Please summarize your educational and professional background. 12
A 3 I received a Bachelor of Science degree in Business Administration from 13
San Jose State University and a Master’s degree in Business Administration 14
from the University of Notre Dame. I joined PG&E in 2008 as a Principal 15
Product Manager, and have managed several programs over the years 16
including the ClimateSmart™ Program, the Winter Gas Savings Program, 17
and our Greenhouse Gas Revenue Return Programs. I have served as the 18
product development witness in the Green Tariff Shared Renewables 19
proceeding since 2012, and have testified in front of the California Public 20
Utilities Commission twice in that proceeding. Since 2013, I have served as 21
Chief Executive Officer of the ClimateSmart Charity. Prior to PG&E, 22
I worked in marketing and product management roles in the wireless 23
telecommunications industry for AirTouch International, Openwave Systems 24
Inc., and Vodafone Group Plc. For the three years immediately prior to 25
PG&E, I was a partner in a sustainability consulting firm called Origo Inc. 26
From 2002-2003, I served on the board of the northern California 27
chapter of the Product Development and Management Association. 28
Q 4 What is the purpose of your testimony? 29
A 4 I am sponsoring the following testimony in PG&E’s 2017 Energy Resource 30
Recovery Account Compliance Review proceeding: 31

MH-2
Chapter 10, “Review Entries Recorded in the Green Tariff Shared 1
Renewables Memorandum Account and The Green Tariff Shared 2
Renewables Balancing Account”: 3
Section B, “Green Tariff Shared Renewables Memorandum 4
Account.” 5
Q 5 Does this conclude your statement of qualifications? 6
A 5 Yes, it does. 7

FI-1
PACIFIC GAS AND ELECTRIC COMPANY 1
STATEMENT OF QUALIFICATIONS OF FELIPE IBARRA 2
Q 1 Please state your name and business address. 3
A 1 My name is Felipe Ibarra, and my business address is Pacific Gas and 4
Electric Company, 77 Beale Street, San Francisco, California. 5
Q 2 Briefly describe your responsibilities at Pacific Gas and Electric Company 6
(PG&E). 7
A 2 I am a Principal Gas Trader in PG&E’s Electric Gas Supply Department, 8
which is part of the Energy Policy and Procurement Department. I am 9
responsible for trading natural gas associated with PG&E’s electric portfolio. 10
Q 3 Please summarize your educational and professional background. 11
A 3 I earned a Bachelor of Science degree in Mathematics from San Jose State 12
University in 2003. From 2007 to present, I have been employed by PG&E 13
in various positions, including Financial Analyst in Risk Management, 14
Analyst Electric Fuels, and currently Principal Gas Trader in the Electric 15
Fuels Department. 16
Q 4 What is the purpose of your testimony? 17
A 4 I am sponsoring the following testimony in PG&E’s 2017 Energy Resource 18
Recovery Account Compliance Review proceeding: 19
Chapter 6, “Generation Fuel Costs and Electric Portfolio Hedging”: 20
– Section B, “Gas Procurement.” 21
– Attachment A, “Letter from Ruby Pipeline Officer Certifying PG&E's 22
“Most Favored Nations” (Lowest Rate) Status”; and 23
– Attachment B, “Generation Fuel Costs,” Tables 6B-1, 6B-2, 24
and 6B-3. 25
Q 5 Does this conclude your statement of qualifications? 26
A 5 Yes, it does. 27

MK-1
PACIFIC GAS AND ELECTRIC COMPANY 1
STATEMENT OF QUALIFICATIONS OF MICHAEL KOWALEWSKI 2
Q 1 Please state your name and business address. 3
A 1 My name is Michael Kowalewski, and my business address is Pacific Gas 4
and Electric Company, 77 Beale Street, San Francisco, California. 5
Q 2 Briefly describe your responsibilities at Pacific Gas and Electric Company 6
(PG&E). 7
A 2 I am a Portfolio Manager in the Electric Gas Supply Department, which is 8
part of the Energy Policy and Procurement Department. I am responsible 9
for managing the financial gas position of PG&E’s electric portfolio. 10
Q 3 Please summarize your educational and professional background. 11
A 3 I earned a Bachelor of Arts degree in Economics from the University of 12
California, Berkeley, in 1992. From 1992 to present, I have been employed 13
by PG&E in various positions including Manager of PG&E’s Electric Portfolio 14
Gas Trading Operations, Renewable Energy Transactor, Gas Trader, 15
Product Manager, Project Manager, and Financial and Regulatory Analyst. 16
Q 4 What is the purpose of your testimony? 17
A 4 I am sponsoring the following testimony in PG&E’s 2017 Energy Resource 18
Recovery Account Compliance Review proceeding: 19
Chapter 6, “Generation Fuel Costs and Electric Portfolio Hedging”: 20
Section H, “Electric Portfolio Hedging”; and 21
Section I, “Internal Procedures and Controls.” 22
Attachment B, “Generation Fuel Costs,” Tables 6B-7, 6B-8, 6B-9, 23
6B-10, 6B-11 and Figures 6B-1 and 6B-2. 24
Q 5 Does this conclude your statement of qualifications? 25
A 5 Yes, it does. 26

VKL-1
PACIFIC GAS AND ELECTRIC COMPANY 1
STATEMENT OF QUALIFICATIONS OF VINCENT K. LOH 2
Q 1 Please state your name and business address. 3
A 1 My name is Vincent K. Loh, and my business address is Pacific Gas and 4
Electric Company, 77 Beale Street, San Francisco, California. 5
Q 2 Briefly describe your responsibilities at Pacific Gas and Electric Company 6
(PG&E). 7
A 2 I am a Senior Manager in the Portfolio Management group in the Energy 8
Policy and Procurement organization and am responsible for leading 9
commercial greenhouse gas policy and strategy. 10
Q 3 Please summarize your educational and professional background. 11
A 3 I received my Bachelor of Science degree in Computer Engineering from 12
Boston University. I hold Master’s degrees in Computer Engineering from 13
Boston University, and in Business Administration from University of 14
California, Berkeley, Haas School of Business. I have worked at: 15
Massachusetts Institute of Technology, as a Research Specialist; Fidelity 16
Investments, as a Quantitative Analyst; Morgan Stanley, as a Commodity 17
Trader; PG&E Energy Services, as a Risk Management Specialist; and as a 18
Product Manager for Charles Schwab & Co, Inc. and OpenLink Financial. 19
In 2003, I joined PG&E in the Energy Procurement Department where 20
I held positions in Short-Term Strategy and Portfolio Management to 21
manage the energy, resource adequacy, hedging, and congestion revenue 22
rights portfolios. In 2012, I joined the Market and Credit Risk Department to 23
oversee implementation of PG&E’s risk policies. I re-joined Portfolio 24
Management as the Senior Manager in 2014 to lead commercial policy, 25
planning, compliance, and commodity procurement. 26
Q 4 What is the purpose of your testimony? 27
A 4 I am sponsoring the following testimony in PG&E’s 2017 Energy Resource 28
Recovery Account Compliance Review proceeding: 29
Chapter 7, “Greenhouse Gas Compliance Instrument Procurement.” 30
Q 5 Does this conclude your statement of qualifications? 31
A 5 Yes, it does. 32

MM-1
PACIFIC GAS AND ELECTRIC COMPANY 1
STATEMENT OF QUALIFICATIONS OF MARK MAYER 2
Q 1 Please state your name and business address. 3
A 1 My name is Mark Mayer, and my business address is Pacific Gas and 4
Electric Company, Diablo Canyon Power Plant. 5
Q 2 Briefly describe your responsibilities at Pacific Gas and Electric Company 6
(PG&E). 7
A 2 I am a Manager in the Nuclear Fuels Purchasing group for Diablo Canyon 8
Power Plant (Diablo Canyon). I am responsible for contracts associated 9
with the fabrication of nuclear fuel for Diablo Canyon and the purchase of 10
feed materials (uranium, conversion services, and enrichment services). 11
Q 3 Please summarize your educational and professional background. 12
A 3 I received a Bachelor of Science degree in Nuclear Engineering from the 13
Massachusetts Institute of Technology. I have worked for PG&E at 14
Diablo Canyon for over 30 years, primarily in engineering. My previous 15
engineering responsibilities have included reactor engineering and system 16
and transient analysis. I am a registered Professional Engineer in the state 17
of California. 18
Q 4 What is the purpose of your testimony? 19
A 4 I am sponsoring the following testimony in PG&E’s 2017 Energy Resource 20
Recovery Account Compliance Review proceeding: 21
Chapter 6, “Generation Fuel Costs and Electric Portfolio Hedging”: 22
Section E, “Nuclear Fuel Expenses”; and 23
Section F, “Nuclear Fuel Carrying Costs.” 24
Attachment B, “Generation Fuel Costs,” Tables 6B-4, 6B-5, 25
and 6B-6. 26
Q 5 Does this conclude your statement of qualifications? 27
A 5 Yes, it does. 28

SPN-1
PACIFIC GAS AND ELECTRIC COMPANY1
STATEMENT OF QUALIFICATIONS OF STUART P. NISHENKO2
Q 1 Please state your name and business address.3
A 1 My name is Stuart P. Nishenko, and my business address is Pacific Gas 4
and Electric Company, 245 Market Street, San Francisco, California.5
Q 2 Briefly describe your responsibilities at Pacific Gas and Electric Company 6
(PG&E).7
A 2 I am a Principal Seismologist/Geophysicist in the PG&E Geosciences 8
Department. I serve as the Technical Manager of the Central Coastal 9
California Seismic Imaging Project (CCCSIP) and the Long-Term Seismic 10
Program (LTSP). I report directly to the Director of the PG&E Geosciences 11
Department.12
Q 3 Please summarize your educational and professional background.13
A 3 I received a Bachelor of Science degree in Geology from the City College of 14
New York, and Master of Arts and Doctor of Philosophy degrees in 15
Seismology and Geophysics from Columbia University. I have more than 16
30 years post-graduate experience with expertise in seismology, 17
geophysics, seismisc hazards assessment and emergency management.18
As Technical Manager of the CCCSIP and LTSP, I am responsible for 19
the planning, execution, and analysis of all seismic and geophysical data 20
related to the project. I will testify about CCCSIP earthquake monitoring 21
offshore Diablo Canyon Power Plant and other LTSP activities.22
Q 4 What is the purpose of your testimony?23
A 4 I am sponsoring the following testimony in PG&E’s 2017 Energy Resource 24
Recovery Account Compliance Review proceeding:25
Chapter 5, “Costs Incurred and Recorded in the Diablo Canyon Seismic 26
Studies Balancing Account.”27
Q 5 Does this conclude your statement of qualifications?28
A 5 Yes, it does.29

YP-1
PACIFIC GAS AND ELECTRIC COMPANY1
STATEMENT OF QUALIFICATIONS OF YANEE PONGSUPAPIPAT2
Q 1 Please state your name and business address.3
A 1 My name is Yanee Pongsupapipat, and my business address is Pacific Gas 4
and Electric Company, 77 Beale Street, San Francisco, California.5
Q 2 Briefly describe your responsibilities at Pacific Gas and Electric Company 6
(PG&E).7
A 2 I am an Accounting Supervisor and am responsible for overseeing 8
accounting for PG&E and its subsidiaries. I also serve as Chief Financial 9
Officer of Fuelco, LLC, and represent PG&E as a member of the Strategic 10
Teaming and Resource Sharing (STARS) finance team.11
Q 3 Please summarize your educational and professional background.12
A 3 I received a Master’s degree in Business Administration, with an emphasis 13
in Accounting, from California State University, East Bay. I joined PG&E in 14
2013 as a Senior Accounting Analyst in the Controller Department. Over the 15
past three years, I have held several roles of increasing responsibility in the 16
Controller Department. I assumed my current position in 2014.17
Q 4 What is the purpose of your testimony?18
A 4 I am sponsoring the following testimony in PG&E’s 2017 Energy Resource 19
Recovery Account Compliance Review proceeding:20
Chapter 6, “Generation Fuel Costs and Electric Portfolio Hedging”:21
Section G, “STARS Alliance.”22
Attachment C, “Annual Report of Utility on the Activities of Stars 23
Alliance, LLC.; Utility Savings/Avoided Costs by Stars Team/Project;24
and Independent Auditor’s Report and Financial Statements.25
Q 5 Does this conclude your statement of qualifications?26
A 5 Yes, it does.27

SR-1
PACIFIC GAS AND ELECTRIC COMPANY1
STATEMENT OF QUALIFICATIONS OF STEVE ROYALL2
Q 1 Please state your name and business address.3
A 1 My name is Steve Royall, and my business address is Pacific Gas and 4
Electric Company, 245 Market Street, San Francisco, California.5
Q 2 Briefly describe your responsibilities at Pacific Gas and Electric Company 6
(PG&E).7
A 2 I am a Director in the Power Generation Department.8
Q 3 Please summarize your educational and professional background.9
A 3 I joined PG&E in 2007 as Director in the Generation Department, 10
responsible for managing the Gateway Generating Station. Prior to PG&E, 11
I worked at Northern California Power Agency, where I was the Assistant 12
General Manager of power generation and the Manager of gas-fired 13
generation. I have more than 37 years of experience working in power 14
generation projects in the areas of operation, engineering, construction, and 15
commissioning. I have been involved in projects that resulted in 16
approximately 3,500 megawatts of new generation in California and 17
Washington over the last 37 years, including PG&E’s new Gateway 18
Generating Station, and Colusa Generating Station. Other former 19
employers include Calpine Corporation, Phillips Oil Company and 20
Freeport-McMoRan Corporation. I am also the Co-Chair of both the: 21
Electric Utility Cost Group – Fossil committee; and the Combined Cycle 22
Users Group, assuming Chairmanship in Fourth Quarter 2015. I was a 23
witness in PG&E’s 2014 and 2015 Energy Resource Recovery Account 24
Compliance Review proceeding.25
Q 4 What is the purpose of your testimony?26
A 4 I am sponsoring the following testimony in PG&E’s 2017 Energy Resource 27
Recovery Account Compliance Review proceeding:28
Chapter 3, “Utility-Owned Generation: Fossil and Other Generation.”29
Q 5 Does this conclude your statement of qualifications?30
A 5 Yes, it does.31

AJS-1
PACIFIC GAS AND ELECTRIC COMPANY1
STATEMENT OF QUALIFICATIONS OF ALVA J. SVOBODA2
Q 1 Please state your name and business address.3
A 1 My name is Alva J. Svoboda, and my business address is Pacific Gas and 4
Electric Company, 77 Beale Street, San Francisco, California.5
Q 2 Briefly describe your responsibilities at Pacific Gas and Electric Company 6
(PG&E).7
A 2 I am Manager of Market Design Integration in the Short-Term Electric 8
Supply Department of the Energy Portfolio Commercial Operations9
organization at PG&E. I am responsible for supporting the optimization of 10
short-term operations.11
Q 3 Please summarize your educational and professional background.12
A 3 I earned a Bachelor of Arts degree in Mathematics from University of 13
California, Santa Barbara in 1980; a Master of Science degree in Operations 14
Research from University of California, Berkeley in 1984; and a Doctorate in 15
Operations Research from University of California, Berkeley in 1992. 16
I joined PG&E in 1997 and have worked in Short-Term Electric Supply from 17
that time to the present.18
Q 4 What is the purpose of your testimony?19
A 4 I am sponsoring the following testimony in PG&E’s 2017 Energy Resource 20
Recovery Account Compliance Review proceeding:21
Chapter 1, “Least-Cost Dispatch and Economically-Triggered Demand 22
Response”:23
– Section A; “Introduction”;24
– Section B, “Least-Cost Dispatch”; and25
– Section D, “Conclusion.”26
Q 5 Does this conclude your statement of qualifications?27
A 5 Yes, it does.28

ALT-1
PACIFIC GAS AND ELECTRIC COMPANY1
STATEMENT OF QUALIFICATIONS OF ALVIN L. THOMA2
Q 1 Please state your name and business address.3
A 1 My name is Alvin L. Thoma, and my business address is Pacific Gas and 4
Electric Company, 245 Market Street, San Francisco, California.5
Q 2 Briefly describe your responsibilities at Pacific Gas and Electric Company 6
(PG&E).7
A 2 I am the Director for Operations and Maintenance of PG&E’s generation 8
facilities in the southern portion of our system in PG&E’s Power Generation 9
organization. During the first half of the record period, I was the Director of 10
Fossil and Solar Operations and Maintenance, and in the second half of the 11
record period I was Director for Hydro Operations and Maintenance.12
Q 3 Please summarize your educational and professional background.13
A 3 I earned a Bachelor of Engineering degree in Chemical Engineering from 14
Vanderbilt University in 1979. I am a Registered Chemical Engineer in the 15
state of California. I joined PG&E in 1979 as an Engineer in the Department 16
of Engineering Research. From 1979-1989, I held a variety of research, 17
engineering design, project management and operations positions 18
supporting PG&E’s geothermal facilities. From 1989-1995, I led project 19
management and outage management groups supporting PG&E’s fossil 20
power plants. From 1995-2000, I led the project management activities at 21
PG&E Energy Services. I continued in this capacity when PG&E Energy 22
Services was sold and became Chevron Energy Solutions. In 2006, 23
I returned to PG&E as Manager of Project Management in Power 24
Generation, and was promoted to Director of the Projects, Engineering, and 25
Construction section of PG&E’s Power Generation Department in 2007. 26
In 2009, I took on the role of Director of Hydro Operations and Maintenance. 27
In 2012, I became the Director of Hydro Licensing. In 2015, I became 28
Director of Fossil and Solar Operations and Maintenance. I was a witness in 29
PG&E’s 2012 and 2016 Energy Resource Recovery Account Compliance 30
Review proceedings.31

ALT-2
Q 4 What is the purpose of your testimony?1
A 4 I am sponsoring the following testimony in PG&E’s 2017 Energy Resource 2
Recovery Account Compliance Review proceeding:3
Chapter 2, “Utility-Owned Generation: Hydroelectric”:4
– Attachment A, “PG&E Powerhouses and Generating Units.”5
Chapter 6, “Generation Fuel Costs and Electric Portfolio Hedging”:6
– Section C, “Distillate Expenses”; and7
– Section D, “Water Purchased for Power.”8
Q 5 Does this conclude your statement of qualifications?9
A 5 Yes, it does.10