pacific gas and electric company · pacific gas and electric company epic final report program...
TRANSCRIPT

Pacific Gas and Electric Company
EPIC Final Report
Program Electric Program Investment Charge
Project EPIC 2.05: Inertia Response Emulation for DG Impact Improvement
Reference Name
EPIC 2.05 - Synthetic Inertia EPIC 2.05 - Inertia Response EPIC 2.05 - Inertia Response and Short Circuit Contribution for DG Impact Improvement
Executive Sponsor Roy Kuga
Project Sponsor
Business Lead
Technical Lead
Contact Info
Date
Mark Esguerra Bennett Chabot Alejandro Avendaño Ceceña [email protected] February 20, 2019
Version Type Final Report

EPIC Final Report | 2.05 Synthetic Inertia
i
Table of Contents
1 Executive Summary .................................................................................................................... 1
1.1 Key Project Objectives ...................................................................................................... 4
1.2 Key Accomplishments ....................................................................................................... 6
1.3 Key Takeaways .................................................................................................................. 8
1.4 Recommendations ............................................................................................................ 9
1.5 Conclusion ...................................................................................................................... 10
2 Introduction .............................................................................................................................. 12
3 Project Summary ...................................................................................................................... 13
3.1 Issue Addressed .............................................................................................................. 13 3.1.1 Project Motivation ............................................................................................. 13 3.1.2 Use Case Overview ............................................................................................ 15
3.2 Project Objectives ........................................................................................................... 15
3.3 Scope of Work and Project Tasks ................................................................................... 16 3.3.1 Tasks and Milestones: PHIL Hardware Testing ................................................. 17 3.3.2 Tasks and Milestones: Modeling and Simulation ............................................. 17
4 Project Activities, Results, and Findings ................................................................................... 20
4.1 Technical Results and Findings – Literature Review ....................................................... 20 4.1.1 Inertial and Primary Frequency Response From Conventional Generation ...... 20 4.1.2 Frequency Response From Inverter-Based Renewable Generation ................. 21 4.1.3 Short-Circuit Contribution and Power System protection ................................ 21 4.1.4 Load Following ................................................................................................... 24 4.1.5 Frequency Response for Distribution System ................................................... 25
4.2 Technical Results and Findings – Synthetic Inertia Modeling and Simulation ............... 26 4.2.1 Technical Development and Methods ............................................................... 26 4.2.2 Challenges .......................................................................................................... 40 4.2.3 Results and Observations .................................................................................. 42
4.3 Technical Results and Findings – PHIL Testing of BESS Controls for Synthetic Inertia
Functions .................................................................................................................................. 42 4.3.1 Main Assumptions and Scenarios Used for PHIL Concept Development .......... 42 4.3.2 Test Plan for Synthetic Inertia-Like Response and Active Power Control By BESS 45 4.3.3 Test Plan for Provision of Distribution System Services By BESS ...................... 46 4.3.4 BESS Controls Development .............................................................................. 47 4.3.5 RTDS Models Development ............................................................................... 48 4.3.6 Results of PHIL Testing of Fast Active Power Controls by BESS ......................... 49 4.3.7 Results of PHIL Testing of Short-Circuit Current Contribution by BESS ............... 7 4.3.8 Results of PHIL Testing of Load Following by BESS ............................................ 13 4.3.9 Results for Frequency Response for Distribution by BESS ................................ 16
5 Value proposition ..................................................................................................................... 25
5.1 Primary Principles ........................................................................................................... 25
5.2 Secondary Principles ....................................................................................................... 26
5.3 Accomplishments and Recommendations ..................................................................... 26 5.3.1 Key Accomplishments ........................................................................................ 26

EPIC Final Report | 2.05 Synthetic Inertia
ii
5.3.2 Key Takeaways ................................................................................................... 27 5.3.3 Recommendations ............................................................................................. 28
5.4 Technology Transfer Plan ............................................................................................... 30 5.4.1 IOU’s Technology Transfer Plans ....................................................................... 30 5.4.2 Information Sharing Forums Held ..................................................................... 30 5.4.3 Adaptability to Other Utilities and Industry ...................................................... 30
5.5 Data Access ..................................................................................................................... 31
6 Metrics ...................................................................................................................................... 32
7 Conclusion ................................................................................................................................ 33
8 Additional References .............................................................................................................. 34
9 Appendices ............................................................................................................................... 36
9.1 Modeling and Simulation Exhibits .................................................................................. 36 9.1.1 Parameters of IRG Generator Models Added .................................................... 36 9.1.2 Dynamic Performance Criteria .......................................................................... 38
9.2 Power-Hardware-in-the-Loop Testing Exhibits .............................................................. 38 9.2.1 PHIL Testing Considerations .............................................................................. 38 9.2.2 Results of PHIL Testing of Reactive Power Controls by BESS ............................ 41 9.2.3 Additional Short-Circuit Scenarios ..................................................................... 44
List of Tables Table 1: Inertia Use Case Definitions .......................................................................................................... 4 Table 2: Overview of Types of Advanced Frequency Response Studied by EPIC 2.05 ............................... 5 Table 3: Definitions of Use Cases for Inertia Functions Explored by EPIC 2.05 ........................................ 15 Table 4: Project Objectives for Each Inertia Use Case .............................................................................. 16 Table 5: Dynamic Models for the IEEE 9-Bus System in PSCAD and PSLF ................................................ 28 Table 6: Load and Generation in the PSLF Base Case ............................................................................... 31 Table 7: Breakdown of Generation in the PSLF Base Case ....................................................................... 31 Table 8: Amount and Percentage of Generation Simulated as IRG in PG&E, CA, and WECC Geographies for Threshold Analysis Cases .................................................................................................................... 32 Table 9: Existing PVD1 (DG Generator Model) Voltage and Frequency Ride-Through Parameters......... 33 Table 10: Frequency Violations for the Dynamic Contingencies Used for Threshold Analysis ................ 34 Table 11: Summary of the Count of Frequency Violations and Lowest Frequency .................................. 38 Table 12. UC1 Test Matrix – Active Power Controls by BESS (No Controls, Inertia Only, FFR Only, Inertia + FFR) ........................................................................................................................................................ 45 Table 13. UC2 Test Matrix – Reactive Power Controls by BESS (voltage droop by BESS) ....................... 45 Table 14. UC4 Test Matrix......................................................................................................................... 46 Table 15. Transmission Fault Scenarios ...................................................................................................... 7 Table 16. Matrix of Fault Test Conducted in Islanded Mode ..................................................................... 9 Table 17. Locational Impact of BESS ......................................................................................................... 13 Table 18: Dynamic Model Parameters for Inverter-Based Renewable Generators Simulated in PSLF .... 36 Table 19. Renewable Penetration Scenarios for 9-Bus System ............................................................... 39 Table 20. BESS Inertia Constants .............................................................................................................. 40
EPIC Final Report | 2.05 Synthetic Inertia
iii
List of Figures Figure 1: Illustrative Time Domains and Terminology of Frequency Response to a Grid Disturbance ...... 3 Figure 2: Examples of BESS Power Output Using Advanced Frequency Control Techniques: Inertia (SIR), FFR With and Without a 1 Second Time Delay (TD), and a combination of SIR and FFR. .......................... 5 Figure 3: Illustrative Time Domains and Terminology of Frequency Response to a Grid Disturbance .... 14 Figure 4. Fault Current Comparison.......................................................................................................... 22 Figure 5 Synthetic Inertia-Like Response Control Block in PSCAD ........................................................... 26 Figure 6: Step Response for Synthetic Inertia Controller in PSCAD and PSLF .......................................... 27 Figure 7: Frequency and Active Power Response and Output of a Generator in Respective RSCAD and PSLF Models for the Same Disturbance .................................................................................................... 28 Figure 8: Active Power Output Response Comparison of PSCAD and PSLF Models ................................ 29 Figure 9: Frequency Response Measured in PSCAD and PSLF .................................................................. 29 Figure 10: Model Comparison in Frequency and Active Power Response in RTDS, PSCAD, and PSLF ..... 30 Figure 11: Summary of Violation Count and Duration With and Without Synthetic Inertia-Like Response .................................................................................................................................................................. 35 Figure 12: Frequency Comparison of PG&E and WECC With and Without Synthetic Inertia-Like Response ................................................................................................................................................... 36 Figure 13: Frequency Comparison of the Locational Sensitivity Cases .................................................... 37 Figure 14: IRG Generation in PG&E From 0.9 to 1.5 Seconds .................................................................. 37 Figure 15: Active Power Output vs Time for Headroom Sensitivity Analysis ........................................... 39 Figure 16: Average System Frequency vs Time for Headroom Sensitivity Analysis ................................. 39 Figure 17: Frequency Comparison Of Two Different Models For The Same Bus Location....................... 41 Figure 18. Adapted Standard IEEE 9-Bus Test System With PG&E Represented as a Mix of Hydro, CT, CC, Wind and Solar PV Generation ........................................................................................................... 43 Figure 19. GE WindInertia Model ............................................................................................................. 44 Figure 20. Historic Frequency Events in the Western Interconnection Measured by NREL In Colorado . 44 Figure 21. P and Q Prioritization Principle ................................................................................................ 48 Figure 22. RTDS Model of Distribution System Used for PHIL Testing ..................................................... 49 Figure 23: Complete Simulation Timescale, Synthetic Inertia Response by BESS, 0% Renewables Level, HBESS = 125 s ............................................................................................................................................... 50 Figure 24: Magnified Timescale Around T=0, Synthetic Inertia Response by BESS, 0% Renewables Level, HBESS = 125 s ............................................................................................................................................... 50 Figure 25. Inertial Response by BESS at 60% Renewables (HBESS = 50 s). Left Column Shows: Complete Simulation Timescale, Right Column Shows Magnified Timescale Around T=0 ......................................... 2 Figure 26. FFR by BESS at 0% Renewables Left Column Shows Complete Simulation Timescale, Right Column Shows Magnified Timescale Around T=0 ...................................................................................... 3 Figure 27. FFR by BESS at 60% Renewables Left Column Shows Complete Simulation Timescale, Right Column Shows Magnified Timescale Around T=0 ...................................................................................... 4 Figure 28. Comparison of Inertial and FFR Controls at 60%Rrenewables Left Column Shows Complete Simulation Timescale, Right Column Shows Magnified Timescale Around T=0 ......................................... 5 Figure 29. Measurements on High Voltage Side of Inverter Transformer During 3-Ph Low Impedance Fault on Bus 630 ......................................................................................................................................... 8 Figure 30. Measurements on High Voltage Side of Inverter Transformer During L-To-L Low Impedance Fault in Bus 691......................................................................................................................................... 10 Figure 31. Measurements on High Voltage Side of Inverter Transformer During 3-Phase Low Impedance Fault in Bus 691......................................................................................................................................... 11

EPIC Final Report | 2.05 Synthetic Inertia
iv
Figure 32. Measurements On High Voltage Side of Inverter Transformer During L-To-G Low Impedance Fault in Bus 691......................................................................................................................................... 12 Figure 33. P-Q Characterization Test ........................................................................................................ 14 Figure 34. Reactive Power Capability Measured on LV and Millivolt Sides Of Inverter Trasformer ........ 15 Figure 35. Voltage and Frequency Setpoint Change In Islanded Mode (Left – High Voltage Side of Bess Transformer, Right – Comparison of Measurements at Different Buses) ................................................ 16 Figure 36. Planned Islanding Test – Bus 630 Measurements ................................................................... 17 Figure 37. Planned Islanding Test – Inverter Measurements ................................................................... 17 Figure 38. Unplanned Islanding Test – Inverter Measurements .............................................................. 18 Figure 39. Unplanned Islanding Test – Comparison of Measurements on Different Buses ..................... 19 Figure 40. BESS Measurements During Motor Start (High Voltage Side of Inverter Transformer) .......... 20 Figure 41. BESS Measurements During Motor Start (High Voltage Side of Inverter Transformer) – Current-Limiting Mode ............................................................................................................................. 21 Figure 42. Comparison of Measurements in Different Buses During Motor Start Event – Current Limiting ..................................................................................................................................................... 22 Figure 43. Power Quality Snapshot on CGI Terminal Before (Left) and During (Right) Motor Start ........ 22 Figure 44. BESS Measurements During PV Trip Event (High Voltage Side of Inverter Transformer) ....... 23 Figure 45. BESS H Values Explained (Left Column – Test Data, Right Column – Magnified Around t=0) 41 Figure 46. LVRT at 40% Renewables and 20% Voltage Droop And Active Power Controls by BESS ........ 42 Figure 47. HVRT at 40% Renewables with Various Controls: Vdroop – 10%, Fdroop – 5%, H75 – Inertia Control Enabled with 75s Inertia Constant ............................................................................................... 43 Figure 48. Measurements on High Voltage Side of Inverter Transformer During 3-Phase High Impedance Fault in Bus 630 ...................................................................................................................... 44 Figure 49. Comparison of Measurements in Different Buses During 3-Phase High Impedance Fault in Bus 630 ..................................................................................................................................................... 45 Figure 50. Measurements on High Voltage Side of Inverter Transformer During L-TO-L Low Impedance Fault in Bus 672 (Load Terminals) ............................................................................................................. 46 Figure 51. Measurements on High Voltage Side of Inverter Transformer During L-to-G Low Impedance Fault in Bus 672 (Load Terminals) ............................................................................................................. 47
EPIC Final Report | 2.05 Synthetic Inertia
v
Table of Acronyms
A. Application
ADC Application Delivery Control
ADER Aggregated Distributed Energy Resource
ADMS Advanced Distribution Management System
AGC Automatic Generator Control
AHJ Authority Having Jurisdiction
amp ampere
APC Active Power Controls
BESS Battery Energy Storage System
BTM Behind the Meter
CAISO California Independent System Operator
CEC California Energy Commission
CHIL Controller-Hardware-in-the-Loop
CGI Controllable Grid Interface
CPUC California Public Utilities Commission
D. Decision
DER Distributed Energy Resource
DERMS Distributed Energy Resource Management System
DG Distributed Generation
DMZ Demilitarized Zone (Computing)
DR Demand Response
DRP Distribution Resources Plan
DRP-A Demand Response Provider Agreement
EPIC Electric Program Investment Charge
EPRI Electric Power Research Institute
ESS Energy Storage Systems
EMTP Electromagnetic Transients Program
EV Electric Vehicle
FERC Federal Energy Regulatory Commission
FFR Fast Frequency Response
FTM Front of the Meter
GE General Electric
GHG Greenhouse Gas
GRC General Rate Case
GTM Greentech Media
GW gigawatt
HTTPS Hypertext Transfer Protocol Secure
HV High Voltage
IEC International Electrotechnical Commission

EPIC Final Report | 2.05 Synthetic Inertia
vi
IEEE Institute of Electrical and Electronic Engineers
IGP Integrated Grid Platform
IRG Inverter-based Renewable Generation resources or Inverter-based Renewable Generators
IT Informational Technology
kV kilovolt
kVAR Kilo Volt Ampere Reactive
kW Kilowatt
kWh kilowatt-hour
LMP Locational Marginal Pricing
LL Line to Line
LTC Load Tap Changer
LV low voltage
MAPE Mean Average Percent Error
MILP Mixed Integer Linear Programming
ms Millisecond
MUA Multiple Use Applications
mV Millivolt
MVA Megavolt-Ampere
MVAR Megavolt Ampere Reactive
MVP Minimum Viable Product
MW Megawatt
MWh megawatt-hour
NEM Net Energy Metering
NERC North American Reliability Corporation
NGR Non-generating Resource
NREL National Renewable Energy Laboratory’s
NWTC National Wind Technology Center
OpenADR Open Automated Demand Response
PDR Proxy Demand Resource
PCC point of common coupling
PFR Primary Frequency Response
PG&E Pacific Gas & Electric Company or the Utility
PHIL Power-Hardware-in-the-Loop
PMU Micro-Phasor Measurement Unit
POI Point of interconnection
PRC Protection and Control
PSCAD Power Systems Computer Aided Design software
PSLF Positive Sequence Load Flow
PV Photovoltaic
QSTS Quasi-Static Time Series
RFI Request for Information

EPIC Final Report | 2.05 Synthetic Inertia
vii
RFP Request for Proposal
ROCOF Rate of Change of Frequency
RSCAD Power system simulation software, a graphical user interface for RTDS
RTDS Real Time Digital Simulation
SCADA Supervisory Control and Data Acquisition
SCC Short Circuit Current Contribution
SCE Southern California Edison Company
SDG&E San Diego Gas & Electric Company
SEL Schweitzer Engineering Laboratories
SIR Synthetic Inertia-like Response
SEPA Smart Electric Power Alliance
SIWG Smart Inverter Working Group
SNL Sandia National Labs
SoC State of Charge
SSP II Supply Side II DR Pilot
STES Short Term Electric Supply
TD&D Technology Demonstration and Deployment
UFLS Under Frequency Load Shedding
V volt
VAR volt-ampere reactive
VVO Volt-VAR Optimization
WECC Western Electricity Coordinating Council
WI Western Interconnection
XSP Excess Supply DR Pilot
YB BESS Yerba Buena Battery Energy Storage System


EPIC Final Report | 2.05 Synthetic Inertia
1
1 Executive Summary
This report summarizes the project objectives, technical results and lessons learned for Electric Program Investment Charge (EPIC) Project 2.05 - Inertia Response Emulation for Distributed Generation (DG) Impact Improvement as reported in the EPIC Annual Report, also referred to as EPIC 2.05 – Inertia Response and Short Circuit Contribution for DG Impact Improvement, EPIC 2.05 – Inertia Response or EPIC 2.05 – Synthetic Inertia. As California pursues its policy objective of reducing carbon emissions of the power system, Pacific Gas and Electric Company (PG&E) is undergoing rapid changes in its generation resource mix. Increased amounts of renewable generation, including solar photovoltaic (PV) power plants, are causing a corresponding decrease in conventional generation, such as gas fired plants or other large machines. This change represents a shift away from machine-based, synchronous, rotating power generation technologies and towards inverter-based, renewable power generation. This shift decreases the total inertia of spinning mass connected to the system. System inertia provides innate and critical support characteristics to the entirety of the interconnected grid. Inertia is one property of the system that helps maintains stability during sudden disruptions, such as the loss of major loads or generators, caused by contingency events. These changing conditions raise concerns for power system operators and utilities including PG&E about the impact of such reduced inertia on grid operation, reliability, and stability. Reliability organizations around the world have devised grid requirements such as North American Reliability Corporation ‘s (NERC) issuance of 2018 reliability guidelines (2018)1 as well as the California Electric Rule 21 Smart Inverter provisions2, to address reliability issues with inverter-based resources like PV and energy storage. Equipment standards such as Institute of Electrical and Electronic Engineers (IEEE) 15473 for inverters are evolving. This standard, for instance, requires inverter-based resources to be capable of a new frequency-watt control function which constitutes a first foray into the possibilities of frequency response from distribution-connected inverters. However, a more complete understanding of what functions constitute “Synthetic Inertia” and associated capabilities from inverter-based resources has yet to emerge. While inertia provides several useful qualities to the connected power system, these functions have not been included in any standard due to the lack of clarity of both the system’s future needs and the capability of current technologies. These future needs may go beyond the scope of what has been studied in the context of Smart Inverters, such as in PG&E’s EPIC 2.03a project4, and most likely will require focus on large transmission-connected inverters to address issues on the bulk electric system.
1 (NERC 2018).
2 See PG&E’s Electric Rule 21, Section Hh. “Smart Inverter Generating Facility Operation and Design Requirements”
https://www.pge.com/tariffs/tm2/pdf/ELEC_RULES_21.pdf. 3 “IEEE 1547-2018 - IEEE Standard for Interconnection and Interoperability of Distributed Energy Resources with
Associated Electric Power Systems Interfaces” https://standards.ieee.org/standard/1547-2018.html. 4 See EPIC 2018 Interim and 2019 Final Reports for the project EPIC 2.03a “Test Capabilities of Customer-Sited
Behind-the-Meter Smart Inverters” as well as the 2018 Joint IOU White Paper “Enabling Smart Inverters for Distribution Grid Services.” Those works focus on distributed resources, whereas this report addresses related but distinct issues encompassing both the distribution and transmission systems https://www.pge.com/en_US/about-pge/environment/what-we-are-doing/electric-program-investment-charge/closeout-reports.page.
EPIC Final Report | 2.05 Synthetic Inertia
2
The PG&E EPIC 2.05 project focused on clarifying the various functions of synthetic inertia and understanding the opportunities and limitations for obtaining these inertia functions from Inverter-based Renewable Generation resources (IRG) to benefit the electric grid. This included understanding how these synthetic inertia functions relate to the level of IRGs deployment that the existing system can support.
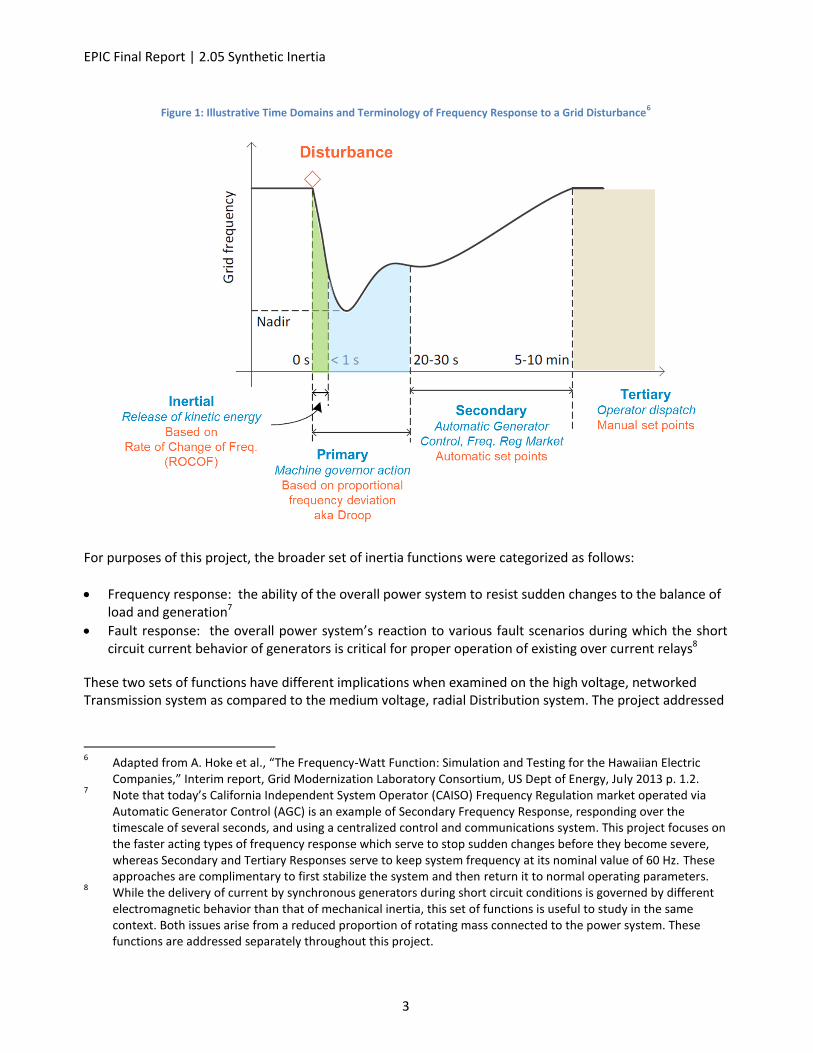
“Synthetic Inertia” is an emergent term for the set of functions that the power system may need as the use of rotating mass for electricity generation declines in the future. The term “Synthetic” is used to differentiate from synchronous machine generation resources, as the real power response from inverter-based resources must be actively managed by electronic control logic rather than by their inherent physical properties. Synthetic Inertia-like Response (SIR) is a designed control capability of inverter-based energy resources. It provides real power output in response to a measured deviation in system frequency. Synchronous machines provide such a response inherently due to their electromechanical connection with the power system; their response is governed by Newton’s Second Law of Motion where the object in motion resists changes to that motion based on its inertia. This report uses the capitalized term “Synthetic Inertia-like Response” throughout to refer to this control capability. “Digital Inertia” could also be an appropriate term to describe the same concept, but it is not used in this report. In the context of the broad transmission system response, the project’s literature review found that the term “Synthetic Inertia” is most common and refers to the ability of a generator to sense and respond to changes in system frequency. Specifically, SIR is used throughout this document to refer to a control of inverter active power output based on a measured Rate of Change of Frequency (ROCOF). See Section 3.1.1 for a more complete definition. Figure 1 shows where inertial response fits in the context of different time domains of frequency response. Today’s power system relies on a combination of designed and innate mechanisms across all these time domains to maintain frequency during sudden disturbances. Whereas prior work such PG&E’s EPIC 1.015 project has shown that inverter-based Battery Energy Storage System (BESS) can provide Secondary Frequency Response in the form of Frequency Regulation market participation, the faster acting time domains of Primary and Inertial response represent areas for innovation.
5 “EPIC Project 1.01 – Energy Storage End Uses: Energy Storage for Market Operations” 2016
https://www.pge.com/pge_global/common/pdfs/about-pge/environment/what-we-are-doing/electric-program-investment-charge/PGE-EPIC-Project-1.01.pdf.
EPIC Final Report | 2.05 Synthetic Inertia
3
Figure 1: Illustrative Time Domains and Terminology of Frequency Response to a Grid Disturbance6
For purposes of this project, the broader set of inertia functions were categorized as follows:
Frequency response: the ability of the overall power system to resist sudden changes to the balance of load and generation7
Fault response: the overall power system’s reaction to various fault scenarios during which the short circuit current behavior of generators is critical for proper operation of existing over current relays8
These two sets of functions have different implications when examined on the high voltage, networked Transmission system as compared to the medium voltage, radial Distribution system. The project addressed
6 Adapted from A. Hoke et al., “The Frequency-Watt Function: Simulation and Testing for the Hawaiian Electric
Companies,” Interim report, Grid Modernization Laboratory Consortium, US Dept of Energy, July 2013 p. 1.2. 7 Note that today’s California Independent System Operator (CAISO) Frequency Regulation market operated via
Automatic Generator Control (AGC) is an example of Secondary Frequency Response, responding over the timescale of several seconds, and using a centralized control and communications system. This project focuses on the faster acting types of frequency response which serve to stop sudden changes before they become severe, whereas Secondary and Tertiary Responses serve to keep system frequency at its nominal value of 60 Hz. These approaches are complimentary to first stabilize the system and then return it to normal operating parameters.
8 While the delivery of current by synchronous generators during short circuit conditions is governed by different
electromagnetic behavior than that of mechanical inertia, this set of functions is useful to study in the same context. Both issues arise from a reduced proportion of rotating mass connected to the power system. These functions are addressed separately throughout this project.
EPIC Final Report | 2.05 Synthetic Inertia
4
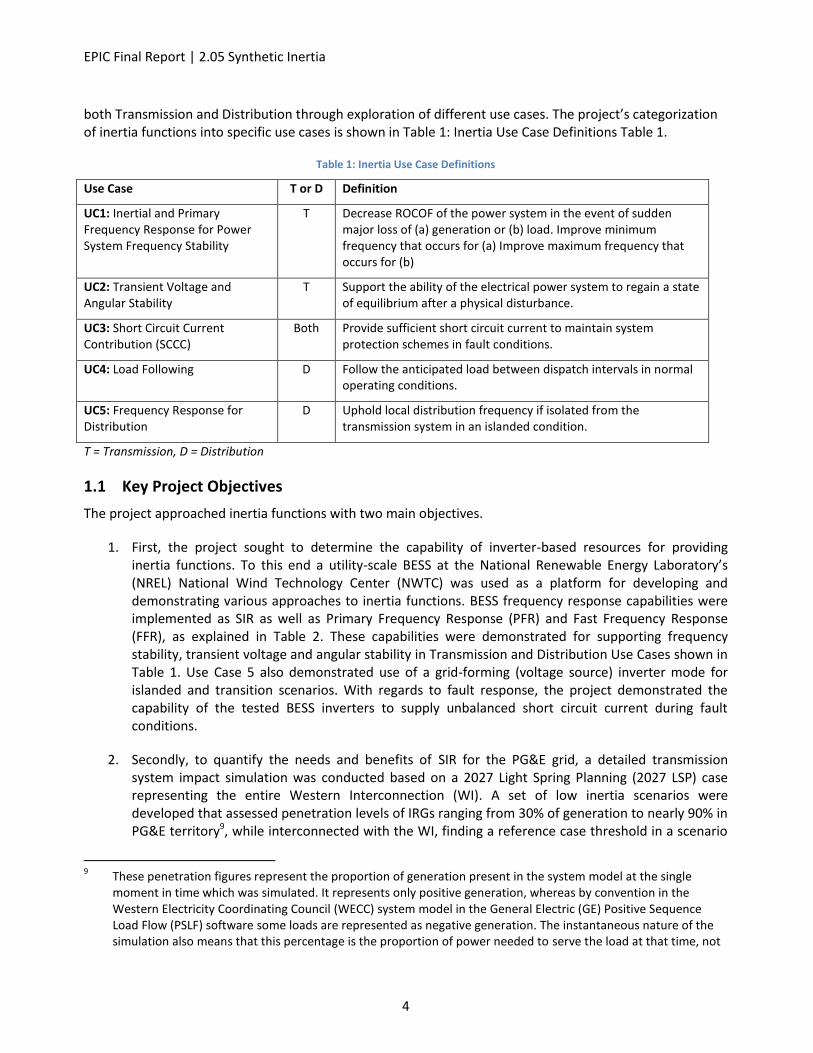
both Transmission and Distribution through exploration of different use cases. The project’s categorization of inertia functions into specific use cases is shown in Table 1: Inertia Use Case Definitions Table 1.
Table 1: Inertia Use Case Definitions
Use Case T or D Definition
UC1: Inertial and Primary Frequency Response for Power System Frequency Stability
T Decrease ROCOF of the power system in the event of sudden major loss of (a) generation or (b) load. Improve minimum frequency that occurs for (a) Improve maximum frequency that occurs for (b)
UC2: Transient Voltage and Angular Stability
T Support the ability of the electrical power system to regain a state of equilibrium after a physical disturbance.
UC3: Short Circuit Current Contribution (SCCC)
Both Provide sufficient short circuit current to maintain system protection schemes in fault conditions.
UC4: Load Following D Follow the anticipated load between dispatch intervals in normal operating conditions.
UC5: Frequency Response for Distribution
D Uphold local distribution frequency if isolated from the transmission system in an islanded condition.
T = Transmission, D = Distribution
1.1 Key Project Objectives
The project approached inertia functions with two main objectives.
1. First, the project sought to determine the capability of inverter-based resources for providing inertia functions. To this end a utility-scale BESS at the National Renewable Energy Laboratory’s (NREL) National Wind Technology Center (NWTC) was used as a platform for developing and demonstrating various approaches to inertia functions. BESS frequency response capabilities were implemented as SIR as well as Primary Frequency Response (PFR) and Fast Frequency Response (FFR), as explained in Table 2. These capabilities were demonstrated for supporting frequency stability, transient voltage and angular stability in Transmission and Distribution Use Cases shown in Table 1. Use Case 5 also demonstrated use of a grid-forming (voltage source) inverter mode for islanded and transition scenarios. With regards to fault response, the project demonstrated the capability of the tested BESS inverters to supply unbalanced short circuit current during fault conditions.
2. Secondly, to quantify the needs and benefits of SIR for the PG&E grid, a detailed transmission system impact simulation was conducted based on a 2027 Light Spring Planning (2027 LSP) case representing the entire Western Interconnection (WI). A set of low inertia scenarios were developed that assessed penetration levels of IRGs ranging from 30% of generation to nearly 90% in PG&E territory9, while interconnected with the WI, finding a reference case threshold in a scenario
9 These penetration figures represent the proportion of generation present in the system model at the single
moment in time which was simulated. It represents only positive generation, whereas by convention in the Western Electricity Coordinating Council (WECC) system model in the General Electric (GE) Positive Sequence Load Flow (PSLF) software some loads are represented as negative generation. The instantaneous nature of the simulation also means that this percentage is the proportion of power needed to serve the load at that time, not

EPIC Final Report | 2.05 Synthetic Inertia
5
with about 57% before frequency response problems were observed. A model of an inverter-based generator with SIR was created, validated using the actual hardware testing, and applied to improve the reference case threshold frequency performance.
Table 2: Overview of Types of Advanced Frequency Response Studied by EPIC 2.05
Type of Frequency Response Control Method Scope of Control System
Power Output Curve Shape Time scale
Synthetic Inertia Response
Differential control based on ROCOF
Autonomous Continuous, likely irregular
Milliseconds, instantaneous
Fast Frequency Response
Fastest possible step change
control
System-level monitoring or autonomous pre-
defined threshold akin to Under Frequency Load
Shedding (UFLS)
Square, step change
Milliseconds, with delay for
communication or time-underfrequency
set point
Primary Frequency Response
Proportional control based on frequency, aka
frequency droop
Autonomous Continuous, likely smooth
Seconds
Figure 2: Examples of BESS Power Output Using Advanced Frequency Control Techniques: Inertia (SIR), FFR With and Without a 1 Second Time Delay (TD), and a combination of SIR and FFR.
the total connected load nor the total possible power capacity of the connected generation. Of the power flowing in the model at the moment simulated, this % represents the portion sourced from IRGs.

EPIC Final Report | 2.05 Synthetic Inertia
6
1.2 Key Accomplishments
The following summarizes some of the key accomplishments of the project over its duration: Power-Hardware-in-the-Loop (PHIL) Testing of BESS Controls:
Developed and validated SIR, PFR, and FFR control capabilities for an inverter resource on lab
platform (LabView) and field automation hardware (A Real-Time Automation Controller);
Created PHIL test protocol including models of the PG&E distribution system and a simplified model
of the WECC Transmission system adapted from the standard IEEE 9 bus test model;
Characterized the short-circuit current contribution of inverter hardware to better inform
protection scheme development of islanded power systems;
Created a novel PHIL interface allowing continuous before and after simulation of islanding events
for a distribution-connected BESS; and
Demonstrated seamless transitions, load variation handling, and fault tolerance of a BESS using grid-
forming (voltage source) inverter mode for Power-frequency droop (proportional) control in PHIL
environment.
Transmission Modeling and Simulation of SIR
Performed thorough literature review of scholarly and industry works related to inertia loss impacts
on the power system and inverter control solutions to mitigate those impacts.
Developed detailed models of SIR controls in PSCAD and RSCAD, cross validating software and
hardware behavior.
Created a user-defined model of an inverter resource with new Synthetic Inertia capability in the GE PSLF Software and validated with more detailed electromagnetic models in PSCAD and testing results from hardware-in-the-loop testing.
Adapted the Synthetic Inertia controller models for use with GE PSLF software for full-scale bulk
power system simulation. Used this model to perform system-wide dynamic simulations to
understand the impact of Synthetic Inertia from IRGs on the performance of the WI.
Determined a reference case for an IRG penetration threshold in PG&E territory using the WECC
power system model and accepted frequency performance planning criteria.
Applied SIR controller models to the reference case to demonstrate improvement of the system
frequency response and a corresponding improvement in IRG penetration threshold.
Performed a sensitivity analysis of the effects of location, type of resource, and varying headroom
on the IRG penetration threshold.
Furthermore, testing tools and lab products developed during this work have immediate value:
The PSCAD and PSLF model files developed by the project can be taken forward to future investigation of system needs and solution requirements. The PSLF unit model could be used by other utilities and grid reliability entities in their own studies to advance the industry knowledge.
The RSCAD and RTDS model files and test scripts created for the project can also be used for other distribution PHIL work including testing of other inertia solutions, DG, inverters, or microgrid controllers.
The utility collaboration with NREL has yielded a promising degree of fit in the lab’s capabilities and PG&E needs, which could yield further opportunities for the EPIC Program and beyond. This

EPIC Final Report | 2.05 Synthetic Inertia
7
example should encourage other utilities to explore opportunities to leverage the capabilities of NREL and other National Labs.

EPIC Final Report | 2.05 Synthetic Inertia
8
1.3 Key Takeaways
The following findings are the key takeaways from this project:
The project demonstrated that new SIR controller capabilities for battery and solar inverters can improve the frequency response of the transmission system in low inertia scenarios.
o SIR alone did not resolve all the frequency criteria violations created in the low-inertia simulations. A persistent number of issues remained at high deployment SIR, showing that the specific technique of SIR is not a one-to-one replacement for mechanical inertia.
o However, a combination of inverter control approaches demonstrated superior frequency response performance. Such a combination of approaches, possibly including SIR, FFR, and PFR, may enable IRGs to meet future frequency support needs.
Voltage variations during contingency events have a large impact on system frequency response performance due to the prevailing use of current-source mode inverters.
o Inverters close to faults are less effective for frequency support due to local voltage depression in those scenarios.
o A geographically disperse portfolio of assets is likely best suited for frequency response in combination with dynamic voltage support.
Today’s inverter hardware is capable of SIR, and the controls can be implemented on lab and field automation controllers. However, commercial availability of such features is uncertain. The project had to develop features on top of the available hardware, and vendor Request for Information (RFI) response was not robust enough to characterize the state of the market.
New inverter testing standards and utility interconnection requirements are needed for increasingly demanding (low inertia) future grid scenarios.
o New frequency response requirements may be needed to build on existing transmission10 and distribution interconnection rules.
o Performance requirements and standards for grid-forming (voltage source) inverters are especially nascent since this control mode is not prevalent for grid connected applications today.
The project proved that simulation methods are available to create low inertia transmission system scenarios, quantify inertia loss impacts, and test possible improvements to a reference penetration threshold.
o Starting with a model of WECC with light load and no PV resources, the method of incrementally adding IRGs and simulating contingency events showed a quantifiable reference for an IRG penetration threshold based on selected performance criteria.
o Using frequency performance criteria to measure the magnitude of impact from disturbances before system recovery, simulations showed a reference threshold of 57% IRG (approx. 10 gigawatts (GW) out of 18 GW) in Northern California while connected to the larger WI. This is not a prediction of an expected future scenario, but rather a baseline performance value usable to show the effects of SIR.
10
Federal Energy Regulatory Commission (FERC) Order 842 issued in 2018 requires Wholesale Distribution Tariff and CAISO interconnection tariffs to include a new requirement for all asynchronous generators (including IRGs) to provide Primary Frequency Response with certain preliminary parameters. https://www.ferc.gov/media/news-releases/2018/2018-1/02-15-18-E-2.asp.

EPIC Final Report | 2.05 Synthetic Inertia
9
The project demonstrated that a BESS operating in a constant grid-forming (voltage source) inverter mode can provide seamless transition capability to a distribution circuit, restoring load-generation imbalance quickly, without communications from a central controller.
o The BESS inverter in grid-forming mode demonstrated stable performance during all islanded distribution test cases even when short-term overload ratings of the BESS were exceeded.
o The studied BESS inverter was able to output unbalanced current. It was also able to ride through all the faults applied during the islanded distribution test sequence.
o The BESS inverter responded to step changes in frequency and voltage setpoints with high speed and precision thanks to the responsiveness of the inverter and controls.
Frequency measurement is technically difficult, and new solutions should be refined and tested for SIR applications.
o PHIL testing showed that existing frequency measurement algorithms fall short in dealing with unbalanced faults.
o Energy storage on distribution will face additional challenges for measuring system frequency. The higher number of various faults on the distribution system can distort the voltage waveforms that reach a storage device, thus impacting their ability to accurately measure the system frequency and respond correctly.11
Momentary cessation settings make an important difference to system response. Older vintages of frequency ride through settings would be a significant hinderance to having a full roll out of PV when considering system performance and stability. New settings required by the recent IEEE 1547-2018 standard should address this ride through issue. These new configurations were not yet in use in PSLF at the time of the project.
1.4 Recommendations
The utility industry needs to undertake further work to better pinpoint long-term future inertia impacts, needs, and refined solutions. This work should include the following activities:
o Assess the system needs in a range of forecasted scenarios for likely resource mixes in both
CA and across WECC.
o Determine how much headroom capacity12 is needed from SIR assets, from which types of
IRG resources, and in what locations on the power system. Alternative sources such as
synchronous condensers should also be assessed.
o Simulate tradeoffs and synergies of combining the ensemble of controller methods,
including SIR, FFR, and PFR.
o Address the modeling limitations of positive sequence dynamic simulation software around
faults and frequency measurement to enhance confidence in simulation outcomes.
Advanced tools may be needed such as co-simulation amongst EMTP and positive sequence
dynamic simulators. Such tools are not readily available.
11
This issue may be addressed in part by the issuance of the forthcoming IEEE 1547.1 standard. 12
Headroom capacity refers to the amount of active power available in online, operational resources that can be deployed for frequency response. This capacity could be provided by resources operating at less than their maximum rating, such as explored in the headroom sensitivity studies described in Section 4.2.1.4.3.3. It could also be provided by stand-by resources dedicated to this purpose, such as a BESS kept online at an idle or zero power output level.

EPIC Final Report | 2.05 Synthetic Inertia
10
o Pursue a more complete protection coordination study for low inertia scenarios, assessing
different adaptation methods in transmission-connected and islanded distribution
conditions.
o Assess the benefits, tradeoffs, and overall requirements to enable use of grid-forming
inverters for utility resilience applications, including investigate BESS locations that may
protect downstream loads from disturbances while grid-connected.
o Establish an industry standard control scheme, and corresponding validation test protocol,
for inverter frequency response including SIR that can be implemented via utility
requirements such as the Transmission Interconnection Handbook.
Near-term steps could be taken by utilities and regulators to advance SIR development including the following:
o Organize a broader stakeholder group including WECC member utilities and Balancing
Authorities such as CAISO to pursue the work detailed above.
o Incorporate the project’s SIR controller model into a standard model for PSLF and other
accepted modeling tools. The parameters of these models need to be refined, tuned and
further validated, particularly for co-simulation in multiple tools.
o Leverage energy storage for inertial functions. Specifically, assess the compatibility of
inflight BESS projects to accept controller upgrades in the future when frequency response
needs are better defined.
o Assess the complete set of alternatives, such as synchronous condensers, and the
respective costs, values, and compensation models for new inertial functions needed to
support the system.
o Thoroughly assess the commercial availability and technical readiness of inertia functions
across the market of inverter vendors.
o Bring this work to standards setting bodies such as IEEE in the 2800.1 Transmission Inverter
standard committee to drive for more thorough testing and addressing advanced frequency
controls commensurate with the evolving needs of the system.
o Engage NERC to establish frequency response requirements that address synthetic inertial
response capabilities and emergent system needs.
1.5 Conclusion
The EPIC 2.05 project gave a more definitive form to a looming issue facing the evolving power system. A high penetration level of renewable energy significantly decreases the inertia of the PG&E transmission system and increases the occurrence of frequency violations during contingency scenarios.
The project demonstrated great potential for novel control methods to enable inverter-based renewables
to address this problem. Dissecting the components of inertia-loss issues as well as analyzing the
complimentary controls techniques for inverters is a critical step in garnering requisite focus to these
looming problems and their potential solutions. Adding SIR, and other new control methods, to inverter-
based renewables may substantially improve system frequency performance.
The project also highlights the potential of grid-forming inverters for resilience applications of BESS on the
distribution system. The project demonstrated a grid-forming inverter providing seamless isolation and
robust response to load variations within an islanded distribution feeder, even without using a microgrid
EPIC Final Report | 2.05 Synthetic Inertia
11
controller or communications. This approach could greatly reduce control system costs while reducing
dependence on fossil-burning synchronous machine generators. Further development of this concept could
yield compelling applications of utility scale BESS, enabling utilities to offer new power system resilience
solutions to face climate and security risks.
Balancing authorities, utilities, regulators, and technology companies have a shared responsibility to
continue the work undertaken by EPIC 2.05. A collective view must be developed of future grid scenarios,
the modeling and analysis tools needed to understand them, and the new grid support technologies they
will require. The new reality of a high-renewables, low-inertia power system demands new approaches to
grid reliability. Greater need for power system resilience also brings new demand for inverter-based
resource to provide solutions. The breadth of these issues and the shared nature of the grid mean that
many entities from system operators to power producers are needed to participate in developing these new
approaches to ensure the clean, safe, reliable, and affordable power system that California needs.

EPIC Final Report | 2.05 Synthetic Inertia
12
2 Introduction
This report documents the EPIC 2.05 - Synthetic Inertia project achievements, highlights key learnings from the project that have industry-wide value, and identifies future opportunities for PG&E to leverage this project. The California Public Utilities Commission (CPUC) passed two decisions that established the basis for this demonstration program. The CPUC initially issued Decision (D.) 11-12-035, Decision Establishing Interim Research, Development and Demonstrations and Renewables Program Funding Level13, which established the EPIC on December 15, 2011. Subsequently, on May 24, 2012, the CPUC issued D.12-05-037, Phase 2 Decision Establishing Purposes and Governance for Electric Program Investment Charge and Establishing Funding Collections for 2013-202014, which authorized funding in the areas of applied research and development, Technology Demonstration and Deployment (TD&D), and market facilitation. In this later decision, CPUC defined TD&D as “the installation and operation of pre-commercial technologies or strategies at a scale sufficiently large and in conditions sufficiently reflective of anticipated actual operating environments to enable appraisal of the operational and performance characteristics and the financial risks associated with a given technology.”15 The decision also required the EPIC Program Administrators16 to submit Triennial Investment Plans to cover three-year funding cycles for 2012-2014, 2015-2017, and 2018-2020. On November 1, 2012, in Application (A.) 12-11-003, PG&E filed its first triennial EPIC Application with the CPUC, requesting $49,328,000 including funding for 26 Technology Demonstration and Deployment Projects. On November 14, 2013, in D.13-11-025, the CPUC approved PG&E’s EPIC plan, including $49,328,000 for this program category. On May 1, 2014, PG&E filed its second triennial investment plan for the period of 2015-2017 in the EPIC 2 A.14-05-003. CPUC approved this plan in D.15-04-020 on April 15, 2015, including $51,080,200 for 31 TD&D projects.17 Pursuant to PG&E’s approved 2015-2017 EPIC triennial plan, PG&E initiated, planned and implemented the following project: EPIC 2.05 - Synthetic Inertia through the annual reporting process. PG&E kept CPUC staff and stakeholder informed on the progress of the project. The following is PG&E’s final report on this project.
13
http://docs.cpuc.ca.gov/PublishedDocs/WORD_PDF/FINAL_DECISION/156050.PDF. 14
http://docs.cpuc.ca.gov/PublishedDocs/WORD_PDF/FINAL_DECISION/167664.PDF. 15
Decision 12-05-037 p. 37. 16
PG&E, San Diego Gas & Electric Company (SDG&E), Southern California Edison Company (SCE), and the California Energy Commission (CEC).
17 In the EPIC 2 Plan A.14-05-003, PG&E originally proposed 30 projects. Per CPUC D.15-04-020 to include an
assessment of the use and impact of EV energy flow capabilities, Project 2.03 was split into two projects, resulting in a total of 31 projects.
EPIC Final Report | 2.05 Synthetic Inertia
13
3 Project Summary
3.1 Issue Addressed
3.1.1 Project Motivation
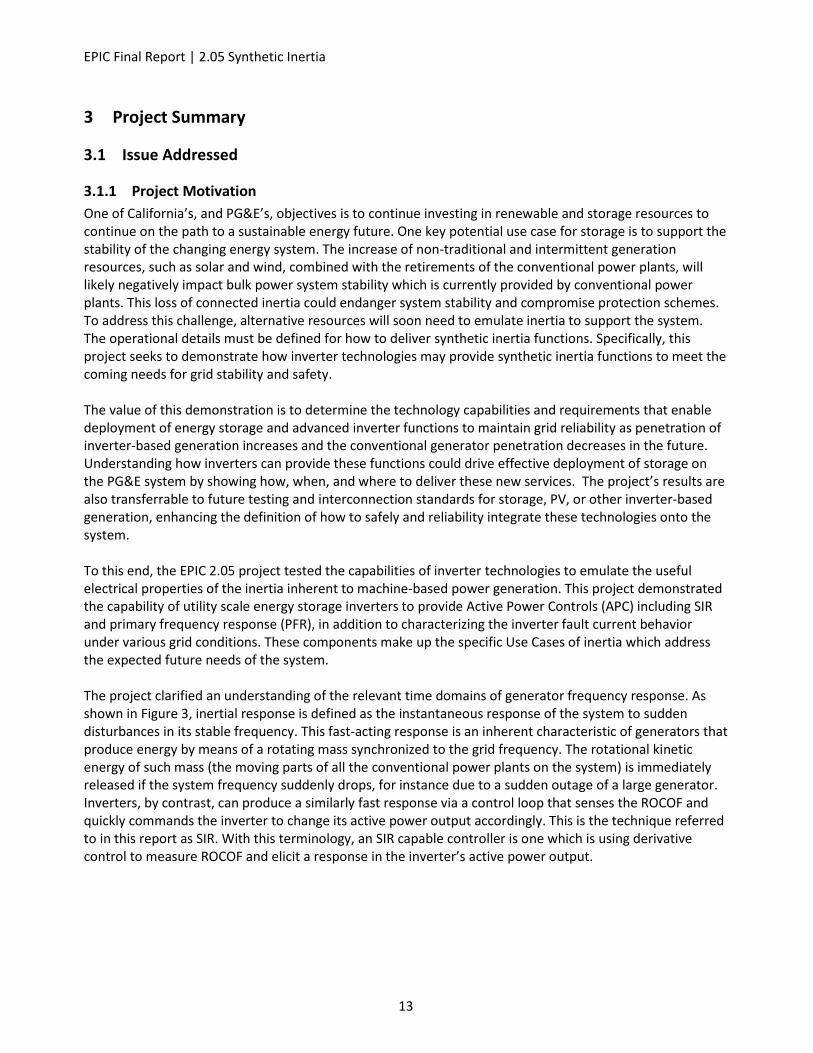
One of California’s, and PG&E’s, objectives is to continue investing in renewable and storage resources to continue on the path to a sustainable energy future. One key potential use case for storage is to support the stability of the changing energy system. The increase of non-traditional and intermittent generation resources, such as solar and wind, combined with the retirements of the conventional power plants, will likely negatively impact bulk power system stability which is currently provided by conventional power plants. This loss of connected inertia could endanger system stability and compromise protection schemes. To address this challenge, alternative resources will soon need to emulate inertia to support the system. The operational details must be defined for how to deliver synthetic inertia functions. Specifically, this project seeks to demonstrate how inverter technologies may provide synthetic inertia functions to meet the coming needs for grid stability and safety. The value of this demonstration is to determine the technology capabilities and requirements that enable deployment of energy storage and advanced inverter functions to maintain grid reliability as penetration of inverter-based generation increases and the conventional generator penetration decreases in the future. Understanding how inverters can provide these functions could drive effective deployment of storage on the PG&E system by showing how, when, and where to deliver these new services. The project’s results are also transferrable to future testing and interconnection standards for storage, PV, or other inverter-based generation, enhancing the definition of how to safely and reliability integrate these technologies onto the system. To this end, the EPIC 2.05 project tested the capabilities of inverter technologies to emulate the useful electrical properties of the inertia inherent to machine-based power generation. This project demonstrated the capability of utility scale energy storage inverters to provide Active Power Controls (APC) including SIR and primary frequency response (PFR), in addition to characterizing the inverter fault current behavior under various grid conditions. These components make up the specific Use Cases of inertia which address the expected future needs of the system. The project clarified an understanding of the relevant time domains of generator frequency response. As shown in Figure 3, inertial response is defined as the instantaneous response of the system to sudden disturbances in its stable frequency. This fast-acting response is an inherent characteristic of generators that produce energy by means of a rotating mass synchronized to the grid frequency. The rotational kinetic energy of such mass (the moving parts of all the conventional power plants on the system) is immediately released if the system frequency suddenly drops, for instance due to a sudden outage of a large generator. Inverters, by contrast, can produce a similarly fast response via a control loop that senses the ROCOF and quickly commands the inverter to change its active power output accordingly. This is the technique referred to in this report as SIR. With this terminology, an SIR capable controller is one which is using derivative control to measure ROCOF and elicit a response in the inverter’s active power output.

EPIC Final Report | 2.05 Synthetic Inertia
14
Figure 3: Illustrative Time Domains and Terminology of Frequency Response to a Grid Disturbance
Figure 3 shows similar breakdowns of the conventional mechanism (e.g., governor action) and control principle (e.g., proportional control) for each of the other time domains of frequency response. In practice, the many generators on the power system and the entities operating them combine all these approaches in the day to day management of the bulk power system. Which tool is used depends on the speed and magnitude of the disturbance: normal daily load variation is managed with Tertiary control, with fine-tuning adjustments using Primary and Secondary control. Today, inertial response is not a deliberate, designed, or controlled technique for controlling frequency. Rather, it is an inherent property of the system’s traditional sources of energy which has been embedded in the assumptions for operating that system for more than a century. Frequency response via release of energy is one of the behaviors of these traditional sources around which the system has evolved: the delivery of large amounts of current during faults is another. EPIC 2.05 approaches these two aspects as separate Use Cases related to inertia, as detailed in Section 3.1.2.

EPIC Final Report | 2.05 Synthetic Inertia
15
3.1.2 Use Case Overview
Table 3: Definitions of Use Cases for Inertia Functions Explored by EPIC 2.05
Use Case Definition
UC1: Inertial and Primary Frequency Response for Power System Frequency Stability
Decrease the ROCOF of the power system in the event of sudden major loss of (a) generation or (b) load. Improve frequency nadir in a low frequency disturbance. Improve maximum frequency that occurs for a high frequency disturbance.
UC2: Transient Voltage and Angular Stability Support the ability of the electrical power system to regain a state of operating equilibrium after a physical disturbance.
UC3: Short Circuit Current Contribution (SCCC) Provide short circuit current under fault conditions which is sufficient to maintain present system protection schemes in a future scenario where SCCC from rotating machines is diminished.
UC4: Load Following Follow the anticipated load between dispatch intervals in normal operating conditions.
UC5: Frequency Response for Distribution Uphold local distribution frequency if isolated from the transmission system in an islanded condition.
3.2 Project Objectives
The overall goal of the project was to understand the challenges of obtaining synthetic inertia functions from inverter-based renewable generation resources (hereafter referred to as IRGs) and the benefits of those functions to the electric grid. Two parallel work streams were pursued, the first for simulating the impact of SIR on the dynamic performance and stability of the WECC using WECC-wide power systems models and an electromechanical transient simulation program (PSLF18). The second workstream focused on developing the actual SIR controller capability and evaluating its response using more detailed electromagnetic simulation models (simulated in PSCAD19 and RSCAD20) as well as PHIL testing methods at the NREL NWTC. These two work streams combined their efforts in developing and validating an SIR controller to use for demonstrating the potential of SIR. While the detailed breakdown of tasks performed in the project is provided in the next section, the key questions that were addressed in the project were as follows:
What are the key technical challenges of integrating large amounts of IRGs in the electric grid and why is reduced inertia a challenge for grid operation?
18
https://www.geenergyconsulting.com/practice-area/software-products/pslf. 19
https://hvdc.ca/pscad/. 20
https://www.rtds.com/the-simulator/our-software/about-rscad/.

EPIC Final Report | 2.05 Synthetic Inertia
16
What is synthetic inertia, why is it important, and what is the state-of-the art of synthetic inertia functions in various types of IRGs—wind, solar PV, and BESS?
How can we test the performance of an SIR controller, and how can we adapt it for use in system-wide studies using positive sequence simulators such as PSLF?
How should the performance impacts of SIR controllers be quantified on a systemwide basis?
What are the challenges of studying the impact of SIR controllers on large power systems such as the WECC?
The detailed objectives specifically related to each of the five Use Cases are shown in Table 4 below.
Table 4: Project Objectives for Each Inertia Use Case
Use Case Objectives
UC1: Inertial and Primary Frequency Response for Power System Frequency Stability
Assess present capabilities of grid-scale inverter and BESS performance; Develop controller architecture and programming to optimize methods for SIR; create reusable test program for future hardware comparisons.
Develop models to understand such inverter behavior in the Transmission Planning context using PSCAD and GE PSLF tools. Identify scenarios and contributing factors when inverter-based frequency response will be needed.
UC2: Transient Voltage and Angular Stability
Evaluate the dynamic reactive response capability of a BESS inverter to support steady voltages at all buses in the test system after a disturbance.
Evaluate capability of a BESS inverter to help the system remain in synchronism when subjected to a disturbance.
UC3: Short Circuit Current Contribution
Characterize inverter SCCC and its impact on protective devices on transmission and distribution circuits.
Determine the magnitude and duration of positive, negative, and zero-sequence current contribution for a variety of faults. Tests include balanced and unbalanced short circuit (three-phase, phase-to-phase, and phase-to-ground), high-impedance, and open phase faults.
Assess relative fault current contribution effectiveness when the BESS (or other inverter-based resource) located (a) on the transmission system substation and (b) on the low-voltage bus of the distribution system substation under strong and weak grid conditions.
UC4: Load Following Develop control methodology for an inverter-based resource with enhanced load following capabilities for grid-connected or islanded operating conditions.
UC5: Frequency Response for Distribution
Determine if a frequency disturbance impacting the distribution system can be mitigated by a distribution-connected energy storage system without the support of the transmission grid.
3.3 Scope of Work and Project Tasks
The project’s two work streams included the tasks and milestones detailed below.
EPIC Final Report | 2.05 Synthetic Inertia
17
3.3.1 Tasks and Milestones: PHIL Hardware Testing
The PHIL work stream completed a multi-megawatt (MW)-scale hardware demonstration of synthetic inertia functions, leveraging the unique testing capabilities of the NREL Controllable Grid Interface test bed. This facility allowed a broad range of grid conditions to be simulated with real hardware under test, namely a 1 MW x 1 megawatt-hour (MWh) BESS installed by NREL in 2017.
1. Develop Real-Time Digital Simulation (RTDS) models representative of the PG&E system for testing specific grid conditions related to synthetic inertia functions.
2. Develop a reusable PHIL test plan to evaluate capabilities of inverters to perform a set of synthetic inertia functions.
3. Carry out this Use Case testing plan on the existing BESS to measure the capability of such commercially available technology.
4. Develop the requisite power inverter control methods to deliver the APC, SIR, and PFR functions for each test scenario.
5. Produce recommendations for next steps in inverter hardware control development or interconnection requirements to deploy at scale the observed hardware control performance.
6. Query the state of the market of hardware manufacturers via a RFI solicitation regarding synthetic inertia functions and future product roadmaps.
3.3.2 Tasks and Milestones: Modeling and Simulation
The modeling and simulation workstream sought to use a virtual environment to determine how inverters should provide SIR, including the device and system level dynamics across scenarios that will inform device requirements, deployment timing, and strategy.
1. Summarize research and industry works on the state of the art for simulation of inertia loss and system stability scenarios, assessing potential solutions including but not limited to inverter design, testing, demonstration, modeling, and system impact evaluation.
2. Develop and validate a unit model in PSCAD and PSLF for PV, wind, and storage of an inverter-based resource capable of delivering SIR.
3. Develop low-inertia scenario simulations to define and identify the thresholds and conditions where system instability reaches a critical level. Define such thresholds in terms of appropriate metrics and analyze their respective sensitivity.
4. Apply the SIR-capable unit model to the threshold scenarios under specified conditions to explore the potential to solve grid reliability problems.
5. Cross-validate the hardware testing outcomes with the simulation, tuning the model to reality. 6. Develop recommendations on future synthetic inertia equipment performance requirements
and recommendations regarding deployment of the required functionality.
The highlights of the approach and the key assumptions made in this workstream, particularly for the threshold determination, were as follows:
The 2027 Light Spring power flow case (2027_LSP) and the corresponding dynamic file (2027LSP_all_ld_ph1.dyd) were used as the starting point for the analysis. This case represents a low load scenario which provided a blank slate, with minimal solar PV, upon which the project built the proceeding test cases.
EPIC Final Report | 2.05 Synthetic Inertia
18
A list of dynamic contingencies, or specific hypothetical outage events, were selected such that they would have the most impact on the PG&E territory.
Threshold IRG penetration level was defined as the IRG penetration at which no performance criteria (detailed in Section 9.1.1) were violated, and if the IRG penetration was increased by an additional 500 or 1,000 MW the performance criteria was violated.
A baseline threshold penetration level was determined by iteratively modifying the 2027_LSP case to incrementally increase IRGs, simulate the system performance, and repeat until a threshold reference case was produced. Each increase consisted of replacing an existing synchronous generator in PG&E territory (Area 30 in the 2027_LSP case) with an SIR capable IRG that dispatched the same amount of real and reactive power and with the same maximum power capability. If there were multiple synchronous generators at a bus, the real and reactive power dispatches and reactive power limits were summed and these units were replaced with one IRG with the same total real and reactive power dispatch and the same aggregate reactive power limits. As a result of this approach, the power flows in the modified cases remained unchanged compared to the 2027_LSP case.
To simplify the simulation and highlight the impacts of the new SIR functionality, no modifications were made to WECC areas outside of PG&E territory in the 2027_LSP case. This simplification means very little or no solar PV exists outside PG&E territory in the simulation and that any other IRGs were modeled at a fixed level for all test cases. This simplification is justified by the study’s purpose to show the relative impact of SIR on the system: the simulation does not predict a certain level of IRG deployment across the system. Another major reason for adopting this approach was that the dynamic contingencies used in the analysis were primarily focused on PG&E, so an attempt to determine the IRG penetration threshold in CA or the rest of the WECC may have resulted in misleading IRG threshold levels.
Only solar PV and BESS type IRGs were modeled while determining the IRG penetration thresholds. This assumption was based on the expected strong growth of solar PV, the BESS procurement targets for investor-owned utilities, and the plateauing of wind power generation in California.
For determining the IRG penetration thresholds, the 2027LSP_all_ld_ph1.dyd file was modified by including the dynamic models of large solar PV (regc_a and reec_b) and BESS (regc_a and reec_c). For the sensitivity case addressing DG, aggregated was modeled as at a transmission bus with dynamic model PVD1. All DG added for this sensitivity analysis was assumed to be distributed solar PV.
SIR controls were only modeled for newly added IRGs. Among the new IRGs, SIR controls were not modeled for DG (i.e., the aggregated DG modeled using the PVD1 model).
Low/high voltage/frequency ride through was modeled for all the new SIR capable IRGs connected to the transmission system. PSLF’s lhfrt and lhvrt models were used for this purpose, and their parameters were selected based on the Protection and Control (PRC)-024-221 NERC
21
https://www.nerc.com/pa/Stand/Reliability%20Standards/PRC-024-2.pdf.

EPIC Final Report | 2.05 Synthetic Inertia
19
standard. For aggregated, distributed IRGs (added only for sensitivity analysis), the PVD1 generator model used lacks the ride through functions. The majority of DG represented by the model is found within the existing composite load model (titled CMPLDWG) used in PSLF, with limited detail or sophistication for DG ride through settings. The use of these DG models in sum reflect a reference scenario where distributed PV has not yet deployed the more recent Smart Inverter requirements for ride through22.
All the parameters of the dynamic models for newly added large solar PV, BESS, and aggregated DG were identical to an existing large solar PV, BESS, and aggregated DG plant, respectively. An exception was for the Megavolt Ampere (MVA) base parameter. This parameter was set to be equal to the aggregated base MVA of all the synchronous generator units at a bus being replaced. The parameters for new large solar PV plants were modeled to match those of a sample plant, the 92.1 MVA “DESERT SUNLIGHT SOLAR PV PLANT MODEL” plant. Similarly, parameters of the new BESS plants were modeled identical to those of the “PG&E Cluster 7 Project Q1032 Tranquillity 8” plant, and the parameters of the aggregated DG plants were identical to those of the PVD1 model at the ELKGROV1" 69.00 "kilovolt (kV) bus. These parameters are listed in the Appendix in Section 9.1.1.
Frequency measurement was performed at all the load buses with nominal voltage of 60 kV or above. PSLF model fmetr was used to measure the load bus frequency and a first order filter time constant of 50 milliseconds was used in the model to attenuate spurious rapid frequency changes, which are typically an artifact of phase jumps during the dynamic simulation.
WECC planning criteria (TPL-001-WECC-CRT-3) were used to determine the IRG penetration thresholds. These criteria are defined in section 9.1.1. The IRG threshold was considered to be reached if the system became unstable, or the simulation diverged and the divergence was unlikely to be due to numerical instability of the PSLF software. A simulation showing a large number of (e.g. 10) synchronous generator rotor angles exceeding 180 degrees, or a large number of TPL-001-WECC-CRT-3 voltage criteria violations, was considered to be exhibiting instability.
Sensitivities were performed on aspects of the threshold simulation including inverter momentary cessation, Tstall, and distribution vs transmission PV resource models. A set of sensitivity checks were done on the improved scenarios, including the location of SIR, the type of resource providing this function, and the headroom or available active power capacity of each generator. Details of the sensitivities are given in section 4.2.1.2.
22
See PG&E’s Electric Rule 21, Section Hh.2, Sheet 185 for these ride through settings. (https://www.pge.com/tariffs/tm2/pdf/ELEC_RULES_21.pdf). These settings were not used in the transmission system simulations of this project due to the focus on transmission connected resources and the relative impacts of SIR. Future work should update the view of what inverters settings are expected to be in use for DG along with a forecast of resource types in place system wide. Neither or these aspects were addressed by this project.
EPIC Final Report | 2.05 Synthetic Inertia
20
4 Project Activities, Results, and Findings
4.1 Technical Results and Findings – Literature Review
This section summarizes the findings of a literature review performed to understand the work done in this area and to guide the two project workstreams. This effort reviewed the key impacts of high penetration levels of inverter-based renewable generation on the power systems. The range of topics included the following:
Inertial and primary frequency response, for conventional and inverter-based generation
Short-circuit current contribution and power system protection
Frequency regulation and load following
Frequency response for distribution system or microgrid applications
4.1.1 Inertial and Primary Frequency Response From Conventional Generation
The literature shows that a reduction in inertia due to the replacement of synchronous generators with IRG can adversely impact the frequency response of a power system. The ROCOF can increase and the frequency nadir can lower. While SIR can help reduce the ROCOF, PFR from IRG similar to the droop-based PFR obtained from governors of conventional power plants can help increase the frequency nadir. The discussion that follows takes a deep dive into the impact of reduction in inertia due to the increasing penetration of IRG, the state-of-the art of obtaining SIR and PFR from IRG, and the resulting impact on the power system.
Newton’s first law of motion, which is often called the “law of inertia,” explains inertia as the property of a body to resist change in its state of motion. In almost all the large power systems across the world, rotating synchronous generators supply most of the electricity demand. These generators have a rotating mass that rotates at constant speed at steady-state due to which their kinetic energies are directly proportional to their moment of inertia23. Moreover, the electrical load is directly connected to the synchronous generators via the electrical grid. All the synchronous generators are also connected to one another via the electrical grid. Therefore, any disturbance that upsets the electricity generation and demand balance (e.g., tripping of a generator) is instantaneously countered by the kinetic energy of the online generators, which is converted into electrical energy (or vice-versa) to resist the change in angular motion of the generators. The greater the inertia of the system, the lower the change in angular speed needed to generate the electrical energy to counter the disturbance. Since the aggregate of generators’ angular speeds determine the frequency of the grid, a grid with higher inertia can reduce the rate at which the system frequency changes after a disturbance. A few seconds into the disturbance, primary frequency response or governor response engages and starts providing additional energy to arrest the change in frequency and bring the frequency close to the nominal frequency.
Another important factor determining the dynamic behavior of existing power systems is the synchronizing torque produced by synchronous generators. The synchronizing torque along with inertia has a crucial role
23
Moment of inertia is the property of a rotating body to resist angular acceleration.

EPIC Final Report | 2.05 Synthetic Inertia
21
in determining the initial rotor speed behavior of conventional generators following a contingency event in the grid. The active power injected by synchronous machines maintains synchronism and damps mechanical oscillations through the synchronizing and damping torque components of the total electric torque. The abundance of inertia and synchronous torque from synchronous machines along with their controls allows for the mitigation of the large active and reactive power imbalances in the grid. This fundamentally important characteristic of power systems could change dramatically with growing penetrations of inverter-based generation.
4.1.2 Frequency Response From Inverter-Based Renewable Generation
The literature review also explored the state of thinking around the frequency response capabilities of inverter-based renewable generation. IRG technologies utilize a fundamentally different set of technologies for energy conversion and interfacing to the grid than conventional generators. Variable-speed wind turbines and solar PV plants interface with the electric grid through power electronics converters. Power electronics converters are required to interface solar PV plants with the grid because the solar panels generate direct current, which must be converted into nominal frequency alternating current. Although wind turbines can interface directly with the grid (e.g., Type I and II wind turbines24), power electronics converters are required to extract maximum energy from wind turbines as the maximum power point occurs at a specific tip-speed ratio for the given wind speed. Such power electronics converter-interfaced wind turbines are called variable speed wind turbines (Type III and IV). Since wind and solar are the leading economical sources of renewable power, variable-speed wind turbines and solar PV are operated at their maximum power points. When a grid disturbance occurs, the controllers in these plants try to maintain the power outputs at the pre-disturbance power levels instead of increasing their power output like conventional synchronous generators to counteract the disturbance and support the grid frequency. As a result, variable speed wind turbines and solar PV that are controlled to generate the desired power output do not contribute to system inertia because they do not contribute to resisting the change in system frequency. Therefore, as wind and solar PV plants displace conventional synchronous generators in the grid, there is a concern that system inertia may reduce to an extent that the system frequency will violate under/over-frequency limits of UFLS relays under severe disturbances, resulting in load shedding. Similarly, the ROCOF may also exceed the limits imposed in some jurisdictions25. Since the power electronics converters of wind and solar PV power plants may be controlled to generate the desired active and reactive power response within the capability of the PV and wind resources, it may be possible for wind and solar PV power plants to support grid frequency in inertial and PFR timeframes if the PV and wind power plants have spare head room capacity and not operating at maximum power output already. In addition to these plants, other sources of energy that interface with the grid through power electronics converters such as BESS, flywheels, and supercapacitors can also be made to inject active power during disturbances and support grid frequency.
4.1.3 Short-Circuit Contribution and Power System protection
The literature review highlighted that the additional challenges of protection systems and protection coordination arise due to the removal of a significant number of synchronous generators from the grid.
24
M. Singh and S. Santoso, “Dynamic Models for Wind Turbines and Wind Power Plants,” University of Texas, Austin, Oct. 2011.
25 EIRGRID & SONI, “RoCoF Alternative & Complementary Solutions Project: Phase 2 Study Report,” Mar. 2016.

EPIC Final Report | 2.05 Synthetic Inertia
22
Synchronous generators produce approximately six times rated current during a fault as shown in Figure 4 example.
Figure 4. Fault Current Comparison
This large current is used to trip protective devices in the most common form of distribution system protection, overcurrent protection. Protective devices must be sensitive enough to trip for any overcurrent fault condition within their protective zone and selective enough to allow downstream protective devices to operate first, thus minimizing an outage to as few customers as possible. Overcurrent protection has been the most common form of distribution system protection driven in part by the large amount of fault current provided by machine-based generation. With islanding microgrids that include inverter-based generation, large fault currents may not always be available due to machine-based generation either not being present or in operation. Inverters are current-limited devices that contain power electronic switches that are sensitive to large currents. As a result, inverters self-protect to prevent overcurrents from damaging their components and are unable to provide a large amount of fault current in excess of their nameplate rating. Load current and fault current may be closely matched making sensitivity and selectivity with overcurrent protection challenging or even impossible. Selectivity is further complicated by a) the large change in fault current levels that may occur between grid-connected and islanded conditions, b) different generator dispatch conditions within the microgrid and c) some inverters do not produce zero sequence current and many do not produce negative sequence current. All of this results in protection relay challenges.
4.1.3.1 Protection Schemes for Systems With Inverter-Based Generators
This section provides an overview from the literature of protection options available in inverter-based microgrids including the previously discussed overcurrent-based protection, as well as voltage-, differential-, impedance-, adaptive-, transient-, and external device-based protection.
4.1.3.1.1 Overcurrent-Based Protection
Overcurrent-based protection schemes in inverter-based microgrids may be enhanced with symmetrical component calculations, directionality, voltage, and communication; however, due to the challenges described in the previous section, it is not recommended as the sole form of protection when islanded. Overcurrent protection can still be used as a primary method when grid-connected since the grid is the dominant source of fault current, while other methods are used as a secondary technique for island conditions.

EPIC Final Report | 2.05 Synthetic Inertia
23
4.1.3.1.2 Voltage-Based Protection
Voltage-based protection schemes use the voltage dip that follows a fault to isolate the fault condition. Anecdotally, when selectivity is not a design criterion, voltage-based protection can be a common technique in inverter-based microgrids. When selectivity is required, voltage-based protection has its weaknesses. (1) A microgrid with short lines will have a similar voltage dip at all nodes following a fault; (2) It is difficult to differentiate the voltage dip of a fault vs. the voltage dip of a motor starting or a capacitor switching offline. (3) High impedance faults will not have a large voltage dip making them difficult to detect. Some of these weaknesses can be reduced by augmenting the protection scheme with communication, but this comes with an increase in complexity and cost.
4.1.3.1.3 Differential-Based Protection
Differential-based protection schemes are similar to transmission-level differential schemes. The current in and out of each protection zone is monitored with multiple devices that communicate synchronized measurements. This is arguably the most robust and exhaustive protection technique; however, it relies heavily on extensive relays and communication channels. It is more appropriate for point to point transmission within a microgrid and its application when multiple loads exist within a single protection zone may be prohibitively complex. G. Buigues et al.26 notes the following weaknesses. (1) If communication infrastructure fails, the microgrid is left unprotected. (2) Problems occur with transients from connecting and disconnecting sources. (3) Unbalanced loads could trigger a nuisance trip. (4) Differential-based protection is high in cost. Additionally, differential protection requires monitoring of all branches within the differential zone for proper operation. Presently the typical maximum amount of monitored terminals for a line differential relay is three to four, significantly less than what may be required in some microgrids.
4.1.3.1.4 Impedance-Based Protection
Faults are typically seen by relays as a low impedance and impedance-based or distance protection measures this impedance and trips when it falls below a certain threshold. Impedance-based protection offers one of the most cost-effective forms of inverter-based microgrid protection when selectivity is a design criterion. G. Buigues et al.14 notes that there is a limited fault resistance that can be reliably detected and trip times can increase due to downstream sources increasing the measured impedance. Despite these concerns, Sandia National Labs (SNL)27 demonstrates an impedance-based protection scheme in simulation. Their scheme uses communication for block and permissive signals; however, they do note that communication is only needed when selectivity cannot be achieved on impedance alone. Other sources28,29 have also demonstrated through simulation that the fault infeed weakness can be accounted for in the settings of both inverter-based and machine-based microgrids. Using impedance-base protection may still be a challenge due to the number of taps, infeed affects, and coordination challenges. Impedance-based protection are also susceptible to non-operation for high-impedance faults.
26
G. Buigues, A. Dysko, V. Valverde, I. Zamora, and E. Fernandez, “Microgrid Protection: Technical challenges and existing techniques,” University of the Basque Country and University of Srathclyde, March 2013.
27 M. Elkhatib, A. Ellis, M. Biswal, S. Brahma, and S. Renade, “Protection of Renewable-dominated Microgrids:
Challenges and Potential Solutions,” Sandia National Laboratory, November 2016. 28
H. Lin, C. Liu, J. Guerro, and J. Vásguez, “Distance Protection for Microgrids in Distribution System,” Aalbord University and Energinet, November 2016.
29 V. Nikolaidis, A. Tsimtsios, and A. Safigianni, “Investigating Particularities of Infeed and Fault Resistance Effect on
Distance Relays Protecting Radial Distribution Feeders with DG,” Democritus University of Thrace, February 2018.

EPIC Final Report | 2.05 Synthetic Inertia
24
4.1.3.1.5 Adaptive Protection
Adaptive protection techniques monitor the system configuration, often with a central processing unit, and change protection settings based on active configuration. Adaptive protection is more of a setting changing technique rather than a protection method by itself. It still requires a basic protection technique to be determined in the various system configurations. It also relies heavily on a communication infrastructure.
4.1.3.1.6 Transient-Based Protection
Transient-based protection schemes use wavelet transforms on traveling waves to detect faults. The reliability of using such a protection scheme in microgrids is unclear. For example, how is the transient event trigger determined. Additionally, protection may be specific to a particular microgrid configuration. SNL15 notes that single-phase faults do not give rise to a transient signature and transient-based protection schemes are sensitive to capacitor switching. Transient-based schemes are also degraded with the presence of taps and may not be a viable alternative to overcurrent protection.
4.1.3.1.7 External Device-Based Protection
External device-based protection schemes modify the fault current levels with an external device. Machine-based microgrids may use a fault current limiter, while inverter-based microgrids may use a flywheel or battery. For inverter-based microgrids, adding a fault- current-increasing device involves a significant investment and may degrade the island detection capabilities of the inverters.
4.1.4 Load Following
The next aspect of the review of the literature was to explore the use of inverter-base resources for load following and frequency regulation. Frequency regulation and load following are grid services that address the temporal variations in load. Load following responds to slower changes (on the order of five to thirty minutes, normally decided by economic dispatch) and regulation responds to rapid load fluctuations (on the order of seconds to one minute, normally determined by area control error, i.e. ACE)30. To provide either service, control that can regulate renewable energy output to a real-time set point is needed. Therefore, both services can be referred to as APC. Historically, renewable energy resources such as wind and PV have not been required to provide APC. However, increasing renewable penetration levels are leading system operators to impose new requirements for frequency regulation capability31. The report by Eyer and Corey assessed the benefits and potential of using energy storage systems to provide ancillary services. In particular, load following and regulation capabilities were assessed. From a technical consideration, storage is well suited for APC for several reasons. First, most types of storage can operate at partial output levels with relatively modest performance penalties. Second, most types of storage can respond very quickly. However, from an economic stand point, the charging/discharging
30
J. Eyer and G. Corey, “Energy Storage for the Electricity Grid : Benefits and Market Potential Assessment Guide, A Study for the DOE Energy Storage Systems Program,” 2010.
31 J. Aho, L. Y. Pao, P. Fleming, and E. Ela, “Controlling Wind Turbines for Secondary Frequency Regulation : An
Analysis of AGC Capabilities Under New Performance Based Compensation Policy,” in 13th Wind Integration Workshop on Large-scale Integration of Wind Power Systems as Well as on Transmission Networks for Offshore Wind Power Plants, 2014.

EPIC Final Report | 2.05 Synthetic Inertia
25
efficiency can limit some application scenarios when the charging cost is high. Also, the report points out that if storage is used to provide regulation, it cannot be used simultaneously for load following, or other applications.
4.1.5 Frequency Response for Distribution System
Last for the literature review was to understand the primary issues facing applications of inverters for frequency response in distribution scenarios, especially the most extreme case of an isolated or islanded piece of the radial distribution system. When operating in isolated/islanded mode, the frequency of the distribution system may experience large excursions due to the low system inertia and volatility of renewable energy if the system/controls are not designed appropriately. Hence frequency response from inverter-based resources is desired. Laaksonen et al.32 propose a voltage and frequency control for inverter-based weak low voltage (LV) network microgrid. The control was based on P-V (real power and voltage) droop and Q-f (reactive power and frequency) droop, which was unique in weak LV networks where R>>X. The proposed control was simulated on a relatively small system with a BESS and a PV. Farrokhabadi et al.33, in view of the limitations of droop control due to rapid changes in the output power of the DGs, propose an additional voltage-based frequency controller where the voltage-frequency dependency of the system was exploited. Wind power inertial and primary frequency responses in isolated power systems were assessed by Wang et al.34. Simulation results on a real isolated power system, the Guadeloupe power system, demonstrated that combining both inertial and primary frequency response control could achieve better frequency response. A centralized control strategy for voltage and frequency control was proposed by Zhao et al.35, which was applicable to interconnected multiple microgrids with on-site BESS. The system dynamic performance was effectively improved with the proposed control. However, high-bandwidth communication was required to implement this control strategy. Shim et al.36 integrated a fast-acting BESS into the AGC function in an island power system with high renewable generation. Under the coordination of the proposed strategy, the BESS was responsible to respond against fluctuations in the high-frequency band, and conventional generation took charge of lower-frequency band fluctuations.
32
H. Laaksonen, P. Saari, and R. Komulainen, “Voltage and Frequency Control of inverter based Weak LV Network Microgrid,” in International Conference on Future Power Systems, 2005, pp. 1-6.
33 M. Farrokhabadi, C. Canizares, and K. Bhattacharya, “Frequency Control in Isolated / Islanded Microgrids through
Voltage Regulation,” IEEE Trans. Smart Grid, vol. 8, no. May, pp. 1185-1194, 2017. 34
Y. Wang, G. Delille, H. Bayem, X. Guillaud, and B. Francois, “High wind power penetration in isolated power systems-assessment of wind inertial and primary frequency responses,” IEEE Trans. Power Syst., vol. 28, no. 3, pp. 2412–2420, 2013.
35 H. Zhao, M. Hong, W. Lin, and K. A. Loparo, “Voltage and Frequency Regulation of Microgrid With Battery Energy
Storage Systems,” IEEE Trans. Smart Grid, pp. 1-12, 2017. 36
J. W. Shim, G. Verbic, N. Zhang, and K. Hur, “Harmonious Integration of Faster-Acting Energy Storage Systems into Frequency Control Reserves in Power Grid with High Renewable Generation,” IEEE Trans. Power Syst., pp. 1-13, 2018.
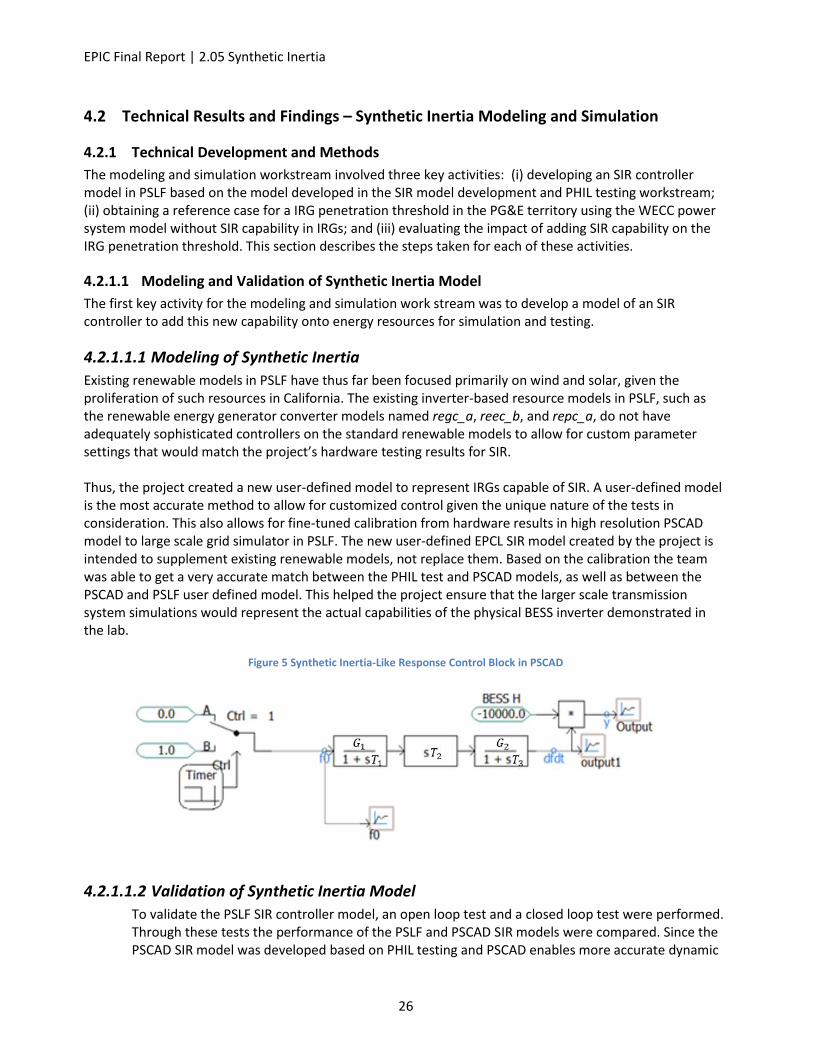
EPIC Final Report | 2.05 Synthetic Inertia
26
4.2 Technical Results and Findings – Synthetic Inertia Modeling and Simulation
4.2.1 Technical Development and Methods
The modeling and simulation workstream involved three key activities: (i) developing an SIR controller model in PSLF based on the model developed in the SIR model development and PHIL testing workstream; (ii) obtaining a reference case for a IRG penetration threshold in the PG&E territory using the WECC power system model without SIR capability in IRGs; and (iii) evaluating the impact of adding SIR capability on the IRG penetration threshold. This section describes the steps taken for each of these activities.
4.2.1.1 Modeling and Validation of Synthetic Inertia Model
The first key activity for the modeling and simulation work stream was to develop a model of an SIR controller to add this new capability onto energy resources for simulation and testing.
4.2.1.1.1 Modeling of Synthetic Inertia
Existing renewable models in PSLF have thus far been focused primarily on wind and solar, given the proliferation of such resources in California. The existing inverter-based resource models in PSLF, such as the renewable energy generator converter models named regc_a, reec_b, and repc_a, do not have adequately sophisticated controllers on the standard renewable models to allow for custom parameter settings that would match the project’s hardware testing results for SIR. Thus, the project created a new user-defined model to represent IRGs capable of SIR. A user-defined model is the most accurate method to allow for customized control given the unique nature of the tests in consideration. This also allows for fine-tuned calibration from hardware results in high resolution PSCAD model to large scale grid simulator in PSLF. The new user-defined EPCL SIR model created by the project is intended to supplement existing renewable models, not replace them. Based on the calibration the team was able to get a very accurate match between the PHIL test and PSCAD models, as well as between the PSCAD and PSLF user defined model. This helped the project ensure that the larger scale transmission system simulations would represent the actual capabilities of the physical BESS inverter demonstrated in the lab.
Figure 5 Synthetic Inertia-Like Response Control Block in PSCAD
4.2.1.1.2 Validation of Synthetic Inertia Model
To validate the PSLF SIR controller model, an open loop test and a closed loop test were performed. Through these tests the performance of the PSLF and PSCAD SIR models were compared. Since the PSCAD SIR model was developed based on PHIL testing and PSCAD enables more accurate dynamic
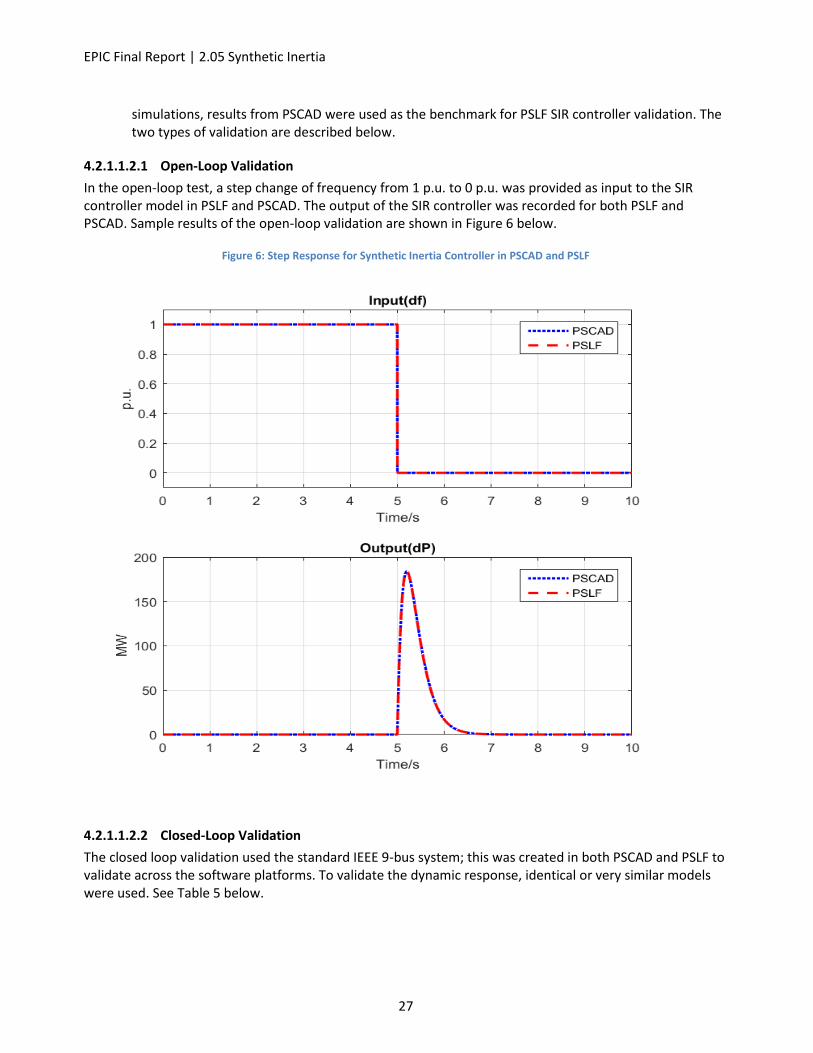
EPIC Final Report | 2.05 Synthetic Inertia
27
simulations, results from PSCAD were used as the benchmark for PSLF SIR controller validation. The two types of validation are described below.
4.2.1.1.2.1 Open-Loop Validation
In the open-loop test, a step change of frequency from 1 p.u. to 0 p.u. was provided as input to the SIR controller model in PSLF and PSCAD. The output of the SIR controller was recorded for both PSLF and PSCAD. Sample results of the open-loop validation are shown in Figure 6 below.
Figure 6: Step Response for Synthetic Inertia Controller in PSCAD and PSLF
4.2.1.1.2.2 Closed-Loop Validation
The closed loop validation used the standard IEEE 9-bus system; this was created in both PSCAD and PSLF to validate across the software platforms. To validate the dynamic response, identical or very similar models were used. See Table 5 below.

EPIC Final Report | 2.05 Synthetic Inertia
28
Table 5: Dynamic Models for the IEEE 9-Bus System in PSCAD and PSLF
Plant Type Equipment PSCAD PSLF
Hydro-power plant at bus 2
Generator Sync1 (Close to Genrou) Genrou
Exciter AC1A Exac1
Turbine/Governor Hydro Tur1 and Hydro Gov 1 Hygov4
Steam power plant at bus 1 and 3
Generator Sync1 (Close to Genrou) Genrou
Exciter AC1A Exac1
Turbine/Governor Steam Tur1/ Steam Gov4 Ieeeg1
A step change in load was applied (30 MW) to the base systems without SIR to validate the responses of the two systems. The plots below illustrate a close match of the responses.
Figure 7: Frequency and Active Power Response and Output of a Generator in Respective RSCAD and PSLF Models for the Same Disturbance
A second test with SIR modeled was also tested. The plots below again show that the PSLF model closely matches the PSCAD model.
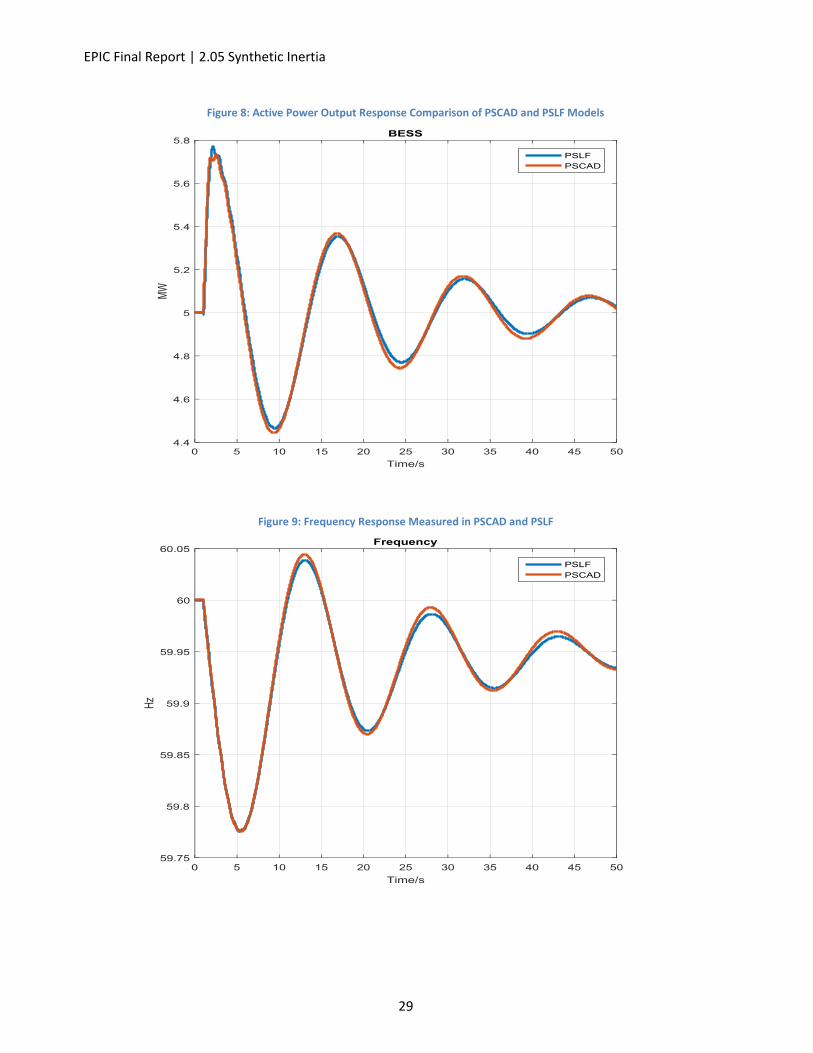
EPIC Final Report | 2.05 Synthetic Inertia
29
Figure 8: Active Power Output Response Comparison of PSCAD and PSLF Models
Figure 9: Frequency Response Measured in PSCAD and PSLF

EPIC Final Report | 2.05 Synthetic Inertia
30
4.2.1.1.2.3 Interaction With PHIL Work Stream
A further test was performed to validate the modeling responses between the RTDS, PSCAD, and PSLF. This was done by setting up the hardware configuration to mimic the IEEE 9-bus system so that the scenario would be the same. As shown by the figure below the responses are all very close.
Figure 10: Model Comparison in Frequency and Active Power Response in RTDS, PSCAD, and PSLF
4.2.1.1.3 Summary and Key Findings
Modeling scenarios and hardware tests were configured to provide a consistent test using a standard IEEE 9-bus system model that would enable validation of the more complete PSLF system models. The results show close alignment between the RTDS, the highly accurate PSCAD model, and the PSLF model to be used in the system scenarios with a full WI system model.
4.2.1.2 Simulation Scenarios Development
4.2.1.2.1 Overview of the Scenario Development Process
The team began with a previously used Base Case from the 2017 CAISO TPP, the 2027 Light Spring case. Modifications were then made by the team to increase the renewable generation to higher levels, up to nearly 100% inverter-based resources serving the instantaneous load in the PG&E area only.
4.2.1.2.2 Description of the Base Case
The Transmission Power Flow Base Case was derived from a WECC published 2027 Light Spring case, that was then later modified for use in the 2017-2018 CAISO TPP. A lightly loaded spring weekend day around noon with very high solar output was modeled. Some case details are provided in Table 6 and Table 7 below.

EPIC Final Report | 2.05 Synthetic Inertia
31
Table 6: Load and Generation in the PSLF Base Case
Area Name
Area Number
Gen (MW)
Load (MW)
IMPERIALCA 21 1061.11 352.22
LADWP 26 1223.95 2568.05
SANDIEGO 22 2046.89 2654
SOCALIF 24 15173.02 11293.87
PG&E 30 16499.71 19651.42
ARIZONA 14 14035.35 9643.3
EL PASO 11 788.73 1173.48
NEVADA 18 1599.01 2152.06
NEW MEXICO 10 2217.78 1969.8
PSCOLORADO 70 3853.32 4198.61
IDAHO 60 1152.32 1629.15
MONTANA 62 3273.89 1177.31
PACE 65 9522.5 7543.2
SIERRA 64 1409.11 1501.86
NORTHWEST 40 11224.96 17934.76
ALBERTA 54 8598.21 7962.6
B.C. HYDRO 50 5142.85 6293.32
MEXICO-CFE 20 1324.04 1309.2
FORTISBC 52 923.39 468.99
WAPA R.M. 73 4173.21 3074.94
WAPA U.M. 63 80.39 -91.4
Total 105323.8 104461.1
Table 7: Breakdown of Generation in the PSLF Base Case
PG&E (MW)
California (MW)
WECC (MW)
% of Positive Generation in PG&E
% of Positive Generation in CA
% of Positive Generation in WECC
Total Positive Generation
16499.71 36004.69 105323.80 100.0% 45.8% 15.7%
Synchronous Generation
6155.43 24468.27 88137.51 37.3% 17.1% 5.8%
Pumped Storage Hydro
-1724.02 -2692.72 -3273.6 -10.4% -4.8% -1.6%
Wind 1458.81 2650.94 6281.97 8.8% 4.1% 1.4%
Solar IRG 8739.09 8739.09 10472.19 53.0% 24.3% 8.3%
BESS IRG 215 247.63 247.63 1.3% 0.6% 0.2%

EPIC Final Report | 2.05 Synthetic Inertia
32
4.2.1.2.3 Development of the Zero Inertia in PG&E Case
The approach for developing an extreme low inertia case was to replace existing generation models greater than 20 MW with an IRG model. This was done only for generators in the PG&E Area, and at the same modeled locations and with the same amount of MW production. This was intended to minimize other changes in the system that may arise from locational changes in resources. New resources replaced in this way were represented as solar PV or BESS. For BESS, the same fixed quantity of 771 MW capacity was added in each case. These BESS were modeled as a replacement of existing resources in the same way as the added IRG. The remainder of IRG added to the base case was modeled as solar PV. To summarize the low inertia case, a total of 88% instantaneous IRG was the resultant maximum amount modeled in the PG&E system. This was the highest amount possible in the model based on the prior approach of replacing only generators greater than 20 MW, which leaves some synchronous machine generators in the simulation. This case served as an upper bounded condition for exploring low inertia issues.
4.2.1.3 Calculation of the Stability Threshold
Renewable generation was increased within the PG&E area in approximately 1,000 MW increments and contingencies were run to assess the system stability. Once instability or frequency violations were observed under any contingency conditions this served as an upper threshold. Frequency violations (59.6 Hz) were observed in the scenario where 5,000 MW of instantaneous IRG was added to the existing PG&E system. The table below details the various levels of IRG tested with relative generation amounts in PG&E, California, and the WI (WECC)
Table 8: Amount and Percentage of Generation Simulated as IRG in PG&E, CA, and WECC Geographies for Threshold Analysis Cases
Case:
MW of
IRG
Added
to Base
PG&E CA WECC
Wind PV Battery Wind PV Battery Wind PV Battery
MW % MW % MW % MW % MW % MW % MW % MW % MW %
Base 1459 9 3617 22 0 0 2651 7 3617 10 0 0 6282 6 5350 5 0 0
4000
MW
1459 9 6868 42 771 5 2651 7 6868 19 771 2 6282 6 8601 8 771 1
5000
MW
1459 9 8033 49 771 5 2651 7 8033 22 771 2 6282 6 9767 9 771 1
6000
MW
1459 9 8875 54 771 5 2651 7 8875 25 771 2 6282 6 10608 10 771 1
7000
MW
1459 9 9847 60 771 5 2651 7 9847 27 771 2 6282 6 11580 11 771 1
8000
MW
1459 9 10866 66 771 5 2651 7 10866 30 771 2 6282 6 12599 12 771 1
9000
MW
1459 9 11864 72 771 5 2651 7 11864 33 771 2 6282 6 13597 13 771 1
ZI case 1459 9 13753 83 771 5 2651 7 13753 38 771 2 6282 6 15486 15 771 1

EPIC Final Report | 2.05 Synthetic Inertia
33
4.2.1.3.1 Stability Threshold Sensitivity Study
4.2.1.3.1.1 Tstall
The parameter Tstall, which represents the time before a single-phase AC unit will stall out, was altered to test for impacts to study results. the initial case had Tstall disabled (or a timing of 999 seconds), the sensitivity case had Tstall of 0.032 seconds (2 cycles) with a stall voltage of 0.42 pu voltage. This sensitivity analysis showed that with Tstall enabled as described above the frequency criteria was violated at the level of about 5,000 MW of additional IRG. System instability was observed at about 7,000 MW of additional IRG.
4.2.1.3.1.2 Momentary Cessation
The models were altered to test the impacts from momentary cessation; a scenario with momentary cessation enabled in all IRG units, and a scenario with it disabled in all IRG units. The modeling approach was based on NERC’s blue cut fire disturbance report i.e., using the Low Voltage Active Power Logic block of the regc_a model to simulate the momentary cessation of the real power.
The result of this sensitivity was that, without momentary cessation, about 6,000 MW of new IRG were added before frequency criteria was violated. With momentary cessation enabled only about 4,000 MW of new IRG was added before a frequency violation was observed. The system exhibited unstable behavior (such as simulation divergence or growing oscillations) with momentary cessation disabled with 11,000 MW of new IRG, contrasted with only 7,000 MW of new IRG was added when momentary cessation was enabled.
4.2.1.3.1.3 Varying Proportions of Transmission-Sited and Distribution-Sited Renewables
This analysis tested the sensitivity of results to a change from representing the new IRGs with transmission characteristics (regc_a model) to representing new IRGs with default distribution characteristics (PVD1 model). The relevant characteristics were primarily their voltage and frequency ride-through capability. See Table 9 for characteristics of distributed resources added to the model. The sensitivity was run by using the PVD1 model instead of regc_a for all new IRG for the same threshold determination process described in Section 4.2.1.3.
Table 9: Existing PVD1 (DG Generator Model) Voltage and Frequency Ride-Through Parameters
Frequency Ride-Through Parameter Value
Voltage Ride-Through Parameter Value
ft0 59.5 vt0 0.88
ft1 59.7 vt1 0.90
ft2 60.3 vt2 1.10
ft3 60.5 vt3 1.20
frflag 0.0 vrflag 1.0
This sensitivity’s results showed that the default distribution models with insufficient ride through characteristics have a significant and detrimental impact on system frequency response. More specifically, this simulation showed that using transmission connected models with their respective ride through characteristics yielded an additional 5,000 MW of IRG before frequency violations were observed but only
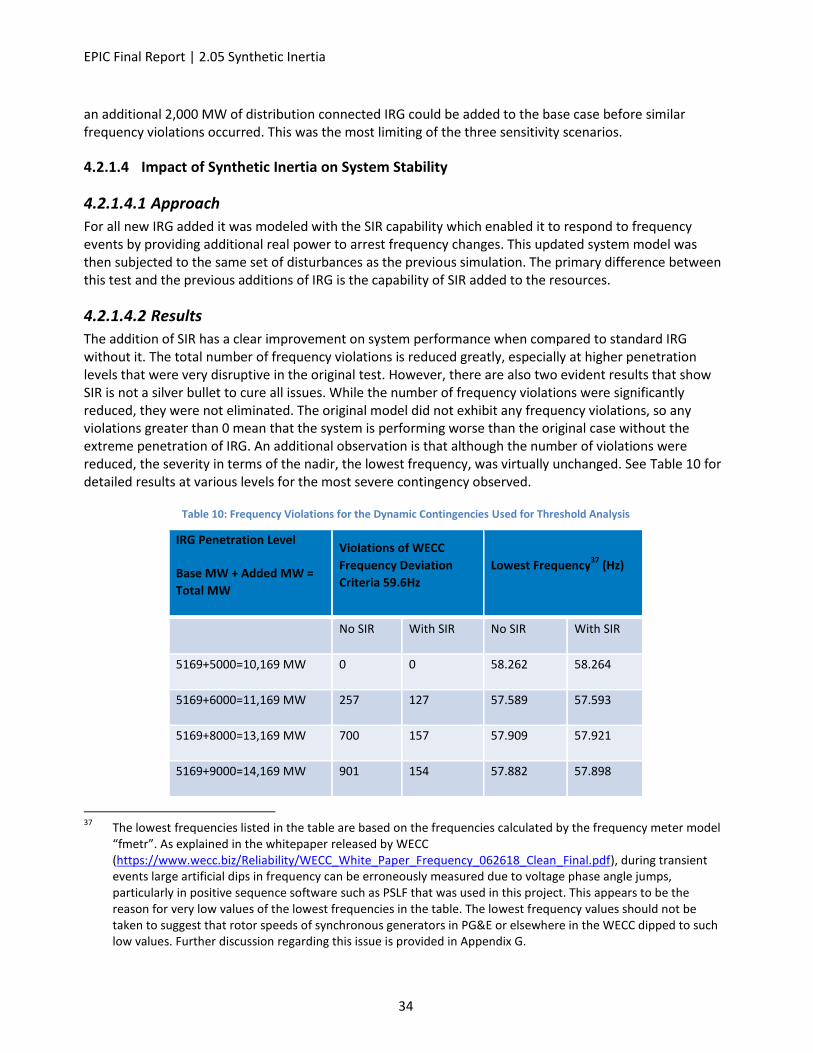
EPIC Final Report | 2.05 Synthetic Inertia
34
an additional 2,000 MW of distribution connected IRG could be added to the base case before similar frequency violations occurred. This was the most limiting of the three sensitivity scenarios.
4.2.1.4 Impact of Synthetic Inertia on System Stability
4.2.1.4.1 Approach
For all new IRG added it was modeled with the SIR capability which enabled it to respond to frequency events by providing additional real power to arrest frequency changes. This updated system model was then subjected to the same set of disturbances as the previous simulation. The primary difference between this test and the previous additions of IRG is the capability of SIR added to the resources.
4.2.1.4.2 Results
The addition of SIR has a clear improvement on system performance when compared to standard IRG without it. The total number of frequency violations is reduced greatly, especially at higher penetration levels that were very disruptive in the original test. However, there are also two evident results that show SIR is not a silver bullet to cure all issues. While the number of frequency violations were significantly reduced, they were not eliminated. The original model did not exhibit any frequency violations, so any violations greater than 0 mean that the system is performing worse than the original case without the extreme penetration of IRG. An additional observation is that although the number of violations were reduced, the severity in terms of the nadir, the lowest frequency, was virtually unchanged. See Table 10 for detailed results at various levels for the most severe contingency observed.
Table 10: Frequency Violations for the Dynamic Contingencies Used for Threshold Analysis
IRG Penetration Level
Base MW + Added MW =
Total MW
Violations of WECC
Frequency Deviation
Criteria 59.6Hz
Lowest Frequency37
(Hz)
No SIR With SIR No SIR With SIR
5169+5000=10,169 MW 0 0 58.262 58.264
5169+6000=11,169 MW 257 127 57.589 57.593
5169+8000=13,169 MW 700 157 57.909 57.921
5169+9000=14,169 MW 901 154 57.882 57.898
37
The lowest frequencies listed in the table are based on the frequencies calculated by the frequency meter model “fmetr”. As explained in the whitepaper released by WECC (https://www.wecc.biz/Reliability/WECC_White_Paper_Frequency_062618_Clean_Final.pdf), during transient events large artificial dips in frequency can be erroneously measured due to voltage phase angle jumps, particularly in positive sequence software such as PSLF that was used in this project. This appears to be the reason for very low values of the lowest frequencies in the table. The lowest frequency values should not be taken to suggest that rotor speeds of synchronous generators in PG&E or elsewhere in the WECC dipped to such low values. Further discussion regarding this issue is provided in Appendix G.
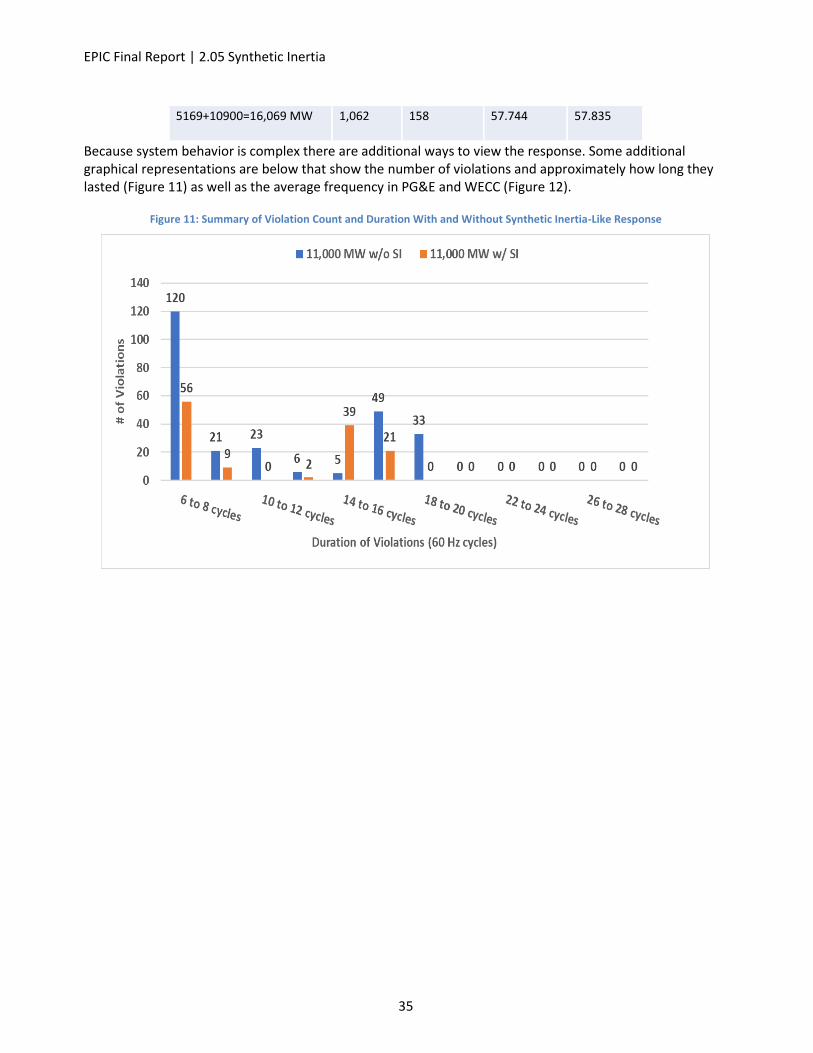
EPIC Final Report | 2.05 Synthetic Inertia
35
5169+10900=16,069 MW 1,062 158 57.744 57.835
Because system behavior is complex there are additional ways to view the response. Some additional graphical representations are below that show the number of violations and approximately how long they lasted (Figure 11) as well as the average frequency in PG&E and WECC (Figure 12).
Figure 11: Summary of Violation Count and Duration With and Without Synthetic Inertia-Like Response

EPIC Final Report | 2.05 Synthetic Inertia
36
Figure 12: Frequency Comparison of PG&E and WECC With and Without Synthetic Inertia-Like Response
4.2.1.4.3 Sensitivity Study
4.2.1.4.3.1 Location Sensitivity
This sensitivity investigates the impacts of location and system response for the new IRG with SIR enabled for the threshold case of 6,000 MW of additional IRG. The difference is in the locational choice is based on voltage response for each particular contingency. For example, higher or lower voltage of a location during the fault when compared to the previous default scenario. Results of this sensitivity showed that, due to the current sourced nature of the IRG, a large fault was more impactful to the frequency response than a single large loss of generation as the fault reduced the effective active power output of the IRG due to voltage depression. For this reason, the location of the responding IRG was greatly impacted by location and electrical distance from the fault. When the IRG was implemented at locations that maintained closer to nominal voltage during the disturbance the system response was greatly improved, and the frequency violations were less severe when compared to the default case, which was very similar to the low voltage sensitivity. Figure 13 below illustrates the frequency response of the different scenarios.

EPIC Final Report | 2.05 Synthetic Inertia
37
Figure 13: Frequency Comparison of the Locational Sensitivity Cases
Figure 14 illustrates the active power changes during faulted conditions compared across the different locational scenarios. The results begin to make sense as we recall that the active power is a product of current and voltage. The IRGs have limited ability to change the system voltage under the faulted condition and are effectively current limited. A traditional synchronous machine has a short-term capability to inject large amounts of fault current which helps to boost the voltage during a fault, and thus its active power contribution which helps with system frequency.
Figure 14: IRG Generation in PG&E From 0.9 to 1.5 Seconds

EPIC Final Report | 2.05 Synthetic Inertia
38
See Table 11 for numerical representation of the results, noting that the scenario where the IRGs were at a more robust location that did not exhibit as severe voltage depression resulted in no frequency violations for the 6,000 MW added scenario, which is a marked improvement compared to the original case with SIR. When the IRGs were placed in an area with a stiffer system voltage (or farther from the voltage dip caused by the fault) the units were able to provide their nominal power schedule which helped to arrest the system frequency decline.
Table 11: Summary of the Count of Frequency Violations and Lowest Frequency
4.2.1.4.3.2 IRG Resource Type Sensitivity
This sensitivity investigates the differences in response provided by resources if they are from solar PV or from battery storage. The scenario tested is also the 6000 MW of added IRG threshold case. The difference in the models is confined to the dynamic response where a few of the parameters are changed (time constants, ramps rates, etc.) Results showed that the slight changes in parameters and response times did not yield an appreciable difference in the overall system performance. This is likely because the models of the PV and BESS resources are already quite similar prior to addition of the same SIR control block. However, the similarity is dependent on the resources having the same available capacity, which the project’s simplified resource replacement approach enforced as a rule. The current practice for PV is that they produce as much active power as the sunlight allows; it is uncommon for them to have headroom. By contrast even a BESS with effectively zero charge may be able to provide some short support for frequency response by doing a deep discharge. Based on our understanding and feedback from BESS manufacturers such a limited deep discharge response is feasible to occur several times in a year without expecting excess degradation to the BESS.
4.2.1.4.3.3 Headroom Sensitivity
This sensitivity investigated how the amount of headroom for the new IRG may change the response. The amount of headroom was varied from about 5% headroom on the lowest end, included 15% headroom (to provide an indication compared to the CAISO 15% reserve margin) and up to >1,000% headroom to understand a nearly unlimited boundary condition. Results showed that varying the levels of headroom had only modest impacts. The figure below shows that there is some, though limited, difference based on available headroom.
Violations of WECC Frequency Deviation
criteria 59.6 Hz
Lowest frequency (Hz)
HV Original LV HV Original LV
6,000 MW Case
With SIR 0 127 127 58.867 57.594 57.867
6,000 MW Case
Without SIR 0 257 189 58.849 57.589 57.866

EPIC Final Report | 2.05 Synthetic Inertia
39
Figure 15: Active Power Output vs Time for Headroom Sensitivity Analysis
Figure 16: Average System Frequency vs Time for Headroom Sensitivity Analysis
It is evident, perhaps intuitive, that more headroom provides for better system response. The additional active power enables the SIR controller to exert more influence on larger frequency deviations. The results agree with this intuition, but the magnitude of the impacts is not as obvious. Of particular note are the book end cases tested in this sensitivity, the 5% and 9,900% headroom cases. In the 5% headroom case the total
EPIC Final Report | 2.05 Synthetic Inertia
40
MW contribution of the new IRG is clipped slightly. Although this has little impact on the system frequency response, nor on the number or magnitude of frequency violations, it is still important to recognize that frequency response will be virtually non-existent if there are no resources with additional output capability to make up for the lost resources. Also of note is that even when the resources are allowed virtually unlimited headroom (9,900%) the system response is only marginally better than the scenario with 25% headroom. This also shows that it is probably not necessary to overbuild the fleet of resources for purpose of providing SIR functions: a right-sized headroom capacity could be determined. Additional capacity beyond this certain point would yield diminishing value to the actual system response to contingency events. This sensitivity did not explore a precise amount of headroom that may be necessary to provide adequate frequency response. This precision will depend on several factors including location and ability of the units to respond. While it is too early to set expectations, for the time being the 15% reserve margin required by the CAISO (system wide) may be a reasonable benchmark to compare to.
4.2.2 Challenges
Measurement of system frequency that is fast, accurate, and precise is revealing itself to be quite challenging for simulation of SIR. This is true of both positive sequence simulations (GE PSLF and other powerflow programs) and actual field hardware. Positive sequence programs make some simplifications of the very complicated electric system to enable achievable analysis and solution times. WECC provided a white paper notification regarding the default PSLF frequency monitoring accuracy. The paper notes that the default frequency monitor model, fmeta, may not be as precise as desired and instead recommends using fmetr as a more accurate measure. Figure 17 below shows that even for the same bus location different models may report very different frequencies even with both using fmetr, which could be the difference between load being shed for under frequency purposes or staying online.

EPIC Final Report | 2.05 Synthetic Inertia
41
Figure 17: Frequency Comparison Of Two Different Models For The Same Bus Location
Additionally, in terms of hardware, another practical challenge of frequency monitoring is a tradeoff between speed and accuracy. This was noted in the Blue Cut fire issues as investigated by NERC38. A digital device (such as an inverter) can sample a waveform very rapidly to calculate an effective frequency. This can be done on a ROCOF or by averaging the time across several cycles. Measuring ROCOF can be a quick way to
38
1,200 MW Fault Induced Solar Photovoltaic Resource Interruption Disturbance Report https://www.nerc.com/pa/rrm/ea/1200_MW_Fault_Induced_Solar_Photovoltaic_Resource_/1200_MW_Fault_Induced_Solar_Photovoltaic_Resource_Interruption_Final.pdf.
EPIC Final Report | 2.05 Synthetic Inertia
42
access frequency, and potential issues. However, it may be prone to false positives (Blue cut fire) and may act erroneously; it is fast but may be inaccurate under strange conditions. Averaging across several cycles is likely to be more accurate as it will ignore very temporary slopes or spikes but may be too slow to respond to a concerning frequency decline which can happen within a few cycles. If digital measurement is the primary means this balance will need to be considered. Other technological advances may be needed to improve measurements in a similar way to how traditional spinning machines respond to frequency.
4.2.3 Results and Observations
The simulations results indicate that SIR, as modeled, can have a positive impact to help with further integration of inverter-based resource generation (IRG). However, it is important to note that the frequency response performance was unacceptable for these system conditions beginning at about 6,000 MW of added IRG even with SIR. This may be related to the relationship between voltage and active power for the IRG, which will begin to interrelate with frequency response. This realization is perhaps unique in that the conventional wisdom for power systems would predict that a generation loss would have the greatest impact to frequency performance and response. However this study revealed that since IRGs are effectively current sources a significant fault may actually be more impactful for frequency in that the voltage depression will result in the IRG to have a reduced effective active power output, which results in significant ‘generation’ loss that results in frequency decline.
4.3 Technical Results and Findings – PHIL Testing of BESS Controls for Synthetic Inertia Functions
4.3.1 Main Assumptions and Scenarios Used for PHIL Concept Development
Several distinct control strategies were explored in the PHIL work stream of this project:
BESS providing inertia and droop control
BESS providing inertia and FFR control
BESS providing droop control only
Challenges with real-time simulations such as memory limitations, extended simulation times, and model complexity limit the practical size and resolution of models that can be implemented in systems like RTDS for PHIL studies and certain levels of simplification are needed to emulate the dynamic behavior of the system. The real-time model of the power system for this project was divided into a higher-resolution internal model (the PG&E system), and a lower-resolution external model (the rest of WI power system). Based on these considerations, it was decided by the project team to develop a 9-bus RSCAD power system test model and adapt it so it could produce a frequency response that had as much “resemblance” as possible with the frequency response of WI under various contingency scenarios.
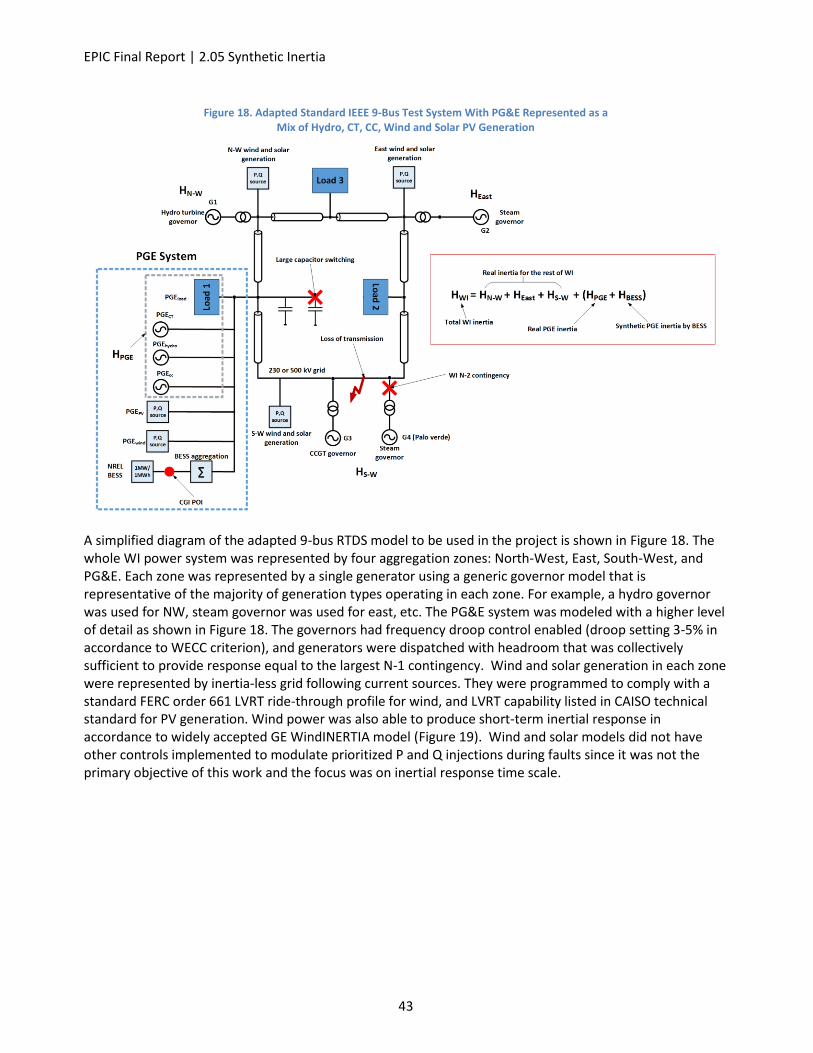
EPIC Final Report | 2.05 Synthetic Inertia
43
Figure 18. Adapted Standard IEEE 9-Bus Test System With PG&E Represented as a Mix of Hydro, CT, CC, Wind and Solar PV Generation
A simplified diagram of the adapted 9-bus RTDS model to be used in the project is shown in Figure 18. The whole WI power system was represented by four aggregation zones: North-West, East, South-West, and PG&E. Each zone was represented by a single generator using a generic governor model that is representative of the majority of generation types operating in each zone. For example, a hydro governor was used for NW, steam governor was used for east, etc. The PG&E system was modeled with a higher level of detail as shown in Figure 18. The governors had frequency droop control enabled (droop setting 3-5% in accordance to WECC criterion), and generators were dispatched with headroom that was collectively sufficient to provide response equal to the largest N-1 contingency. Wind and solar generation in each zone were represented by inertia-less grid following current sources. They were programmed to comply with a standard FERC order 661 LVRT ride-through profile for wind, and LVRT capability listed in CAISO technical standard for PV generation. Wind power was also able to produce short-term inertial response in accordance to widely accepted GE WindINERTIA model (Figure 19). Wind and solar models did not have other controls implemented to modulate prioritized P and Q injections during faults since it was not the primary objective of this work and the focus was on inertial response time scale.
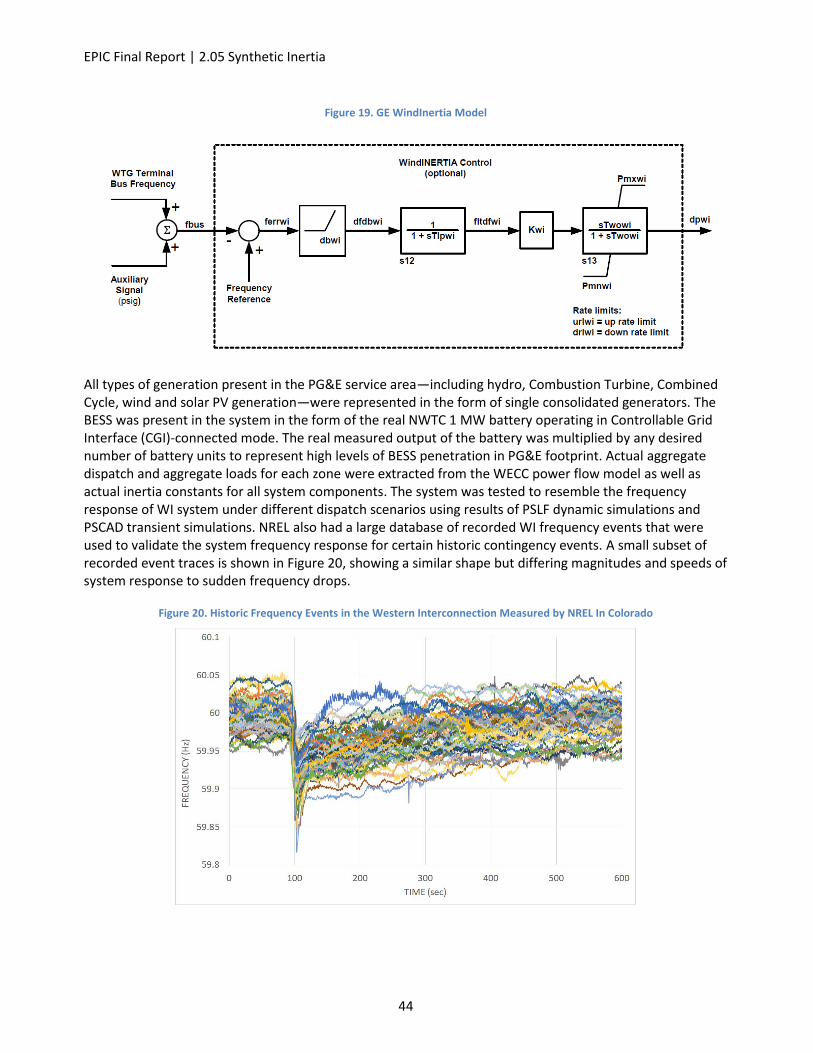
EPIC Final Report | 2.05 Synthetic Inertia
44
Figure 19. GE WindInertia Model
All types of generation present in the PG&E service area—including hydro, Combustion Turbine, Combined Cycle, wind and solar PV generation—were represented in the form of single consolidated generators. The BESS was present in the system in the form of the real NWTC 1 MW battery operating in Controllable Grid Interface (CGI)-connected mode. The real measured output of the battery was multiplied by any desired number of battery units to represent high levels of BESS penetration in PG&E footprint. Actual aggregate dispatch and aggregate loads for each zone were extracted from the WECC power flow model as well as actual inertia constants for all system components. The system was tested to resemble the frequency response of WI system under different dispatch scenarios using results of PSLF dynamic simulations and PSCAD transient simulations. NREL also had a large database of recorded WI frequency events that were used to validate the system frequency response for certain historic contingency events. A small subset of recorded event traces is shown in Figure 20, showing a similar shape but differing magnitudes and speeds of system response to sudden frequency drops.
Figure 20. Historic Frequency Events in the Western Interconnection Measured by NREL In Colorado
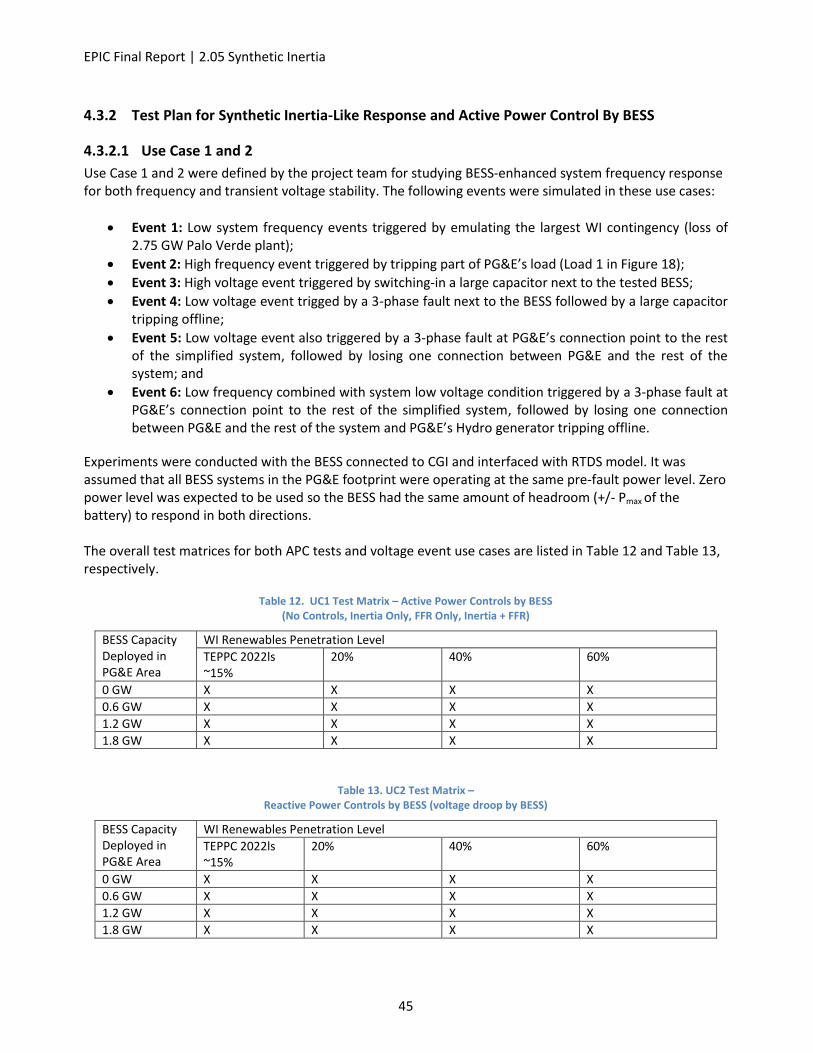
EPIC Final Report | 2.05 Synthetic Inertia
45
4.3.2 Test Plan for Synthetic Inertia-Like Response and Active Power Control By BESS
4.3.2.1 Use Case 1 and 2
Use Case 1 and 2 were defined by the project team for studying BESS-enhanced system frequency response for both frequency and transient voltage stability. The following events were simulated in these use cases:
Event 1: Low system frequency events triggered by emulating the largest WI contingency (loss of 2.75 GW Palo Verde plant);
Event 2: High frequency event triggered by tripping part of PG&E’s load (Load 1 in Figure 18);
Event 3: High voltage event triggered by switching-in a large capacitor next to the tested BESS;
Event 4: Low voltage event trigged by a 3-phase fault next to the BESS followed by a large capacitor tripping offline;
Event 5: Low voltage event also triggered by a 3-phase fault at PG&E’s connection point to the rest of the simplified system, followed by losing one connection between PG&E and the rest of the system; and
Event 6: Low frequency combined with system low voltage condition triggered by a 3-phase fault at PG&E’s connection point to the rest of the simplified system, followed by losing one connection between PG&E and the rest of the system and PG&E’s Hydro generator tripping offline.
Experiments were conducted with the BESS connected to CGI and interfaced with RTDS model. It was assumed that all BESS systems in the PG&E footprint were operating at the same pre-fault power level. Zero power level was expected to be used so the BESS had the same amount of headroom (+/- Pmax of the battery) to respond in both directions. The overall test matrices for both APC tests and voltage event use cases are listed in Table 12 and Table 13, respectively.
Table 12. UC1 Test Matrix – Active Power Controls by BESS (No Controls, Inertia Only, FFR Only, Inertia + FFR)
BESS Capacity Deployed in PG&E Area
WI Renewables Penetration Level
TEPPC 2022ls ~15%
20% 40% 60%
0 GW X X X X
0.6 GW X X X X
1.2 GW X X X X
1.8 GW X X X X
Table 13. UC2 Test Matrix – Reactive Power Controls by BESS (voltage droop by BESS)
BESS Capacity Deployed in PG&E Area
WI Renewables Penetration Level
TEPPC 2022ls ~15%
20% 40% 60%
0 GW X X X X
0.6 GW X X X X
1.2 GW X X X X
1.8 GW X X X X
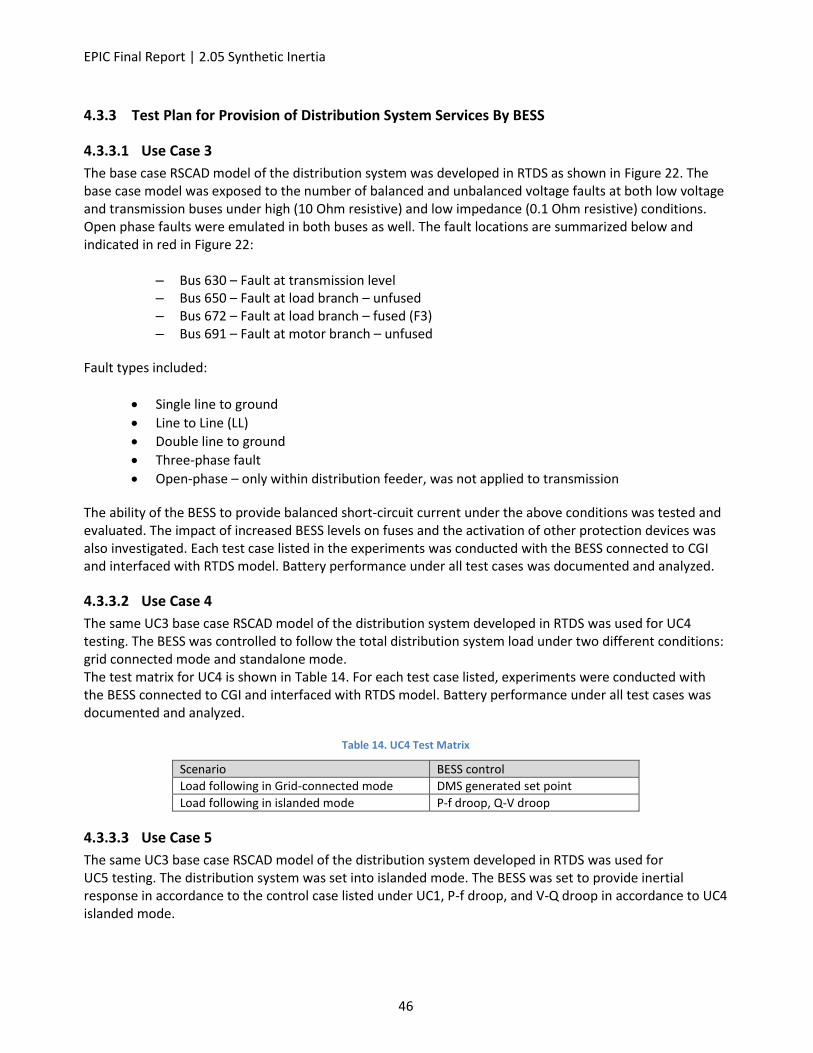
EPIC Final Report | 2.05 Synthetic Inertia
46
4.3.3 Test Plan for Provision of Distribution System Services By BESS
4.3.3.1 Use Case 3
The base case RSCAD model of the distribution system was developed in RTDS as shown in Figure 22. The base case model was exposed to the number of balanced and unbalanced voltage faults at both low voltage and transmission buses under high (10 Ohm resistive) and low impedance (0.1 Ohm resistive) conditions. Open phase faults were emulated in both buses as well. The fault locations are summarized below and indicated in red in Figure 22:
– Bus 630 – Fault at transmission level – Bus 650 – Fault at load branch – unfused – Bus 672 – Fault at load branch – fused (F3) – Bus 691 – Fault at motor branch – unfused
Fault types included:
Single line to ground
Line to Line (LL)
Double line to ground
Three-phase fault
Open-phase – only within distribution feeder, was not applied to transmission
The ability of the BESS to provide balanced short-circuit current under the above conditions was tested and evaluated. The impact of increased BESS levels on fuses and the activation of other protection devices was also investigated. Each test case listed in the experiments was conducted with the BESS connected to CGI and interfaced with RTDS model. Battery performance under all test cases was documented and analyzed.
4.3.3.2 Use Case 4
The same UC3 base case RSCAD model of the distribution system developed in RTDS was used for UC4 testing. The BESS was controlled to follow the total distribution system load under two different conditions: grid connected mode and standalone mode. The test matrix for UC4 is shown in Table 14. For each test case listed, experiments were conducted with the BESS connected to CGI and interfaced with RTDS model. Battery performance under all test cases was documented and analyzed.
Table 14. UC4 Test Matrix
Scenario BESS control
Load following in Grid-connected mode DMS generated set point
Load following in islanded mode P-f droop, Q-V droop
4.3.3.3 Use Case 5
The same UC3 base case RSCAD model of the distribution system developed in RTDS was used for UC5 testing. The distribution system was set into islanded mode. The BESS was set to provide inertial response in accordance to the control case listed under UC1, P-f droop, and V-Q droop in accordance to UC4 islanded mode.

EPIC Final Report | 2.05 Synthetic Inertia
47
Case 1. The distribution system is connected to the transmission grid where a disturbance occurs that affects the voltage and frequency at the distribution level causing the distributed PV inverters to disconnect.
Determine if a distribution-connected BESS can respond fast enough to improve the frequency or voltage on the distribution system and prevent the distributed PV inverters from disconnecting.
Case 2. The BESS is connected to the LV bus of the distribution substation and an unintentional islanding event makes the substation disconnect from the transmission grid.
a) Monitor BESS performance when BESS is rated to support load increase.
Monitor for low-voltage or under-frequency conditions and their duration at the substation bus and PV interconnection as a measure of BESS inverter response capability.
Determine if inverter response time is fast enough to prevent distributed PV inverters from disconnecting from system.
Determine any limitations when the inverter is required to supply additional reactive power (e.g., if a capacitor bank is switched off) in addition to the installed load during the islanding event.
b) BESS Response in Islanded System Configuration:
Once successful islanded mode is established, determine how the BESS can respond to sudden loss of the PV generation and stabilize the system, assuming it is sized to supply 100% of the load.
Determine if the BESS can prevent PV generation from tripping after a sudden start of a large motor.
c) Monitor BESS performance under overload conditions when BESS is not rated to support load increase.
Monitor the behavior of the inverter, such as the time the inverter stays online before disconnecting or shutting down based on overload, undervoltage, or under-frequency ride-through capability.
Determine if transformer overload ratings become exceeded before the inverter isolates from the system.
4.3.4 BESS Controls Development
The BESS external controller was developed using National Instrument’s Real-Time LabView Controls and Simulation Tool and implemented on an RT PXI controller (see Appendix for control diagram). The BESS Point of Interconnection (POI) electric frequency was provided from the RTDS rack to the PXI controller using UDP communications protocol. Three different frequency response controls could be activated individually or in combination with each other: inertial control, FFR control, and droop control. The level of impact on the test power system depended on the amount of total installed BESS capacity, which could be controlled by selecting the number of installed 1 MW/1 MWh BESS units (parameter NBESS). This control system allowed testing all the use cases and other control strategies described in this report. Additional features included ROCOF filtering, reactive power droop control, and an algorithm to prioritize active or reactive power operation. The controller received the voltage, frequency, phase angle and other information from the real-time power system model running in RTDS via UDP. The prioritization algorithm is further described in Figure 21.

EPIC Final Report | 2.05 Synthetic Inertia
48
Figure 21. P and Q Prioritization Principle
4.3.5 RTDS Models Development
4.3.5.1 Description of EPIC Distribution System Model
A distribution system model in CYME was selected for deployment on the RTDS platform. The CGI POI was on the 13.2 kV side of the BESS transformer. Additional voltage matching transformer was placed in RSCAD model to match the BESS with the voltage level of 12.47 kV. This was the virtual POI of the BESS with RSCAD distribution model. Various types of 1, 2 and 3-phase voltage faults could be introduced in the RSCAD model on 13.2 kV and transmission buses and the CGI emulated the exact voltage waveforms on the 12.47 kV bus under such fault conditions.
P
QQavailable
S
Active power level
f
P
+Pmax
-Pmax
Char
ging
Dis
char
ging
V
Q
+Qmax
-Qmax
VA
R
inje
ctio
nV
AR
ab
sorp
tio
n
60 Hz
Vnom
P and Q components of BESS response can be adjusted
and prioritized within S limit of the inverter
Steady-state operation
Frequency deadband
Voltage deadband

EPIC Final Report | 2.05 Synthetic Inertia
49
Figure 22. RTDS Model of Distribution System Used for PHIL Testing
4.3.6 Results of PHIL Testing of Fast Active Power Controls by BESS
4.3.6.1 Impacts of Synthetic Inertia-Like Response By BESS on System Frequency Response
For use case testing, the RTDS model was subjected to simulated low frequency events to demonstrate the ability of the new BESS controls to react. For the SIR function, the BESS was programmed to deploy its available power proportional to the ROCOF to reduce the initial ROCOF after a sudden loss of generation. The ROCOF deadband implemented for this test was set at 20 megahertz/sec level to avoid unnecessary triggering of inertial response by BESS controller. The tests were conducted for four BESS capacities at each

EPIC Final Report | 2.05 Synthetic Inertia
50
renewable penetration level. Figure 23 and Figure 23 show the results for the boundary cases of 0% and 60% renewables, respectively.
Figure 23: Complete Simulation Timescale, Synthetic Inertia Response by BESS, 0% Renewables Level, HBESS =
125 s
Figure 24: Magnified Timescale Around T=0, Synthetic Inertia Response by BESS, 0% Renewables Level, HBESS =
125 s
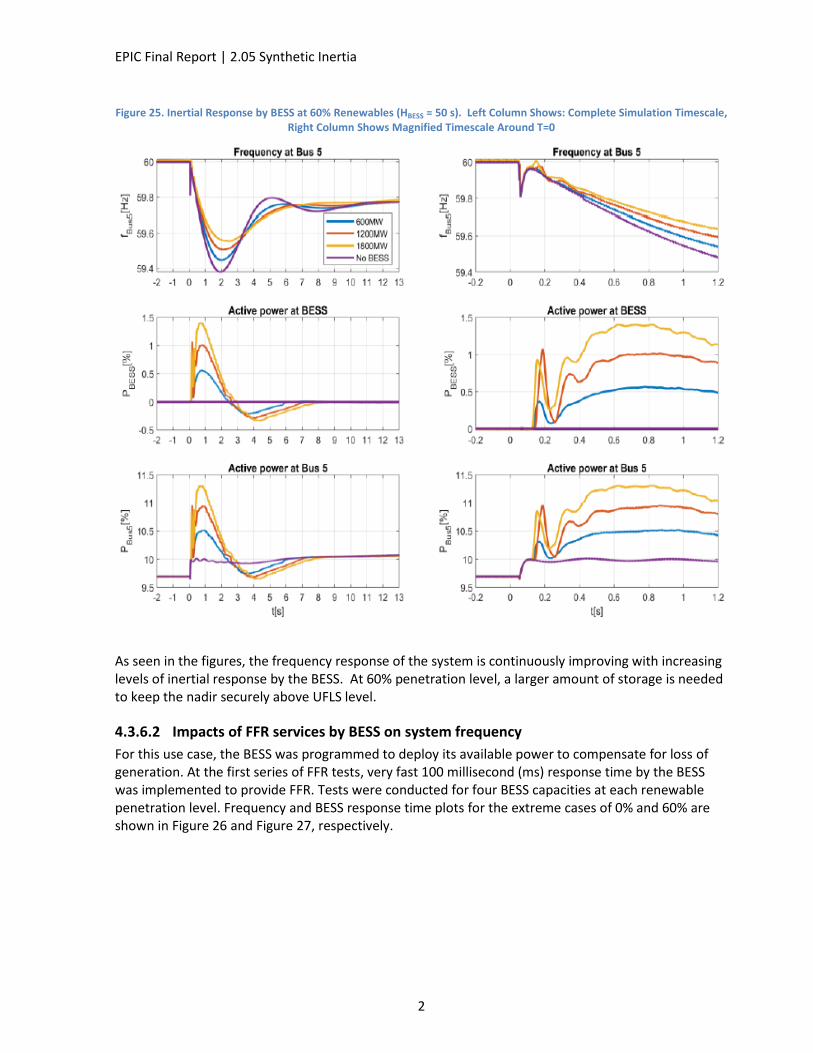
EPIC Final Report | 2.05 Synthetic Inertia
2
Figure 25. Inertial Response by BESS at 60% Renewables (HBESS = 50 s). Left Column Shows: Complete Simulation Timescale, Right Column Shows Magnified Timescale Around T=0
As seen in the figures, the frequency response of the system is continuously improving with increasing levels of inertial response by the BESS. At 60% penetration level, a larger amount of storage is needed to keep the nadir securely above UFLS level.
4.3.6.2 Impacts of FFR services by BESS on system frequency
For this use case, the BESS was programmed to deploy its available power to compensate for loss of generation. At the first series of FFR tests, very fast 100 millisecond (ms) response time by the BESS was implemented to provide FFR. Tests were conducted for four BESS capacities at each renewable penetration level. Frequency and BESS response time plots for the extreme cases of 0% and 60% are shown in Figure 26 and Figure 27, respectively.

EPIC Final Report | 2.05 Synthetic Inertia
3
Figure 26. FFR by BESS at 0% Renewables Left Column Shows Complete Simulation Timescale, Right Column Shows Magnified Timescale Around T=0
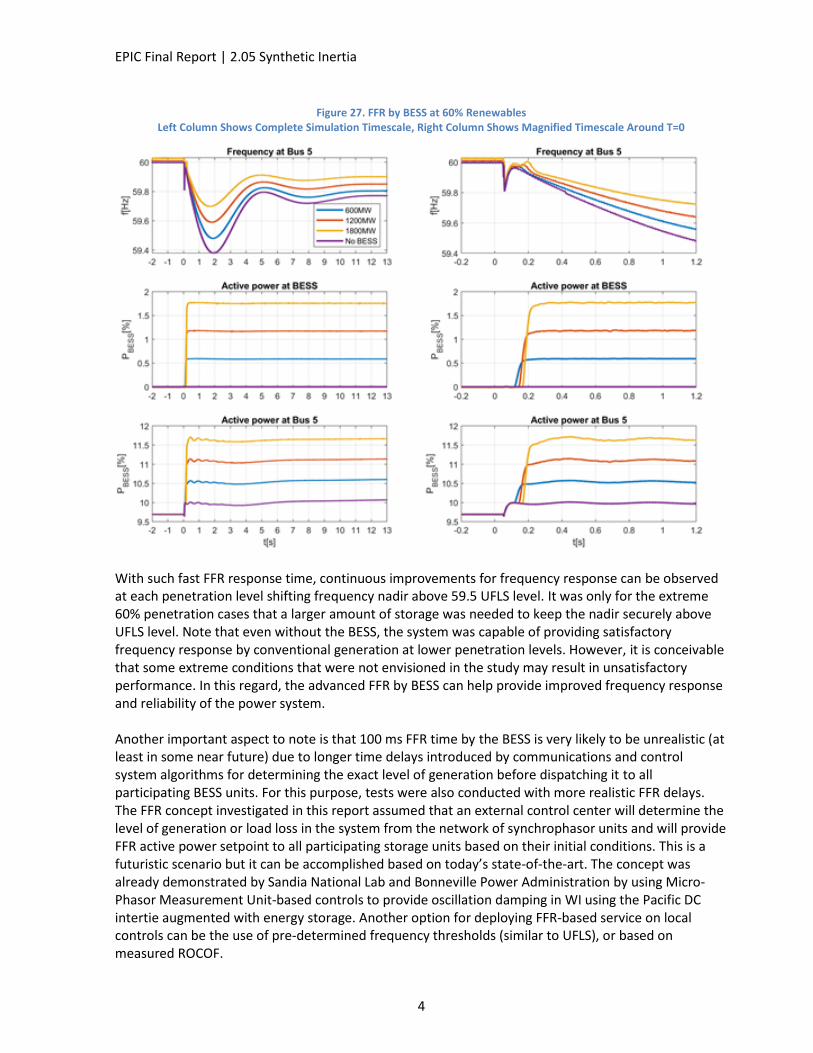
EPIC Final Report | 2.05 Synthetic Inertia
4
Figure 27. FFR by BESS at 60% Renewables Left Column Shows Complete Simulation Timescale, Right Column Shows Magnified Timescale Around T=0
With such fast FFR response time, continuous improvements for frequency response can be observed at each penetration level shifting frequency nadir above 59.5 UFLS level. It was only for the extreme 60% penetration cases that a larger amount of storage was needed to keep the nadir securely above UFLS level. Note that even without the BESS, the system was capable of providing satisfactory frequency response by conventional generation at lower penetration levels. However, it is conceivable that some extreme conditions that were not envisioned in the study may result in unsatisfactory performance. In this regard, the advanced FFR by BESS can help provide improved frequency response and reliability of the power system. Another important aspect to note is that 100 ms FFR time by the BESS is very likely to be unrealistic (at least in some near future) due to longer time delays introduced by communications and control system algorithms for determining the exact level of generation before dispatching it to all participating BESS units. For this purpose, tests were also conducted with more realistic FFR delays. The FFR concept investigated in this report assumed that an external control center will determine the level of generation or load loss in the system from the network of synchrophasor units and will provide FFR active power setpoint to all participating storage units based on their initial conditions. This is a futuristic scenario but it can be accomplished based on today’s state-of-the-art. The concept was already demonstrated by Sandia National Lab and Bonneville Power Administration by using Micro-Phasor Measurement Unit-based controls to provide oscillation damping in WI using the Pacific DC intertie augmented with energy storage. Another option for deploying FFR-based service on local controls can be the use of pre-determined frequency thresholds (similar to UFLS), or based on measured ROCOF.

EPIC Final Report | 2.05 Synthetic Inertia
5
4.3.6.3 Impacts of Combined Control Strategies By BESS On System Frequency Response
Below are the combined results of several PHIL test on the same graph to better understand the system performance for each method. For this purpose, we have selected the most extreme 60% penetration case. Figure 28 shows results for the following use case:
No BESS
Equivalent of 1800 MW BESS providing inertial response only
Equivalent of 1800 MW providing FFR with 100 ms delay
Equivalent of 1800 MW providing FFR with 1 s delay
Equivalent of 1800 MW providing Inertia + FFR with 1 s delay
Figure 28. Comparison of Inertial and FFR Controls at 60%Rrenewables Left Column Shows Complete Simulation Timescale, Right Column Shows Magnified Timescale Around T=0
As shown, the best performance was achieved for the use case with 100 ms FFR. However, as it was discussed earlier, this is not a realistic situation. Therefore, the best performance among the rest of the use cases was demonstrated by the “Inertia + FFR with 1 s delay” use case (green trace in the above plot). As discussed previously, the Inertia + FFR combination was expected to produce the best results. Even at such high level of renewable penetration, the combination of inertial response and FFR with 1 s delay produced the best performance keeping the frequency nadir securely above UFLS level.

EPIC Final Report | 2.05 Synthetic Inertia
6
4.3.6.4 Conclusions and Recommendations for Active Power Control Testing
This testing effort was conducted specifically to investigate the frequency response of the WI-like power system caused by a large loss of generation and address any stability-related impacts on transmission caused by voltage faults in the system. Many factors and constraints (both technical and economic) affect the operation of the power system with high levels of wind and solar generation. The depth of frequency excursions followed by a generation loss can be improved by energy storage providing inertial and/or FFR controls. The industry is concerned about having inadequate frequency response considering this changing generation mix as a result of the increasing penetration of variable generation and planned retirements of fossil-fueled generation. Currently, the various types of reliability services from generation sources are not technology neutral. To consider all options toward improving the frequency performance and voltage stability, the industry needs to research, develop, and demonstrate newer and less familiar sources to provide frequency support, such as battery energy storage. The results and data produced during these tests confirmed that PHIL testing is an important step in understanding the integration challenges of large utility-scale BESS plants into the power grid. Battery inverters are certified in accordance to various standards that impose a limited number of testing scenarios and grid conditions. As it was demonstrated in this testing task, the conditions encountered by the battery inverter can have a large variety of voltage and frequency profiles sometimes producing unpredictable results. In particular, some controls of battery inverters are expected to be more suitable for distribution level applications with many parameters and control modes that are not very well defined in their manuals. As a result, these control modes can interfere with transmission level applications and cause behaviors that do not produce benefits to the system, and even worse, deteriorate the system performance during contingencies. This is especially important for understanding the impacts of various anti-islanding control modes on inverter controllability for grid supportive services during contingency conditions. The following are specific conclusions from this testing task:
The main finding after these experiments was that PHIL testing of inverters under realistic voltage conditions emulated by CGI is an important step in understanding their true dynamic and transient performance. Even though vendors claim compliance with certain standards, the true performance of inverters will depend on many factors missed during certification testing in factories.
The 9-bus RTDS system was tested in PHIL setup with CGI and real 1 MW/1 MWh BESS.
Both inertial and FFR controls by BESS helped improve the frequency response of the system.
Increased inertial response by BESS helps increase frequency nadir, thus reducing the risk of UFLS.
It was observed that inertial response alone increases nadir but does not have a large impact on the transition time to the nadir (it actually shifts it slightly to the right).
FFR by BESS with a short delay (100 ms) has a significant impact on frequency nadir at any penetration level, however, such short delay will be hard to achieve in practice.
Combined Inertial + FFR control by BESS is a preferred solution.
Inertial response starts at the beginning of the event then FFR takes over after some delay to receive the actual setpoint from external control center.
Inertia + FFR by BESS produced the most benefits in terms of frequency response metrics in this test system.
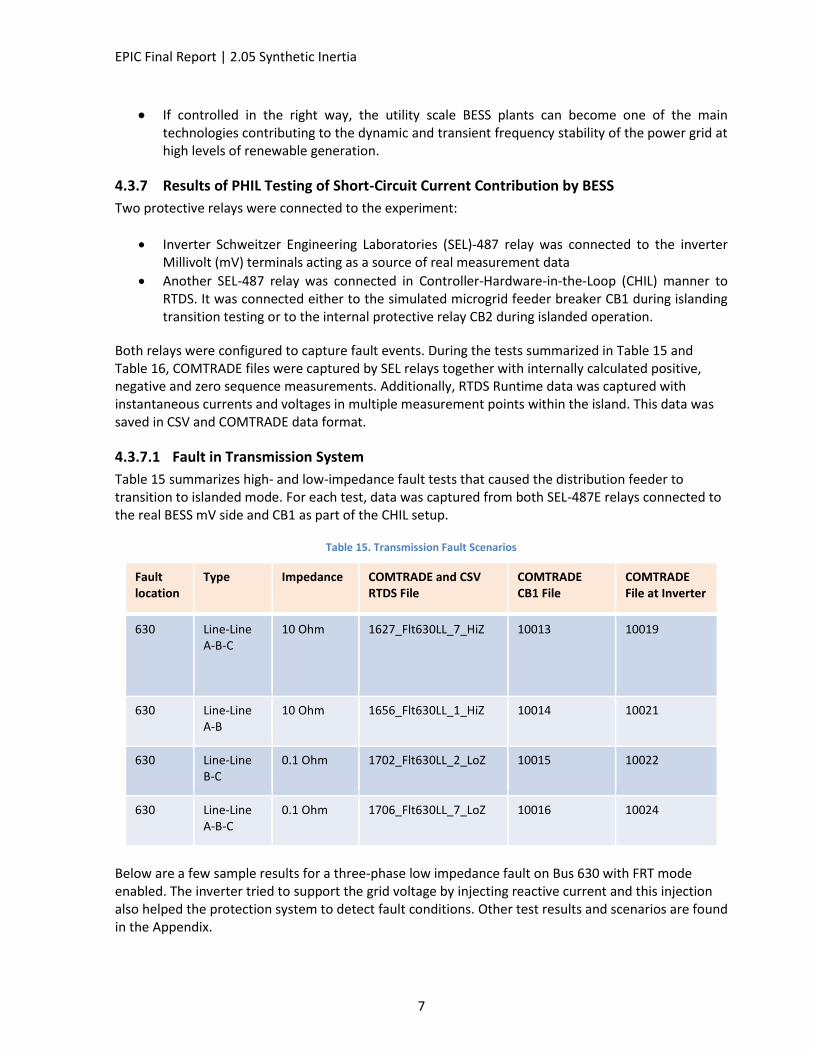
EPIC Final Report | 2.05 Synthetic Inertia
7
If controlled in the right way, the utility scale BESS plants can become one of the main technologies contributing to the dynamic and transient frequency stability of the power grid at high levels of renewable generation.
4.3.7 Results of PHIL Testing of Short-Circuit Current Contribution by BESS
Two protective relays were connected to the experiment:
Inverter Schweitzer Engineering Laboratories (SEL)-487 relay was connected to the inverter Millivolt (mV) terminals acting as a source of real measurement data
Another SEL-487 relay was connected in Controller-Hardware-in-the-Loop (CHIL) manner to RTDS. It was connected either to the simulated microgrid feeder breaker CB1 during islanding transition testing or to the internal protective relay CB2 during islanded operation.
Both relays were configured to capture fault events. During the tests summarized in Table 15 and Table 16, COMTRADE files were captured by SEL relays together with internally calculated positive, negative and zero sequence measurements. Additionally, RTDS Runtime data was captured with instantaneous currents and voltages in multiple measurement points within the island. This data was saved in CSV and COMTRADE data format.
4.3.7.1 Fault in Transmission System
Table 15 summarizes high- and low-impedance fault tests that caused the distribution feeder to transition to islanded mode. For each test, data was captured from both SEL-487E relays connected to the real BESS mV side and CB1 as part of the CHIL setup.
Table 15. Transmission Fault Scenarios
Fault location
Type Impedance COMTRADE and CSV RTDS File
COMTRADE CB1 File
COMTRADE File at Inverter
630 Line-Line A-B-C
10 Ohm 1627_Flt630LL_7_HiZ 10013 10019
630 Line-Line A-B
10 Ohm 1656_Flt630LL_1_HiZ 10014 10021
630 Line-Line B-C
0.1 Ohm 1702_Flt630LL_2_LoZ 10015 10022
630 Line-Line A-B-C
0.1 Ohm 1706_Flt630LL_7_LoZ 10016 10024
Below are a few sample results for a three-phase low impedance fault on Bus 630 with FRT mode enabled. The inverter tried to support the grid voltage by injecting reactive current and this injection also helped the protection system to detect fault conditions. Other test results and scenarios are found in the Appendix.

EPIC Final Report | 2.05 Synthetic Inertia
8
Figure 29. Measurements on High Voltage Side of Inverter Transformer During 3-Ph Low Impedance Fault on Bus 630
4.3.7.2 Tests in Islanded Mode
Several tests were also conducted when the distribution system was operating in islanded mode. SEL-487E relay event reports were triggered by a pre-programmed overcurrent limit (instantaneous overcurrent element - 50). As in the previous cases, one SEL-487 was set to measure real waveforms on the High Voltage (HV) side of the inverter transformer and second relay was connected to the RTDS analog outputs as CHIL to CB2. The test matrix for low-impedance faults in islanded mode is shown in Table 16..
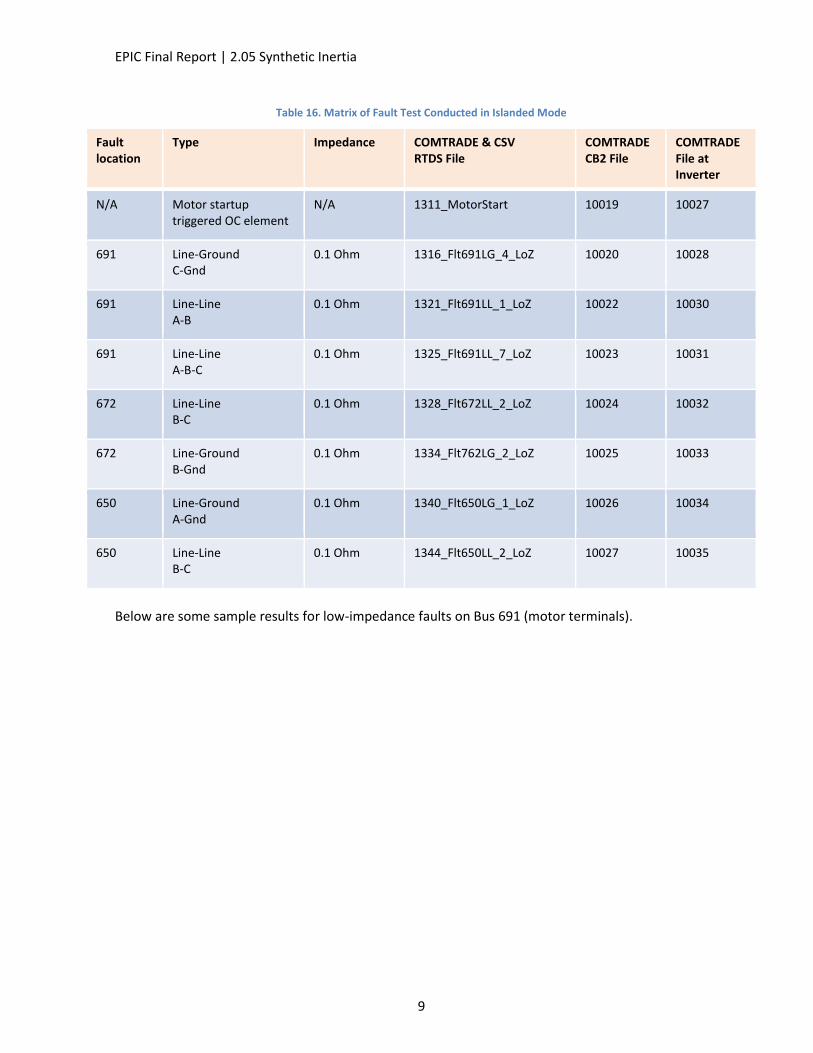
EPIC Final Report | 2.05 Synthetic Inertia
9
Table 16. Matrix of Fault Test Conducted in Islanded Mode
Fault location
Type Impedance COMTRADE & CSV RTDS File
COMTRADE CB2 File
COMTRADE File at Inverter
N/A Motor startup triggered OC element
N/A 1311_MotorStart 10019 10027
691 Line-Ground C-Gnd
0.1 Ohm 1316_Flt691LG_4_LoZ 10020 10028
691 Line-Line A-B
0.1 Ohm 1321_Flt691LL_1_LoZ 10022 10030
691 Line-Line A-B-C
0.1 Ohm 1325_Flt691LL_7_LoZ 10023 10031
672 Line-Line B-C
0.1 Ohm 1328_Flt672LL_2_LoZ 10024 10032
672 Line-Ground B-Gnd
0.1 Ohm 1334_Flt762LG_2_LoZ 10025 10033
650 Line-Ground A-Gnd
0.1 Ohm 1340_Flt650LG_1_LoZ 10026 10034
650 Line-Line B-C
0.1 Ohm 1344_Flt650LL_2_LoZ 10027 10035
Below are some sample results for low-impedance faults on Bus 691 (motor terminals).

EPIC Final Report | 2.05 Synthetic Inertia
10
Figure 30. Measurements on High Voltage Side of Inverter Transformer During L-To-L Low Impedance Fault in Bus 691

EPIC Final Report | 2.05 Synthetic Inertia
11
Figure 31. Measurements on High Voltage Side of Inverter Transformer During 3-Phase Low Impedance Fault in Bus 691
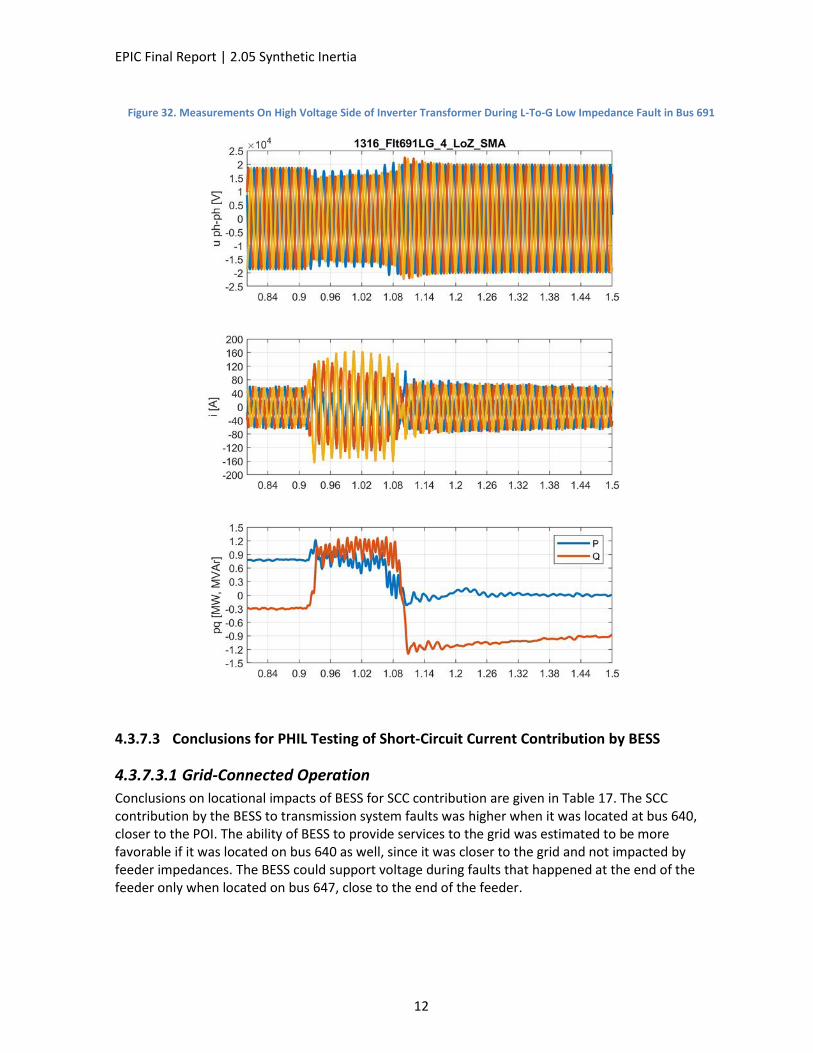
EPIC Final Report | 2.05 Synthetic Inertia
12
Figure 32. Measurements On High Voltage Side of Inverter Transformer During L-To-G Low Impedance Fault in Bus 691
4.3.7.3 Conclusions for PHIL Testing of Short-Circuit Current Contribution by BESS
4.3.7.3.1 Grid-Connected Operation
Conclusions on locational impacts of BESS for SCC contribution are given in Table 17. The SCC contribution by the BESS to transmission system faults was higher when it was located at bus 640, closer to the POI. The ability of BESS to provide services to the grid was estimated to be more favorable if it was located on bus 640 as well, since it was closer to the grid and not impacted by feeder impedances. The BESS could support voltage during faults that happened at the end of the feeder only when located on bus 647, close to the end of the feeder.
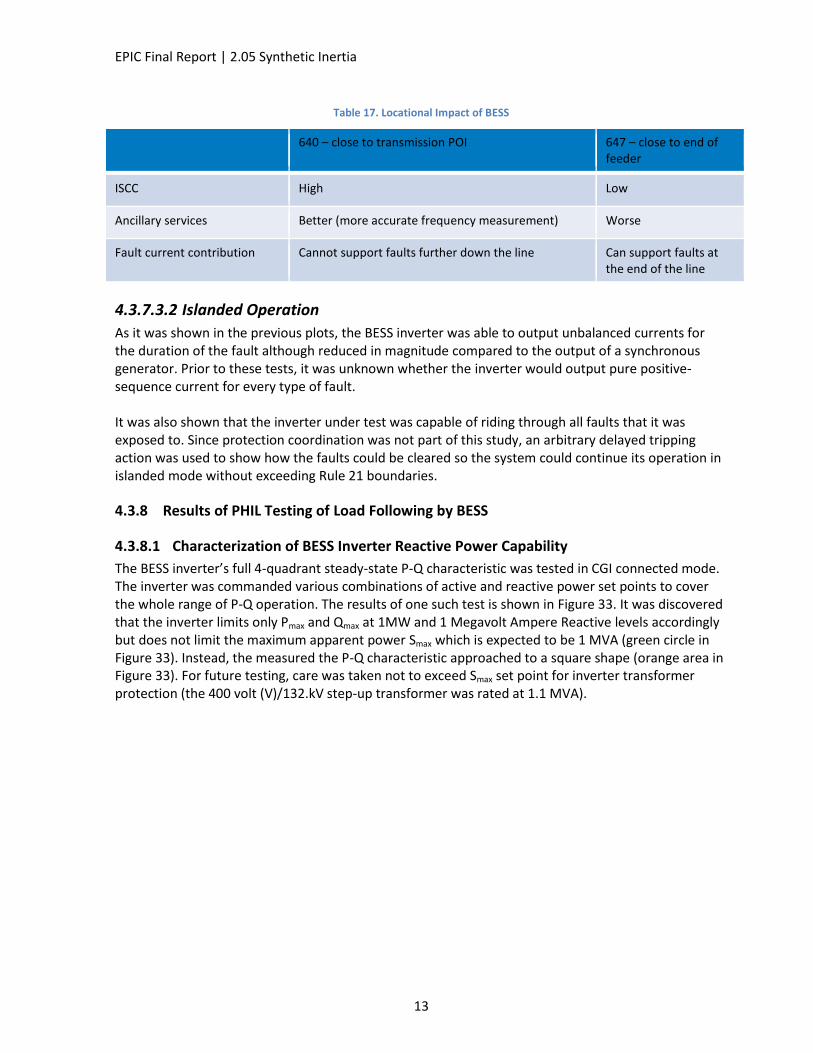
EPIC Final Report | 2.05 Synthetic Inertia
13
Table 17. Locational Impact of BESS
640 – close to transmission POI 647 – close to end of feeder
ISCC High Low
Ancillary services Better (more accurate frequency measurement) Worse
Fault current contribution Cannot support faults further down the line Can support faults at the end of the line
4.3.7.3.2 Islanded Operation
As it was shown in the previous plots, the BESS inverter was able to output unbalanced currents for the duration of the fault although reduced in magnitude compared to the output of a synchronous generator. Prior to these tests, it was unknown whether the inverter would output pure positive-sequence current for every type of fault. It was also shown that the inverter under test was capable of riding through all faults that it was exposed to. Since protection coordination was not part of this study, an arbitrary delayed tripping action was used to show how the faults could be cleared so the system could continue its operation in islanded mode without exceeding Rule 21 boundaries.
4.3.8 Results of PHIL Testing of Load Following by BESS
4.3.8.1 Characterization of BESS Inverter Reactive Power Capability
The BESS inverter’s full 4-quadrant steady-state P-Q characteristic was tested in CGI connected mode. The inverter was commanded various combinations of active and reactive power set points to cover the whole range of P-Q operation. The results of one such test is shown in Figure 33. It was discovered that the inverter limits only Pmax and Qmax at 1MW and 1 Megavolt Ampere Reactive levels accordingly but does not limit the maximum apparent power Smax which is expected to be 1 MVA (green circle in Figure 33). Instead, the measured the P-Q characteristic approached to a square shape (orange area in Figure 33). For future testing, care was taken not to exceed Smax set point for inverter transformer protection (the 400 volt (V)/132.kV step-up transformer was rated at 1.1 MVA).

EPIC Final Report | 2.05 Synthetic Inertia
14
Figure 33. P-Q Characterization Test
The P-Q characteristic of BESS system was measured on mV side (or CGI side) of the inverter transformer as well. Comparison of both P-Q characteristics is shown in Figure 34. The shift between the two is due to the 6% impedance of the inverter transformer, and some reactive losses in the 100 m underground collector line.

EPIC Final Report | 2.05 Synthetic Inertia
15
Figure 34. Reactive Power Capability Measured on LV and Millivolt Sides Of Inverter Trasformer
Additional tests were conducted to characterize P-Q characteristic of the inverter under different emulated grid strength conditions using CGI’s ability to simulate radial lines with any desired impedance levels.
4.3.8.2 Voltage and Frequency Control in Islanded Operation
The results of voltage and frequency control by the inverter in islanded mode are shown in Figure 35. At t=0.9s, the frequency set point of the inverter changed from 60 Hz to 60.33 Hz and the voltage set point changed from 400 V to 435 V.

EPIC Final Report | 2.05 Synthetic Inertia
16
Figure 35. Voltage and Frequency Setpoint Change In Islanded Mode (Left – High Voltage Side of Bess Transformer, Right – Comparison of Measurements at Different Buses)
4.3.8.3 Conclusions for Load Following of BESS Inverter
The test sequences of this section uncovered the unique dynamics with which voltage and frequency can be controlled with a BESS system. In these examples, the response to step changes in frequency and voltage setpoints was shown to be superior over conventional generation where inertia slows these processes down. In addition to the proper following of P and Q setpoints, the battery was able to provide the extremely fast changes in active and reactive power delivery needed during subsequent tests where either large loads or large generation was tripped from the system.
4.3.9 Results for Frequency Response for Distribution by BESS
The BESS was set to provide inertial response for grid-connected and islanded distribution system scenarios. While grid-connected, the system was exposed to disturbances that affected the voltage and frequency seen by equipment such as distributed PV inverters.
The performance of the BESS was also evaluated under unintentional islanding conditions when the BESS was rated to support the island load and when it was not. Performance metrics were low voltage or under-frequency conditions that may cause distributed PV inverters to disconnect.

EPIC Final Report | 2.05 Synthetic Inertia
17
Finally, the BESS was also tested on an islanded system under sudden loss of PV generation or sudden load changes such as the starting of a large motor.
4.3.9.1 Intentional Islanding
Intentional islanding requires the reduction of power at the POI to a minimum and opening the breaker causing a seamless transition with no noticeable distortions to the voltage frequency and magnitude. In this sequence, the BESS ramped up its power accordingly and switched to grid-forming mode just before CB1 opened at t=2.9 s.
Figure 36. Planned Islanding Test – Bus 630 Measurements
Figure 37. Planned Islanding Test – Inverter Measurements
4.3.9.2 Unplanned Islanding
BESS behavior for unplanned islanding was tested when CB1 tripped due to a L-L fault on the transmission system at t = 0.6 s. The voltage sag on the distribution system was limited to the time required by the protective relay to detect the event and open the POI breaker at t = 0.7 s. Immediately after this, the voltage was restored by the BESS grid forming inverter and the system transitioned to islanded operation with the feeder frequency stabilized by inverter droop control at around 59.75 Hz. Since separation of the island happened within 100 ms, according to Rule 21 no voltage nor frequency violation outside boundary was observed so the PV did not disconnect during this event.

EPIC Final Report | 2.05 Synthetic Inertia
18
Figure 38. Unplanned Islanding Test – Inverter Measurements

EPIC Final Report | 2.05 Synthetic Inertia
19
Figure 39. Unplanned Islanding Test – Comparison of Measurements on Different Buses
4.3.9.3 Islanded Operation – Motor Start Event #1
A motor start event was evaluated with varying amounts of PV generation. When enough PV generation was available, the BESS was able to provide the remaining active and reactive power needed for the motor to start at t=0.4s.

EPIC Final Report | 2.05 Synthetic Inertia
20
Figure 40. BESS Measurements During Motor Start (High Voltage Side of Inverter Transformer)
4.3.9.4 Islanded Operation – Motor Start Event #2
The same motor start event was tested under a reduced amount of PV generation (500 kW reduction). In this case, the BESS was not able to provide the levels of active and reactive power needed for the motor to start and it went into current-limiting mode.
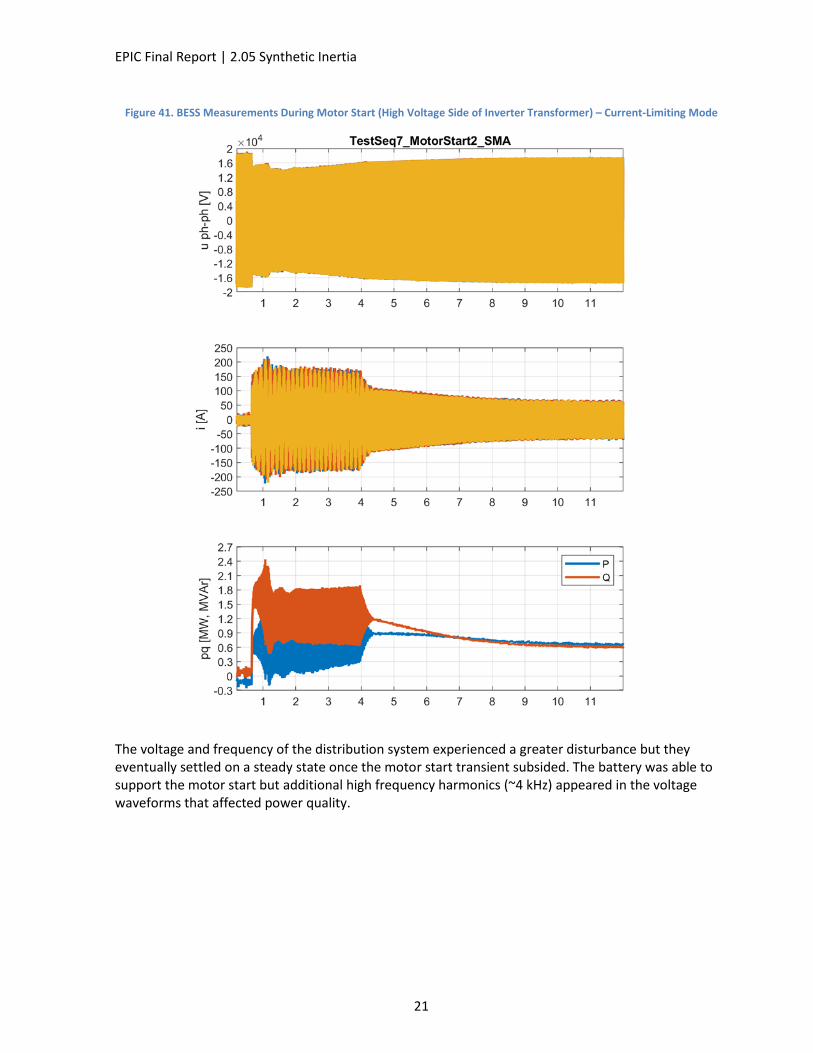
EPIC Final Report | 2.05 Synthetic Inertia
21
Figure 41. BESS Measurements During Motor Start (High Voltage Side of Inverter Transformer) – Current-Limiting Mode
The voltage and frequency of the distribution system experienced a greater disturbance but they eventually settled on a steady state once the motor start transient subsided. The battery was able to support the motor start but additional high frequency harmonics (~4 kHz) appeared in the voltage waveforms that affected power quality.

EPIC Final Report | 2.05 Synthetic Inertia
22
Figure 42. Comparison of Measurements in Different Buses During Motor Start Event – Current Limiting
Figure 43. Power Quality Snapshot on CGI Terminal Before (Left) and During (Right) Motor Start
4.3.9.5 Islanded Operation – Loss of PV
The BESS behavior under sudden loss of large PV generation was tested by tripping approximately 750 kW at t= 0.7 s. The loss of the PV plant lead to short-term overloading of the BESS but was still

EPIC Final Report | 2.05 Synthetic Inertia
23
within range that allowed operation according to the specified droop curve. Since the power exceeded the nominal capability of the battery transformer, a load shedding action was required which was demonstrated by tripping the motor load after an arbitrary delay of 250ms. This process created under- and over-frequency transients during PV-tripping and motor shedding but neither of these transients exceeded Rule 21 boundaries so the PV inverters stayed connected at all times.
Figure 44. BESS Measurements During PV Trip Event (High Voltage Side of Inverter Transformer)
4.3.9.6 Conclusions for Frequency Response by BESS for Distribution System
An advanced PHIL interface was developed that allowed successful implementation of various planned and unintentional islanding tests for the distribution system. The battery inverter demonstrated stable performance during all test cases even when short-term overload ratings of BESS were exceeded. This showed that the implementation of a battery storage system of a size similar to NREL’s is beneficial for the resiliency of the considered feeder.

EPIC Final Report | 2.05 Synthetic Inertia
24
Having a BESS capable of grid forming with voltage and frequency droops (V-Q and f-P) in islanded and grid-connected modes added significant resiliency to the system. During the unplanned islanding events in this study, the BESS could restore the generation-load imbalance instantly, achieving a seamless transition like for the planned islanding case. Another way of achieving a seamless transition is to implement a fast-acting controller that depends on very fast communications between protective relays and an ability of the inverter to seamlessly switch modes from grid following to grid forming. This solution requires very high level of integration and critical timing. Having BESS operating in grid-forming mode at all times as in these test cases provided seamless transition capability without the need of any communications between protective devices and the battery, which largely simplified the development process of islanding schemes. After the transition to islanded operation, the frequency and voltage can be brought back to nominal with a centralized device. For the cases when the battery was not capable of supporting the full load of the distribution system, a decentralized load shedding scheme was implemented that depended on the f-P droop characteristics of the battery inverter and under/over frequency elements of sheddable loads or generators. In this way, fully functional load balancing for the island was achieved without the need of a centralized controller.
4.3.9.7 Future Demonstration Needs
The storage and renewable generation inverters operating in grid forming mode at times (in both stand-alone and grid connected cases) seem to have several major advantages and are promising for future large-scale use:
Simplicity of control
Lack of PLL
Possibility to regulate voltage magnitude and angle in the synchronous dq-reference frame
Possibility of mimicking the basic characteristics of synchronous generators
Seamless transition between different modes of operation
Fault ride-through capabilities
However, certain aspects of grid-forming operation (especially at very high penetration levels) require intensive future demonstration and development to give answers and provide solutions to the following important topics:
Do we really need all inverters to be operating in grid following modes? If not, what is the optimum ratio between grid-forming and grid-following inverters in a given power system?
What are the stability implications of grid-forming application on system level?
What is the best way to operate grid-forming inverters under various fault conditions?
What are the impedance characteristics of grid-forming inverters with different control strategies?
What is the role of grid-forming inverters in enhancing the system resilience and security?
Distributed vs. centralized control for various services?
All above questions require comprehensive demonstration and development activities and comparison between different grid-forming converter control strategies in both modeling and PHIL testing environments.
EPIC Final Report | 2.05 Synthetic Inertia
25
5 Value proposition
The purpose of EPIC funding is to support investments in TD&D projects that benefit the electricity customers of PG&E, SDG&E, and SCE. EPIC 2.05 Synthetic Inertia has demonstrated that inverter based renewable generation can be controlled to partially emulate the frequency response of synchronous machine generators. The project further demonstrated that the use of such controls has clear frequency performance benefits to the overall bulk electric system across the WI. This technology holds promise for maintaining and improving the reliability of the entire system in support of renewable energy deployment across the region.
5.1 Primary Principles
The primary principles of EPIC are to invest in technologies and approaches that provide benefits to electric ratepayers by promoting greater reliability, and increased safety. This EPIC project contributes to these primary principles in the following ways:
Reliability: a. Use Cases 1 and 2 addressed frequency management for the transmission system. The
project found that new approaches will be needed in the future for managing the moment to moment balance of load and generation across the system, as measured in the system frequency. This project explored, demonstrated, and advanced the use of inverters to use new control methods to maintain system frequency as the system relies increasingly on renewable energy. The deployment of this synthetic inertia functions could be a key component to the suite of solutions for enhancing reliability under the range of disturbances the system will face.
b. Use Cases 4 and 5 targeted frequency response and load following capabilities on the distribution system. The project’s findings show that advanced inverter controls have high potential for managing loads and responding to disturbances in both transmission connected and islanded distribution scenarios. Further advancement of using grid forming inverter modes showed great promise for resiliency applications as well, demonstrating successful transitions from grid-sourced to battery-sourced states on a distribution circuit.
Affordability: a. Use Cases 1, 2, and 3 seeks solutions to keep the power system operating safely and
reliably in a future with high renewables. They aim to find optimal technical approaches that would reduce the overall cost to operate and maintain the power system at a high level of performance. As such, the project takes a long view of affordability, advancing solutions towards more optimal cost and performance tradeoffs in the future.
b. Use Cases 4 and 5 aim to find solutions that would reduce total system cost for distribution reliability and resilience services. More advanced BESS inverter controllers could reduce the total costs for monitoring and control of these applications, thus improving the affordability and service benefits for utility customers.
Safety: Increased safety and/or enhanced environmental sustainability: a. Use Case 3 addressed safety by exploring fault scenarios and approaches to maintain
protection methods that prevent harm to people and equipment. The project validated expected performance limitations of inverter technologies and explored the
EPIC Final Report | 2.05 Synthetic Inertia
26
state of knowledge on alternative protection solutions for low-inertia power systems. This knowledge base will inform future solutions to elevating safety performance as needs evolve for system protection.
b. The underpinning need for new inertia solutions is to support the growth of renewable energy. The solutions demonstrated by this project advance the long term, wide spread, and large-scale deployment of very high amounts of solar and wind generation. Enabling these sources of energy to become majority players in the resource pool is essential to the environmental objective of reducing air pollution including criteria air pollutants to greenhouse gases.
5.2 Secondary Principles
EPIC also has a set of complementary secondary principles. This EPIC project contributes to the secondary principles of societal benefits, greenhouse gas (GHG) emissions reduction, and economic development.
Societal benefits: By supporting long term renewables deployment, the project works indirectly to reduce California’s dependence on fossil resources. This reduction corresponds to the societal benefit of reducing the air and water toxins associated with the use of fossil fuels.
GHG emissions reduction: The technology demonstrated in this project ultimately addresses impending problems that could hamper the deployment of renewable energy. By preempting these problems, the solutions explored here support the continual reduction of the GHG intensity of the energy industry through greater use of renewable resources.
Economic development: The long-term growth of renewables includes a geographical dispersion of energy resources which present economic opportunities throughout the state of California which benefit local communities in construction and in operation.
5.3 Accomplishments and Recommendations
5.3.1 Key Accomplishments
The following summarizes some of the key accomplishments of the project over its duration:
5.3.1.1 PHIL Testing of BESS Controls
Developed and validated SIR, PFR, and FFR control capabilities for an inverter resource on lab platform (LabView) and field automation hardware (SEL RTAC)
Created PHIL test protocol including models of the PG&E distribution system and a simplified model of the WECC transmission system adapted from the standard IEEE 9 bus test system
Characterized the short-circuit current contribution of inverter hardware to better inform protection scheme development of islanded power systems
Created a novel PHIL interface allowing continuous before and after simulation of islanding events for a distribution-connected BESS
Demonstrated seamless transitions, load variation handling, and fault tolerance of a BESS using grid-forming (voltage source) inverter mode for P-f droop control in PHIL environment
5.3.1.2 Transmission Modeling and Simulation
Performed thorough literature review of scholarly and industry works related to inertia loss impacts on the power system and inverter control solutions to mitigate those impacts.
EPIC Final Report | 2.05 Synthetic Inertia
27
Developed detailed models of SIR controls in PSCAD and RSCAD, cross validating software and hardware behavior.
Created a user-defined model of an inverter resource with new SIR capability in the GE PSLF and validated with more detailed electromagnetic models in PSCAD and testing results from hardware-in-the-loop testing.
Adapted the SIR controller models for use with GE PSLF software for full-scale bulk power system simulation. Used this model to perform system-wide dynamic simulations to understand the impact of SIR from IRGs on the performance of the WI.
Determined a reference case for an IRG penetration threshold in the PG&E territory using the WECC power system model and accepted frequency performance planning criteria
Applied SIR controller models to reference case to demonstrate improvement of the system frequency response and a corresponding IRG penetration threshold.
Performed a sensitivity analysis of the effects of location, type of resource, and varying headroom on the IRG penetration threshold
5.3.1.3 Other Collateral Benefits
The PSCAD and PSLF model files developed by the project can be taken forward to future investigation of system needs and solution requirements.
The RSCAD and RTDS model files and test scripts created for the project can also be used for other distribution PHIL work including testing of other inertia solutions, DG, inverters, or microgrid controllers.
The utility collaboration with NREL has yielded a promising degree of fit in lab’s capabilities and PG&E needs which could yield further opportunities for the EPIC program and beyond.
5.3.2 Key Takeaways
The following findings are the key takeaways from this project:
The project demonstrated that new SIR controller capabilities for battery and solar inverters can improve the frequency response of the transmission system in low inertia scenarios.
o SIR alone did not resolve all the frequency criteria violations created in the low-inertia simulations. A persistent number of issues remained at high deployment SIR, showing that the specific technique of SIR is not a one-to-one replacement for mechanical inertia.
o However, a combination of inverter control approaches demonstrated superior frequency response performance. Such a combination of approaches, possibly including SIR, FFR, and PFR, may enable IRGs to meet future frequency support needs.
Voltage variations during contingency events have a large impact on system frequency response performance due to the prevailing use of current-source mode inverters.
o Inverters close to faults are less effective for frequency support due to local voltage depression in those scenarios.
o A geographically disperse portfolio of assets is likely best suited for frequency response in combination with dynamic voltage support.
Today’s inverter hardware is capable of SIR, and the controls can be implemented on lab and field automation controllers. However, commercial availability of such features is uncertain. The project had to develop features on top of the available hardware, and vendor RFI response was not robust enough to characterize the state of the market.

EPIC Final Report | 2.05 Synthetic Inertia
28
New inverter testing standards and utility interconnection requirements are needed for increasingly demanding (low inertia) future grid scenarios.
o New frequency response requirements may be needed to build on existing transmission and distribution3 interconnection rules.
o Performance requirements and standards for grid-forming (voltage source) inverters are especially nascent since this control mode is not prevalent for grid connected applications today.
The project proved that simulation methods are available to create low inertia transmission system scenarios, quantify inertia loss impacts, and test possible improvements to a reference penetration threshold.
o Starting with a model of WECC with light load and no PV resources, the method of incrementally adding IRGs and simulating contingency events showed a quantifiable reference for an IRG penetration threshold based on selected performance criteria.
o Using frequency performance criteria to measure the magnitude of impact from disturbances before system recovery, simulations showed a reference threshold of 57% IRG (approx. 10 GW out of 18 GW). This is not a prediction of an expected future scenario, but rather a baseline performance value usable to show the effects of SIR.
The project demonstrated that a BESS operating in a constant grid-forming (voltage source) inverter mode can provide seamless transition capability to a distribution circuit, restoring load-generation imbalance instantly, without communications from a central controller.
o The BESS inverter in grid-forming mode demonstrated stable performance during all islanded distribution test cases even when short-term overload ratings of the BESS were exceeded.
o The BESS inverter was able to output unbalanced current. It was also able to ride through all the faults applied during the islanded distribution test sequence.
o The BESS inverter responded to step changes in frequency and voltage setpoints with high speed and precision thanks to the responsiveness of the inverter and controls.
Frequency measurement is technically difficult, and new solutions should be refined and tested for SIR applications.
o PHIL testing showed that existing frequency measurement algorithms fall short in dealing with unbalanced faults.
o Energy storage on distribution will face additional challenges for measuring system frequency. The higher number of various faults on the distribution system can distort the voltage waveforms that reach a storage device, thus impacting their ability to accurately measure the system frequency and respond correctly.
Momentary cessation settings make an important difference to system response. Older vintages of frequency ride through settings would be a significant hinderance to having a full roll out of PV when considering system performance and stability. New settings required by the recent IEEE 1547-2018 standard should address this ride through issue. These new configurations were not yet in use in PSLF at the time of the project.
5.3.3 Recommendations
The utility industry needs to undertake further work to better pinpoint long-term future inertia impacts, needs, and refined solutions. This work should include the following activities:
o Assess the system needs in a range of forecasted scenarios for likely resource mixes in
both CA and across WECC.

EPIC Final Report | 2.05 Synthetic Inertia
29
o Determine how much headroom capacity39 is needed from SIR assets, from which
types of IRG resources, and in what locations on the power system. Alternative
sources such as synchronous condensers should also be assessed.
o Simulate tradeoffs and synergies of combining the ensemble of controller methods,
including SIR, FFR, and PFR.
o Address the modeling limitations of positive sequence dynamic simulation software
around faults and frequency measurement to enhance confidence in simulation
outcomes. Advanced tools may be needed such as co-simulation amongst
Electromagnetic Transients Program (EMTP) and positive sequence dynamic
simulators. Such tools are not readily available.
o Pursue a more complete protection coordination study for low inertia scenarios,
assessing different adaptation methods in transmission-connected and islanded
distribution conditions.
o Assess the benefits, tradeoffs, and overall requirements to enable use of grid-forming
inverters for utility resilience applications, including locating BESS such that it can
protect downstream loads from disturbances while grid-connected.
o Establish an industry standard control scheme, and corresponding validation test
protocol, for inverter frequency response including SIR that can be implemented via
utility requirements such as the Transmission Interconnection Handbook.
Near-term steps could be taken by utilities and regulators to advance SIR development including the following:
o Organize a broader stakeholder group including WECC member utilities and Balancing
Authorities such as CAISO to pursue the work detailed above.
o Incorporate the project’s SIR controller model into a standard model for PSLF and
other accepted modeling tools. The parameters of these models need to be refined,
tuned and further validated, particularly for co-simulation in multiple tools.
o Leverage energy storage for inertial functions. Specifically, assess the compatibility of
inflight BESS projects to accept controller upgrades in the future when frequency
response needs are better defined.
o Assess the complete set of alternatives, such as synchronous condensers, and the
respective costs, values, and compensation models for new inertial functions needed
to support the system.
o Thoroughly assess the commercial availability and technical readiness of inertia
functions across the market of inverter vendors.
39
Headroom capacity refers to the amount of active power available in online, operational resources that can be deployed for frequency response. This capacity could be provided by resources operating at less than their maximum rating, such as explored in the headroom sensitivity studies described in Section 4.2.1.4.3.3. It could also be provided by stand-by resources dedicated to this purpose, such as a BESS kept online at an idle or zero power output level.

EPIC Final Report | 2.05 Synthetic Inertia
30
o Bring this work to standards setting bodies such as IEEE in the 2800.1 Transmission
Inverter standard committee to drive for more thorough testing and addressing
advanced frequency controls commensurate with the evolving needs of the system.
o Engage NERC to establish frequency response requirements that address synthetic
inertial response capabilities and emergent system needs.
5.4 Technology Transfer Plan
5.4.1 IOU’s Technology Transfer Plans
A primary benefit of the EPIC program is the technology and knowledge sharing that occurs both internally within PG&E, and across the other IOUs, the CEC and the industry. In order to facilitate this knowledge sharing, PG&E will share the results of this project in industry workshops and through public reports published on the PG&E website. Specifically, below is information sharing forums where the results and lessons learned from this EPIC project were presented or plan to be presented:
5.4.2 Information Sharing Forums Held
Regular discussions with EPRI Balancing and Uncertainty Task Force leads Ongoing
NREL Article “When the Gears Stop Turning: NREL and PG&E Collaboration Demonstrates Synthetic Inertia” Web Newsletter40 |May 2018 Information Sharing Forums Planned
Energy Systems Integration Group, 2019 Spring Technical Workshop Albuquerque, NM | March 2019
CAISO Transmission Planning Process Forums (To Be Determined)
WECC Reliability Study Forums (To Be Determined)
PG&E plans on continuing to share the results and lessons learned from this EPIC project in the future.
5.4.3 Adaptability to Other Utilities and Industry
The following findings of this project are relevant and adaptable to other utilities and the industry:
SIR controller capabilities for inverters can improve the frequency response of the transmission system in low inertia scenarios.
Today’s inverter hardware is capable of SIR, and the controls can be implemented on lab and field automation controllers.
Voltage variations during contingency events have a large impact on system frequency response performance due to the prevailing use of current-source mode inverters.
A geographically disperse portfolio of assets is likely best suited for frequency response.
Simulation methods are available to create low inertia transmission system scenarios, quantify inertia loss impacts, and test possible improvements to a reference penetration threshold.
40
https://www.nrel.gov/news/program/2018/when-the-gears-stop-turning.html.

EPIC Final Report | 2.05 Synthetic Inertia
31
A BESS operating in a constant grid-forming (voltage source) inverter mode can provide seamless transition capability to a distribution circuit, restoring load-generation imbalance instantly, without communications from a central controller.
The BESS inverter was able to output unbalanced current. It was also able to ride through all the faults applied during the islanded distribution test sequence.
Frequency measurement is technically difficult, and new solutions should be refined and tested for SIR applications.
Inverter testing standards and utility interconnection requirements need to evolve for increasingly demanding (low inertia) future grid scenarios.
Momentary cessation settings make an important difference to system frequency response.
5.5 Data Access
Upon request, PG&E will provide access to data collected that is consistent with the CPUC's data access requirements for EPIC data and results.

EPIC Final Report | 2.05 Synthetic Inertia
32
6 Metrics
The following metrics were identified for this project and included in PG&E’s EPIC Annual Report as potential metrics to measure project benefits at full scale.41 Given the proof of concept nature of this EPIC project, these metrics are forward looking.
D.13-11-025, Attachment 4. List of Proposed Metrics and Potential Areas of Measurement (as applicable to a specific project or investment area)
Reference
1. Potential energy and cost savings
a. Number and total nameplate capacity of DG facilities Section 4.3
b. Total electricity deliveries from grid-connected DG facilities Section 4.3
i. Nameplate capacity (MW) of grid-connected energy storage Section 4.2
3. Economic benefits
e. Non-energy economic benefits (reliability) Sections 4.2, 4.3
5. Safety, Power Quality, and Reliability (Equipment, Electricity System)
a. Outage number, frequency and duration reductions Sections 4.2, 4.3
7. Identification of barriers or issues resolved that prevented widespread deployment of technology or strategy
b. Increased use of cost-effective digital information and control technology to improve reliability, security, and efficiency of the electric grid (PU Code § 8360)
Section 4
d. Deployment and integration of cost-effective distributed resources and generation, including renewable resources (PU Code § 8360)
Sections 4.2, 4.3
h. Deployment and integration of cost-effective advanced electricity storage and peak-shaving technologies, including plug-in electric and hybrid electric vehicles, and thermal-storage air-conditioning (PU Code § 8360)
Sections 4.2, 4.3
41
2015 PG&E EPIC Annual Report. Feb 29, 2016. http://www.pge.com/includes/docs/pdfs/about/environment/epic/EPICAnnualReportAttachmentA.pdf.
EPIC Final Report | 2.05 Synthetic Inertia
33
7 Conclusion
The EPIC 2.05 project gave a more definitive form to a looming issue facing the evolving power system. A high penetration level of renewable energy significantly decreases the inertia of the PG&E transmission system and increases the occurrence of frequency violations during contingency scenarios. The project demonstrated great potential for novel control methods to enable inverter-based renewables to address this problem. Dissecting the components of inertia-loss issues as well as analyzing the complimentary controls techniques for inverters is a critical step in garnering requisite focus to these looming problems and their potential solutions. Adding SIR, and other new control methods, to inverter-based renewables may substantially improve system frequency performance. The project also highlights the potential of grid-forming inverters for resilience applications of BESS on
the distribution system. The project demonstrated a grid-forming inverter providing seamless isolation
and robust response to load variations within an islanded distribution feeder, even without using a
microgrid controller or communications. This approach could greatly reduce control system costs while
reducing dependence on fossil-burning synchronous machine generators. Further development of this
concept could yield compelling applications of utility scale BESS, enabling utilities to offer new power
system resilience solutions to face climate and security risks.
Balancing authorities, utilities, regulators, and technology companies have a shared responsibility to continue the work undertaken by EPIC 2.05. A collective view must be developed of future grid scenarios, the modeling and analysis tools needed to understand them, and the new grid support technologies they will require. The new reality of a high-renewables, low-inertia power system demands new approaches to grid reliability. Greater need for power system resilience also brings new demand for inverter-based resource to provide solutions. The breadth of these issues and the shared nature of the grid mean that many entities from system operators to power producers are needed to participate in developing these new approaches to ensure the clean, safe, reliable, and affordable power system that California needs.

EPIC Final Report | 2.05 Synthetic Inertia
34
8 Additional References
[1] V. Singhvi et al., “Impact of wind active power control strategies on frequency response of an interconnection,” in 2013 IEEE Power Energy Society General Meeting, 2013, pp. 1–5.
[2] C. Loutan et al., “Using Renewables to Operate a Low-Carbon Grid: Demonstration of Advanced Reliability Services from a Utility-Scale Solar PV Plant,” California ISO.
[3] Everoze, “Batteries: Beyond the Spin,” Everoze, Oct. 2017.
[4] E. Spahic, D. Varma, G. Beck, G. Kuhn, and V. Hild, “Impact of reduced system inertia on stable power system operation and an overview of possible solutions,” in 2016 IEEE Power and Energy Society General Meeting (PESGM), 2016, pp. 1–5.
[5] Bruce Miller, “Inertia in power system: We don’t actually need that much,” 23-Jun-2017.
[6] E. Muljadi, V. Gevorgian, M. Singh, and S. Santoso, “Understanding inertial and frequency response of wind power plants,” in 2012 IEEE Power Electronics and Machines in Wind Applications, 2012, pp. 1–8.
[7] Peter Fairley, “Can Synthetic Inertia from Wind Power Stabilize Grids,” Energywise, 07-Nov-2016.
[8] C. Rahmann and A. Castillo, “Fast Frequency Response Capability of Photovoltaic Power Plants: The Necessity of New Grid Requirements and Definitions,” Energies, vol. 7, no. 10, pp. 6306–6322, Sep. 2014.
[9] Australian Energy Market Operator (AEMO), “Initial operation of the Hornsdale Power Reserve Battery Energy Storage System,” Australian Energy Market Operator (AEMO), Apr. 2018.
[10] N. W. Miller, M. Shao, S. Pajic, and R. D’Aquila, “Western Wind and Solar Integration Study Phase 3 – Frequency Response and Transient Stability (Report and Executive Summary),” National Renewable Energy Laboratory, NREL/SR-5D00-62906-ES, Dec. 2014.
[11] NERC Reliability Guideline, “Integrating Inverter- Based Resources into Weak Power Systems,” 2017.
[12] J. Aho et al., “A tutorial of wind turbine control for supporting grid frequency through active power control,” in American Control Conference (ACC), 2012, pp. 3120–3131.
[13] S. Baros and M. D. Ilić, “Distributed Torque Control of Deloaded Wind DFIGs for Wind Farm Power Output Regulation,” IEEE Trans. Power Syst., vol. 32, no. 6, pp. 4590–4599, 2017.
[14] V. Gevorgian and B. O. Neill, “Demonstration of Active Power Controls by Utility- Scale PV Power Plant in an Island Grid,” in the 15th International Workshop on Large-Scale Integration of Wind Power into Power Systems as well as on Transmission Networks for Offshore Wind Power Plants, 2017.
[15] NERC, “2017 Frequency Response Annual Analysis,” 2017.

EPIC Final Report | 2.05 Synthetic Inertia
35
[16] I. a. Urbana-Champaign. WSCC 9-Bus System. Available: file:///C:/Users/jtan/Desktop/TJ/99_%20Standand%20Model/IEEE%20standard%20Model/WSCC9BusTestCase/WSCC%209-Bus%20System%20-%20Illinois%20Center%20for%20a%20Smarter%20Electric%20Grid%20(ICSEG).html.
[17] “Energy Storage.” [Online]. Available: http://www.cpuc.ca.gov/General.aspx?id=3462 [Accessed: 14-Jun-2018].
[18] The Climate Group, “How California Is Driving the Energy Storage Market Through State Legislation,” Apr. 2017.
[19] Public Utilities Commission of California, DECISION ON TRACK 2 ENERGY STORAGE ISSUES. 2017.
[20] Commissioner Randolph of the Public Utilities Commission of California, DECISION SETTING REQUIREMENTS FOR LOAD SERVING ENTITIES FILING INTEGRATED RESOURCE PLANS. 2017.
[21] A. Ellis, M. Behnke, and R. Elliott, “Generic solar photovoltaic system dynamic simulation model specification,” Sandia Report, Sandia National Laboratories, Albuquerque, New Mexico, 2013.
[22] W. E. C. Council. (2015). REEC_C Modeling Specification. Available: https://www.wecc.biz/Reliability/REEC_C_031815_rev3%20Model%20Spec.pdf.
[23] P. P. Zarina, S. Mishra, and P. C. Sekhar, “Deriving inertial response from a non-inertial PV system for frequency regulation,” in 2012 IEEE International Conference on Power Electronics, Drives and Energy Systems (PEDES), 2012, pp. 1–5.

EPIC Final Report | 2.05 Synthetic Inertia
36
9 Appendices
9.1 Modeling and Simulation Exhibits
9.1.1 Parameters of IRG Generator Models Added
The tables below list the dynamic model parameters for new IRGs. for simulating momentary cessation the zerox parameter of the regc models was made equal to the brkpt parameter, with each being equal to 0.9.
Table 18: Dynamic Model Parameters for Inverter-Based Renewable Generators Simulated in PSLF
DESERT SUNLIGHT SOLAR PV PLANT MODEL PG&E Cluster 7 Project Q1032 Tranquillity 8
regc_a
reec_b
regc_a
reec_c
lvplsw 1 vdip 0.9 lvplsw 1 vdip 0.9
rrpwr 1.4 vup 1.1 rrpwr 1.4 vup 1.1
brkpt 0.9 trv 0.01 brkpt 0.9 trv 0.01
zerox 0.5 dbd1 -0.1 zerox 0.5 dbd1 -0.1
lvpl1 1.1 dbd2 0.1 lvpl1 1.1 dbd2 0.1
vtmax 1.1 kqv 2 vtmax 1.1 kqv 2
lvpnt1 0.05 iqh1 1.1 lvpnt1 0.05 iqh1 1.1
lvpnt0 0.01 iql1 -1.1 lvpnt0 0.01 iql1 -1.1
qmin -1.1 vref0 0 qmin -1.1 vref0 1
accel 0.7 tp 0.01 tg 0.02 SOCini 0.5
tg 0.02 qmax 0.6 tfltr 0.01 SOCmax 1
tfltr 0.01 qmin -0.6 iqrmax 20 SOCmin 0
iqrmax 20 vmax 1.15 iqrmin -20 T 99999
iqrmin -20 vmin 0.85 xe 0 tp 0.01
xe 0 kqp 1
qmax 0.6
kqi 1
qmin -0.6
kvp 1
vmax 1.15
kvi 1
vmin 0.85
tiq 0.01
kqp 1
dpmax 1
kqi 1
dpmin -1
kvp 1
pmax 1
kvi 1
pmin 0
tiq 0.01
imax 1.1
dpmax 1
tpord 0.01
dpmin -1
pfflag 0
pmax 1
vflag 0
pmin -1
qflag 0
imax 1.1
pqflag 0
tpord 0.01
pfflag 0
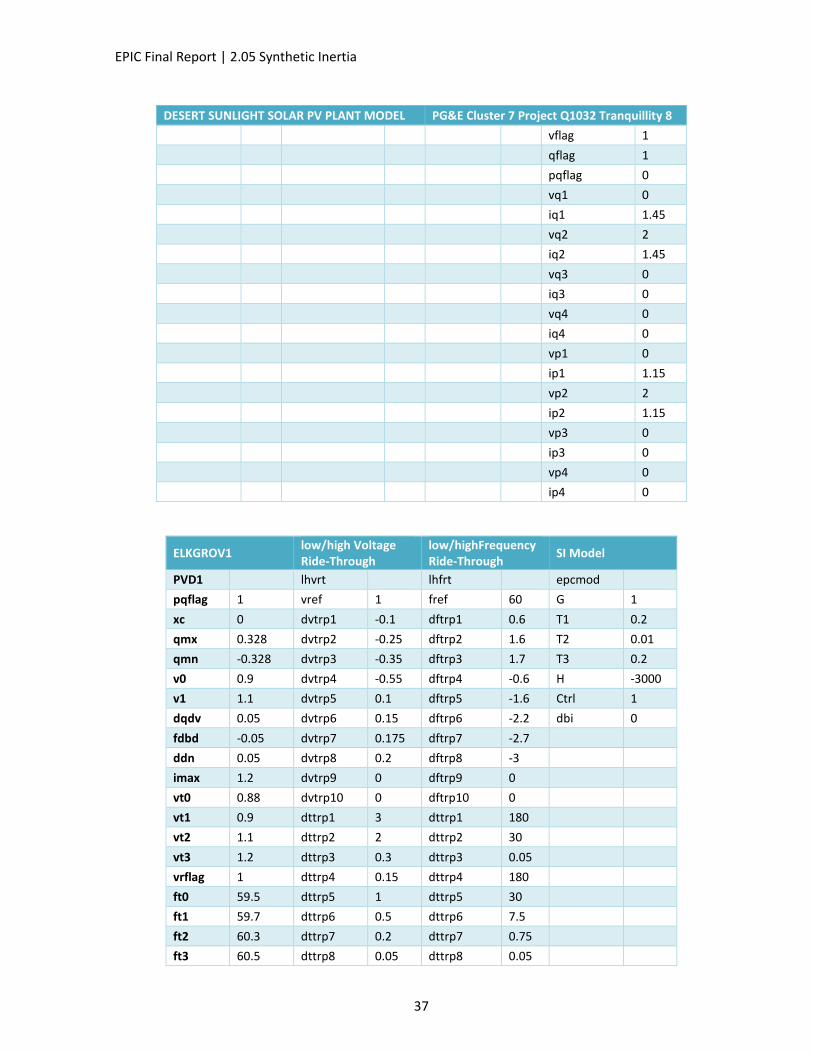
EPIC Final Report | 2.05 Synthetic Inertia
37
DESERT SUNLIGHT SOLAR PV PLANT MODEL PG&E Cluster 7 Project Q1032 Tranquillity 8
vflag 1
qflag 1
pqflag 0
vq1 0
iq1 1.45
vq2 2
iq2 1.45
vq3 0
iq3 0
vq4 0
iq4 0
vp1 0
ip1 1.15
vp2 2
ip2 1.15
vp3 0
ip3 0
vp4 0
ip4 0
ELKGROV1 low/high Voltage Ride-Through
low/highFrequency Ride-Through
SI Model
PVD1
lhvrt
lhfrt
epcmod
pqflag 1 vref 1 fref 60 G 1
xc 0 dvtrp1 -0.1 dftrp1 0.6 T1 0.2
qmx 0.328 dvtrp2 -0.25 dftrp2 1.6 T2 0.01
qmn -0.328 dvtrp3 -0.35 dftrp3 1.7 T3 0.2
v0 0.9 dvtrp4 -0.55 dftrp4 -0.6 H -3000
v1 1.1 dvtrp5 0.1 dftrp5 -1.6 Ctrl 1
dqdv 0.05 dvtrp6 0.15 dftrp6 -2.2 dbi 0
fdbd -0.05 dvtrp7 0.175 dftrp7 -2.7
ddn 0.05 dvtrp8 0.2 dftrp8 -3
imax 1.2 dvtrp9 0 dftrp9 0
vt0 0.88 dvtrp10 0 dftrp10 0
vt1 0.9 dttrp1 3 dttrp1 180
vt2 1.1 dttrp2 2 dttrp2 30
vt3 1.2 dttrp3 0.3 dttrp3 0.05
vrflag 1 dttrp4 0.15 dttrp4 180
ft0 59.5 dttrp5 1 dttrp5 30
ft1 59.7 dttrp6 0.5 dttrp6 7.5
ft2 60.3 dttrp7 0.2 dttrp7 0.75
ft3 60.5 dttrp8 0.05 dttrp8 0.05
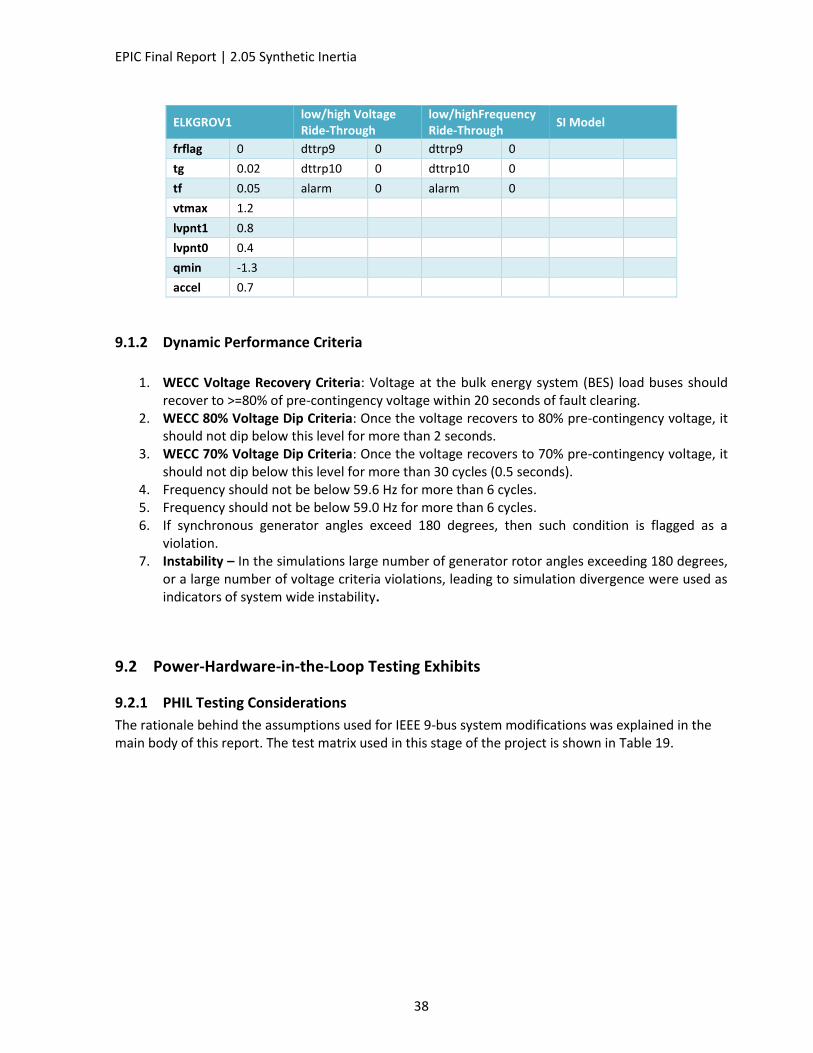
EPIC Final Report | 2.05 Synthetic Inertia
38
ELKGROV1 low/high Voltage Ride-Through
low/highFrequency Ride-Through
SI Model
frflag 0 dttrp9 0 dttrp9 0
tg 0.02 dttrp10 0 dttrp10 0
tf 0.05 alarm 0 alarm 0
vtmax 1.2
lvpnt1 0.8
lvpnt0 0.4
qmin -1.3
accel 0.7
9.1.2 Dynamic Performance Criteria
1. WECC Voltage Recovery Criteria: Voltage at the bulk energy system (BES) load buses should
recover to >=80% of pre-contingency voltage within 20 seconds of fault clearing. 2. WECC 80% Voltage Dip Criteria: Once the voltage recovers to 80% pre-contingency voltage, it
should not dip below this level for more than 2 seconds. 3. WECC 70% Voltage Dip Criteria: Once the voltage recovers to 70% pre-contingency voltage, it
should not dip below this level for more than 30 cycles (0.5 seconds). 4. Frequency should not be below 59.6 Hz for more than 6 cycles. 5. Frequency should not be below 59.0 Hz for more than 6 cycles. 6. If synchronous generator angles exceed 180 degrees, then such condition is flagged as a
violation. 7. Instability – In the simulations large number of generator rotor angles exceeding 180 degrees,
or a large number of voltage criteria violations, leading to simulation divergence were used as indicators of system wide instability.
9.2 Power-Hardware-in-the-Loop Testing Exhibits
9.2.1 PHIL Testing Considerations
The rationale behind the assumptions used for IEEE 9-bus system modifications was explained in the main body of this report. The test matrix used in this stage of the project is shown in Table 19.

EPIC Final Report | 2.05 Synthetic Inertia
39
Table 19. Renewable Penetration Scenarios for 9-Bus System
Conventional Generators PV & Wind Loads Total H
Renewable penetration
𝑃𝐺𝑛
GW 𝐻𝐺
sec 𝑃𝐺𝑑𝑖𝑠𝑝𝑎𝑡𝑐ℎ
GW
𝑃𝑅𝑛 ,
GW 𝑃𝐿
GW 𝐻𝑇𝑜𝑡
sec
60% 53.3 4 40 60 100 2.13
40% 80 4 60 40 100 3.20
20% 106.7 4 80 20 100 4.27
15% 113.3 4 85 15 100 4.53
0% 133.3 4 100 0 100 5.33
The following scaling factors have been used for all dispatched values used in Table 19: Kscaling= 317.46. For example, 126 MW dispatch for conventional generators will correspond to 40 GW for a scaled-up model for the whole WI. All results in this section are shown in per unit. The BESS is the only real generation system in this PHIL experiment. In the future, we can use the existing wind and PV generation at NWTC and include them into PHIL experiments to understand the impacts of multi-technology frequency response. Equation for total system inertia related to system’s total power (total amount of loads):
𝐻𝑇𝑜𝑡 =𝐻𝐺𝑃𝐺𝑛 + 𝐻𝐵𝑃𝐺𝑛 + 𝐻𝑅𝑃𝑅𝑛
𝑃𝑇𝑜𝑡
Equation (1)
𝑃𝑇𝑜𝑡 = 𝑃𝐿 and is constant for all renewable penetration cases 𝐻𝑅 – inertia provided renewable generation is assumed to be 0. BESS inertial constant can be calculated from (1): Equation for inertia emulation:
2𝐻𝑇𝑜𝑡
𝑑𝑓𝑝𝑢
𝑑𝑡≈ ∆𝑃𝑝𝑢
Equation (2)
Then, ROCOF can be calculated as:
𝑅𝑂𝐶𝑂𝐹 =𝑑𝑓𝑝𝑢
𝑑𝑡≈
∆𝑃𝑝𝑢
2𝐻𝑇𝑜𝑡
Equation (3)
With maximum expected power step of ∆𝑃𝑝𝑢𝑀𝑎𝑥 =4% maximum ROCOF can be expressed as
𝑅𝑂𝐶𝑂𝐹𝑀𝑎𝑥 =∆𝑃𝑝𝑢𝑀𝑎𝑥
2𝐻𝑇𝑜𝑡
Equation (4)

EPIC Final Report | 2.05 Synthetic Inertia
40
BESS power then can be expressed as
𝑃𝐵𝑝𝑢 = 𝑅𝑂𝐶𝑂𝐹 ∗ 2 ∗ 𝐻𝐵 Equation (5)
To utilize full capacity of the battery, BESS inertial constant 𝐻𝐵 can be calculated, so BESS power 𝑃𝐵𝑀𝑎𝑥 = 94%) can be achieved at ROCOFMax combining (4) and (5):
𝐻𝐵 =𝑃𝐵𝑀𝑎𝑥
𝑅𝑂𝐶𝑂𝐹𝑀𝑎𝑥 ∗ 2=
𝑃𝐵𝑀𝑎𝑥𝐻𝑇𝑜𝑡
∆𝑃𝑝𝑢𝑀𝑎𝑥
Equation (6)
The 𝑃𝐵𝑀𝑎𝑥 = 94% was achieved experimentally by setting arbitrary values to inertia and keeping small margin to avoid power limiting by BESS inverter. Based on above equations, the following table for BESS inertial constant was calculated for all penetration cases:
Table 20. BESS Inertia Constants
Renewables Penetration (%) HTot sec
HB sec
0 5.33 125
15 4.53 106
20 4.27 100
40 3.20
75
60 2.13 50
The rationale used for HBESS adjustments is explained in PHIL test results shown in Figure 45 for 1,800 MW BESS case. The upper and lower graphs show frequency and BESS power respectively measured on Bus 5 of the RTDS model for the same level of generation loss for different renewable penetration levels (0, 15, 20, 40 and 60%). The BESS H values were adjusted to ensure that BESS produced the same amount of inertial response (lower graph). The frequency response of the 9-bus system is declining with penetration level (upper graph), so deeper frequency nadir is observed at high renewable penetration cases. The battery H was adjusted to ensure the same maximum benefit from BESS at any penetration level in terms of active power response. For smaller H, the BESS will produce less power than it is capable of, and therefore, the comparison between cases will not be correct. For all cases shown in Figure 45, the BESS was controlled from NI PXI controller. The under and over frequency relays were disabled in the 9-bus system so the full system frequency response can be compared for different events and penetration levels. Figure 45 shows results for 1800 MW BESS at all penetration cases. The BESS response remains the same by adjusting the BESS H accordingly (lower graph). This way, as it was explained earlier, the BESS deploys all its available power during the frequency event. The resulting frequency picture is different as seen in the upper graph with frequency nadir declining at higher penetration cases.

EPIC Final Report | 2.05 Synthetic Inertia
41
Figure 45. BESS H Values Explained (Left Column – Test Data, Right Column – Magnified Around t=0)
9.2.2 Results of PHIL Testing of Reactive Power Controls by BESS
9.2.2.1 Reactive Power Droop Control by BESS During Ground Faults
Several tests were conducted at different renewable generation levels for two levels of BESS installed capacity. The test cases include (1) no energy storage in the system, (2) equivalent to 1,800 MW of storage in idle mode (no set points commanded to the BESS with internal FRT control disabled, but it was desired to see if it produced any other response to the fault), (3) equivalent 1,800 MW of storage operating on voltage droop set by external PXI controller, (4) equivalent of 1,800 MW storage operating on its internal inverter FRT control. BESS was not set to provide any APCs during above cases. After conducting some primary modeling in PSCAD and RTDS systems, it was decided to set the BESS reactive power/voltage droop at 20% for all tests (20% droop means that 20% change in voltage results in 100% change in reactive power). Test results for 40% renewable penetration level are shown in Figure 46. As in all the other cases, the BESS control method had very little impact on the minimum voltage magnitude, where the minimum voltage at Bus 5 reached about 0.6 p.u. The impact of 20% voltage droop control was about the same as for the rest of the cases with ~1.2% improvement in minimum voltage for both inverter and PCI controller options. For this renewables penetration case, it was decided to activate power controls to

EPIC Final Report | 2.05 Synthetic Inertia
42
check if they can help with the over-frequency situation observed after the voltage fault event. At the beginning of the voltage fault, the BESS inverter was controlled to produce inertial response only (Hbess=75s), 3% frequency droop response only, and combination of inertial and droop response. The response of the battery can be observed in an active power increase as seen in Figure 46.
Figure 46. LVRT at 40% Renewables and 20% Voltage Droop And Active Power Controls by BESS
All above APCs had very little impact on over-frequency, and in fact, caused lower voltage levels during the faults in Bus 7. Apparently, this issue of combined active and reactive power interactions during voltage faults must be investigated further and perhaps it is a subject of another extended project to understand the system dynamics and impacts of BESS controls.

EPIC Final Report | 2.05 Synthetic Inertia
43
9.2.2.2 Reactive Power Droop Control by BESS during Overvoltage Event
Testing was conducted with a switched capacitor on Bus 6 to inject additional reactive current in the 9-bus system and emulate overvoltage events. An example of this test is shown in Figure 47 for 40% renewable penetration case. During these tests, the Labview PXI controller was enabled to command both 10% voltage droop, and APCs in the form of 5% frequency droop and inertial control with Hbess=75s.
Figure 47. HVRT at 40% Renewables with Various Controls: Vdroop – 10%, Fdroop – 5%, H75 – Inertia Control Enabled with 75s Inertia Constant
As it can be observed from the time series (Figure 47), 10% voltage droop allowed reducing the magnitude of overvoltage by 1%. However, when combined with inertial response, the magnitude of overvoltage was higher, perhaps, due to voltage drop over the lines with relatively low X/R ratio. Inclusion of frequency droop did not seem to impact overvoltage magnitude.
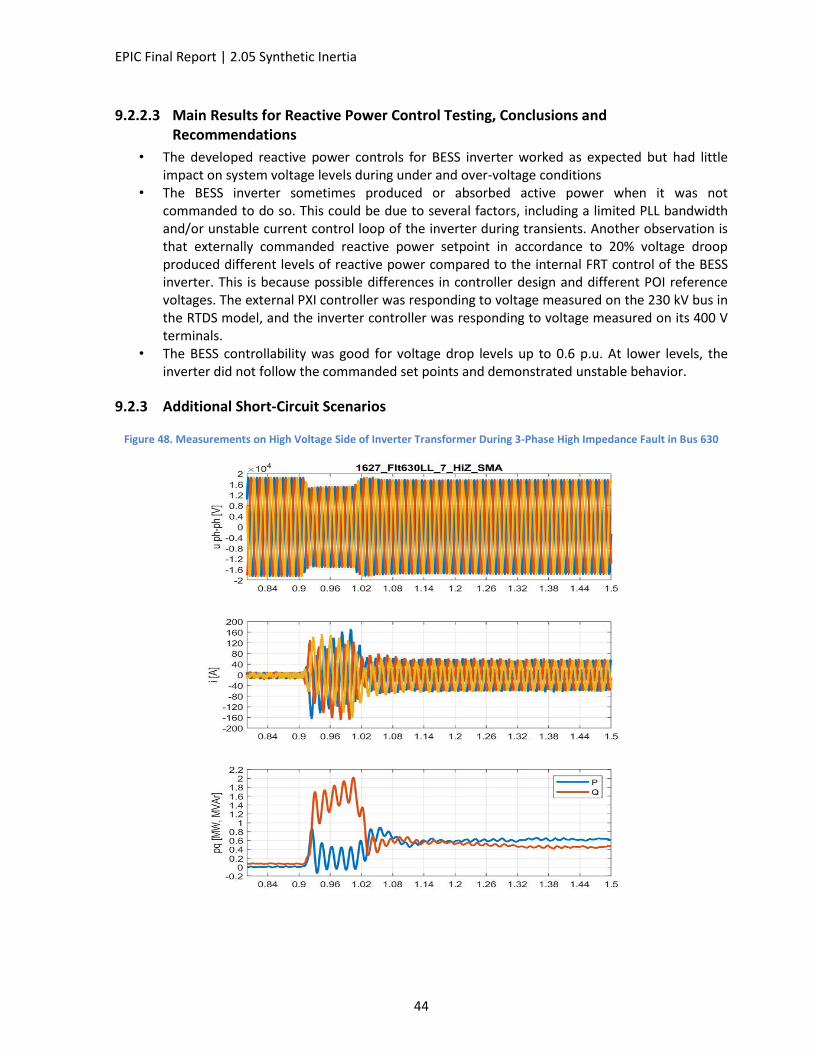
EPIC Final Report | 2.05 Synthetic Inertia
44
9.2.2.3 Main Results for Reactive Power Control Testing, Conclusions and Recommendations
• The developed reactive power controls for BESS inverter worked as expected but had little impact on system voltage levels during under and over-voltage conditions
• The BESS inverter sometimes produced or absorbed active power when it was not commanded to do so. This could be due to several factors, including a limited PLL bandwidth and/or unstable current control loop of the inverter during transients. Another observation is that externally commanded reactive power setpoint in accordance to 20% voltage droop produced different levels of reactive power compared to the internal FRT control of the BESS inverter. This is because possible differences in controller design and different POI reference voltages. The external PXI controller was responding to voltage measured on the 230 kV bus in the RTDS model, and the inverter controller was responding to voltage measured on its 400 V terminals.
• The BESS controllability was good for voltage drop levels up to 0.6 p.u. At lower levels, the inverter did not follow the commanded set points and demonstrated unstable behavior.
9.2.3 Additional Short-Circuit Scenarios
Figure 48. Measurements on High Voltage Side of Inverter Transformer During 3-Phase High Impedance Fault in Bus 630

EPIC Final Report | 2.05 Synthetic Inertia
45
Figure 49. Comparison of Measurements in Different Buses During 3-Phase High Impedance Fault in Bus 630

EPIC Final Report | 2.05 Synthetic Inertia
46
Figure 50. Measurements on High Voltage Side of Inverter Transformer During L-TO-L Low Impedance Fault in Bus 672 (Load Terminals)

EPIC Final Report | 2.05 Synthetic Inertia
47
Figure 51. Measurements on High Voltage Side of Inverter Transformer During L-to-G Low Impedance Fault in Bus 672 (Load Terminals)