overview and recommendations for the application of...
TRANSCRIPT

1
Overview and
recommendations for the application of digital PCR
European Network of GMO Laboratories (ENGL)
Pecoraro S., Berben G., Burns M.,
Corbisier P., De Giacomo M., De Loose M.,
Dagand E., Dobnik D., Eriksson R.,
Holst-Jensen A., Kagkli D. M., Kreysa J.,
Lievens A., Mäde D., Mazzara M.,
Paternò A., Peterseil V., Savini C.,
Sovová T., Sowa S., Spilsberg B.
2019
EUR 29673 EN

2
This publication is a Technical report by the Joint Research Centre (JRC), the European Commission’s science and knowledge service. It aims to provide evidence-based scientific support to the European policymaking process. The scientific output expressed does not imply a policy position of the European Commission. Neither the European Commission nor any person acting on behalf of the Commission is responsible for the use that
might be made of this publication.
Contact information
ENGL Secretariat
Food & Feed Compliance Unit (F.5)
European Commission - Joint Research Centre (JRC)
Health, Consumers and Reference Materials
Via Enrico Fermi 2749. TP 201
I-21027 Ispra (VA) Italy
E-mail: [email protected]
EU Science Hub
https://ec.europa.eu/jrc
JRC115736
EUR 29673 EN
PDF ISBN 978-92-76-00180-5 ISSN 1831-9424 doi:10.2760/192883
Print ISBN 978-92-76-00182-9 ISSN 1018-5593 doi:10.2760/31034
Luxembourg: Publications Office of the European Union, 2019
© European Union 2019
The reuse policy of the European Commission is implemented by Commission Decision 2011/833/EU of 12
December 2011 on the reuse of Commission documents (OJ L 330, 14.12.2011, p. 39). Reuse is authorised,
provided the source of the document is acknowledged and its original meaning or message is not distorted. The
European Commission shall not be liable for any consequence stemming from the reuse. For any use or
reproduction of photos or other material that is not owned by the EU, permission must be sought directly from
the copyright holders.
All content © European Union, 2019.
How to cite this report: Pecoraro S., Berben G., Burns M., Corbisier P., De Giacomo M., De Loose M., Dagand E., Dobnik D., Eriksson R., Holst-Jensen A., Kagkli D. M., Kreysa J., Lievens A., Mäde D., Mazzara M., Paternò A., Peterseil V., Savini C., Sovová T., Sowa S., Spilsberg B. Overview and recommendations for the application of digital PCR. EUR 29673 EN, Publications Office of the European Union, Luxembourg, 2019, ISBN 978-92-76-00180-5, doi:10.2760/192883, JRC 115736.

1
Contents
1. Executive summary ............................................................................................................................. 3
2. Working group overview ..................................................................................................................... 4
2.1 Working group establishment ................................................................................................... 4
2.2 Background ................................................................................................................................ 4
2.3 Mandate and tasks .................................................................................................................... 4
2.4 Scope ......................................................................................................................................... 5
3. Glossary ............................................................................................................................................... 5
4. Introduction and description of technologies ..................................................................................... 7
4.1 Introduction ................................................................................................................................... 7
4.1.1 Chamber-based methods ..................................................................................................... 10
4.1.2 Droplet-based methods ........................................................................................................ 10
4.2 Fields of application..................................................................................................................... 10
4.2.1 Application of dPCR in the field of GMO detection and quantification ............................... 10
4.2.2 Digital PCR applications for monitoring human disease states ............................................ 13
4.2.3 Digital PCR applications in the field of food virology ........................................................... 14
4.2.4 Digital PCR in the agricultural and environmental field ....................................................... 14
4.2.5 Digital PCR applications in the field of species identification .............................................. 15
4.2.6 Digital PCR applications in the field of microbiology ........................................................... 15
5. Technical aspects of digital PCR ........................................................................................................ 16
5.1 Theoretical basis of digital PCR ................................................................................................... 16
5.1.1 Statistics and assumptions ................................................................................................... 16
5.2 DNA extraction ............................................................................................................................ 18
5.2.1 Sample preparation .............................................................................................................. 18
5.2.2 DNA yield .............................................................................................................................. 18
5.2.3 DNA structural integrity ....................................................................................................... 18
5.2.4 Purity of DNA extracts .......................................................................................................... 19
5.2.5 Additional recommendations ............................................................................................... 19
5.3 PCR ............................................................................................................................................... 20
5.3.1 Master mix ............................................................................................................................ 20
5.3.2 Primers and probe concentrations ....................................................................................... 21
5.3.3 Temperature cycling program .............................................................................................. 22

2
5.3.4 The use of control samples................................................................................................... 25
5.3.5 Plasticware ........................................................................................................................... 25
5.3.6 Considerations for multiplexing ........................................................................................... 25
5.4 Results and performance requirements ..................................................................................... 27
5.4.1 Amplification product of a single target ............................................................................... 28
5.4.2 Amount of rain ..................................................................................................................... 29
5.4.3 Resolution ............................................................................................................................. 29
5.4.4 Target concentration ............................................................................................................ 30
5.4.5 Amount of sample compartmentalized ............................................................................... 31
5.4.6 Unit of measurement ........................................................................................................... 31
5.5 Data interpretation and reporting .............................................................................................. 32
5.5.1 Data interpretation ............................................................................................................... 32
5.6 Digital MIQE guidelines ............................................................................................................... 34
6. Costs and practicability of dPCR ........................................................................................................ 35
6.1 Instruments costs .................................................................................................................... 35
6.2 Consumables cost .................................................................................................................... 35
6.3 Practicability ............................................................................................................................ 36
6.4 In-house verification .................................................................................................................... 37
6.4.1 Specificity .............................................................................................................................. 37
6.4.2 Repeatability ......................................................................................................................... 38
6.4.3 Intermediate precision ......................................................................................................... 38
6.4.5 Trueness ............................................................................................................................... 39
6.4.6 Uncertainty estimation ......................................................................................................... 40
6.4.7 Limit of Detection (LOD), Limit of Quantification (LOQ) ...................................................... 41
6.4.8 Robustness ........................................................................................................................... 41
6.5 Accreditation ............................................................................................................................... 42
7. Bibliography ................................................................................................................................... 43
Annex ..................................................................................................................................................... 50
A. Application of dPCR in the field of GMO detection and quantification – explanations, notes
and examples ................................................................................................................................. 50
B. Technical part specific for the implementation of dPCR in a laboratory .................................. 53

3
1. Executive summary
The so-called digital Polymerase Chain Reaction (dPCR) is a relatively new technique for the detection
and quantification of DNA, but its application in analytical laboratories is steadily increasing. In
contrast to quantitative real-time PCR, DNA (fragments) can be quantified here without the need for
calibration curves. Using dPCR, the PCR mix containing the (target) DNA is partitioned – depending
on the device used – currently into a maximum of 10,000,000 small compartments with a volume as
low as a few picolitres. These can be either physically distinct compartments on a chip (referred to as
chamber-based digital PCR [cdPCR]), or the compartments correspond to water-in-oil droplets
(referred to as droplet digital [ddPCR]). Once the PCR has been carried out simultaneously in all
compartments/droplets, it is common to both approaches that the number of positive and negative
signals for each partition is counted by a fluorescence measurement.
With this technique, an absolute quantification of DNA copy numbers can be performed with high
precision and trueness, even for very low DNA copy numbers. Furthermore, dPCR is considered less
susceptible than qPCR to PCR inhibitory substances that could be co-extracted during DNA extraction
from different samples.
Digital PCR has already been applied in various fields, for example for the detection and
quantification of GMOs, species (animals, plants), human disease bioindicators, food viruses and
bacteria including pathogens.
When establishing dPCR in a laboratory, different aspects have to be considered. These include, but
are not limited to, the adjustment of the type of the PCR master mix used, optimised primer and
probe concentrations and the signal separation of positive and negative compartments. This
document addresses these and other aspects and provides recommendations for the transfer of
existing real-time PCR methods into a dPCR format.
4
2. Working group overview
2.1 Working group establishment
The Working Group (WG) on digital PCR was established based on a mandate adopted at the 28th
meeting of the ENGL (European Network of GMO Laboratories) Steering Committee on 11th February
2015. The WG was chaired by Sven Pecoraro, Bavarian Health and Food Safety Authority (LGL),
Oberschleissheim, Germany.
The other members of the Working Group were: Gilbert Berben, Walloon agricultural Research
Center (CRA-W), Belgium; Malcolm Burns, LGC, United Kingdom; Philippe Corbisier, European
Commission, Directorate-General Joint Research Centre (DG JRC), Belgium; Marzia De Giacomo,
Italian Institute of Health (ISS), Italy; Marc De Loose, Flanders research institute for agriculture,
fisheries and food (ILVO), Belgium; Emilie Dagand, Federal Office of Consumer Protection and Food
Safety (BVL), Germany; David Dobnik, National Institute of Biology (NIB), Slovenia; Ronnie Eriksson,
National Food Agency (NFA), Sweden; Arne Holst-Jensen, Norwegian Veterinary Institute (NVI),
Norway; Dafni-Maria Kagkli, European Commission, Directorate-General Joint Research Centre (DG
JRC), Italy; Joachim Kreysa, European Commission, Directorate-General Joint Research Centre (DG
JRC), Belgium; Antoon Lievens, European Commission, Directorate-General Joint Research Centre
(DG JRC), Belgium; Dietrich Mäde, State Institute for Consumer Protection Department of Food
Safety Saxony-Anhalt (LAV ST), Germany; Marco Mazzara, European Commission, Directorate-
General Joint Research Centre (DG JRC), Italy; Annalisa Paternò, Istituto Zooprofilattico Sperimentale
del Lazio e della Toscana- M. Aleandri (IZSLT), Italy; Verena Peterseil, Austrian Agency for Health and
Food Safety (AGES), Austria; Christian Savini, European Commission, Directorate-General Joint
Research Centre (DG JRC), Italy; Tereza Sovová, Crop Research Institute (CRI), Czech Republic;
Slawomir Sowa, Plant Breeding and Acclimatization Institute (IHAR) - National Research Institute,
Poland; Bjørn Spilsberg, Norwegian Veterinary Institute (NVI), Norway.
2.2 Background
Digital PCR (dPCR), in its different formats (chamber dPCR, droplet dPCR), is a rapidly evolving
technology in the area of DNA analysis. Digital PCR brings various advantages over traditional real-
time PCR, including the large number of parallel repetitions (from a few hundred to thousands per
sample), the potential to conduct absolute quantification without standard curves, and the reduced
sensitivity to PCR inhibitors affecting DNA analysis.
During 2014, the ENGL discussed the current application of dPCR to GMO analysis and identified that
the technology had the potential to advance DNA analysis applied in a regulatory context.
Advantages and disadvantages were identified during an ENGL discussion day where experts also
identified some issues to be resolved to facilitate routine application of dPCR for DNA analysis.
2.3 Mandate and tasks
As part of the mandate from the ENGL Steering Committee, the WG was asked to review the following issues, identify future needs and propose approaches to address these:
Transferability of existing real-time PCR methods into a dPCR format;
Accreditation (including in-house validation);
Applicability to difficult matrices;
Applicability to analytical areas other than GM food/feed;

5
Definition and assessment of relevant method performance criteria;
Multiplexing;
Summary of technical needs and requirements for implementing and applying dPCR.
As a result, the following document was elaborated, addressing the various issues discussed and
summarising relevant existing experience with dPCR, with the aim of helping laboratories to decide if
dPCR will meet their specific needs.
2.4 Scope
The scope of the document is two-fold: firstly, the potential of the dPCR technologies present on the
market and a comparison with real-time PCR are discussed. Furthermore, the different fields of
application of dPCR are reflected upon. Secondly, it addresses technical issues, which are of
relevance to laboratories using the dPCR technology or considering implementing it, and the scope
includes issues linked to the method verification and implementation process. In addition,
performance parameters relevant to the dPCR are discussed.
3. Glossary
- CB : confidence bounds - cdPCR : chamber digital PCR - CNV : copy number variation - ddPCR : droplet digital PCR - dMIQE : minimum information for publication of quantitative digital PCR experiments - DNA : deoxyribonucleic acid - dPCR : digital PCR - ENGL : European Network of GMO Laboratories - EURL GMFF : European Union Reference Laboratory for GM Food & Feed - GM event : a specific genetic modification (often used as synonym of GMO) - GM(O) : genetically modified (organism) - HGE : haploid genome equivalent - ISO : International Organization of Standardization - LC/MS : liquid chromatography/mass spectrometry - LOD : limit of detection - LOQ : limit of quantification - MPR : minimum performance requirements - MRPL : minimum required performance limit - NGS : next generation sequencing - PAL : precautionary allergen labelling - PCR : polymerase chain reaction - qMIQE : minimum information for publication of quantitative PCR experiments - qPCR : quantitative real-time PCR - RS : resolution of a digital assay - RSD : relative standard deviation - RSDr: repeatability standard deviation - RT-PCR : reverse transcription-polymerase chain reaction - UGM : unauthorised GMO - WG : working group - WG DIR : ENGL working group on 'Detection, Interpretation and Reporting on the presence of
authorised and unauthorised genetically modified materials'

6

7
4. Introduction and description of technologies
4.1 Introduction Methods for nucleic acid analysis that are already established and used on a routine basis include the
Polymerase Chain Reaction (PCR). PCR came into common use in the 1980s due to the availability of
the thermostable Taq DNA polymerase, and this allowed for unprecedented amplification and
detection of specific DNA sequences. The amplified DNA was often visualized by staining, for example
using ethidium bromide on an agarose gel, or by using capillary electrophoresis in a closed and
automated instrument. Whilst end-point PCR was a very useful and flexible tool for the detection of
specific DNA targets, its main limitation was its qualitative nature (limited to assessing presence or
absence but not quantification of the target).
Quantitative real-time PCR (qPCR) allows analysis of the kinetics of the amplification reaction
(Higuchi et al., 1992) through monitoring in real-time a fluorescent signal which is directly
proportional to the amount of DNA target sequence being generated during PCR amplification. The
signal is produced either by fluorescent probes (Rasmussen et al., 1998) or by fluorescent
intercalating reagents (Morrison et al., 1998). Quantification (i.e. determination of the amount of
target copies present expressed as an absolute number) can be achieved during the exponential
growth phase of the PCR, provided that an appropriate calibration curve based on standards of
known analyte concentration is included in the PCR setup. Relative quantification, i.e. change relative
to a reference, can also be achieved and does not require use of standard curves. Moreover, the
added selectivity and specificity attributed to the reaction by the presence of the probe makes qPCR
one of the most reliable methods and endorses it as the main method used for nucleic acid
identification and quantification.
Real-time PCR can suffer from a number of issues including:
Initial amplification cycles are assumed to be exponential but in practice this may not be the
case;
Low initial concentrations of nucleic acid molecules may not amplify to detectable levels due
to the presence of inhibitors; and
Quantification is relative to a calibration curve (PCR amplification efficiency in a sample of
interest may be different from that of reference samples due to matrix differences).
Some of these issues can be minimised or even mitigated entirely using digital PCR (dPCR).
Digital PCR is also based on PCR, but the main difference from qPCR is the fact that the reaction
volume is split over a high number of small partitions (from 500 up to millions) of a very small volume
(currently from 6 nanoliters down to a few picoliters). After the PCR, each partition is scored either as
positive or negative (binary or digital read-out). Statistical analysis of the results is then used to
determine the absolute quantity of target DNA in a sample. The approach was first developed in
1999 (Vogelstein and Kinzler, 1999) as a tool for cancer diagnostics, and the underlying principle is
well developed in the fields of chemistry and physics, as well as in microbiology where the related
most probable number (MPN) method is used to estimate the concentration of specific
microorganisms in a matrix (Oblinger and Koburger 1975).

8
In dPCR, the distribution of target DNA templates throughout the partitions is assumed to follow a
Poisson process. Based on counting the total number of positive and negative partitions and using
Poisson statistics, the absolute number of DNA copies in the original sample can therefore be
estimated (see 4. of this document for a more detailed statistical background).
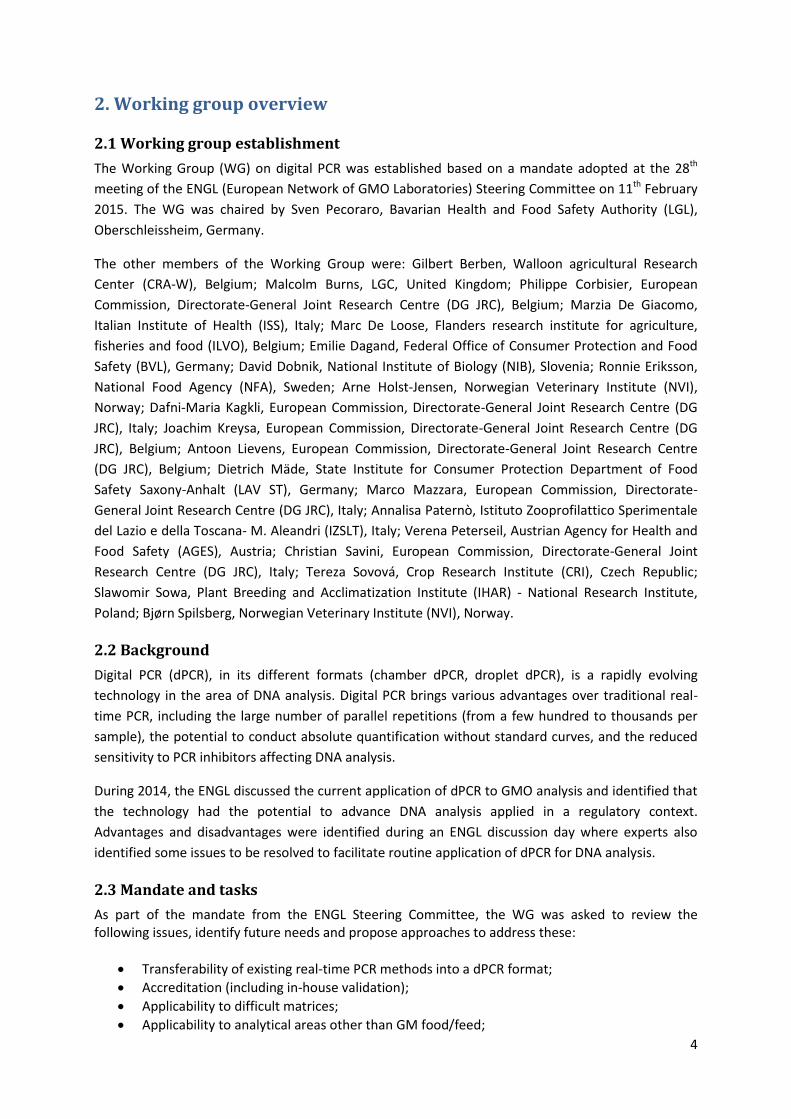
An example is illustrated in Figure 1. It should be stressed, however, that estimating the number of
targets based on a Poisson (or binomial) distribution is based on the following series of assumptions:
Target molecules are randomly distributed over the total number of partitions under analysis;
Presence of the target leads to a positive classification of the partition;
Absence of the target leads to a negative classification of the partition;
All partitions have the same volume;
For absolute quantification the volume of the partitions should be known precisely (as the correctness of the measurement depends also on the accuracy with which the partition volume has been determined)
9
Figure 1 : Examples of the results of dPCR runs. The top picture shows an example of the visual output on a Fluidigm dPCR
device (cdPCR). The plate (chip) contains 765 partitions, i.e. chambers, of which 208 are shown as positive. The bottom
diagram shows an example of the visual output on a Bio-Rad QX200 platform (ddPCR). The reaction contains up to 20,000
droplets, and positive droplets have a higher fluorescence than negative droplets (In the example shown, there are 14,534
droplets in total, of which 2,375 are positive).
Digital PCR possesses a number of advantages compared to conventional endpoint PCR and qPCR:
The major advantage of the dPCR method is that it permits absolute target quantification without reference to a calibration curve. As a consequence, any matrix differences between calibrant and test sample that may cause different PCR amplification efficiencies are minimised;
Because of the very high level of sample partitioning achieved (through the high number of individual partitions), dPCR can produce results with very high precision (Hindson et al., 2011);
Digital PCR may be ideally suited for the detection of minority targets in a high background of competing non-target DNA because in each partition containing the target, the ratio between target and non-target DNA is significantly higher than in the original sample;
Digital PCR amplification (and consequently the results) are less affected by partial inhibition (Rački et al., 2014b; Nixon et al., 2014; Iwobi et al. 2016).
There are a number of dPCR instruments currently on the market providing evidence of the
importance of this relatively new technology for quantitative molecular biology approaches. Digital
PCR instruments currently available include "closed" (Fluidigm BioMark, Formulatrix Constellation) or
"open" (Thermo Fisher Quant Studio 3D) chamber-based dPCR instruments (for details refer to Basu,
2017) and water-in-oil emulsion droplet-based digital PCR (ddPCR; e.g. Bio-Rad/Bio-Rad: QX,
RainDance: RainDrop, Stilla Technologies: Naica System). Future and next generation dPCR devices
may include centrifugal devices and sliding microarray devices.

10
Currently, there are two main approaches for conducting dPCR: chamber-based methods and
droplet-based methods.
4.1.1 Chamber-based methods
Chamber-based methods use pre-made solid-state partitions (chambers) into which the reaction
mixture is injected. As with qPCR 96-well plates, the chambers are non-reusable plastic consumables.
A dedicated thermal cycler allows the chambers to be cycled and read. The number and size of
chambers per device is fixed and thus highly consistent over runs. The number of partitions and
reactions per run is often lower than in droplet-based platforms.
4.1.2 Droplet-based methods
In ddPCR, the compartmentalization of the reaction mix is achieved by making a water-in-oil
emulsion prior to the PCR - generation of high numbers of droplets. The DNA targets in the emulsion
are amplified either in standard PCR wells, in strips or on plates and a dedicated reader measures the
end-point fluorescence of the droplets. The number of partitions varies between different platforms
and between individual reactions.
4.2 Fields of application Apart from the analysis of Genetically Modified Organisms (GMOs), dPCR has broad applicability
across a number of sectors. These include:
Food fraud and food authenticity testing in general (e.g. meat speciation and quantitation; Floren et al., 2015);
Prenatal diagnostics (e.g. aneuploidy and testing for Down’s syndrome; Evans et al., 2012);
Cancer diagnostics (trace detection for a minority target, where early detection means faster treatment and greater chance of successful recovery; Ma et al., 2013);
Viral and bacterial load measurements (important in monitoring and diagnosis of infectious diseases, for example influenza and Mycobacterium tuberculosis; Sedlak and Jerome, 2013; and
Testing for antimicrobial resistance and harmful micro-organisms (Whale et al., 2016b).
In the following paragraphs, we give a short overview of how dPCR can be applied in these fields.
4.2.1 Application of dPCR in the field of GMO detection and quantification
GMO detection and quantification – general considerations
For many plant species, e.g. maize, rapeseed, rice and soybean, there are multiple GM events. For
GMO detection and quantification, it is common to relate the GM target to a species specific
reference target. The reference target can serve multiple functions. The primary function of the
reference gene is to inform the analyst of the presence of a particular species (ingredient).
Furthermore, if quantified, it can:
Provide an estimate of the amount of species DNA that is extracted from the sample;
Provide data on the amount of the species DNA that is necessary if the analyst wishes to quantify the GMO content relative to the species;
Allow the analyst to determine the practical limit of detection (LOD) and the practical limit of quantification (LOQ) of GM events of the species in question in the sample.
With multiple GM events belonging to the same species, there are several approaches to cost-
efficient detection and quantification. Many of the GM events have been transformed using the

11
same or related genetic constructs resulting in identical or very similar sequences of the inserts of
these GMOs. This has been exploited in many routine laboratories applying the so-called element
screening (or the matrix approach) for GMO detection as discussed broadly in e.g. Holst-Jensen et al.
(2012). However, in some cases it may be necessary to help supplement this approach with
additional event-specific methods in order to facilitate full coverage of all authorised GM events for a
particular species. The results of the screening can be matched against a reference matrix (listing
presence/absence data for specific screening markers in all known GMOs). Correspondence between
the observed presence/absence patterns and the presence/absence patterns of specific GMOs in the
reference matrix suggest possible presence of the specific GMOs in the tested product. Absence of
signals for certain elements is indicative evidence of the absence of specific GMOs in the tested
products (at the LOD). This information can then be used to select more specific PCRs (construct and
event specific real-time PCRs) for identification and quantification. Element screening can be done
using real-time PCR or end-point PCR and may be multiplexed.
An alternative screening strategy would be to use (multiplex) event specific approaches. These can
be strictly qualitative or (semi-)quantitative. Published examples include both qPCR and dPCR
approaches (e.g. Querci et al., 2009; Kluga et al., 2011; Gerdes et al., 2012; Kim et al., 2010; Košir et
al., 2017a). The use, including both descriptions and recommendations, is discussed in further detail
in annex A. 1.
The use of qPCR for cost-efficient GMO detection is challenged by the large and increasing number of
GMOs on the market (including both authorized and un-authorized events). This is a problem
because firstly each quantification with qPCR requires a standard curve of high quality. Secondly, due
to the fact that in case of the detection and quantification of several GM-events per species (e.g.
soybean) all these quantitative analytical results (per GM-event) sometimes need to be added (e.g. in
order to evaluate correct food or feed labelling) and as a result the overall RSD (relative standard
deviation) is the combination of all RSDs (as root of summed squares). This can be a problem because
quantification is imprecise and difficult at near LOQ concentrations. Thirdly, PCR inhibitors co-
extracted with sample DNA can cause a problem because the inhibitors can result in other
amplification efficiencies than those observed for the standard curves, thus affecting the reliability of
quantitative data. Fortunately, dPCR offers solutions to all these three major challenges.
Application of dPCR in GMO detection
With minor modifications, any probe-based qPCR assay can be converted into a dPCR assay. Many
species-, element- and event-specific qPCR assays have been validated in a collaborative trial and are
in current use in GMO-laboratories around the world. The EURL GMFF is maintaining a database of
these qPCR assays (GMOMETHODS: EU Database of Reference Methods for GMO Analysis) and the
ENGL members have a long history and experience with their use and know their strengths and
weaknesses.
Notably, in contrast to qPCR, no standard curve is needed for dPCR in GMO quantification. This is
because absolute DNA copy quantification performed with dPCR is inherently quantitative. When
applied for one (or multiple) transgene(s) as well as for the reference gene (species specific), the
GMO quantity relative to the reference gene can be calculated. Furthermore, partitioning increases
the ratio of low concentration targets relative to non-target DNA. As a consequence, competitive
exclusion of low concentration targets by high concentration targets is thus generally not a problem

12
in dPCR. PCR inhibitors affect the amplification efficiency, but only exceptionally lead to complete
inhibition of the amplification reaction. For qPCR, however, partial inhibition would reduce
amplification efficiency and consequently delay the accumulation of fluorescent signal, leading to
underestimation of the target concentration. For dPCR partial inhibition is not a problem as long as
the presence of a template copy in a partition yields a positive amplification signal detectable at the
end-point.
Simplex dPCR for GMO detection
Most official quantitative detection methods published by the EURL GMFF are so far based on qPCR
with hydrolysis probes (European Reference Laboratory for GM Food & Feed Status of dossiers;
http://gmo-crl.jrc.ec.europa.eu/StatusOfDossiers.aspx). Several laboratories have tested the
potential of dPCR in a chamber-based (cdPCR) or in droplet-based (ddPCR) format for the analysis of
GMO. The ratio of absolute copy numbers of transgene per reference gene determined by cdPCR was
found to be identical to the ratio measured by real-time quantitative PCR (qPCR) using a plasmid DNA
calibrator. These results indicate that both methods could be applied to determine the copy number
ratio of MON810 maize (Corbisier et al., 2010). Well characterised certified reference material
bearing one copy of the transgenic target and one copy of the species reference target have been
used to verify several assumptions of dPCR, some of which relate to Poisson statistics. The
assumptions are (i) a large number of PCR reactions are analysed, as with most statistics a larger
number of replicates/partitions means more power to discriminate small differences (Pagano and
Gauvreau, 2000), (ii) random distribution of target DNA (Pinheiro et al., 2012), (iii) independent
segregation of target DNA (Bhat et al., 2009), (iv) that every partition containing one or more DNA
copies gives a signal and (v) that every molecule is double stranded DNA (Bhat et al. 2010). The
absolute LOD and LOQ of cdPCR for GM quantification has been reported (Burns et al., 2010) and the
applicability of ddPCR for routine analysis in food and feed samples has been demonstrated with the
quantification of GMO (Morisset et al., 2013). Finally, the contribution of several assay parameters
(singleplex/duplex ddPCR, assay volume, thermal cycler, probe manufacturer, oligonucleotide
concentration, annealing/elongation temperature and a droplet separation evaluation) have been
evaluated for the quantification of GMO by ddPCR (Gerdes et al., 2016).
The optimisation of DNA concentration in GMO quantification by dPCR around GM contents of 0.1 %
is recommended. Detailed explanations are provided in annex A. 2 to generally illustrate such
"lambda optimised approach".
Multiplexing of dPCR in GMO detection
While absolute quantification is often used (and needed) in other fields, GMOs are usually quantified
relative to a species. When GMOs are quantified, dPCR offers an approach that qPCR cannot provide.
For instance a duplex dPCR, where the species and the GMO of that same species are separately
detected, e.g. with two separate fluorescence, will potentially yield the relative GMO concentration
directly.
Many dPCR instruments currently available have two different fluorescent channels. Multiplexing
therefore is limited compared to qPCR devices with multiple (e.g. five) channels. Duplex dPCR
methods are conceptually similar to duplex qPCR methods and several methods to quantify one GM-
specific target and one reference gene have been published (Morriset et al., 2013; Gerdes et al.,
2016; Dalmira et al., 2016). A triplex assay can be achieved on a two channel (e.g. FAM/VIC)

13
instrument by labelling one probe with FAM, a second probe with VIC and for the third target a 1:1
mixture of FAM and VIC labelled probes (Pretto et al., 2015; Dobnik et al., 2016; Whale et al., 2016a).
By analysing single labelled and double labelled partitions the three targets can be distinguished in a
probe-mixing assay (Whale et al., 2016a; also refer to 4.3.6).
By using different concentrations of probes (i.e. 100 and 300 nM) two targets can be distinguished
based on absolute endpoint fluorescence read in the same channel (Dobnik et al., 2016), (4.3.6,
Figure 5). Four levels of fluorescence will be expected, negative, single positive for each target and
double positives. This strategy can be extended to analyse four targets in two channels using high
and low probe concentrations in each channel. This approach was applied using a method covering
seven maize events (MON863, MON810, DP98140, MIR604, GA21, MON89034 and MIR162) and a
maize reference gene (hmgA) in two assays. In a 2-D plot of fluorescence for two fluorescence
channels, a total of 16 clusters of partitions can be expected (4.3.6, Figure 6). (Note: For the sake of
quality assurance, this kind of analysis should be computerized and not performed on spreadsheets.)
Dobnik et al. (2016) developed a computer-script to do automated threshold setting and
quantification based on the various clusters.
The threshold for labelling of GM products in the EU (i.e. 0.9 % according to Regulation (EC) No
1829/2003) refers to the concentration(s) of EU authorized GMO(s) per ingredient (species).
Although not (yet) common in EU enforcement laboratories, this theoretically opens the possibility to
measure EU-authorized events of each single species together in one fluorescence channel and a
species-specific reference gene in another fluorescence channel. This approach of multiplexing of
dPCR in GMO analysis has successfully been demonstrated for EU-authorized GM maize (Dobnik et
al., 2015) and GM soybean (Košir et al., 2017a). The latter study also included all soybean events
falling under Regulation (EU) No. 619/2011 (at the time of publishing). Such methods will report the
sum of a set of events (e.g. all EU authorised events) from one species (without taking stacked events
into account). Alternative applications are also possible, e.g. by using dPCR multiplex for screening
purposes and by subsequently re-analysing (quantitatively) only such samples, estimated to contain
> 0.9 % GM material by singleplex or duplex dPCR (or qPCR) for the events detected.
The main advantage of duplex and multiplex dPCR assays are cost efficiency, due to the fact that
multiple standard curves are not needed. In addition, for assays where the GM target(s) and the
reference gene are analysed in the same partition (droplet or chamber), possible pipetting errors are
reduced when relative concentrations are calculated.
Additional notes regarding practical aspects of multiplex dPCR are given in annex A. 3.
4.2.2 Digital PCR applications for monitoring human disease states
Digital PCR is ideally suited for identification of minor amounts of DNA targets such as point
mutations, chromosomal translocations, DNA methylation and alternatively spliced mRNA. This has
found applications in areas such as cancer diagnostics, non-invasive prenatal diagnostics, and
assessment of microbial resistance. Additionally, dPCR can be used for the quantification of viral load
(Trypsteen et al., 2016; Sedlak and Jerome, 2013).
Digital PCR can also be used to measure and monitor copy number variations (CNV) which arise when
an individual has one or more deletions/duplications of a particular genomic region (Usher and
McCaroll, 2015) . CNV can occur naturally, but in humans, it can be used as an indication of disease
state, for example as in aneuploidy (e.g. Down's syndrome) and cancer diagnosis (e.g. HER2 tumour
14
cell amplification in breast cancer). Current methods for measuring CNV include karyotyping, use of
arrays, immunohistochemistry, PCR and Next Generation Sequencing (NGS). However, dPCR may
provide a more rapid method for identifying CNV compared to traditional methods. Digital PCR can
measure more accurately smaller fold changes than traditional qPCR, and therefore can be used for
prenatal screening and tumour screening applications, as well as detection of CNV in cell-free DNA.
Digital PCR is helpful for prenatal diagnostics without the need for invasive approaches, for example
by sampling cell-free foetal DNA from the maternal blood plasma (non-invasive prenatal testing,
NIPT) (Lo et al., 2007; Zimmermann et al., 2008; Fan et al., 2009).
4.2.3 Digital PCR applications in the field of food virology
Hepatitis A virus (HAV) and norovirus (NoV) are important agents of food-borne human viral
illnesses. No routine methods exist to culture these viruses from food matrices. Detection is
therefore reliant on molecular methods using the reverse transcription-polymerase chain reaction
(RT-PCR) followed by qPCR. Coudray-Meunier et al. (2015) published a comparative study of dPCR
and qPCR for quantification of Hepatitis A virus and Norovirus in lettuce and water samples. For
certain food matrices, e.g. bivalve shellfish, quantitative analysis is considered necessary for risk
analysis. Quantification of levels of virus RNA by conventional real-time RT-PCR has been described in
ISO 15216-1:2017. Due to the complexity of the method, it is necessary to include a comprehensive
suite of controls, which need to be quantified as well. In the ISO standard mentioned, dPCR can be
used as an option to quantify the nucleic acid control material.
The virus load of any sample can be estimated using dPCR. Preliminary data have shown that RT-PCR
inhibitors do not have the same severe impact on quantitative data in dPCR compared to
conventional real-time RT-PCR (Rački et al., 2014b). In principle, dPCR should allow quantification of
any virus. Determination of virus loads is a prerequisite to estimate the risk connected to a certain
food item and to verify the effectiveness of preventive measures, either at technological or at
epidemiological level. A possible field of application besides HAV and NoV could be the detection of
Hepatitis-E-virus in liver sausages, which is closely linked to food safety.
4.2.4 Digital PCR in the agricultural and environmental field
The fields of agricultural and environmental testing may be considered distinct but also share several
similarities and to some degree overlap. They typically include a broad range of target organisms and
complex matrices and the presence of inhibitory substances can be a great challenge (Strand et al.,
2011; Rački et al., 2014b). The quantification of plant and animal pathogens is gaining importance, as
regulatory bodies are shifting toward quantitative microbial risk assessments instead of mere
qualitative detection.
Real-time PCR is used for water monitoring and microbial source identification with faecal indicator
bacteria, plant, animal and human pathogens (Boben et al., 2007; Strand et al., 2011 and 2014;
Huang et al., 2016; Masago et al., 2016; Wang et al., 2016) and invasive species (Doi et al., 2015).
However, these assays are subject to bias introduced by reliance on quantitative standards, difficulty
in multiplexing and inhibition. Digital PCR has shown to reduce all these problems and has proven to
be appropriate in monitoring, faecal source identification and detection of pathogenic and invasive
species in water samples (Morisset et al., 2013; Rački et al., 2014a; Doi et al., 2015; Cao et al., 2015).
Plant material, soil, and wastewater are matrices known to have high levels of inhibitors that reduce
the likelihood of detecting and quantifying targets of interest (e.g. plant pathogens). Analyses with

15
dPCR have a higher resilience to inhibitors commonly found in such samples, in contrast to qPCR
(Rački et al., 2014b).
4.2.5 Digital PCR applications in the field of species identification
Identification of species, including plants, animals or microorganisms, is important in order to be able
to monitor food integrity and to detect food fraud. However, monitoring the compliance of the
relevant EU labelling legislation by demonstrating the presence or absence of a particular species or
products derived thereof, is also highly important. Species identification is important to define the
origin and traceability of raw materials and derived food products as well as to check for the
potential unintentional occurrence of other species (contamination). The most extensive use of
molecular techniques (genomic and proteomic techniques) is for determination of species and
botanical origin, while all other techniques are mostly dealing with adulteration and geographical
origin (Danezis et al., 2016). In some cases, such as food allergens, it is also a food safety issue (EU
Regulation 1169/2011). Finally in the context of protection of endangered species, detection and
identification of organisms is essential too (Staats et al., 2016 and references therein).
The adventitious presence of traces of species in the food supply chain often cannot be avoided
completely. For food allergens and endangered species, the presence of even minute quantities may
be unacceptable. Quantification based on determination of species DNA copy numbers is an
attractive approach to meet these needs. The application of dPCR in this evolving field will most likely
facilitate implementation of cost-effective and reliable analyses in the near future (Scollo et al.,
2016). In the context of food allergens, one should distinguish between
a) checking compliance with the legislation on the labelling of ingredients, and
b) checking the accidental presence/contamination of foods with allergens.
The latter, precautionary allergen labelling principle (PAL), is voluntary and currently not required by
any legal act in the EU (at the time of publication). Digital PCR might be a very interesting tool for
checking for compliance of product composition with its corresponding ingredient list and for
searching for other, potentially unintended components. Conversion factors are needed in order to
be able to compare such results with results obtained by analytical methods detecting other target
molecules. The use of dPCR to checking for accidental presence of food allergens should probably be
implemented primarily as a screening tool that needs to be complemented with LC/MS methods.
4.2.6 Digital PCR applications in the field of microbiology
In Europe, thermophilic Campylobacter are one of the major bacterial food pathogens (EFSA & ECDC
2015). Hygienic measures in the whole food chain, starting at primary production, are considered as
the most effective tool to fight campylobacteriosis. Risk assessment in slaughterhouses is based on
Campylobacter quantification by conventional microbiology. This methodology, however, is prone to
underestimation of the infectious bacterial contamination because “viable but non cultivable”
Campylobacter are not detected. This problem also affects several other foodborne pathogens.
Qualitative molecular methods are available and standardized (ISO/TS 13136:2012; ISO/TS
18867:2015). The application of dPCR may provide a step towards quantification in this important
field.
Several food-borne bacterial pathogens such as Bacillus cereus, Staphylococcus aureus, and
Clostridium perfringens owe their pathogenicity to the production of toxins after multiplication.
Several toxigenic fungi such as Aspergillus, Fusarium and Penicillium spp. also affect food safety. As

16
the detection of toxins in food can be cumbersome in routine testing, an attractive alternative is the
use of microbial counts as rough estimates for the food safety. The microbial counts, however, are
not strictly related to toxin production. Not all strains are toxigenic, and the toxin production can also
vary among strains and with environmental conditions. Some toxins produced by foodborne
pathogens (bacteria and fungi) can be persistent to processing methods like heating, irradiation or
high pressure that kill the microorganisms (e.g. trichothecene mycotoxins produced by Fusarium
spp., enterotoxins produced by Staphylococcus aureus, and emetic toxin produced by Bacillus cereus;
Stenfors Arnesen et al., 2008; Pinchuk et al., 2010; Hennekinne et al., 2012; EMAN, 2015). Thus, the
toxins may be present also in the absence of viable pathogens. DNA is also relatively persistent to
such treatment. Thus, DNA based detection/quantification may be very useful to assess the potential
presence of toxins. The advantages listed above for dPCR compared to qPCR suggest that dPCR may
also prove superior to qPCR for the enumeration of foodborne pathogens.
In microbiology, dPCR has been applied ‒ besides bacteria, viruses and fungi ‒ to parasite analysis,
e.g. for the sensitive detection and identification of parasites from human blood (Wilson et al., 2015).
5. Technical aspects of digital PCR This part of the document goes into more detail on each technical aspect of dPCR, giving background
and guidelines on each facet of the GMO analytical chain. Extra attention is devoted to differences
from the standard qPCR approach.
This part of the document is subdivided into six modules, each representing a step in the analytical
process from sample preparation and analysis to results generation and their interpretation. The six
sections are:
1. Theoretical basis of dPCR; 2. DNA extraction; 3. PCR; 4. Results and performance requirements; 5. Data interpretation and reporting; 6. MIQE guidelines for publishing dPCR data.
5.1 Theoretical basis of digital PCR
5.1.1 Statistics and assumptions
Central to the analysis of dPCR is the Poisson distribution, a discrete probability distribution that
expresses the probability of a given number of events1 occurring in a fixed interval of time or space. It
assumes that these events occur with a (fixed) average rate and independently of time since the last
event. The Poisson distribution is given by:
𝑃(𝑘) = (𝑒−) ∗
𝑘
𝑘!
(1)
1 Event is a statistical term and does not refer to GM event in this paragraph

17
Where 𝑃(𝑘) is the probability to observe exactly 𝑘 targets (e.g. molecules), is the average number
of events per interval and 𝑘 is the actual number of events. In the context of dPCR, the event is
"presence of the target sequence" and is the average number of targets per partition.
Analysis of dPCR results is based on the assumption that the distribution of the target sequence over
the partitions is a nearly perfect Poisson process. Let ntot be the total number of partitions for which
we have a read-out and nneg the number of negative partitions, we then estimate p0 (probability of an
empty partition) and (the average number of targets per partition) as:
𝑝0 =𝑛𝑛𝑒𝑔
𝑛𝑡𝑜𝑡 (2)
= −ln 𝑝0 (3)
The ratio of GMO in the sample (in haploid genome equivalents) is then given by
𝑅𝑎𝑡𝑖𝑜 = 𝑡𝑟
𝑒𝑛 (4)
Where tr and en are the concentration estimates for the transgene and endogene, respectively.
Note that calculating the GM ratio does not require the droplet volume to be known, it is however
assumed to be constant. This assumption, however, is not absolutely correct (Dong et al., 2015).
Variability in the droplet volume will increase the quantification uncertainty. Most manufacturers
have taken precautions to keep this variability within strict limits (e.g. excessively large or small
droplets may be removed from analysis). The 95 % confidence bounds (CB) can be calculated for each
of the individual estimates:
𝑒𝑛, 𝐶𝐵 = 𝑒𝑛 ± 1.96 √𝑛𝑡𝑜𝑡 − 𝑛𝑛𝑒𝑔
𝑛𝑡𝑜𝑡 ∗ 𝑛𝑛𝑒𝑔 (5)
𝑡𝑟, 𝐶𝐵 = 𝑡𝑟 ± 1.96 √𝑛𝑡𝑜𝑡 − 𝑛𝑛𝑒𝑔
𝑛𝑡𝑜𝑡 ∗ 𝑛𝑡𝑛𝑒𝑔 (6)
Whereas the CB for the ratio of transgene to endogene is obtained using Fieller´s theorem:
𝑅𝑎𝑡𝑖𝑜𝐶𝐵 = 𝑡𝑟 𝑒𝑛 ± √𝑡𝑟
2 𝑒𝑛2 − (𝐸2 − 𝑒𝑛
2 )(𝑇2 − 𝑡𝑟2 )
𝑡𝑟2 − 𝑇2
(7)
Where
𝐸 = |𝑒𝑛 − 𝑒𝑛, 𝐶𝐵| (8) and 𝑇 = |𝑡𝑟 − 𝑡𝑟, 𝐶𝐵| (9)
with CB being the relevant confidence bound (upper or lower). Where 𝐸 is the absolute difference
between the concentrates estimates of the endogenous target and the confidence bound associated
to that estimation and 𝑇 is the absolute difference between the concentrate estimates of the
transgenic target and the confidence bound associated to that estimation.

18
As an alternative to Fieller’s theorem, an ad hoc confidence interval can be used (ratio ± 1.96 ∗
standard deviation of the ratio). Such a confidence interval is more straightforward to calculate and
has been shown to have 95 % coverage when a sufficient number or repeats is used to obtain the
standard deviation of the ratio (e.g. four repeats: two subsamples analysed in duplicate; see Lievens
et al., 2016).
5.2 DNA extraction Methodologies for investigating the quality of the extracted DNA to be analysed in qPCR have been
extensively described. Related acceptance criteria have been elaborated with particular focus on
applications for GMO detection (Marchesi et al., 2015). The number of references about this topic in
relation to dPCR is still limited, but some experimental evidence indicate that dPCR is less sensitive to
PCR inhibition compared to qPCR (Nixon et al., 2014; Rački et al., 2014b; Iwobi et al., 2016). As target
concentration in dPCR is calculated from endpoint positive and negative reactions, one can assume
that partial PCR inhibition will have less impact on quantification. Generally, the same DNA quality
requirements should be applied to dPCR analysis as for qPCR analysis.
There are many methods for extraction of DNA that will yield high quality DNA, i.e. non-degraded
and free of excess salts, proteins or polysaccharides (e.g. Murray and Thompson, 1980; Sambrook
and Russel, 2001). In addition, DNA quality also depends on sample processing that affects structural
integrity and physical-chemical purity of the extracted DNA.
5.2.1 Sample preparation
Concerning sample preparation there are no specific requirements for dPCR, one can therefore refer
to the document developed within the ENGL: Guidelines for sample preparation procedures in GMO
analysis (Berben et al., 2014).
5.2.2 DNA yield
Regarding the quantity and concentration of extracted DNA, no special requirements are
recommended for dPCR. The yield should be at least as much as is required for the subsequent PCR
analyses (Marchesi et al., 2015).
5.2.3 DNA structural integrity
With regard to structural integrity, considering that the amplicon length of dPCR systems is identical
to their qPCR counterparts, the effects of DNA fragmentation are expected to be the same for all PCR
systems.
Under certain circumstances, it may be necessary to perform a restriction digest of the DNA before
partitioning in droplets or chambers to improve the accuracy of the measurement for the following
reasons:
a) Decreasing the viscosity of the DNA solution;
Hindson et al. (2011) reported changes of droplet volume and possible decrease of accuracy of
measurement when using more than 66 ng DNA (human genomic DNA) in a 20 µL ddPCR due to
increased viscosity of the DNA solution. By restriction digest this viscosity could be reduced and even
much higher DNA concentrations (1 µg) could be used in ddPCR without affecting the droplet

19
volume. BioRad recommends restriction digestion whenever DNA input is greater than 66 ng per 20
µL reaction (Kaihara et al., 2016).
b) Separation of linked gene copies;
If the DNA molecules contain linked gene copies (e.g. tandem gene copies) one positive droplet or
partition will contain multiple copies (e.g. two linked copies will be counted as one copy). This can be
overcome by restriction digest which leads to a physical separation of such gene copies (BioRad
Bulletin 6277 Rev A, 2012) and thus enables independent segregation.
c) Improving the accessibility of the DNA when working with supercoiled plasmids;
By linearisation of plasmid DNA by restriction digest the accessibility (and thus the efficiency of
primer/probe binding to the DNA) can be improved, leading to more accurate quantification of the
plasmid (Kaihara et al., 2016);
If a restriction digest of DNA is performed prior to dPCR there are three considerations that should
be taken into account in the choice of enzyme for a particular locus:
(1) The enzyme should not cut within the PCR amplicon sequence itself;
(2) It is best to use an enzyme that is insensitive to methylation to avoid incomplete
fragmentation due to methylation of the target DNA; and
(3) In some instances, it is optimal to digest the target copy to the smallest size fragment that
fully contains the amplicon footprint [sequence] – preferable under a few hundred base pairs
(BioRad Bulletin 6277 Rev A, 2012).
Often restriction enzymes with 4-base and 6-base recognition sites are used.
However based on practical experience restriction digest of DNA is not mandatory and should be
considered on a case-by-case decision (Jacchia et al., 2018).
Note: Random shearing (fragmentation) of the DNA by sonication and a column-based method has
been reported to improve the accuracy of measurement in analysing mitochondrial DNA (Vitomirov
et al., 2017).
5.2.4 Purity of DNA extracts
With regard to physical-chemical purity of the DNA extract, PCR (and in particular qPCR) is known to
be susceptible to inhibition due to the possible presence of impurities in the extracted DNA (Huggett
et al., 2008; Kennedy and Oswald, 2011). Notwithstanding the still limited experience, dPCR is
demonstrated to be less prone to inhibition (Nixon et al., 2014; Rački et al.; 2014b; Iwobi et al.,
2016). Until there is sufficient evidence to conclude otherwise, acceptance criteria already set for
qPCR are considered valid also for dPCR.
5.2.5 Additional recommendations
Some methods for DNA extraction might interfere with droplet generation. The impact of the
extraction method on downstream workflow should therefore be evaluated once in the process of
implementing dPCR in a laboratory. This can be done by extracting a) a certified reference material,
and b) a food sample, with the standard DNA extraction methods applied in a specific laboratory.

20
Two DNA dilutions should be tested each for a) and b). The droplet plots between DNA extraction
methods should be compared in terms of signal (positive and negative droplets) separation and
signal intensity. If an extraction method shows significantly deviating (poor) performance compared
to others, then this method should not be used for extraction of DNA for dPCR.
Another important consideration is whether the DNA subjected to analysis is double or (partially)
single stranded when partitioned. The different strands of fully denatured molecules may be divided
over different partitions, leading to two positives for a single (double stranded) target copy. As a
consequence, if a significant portion of the sample DNA is denatured, the amount of target will be
overestimated if the user assumes that only double-stranded DNA is quantified. This effect can occur,
when DNA is exposed to sustained elevated temperatures or alkaline solution which therefore should
be considered and avoided when designing dPCR experiments for absolute quantification of DNA
copy numbers (Bhat et al., 2011).
The options are to either validate the method that produces 100 % of single stranded DNA and then
apply a 2-fold factor to concentration calculations or to validate a method that produces 100 % of
double stranded DNA (Holden et al., 2009 )
Another important assumption is that the DNA target molecules segregate independently. If the DNA
molecules are concatemers or physically bound to each other, one positive droplet or partition would
contain multiple copies (e.g. two linked copies will be counted as one copy).
5.3 PCR The set-up of a dPCR follows very closely the assembly of a qPCR. The reaction ingredients include:
template nucleic acid, forward and reverse primers, a hydrolysis probe (e.g. TaqMan, not included for
detection strategies using intercalating dye), sterile nuclease-free water to adjust the reaction
volume, and the master mix. The latter includes the reaction buffer, bivalent cations, nucleotides,
and a DNA polymerase (plus the DNA intercalating dye e.g. SYBR® Green or EvaGreen if this
detection strategy is selected). In addition, technical additives may be included, depending on the
master mix and the digital PCR format.
The main difference from qPCR is the step of partitioning the reaction mix into a large number of
chambers or droplets which typically occurs shortly before the amplification itself.
5.3.1 Master mix
In cdPCR, a loading reagent is added to the reaction mix to facilitate the microfluidics of the
partitioning. In droplet-based systems, specific surfactants are often included in the master mix in
order to add stability to the droplets and to minimize coalescence once they are formed.
As a consequence, proprietary master mixes associated with specific platforms are commonly used
for dPCR and the use of other non-proprietary master mixes is not recommended by the instrument
manufacturers. However, a few instrument platforms (e.g. Constellation, Naica, and Raindance
systems) are not bound to the use of dedicated master mixes. At least for Constellation, the master
mix used should contain ROX dye.
The JRC method database (GMOMETHODS) contains protocol information for more than a hundred
validated GMO assays. The large majority of these make use of some type of commercial master mix
optimized for qPCR. Protocols already validated for qPCR may need to be amended when used with
another master mix.

21
Commercial master mixes may include non-declared components that can yield false positives. For
example, the presence of bovine serum albumin (BSA) may yield positive signals for a dPCR targeting
bovine. Special attention should therefore always be given to unexpected results for negative
controls when modifying a qPCR protocol for dPCR application.
In the case of GMO methods, this can be done by evaluating the specificity of the detection method
for the taxon and for the GM target, taking into account the following aspects:
Composition of the master mix. While the exact composition of master mixes is generally not
known, the concentrations of the key components is usually stated (MgCl2, dNTPs, polymerase,
buffer). If their concentrations are comparable (within 10 % variation) with the conditions of the
validated conditions (master mix), then the reassessment of specificity is not required. Otherwise, an
experimental check on selected targets is recommended (Onori et al., in preparation). It is advisable
to select and check those targets, which have the most sequence similarities (primer and probe
sequences) compared to the method to be implemented. This can be done by bioinformatic analyses
using e.g. the molecular database CCSIS (Central Core DNA Sequence Information System) of the
EURL GMFF or one of the NCBI databases (National Center for Biotechnology Information).
5.3.2 Primers and probe concentrations
For the design and selection of primers and probes, one should use the same rules as for qPCR assays
(in terms of target-matching, base composition, length, melting temperature, absence of secondary
structures and self- and inter-complementarity and specificity (Degen et al., 2006) ). However,
primers and probe concentrations in dPCR are usually higher than in qPCR. Higher primer and probe
concentrations increase the intensity of the end-point fluorescence signal and thus allow better
separation of the background noise from specific signals, aiding more accurate quantification of the
target. Tests carried out in ddPCR (BioRad QX200) on twelve assays validated by the EURL GMFF in
qPCR have shown that the best results were obtained when the final concentration of primers were
set around 500 nM per reaction while keeping the primer:probe ratio the same as the validated
qPCR conditions (Lievens et al., 2016).
Manufacturers may recommend certain combinations of reporter and quencher. For instance, in the
Bio-Rad QX200 ddPCR system, it is recommended to NOT use TAMRA as a quencher as its emission
overlaps with the emission of HEX (or VIC®), resulting in additional background signals in the second
fluorescence channel. This deteriorates cluster separation and peak resolution. Instead, the use of
non-fluorescent quenchers is recommended. Nevertheless, this relates not only to dPCR but can be
considered as a general recommendation as TAMRA contributes to an overall increase in
fluorescence background. Changing the fluorescent dye or quencher during the transfer from qPCR
to dPCR should generally not have any effect on the performance, thus additional validation is not
needed, unless the change affects the annealing temperature of the probe (e.g. MGB probes). In such
case additional optimisation and validation are necessary.
For the transfer of existing qPCR methods into a dPCR format, it is recommended to initially use the
concentrations from the validated qPCR method, and to run a primer/probe concentration gradient if
it is deemed necessary to improve the end-point fluorescence values of the positive partitions.

22
Primer and/or probe concentrations. If primer/probe concentrations are (substantially) changed,
additional performance parameters should be experimentally assessed (e.g. specificity and trueness,
Hougs et al., 2017).
Primer and/or probe sequence. In case of changing of primer/probe sequence, a full validation of
such a new method is needed. For method performance parameters, see e.g. Marchesi et al., 2015
5.3.3 Temperature cycling program
In general, the temperature profile used in qPCR can be directly applied to dPCR. However, one
should always check the manufacturer's recommendations for specific requirements. For example, in
droplet-based systems, a final step at higher temperature (e.g. 98 °C, 10 min for the Bio-Rad
QX100/200 ddPCR systems) may be mandatory to further stabilize the droplets prior to reading
them. There may also be recommendations concerning the ramping rate to ensure uniform heating
of the partitions (droplet or chamber).
It is also advisable to run a minimum of 45 amplification cycles, in order to have sufficient separation
between positive signals and background noise. An example is illustrated in Figure 2.
a)

23
b)
Figure 2: Signal separation in cdPCR for MON 810 (Primers 300 nM, Probe 180 nM) performed with QuantStudio™ 3D
Digital PCR System either run with 39 (a) or 45 (b) PCR cycles.
Annealing temperature. The annealing temperature contributes to the specificity of PCR reactions,
and it should ideally be maintained in line with that of validated methods. However, in the case of co-
amplification of a secondary target (multiple clouds of positive droplets) one can increase the
annealing temperature in order to have sufficient separation between positive signals and
background noise (Figure 3). If the deviation in temperature falls within the robustness range
[assessed for the validated method], there is no (general) need for specificity testing. Nevertheless
the specificity should be tested with a method whose annealing temperature is decreased. If the
annealing temperature of a method is increased, it is not necessary to test the specificity because the
new conditions are more stringent for primer annealing (Onori et al.; in preparation).
Possible effects of different annealing temperatures on signal (positives) to background (negatives) separation is illustrated in Example 2, Figure 4.
Example 1: Acp1 co-amplification of a secondary target
Figure 3 below shows an annealing temperature gradient experiment with the same amplification
system acp1 – acyl carrier protein, specific to cotton. This gene is present in two almost identical
copies in cotton. One target has a perfect match to the designed PCR method while the other one
contains four SNPs. The dPCR was run at temperatures ranging from 62 °C to 56 °C. While at the
highest annealing temperature, the acp1 cloud is visible (blue dots, where each dot represents the
fluorescent signal of one droplet) in addition to the background fluorescence (grey dots), at
decreasing annealing temperatures a second cluster of positive droplets (grey dots above the Ch1
amplitude of 3,000) stems from the co-amplification of the closely related gene at lower efficiency.
As the annealing temperature lowers, its fluorescence gradually increases and gets closer to the acp1
specific cluster of droplets. The highly stringent annealing temperature conditions at which the
reaction was run at 62 °C impeded the amplification of the secondary target.

24
Figure 3 . Annealing temperature gradient of the cotton-specific acp1 amplification system in ddPCR. As the annealing
temperature is raised the specificity of the reaction increases and efficiency of the co-amplification is reduced, until the
undesired droplet population merges with the negative population.
Example 2: Temperature dependent signal separation of a lectin and MON 87769 soy-specific duplex ddPCR
Figure 4 below shows an annealing temperature gradient experiment – using a 100 % MON 87769 soy certified reference material – with a lectin and MON 87769 soy-specific duplex ddPCR, run at temperatures ranging from 66 °C to 56.3 °C. With decreasing annealing temperature, signal separation (positives and negatives for both lectin and MON 87769 reaction) increases to finally reach a maximum separation plateau. This increased separation reflects a more efficient primer and probe binding to the target DNA. Even at temperatures significantly below the validated 60 °C annealing temperature, no unspecific signal populations are observed. a) Lectin specific reaction:

25
b) MON 87769 specific reaction:
Figure 4 . Annealing temperature gradient of the lectin (a) and MON 87769 (b) soy-specific amplification system run in
duplex ddPCR with a 100 % MON 87769 soy certified reference material. Purple numbers reflect calculated DNA copy
numbers per microliter PCR reaction. Purple lines represent the threshold set for separating positive from negative droplet
populations.
5.3.4 The use of control samples
Although quantification with dPCR is not dependent upon the generation of a calibration curve for
results interpretation, it still requires the use of appropriate positive controls to provide evidence
that the experiment has worked correctly. In addition, negative controls should always be used in a
dPCR experiment to test for false positives. The use of control samples is essential for dPCR to
control the appearance of the above-mentioned effects. In the case of routine GMO quantification,
as for the qPCR, the controls described in ISO 24276 should also be used in dPCR. When an assay is
being transferred from qPCR to dPCR, additional control samples should be used (e.g. certified
reference material or samples with known GM content), enabling a direct evaluation of dPCR
performance.
5.3.5 Plasticware
It appears that the brand of the plasticware and especially that of the tips can be of importance to
reach good results. Due to the nature of the instruments, reactions should be set up in plasticware
appropriate for use with digital PCR instruments according to the manufacturer´s recommendations.
5.3.6 Considerations for multiplexing
Multiplexing allows for simultaneous identification and quantification of more than one target in a
single reaction. The majority of dPCR systems currently on the market can detect fluorescence in two
colour channels, FAM and HEX (VIC®), and some have an option of detecting a third fluorophore.
Duplex reactions can easily be implemented; fluorophore-specific signal is acquired through either
channel, computed by the software algorithm and graphically represented in a two-axis plot of FAM
and HEX amplitude.
Although the availability of only two-colour channels (FAM and HEX) limits the choice of the
reporters for TaqMan probes, more complex levels of multiplexing can be attained in dPCR by

26
labelling two or more probes, belonging to different target-specific assays, with the same reporter
and varying the concentration of the probes (see Figures 5 and 6 for examples; also see Whale et al.,
2016a). This results in a spatial separation of the respective clusters of amplified targets on the basis
of their florescence level. Identification of the clusters with their specific assays is established in
simplex reactions during the optimisation stage of the test where the positioning of each cluster with
the adjusted probe concentration can be easily identified in the two-dimensional plot. It is possible to
successfully combine dPCR assays into multiplex assays if different reporter fluorophores (e.g. FAM
and HEX) and probe concentrations are used for different targets. This, however, requires careful
optimisation, and the complexity increases exponentially with the number of included targets.
Separating the different targets into clearly identifiable clusters is necessary for reliable identification
and quantification. Such multiplexing is theoretically possible with any dPCR format, but has so far
only been demonstrated with ddPCR (time of publication).
Figure 5: Example of duplex droplet readout in one fluorescence channel for three wells (one well for sample NTC and two
wells for sample MON863 maize). Both probes (for hmgA and MON863) were labelled with the same fluorophore (FAM),
but in the reaction mixture for hmgA the concentration was 100 nM for the probe and 300 nM for the primers (low),
whereas for MON863 the concentration was 300 nM for the probe and 900 nM for the primers (high). In the 1D amplitude
view, the positive droplets for the low primer/probe concentration target (hmgA) appear as cluster just above the negative
one. The next cluster (above the hmgA cluster) are droplets positive for the high primer/probe concentration target
MON863, whereas the topmost cluster are droplets positive for both of the targets. To achieve the best possible separation
optimization of primer and probe concentrations is needed (Dobnik et al., 2016).

27
Figure 6: Graphical representation of possible target combinations in droplet clusters and their area of appearance in the 2-
D amplitude view. When primer and probe concentrations have been optimized for the best separation of clusters in
individual channels, the assays may be combined to achieve the highest level of multiplexing (4-plex). In case of four targets
(A, B, C and D), theoretically there are sixteen different possible clusters where the different combinations of targets might
appear after readout. Presence or absence of the clusters depends on the ratio of targets in the sample and their initial
concentration (Dobnik et al., 2016).
The Regulation (EC) No 1829/2003 specifies that quantification of GM material shall be based on the
concentration per ingredient (not per event). In practise, the ingredient is interpreted as species.
Consequently, for the EU-authorised GMOs testing for legal compliance can be done although not
common practice in EU enforcement laboratories using duplex (multiplex) quantification where the
species specific reference gene is quantified in one channel and the authorised GMOs belonging to
that same species are quantified simultaneously in the other channel, as exemplified for maize
(Dobnik et al., 2015) and soybean (Košir et al., 2017a).
5.4 Results and performance requirements Digital PCR is still only a PCR in a different format; thus all of the pre-written minimum performance
requirements (MPRs) (Marchesi et al., 2015) also apply in this field, with the exception of
amplification efficiency that is not as important because dPCR is an end-point reaction. Digital PCR
assays must therefore be compliant where appropriate with these MPRs in order to be suitable
as a method for quantification of GMOs. They should be valid not only for GMO detection methods,
but for all applications of dPCR as they are technical criteria in order to ensure that the method
works properly before proceeding towards determination of parameters such as LOD.
Nevertheless, dPCR has some of its own specific issues which require setting some additional
performance requirements, which must be fulfilled before proceeding to validation. If the PCR assay
is specific and efficient, the main source of error in digital quantification is caused by the
misclassification of partitions. To allow accurate classification of partitions and thus reliable
quantification the method should meet acceptance levels within several criteria associated with the
following simplex dPCR results: (I) single amplification product (there should only be two
fluorescence populations), (II) peak resolution (as a measure of the separation between positives and
negatives), and (III) the amount of stragglers or 'rain' (i.e. droplets that have an intermediate
fluorescence and do not seem to belong to either the positive or negative population). Two further

28
criteria that apply to each reaction (post run evaluation) are: (IV) target concentration and (V)
fraction of sample compartmentalized. In the following sections, we will define these specific criteria
and set their limits, most of which are based on the qPCR MPR stating that the relative error should
be below or equal to 25 %.
In the course of method validation for the measurement of the dPCR-specific performance (e.g.
resolution, amount of rain), it is recommended to select a target concentration, which would give the
λ value around 0.7. This corresponds to a situation in which approximately half of the partitions are
positive and thus allows gauging both the rain and the dispersion of the droplets without being
biased by the fact that one population is larger than the other.
Classification of partitions as positive or negative is based on the threshold, which should be set just
above the cluster of negative partitions. NTC sample, with only negative partitions, can help in
setting the threshold, however, an inspection of all wells/panels is recommended. Fluorescence
amplitude of individual wells/panels might be slightly higher or lower than NTCs, thus in such cases
the threshold can be adjusted individually to avoid misclassification of some droplets.
A reaction is considered positive, when the number of positive partitions exceeds 2. There is no clear
consensus on this value, however, this proposed value was determined based on experiments with a
statistically significant replication level negative samples (0 % GM Material and NTCs, Dobnik et al.,
2015) and corresponds to the theoretical limit of detection of PCR.
5.4.1 Amplification product of a single target
In a qPCR reaction, the fluorescence measured is the sum of all amplification processes in the
reaction mixture. It is therefore impossible to distinguish between different amplification products
arising from the same primer probe combinations in the same reaction (e.g. the amplification of
closely related sequences). In dPCR, the compartmentalisation allows such a distinction. Unintended
amplification products (i.e. non-perfect match) usually amplify at a lower efficiency. This results in an
endpoint fluorescence that is lower than for the actual target (after a standard run of 45 cycles). As a
consequence, these amplifications show up in dPCR as an additional (distinct) population of droplets
with fluorescence values between negatives and the true positive (see Figure 7 and Example 1, Figure
3). The presence of multiple populations of droplets may complicate the digital analysis, affect the
separation of positives from negatives, and ultimately lead to misclassification of droplets. Therefore,
dPCR methods for GMO quantification should only amplify a single target unless the aim is to
perform multiplexing.

29
Figure 7: Illustration of multiple fluorescence populations. Panel A shows the results for the acp1 target, an additional
population of fluorescence measurements is visible with values closely situated to the negatives. Panel B shows the results
for the cruciferin (cruA) target, an additional population of fluorescence measurements is visible with values closely
situated to the positives. Contrary to "rain", this kind of intermediate fluorescence is not uniformly spread between
negatives and true positives, but appears in a more discrete manner.
5.4.2 Amount of rain
In many dPCR reactions there are partitions that seemingly fail to belong to either the positive or
negative population. These partitions have an intermediate fluorescence level and are colloquially
referred to as "rain" or "drag" (e.g. see Figures 3 and 4). Rain represents droplets with intermediate
fluorescence that defy straightforward classification as either positive or negative. In contrast to
unintended amplification products, rain does not seem to have a pronounced distribution but it is
often equally spread between positives and negatives. The occurrence of rain may for example be
attributed to a late PCR onset due to partial inhibition in a certain amount of droplets (Dreo et al.,
2014 and Dingle et al., 2013). In addition, experiments indicate that after a standard reaction (40 or
45 cycles) the cloud of negatives may still house a population of rain partitions that have not yet had
the time to accumulate fluorescence above the baseline level. Thus, the main question relating to
how much rain we can tolerate becomes: how many rain partitions are "hiding" in the negative cloud
(and are thus always misclassified).
In order to set a limit to the amount of rain that can be allowed in dPCR reactions, we consider the
misclassification of partitions. Simulation experiments show that, at the 1 % quantification level,
approximately 2.5 % rain (percentage of total droplets) can be tolerated before 25 % quantification
bias is reached (Lievens et al., 2016). Hence, we propose the latter as a rule of thumb for the
maximum amount of rain in a given reaction. A tool to calculate the amount of rain is described in
Lievens et al., 2016.
5.4.3 Resolution
Peak resolution is a concept from the field of HPLC (High Pressure Liquid Chromatography) that
translates well to dPCR when applied to the density plots of the droplet fluorescence readings. The
resolution of a digital assay (Rs) is a quantitative measure of how well the two populations (positive
and negative), hereinafter referred to as peaks, can be differentiated in a linear separation. It is

30
defined as the difference in fluorescence between the two peaks, divided by the combined widths of
the peaks:
𝑅𝑠 = 2 ∗ (𝑡𝑝 − 𝑡𝑛)
𝑤𝑝 + 𝑤𝑛 (10)
where the subscript p indicates the population with the higher fluorescence (positive, as opposed to
n for the negatives). The variables t and w are the peak fluorescence and peak width, respectively
(Figure 8).
Figure 8: Illustration of the concept of resolution. The left-hand figures show the droplet readout; the right-hand figures
show the corresponding density plots. tn and tp show the fluorescence positions with the highest density in the negative
and positive droplet clouds, respectively. wn and wp represent the width of the density peaks at their base (Lievens et al.,
2016).
Essentially, the resolution corresponds to how well the fluorescence of the droplet populations is
separated. A resolution of 2 represents a complete separation; we propose 𝑅𝑠 = 2 as a minimum to
allow for a certain amount of deterioration of the resolution in more difficult samples. At 𝑅𝑠 = 2.5
there is high resolution and at 𝑅𝑠= 0.5 there is low resolution.
5.4.4 Target concentration
As mentioned in several papers (Dube et al., 2008; Jacobs et al., 2014), there is an optimal
concentration of target molecules per partition that should yield the least random sampling
variability (and thus the narrowest confidence bounds). This optimal value of λ for absolute
quantification is approximately 1.6, i.e. if random sampling variation as described by the Poisson

31
process is the only source of variability. For a partition size of 0.85 nl (ddPCR), this translates to an
optimum of about 1,870 target copies per μl or 37,400 per 20 μl total reaction mix. For a partition
size of 6 nl (cdPCR), this translates to final concentrations of about 265 copies per μl or 2,650 copies
per 10 μl total reaction mix for optimal conditions.
An upper and lower bound for optimal quantification can be found by inspecting the fraction of
reactions that have more than 25 % error due to Poisson variation (see Lievens et al., 2016 for details
on the bootstrap approach). Table 1 shows the results for the bootstrap. In addition, the table also
shows how these limits shift when instead of a single reaction, multiple repeats are used (i.e.
averaged) to estimate λ.
Table 1: Results from the bootstrap analysis The table lists the lowest and highest values (as λ and as number of target copies per reaction) at which 95 % of all reactions contain less than 25 % error.
dPCR system 20,000 partitions 765 partitions
Value λ DNA copies λ DNA copies
repeats lower upper lower upper lower upper lower upper
1 0.0030 8.86 61 177,297 0.077 5.51 59 4,218
2 0.0014 9.51 29 190,270 0.038 5.31 29 4,063
3 0.0012 9.92 23 198,378 0.030 5.31 23 4,063
4 0.0011 10.00 21 200,000 0.020 6.53 15 4,993
5.4.5 Amount of sample compartmentalized
Both droplet and chamber-based dPCR systems are subject to variability in the number of partitions
that are generated and/or accepted into the analysis. On top of that, most compartmentalization
techniques have a certain ‘dead volume’. Consequently, and unlike in qPCR, the entire volume of
sample loaded into the chamber/droplet generator is not analysed. This essentially corresponds to a
form of subsampling which may in turn add variation or error to the quantification, especially for
reactions with targets at very low abundance. We can express the number of partitions in the
analysis in a relative way, i.e. as the fraction of sample compartmentalized: the total volume of
partitions accepted into the analysis divided by the total volume loaded into the device.
For droplet-based dPCR, (in silico) simulation results show that there is an increase in variability as
less of the total sample is compartmentalized (Lievens et al., 2016). However, for endogene λ = 3 and
1 % analyte, one can go down to very low levels of compartmentalisation (< 10 %) before the chance
of excessive error (> 25 %) becomes greater than 1 in 20 (i.e. 95 % of the simulations have less than
25 % relative error). For lower levels of analyte, a higher compartmentalisation level is required to
keep 95 % of the simulations below 25 % error, and the same is true for lower values of λ. From these
results, we propose to require at least 30 % compartmentalisation for quantification down to 1 %,
and 50 % compartmentalisation for quantification down to 0.5 %. Runs with lower
compartmentalisation should therefore be omitted.
5.4.6 Unit of measurement
The GM content measured by dPCR is expressed as a copy number ratio but does not provide an
estimate of the amount of GM in mass fraction as required by the EU legislation. The conversion of
copy number ratio into mass fraction can be done via one single conversion factor (CF) per event. A

32
recent guidance document explains how to report traceable and comparable results expressing GM
content in accordance with EU legislation (Corbisier et al., 2017).
5.5 Data interpretation and reporting
5.5.1 Data interpretation
As far as data interpretation is concerned, a dedicated ENGL Working Group on "Detection,
Interpretation and Reporting on the presence of authorised and unauthorised genetically modified
materials" (WG DIR) has been established in order to amend and update the previously produced
document on "The detection, interpretation and reporting on the presence of unauthorised
genetically modified materials" (Ciabatti et al., 2017). This document is designed:
To help laboratories to take the appropriate decisions on compliance on the basis of the
results obtained and the requirements of the EU legislation on GM food and feed currently
in place;
To provide all the relevant data and information on analytical reports according to the
obligations of the EU legislation on GM food and feed and ISO standards.
Even though the previous document is non-exhaustive, it addresses the most frequent cases and
should be considered as a source of guidance on the matter. It applies to the official analytical
control of the following GM events for the enforcement of EU legislation on GM food and feed. Some
particular cases may require further adaptive interpretation. Future developments and/or legal
requirements (e.g. new tolerance or labelling thresholds, etc.) should be taken into consideration in
case of future amendments to the document.
GM events authorised on the EU market for food and feed: for traceability and labelling
requirements, the laboratory is requested to verify the presence of these events above a
0.9 %-threshold;
GM events unauthorised or withdrawn from the EU market, which are falling under the
scope of Reg. (EU) 619/2011: the laboratory is requested to verify the presence of these GM
events taking into consideration the Minimum Required Performance Limit (MRPL) set by the
Regulation at 0.1 %. A technical guidance document on the implementation of Commission
Regulation (EU) 619/2011 has been developed and published by the EURL GMFF (Mazzara et
al., 2011);
GM events unauthorised or withdrawn from the EU market, to which a Commission
Implementing Decision on the withdrawal from the market and on a tolerance period for
traces applies. The laboratory is requested to verify the presence of these GM events taking
into consideration the MRPL of 0.1 %. For GM events currently fulfilling the requirements of
Reg. (EC) No. 619/2011 as well as for information about specific validated detection methods
and the source of certified reference material please refer to:
http://ec.europa.eu/food/dyna/gm_register/index_en.cfm.
GM events unauthorised or withdrawn from the EU market, which are not falling under the
scope of Reg. (EU) 619/2011 and to which no Commission Implementing Decision on the
withdrawal from the market and on a tolerance period for traces applies: the laboratory is
requested to verify the presence of these GM events without any tolerance threshold or any
MRPL.

33
The WG DIR document does not address the official analytical control of seeds, for which no
traceability/labelling threshold or MRPL has yet been established in the EU. However, the reporting
requirements are also applicable to seed testing.
A decision tree has been presented by the group and refers to the following stepwise analytical work
flow, which is generally adopted by laboratories to verify the enforcement of EU legislation on GM
food and feed:
1. Detection of the ingredient/component/constituent of the food/feed: this is performed using
taxon-specific methods;
2. GMO screening: this is usually performed using element and/or construct-specific methods;
3. GM event identification using qualitative event-specific methods;
4. GM event quantification using quantitative event-specific methods.
However, there may be specific cases where one or more of the steps listed above are not necessary
or useful and may be skipped. For unauthorised GMOs (UGMs), step 3 and 4 will often not be
possible because of the lack of event-specific detection methods and/or reference materials. Zero
tolerance of UGMs in food is prescribed in the EU (Figure 9).
Figure 9. Decision tree for GMO analysis (Figure based on Ciabatti et al., 2017).
# The term "inconclusive" is used in this context with the meaning that, if a taxon is not detected, the analytical request to
detect and identify possible GM events for this taxon cannot be satisfied.
## The term "donor organism-specific test" means to test for the presence of organisms in which the screening elements
are naturally present.

34
* 0.1 % Minimum Required Performance Limit applies to methods for the detection of GM events falling under the scope of
Regulation (EU) No 619/2011
** A tolerance threshold applies to some products according to specific Commission Implementing Decisions on their
withdrawal from the market: e.g. Commission Implementing Decision (EU) 2016/2268 of 14 December 2016 amending
Decisions 2007/305/EC, 2007/306/EC and 2007/307/EC as regards the tolerance period for traces of Ms1xRf1 (ACS-BNØØ4-
7xACS-BNØØ1-4) hybrid oilseed rape, Ms1xRf2 (ACS-BNØØ4-7xACS-BNØØ2-5) hybrid oilseed rape and Topas 19/2 (ACS-
BNØØ7-1) oilseed rape, as well as of their derived products; it sets a 0.1 % tolerance threshold until 31 December 2019.
*** provided that this presence is adventitious or technically unavoidable
Results should be reported according to ISO 24276/Amd1:2013, ISO 21569/Amd1:2013 and ISO
21570/Amd1:2013
5.6 Digital MIQE guidelines The growth of interest in dPCR, both as an aid in metrological traceability and as a real-life
application across a range of sectors including food testing, means that a plethora of data is being
produced. This has led to the establishment of a set of guidelines for the production and publication
of dPCR data, in order to harmonise the approach and provide meaningful results which can be
readily interpreted (dMIQE guidelines, Huggett et al., 2013). Methods based on dPCR can be applied
in various areas of food analysis. The methodology is a quantitative technology by nature, but it can
be used for screening purposes as well.
The original qMIQE guidelines (Minimum Information for Publication of Quantitative PCR
Experiments; Bustin et al., 2009) were published with the aim of improving qPCR analyses and
ensuring data comparability and reproducibility. These were rapidly adopted by a number of
stakeholders as a useful way in striving towards harmonisation of qPCR results.
Shortly after this in 2013, the digital MIQE guidelines (dMIQE; Minimum Information for Publication
of Quantitative Digital PCR Experiments guidelines; Huggett et al., 2013) were published, in order to
help harmonise results from dPCR experiments. The dMIQE guidelines provide a checklist of items to
address when publishing results from dPCR experiments to help ensure that results can be
reproduced, followed and understood. The aim of the dMIQE guidelines is three-fold: i) to facilitate
replication of experiments; ii) to provide critical information to allow analysts and reviewers to
measure the technical quality of work; iii) to help towards harmonisation of reporting of
results/comparison of results irrespective of dPCR instrumentation used.
The items in the dMIQE guidelines checklist are categorised as either essential (E) or desirable (D) to
report when publishing results.
Essential (E) information to report includes, but is not limited to:
Mean DNA target copies per partition (lambda);
Number of partitions used (lambda and the partition number determine the precision associated with the experiment);
Template structural information – there is evidence to suggest that the nature of the sample can affect the reliability and accuracy of the result. It is important to capture aspects of the structural information of the template, including: template type (e.g. genomic, plasmid);

35
source (e.g. organism, tissue, cell, flour, food, plant, leaf); treatment (e.g. restriction digestion, sonication, pre-amplification, none);
Individual partition volume – different dPCR platforms have different partition volumes2;
Total volume of reaction = (number of partitions) x (partition volume). This is particularly important for ddPCR as total volume can differ between runs because of variability in number of partitions generated;
Nature of controls used;
Supplemental data – representative amplification plots (or endpoint fluorescence values) of positive and negative experimental results;
Example experimental variance – the analyst is encouraged to take multiple biological replicates to more accurately capture the experimental uncertainty.
Desirable (D) information to report includes, but is not limited to:
Optimisation data for the assay;
Total initial PCR reaction volume prepared – not all instruments use the total volume and sample volume may be much smaller;
LOD of assay.
It is a recommendation of this WG that the essential items outlined in the dMIQE guidelines should
be documented when publishing dPCR experimental results, as an aid to harmonised presentation of
results from analysis of GMOs using dPCR instrumentation.
6. Costs and practicability of dPCR Assuming that all currently active GMO laboratories already possess qPCR equipment, the laboratory
may benefit from performing a cost-benefit calculation prior to investing in dPCR equipment.
6.1 Instruments costs
Currently two types of technology are applied to create reaction partitions. One is based on specially
designed chips or plates (Fluidigm, Formulatrix or Applied Biosystems) and the other sequester
reagents into individual droplets (Bio-Rad, RainDance and Stilla Technologies). Recent advances in
nanofabrication and nanofluidics enabled building dPCR platforms capable of generating thousand or
even millions of PCR partitions. The final costs of analysing each sample will depend greatly on the
platform, price of consumables and the time required to set up and analyse samples.
6.2 Consumables cost
The price for consumables as well as for instruments can vary depending on the producer’s pricing
policy for a particular market. Digital PCR uses the same reagents (primers and probes) as qPCR but
specific consumables (chips, cartridges, gaskets, holders, pipettes etc.) are required for each
instrument. For ddPCR, the QX 100/200 ddPCR system from Bio-Rad can generate up to 20,000
droplets (usually 14,000–18,000) per sample on an 8-sample cartridge. Up to 96 samples can be
analysed at once assuming samples from 12 cartridges are transferred into a 96-well PCR plate and
run together. The Naica System is based on chips that can be used for four samples. Each sample is
distributed into approximately 30,000 individual droplets, where a maximum of three chips can be
run simultaneously. RainDrop Digital PCR can generate up to 10,000,000 droplets per sample and run
2 also see Vynck and Thas, 2018

36
8 samples per chip. For cdPCR, Fluidigm offers partition of samples into 765 chambers in each of the
12-chip panels (765 chambers x 12 panels = 9,180 reactions per chip), or a chip with 48 arrays (770
chambers per array) capable of producing 36,960 individual PCRs simultaneously. The QuantStudio
3D uses one chip per sample, where the reaction mixture is distributed into 20,000 wells present in a
chip. Twenty-four chips can then be run together in a PCR cycler, but each chip needs to be read
individually. The Constellation system from Formulatrix offers plates where 96 samples can be loaded
and each is distributed into 8,000 chambers or 24 samples can be loaded and each is distributed into
36,000 chambers.
6.3 Practicability
Each dPCR platform has some advantages and limitations in terms of using it in practice. There are
also some bespoke procedures to learn in order to generate the required number of droplets or fully
load the chip. Some systems enable analysis of the full kinetics of the amplification per partition
(BioMark HD, QuantStudio 12K Flex), whilst others are built to detect end-point amplification only
(Bio-Rad QX100, QX200, RainDrop Digital PCR, Naica System, QuantStudio 3D, Constellation).
When comparing qPCR and dPCR in terms of costs, some producers of dPCR platforms advertise the
systems on the basis of very low costs for a single data point. This price can be very small especially
in systems capable of generating millions of partitions. However, the instrument should be tailored
to each application which may require a large number of 'single data points' to generate a
meaningful result. For instance, two hundred chambers are sufficient to distinguish between 2 and 3
copies in a sample, but at least 8,000 partitions are required to distinguish between 10 and 11 copies.
Systems generating millions of partitions are capable of detecting very rare mutations or quantifying
very low concentrations of DNA copies, as with more partitions a higher dynamic range can be
achieved.
It is therefore difficult to estimate the exact costs of using dPCR in routine testing or research as the
total price will depend on several factors. Each user should estimate the costs of dPCR in particular
applications taking into account:
The price of the instrument and costs of maintenance;
Costs of consumables and reagents;
The achievable throughput of the system;
Ease of use of the system;
Required precision and sensitivity;
Possibility of multiplexing;
Additional capacity of performing qPCR;
Hands-on time;
Sample throughput per runtime;
Analysis time.
The costs for analysing a sample with dPCR and qPCR can be comparable or deviate strongly
depending on the different platforms that are compared. This comparison only makes sense within a
particular market which is being considered (and not between different/deviating markets). The
aspect of hands-on-time for analysis and the complexity of handling are crucial parameters that need
to be considered.

37
The qPCR technology has been present on the market for around two decades. As a result, it is well
established in many testing and research labs. It has higher throughput and for many routine
applications it also costs less. Digital PCR can offer more precision and less uncertainty than qPCR,
however, it offers a narrower dynamic range. Some dPCR systems that require less hands-on time
will probably find more application in routine testing, especially in medical diagnostics where
reproducibility is of great importance. Other systems that offer more flexibility might become the
system of choice in research labs.
In case of GMO quantification, dPCR offers similar performance as qPCR but in some cases can
outperform qPCR in terms of cost-effectiveness. The possibility of multiplex quantification of GM
events of the same species is a good example of reduced hands on time and costs compared to qPCR
quantification. A method for direct quantification of twelve approved GM maize lines with multiplex
assays with ddPCR recently (Dobnik et al., 2015) proved to be cost-efficient particularly for testing
higher number of samples. Direct quantification of twelve approved GM maize lines with 4-plex and
10-plex multiplex assays with ddPCR compared to direct quantification of twelve approved GM maize
lines in simplex reactions with qPCR proved to be 3 times cheaper and can save six working days until
the result is obtained (the case of analysing 11 samples). For labs testing many mixed samples, the
most cost efficient approach could be combining qPCR screening of all samples prior to multiplex
ddPCR quantification of the screening positive samples. Developed ddPCR multiplex maize assays can
provide more cost-effective GMO quantification, especially when the system is extended to include
additional species relevant GM events. In case of quantification of various targets as one group, dPCR
offers high flexibility of multiplexing and can easily be applied to diverse testing fields.
6.4 In-house verification For the in-house verification of dPCR methods (based on validated qPCR methods which are to be
transferred to a dPCR format), several parameters associated with quantification should be
inspected. Analogous to qPCR, these parameters are: specificity, trueness (when possible),
repeatability, robustness, and LOD/LOQ (Hougs et al., 2017). The variability associated with the
repeatability, intermediate precision and bias can be used to estimate the measurement uncertainty
of a dPCR result. The general principles provided in the technical report from Trapmann et al. (2009)
to estimate the analytical variability of quantitative analytical results obtained by real-time PCR can
also be applied for dPCR methods. The approach detailed below to determine the uncertainty
associated to a dPCR result is using data derived from within-laboratory samples (ISO 5725-2;
Linsinger, 2008).
6.4.1 Specificity
The dPCR method does not differ in its concept from qPCR. The principle of amplification of DNA
target molecules is the same as for qPCR. The specificity of a PCR assay is provided by the use of
high-fidelity polymerase and an appropriate primers/probe design (DNA sequences). If the
specificity of a method has been demonstrated in qPCR, the sequence of the primers/probe as well
as the reaction conditions should be maintained in a dPCR format. Changes may have to be made to
optimise dPCR (e.g. by altering MgCl2 concentration of the PCR reaction buffer, by changing the
annealing temperature, the primer and probe concentrations or the ramping setting). Depending on
the changes made to the method (e.g. master mix, thermal program, etc.) a re-evaluation of the
method's specificity may be necessary (see 4.3 and annex B.3 for details).

38
6.4.2 Repeatability
Repeatability is the precision under a set of repeatability conditions that includes the same
measurement procedure, same operators, same measuring system (method and dPCR device), same
operating conditions and same location and replicate measurements on the same or similar samples
over a short period of time. To estimate the repeatability, one can use for example two samples, a
high concentration (e.g. 10 % GM material) and a low concentration (e.g. 1 % material), which are
analysed in triplicates across five different days. The results are then inspected for their variability
over the different days, e.g. by a one-way ANOVA (Analysis of Variance), an example of which is
given below.
With the three replicates over the five days there are five estimates of the variance. The MSw (within
Mean Square) captures the variability within each different day. The relative repeatability standard
deviation (RSDr) is given by equation 11:
𝑅𝑆𝐷𝑟 = √𝑀𝑆𝑤
�� (11)
where �� is the overall mean estimate, and MSw is the within Mean Square expressing the variance
observed within a day.
6.4.3 Intermediate precision
The Intermediate precision reflects the precision over time (for example between days). The relative
between-day standard deviation 𝑅𝑆𝐷𝑖𝑝 is given by equation 12:
𝑅𝑆𝐷𝑖𝑝 = √
𝑀𝑆𝑏−𝑀𝑆𝑤
𝑛
��
(12)
where 𝑀𝑆𝑏 is the between group variance capturing the variability between each days, 𝑀𝑆𝑤 is the
within Mean Square capturing the variance observed within a day, 𝑛 is the number of replicates per
day and �� is the overall mean estimate.
When MSw is bigger than MSb the maximum hidden between-day-variation (s*ip) can be calculated
with equation 13:
𝑠𝑖𝑝∗ = √
𝑀𝑆𝑤
𝑛 ∗ √
2
𝑝 (𝑛 − 1)
4
(13)
where, 𝑀𝑆𝑤 is the within Mean Square capturing the variance observed within a day, 𝑛 the number
of replicates per day and 𝑝 the number of days.
The relative standard deviation for intermediate precision (𝑅𝑆𝐷𝑖𝑝) is then obtained by dividing 𝑠𝑖𝑝∗
by the overall mean estimate �� (equation 14).
𝑅𝑆𝐷𝑖𝑝 = 𝑠𝑖𝑝
∗
�� (14)

39
Note: In this example, the experiment is repeated on different days to capture the day-to-day variation, however it also possible to perform several runs on one single day to cover all factors that may contribute to the uncertainty of the measurement.
6.4.4 Standard relative uncertainty related to precision
From the above, one can calculate the relative standard uncertainty related to the precision within
one laboratory by combining the relative standard deviations associated with repeatability and
intermediate precision, as shown in equation 15:
𝑢𝑝𝑟𝑒𝑐𝑖𝑠𝑖𝑜𝑛,𝑟𝑒𝑙 = √𝑅𝑆𝐷𝑟
2
𝑛 × 𝑝+
𝑅𝑆𝐷𝑖𝑝2
𝑝 (15)
where 𝑢𝑝𝑟𝑒𝑐𝑖𝑠𝑖𝑜𝑛,𝑟𝑒𝑙 is the relative standard uncertainty related to the precision, RSDr the relative
repeatability standard deviation, 𝑅𝑆𝐷𝑖𝑝 the relative standard deviation for intermediate precision, 𝑝
the number of days and 𝑛 the number of replicates per day.
Note: The uncertainty related to the conversion of the number of positive droplets into copy number
concentration varies very much in relation to the lambda value. The lowest uncertainty is observed
for a lambda around 1.6 (Lievens et al., 2016). This means that the solution with the extracted DNA
for the endogen assay needs to be diluted before being added to the master mix, whereas in most
cases the DNA of the transgene does not need to be diluted.
6.4.5 Trueness
Definition: Closeness of agreement between the average value of an infinite number of replicate
measured quantity values and a reference quantity value. The measure of trueness is usually
expressed in terms of bias (ISO/IEC Guide 99:2007). The bias is the difference between the
expectation of the test results and an accepted reference value (ISO 5725-1:1994). The absence of
significant bias should be tested over the whole dynamic range of the method.
Note: An accepted reference value is a value that serves as an agreed-upon reference for
comparison, and which derives from:
a) a theoretical or established value, based on scientific principles;
b) an assigned or certified value, based on experimental work of a national or international
organisation;
c) a consensus or certified value, based on collaborative experimental work under the auspices
of a scientific group;
d) the expectation of the (measurable) quantity, i.e. the mean of a specified population of
measurements when a), b), c) are not available.
The trueness of a result obtained by dPCR can be assessed by comparing the average measured value
of a CRM with its certified value. The CRM should be a material certified for its absolute copy number
concentration or a material certified for its copy number concentration ratio. The bias between the
measured concentration (𝐶𝑜𝑛𝑐𝑚) and the certified copy number concentration (𝐶𝑜𝑛𝑐𝑐) is provided in
equation 16.
𝑏𝑖𝑎𝑠 = |𝐶𝑜𝑛𝑐𝑚 − 𝐶𝑜𝑛𝑐𝑐| (16)
40
The uncertainty associated with this bias can be calculated as followed:
𝑢𝑏𝑖𝑎𝑠 = √𝑢𝑝𝑟𝑒𝑐𝑖𝑠𝑖𝑜𝑛2 + 𝑢𝐶𝑅𝑀
2 (17)
where 𝑢𝐶𝑅𝑀 is the uncertainty of the certified value obtained by dividing the expanded uncertainty
(𝑈𝐶𝑅𝑀) by a coverage factor k, both found on the certificate of the CRM. The standard uncertainty
related to precision (𝑢𝑝𝑟𝑒𝑐𝑖𝑠𝑖𝑜𝑛) is calculated when the relative standard uncertainty related to
precision (𝑢𝑝𝑟𝑒𝑐𝑖𝑠𝑖𝑜𝑛,𝑟𝑒𝑙) – provided by equation 15 – is multiplied by the mean value (��) obtained
when analysing the CRM.
𝑢𝑝𝑟𝑒𝑐𝑖𝑠𝑖𝑜𝑛 = 𝑢𝑝𝑟𝑒𝑐𝑖𝑠𝑖𝑜𝑛,𝑟𝑒𝑙 ∗ �� (18)
The expanded uncertainty 𝑈𝑏𝑖𝑎𝑠 is estimated by multiplying the standard uncertainty associated to
the bias 𝑢𝑏𝑖𝑎𝑠 by a coverage factor k = 2, providing a level of confidence of approximatively 95 %.
𝑈𝑏𝑖𝑎𝑠 = 2 ∗ 𝑢𝑏𝑖𝑎𝑠 (19)
Acceptance criterion: A bias will be significant if it is larger than the expanded uncertainty of the
difference between result and certified value (𝑈𝑏𝑖𝑎𝑠) [ERM application note 1, 2010]. If a significant
bias is observed, either the origin of the bias should be further investigated (e.g. through
improvement of the dPCR method) or the results should be corrected for that bias.
6.4.6 Uncertainty estimation
The relative uncertainty of a measurement result (𝑢𝑚𝑒𝑎𝑠,𝑟𝑒𝑙) can be estimated by combining the
relative uncertainty associated with the precision (𝑢𝑝𝑟𝑒𝑐𝑖𝑠𝑖𝑜𝑛,𝑟𝑒𝑙) with the relative uncertainty
associated with the trueness (𝑢𝑏𝑖𝑎𝑠,𝑟𝑒𝑙). The uncertainty of the bias is included in the uncertainty
budget regardless of whether or not the bias was found to be significant (Linsinger et al., 2008).
𝑢𝑚𝑒𝑎𝑠,𝑟𝑒𝑙 = √𝑢𝑝𝑟𝑒𝑐𝑖𝑠𝑖𝑜𝑛,𝑟𝑒𝑙2 + 𝑢𝑏𝑖𝑎𝑠,𝑟𝑒𝑙
2 (20)
𝑢𝑏𝑖𝑎𝑠,𝑟𝑒𝑙 is obtained by dividing 𝑢𝑏𝑖𝑎𝑠 (Eq. 17) by the mean value measured on the CRM.
Note: The relative standard uncertainty for calculating uncertainty estimates can be used when the
percent coefficient of variation is approximately constant over a substantial portion of the measuring
range (in our case between 1 % and 10 % GM material).
General note: 𝑢𝑥,𝑟𝑒𝑙 =𝑢𝑥
�� or 𝑢𝑥 = 𝑢𝑥,𝑟𝑒𝑙 ∗ ��
where ux,rel is the relative standard uncertainty, ux is the standard uncertainty and �� the mean value.
The standard uncertainty is expressed in the unit of measurement (e.g. in g/kg, GM % or DNA copy
number ratio). The relative standard uncertainty is expressed as a percentage relative to the mean
value.

41
6.4.7 Limit of Detection (LOD), Limit of Quantification (LOQ)
The limit of detection (LOD) is the lowest amount or concentration of analyte (e.g. DNA) in a sample
which can be detected – but not necessarily quantified – based on a given probability.
Experimentally, methods should detect the presence of the analyte for at least 95 % of the cases
(samples) at the LOD, ensuring ≤ 5 % false negative results. Analogous to qPCR, the LOD can be
established in dPCR by measuring successive dilutions of the analyte in replicate measurements.
The measurement principle of the dPCR makes it possible to detect down to one copy of a target
sequence and the Poison distribution is applicable at these very low copy number concentrations.
Therefore, it is reasonable to assess the LOD (and LOQ) by performing many replicate measurements
at very low copy number concentrations. The assessment should start by clearly defining the level of
confidence appropriate for the intended use of the method. When performing an experiment e.g.
with 60 replicate measurements (Marchesi et al., 2015) exactly at the LOD with a confidence interval
of 95 % there would be on average three negative measurement results, as this represents 5 % of the
cases. If all of the 60 replicate measurements performed at a certain PCR copy number concentration
are positive, it can be reasonably assumed that this concentration is above the LOD of the method
(Deprez et al. 2016). As this approach may not always be feasible, a pragmatic approach based on a
lower number of replicate measurements could be followed for the verification of the LOD. This
approach allows an approximate estimation of the LOD. Dilution series representing the range above
and below the expected LOD, based on prior knowledge of the LOD of that method (e.g. from
validation data), are tested in e.g. a minimum of 10 PCR replicate measurements for each
concentration level. The lowest concentration where all replicate measurements are positive is the
estimated LOD (Hougs et al., 2017). The use of a different approach should be supported by sound
statistical evidence ensuring that the level of confidence required is reached (Marchesi et al., 2015).
The LOD (and the LOQ) of a dPCR method depend on the number of analysed partitions and the total
volume of the analysed partitions. It is therefore possible to calculate the theoretical minimum LOD
for a given dPCR set-up based on the Poisson distribution. The calculation is based on the
combination of two probabilities: the probability of pipetting the DNA copies in the mix (sampling)
and the probability that these DNA copies end up in the droplets. In the case of a ddPCR with e.g.
17,000 analysed (accepted) droplets with an assumed droplet volume of 0.85 nL (also see note of
table A. 1b in the annex), the minimum theoretical LOD will be 0.29 cp/µL in the PCR mix. At this
concentration level, 5 % of the measurements will not have a single copy of the target sequence in
the analysed droplets.
The Limit of quantification (LOQ) is the lowest amount or concentration of analyte in a sample that
can be reliably quantified with an acceptable level of trueness and precision. This means that the LOQ
of a dPCR method depends on the level of uncertainty considered acceptable given the intended use
of the method. Practically, the LOQ of a dPCR method can be established by measuring the relative
uncertainty of a measurement result (𝑢𝑚𝑒𝑎𝑠,𝑟𝑒𝑙) at a low copy number concentration or ratio.
For some dPCR platforms, the manufacturer may give indications about the lower bound of the
number of partitions needed for accurate quantification.
6.4.8 Robustness
The robustness of a method is a measure of its capacity to remain unaffected by small, but deliberate
deviations from the experimental conditions described in the procedure.

42
Acceptance criterion: the method should provide the expected results when small deviations are
introduced from the experimental conditions described in the procedure.
For quantitative modules, based on the acceptance criterion of ≤ 25 % for the relative repeatability
standard deviation (RSDr) and trueness, the RSDr and trueness calculated for a combination of
changes should not exceed 30 % (Marchesi et al., 2015).
Examples of factors that a robustness test should address are experiments performed by another
operator, different primer and probe concentrations, different annealing temperatures, different
thermal cyclers, different reaction volumes, and different master mix suppliers (for examples on how
to assess robustness see e.g. Marchesi et al., 2015; Hougs et al., 2017).
6.5 Accreditation A dPCR method can be submitted for accreditation under ISO 17025. The process of submission
strongly depends on the scope of the accreditation. Before submission, it is advised that the national
accreditation body is consulted regarding the dPCR method submission. Digital PCR is essentially just
a variation of PCR, using the same primers/probes (and in some cases master mix) as qPCR.
Documents for method submission should be prepared in accordance with a quality system. If a
laboratory has a scope for PCR based methods, general documents could just be complemented with
description of dPCR and new documents relating to the dPCR procedures should be prepared. A dPCR
method must fulfil the above-mentioned verification criteria, if the assays were transferred from
qPCR to dPCR. New methods should be validated, and pass all of the acceptance criteria if they are to
be considered for accreditation.

43
7. Bibliography 1. Basu AS (2017). Digital Assays Part I: Partitioning Statistics and Digital PCR. SLAS Technology.
22(4), 369-386. http://journals.sagepub.com/doi/pdf/10.1177/2472630317705680, consulted 09/07/2018
2. Berben G, Charels D, Demšar T, Hochegger R, Nardini E, Onori R, Schulze M, Philipp P and Weber T (2014). Guidelines for sample preparation procedures in GMO analysis. JRC Technical Report. EUR 27021 EN.
3. Bhat S, Herrmann J, Armishaw P, Corbisier P and Emslie KR (2009). Single molecule detection in nanfluidic digital array enables accurate measurement of DNA copy number. Analytical and Bioanalytical Chemistry. 394, 457-467.
4. Bhat S, Curach N, Mostyn T, Bains GS, Griffiths KR and Emslie KR (2010). Comparison of methods for accurate quantification of DNA mass concentration with traceability to the international system of units. Analalytical Chemistry. 82(17), 7185-7192.
5. Bhat S, McLaughlin JL and Emslie KR (2011). Effect of sustained elevated temperature prior to amplification on template copy number estimation using digital polymerase chain reaction. Analyst. 136(4), 724-732.
6. BioRad Bulletin 6277 Rev A (2012). http://www.bio-rad.com/webroot/web/pdf/lsr/literature/bulletin_6277.pdf, consulted 04/07/2018
7. BioRad Bulletin 6407 Rev A. Droplet Digital™ PCR Applications Guide. http://www.bio-rad.com/webroot/web/pdf/lsr/literature/Bulletin_6407.pdf, consulted 16/07/2018
8. Boben J, Kramberger P, Petrovič N, Cankar K, Peterka M, Štrancar A and Ravnikar M (2007). Detection and quantification of tomato mosaic virus in irrigation waters. European Journal of Plant Pathogology. 118(1), 59-71.
9. Burns MJ, Burrell AM and Foy CA (2010). The applicability of digital PCR for the assessment of detection limits in GMO analysis. European Food Research Technology. 231(3), 353-362.
10. Bustin SA, Benes V, Garson JA, Hellemans J, Huggett J, Kubista M, Mueller R, Nolan T, Pfaffl MW, Shipley GL, Vandesompele J and Wittwer CT. (2009). The MIQE guidelines: minimum information for publication of quantitative real-time PCR experiments. Clinical Chemistry. 55(4), 611-622.
11. Cao Y, Raith MR and Griffith JF (2015). Droplet digital PCR for simultaneous quantification of general and human-associated fecal indicators for water quality assessment. Water Research. 70, 337-349.
12. Central Core DNA Sequence Information System (CCSIS). https://ec.europa.eu/jrc/en/scientific-tool/central-core-dna-sequence-information-system-ccsis, consulted 23/07/2018
13. Ciabatti I, Philipp P, Berben G, Boniotti B, De Loose M, Garavelloni S, Grohmann L, Herau V, Holst-Jensen A, Hubert P, Narendja F, Onori R, Ovesná J, Papazova N, Pecoraro S, Roosens N, Scholtens I, Villa D, Welling A, Woll K and Žel J (2017). Detection, Interpretation and Reporting on the presence of authorised and unauthorised genetically modified materials. JRC Technical Reports. JRC106273.
14. Corbisier P, Bhat S, Partis L, Xie VR and Emslie K (2010). Absolute quantification of genetically modified MON810 maize (Zea mays L.) by digital polymerase chain reaction. Analytical and Bioanalytical Chemistry. 396(6), 2143-2150.
15. Corbisier P, Pinheiro L, Mazoua S, Kortekaas A-M, Chung PYJ, Gerganova T, Roebben G, Emons H and Emslie K (2015). DNA copy number concentration measured by digital and droplet digital quantitative PCR using certified reference materials. Analytical and Bioanalytical Chemistry. 407, 1831–1840.
16. Corbisier P, Barbante A, Berben G, Broothaerts W, De Loose M, Emons H, Georgieva Tz, Lievens A, Mazzara M, Papazova N, Perri E, Sowa S, Stebih D, Terzi V and Trapmann S (2017). Recommendation for the unit of measurement and the measuring system to report traceable and comparable results expressing GM content in accordance with EU legislation. EUR 28536 EN, http://gmo-crl.jrc.ec.europa.eu/ENGL/docs/WG-UoM-Final-Report.pdf, consulted on 07/02/2018

44
17. Coudray-Meunier C, Fraisse A, Martin-Latil S, Guillier L, Delannoy S, Fach P and Perelle S (2015). A comparative study of digital RT-PCR and RT-qPCR for quantification of Hepatitis A virus and Norovirus in lettuce and water samples. International Journal of Food Microbiology. 201, 17-26.
18. Dalmira F-U, Melina P-U, Jose-Benigno VT, Josefina L-F, Raymundo G-E and Abraham A-S (2016). Development, optimization, and evaluation of a duplex droplet digital PCR assay to quantify the
T‑nos/hmg copy number ratio in genetically modified maize. Analytical Chemistry. 88(1), 812−819.
19. Danezis GP, Tsagkaris AS, Camin F, Brusic V and Georgiou CA (2016). Food authentication: Techniques, trends & emerging approaches. Trends in Analytical Chemistry. 85, 123-132.
20. Degen H-J, Deufel A, Eisel D, Grunewald-Janho S and Keesey J (Eds.), (2006). PCR applications Guide (3rd edition). Roche Diagnostics.
21. Deprez L, Corbisier P, Kortekaas A-M, Mazoua S, Hidalgo RB, Trapmann S and Emons H (2016). Validation of a digital PCR method for quantification of DNA copy number concentrations by using a certified reference material. Biomolecular Detection and Quantification. 9, 29-39.
22. Dingle TC, Sedlak RH, Cook L and Jerome KR (2013). Tolerance of droplet-digital PCR vs real-time quantitative PCR to inhibitory substances. Clinical Chemistry. 59(11), 1670-1672.
23. Dobnik D, Spilsberg B, Bogožalec K, Holst-Jensen A and Žel J (2015). Multiplex Quantification of 12 European Union Authorized Genetically Modified Maize Lines with Droplet Digital Polymerase Chain Reaction. Analytical Chemistry. 87(16), 8218-8226.
24. Dobnik D, Štebih D, Blejec A, Morisset D and Žel J (2016). Multiplex quantification of four DNA targets in one reaction with Bio-Rad droplet digital PCR system for GMO detection. Scientific Report. 6:35451|DOI: 10.1038/srep35451.
25. Doi H, Takahara T, Minamoto T, Matsuhashi S, Uchii K and Yamanaka H (2015). Droplet digital polymerase chain reaction (PCR) outperforms real-time PCR in the detection of environmental DNA from an invasive fish species. Environmental Science and Technology. 49(9), 5601-5608.
26. Dong L, Meng Y, Sui Z, Wang J, Wu L and Fu B (2015). Comparison of four digital PCR platforms for accurate quantification of DNA copy number of a certified plasmid DNA reference material. Scientific Reports. 5: 13174.
27. Dreo T, Pirc M, Ramšak Z, Pavšič J, Milavec M, Žel J and Gruden K (2014). Optimising droplet digital PCR analysis approaches for detection and quantification of bacteria: a case study of fire blight and potato brown rot. Analytical and Bioanalytical Chemistry. 406(26), 6513-6528.
28. Dube S, Qin J and Ramakrishnan R (2008). Mathematical analysis of copy number variation in a DNA sample using digital PCR on a nanofluidic device. PLoS ONE. 3(8), e2876.
29. EFSA (European Food Safety Authority) and ECDC (European Centre for Disease Prevention and Control) (2015). The European Union summary report on trends and sources of zoonoses, zoonotic agents and food-borne outbreaks in 2014. EFSA Journal. 13(12):4329.
30. EMAN (2015). European Mycotoxin Awareness Network: Basic Factsheet Trichothecenes. European Mycotoxin Awareness Network.
31. European Reference Materials' application note (1/2010). Application note 1, Comparison of a measurement result with the certified value. https://ec.europa.eu/jrc/sites/jrcsh/files/erm_application_note_1_en.pdf, consulted on 07/02/2018
32. Evans MI, Wright DA, Pergament E, Cuckle HS and Nicolaides KH (2012). Digital PCR for Noninvasive Detection of Aneuploidy: Power Analysis Equations for Feasibility. Fetal Diagnosis and Therapy. 31(4), 244-247.
33. Fan HC, Blumenfeld YJ, El-Sayed YY, Chueh J and Quake SR (2009). Microfluidic digital PCR enables rapid prenatal diagnosis of fetal aneuploidy. American Journal of Obstetrics & Gynecology. 200(5): 543.
34. Floren C, Wiedemann I, Brenig B, Schütz E and Beck J (2015). Species identification and quantification in meat and meat products using droplet digital PCR (ddPCR). Food Chem. 173, 1054-1058.

45
35. Gerdes L, Busch U and Pecoraro S (2012). Parallelised real-time PCR for identification of maize GMO events. European Food Research and Technology. 234 (2), 315-322.
36. Gerdes L, Iwobi A, Busch U and Pecoraro S (2016). Optimization of digital droplet polymerase chain reaction for quantification of genetically modified organisms. Biomolecular Detection and Quantification. 7, 9-20.
37. GMOMETHODS: EU Database of Reference Methods for GMO Analysis. http://gmo-crl.jrc.ec.europa.eu/gmomethods, consulted on 07/02/2018
38. Hennekinne JA, De Buyser ML and Dragacci S (2012). Staphylococcus aureus and its food poisoning toxins: characterization and outbreak investigation. FEMS Microbiology Reviews. 36(4), 815-836.
39. Higuchi R, Dollinger G, Walsh PS and Griffith R (1992). Simultaneous amplification and detection of specific DNA sequences. Biotechnology. 10(4), 423-427.
40. Hindson BJ, Ness KD, Masquelier DA, Belgrader P, Heredia NJ, Makarewicz AJ, Bright IJ, Lucero MY, Hiddessen AL, Legler TC, Kitano TK, Hodel MR, Petersen JF, Wyatt PW, Steenblock ER, Shah PH, Bousse LJ, Troup CB, Mellen JC, Wittmann DK, Erndt NG, Cauley TH, Koehler RT, So AP, Dube S, Rose KA, Montesclaros L, Wang S, Stumbo DP, Hodges SP, Romine S, Milanovich FP, White HE, Regan JF, Karlin-Neumann GA, Hindson CM, Saxonov S and Colston BW (2011). High-throughput droplet digital PCR system for absolute quantitation of DNA copy number. Analytical Chemistry. 83(22), 8604-8610.
41. Holden MJ, Haynes RJ, Rabb SA, Satija N, Yang K and Blasic JR Jr (2009). Factors affecting quantification of total DNA by UV spectroscopy and PicoGreen fluorescence. Journal of Agricultural and Food Chemistry. 57(16), 7221-7226.
42. Holst-Jensen A, Bertheau Y, De Loose M, Grohmann L, Hamels S, Hougs L, Morisset D, Pecoraro S, Pla M, Van den Bulcke M and Wulff D (2012). Detecting un-authorized genetically modified organisms (GMOs) and derived materials. Biotechnology Advances. 30(6), 1318-1335.
43. Hougs L, Gatto F, Goerlich O, Grohmann L, Lieske K, Mazzara M, Narendja F, Ovesná J, Papazova N, Scholtens I and Žel J (2017). Verification of analytical methods for GMO testing when implementing interlaboratory validated methods. JRC Technical Reports. Version 2, EUR 29015 EN, http://gmo-crl.jrc.ec.europa.eu/ENGL/docs/WG-MV-Report-version-2.pdf, consulted on 17/07/2018
44. Huang WC, Chou YP, Kao PM, Hsu TK, Su HC, Ho YN, Yang YC and Hsu BM (2016). Nested-PCR and TaqMan real-time quantitative PCR assays for human adenoviruses in environmental waters. Water Science and Technology. 73(8), 1832-1841.
45. Huggett JF, Novak T, Garson JA, Green C, Morris-Jones SD, Miller RF and Zumla A (2008). Differential susceptibility of PCR reactions to inhibitors: an important and unrecognised phenomenon. BMC Res Notes. 1:70.
46. Huggett JF, Foy CA, Benes V, Emslie K, Garson JA, Haynes R, Hellemans J, Kubista M, Mueller RD, Nolan T, Pfaffl MW, Shipley GL, Vandesompele J, Wittwer CT and Bustin SA (2013). The Digital MIQE Guidelines: Minimum Information for Publication of Quantitative Digital PCR Experiments Clinical Chemistry. 59(6), 892-902.
47. ISO/IEC 17025:2005 – General requirements for the competence of testing and calibration laboratories.
48. ISO/TS 13136:2012 – Microbiology of food and animal feed -- Real-time polymerase chain reaction (PCR)-based method for the detection of food-borne pathogens -- Horizontal method for the detection of Shiga toxin-producing Escherichia coli (STEC) and the determination of O157, O111, O26, O103 and O145 serogroups.
49. ISO 15216-1:2017 – Microbiology of food chain -- Horizontal method for determination of hepatitis A virus and norovirus using real-time RT-PCR -- Part 1: Method for quantification.
50. ISO/TS 18867:2015 – Microbiology of the food chain -- Polymerase chain reaction (PCR) for the detection of food-borne pathogens -- Detection of pathogenic Yersinia enterocolitica and Yersinia pseudotuberculosis.

46
51. ISO 24276:2006 – Foodstuffs -- Methods of analysis for the detection of genetically modified organisms and derived products -- General requirements and definitions.
52. ISO 24276:2013Amd1 Foodstuffs -- Methods of analysis for the detection of genetically modified organisms and derived products -- General requirements and definitions AMENDMENT 1.
53. ISO 21569:2013Amd1 Foodstuffs -- Methods of analysis for the detection of genetically modified organisms and derived products -- Qualitative nucleic acid based methods AMENDMENT 1.
54. ISO 21570:2013Amd1 Foodstuffs -- Methods of analysis for the detection of genetically modified organisms and derived products -- Quantitative nucleic acid based methods AMENDMENT 1.
55. ISO 5725-1:1994 Accuracy (trueness and precision) of measurement methods and results -- Part 1: General principles and definitions.
56. ISO 5725-2:1994 Accuracy (trueness and precision) of measurement methods and results -- Part 2: Basic method for the determination of repeatabilty and reproducibility of a standard measurement method.
57. ISO/IEC Guide 99:2007 – International vocabulary of metrology -- Basic and general concepts and associated terms (VIM).
58. Iwobi A, Gerdes L, Busch U and Pecoraro S (2016). Droplet digital PCR for routine analysis of genetically modified foods (GMO) - A comparison with real-time quantitative PCR. Food Control. 69, 205-213.
59. Jacchia S, Kagkli D-M, Lievens A, Angers-Loustau A, Savini C, Emons H and Mazzara M (2018). Identification of single target taxon-specific reference assays for the most commonly genetically transformed crops using digital droplet PCR. Food Control. 93, 191-200.
60. Jacobs BK, Goetghebeur E and Clement L (2014). Impact of variance components on reliability ofl absolute quantification using digital PCR BMC. Bioinformatics. 15:283.
61. Jones GM , Busby E, Garson JA, Grant PR, Nastouli E, Devonshire AS and Whale AS (2016). Digital PCR dynamic range is approaching that of real-time quantitative PCR. Biomolecular Detection and Quantification. 10, 31–33.
62. Mazzara M, Plan D, Savini C, Van den Bulcke M and Van den Eede G (2011). Technical guidance document from the European Union Reference Laboratory for Genetically Modified Food and Feed on the implementation of Commission Regulation (EU) NO 619/2011. JRC Scientific and Technical Reports. EUR 25137 EN, http://publications.jrc.ec.europa.eu/repository/bitstream/JRC68082/technical%20guidance%20from%20eurl%20on%20llp.pdf, consulted on 11/10/2018
63. Kaihara K, Bemis A and Choudhary G (2016). Bench Tips: Digital PCR: Helpful Tips When Using Droplet Partitioning Technology. Biocompare, https://www.biocompare.com/Bench-Tips/240090-Digital-PCR-Helpful-Tips-When-Using-Droplet-Partitioning-Technology/, consulted on 26/09/2018
64. Kennedy S and Oswald N (2011). PCR troubleshooting and optimisation - The essential guide. Caister Academic Press.
65. Kim JH, Kim SY, Lee H, Kim YR and Kim HY (2010). An Event-Specific DNA Microarray To Identify Genetically Modified Organisms in Processed Foods. Journal of Agricultural and Food Chemistry. 58(10), 6018-6026.
66. Kluga L, Van den Bulcke M, Folloni S, Gineste J-M, Weber T, Foti N, Mazzara M, Van den Eede G and Querci M (2011). A ready-to-use multi-target analytical system for GM soy and maize detection for enforcement laboratories. In Prof. Tzi-Bun Ng (Ed.), Soybean – Applications and Technology. 173–184.
67. Košir AB, Spilsberg B, Holst-Jensen A, Žel J and Dobnik D (2017a). Development and inter-laboratory assessment of droplet digital PCR assays for multiplex quantification of 15 genetically modified soybean lines. Scientific Reports. 7(1): 8601.
68. Košir AB, Divieto C, Pavšič J, Pavarelli S, Dobnik D, Dreo T, Bellotti R, Sassi MP and Žel J (2017b). Droplet volume variability as a critical factor for accuracy of absolute quantification using droplet digital PCR. Analytical and Bioanalytical Chemistry. 409(28), 6689-6697.

47
69. Linsinger TPJ (2008). Use of recovery and bias information in analytical chemistry and estimation of its uncertainty contribution. Trends in Analytical Chemistry. 27(10), 916-923.
70. Lievens A, Jacchia S, Kagkli D-M, Savini C and Querci M (2016). Measuring Digital PCR Quality: Performance Parameters and Their Optimization. PloS One. 11(5), e0153317. https://doi.org/10.1371/journal.pone.0153317, consulted on 07/02/2018
71. Lo YM, Lun FM, Chan KC, Tsui NB, Chong KC, Lau TK, Leung TY, Zee BC, Cantor RC and Chiu RW (2007). Digital PCR for the molecular detection of fetal chromosomal aneuploidy. Proc Nat Acad Sci USA. 104 (32), 13116-13121.
72. Ma J, Li N, Guarnera M and Jiang F (2013). Quantification of plasma miRNAs by digital PCR for cancer diagnosis. Biomarker Insights. 8, 127–136.
73. Marchesi U, Mazzara M, Broll H, De Giacomo M, Grohmann L, Herau V, Holst-Jensen A, Hougs L, Hübert P, Laurensse E, Morisset D, Papazova N, Pietsch K, Pla M, Sandberg M, Savini C, Waiblinger H-U and Woll K (2015). Definition of Minimum Performance Requirements for Analytical Methods of GMO Testing. JRC Technical Report. JRC95544. http://gmo-crl.jrc.ec.europa.eu/doc/MPR%20Report%20Application%2020_10_2015.pdf, consulted on 07/02/2018
74. Masago Y, Konta Y, Kazama S, Inaba M, Imagawa T, Tohma K, Saito M, Suzuki A, Oshitani H and Omura T (2016). Comparative evaluation of real-time PCR methods for human Noroviruses in wastewater and human stool. PLoS One. 11(8): e0160825.
75. Meyer W, De Andrade E, Boeders S, Charels D, Corbisier P, Merveillie A, Trapmann S and Emons H (2010). Certification of a Soya 356043 Reference Material for its DNA copy number ratio. ERM. Certified Reference Material ERM®-BF425c.
76. Morisset D, Štebih D, Milavec M, Gruden K and Žel J (2013). Quantitative analysis of food and feed samples with droplet digital PCR. PLoS One. 8(5):e62583.
77. Morrison TB, Weis JJ and Wittwer CT (1998). Quantification of low-copy transcripts by continuous SYBR Green I monitoring during amplification. BioTechniques 24(6), 954-958.
78. Murray MG and Thompson WF (1980). Rapid isolation of high molecular weight plant DNA. Nucleic Acids Research. 8(19), 4231-4325.
79. Nixon G, Garson JA, Grant P, Nastouli E, Foy CA and Huggett JF (2014). Comparative study of sensitivity, linearity, and resistance to inhibition of digital and nondigital polymerase chain reaction and loop mediated isothermal amplification assays for quantification of human cytomegalovirus. Analytical Chemistry. 86(9), 4387-4394.
80. Oblinger JL and Koburger JA (1975). Understanding and teaching the most probable number technique. Journal of Milk Food Technology. 38(9), 540-545.
81. Onori R, Beringer P, Hochegger R, Ovesná J, Kraucelyte A, Marchesi U, Woll K, Mazzara M, Savini C, Nardini E and Broothaerts W. Guidelines on the update of GMO EURL GMFF validated methods. publication in preparation
82. Pagano M and Gauvreau K (2000). Principles of Biostatistics 2nd ed. Pacific Grove, Duxbury Press.
83. Pinchuk IV, Beswick EJ and Reyes VE (2010). Staphylococcal enterotoxins. Toxins. 2(8), 2177-2197.
84. Pinheiro LB, Coleman VA, Hindson CM, Herrmann J, Hindson BJ, Bhat S and Emslie KR (2012). Evaluation of a droplet digital polymerase chain reaction format for DNA copy number quantification. Analytical Chemistry. 84(2), 1003-1011.
85. Pretto D, Maar D, Yrigollen CM, Regan J and Tassone F (2015). Screening newborn blood spots for 22q11.2 deletion syndrome using multiplex droplet digital PCR. Clinical Chemistry. 61(1), 182-190
86. Querci M, Foti N, Bogni A, Kluga L, Broll H and Van den Eede G (2009). Real-time PCR-based ready-to-use multi-target analytical system for GMO detection. Food Analytical Methods. 2(4), 325-336.

48
87. Rački N, Morisset D, Gutierrez-Aguirre I and Ravnikar M (2014a). One-step RT-droplet digital PCR: a breakthrough in the quantification of waterborne RNA viruses. Analytical and Bioanalytical Chemistry. 406(3), 661-667.
88. Rački N, Dreo T, Gutierrez-Aguirre I, Blejec A and Ravnikar M (2014b). Reverse transcriptase droplet digital PCR shows high resilience to PCR inhibitors from plant, soil and water samples. Plant Methods. 10(1): 42.
89. Rasmussen R, Morrison T, Herrmann M and Wittwer C (1998). Quantitative PCR by continuous fluorescence monitoring of a double strand DNA specific binding dye. Biochemica. 2, 8-11.
90. Regulation (EU) No 619/2011 of 24 June 2011 laying down the methods of sampling and analysis for the official control of feed as regards presence of genetically modified material for which an authorisation procedure is pending or the authorisation of which has expired.
91. Regulation (EU) No 1169/2011 of the European Parliament and of the Council of 25 October 2011 on the provision of food information to consumers, amending Regulations (EC) No 1924/2006 and (EC) No 1925/2006 of the European Parliament and of the Council, and repealing Commission Directive 87/250/EEC, Council Directive 90/496/EEC, Commission Directive 1999/10/EC, Directive 2000/13/EC of the European Parliament and of the Council, Commission Directives 2002/67/EC and 2008/5/EC and Commission Regulation (EC) No 608/2004.
92. Regulation (EC) No 1829/2003 of the European Parliament and of the Council of 22 September 2003 on genetically modified food and feed.
93. Sambrook JF and Russel WD (2001). Molecular Cloning: a laboratory manual. 3rd Edition, Cold Spring Harbor Laboratory Press.
94. Scollo F, Egea LA, Gentile A, La Malfa S, Dorado G and Hernandez P (2016). Absolute quantification of olive oil DNA by droplet digital-PCR (ddPCR): Comparison of isolation and amplification methodologies. Food Chemistry. 213, 388-394.
95. Sedlak RH and Jerome KR (2013). Viral diagnostics in the era of digital PCR. Diagnostic Microbiology and Infectious Disease. 75(1), 1-4.
96. Staats M, Arulandhu AJ, Gravendeel B, Holst-Jensen A, Scholtens I, Peelen T, Prins TW and Kok E (2016). Advances in DNA metabarcoding for food and wildlife forensic species identification. Analytical and Bioanalytical Chemistry. 408 (17), 4615-4630.
97. Stenfors Arnesen LP, Fagerlund A and Granum PE (2008). From soil to gut: Bacillus cereus and its food poisoning toxins. FEMS Microbiology Reviews. 32 (4), 579-606.
98. Strand DA, Holst-Jensen A, Viljugrein H, Edvardsen B, Klaveness D, Jussila J and Vrålstad T (2011). Detection and quantification of the crayfish plague agent in natural waters: direct monitoring approach for aquatic environments. Diseases of Aquatic Organisms. 95(1), 9-17.
99. Strand DA, Jussila J, Johnsen SI, Viljamaa-Dirks S, Edsman L, Wiik-Nielsen J, Viljugrein H, Engdahl F and Vrålstad T (2014). Detection of crayfish plague spores in large freshwater systems. Journal of Applied Ecology. 51(2), 544–553.
100. Taylor CT, Carbonneau J, Shelton DN and Boivin G (2015). Optimization of Droplet Digital PCR from RNA and DNA extracts withdirect comparison to RT-qPCR: Clinical implications for quantificationof Oseltamivir-resistant subpopulations. Journal of Virological Methods. 224, 58-66.
101. Trapmann S, Burns M, Broll H, Macarther R, Wood R and Žell J (2009). Guidance Docment on Measurement Uncertainty for GMO Laboratories. JRC Technical Report. EUR22756EN/2, https://ec.europa.eu/jrc/sites/jrcsh/files/eur22756en.pdf, consulted 10/07/2018
102. Trypsteen W, Kiselinova M, Vandekerckhove L, and De Spiegelaere W (2016). Diagnostic utility of droplet digital PCR for HIV reservoir quantification. Journal of Virus Eradication. 2(3), 162–169.
103. Usher CL and McCaroll SA (2015). Complex and multi-allelic copy number variation in human disease. Briefings in Functional Genomics. 14(5), 329–338.
104. Vitomirov A, Ramirez-Gaona M, Metha SR and Pérez-Santiago J (2017). Random shearing as an alternative to digestion for mitochondrial DNA processing in droplet digital PCR. Mitochondrion. 32, 16-18.

49
105. Vogelstein B and Kinzler KW (1999). Digital PCR. Proceedings of the National Academy of Sciences of the United States of America. 96(16), 9236-9241.
106. Vynck M and Thas O (2018). Reducing bias in digital PCR quantification experiments: the importance of appropriately modeling volume variability. Analytical Chemistry. 90(11). 6540-6547.
107. Wang DN, Liu L, Qiu ZG, Shen ZQ, Guo X, Yang D, Li J, Liu WL, Jin M and Li JW (2016). A new adsorption-elution technique for the concentration of aquatic extracellular antibiotic resistance genes from large volumes of water. Water Research. 92, 188-198.
108. Whale AS, Huggett JF and Tzonev S (2016a). Fundamentals of multiplexing with digital PCR. Biomolecular Detection and Quantification. 10, 15-23.
109. Whale AS, Bushell CA, Grant PR, Cowen S, Gutierrez-Aguirre I, O'Sullivan DM, Žel J, Milavec M, Foy CA, Nastouli E, Garson JA and Huggett JF (2016b). Detection of rare drug resistance mutations by digital PCR in a human influenza A virus model system and clinical samples). Journal of Clinical Microbiology. 54(2), 392-400.
110. Wilson M, Glaser KC, Adams-Fish D, Boley M, Mayda M and Molestina RE (2015). Development of droplet digital PCR for the detection of Babesia microti and Babesia duncani. Experimental Parasitology. 149, 24-31.
111. Zimmermann BG, Grill S , Holzgreve W , Zhong XY, Jackson LG and Hahn S (2008). Digital PCR: a powerful new tool for noninvasive prenatal diagnosis? Prenatal Diagnosis. 28(12), 1087-1093.
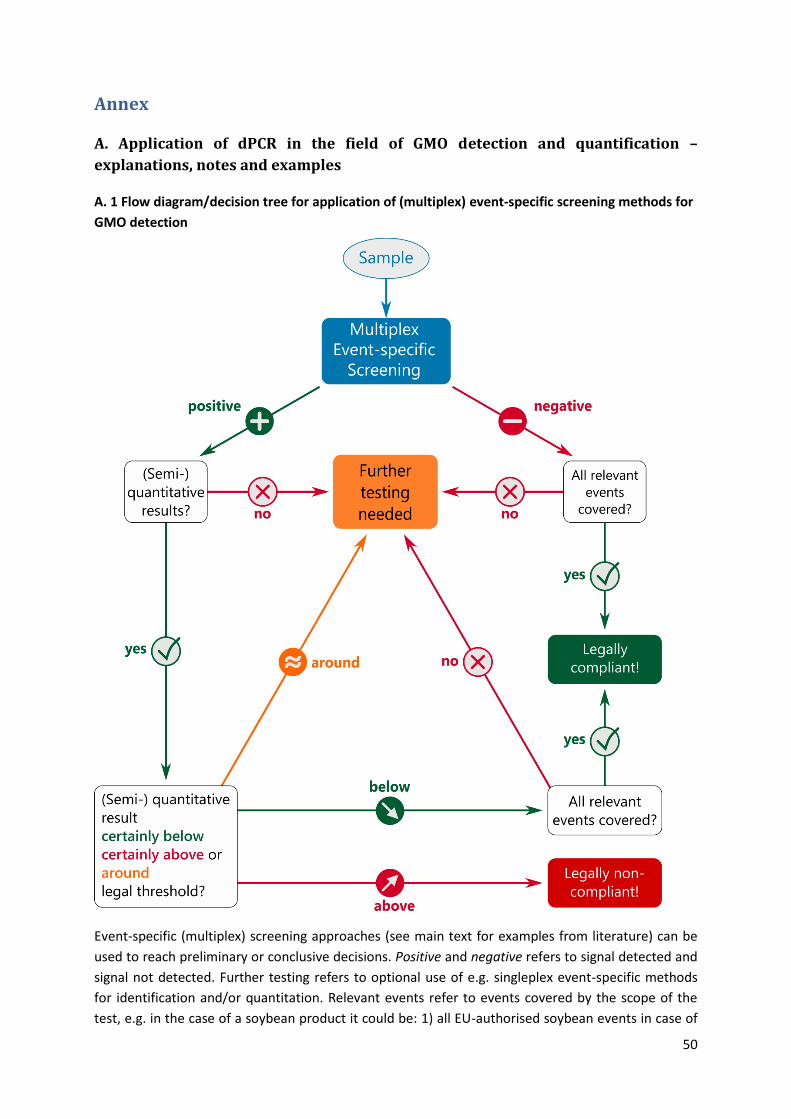
50
Annex
A. Application of dPCR in the field of GMO detection and quantification –
explanations, notes and examples
A. 1 Flow diagram/decision tree for application of (multiplex) event-specific screening methods for
GMO detection
Event-specific (multiplex) screening approaches (see main text for examples from literature) can be
used to reach preliminary or conclusive decisions. Positive and negative refers to signal detected and
signal not detected. Further testing refers to optional use of e.g. singleplex event-specific methods
for identification and/or quantitation. Relevant events refer to events covered by the scope of the
test, e.g. in the case of a soybean product it could be: 1) all EU-authorised soybean events in case of

51
testing for compliance with the authorization and labelling regulations 1829/2003 and 1830/2003; or
2) all soybean events under LLP regulation in the EU in case of testing for compliance with Regulation
EC 619/2011, respectively. Legally compliant and non-compliant refers to cases where the product is
or is not compliant with the legal requirements in e.g. one of the mentioned regulations. Certainly
above or below a legal threshold refers to the inferred concentration/value after taking the
associated measurement uncertainty into account.
A. 2 Lambda optimised approach
The dynamic range of a dPCR may cover four to six orders of magnitude, approaching those of qPCR
(up to seven orders of magnitude), depending on the partition number of the dPCR device used
(RainDance Technologies device; Jones et al., 2016). It should be mentioned that some
devices/analysis tools allow several wells to be merged in order to increase the number of partitions
analysed and thus to increase the dynamic range. However, as described for chamber dPCR (BioMark
device; Bhat et al., 2009) or droplet dPCR (Bio-Rad device; Pinheiro et al., 2012; Deprez et al., 2016),
the relative uncertainty of the determined concentration is not constant across the dynamic range.
The stochastic effect (i.e. impact on measurement uncertainty) associated with the (sub-)sampling
(* see note) of a DNA solution increases as the concentration of the DNA solution decreases. It is
advisable for dPCR to check the copy numbers of a DNA solution in a test run in order to determine
reference and transgene copy numbers. Alternatively, multiple dilutions of DNA can be analysed
simultaneously. For samples with low GM content (** see note), i.e. where a low number of
transgenic copies are present among a high number of copies of species reference gene, it is advised
to use at least two different DNA dilutions.
DNA copy number concentration adjustments can be achieved by testing the DNA extracts at two
dilutions, one optimised dilution for the reference gene reaction and one optimised dilution for the
transgene reaction. This optimisation avoids having either too many negative or positive partitions
for both transgenic and reference gene reaction.
The DNA copy number determination can be done either by simplex or by duplex dPCR, depending
on the laboratories´ preference. The result is then determined by combining the results of the two
"lambda optimised" reactions taking the dilution factors of the DNA solutions used into account.
* Note: The term ´sampling´ refers to the fact that not the entire PCR reaction (including the DNA
molecules) is read in the droplet reader (´dead volume´).
** Note: For the present Bio-Rad System (QX100 or QX200) low transgenic DNA copy numbers would
correspond to approximately 0.1 %. For other devices, it could be higher or lower depending on the
number of partitions used.
Example for a ddPCR device with a maximum of 20,000 droplets generated:
A maize sample containing 0.1 % (m/m) of MON 810 (hemizygous for the transgene), that sample –
assuming a conversion factor (zygosity) of 0.5 – contains 2,000 times more species specific DNA
copies (hmg) than MON 810 transgene copies. Considering a DNA solution (with 5 µL of that solution
in a total dPCR volume of 22 µL) containing 8,282 copies (*** see note) of hmg per µL DNA solution
and (theoretically) more than 4 copies of MON 810 (2,000 times less). The lambda value (λ = number
of DNA copies per droplet in a ddPCR, see 4.1) for the hmg reaction will be close to 1.6. At this
lambda value, the conversion of positive droplets into copies has the lowest variability and the

52
dilution applied to the DNA extract is indeed optimal for that hmg reaction. However, the lambda
value for the MON 810 reaction in this diluted DNA sample will be below 0.001 (Table A 1a, No 1),
which is not optimal considering the error due to Poisson variation (Lievens et al., 2016). When, for
example, measuring a few transgene DNA copies less, the result (GMO percentage) will substantially
change (Table A 1a, No 2). When scaling up the DNA quantity (e.g. roughly three or six times) used in
PCR, lambda for MON 810 can be improved (Table A 1a, No 3 and 4). The lambda optimised ddPCR
results can then be combined (Table A 1b, No 5 and 6).
Table A 1a. Lambda values in ddPCR for a 0.1 % (m/m) heterozygous gm maize material at different DNA sample
concentrations
No
ddPCR
+ d total d estimated
cp in total d ***
λ [cp/d]
DNA diluted sample [cp/µL]
***
Ratio cp/cp
[%]
Ratio m/m [%] a)
DNA dilution factor
1 hmg 13,568 17,000 27,200 1.6001 8,282
0.051 0.103 6.0 MON 810 14 17,000 14 0.0008 4.26
2 hmg 13,568 17,000 27,200 1.6001 8,282
0.033 0.066 6.0 MON 810 9 17,000 9 0.0005 2.74
3 hmg 16,869 17,000 82,716 4.8658 25,187
0.048 0.097 2.0 MON 810 40 17,000 40 0.0024 12.19
4 hmg 16,999 17,000 165,592 9.7410 50,422
0.048 0.097 1.0 MON 810 80 17,000 80 0.0047 24.42
+ d: positive droplets cp: DNA copy number total d: total measured (accepted) droplets λ = number of estimated DNA copies per droplet [cp/d] a)
: a conversion factor (CF) of 0.5 was assumed to convert cp/cp [%] into m/m [%]
Table A 1b. Combination of lambda optimised ddPCR results taking different dilution factors into account
No
ddPCR
+ d total d
estimated cp in
total d ***
λ [cp/d]
DNA diluted sample [cp/µL]
***
DNA not
diluted cp/µL ***
Ratio m/m [%] a)
DNA dilution factor
5 hmg 13,568 17,000 27,200 1.6001 8,282 49,695
0.097 6.0
MON 810 40 17,000 40 0.0024 12.19 24.39 2.0
6 hmg 13,568 17,000 27,200 1.6001 8,282 49,695 0.097 6.0
MON 810 80 17,000 80 0.0047 24.42 24.42 1.0
*** Note: The average droplet volume was assumed to be 0.85 nL according to Bio-Rad software
QuantaSoft (from version 1.6.6.0320 onwards). There is strong evidence that the average droplet
volume is actually smaller, ranging from 0.837 nL (Dong et al., 2015) and 0.834 nL (Corbisier et al.,
2015) to 0.718 nL (Košir et al., 2017b), the latter volume depending on the cartridges, droplet
generator and master mix used. The (assumed) droplet volume has an impact on the calculation of
absolute copy number concentration only. For the determination of a copy number ratio, the
average droplet volume has no influence on the calculation results.
53
In such a case, where low DNA copies (e.g. transgene) are to be quantified, the measurement of two
different dilutions of the DNA extract should be considered. In the above mentioned (theoretical)
example the DNA extract was diluted to optimize the hmg reaction (lambda = 1.6). A three to six
times more concentrated — i.e. less diluted — DNA extract (Table A 1a, No 3 and 4) will improve the
lambda values for the MON 810 reaction (0.0024 and 0.0047, respectively) but will finally saturate
the hmg reaction (BioRad Bulletin 6407 Rev A; Taylor et al., 2015). In order to optimise the transgenic
reaction and to reduce uncertainties at low DNA concentration due to positive droplet count
variation, the number of positive droplets should give the result in copies per reaction above the LOQ
of a specific method.
A. 3 Practical aspects of multiplex dPCR
1. Multiplex PCR with several probes labelled with the same fluorescent dye may increase the
background fluorescence of the negative droplets reducing the distance between the negative
cluster and the positive cluster(s) (Dobnik et al., 2015). A reduced discrimination between the
clusters may increase the chance of droplet misclassification and may make quantification of low
GM contents more challenging. Therefore optimization and validation of the method is necessary,
as for any method or approach.
2. The copy number ratio measured by dPCR needs to be converted into a mass fraction. The applied
conversion factor (CF) needs to be linked to the calibrant used in qPCR (to obtain comparable and
traceable results between qPCR and dPCR techniques). A conversion factor is determined for each
certified reference material (CRM) (Corbisier et al., 2017).
3. A multiplex approach for heterozygous GM material (e.g. GM maize), which sums up different GM
contents per species, forces use of a generic species CF which may increase the uncertainty of the
measurement, if individual CFs deviate significantly from the generic CF. This is particularly
relevant, when quantification at concentrations around a legal threshold is performed. In such
cases the performance of individual (singleplex) quantification reactions is recommended.
B. Technical part specific for the implementation of dPCR in a laboratory
In this section a summary of technical recommendations, explanations and notes are given, that are
specific to dPCR. For other issues, such as acceptance criteria for method performance, the same
requirements apply as for qPCR (Marchesi et al., 2015), if applicable.
B. 1 dPCR platform verification
B.1.1 DNA copy number determination
When establishing a new dPCR device in a laboratory, it has to be demonstrated at least once, that
the laboratory is able to properly use this device and DNA copy numbers can be determined with
sufficient accuracy in terms of precision and trueness. This is ideally done with reference material
certified for absolute DNA copy numbers, if available. Alternatively reference material can be used
that is certified for DNA copy ratio (e.g. ERM®-BF425c , Meyer et al., 2010) or for mass/mass fraction.
A list of certified reference materials is available e.g. at the JRC
(https://ec.europa.eu/jrc/sites/jrcsh/files/rm_catalogue_170424.pdf).

54
B. 1.2 Fraction of sample compartmentalised
There is an increase in variability as less of the total sample is compartmentalized ('dead volume').
However, for endogene λ = 3 (lambda, λ is the average number of targets per partition) and 1 %
analyte, one has to go down to very low levels of compartmentalisation/partitioning (< 10 %) before
the chance of excessive error (> 25 %) becomes greater than 1 in 20 (i.e. 95 % of the simulations have
less than 25 % relative error). For lower levels of analyte, more compartmentalisation is required to
keep 95 % of the simulations below 25 % error, and the same is true for lower values of λ. Based on
in silico simulations (Lievens et al., 2016) it is proposed to require at least 30 % compartmentalisation
for quantification down to 1 %, and 50 % compartmentalisation for quantification down to 0.5 %.
Note: Both droplet and chamber-based dPCR systems are subject to variability in the number of
compartments that are generated and/or accepted into the analysis. Additionally, most
compartmentalisation techniques have a certain ‘dead volume’. As a consequence, and unlike in
qPCR, not the entire volume of sample loaded into the chamber/droplet generator is analysed. This
essentially corresponds to a form of sub-sampling which may in turn add variation or error the
quantification, especially for reactions with targets at very low abundance.
B.1.3 Dynamic Range
The dynamic range of the platform should be assessed. This can be done by analysing serial dilution
of DNA with known DNA content (e.g. Jones et al., 2016). The dynamic range of a dPCR increases, as
the number of partitions analysed increases.
B. 2 Method transfer of qPCR methods into a dPCR format
When a qPCR method is to be transferred into a dPCR format it is recommended to start with the
examination of the reaction conditions (primer and probe concentrations; temperature profile for
DNA amplification) as described for the validated qPCR method. Nevertheless this is not always
possible, e.g. as certain platforms require specific master mixes.
In case the parameters for dPCR are respected, e.g. single target amplification, amount of rain and
resolution is acceptable, use the method as such. Otherwise, if the method is to be modified, then
take into consideration the following parameters and aspects:
Annealing temperature
Primer and/or probe sequence. In case primer/probe sequence are changed, a full validation
of such a new method is needed (Marchesi et al., 2015)
Use certified reference material (if available) to check for accuracy (trueness and precision),
ideally certified for DNA copies (range between 10–100,000 per reaction, 6 parallel reactions
per dilution)
If the composition of an alternative master mix is known and comparable to the conditions of
the validated master mix, then the re-assessment of specificity is not required. Otherwise, an
experimental check on selected targets (e.g. GM targets and taxa) is recommended
B. 2.1 Peak resolution and intermediate signals in ddPCR
The conditions for establishing the following parameters should ideally be around λ = 0.7
(corresponding to 50 % positive and 50 % negative droplets):

55
B. 2.1.1 Minimal peak resolution (𝑹𝒔)
The resolution of a digital assay (Rs) is a quantitative measure of how well the two populations
(positive and negative) can be differentiated in a linear separation. It is defined as the difference in
fluorescence between the two peaks, divided by the combined widths of the peaks:
𝑅𝑠 = 2 ∗ (𝑡𝑝 − 𝑡𝑛)
𝑤𝑝 + 𝑤𝑛
where the subscript p indicates the population with the higher fluorescence (positive, as opposed to
n for the negatives). The variables t and w are the peak fluorescence and peak width, respectively.
Minimal peak resolution (𝑅𝑠) should be at least 2.0, preferably higher than 2.5
B. 2.1.2 Intermediate signals (rain)
Intermediate signals (rain) may be defined as the compartments whose fluorescence readings are
between the maximal fluorescence of the negative cluster and the minimal fluorescence of the
positive cluster.
Intermediate signals (rain) should be less than 2.5 % of the total number of partitions
B.2.1.3 Threshold setting for analysis
Threshold setting for classification of partitions as positive or negative should be set just above the
cluster of negative partitions. Although there is no clear consensus, due to practical experience a
reaction is usually considered positive, when the number of positive partitions exceeds two (Dobnik
et al., 2015).
Note: No template control (NTC) samples, generating only negative partitions, can help in setting the
threshold, however, an inspection of all wells/panels is recommended. The fluorescence amplitude
of the negatives in individual wells/panels might be slightly higher or lower than NTCs, thus in such
cases threshold can be adjusted individually to avoid misclassification of droplets.
B. 3 Optimization of dPCR
B. 3.1 DNA extraction
Some DNA extraction methods might interfere with droplet generation. The impact of the extraction
method on downstream workflow should therefore be evaluated once. This can be done by
extracting a) a certified reference material, and b) a food sample, with the standard DNA extraction
methods applied in a specific laboratory. Some extraction method may show significantly deviating
(poor) performance (e.g. in terms of yield and purity) when applied to certain matrices compared to
another method. Therefore yield and purity should be checked beforehand and a method should be
chosen that gives favoured performance with that matrix.
B. 3.2 DNA pre-treatment
Under certain conditions (e.g. to separate tandem gene copies, to increase random partitioning, to
reduce sample viscosity of high molecular DNA solutions) pre-treatment of DNA (e.g. with DNA
dependent restriction endonucleases, 4- or 6-base recognition sites) may be required in order to
increase accuracy of dPCR measurement. This is to digest the DNA with enzymes (DNA dependent

56
restriction endonucleases, e.g. with 4- or 6-base recognition sites). It should be checked and verified,
that the enzyme used does not cut the target DNA sequence of interest (i.e. the DNA sequence of the
PCR generated amplicon). Additionally it is recommended to check the efficacy of digestion step e.g.
by gel-electrophoresis.
Note: It should be avoided to expose DNA to sustained elevated temperatures or alkaline solution as the
different strands of fully denatured molecules may be divided across different partitions, leading to two
positives for a single (double stranded) target copy. As a consequence, if a significant portion of the sample
DNA is denatured, the amount of target will be overestimated if the user assumes that only double-stranded
DNA is quantified.
B. 3.3 Target DNA concentration
There is an optimal concentration of target molecules per partition that should yield the least
random sampling variability. This optimal value of λ for absolute quantification is approximately 1.6.
In practice, this value is not always achievable, especially when analysing samples with low target
DNA concentrations (see Annex A. 1).
B. 3.4 PCR reaction
• In general, the temperature profile used in qPCR can be directly applied to dPCR.
However, one should always check the manufacturer's recommendations for specific
requirements. For example, in droplet-based systems, a final step at higher temperature
(e.g. 98 °C, 10 min for the Bio-Rad QX100/200 ddPCR systems) may be mandatory to
further stabilize the droplets prior to detection with the droplet reader.
• Sometimes it is advisable to run an annealing temperature gradient to find the optimal
annealing temperature. In case of co-amplification of a secondary target (multiple clouds
of positive droplets in ddPCR) one can increase the annealing temperature in order to
generate only one cloud of positive droplets. Lowering the annealing temperature can
lead to better separation between positive signals and background noise.
• Primer and probe concentration can be adjusted if necessary. For testing higher and
lower primer and probe concentration than given in the original qPCR method protocol
can be used. Higher primer and probe concentrations usually increase the intensity of the
end-point fluorescence signal and thus allow better separation of the background noise
from specific signals, aiding more accurate quantification of the target. If deemed
necessary a primer/probe concentration gradient can be run to improve resolution.
• Touch down PCR can also be applied to enhance specificity which can lead to less rain.
Possible conditions for annealing are, e.g. 15 cycle at 63 °C and 15 cycles at 60 °C.
• Increasing the number of amplification cycles can reduce intermediate signals ("rain" in
ddPCR), e.g. due to late PCR onset caused by partial inhibition. Suggested total cycle
numbers are, e.g. 45, 50, 60 or 75).

GETTING IN TOUCH WITH THE EU
In person
All over the European Union there are hundreds of Europe Direct information centres. You can find the address of the centre nearest you at: https://europa.eu/european-union/contact_en
On the phone or by email
Europe Direct is a service that answers your questions about the European Union. You can contact this service:
- by freephone: 00 800 6 7 8 9 10 11 (certain operators may charge for these calls),
- at the following standard number: +32 22999696, or
- by electronic mail via: https://europa.eu/european-union/contact_en
FINDING INFORMATION ABOUT THE EU
Online
Information about the European Union in all the official languages of the EU is available on the Europa website at: https://europa.eu/european-union/index_en
EU publications You can download or order free and priced EU publications from EU Bookshop at:
https://publications.europa.eu/en/publications. Multiple copies of free publications may be obtained by
contacting Europe Direct or your local information centre (see https://europa.eu/european-
union/contact_en).

kJ-N
A-2
9673-E
N-N
doi:10.2760/192883
ISBN 978-92-76-00180-5