osteoporosis : definition consensus development 1993 normal trabecular bone osteoporotic trabecular...
TRANSCRIPT


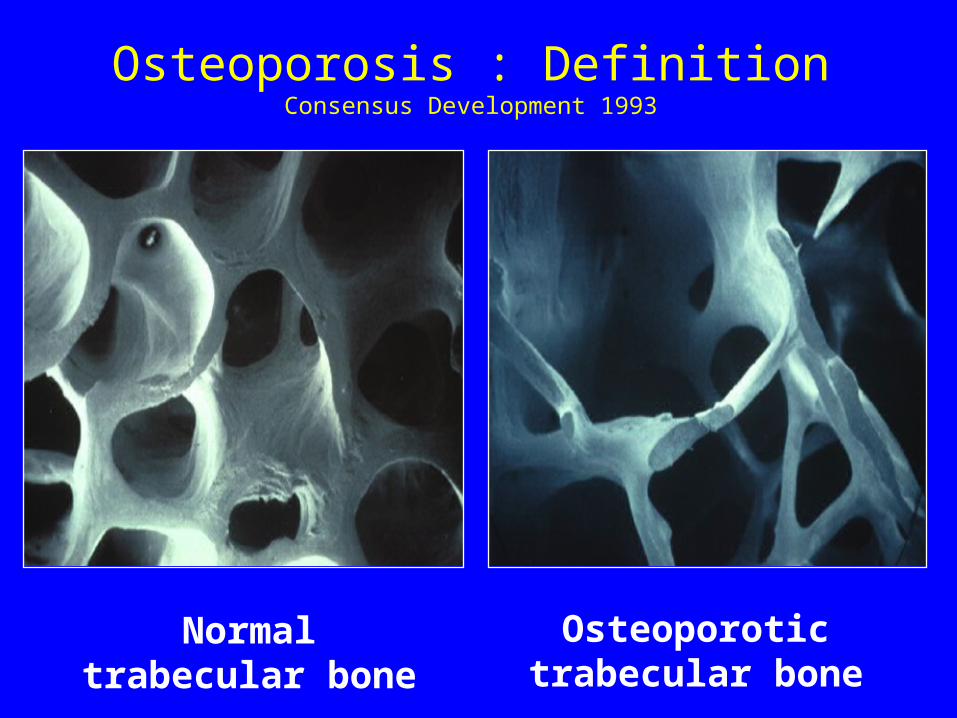
Osteoporosis : DefinitionConsensus Development 1993
Normal trabecular bone
Osteoporotic trabecular bone

Detecting patients at risk. • Risk factors assessment
• BMD testing
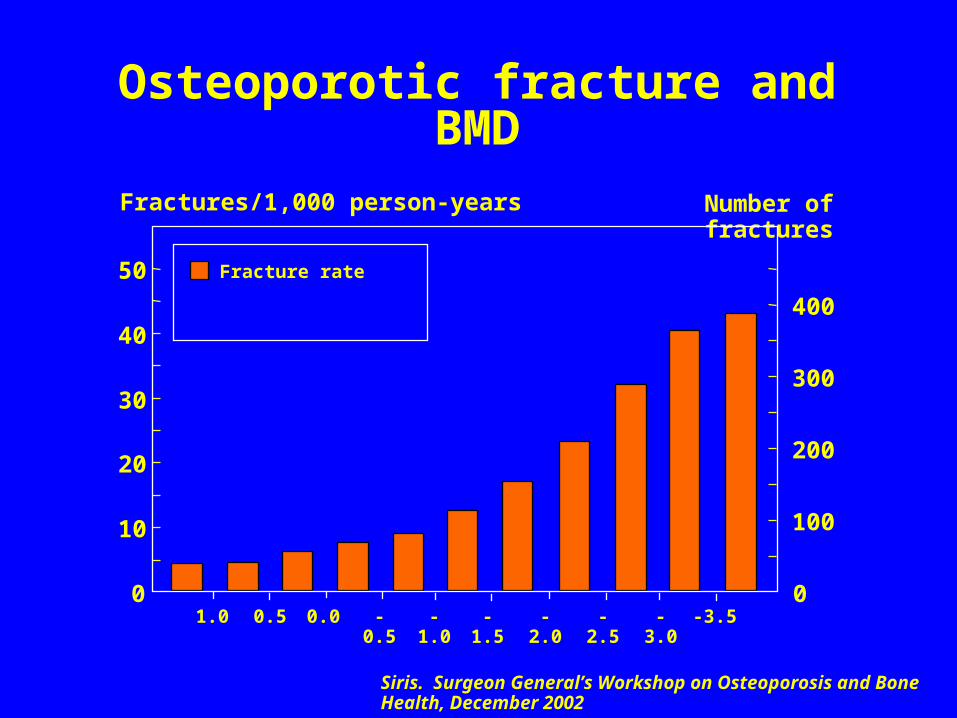
05ca085 Osteoporotic fracture and BMD
Fractures/1,000 person-years Number of fractures
1.0 0.5 0.0 -0.5 -1.0 -1.5 -2.0 -2.5 -3.0 -3.5
Fracture rate
0
10
20
30
40
50
0
100
200
300
400
Siris. Surgeon General’s Workshop on Osteoporosis and Bone Health, December 2002

05ca085 Osteoporotic fracture and BMD
Fractures/1,000 person-years Number of fractures
1.0 0.5 0.0 -0.5 -1.0 -1.5 -2.0 -2.5 -3.0 -3.5
Fracture rate
Women with fractures
0
10
20
30
40
50
0
100
200
300
400
Siris. Surgeon General’s Workshop on Osteoporosis and Bone Health, December 2002

T-score (SD)
-3 -2 -1 0 10
10
20
Fracture probability (%)
50
60
70
80
Age (years) Women
Ten year probability of hip fracture in Sweden
00ca104


Holy Smoke !


FRAX (http://www.shef.ac.uk/FRAX).
• A computer-based algorithm -> 10 yr probability hip & osteoporotic fractures
• Clinical risk factors (+ BMD). • From population-based cohorts around the
world & validated in independent cohorts with a similar geographic distribution.
• should not be considered as a gold standard, but rather as a platform technology
• Adapted from Kanis et al 2009

09ca001
Cohorts studied
EVOS/EPOS Hiroshima CaMos Rochester Sheffield
Rotterdam Kuopio Gothenburg (2) EPIDOS Dubbo
OFELY THIN SOF York Geelong (2)
OPUS PERF Miyama SEMOF WHI
n = 289,718 person-years = 1,458,427
Osteoporotic fractures = 18,678 hip fractures = 4314
22 population based cohorts from Europe, North America, Asia, Australasia

05ca186 Prior fracture and hip fracture risk
0
2
4
6
50 55 60 65 70 75 80 85
Age (years)
RR
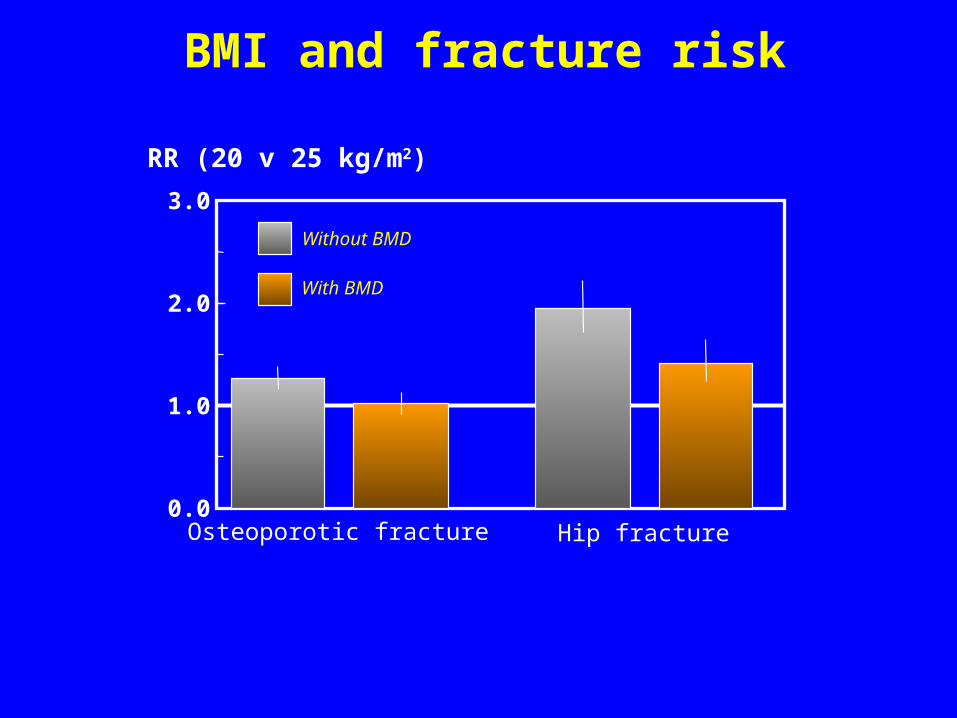
07ca080 BMI and fracture risk
0.0
1.0
2.0
3.0
Osteoporotic fracture Hip fracture
RR (20 v 25 kg/m2)
Without BMD
With BMD

05ca106
0
10
20
30
40
50
60
70
0 -1 -2 -3
T-score
0 -1 -2 -3
NonePrior fracture+Glucocorticoids+Family history
Men Women
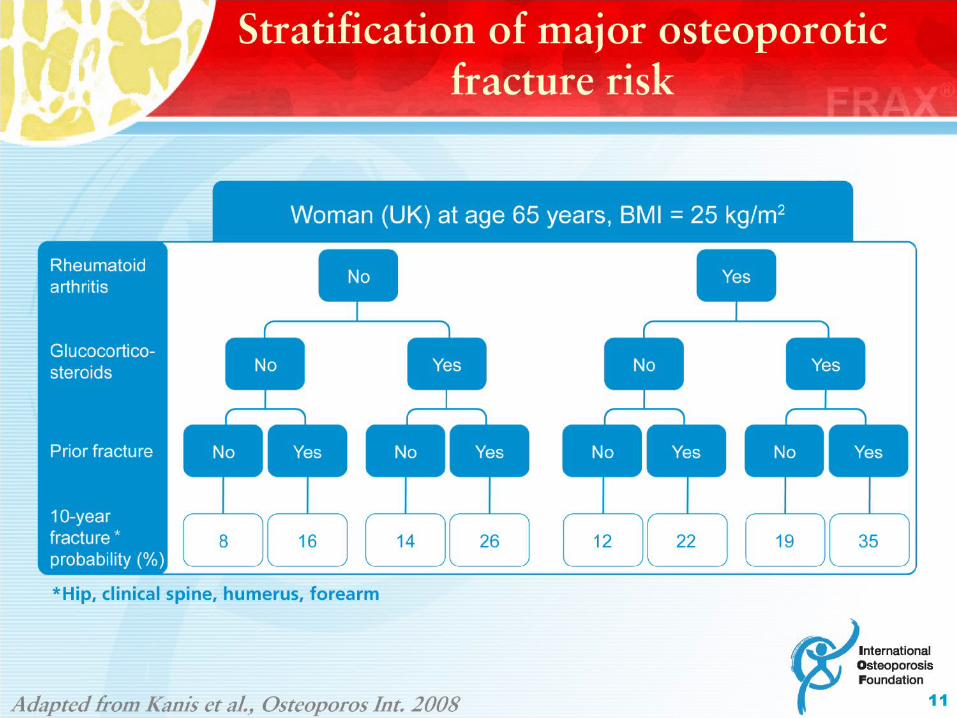
US Caucasian, no CRF, BMI=24*Hip, clinical spine, humerus, forearm
Probability of osteoporotic fracture* at age 65
10-year probability (%)
FRAX®

http://www.shef.ac.uk/FRAX/


0
5
10
15
20
25
30
55 y 65 y 75 y 85 y
Spain
France
Italy
UK
Sweden
• Frax (WHO fracture assesment tool)
• 10 year probability (%) of major osteoporotic fracture for a woman at no particular risk at ages 55, 65, 75, 85
%
Frax 2.0 (beta vesrion)

09ca121Figure 1
0
5
10
15
20
25
30
35
50 60 70 80 900
5
10
15
20
25
30
35
50 60 70 80 90
Risque absolu à 10 ans de fracture (%)
-4
-3
-2
-1
0
1
T-score
Age (années)
Hommes Femmes
Courtesy of JY Reginster 2009
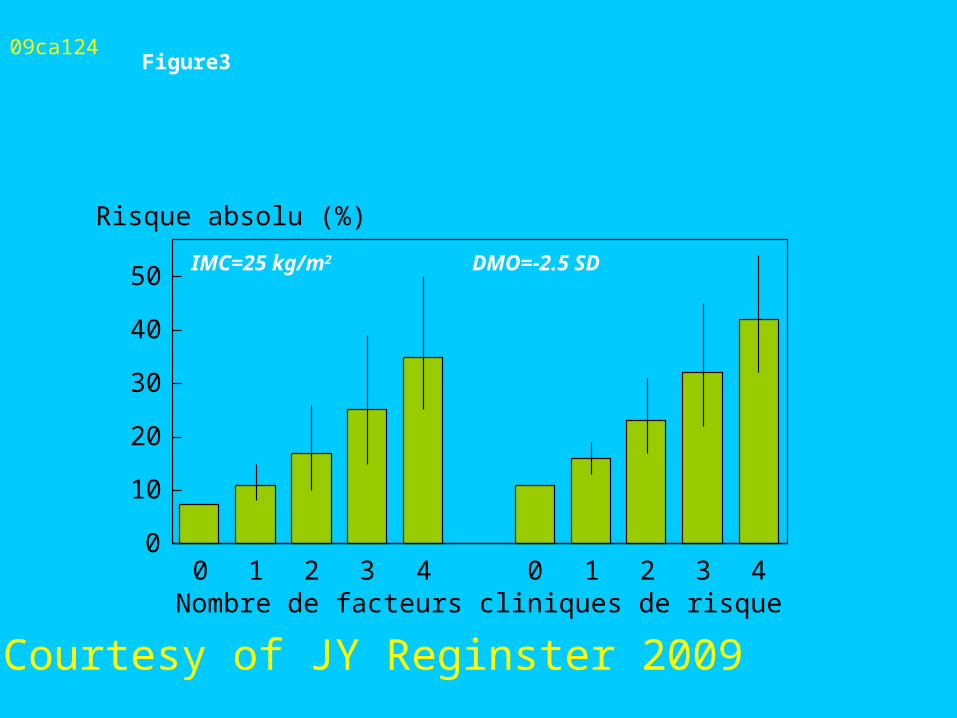
09ca124Figure3
0
10
20
30
40
50
0 1 2 3 4 0 1 2 3 4Nombre de facteurs cliniques de risque
Risque absolu (%)
IMC=25 kg/m2 DMO=-2.5 SD
Courtesy of JY Reginster 2009
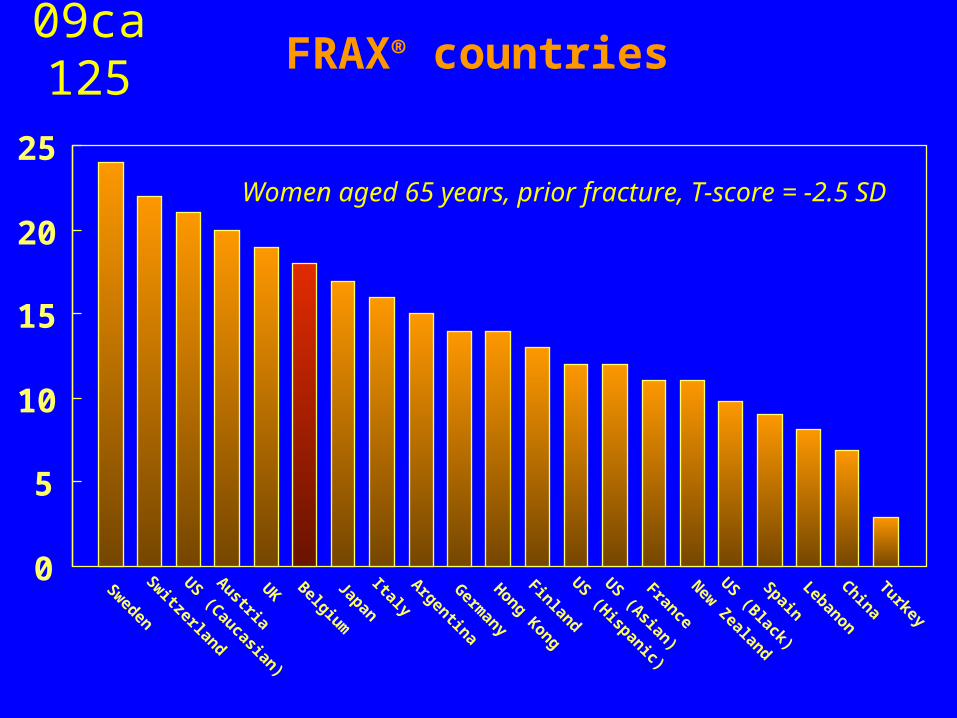
09ca125 FRAX® countries
0
5
10
15
20
25
Sweden
Switzerland
US (Caucasian)
Austria
UK Belgium
Japan
ItalyArgentina
Germany
Hong Kong
Finland
US (Hispanic)
US (Asian)
France
New Zealand
US (Black)
Spain
Lebanon
China
Turkey
Women aged 65 years, prior fracture, T-score = -2.5 SD


09ca122Figure 2
Risque absolu à 10 ans de fracture (%)
Fracture de hanche
0
2
4
6
8
10
12
14
16
50 55 60 65 70 75 80 85 90
Age (années)
Fracture majeure
0
5
10
15
20
25
30
35
50 55 60 65 70 75 80 85 90
Envisager traite
ment
Envisager traite
ment
Courtesy of JY Reginster 2009

Reducing fracture risk is the goal
• Modeling suggests that intervention can be cost-effective
at around 10-15% 10 year individualised fracture risk
• Can estimate 10 yr. fracture risk by using
– FRAX website programme
– Tables from FRAX website relating
BMD/age/risk factors
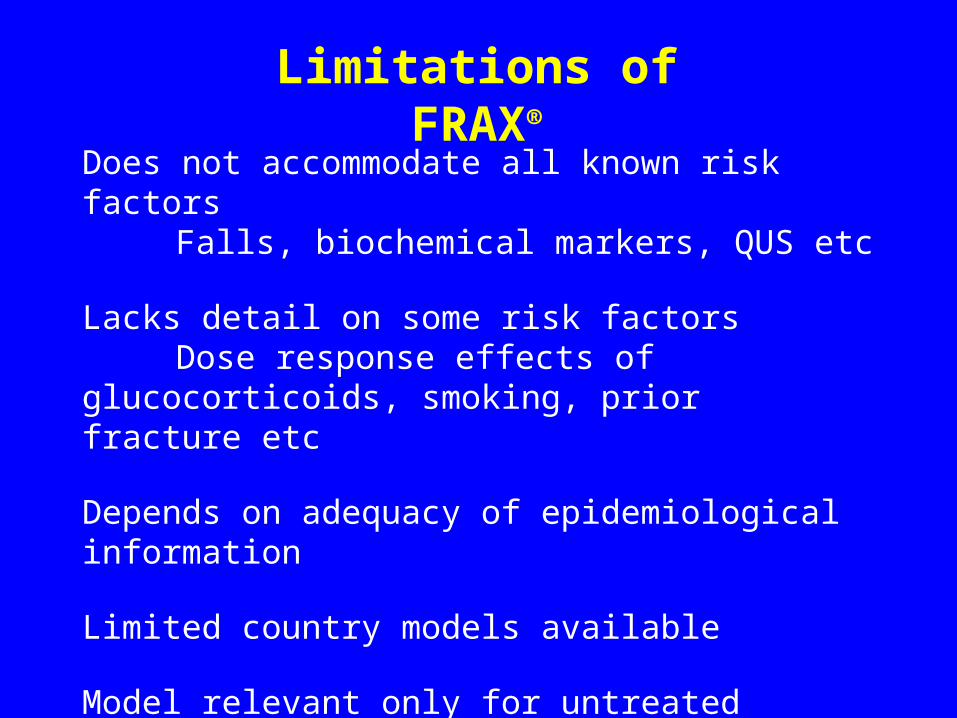
08ca100Limitations of FRAX®
Does not accommodate all known risk factorsFalls, biochemical markers, QUS etc
Lacks detail on some risk factorsDose response effects of glucocorticoids, smoking,
prior fracture etc
Depends on adequacy of epidemiological information
Limited country models available
Model relevant only for untreated patients
Does not replace clinical judgment

A ballerina at Mariinsky Theatre in St. Petersburg, Russia, 1998 by Sisse Brimberg


Application of the WHO fracture risk assessment tool FRAXR in a Spanish population
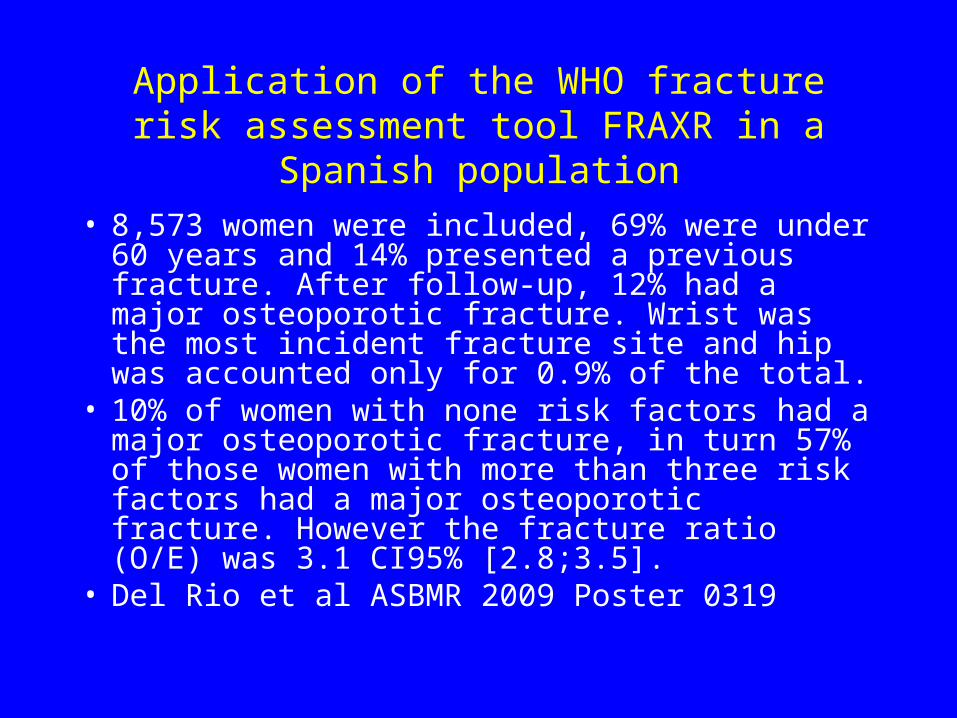
• 8,573 women were included, 69% were under 60 years and 14% presented a previous fracture. After follow-up, 12% had a major osteoporotic fracture. Wrist was the most incident fracture site and hip was accounted only for 0.9% of the total.
• 10% of women with none risk factors had a major osteoporotic fracture, in turn 57% of those women with more than three risk factors had a major osteoporotic fracture. However the fracture ratio (O/E) was 3.1 CI95% [2.8;3.5].
• Del Rio et al ASBMR 2009 Poster 0319
Application of the WHO fracture risk assessment tool FRAXR in a Spanish population
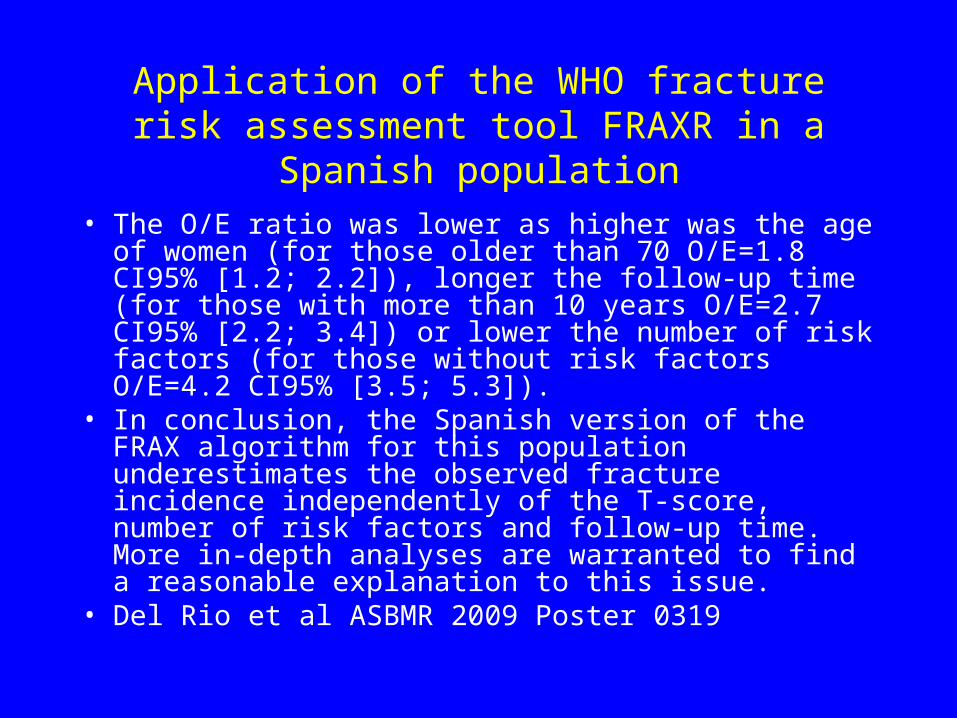
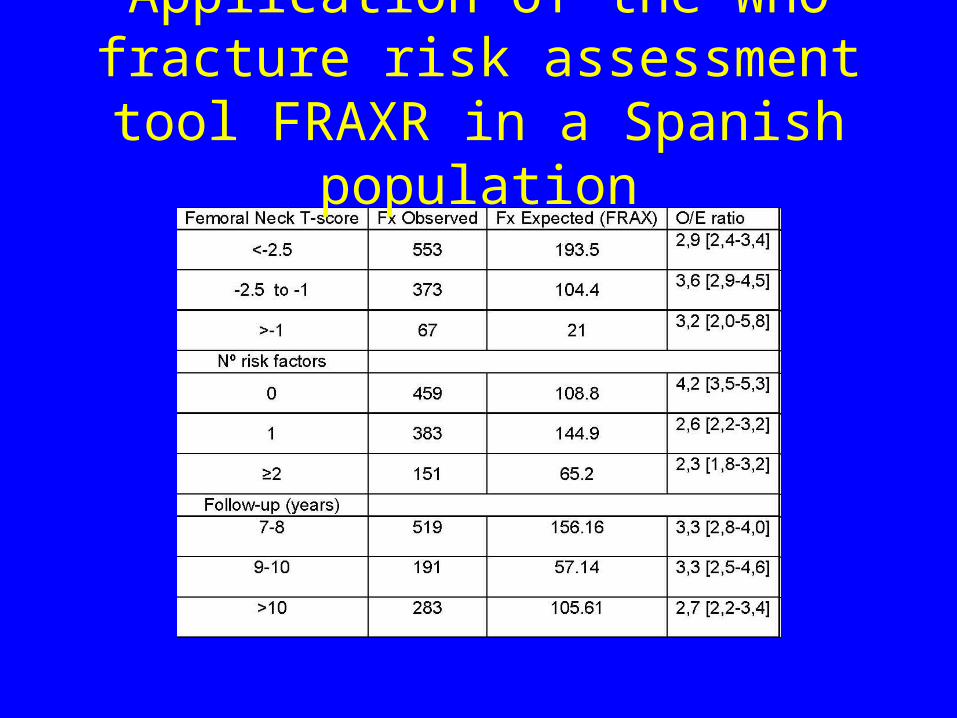
• The O/E ratio was lower as higher was the age of women (for those older than 70 O/E=1.8 CI95% [1.2; 2.2]), longer the follow-up time (for those with more than 10 years O/E=2.7 CI95% [2.2; 3.4]) or lower the number of risk factors (for those without risk factors O/E=4.2 CI95% [3.5; 5.3]).
• In conclusion, the Spanish version of the FRAX algorithm for this population underestimates the observed fracture incidence independently of the T-score, number of risk factors and follow-up time. More in-depth analyses are warranted to find a reasonable explanation to this issue.
• Del Rio et al ASBMR 2009 Poster 0319
Application of the WHO fracture risk assessment tool FRAXR in a
Spanish population
Comparison of 10-Year Probability of Hip Fracture Predicted by FRAX and Observed Hip Fracture
Incidence in the Framingham Osteoporosis Study
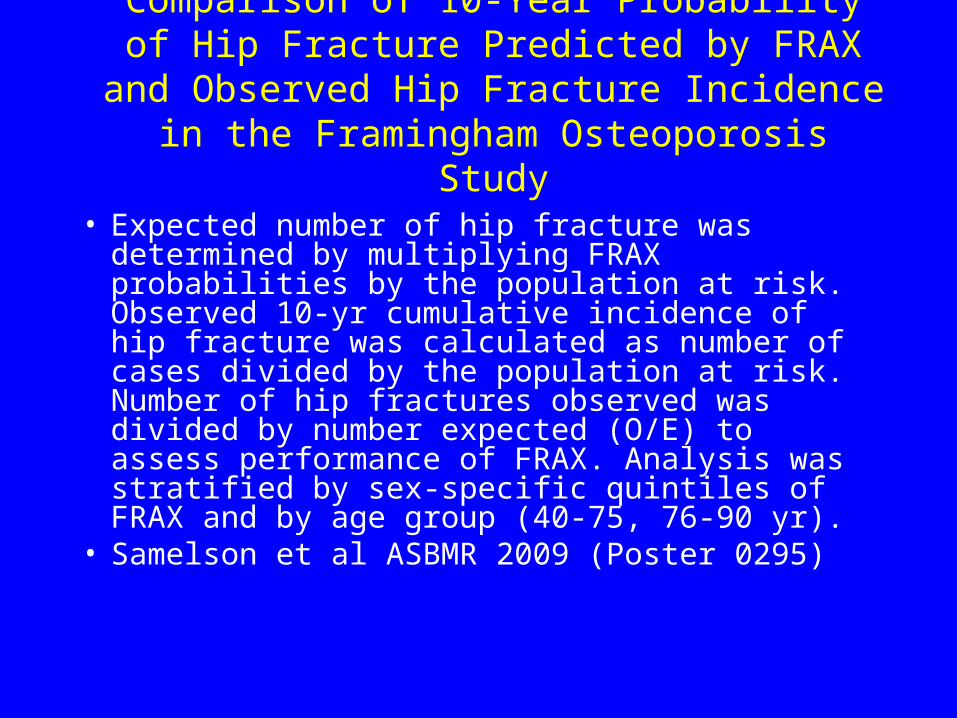
• Expected number of hip fracture was determined by multiplying FRAX probabilities by the population at risk. Observed 10-yr cumulative incidence of hip fracture was calculated as number of cases divided by the population at risk. Number of hip fractures observed was divided by number expected (O/E) to assess performance of FRAX. Analysis was stratified by sex-specific quintiles of FRAX and by age group (40-75, 76-90 yr).
• Samelson et al ASBMR 2009 (Poster 0295)

Comparison of 10-Year Probability of Hip Fracture Predicted by FRAX and Observed Hip Fracture
Incidence in the Framingham Osteoporosis Study• Mean age of participants was 65 yrs. 10-yr incidence of hip fracture was 0.031
(163 observed), nearly identical to FRAX predicted probability (0.032; 166 expected), yielding O/E=0.980 (CI:0.835-1.136). O/E ratios were similar across quintiles of predicted probabilities (TABLE). Findings were similar for women and men, however, the relatively small number of fractures in men resulted in unstable estimates. For example, 10-yr incidence in women was 0.045 (133 observed) compared to predicted probability of 0.042 (125 expected) yielding O/E=1.060 (CI:0.887-1.248); incidence in men was 0.013 (30 observed) compared to predicted probability of 0.018 (40 expected), yielding O/E=0.733 (CI:0.494-1.019). In persons 76-90 yrs, O/E=1.315 (CI:1.061-1.596). In contrast, O/E=0.732 (CI:0.570-0.913) for participants 40-75 yrs. Overall, FRAX performed well in predicting 10-yr probability of hip fracture in a large, population-based study of U.S. Caucasian women and men. However, FRAX underestimated hip fracture risk 32% in persons 76-90 yrs and overestimated risk 27% in those 40-75 yrs.
• Samelson et al ASBMR 2009 (Poster 0295)

Comparison of 10-Year Probability of Hip Fracture Predicted by FRAX and Observed Hip Fracture
Incidence in the Framingham Osteoporosis Study
• Overall, FRAX performed well in predicting 10-yr probability of hip fracture in a large, population-based study of U.S. Caucasian women and men.
• However, FRAX underestimated hip fracture risk by 32% in persons 76-90 yrs and overestimated risk by 27% in those 40-75 yrs.
• Samelson et al ASBMR 2009 (Poster 0295)

Prediction of absolute risk of fracture
by validation of risk factors in a
Belgian cohort followed during 10
yearsFRISBEE (FFractures RIsk Study Brussels
Epidemiological Enquiry)
Courtesy of JJ Body
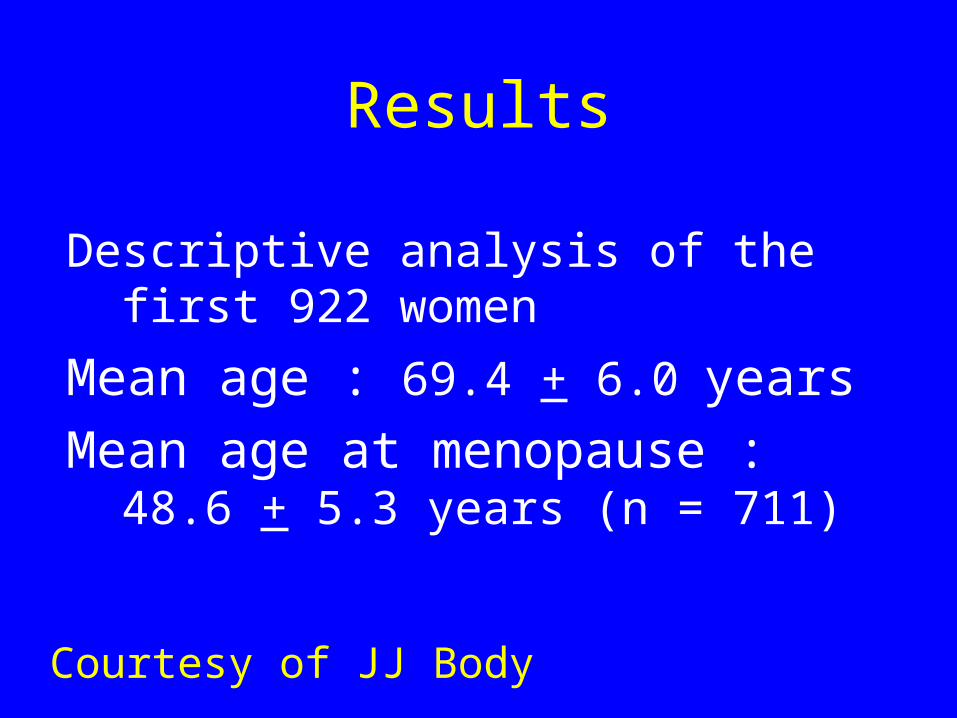
Results
Descriptive analysis of the first 922 women
Mean age : 69.4 + 6.0 years
Mean age at menopause : 48.6 + 5.3 years (n = 711)
Courtesy of JJ Body

Results
-2.4 -1.8 -1.2 -0.5 0 0.5 1.2 1.8 2.4 3 3.6 4.2 4.8 5.4Z- Score
Bone mass: z-score distribution

Results
Nombre de facteurs de risque de fracture présents
6.5
23.226.6
21.8
11.8 10.2
0
5
10
15
20
25
30
0 1 2 3 4 >= 5
Nombre de facteurs de risque
%
Number of RFs
Subject distribution as a function of the number of risk factors
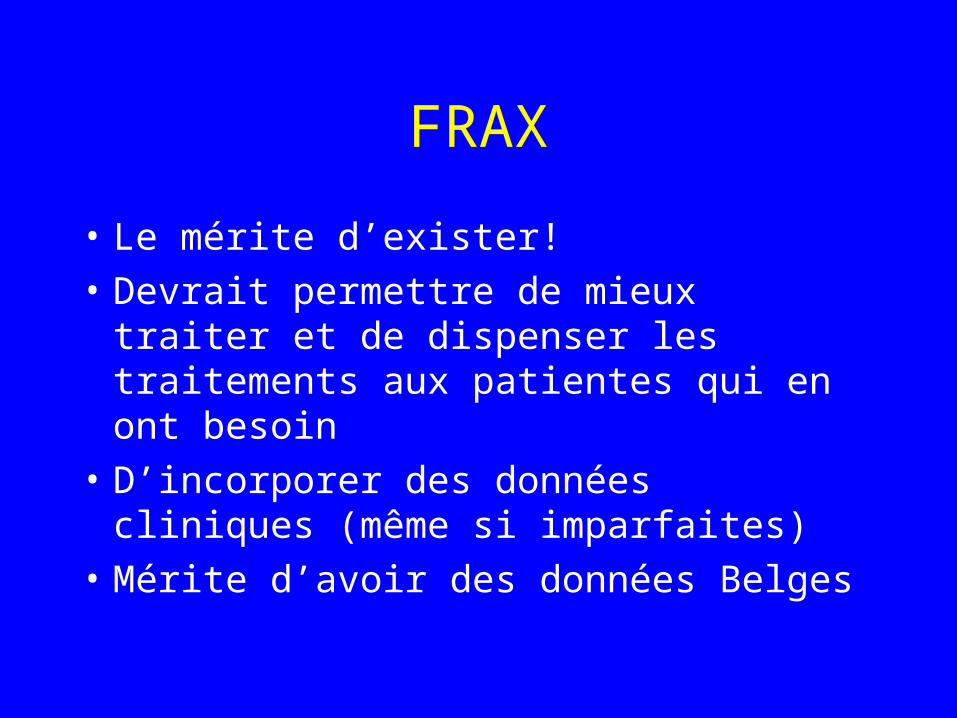
FRAX
• Le mérite d’exister!
• Devrait permettre de mieux traiter et de dispenser les traitements aux patientes qui en ont besoin
• D’incorporer des données cliniques (même si imparfaites)
• Mérite d’avoir des données Belges

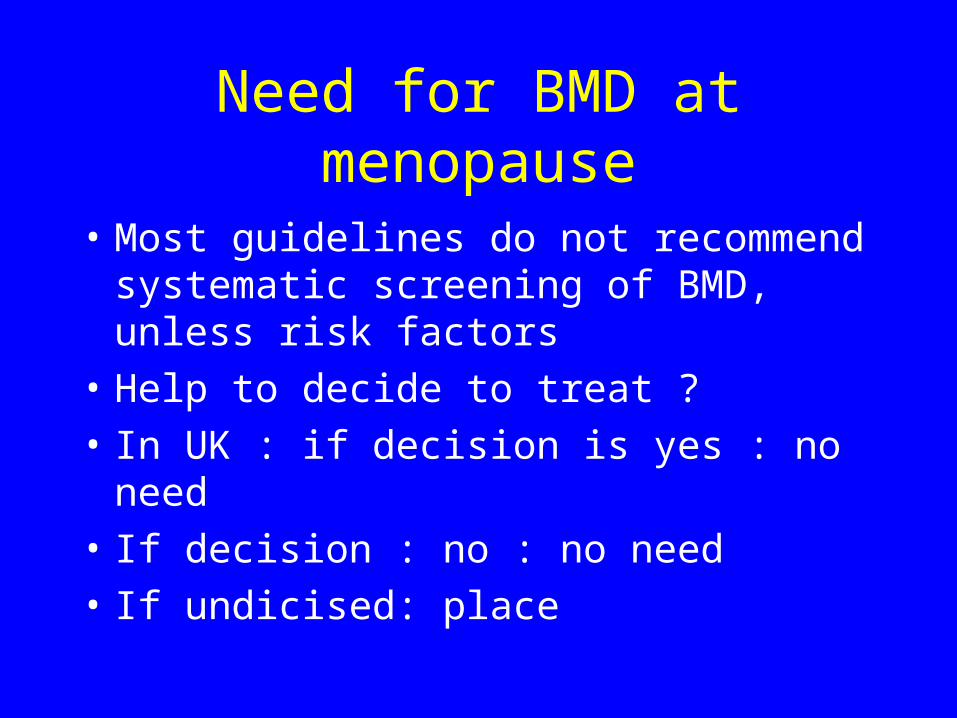
Need for BMD at menopause
• Most guidelines do not recommend systematic screening of BMD, unless risk factors
• Help to decide to treat ?
• In UK : if decision is yes : no need
• If decision : no : no need
• If undicised: place

Application of the WHO fracture risk assessment tool FRAXR in a Spanish population
• Clinical and BMD data large population cohort of Barcelona. • Inclusion criteria were: age range 40-90 yrs, clinical risk factors,
femoral neck BMD T-score available and follow-up longer than 7 years.
• Main outcome was: major osteoporotic fracture at least 7 years after the first BMD measurement. The total number of predicted fractures by the FRAX algorithm was compared with the total number of new registered fractures during the follow-up time in the study population and expressed as observed - expected fracture (O/E) ratio. Results were stratified by age group, follow-up time and number of clinical risk factors used in the FRAX algorithm
• Del Rio et al ASBMR 2009 Poster 0319

Validity of the WHO FRAX Model to Predict the Risk of Fracture in Early Postmenopausal Women
• compared the predictive validity of the FRAX model and femoral neck (FN) BMD in a large cohort of early PM women.
• The analysis was conducted in the MENOS cohort that included an initial population of 4,024 women ≥45 years of age, from whom 2,650 (mean age 54±4 yrs) were followed over a period of time of 13.4 yrs.
• Baseline characteristics were obtained through a structured questionnaire as well as BMD measurement (Lunar DPX).
• Excluded women with current or past OP treatment >3 months at baseline (n=544). Due to changes in the procedure of BMD measurements that occurred during the baseline examination period of time, only 1,399 out of 2,196 women had a valid FN BMD. Therefore, the WHO FRAX score was calculated only in those 1,399 women according to the CRFs and the FN T-score as given by the Lunar device.
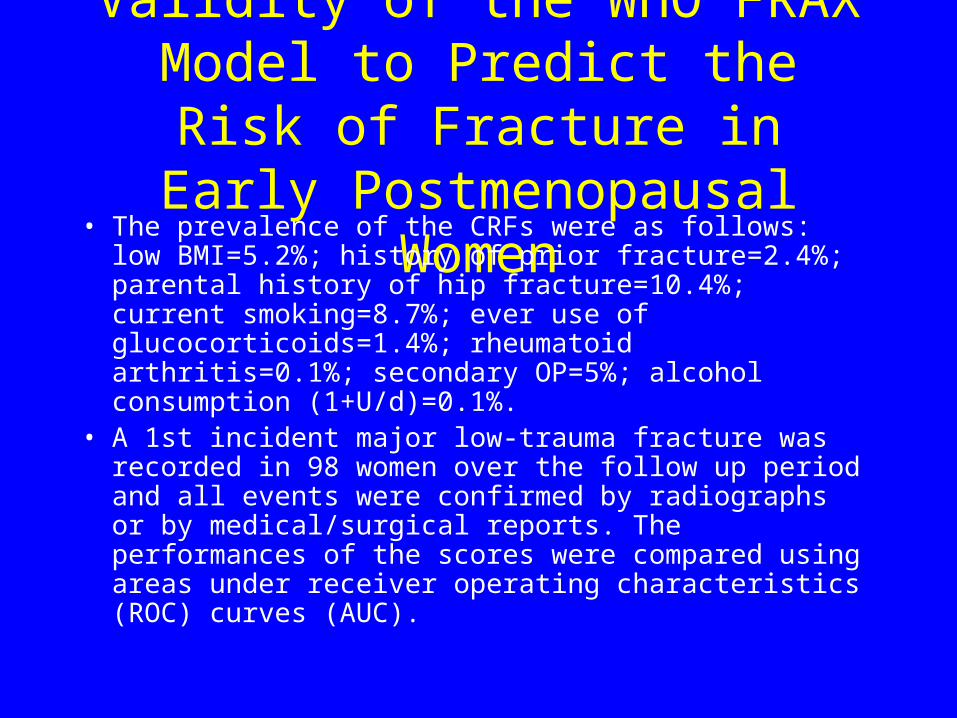
Validity of the WHO FRAX Model to Predict the Risk of Fracture in Early Postmenopausal Women
• The prevalence of the CRFs were as follows: low BMI=5.2%; history of prior fracture=2.4%; parental history of hip fracture=10.4%; current smoking=8.7%; ever use of glucocorticoids=1.4%; rheumatoid arthritis=0.1%; secondary OP=5%; alcohol consumption (1+U/d)=0.1%.
• A 1st incident major low-trauma fracture was recorded in 98 women over the follow up period and all events were confirmed by radiographs or by medical/surgical reports. The performances of the scores were compared using areas under receiver operating characteristics (ROC) curves (AUC).

Validity of the WHO FRAX Model to Predict the Risk of Fracture in Early Postmenopausal Women
• The AUC (0.66) for the FRAX model was not significantly different from that of FN BMD alone (0.69).
• The WHO FRAX model lack sensitivity i.e. the detection rate was low. For example, for a specificity of 80%, the FRAX model had a sensitivity of about 38%.
• Since, 381 out of 1,399 women started HRT during follow-up, the analyses were re-runned in the remaining women. The AUCs increased to 0.69 and 0.71, respectively for the FRAX model and FN BMD.
• In this population, the FRAX model has a poor value to predict the risk of fracture and does not significantly improve the predictive value of hip BMD alone.
• These results raise the question of the selection of the CRFs that need to be considered in the clinical assessment of the risk of fracture in early PM women.
• Dargent-Molina; et al ASBMR 2009 Oral 1094

Validity of the WHO FRAX Model to Predict the Risk of Fracture in Early Postmenopausal Women

Imputation of Ten Year Osteoporotic Fracture Rates
from Hip Fractures: A Clinical Validation Study. • to evaluate the method for imputation of osteoporotic fracture rates from
hip fractures alone. • 38,784 women age 47.5 years or older at the time of baseline femoral
neck BMD identified in a database containing all clinical DXA results for the Province of Manitoba, Canada.
• Health service records were assessed for the presence of non-trauma osteoporotic fracture codes after BMD testing (431 hip, 787 forearm, 336 clinical vertebral, and 431 humerus fractures).
• Ten year hip and osteoporotic fracture rates were estimated by the Kaplan-Meier method.
• The population was stratified by age (50 to 90, 5 year width strata) and again by femoral neck T-scores (-4.0 to 0.0, 0.5 SD width strata).
• Within each stratum, the ratio of hip to osteoporotic fractures was calculated and compared to the predicted ratio from FRAX.
• Leslie WD, Lix LM; for the Manitoba Bone Density ProgramJ Bone Miner Res. 2009 Aug 4. [Epub ahead of print]

Imputation of Ten Year Osteoporotic Fracture Rates
from Hip Fractures: A Clinical Validation Study. • Increasing age was associated with greater predicted hip-to-
osteoporotic ratios (youngest 0.07 vs oldest 0.41) and observed ratios (youngest 0.10 vs oldest 0.48).
• Lower T-scores were associated with greater predicted (highest 0.04 vs lowest 0.71) and observed ratios (highest 0.06 vs lowest 0.44).
• There was a strong positive correlation between predicted and observed ratios (Spearman r = 0.90-0.97, p < .001).
• For 14 of the 18 strata, the predicted ratio was within the observed 95% confidence interval.
• Since collection of population-based hip fracture data is considerably easier than collection of non-hip fracture data, this study supports the current emphasis on using hip fractures as the preferred site for FRAX model calibration.
• Leslie WD, Lix LM; for the Manitoba Bone Density ProgramJ Bone Miner Res. 2009 Aug 4. [Epub ahead of print]

• Osteoporosis – primary prevention– stop the deterioration of BMD
•Osteopenia •Risk factors
•Osteoporosis – secondary prevention– BMD t score <-2.5SD
•Fracture – primary prevention– No fracture – prevent fracture
•Fracture – secondary prevention– Previous fracture – prevent another fracture
Understanding the definitions in the Management of Osteoporosis


08ca032 FRAX
Patient
65
65
165
-2.5
23.9
8.0
24
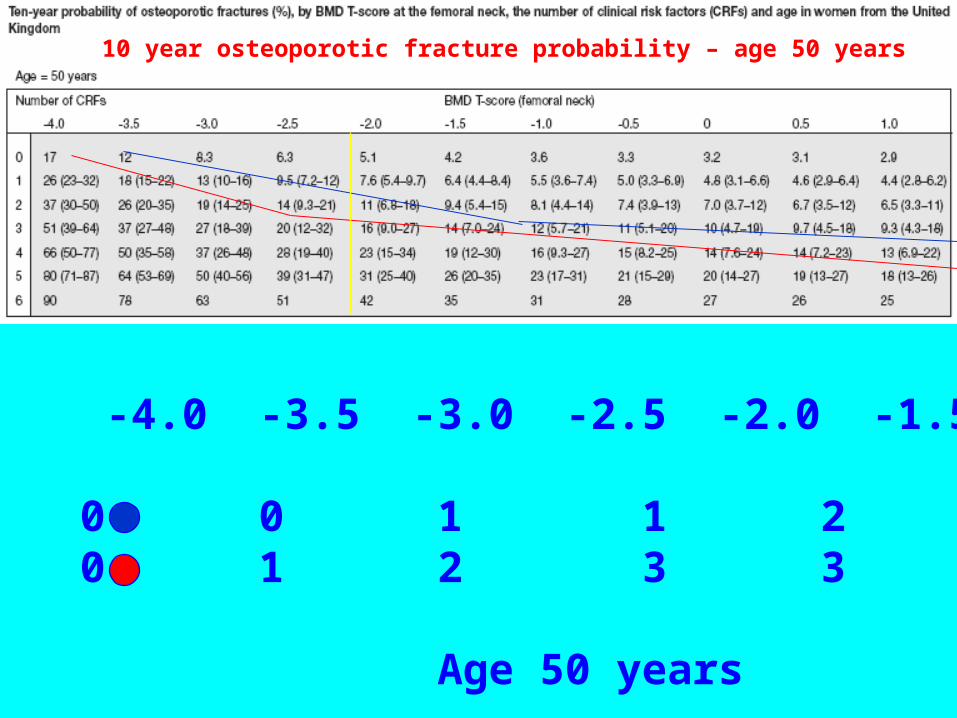
10 year osteoporotic fracture probability – age 50 years
T score -4.0 -3.5 -3.0 -2.5 -2.0 -1.5 -1.0
10% CRFs 0 0 1 1 2 2 215% CRFs 0 1 2 3 3 4 4
Age 50 years

BILL FRAKES, DAVID CALLOW/SPORTS ILLUSTRATED
Systematic review
• 145 articles

Updated fracture incidence rates for the US version of FRAX(R).
• recommend revising the US-FRAX by updating current base population values for hip fracture and major osteoporotic fracture. The impact of these revisions on FRAX(R) is likely to be lowering of 10-year fracture probabilities, but more precise estimates of the impact of these changes will be available after these new rates are incorporated into the FRAX(R) tool.
• Ettinger et al Osteoporos Int. 2009 Aug 25.
Updated fracture incidence rates for the US version of FRAX(R).
• US hospital discharge data from 2006 to calculate annual age- and sex-specific hip fracture rates and age-specific ratios to estimate clinical vertebral fracture rates.
• To estimate the incidence of any one of four major osteoporotic fractures, They first summed these newly derived hip and vertebral fracture estimates with Olmsted County, MN, wrist and upper humerus fracture rates, and then applied 10-20% discounts for overlap. RESULTS: Compared with rates used in the current FRAX(R) tool, 2006 hip fracture rates are about 16% lower, with greatest reductions observed among those below age 65 years; major osteoporotic fracture rates are about one quarter lower, with similar reductions across all ages.
• Ettinger et al Osteoporos Int. 2009 Aug 25.
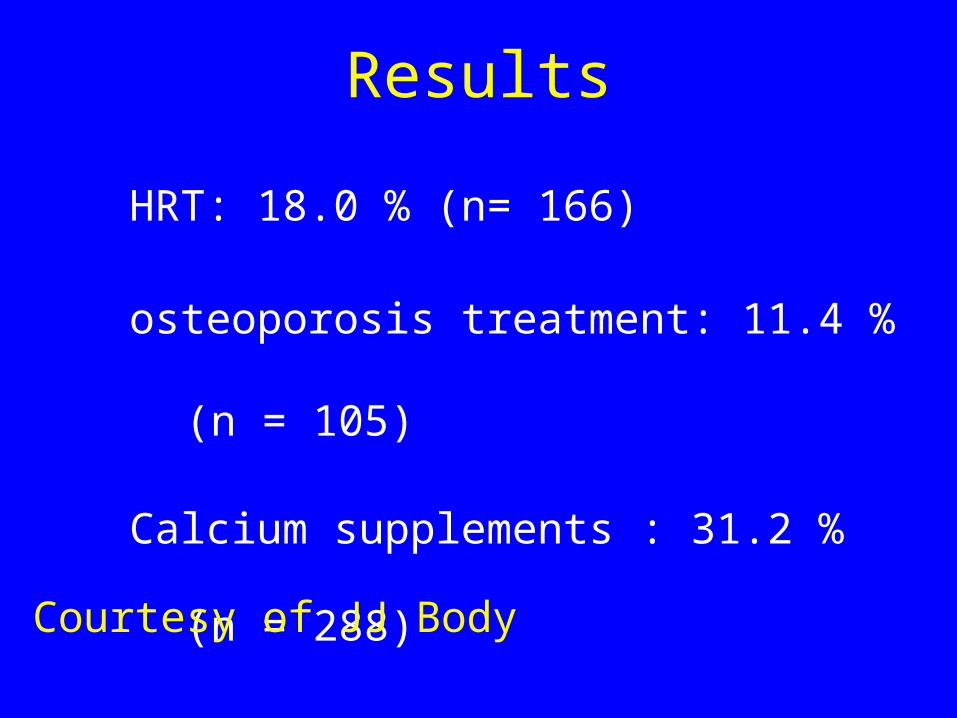
Results
HRT: 18.0 % (n= 166)
osteoporosis treatment: 11.4 % (n = 105)
Calcium supplements : 31.2 % (n = 288)
Courtesy of JJ Body
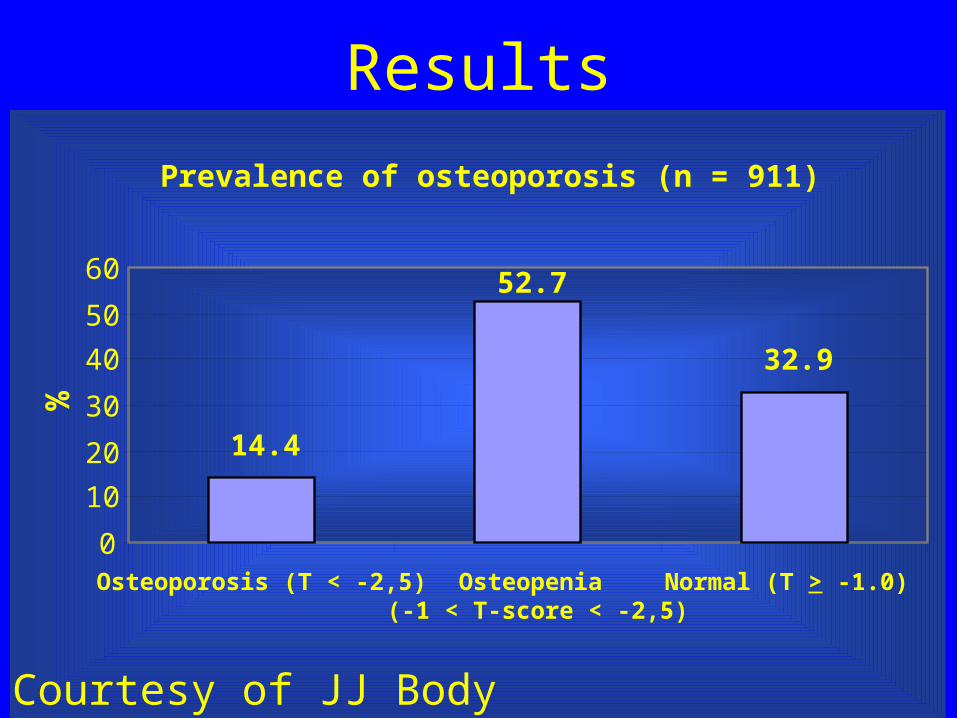
Results
Prevalence of osteoporosis (n = 911)
14.4
52.7
32.9
0
10
20
30
40
50
60
Osteoporosis (T < -2,5) Osteopenia (-1 < T-score < -2,5)
Normal (T > -1.0)
%
Courtesy of JJ Body
ResultsPrévalence des autres facteurs de risque (%)
6.89
9.1
12.913.214.3
15.015.6
25.936.8
40.7
47.3
0 10 20 30 40 50
Consommation alcool > 2 verres par jour
Traitements par corticoïdes pendant > 3 mois
BMI < 20
Tabagisme habituel
Sédentarité
Atcdts de fracture col fémoral chez père ou mère
Chute(s) entre 1 et 6 mois avant évaluation
Maladie chronique causant une perte osseuse
Atcdts personnels de fracture > 50 ans
Ménopause précoce non substituée
Age > 70 ans
Prise de somnifères/insomnie
%
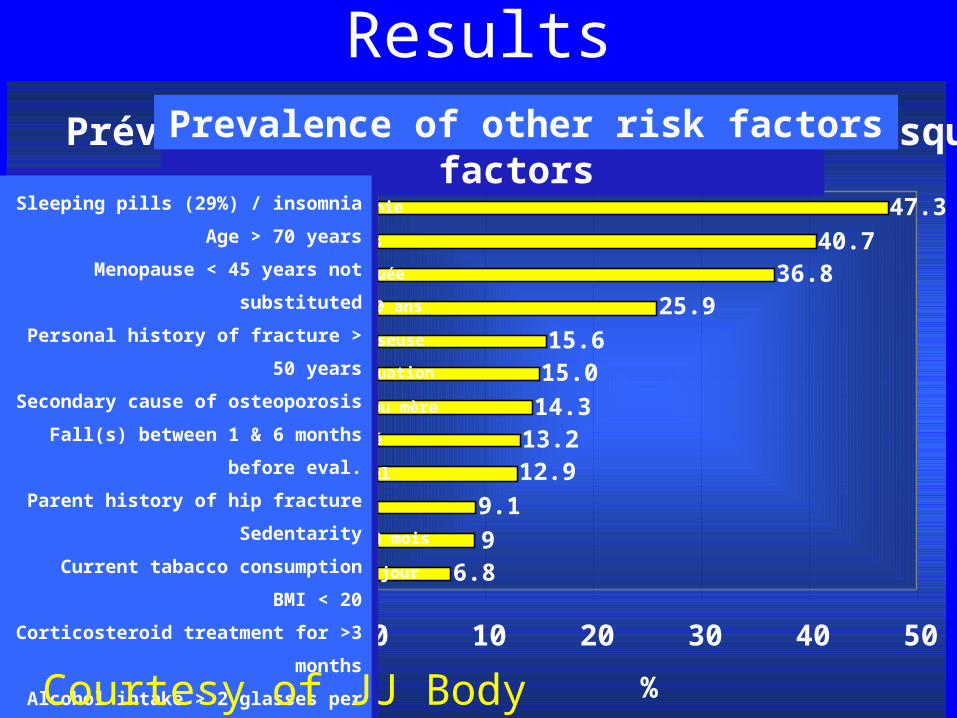
Prevalence of other risk factors
Sleeping pills / insomnia
Age > 70 years
Menopause < 45 years not substituted
Personal history of fracture > 50 years
Secondary cause of osteoporosis
Fall(s) betw 1 & 6 months before eval
Parent history of hip fracture
Sedentarity
Current tabacco consumption
BMI < 20
Corticosteroid treatment for >3 months
Alcohol intake > 2 glasse per day
Prevalence of other risk factors
Sleeping pills (29%) / insomnia
Age > 70 years
Menopause < 45 years not substituted
Personal history of fracture > 50 years
Secondary cause of osteoporosis
Fall(s) between 1 & 6 months before
eval.
Parent history of hip fracture
Sedentarity
Current tabacco consumption
BMI < 20
Corticosteroid treatment for >3 months
Alcohol intake > 2 glasses per day
Courtesy of JJ Body
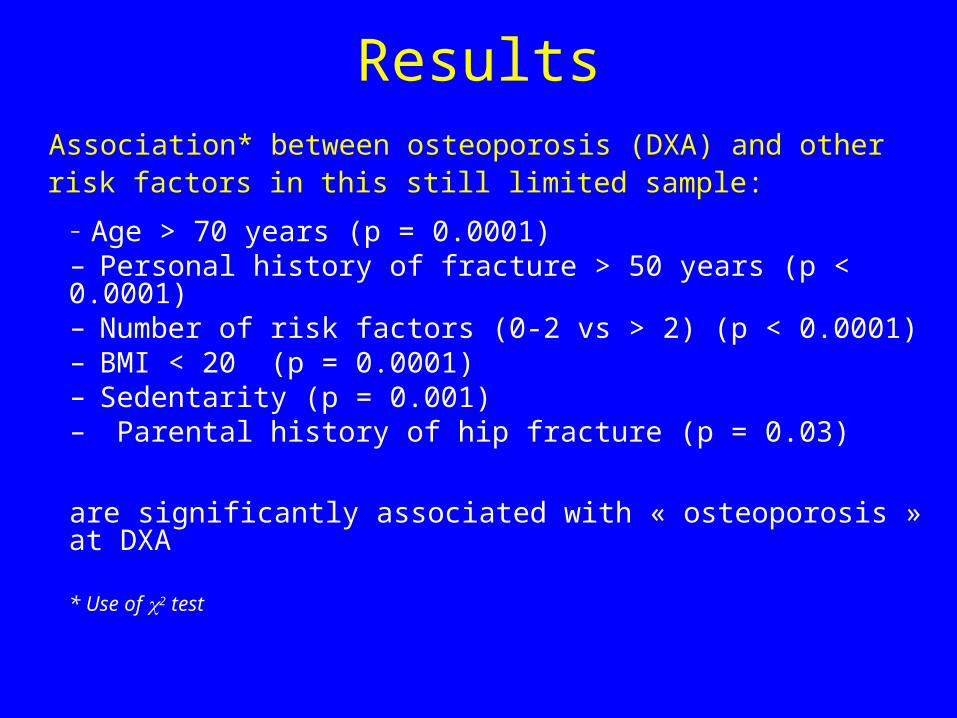
ResultsAssociation* between osteoporosis (DXA) and other risk factors in this still limited sample:
– Age > 70 years (p = 0.0001)– Personal history of fracture > 50 years (p < 0.0001)– Number of risk factors (0-2 vs > 2) (p < 0.0001)– BMI < 20 (p = 0.0001)– Sedentarity (p = 0.001)– Parental history of hip fracture (p = 0.03)
are significantly associated with « osteoporosis » at DXA
* Use of 2 test

Preliminary conclusions• Elevated level of participation
• Selection bias ? :
- education level is rather high
- relatively high % of women taking HRT (18 %)
or calcium supplements (31.2 %)
However, the Z-score distribution is centered around 0, suggesting the
ABSENCE of systematic bias !
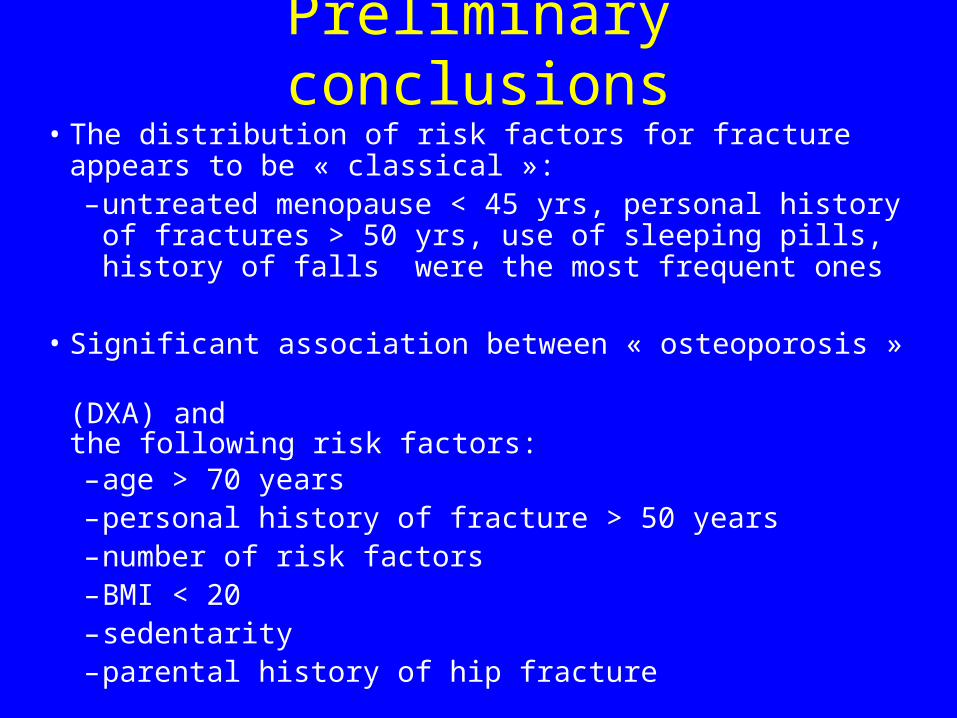
Preliminary conclusions• The distribution of risk factors for fracture appears to be
« classical »: – untreated menopause < 45 yrs, personal history of fractures >
50 yrs, use of sleeping pills, history of falls were the most frequent ones
• Significant association between « osteoporosis » (DXA) and the following risk factors: – age > 70 years – personal history of fracture > 50 years – number of risk factors – BMI < 20 – sedentarity– parental history of hip fracture


Osteoporosis strategy in early postmenopause (<60yr.)
HRT for fracture prevention in unselected group – benefit and risks are in balance
Fractures saved and risks events are low
HRT for fracture prevention in women at increased fracture risk – improves benefit:risk balance
Fractures saved >> risks events
10%-15% 10 year fracture risk threshold delivers cost-effectiveness
women need to have osteoporosis and RFs