skeletal site-related variation in human trabecular bone
TRANSCRIPT

Skeletal Site-Related Variation in Human TrabecularBone Transcriptome and SignalingSatya S. Varanasi1., Ole K. Olstad2., Daniel C. Swan3, Paul Sanderson4, Vigdis T. Gautvik2,6, Sjur
Reppe2,6, Roger M. Francis5, Kaare M. Gautvik2,6,7, Harish K. Datta1*
1 Musculoskeletal Research Group, Institute of Cellular Medicine, Medical School, Newcastle University, Newcastle Upon Tyne, United Kingdom, 2 Department of Clinical
Biochemistry, Oslo University Hospital, Ulleval, Norway, 3 Bioinformatics Support Unit, Institute for Cell and Molecular Biosciences, Medical School, Newcastle University,
Newcastle Upon Tyne, United Kingdom, 4 Department of Orthopaedic Surgery, Newcastle General Hospital, Newcastle Upon Tyne, United Kingdom, 5 Institute for Ageing
and Health, Newcastle University, Newcastle Upon Tyne, United Kingdom, 6 Institute of Basic Medical Sciences, University of Oslo, Oslo, Norway, 7 Department of Clinical
Chemistry, Lovisenberg Deacon Hospital, Oslo, Norway
Abstract
Background: The skeletal site-specific influence of multiple genes on bone morphology is recognised, but the question asto how these influences may be exerted at the molecular and cellular level has not been explored.
Methodology: To address this question, we have compared global gene expression profiles of human trabecular bone fromtwo different skeletal sites that experience vastly different degrees of mechanical loading, namely biopsies from iliac crestand lumbar spinal lamina.
Principal Findings: In the lumbar spine, compared to the iliac crest, the majority of the differentially expressed genesshowed significantly increased levels of expression; 3406 transcripts were up- whilst 838 were down-regulated. Interestingly,all gene transcripts that have been recently demonstrated to be markers of osteocyte, as well as osteoblast and osteoclast-related genes, were markedly up-regulated in the spine. The transcriptome data is consistent with osteocyte numbers beingalmost identical at the two anatomical sites, but suggesting a relatively low osteocyte functional activity in the iliac crest.Similarly, osteoblast and osteoclast expression data suggested similar numbers of the cells, but presented with higheractivity in the spine than iliac crest. This analysis has also led to the identification of expression of a number of transcripts,previously known and novel, which to our knowledge have never earlier been associated with bone growth andremodelling.
Conclusions and Significance: This study provides molecular evidence explaining anatomical and micro-architectural site-related changes in bone cell function, which is predominantly attributable to alteration in cell transcriptional activity. Anumber of novel signaling molecules in critical pathways, which have been hitherto not known to be expressed in bonecells of mature vertebrates, were identified.
Citation: Varanasi SS, Olstad OK, Swan DC, Sanderson P, Gautvik VT, et al. (2010) Skeletal Site-Related Variation in Human Trabecular Bone Transcriptome andSignaling. PLoS ONE 5(5): e10692. doi:10.1371/journal.pone.0010692
Editor: Jorg Hoheisel, Deutsches Krebsforschungszentrum, Germany
Received May 20, 2009; Accepted April 19, 2010; Published May 18, 2010
Copyright: � 2010 Varanasi et al. This is an open-access article distributed under the terms of the Creative Commons Attribution License, which permitsunrestricted use, distribution, and reproduction in any medium, provided the original author and source are credited.
Funding: The support of the EU project OSTEOGENE (No. FP6-502491) was under FP6 programme and partially funded by Newcastle University and NewcastleUniversity Hospital Trust is thankfully acknowledged. The funders had no role in study design, data collection and analysis, decision to publish, or preparation ofthe manuscript.
Competing Interests: The authors have declared that no competing interests exist.
* E-mail: [email protected]
. These authors contributed equally to this work.
Introduction
Mechanical loading, and the associated mechanical stress,
shows immense skeletal site-related variation [1,2]. A stark
example of such profound differences in the extent of the
mechanical loading is that of the lumbar spine (LS), where
normally far greater loading is experienced than at such skeletal
sites as skull or iliac crest (ILC) [3]. There are therefore marked
differences in bone density, micoarchitecture and bone composi-
tion at different skeletal sites, which reflect evolutionary adaptation
of the skeleton [4–6]. A focus of recent interest is how
environmental and genetic factors influence bone mineral density
(BMD). The genotypic influence on skeleton have largely been
focused on the phenotype relating to bone density, and only a
handful studies have investigated bone geometry or bone quality
indirectly by looking at the risk of fracture [7]. Genetic factors
influence bone mass and between 50–90% of variation in BMD is
inherited [7]. These BMD determinants are known to be
polygenic, and objective evidence for this is provided by candidate
gene SNPs (single nucleotide polymorphisms), quantitative trait
locus and family linkage studies [7–20]. Previous studies have
identified multiple candidate genes and chromosomal regions
which influence bone mass and are linked to osteoporosis-related
phenotypes [10–20]. These studies have also provided evidence for
the presence of gender- and skeletal site-specific regulation and
variation of BMD [10–20]. However, the nature of polygenic
PLoS ONE | www.plosone.org 1 May 2010 | Volume 5 | Issue 5 | e10692

influences and the resulting complexity of molecular interaction
mediating these effects in the development, attainment and
subsequent maintenance of bone mineral density (BMD) are
unclear.
Bone is a heterogeneous tissue and its histological classification,
based on macroscopic texture of cross sections, classifies the tissue
into compact (or cortical) and cancellous (or trabecular) subtypes.
The trabeculae, within cancellous bone, while may appear to be
disorganized are in fact arranged to provide maximum strength
and are aligned in the direction to support maximum mechanical
stress. Trabecular bone has a porous network of irregular cavities,
and being less dense than compact bone, constitutes only a small
fraction of total bone mass, but provide approximately 90% of the
total bone surface area representing about 80% of the exchange-
able calcium pool. It is this much larger surface area that makes
trabecular bone metabolically more active than compact bone.
The question as to how mechanical loading, and the associated
mechanical stress, affects particular histological type of bone at
different sites in the skeleton is of interest. To date many studies
have been performed examining the mechanical stress related
changes in the bone strength, microarchitecture and even cellular
changes [1–6]. The effect of differences in the mechanical loading
on the underlying complex molecular architecture of bone, which
is critical for bone function, has never been investigated.
Therefore, to address this question we have performed a global
gene transcriptome investigation on human male cancellous bone
from two anatomical sites, exposed to marked differences in
mechanical and functional demands.
Results
Raw data AnalysisIn view of high degree of molecular homogeneity in the overall
transcript expression between these sites (.95%), the data from
the three lumbar vertebrae, namely L2, L3 and L4, were grouped
for analysis (Table S1). If filtration on absents (or presents) is used
to remove transcripts that have absent call in all the arrays then
40,450 transcripts were found, and the number of transcripts
expressed in all of the bone biopsies is approximately 14,300. The
Venn analysis revealed 9177 gene transcripts to be uniquely
expressed in the LS as opposed to 713 gene transcripts in the ILC.
A statistical comparison of global gene expression in lamina of
lumbar vertebrae (L2, L3 and L4) and ILC revealed differential
expression of 4244 gene transcripts with significant differences
(fold change $2.0, p-value #0.05). It was seen that compared with
ILC, in LS region 3406 transcripts were up-regulated and 838
were down regulated. However, the number of differentially
expressed transcripts between the skeletal sites was found to be
1733 for an adjusted p-value ,0.05 and fold change .2; 1025
probesets are up-regulated in LS versus ILC, 708 probesets are
Table 1. Top up-regulated genes showing up-regulation .50 fold in lamina of lumbar vertebrae (LS) in comparison with iliac crest(ILC).
Probe Set ID Gene Title Gene Symbol p-value LS vs. ILC FC Absolute LS vs. ILC S.D
206373_at zic1 family member (odd-paired homolog, Drosophia) Zic1 8.95E-08 202.03 1.78
217404_s_at collagen, type II, alpha 1 (primary osteoarthritis,spondyloepiphyseal dysplasia, congenital)
COL2A1 1.6E-5 167.51 2.95
205713_s_at cartilage oligomeric matrix protein COMP 1.08E-11 166.98 1.15
209904_at troponin C type 1 (slow) TNNC1 0.003 157.67 4.79
206227_at cartilage intermediate layer protein, nucleotidepyrophosphohydrolase
CILP 6.84E-11 154.45 1.25
214087_s_at myosin binding protein C, slow type MYBPC1 1.87E-04 134.89 3.41
204737_s_at myosin, heavy chain 6, cardiac muscle, alpha(cardiomyopathy, hypertrophic 1) myosin, heavychain 7, cardiac muscle, beta
MYH6///MYH7 0.002 112.49 4.18
204810_s_at creatine kinase, muscle CKM 0.002 96.48 4.07
209888_s_at myosin, light chain 1, alkali; skeletal, fast MYL1 8.70E-04 84.64 3.58
209742_s_at myosin, light chain 2, regulatory, cardiac, slow MYL2 0.002 82.85 3.88
213201_s_at troponin T type 1 (skeletal, slow) TNNT1 0.002 79.48 3.99
209621_s_at PDZ and LIM domain 3 PDLIM3 3.82E-05 77.27 2.68
213782_s_at myozenin 2 MYOZ2 0.002 74.63 3.89
212654_at tropomyosin 2 (beta) TPM2 3.23E-04 69.76 3.14
213492_at collagen, type II, alpha 1 (primary osteoarthritis,spondyloepiphyseal dysplasia, congenital)
COL2A1 4.40E-05 68.00 2.49
222043_at Clusterin CLU 1.32E-09 62.26 1.31
203872_at actin, alpha 1, skeletal muscle ACTA1 0.00307 60.50 3.85
219728_at Myotilin MYOT 8.21E-04 58.01 3.31
205054_at Nebulin NEB 0.001 57.24 3.31
204179_at Myoglobin MB 0.001 56.32 3.51
228224_at proline/arginine-rich end leucine-rich repeat protein PRELP 2.74E-09 55.65 1.19
219106_s_at kelch repeat and BTB (POZ) domain containing 10 KBTBD10 0.002 50.02 3.41
FC, fold change; SD, standard deviation.doi:10.1371/journal.pone.0010692.t001
Trabecular Bone Transcriptome
PLoS ONE | www.plosone.org 2 May 2010 | Volume 5 | Issue 5 | e10692
downregulated in LS compared to ILC. Examination of Gene
Ontology (GO) terms show a statistically significant over
representation for a number of GO terms (p,0.005) including
biological and cell adhesion, extracellular matrix formation and
skeletal development (Table S2).
Bone cells related transcriptomesThe detailed analysis of the data reveals some profound and
consistent changes in the transcriptomes that are characteristically
associated with skeletal tissues, which were up-regulated in the
LS when compared with ILC (Table 1 & 2). Bone related genes,
such as SOST, MEPE and matrix Gla protein were among
the most up-regulated, but also novel and genes with unchar-
acterised gene function, such as Zic1, cDNA clone ZA88B06 and
DKFZP434C153 protein showed high differential expression. The
comparison of transcripts characteristically associated with osteo-
blasts, osteoclast and osteocytes, revealed profound difference
between the ILC and LS (Table 3). Interestingly, whilst transcripts
of enzymes, matrix proteins and humoral factors, reflecting
activities of osteoblasts, osteoclasts and osteocytes showed up-
regulation in the LS, the cell structure components of these cells,
namely PTHR2, CTR and PDPN, respectively, showed similar
expression in both sites. The array data was validated by qRT-
PCR of RNA from five ILC and equal number of randomly
selected LS biopsies. The verification was carried out by
determining expression of select group of differential expressed
transcripts. The transcripts were selected to reflect respective
expression activities of each of the three bone cell types, for
osteoclast CATK, for osteoblast Col1a and for osteocytes SOST,
DMP1 and MEPE (Table 3 & 4). The increased expression in the
LS compared with ILC suggested increased transcriptional activity
of the three bone cells rather than any changes in their numbers.
OSCAR and PTHR2 expression seen in the array data were
substantiated by qRT-PCR, which reflects lack of site-related
significant differences in actual number of osteoclast and osteoblast
respectively. Thus, the major molecular differences between the
two distinct bone sites were strictly associated with osteocyte and
osteoblast related transcripts encoding matrix (secretory) proteins
and key master regulatory genes encoding transcription factors,
e.g. RUNX2.
Pathways analysis and novel gene identificationThe differential analysis revealed that the top three pathways,
i.e., with the highest number of differentially expressed transcripts,
were TNF receptor signaling pathway, BMP signaling and
Proteogylcan syndecan-mediated signaling (Tables S3 to S6;
Figures 1, 2, & 3). The details of the gene transcripts for the
signaling mediated by TNF receptor, BMP and Proteogylcan
syndecan-mediated pathway (Figures 1, 2 & 3) is given in Tables
S4, S5 and S6, respectively. The majority of the post-receptor
transcripts of these pathways were found to show up-regulation in
the LS when compared with ILC. The analysis also reveals a
number of hitherto unidentified and unknown transcripts which
are involved in the signaling.
Probesets with a 5-fold or more change in expression were
analysed with Ingenuity Pathway Analysis (IPA), a list of 268
eligible entities for IPA analysis. The most significant biological
function classification was in skeletal and muscular development
and function with the most significant subclass being skeletal
development (corrected p-value of 2.2261029) (Table S7).
Network analysis of the data set suggested one interaction network
with skeletal and muscular system development and function
including the genes Akt, COL1A1, CTGF, EGFR, EGR1, ERK,
IGFBP3, ITGA4, Jnk, MYH11, NF-kB, (complex), PDGFBB,
PI3K, Pka, POSTN, PTPRK, SOX9, SPARC, TGFB2, TIMP3
(Figure 4).
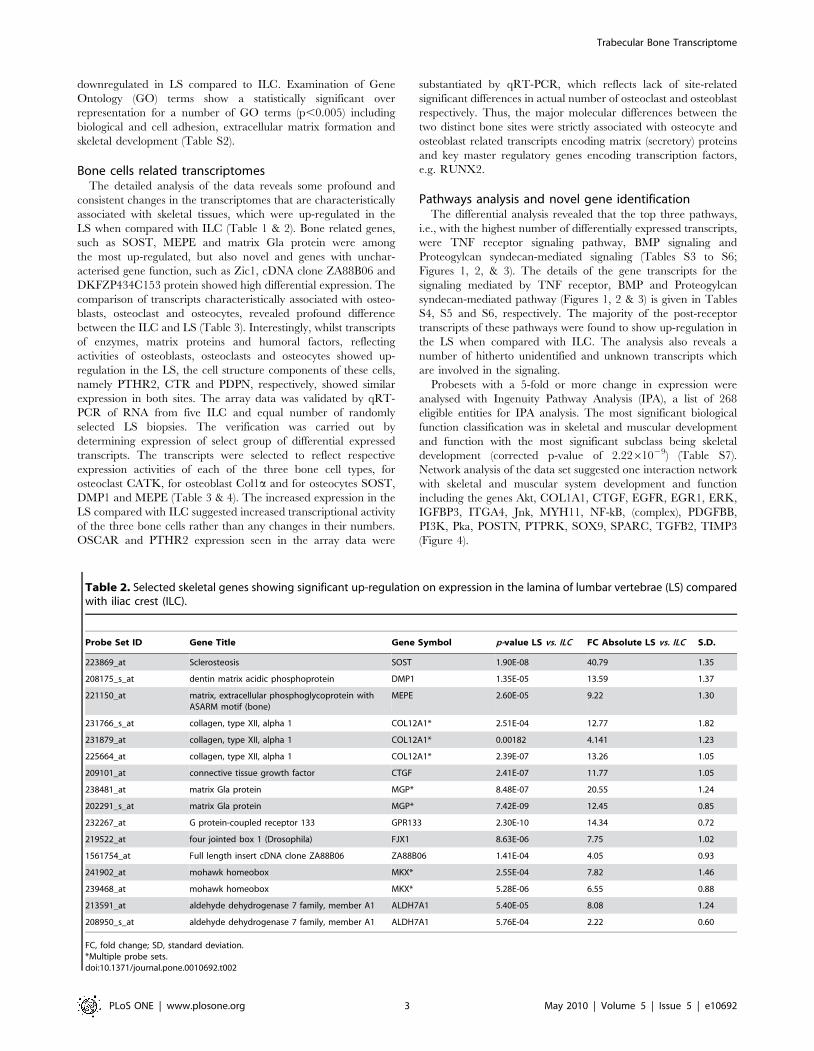
Table 2. Selected skeletal genes showing significant up-regulation on expression in the lamina of lumbar vertebrae (LS) comparedwith iliac crest (ILC).
Probe Set ID Gene Title Gene Symbol p-value LS vs. ILC FC Absolute LS vs. ILC S.D.
223869_at Sclerosteosis SOST 1.90E-08 40.79 1.35
208175_s_at dentin matrix acidic phosphoprotein DMP1 1.35E-05 13.59 1.37
221150_at matrix, extracellular phosphoglycoprotein withASARM motif (bone)
MEPE 2.60E-05 9.22 1.30
231766_s_at collagen, type XII, alpha 1 COL12A1* 2.51E-04 12.77 1.82
231879_at collagen, type XII, alpha 1 COL12A1* 0.00182 4.141 1.23
225664_at collagen, type XII, alpha 1 COL12A1* 2.39E-07 13.26 1.05
209101_at connective tissue growth factor CTGF 2.41E-07 11.77 1.05
238481_at matrix Gla protein MGP* 8.48E-07 20.55 1.24
202291_s_at matrix Gla protein MGP* 7.42E-09 12.45 0.85
232267_at G protein-coupled receptor 133 GPR133 2.30E-10 14.34 0.72
219522_at four jointed box 1 (Drosophila) FJX1 8.63E-06 7.75 1.02
1561754_at Full length insert cDNA clone ZA88B06 ZA88B06 1.41E-04 4.05 0.93
241902_at mohawk homeobox MKX* 2.55E-04 7.82 1.46
239468_at mohawk homeobox MKX* 5.28E-06 6.55 0.88
213591_at aldehyde dehydrogenase 7 family, member A1 ALDH7A1 5.40E-05 8.08 1.24
208950_s_at aldehyde dehydrogenase 7 family, member A1 ALDH7A1 5.76E-04 2.22 0.60
FC, fold change; SD, standard deviation.*Multiple probe sets.doi:10.1371/journal.pone.0010692.t002
Trabecular Bone Transcriptome
PLoS ONE | www.plosone.org 3 May 2010 | Volume 5 | Issue 5 | e10692

Discussion
The global transcriptosome first ever analysis of human lamellar
LS and ILC revealed that whilst most of the transcripts showed a
similar level of expression, a limited number of functionally
associated subsets showed marked anatomical site-related differ-
ences. Interestingly, between L2, L3 and L4 vertebrae from
different subjects there was a higher overall molecular homoge-
neity when compared with ILC from the same person. Therefore
for further comparison the three vertebrae were treated as one
group. Similarly, high degree of overall molecular homogeneity in
gene expression was seen between symmetrical sites in ILC [20]
underscoring the importance of function as a major determinant of
bone cell gene expression .and adaptability. The number of gene
transcripts and the extent of their up-regulation was much higher
in the lamina of spinal vertebra when compared with ILC. The
analysis of up-regulated genes showed that these were related to
changes in key cellular and molecular components and strongly
associated with essential biological functions in bone. The gene
transcripts, reflecting respective transcriptional activities of osteo-
cytes, osteoblasts and osteoclasts from vertebrae when compared
with ILC, were found to be consistently up-regulated in the
vertebrae and magnitude of the increased expression was quite
similar. In contrast, the gene transcripts that reflect osteocytes,
osteoblasts and osteoclasts number showed insignificant or less
marked skeletal site-related variation. This conclusion was based
on an analysis of the data evaluating osteocyte-, osteoblast- and
osteoclast-specific structural transcripts, namely podoplanin in
osteocytes, parathyroid hormone receptor in osteoblasts and
osteocytes and calcitonin receptor and osteoclast-associated
Table 3. Comparison of differences in the absolute expression of osteoblast, osteoclast and osteocyte-related gene transcripts inlamina of lumbar vertebrae (LS) and iliac crest (ILC).
Cell type Probe Set ID Gene Symbol Gene Title FC (LS vs. ILC)
Osteocytes 208175_s_at DMP1 dentin matrix acidic phosphoprotein 13.59
221150_at MEPE matrix, extracellular phosphoglycoprotein with ASARM motif (bone) 9.22
221166_at FGF23 fibroblast growth factor 23 3.52
223869_at SOST sclerosteosis 40.79
204879_at PDPN* podoplanin 6.43
208233_at PDPN* podoplanin 2.82
221898_at PDPN* podoplanin 5.90
226658_at PDPN* podoplanin 2.75
Osteoblasts 202310_s_at COL1A1* collagen, type I, alpha 1 6.13
202311_s_at COL1A1* collagen, type I, alpha 1 3.99
1556499_s_at COL1A1* collagen, type I, alpha 1 2.19
206956_at BGLAP bone gamma-carboxyglutamate (gla) protein (osteocalcin) 3.78
209875_s_at SPP1 secreted phosphoprotein 1 (osteopontin, bone sialoprotein I,early T-lymphocyte activation 1)
2.97
212667_at SPARC* secreted protein, acidic, cysteine-rich (osteonectin) 5.86
200665_s_at SPARC* secreted protein, acidic, cysteine-rich (osteonectin) 4.01
209875_s_at SPP1 secreted phosphoprotein 1 (osteopontin, bone sialoprotein I,early T-lymphocyte activation 1)
2.97
207370_at IBSP* integrin-binding sialoprotein (bone sialoprotein, bone sialoprotein II) 3.97
236028_at IBSP* Integrin-binding sialoprotein (bone sialoprotein, bone sialoprotein II) 7.35
236859_at RUNX2* runt-related transcription factor 2 3.80
221283_at RUNX2* runt-related transcription factor 2 2.74
236858_s_at RUNX2* runt-related transcription factor 2 2.21
205289_at BMP2* bone morphogenetic protein 2 2.71
205290_s_at BMP2* bone morphogenetic protein 2 2.60
239769_at CDH11* Cadherin 11, type 2, OB-cadherin (osteoblast) 3.00
207173_x_at CDH11* cadherin 11, type 2, OB-cadherin (osteoblast) 2.85
205911_at PTHR1 parathyroid hormone receptor 1 4.29
206772_at PTHR2 parathyroid hormone receptor 2 21.59
Osteoclasts 202450_s_at CTSK cathepsin K 4.04
1554503_a_at OSCAR osteoclast associated, immunoglobulin-like receptor 21.28
207886_s_at CALCR* calcitonin receptor 1.59
207887_s_at CALCR* calcitonin receptor 1.04
204638_at ACP5 acid phosphatase 5, tartrate resistant 2.03
FC, fold change.*Multiple probe sets.doi:10.1371/journal.pone.0010692.t003
Trabecular Bone Transcriptome
PLoS ONE | www.plosone.org 4 May 2010 | Volume 5 | Issue 5 | e10692

receptor in osteoclasts. We postulate that these transcripts provide
estimate of the cell numbers with the reasonable assumption that
each cell type in vertebra and ILC express on average similar
number of the marker molecules. Since these transcripts were
found to show only minor differences in vertebra and ILC when
compared with other activity related transcripts (Table 3 & 4), we
interpret that the observed increase in the respective activities of
the three bone cell types were predominantly due to increase in the
relative cell activity rather than reflecting a change in absolute cell
number. Interestingly, the most profound up-regulation in the
spinal vertebrae was observed for transcripts reflecting osteocyte
activity, namely in SOST, DMP1, and MEPE.
In light of the recent observations, the data analysis allows us to
suggest possible mechanisms for the existing evidence of increased
bone turnover, based on the described molecular differences in
osteoblast- and osteoclast-related bone remodelling in lamellar
bone of LS when compared with ILC. It is generally accepted that
mechanical stress induced by weight-bearing exercise increases
osteoblast activity, and that the absence of mechanical stimulation
resulting from prolonged immobilization or microgravity causes
severe bone loss [21,22]. In recent years a number of observations
suggest, based on in vitro studies and animal transgenic models, that
osteocytes act as mechano-sensory cells and that lacuno-canaliculi
carry signaling molecules that are responsible for maintenance of
bone structure and mass [23]. Osteocytes are interconnected by a
network that involves their dendritic processes within lacunae to
osteoblasts; that mirrors the CNS neuronal network, but
comprehensive identity of all relevant signaling molecules in bone
remains to be identified [24,25]. We believe that the present data
show that osteocytes are more metabolically active than hitherto
understood and play a central role in the determination and
maintenance of bone structure [24–26]. The bone matrix secludes
and isolates osteocytes which have an extensive interaction and
also connect to other surrounding cells via an elaborate network of
dendritic processes which may have the potential to modulate
bone resorption [26].
We hypothesize that significantly higher transcriptional activity
within specific functional osteocyte networks in the spinal vertebra,
when compared with ILC, is reflective of the increased stress
experienced at the LS [3]. The mechanical stress, both due fluid
shear stress and tissue strain, in bone is now thought to be mainly
detected by osteocytes (Figure 5) [24–29]. Osteocytes are involved
in mechano-sensing as well as in mechano-transduction of the
stress into biochemical signal [24–29]. The increased expression of
osteocyte-related transcripts, such as SOST, DMP1, MEPE, in the
spine relative to the ILC, provides for the first time evidence of
mechanical stress-related in vivo increase in osteocyte transcrip-
tional activity. The osteocyte activity, resulting from excess
mechanical loading, increases the respective activities of osteo-
blasts and osteoclasts, as evident from increase in the expression of
matrix proteins (COL1A, SPARC, and IBSP) and osteoclast-
specific enzymes (CTSK and ACP5) (Table 3 & 4; Figure 5).
These genes, i.e., characteristically associated with osteocyte,
osteoblasts and osteoclasts, showing markedly increased expres-
sion, encode secretory proteins. Further evidence of skeletal site-
related difference in the bone remodelling activity due to
mechanical stress, that seem to be orchestrated by osteocyte, is
provided by the PathwayArchitectTM analysis (Figures 2, 3 and 4;
Tables S4, S5 and S6). The analysis shows that top pathways, in
terms of differential expression in the lamina of LS as compared
with the ILC, are those involved in the bone formation by
osteoblasts (BMP signalling pathway, Proteoglycan Syndecan
signalling) and bone-resorption by osteoclast (TNF receptor
signalling, and other network groups, e.g. adherence/adhesion).
The most likely explanation in the observed increase in
transcriptional activity in the osteocyte, as well as osteoblasts and
osteoclasts, in the spine is likely to be a higher degree of local
mechanical stress [3]. The data presented provides support for the
proposal that osteocytes modulate respective bone-formation and
bone-resorptive activities of osteoblasts and osteoclasts, and
thereby regulate and maintain of bone mass. These observations
add to our understanding about the central role of osteocytes in
the maintenance of bone mass in health and in the pathogenesis of
osteoporosis.
The comparison of the relative expression of the transcripts led
to identification of a number of novel and uncharacterised genes,
whose function in bone cell biology is not yet known [30,31]. In
addition, the pathways analysis revealed the known key signaling
molecules (Figs. 1, 2 & 3 and corresponding Tables S4, S5 & S6),
and led to the identification some novel pathways specific
intracellular putative proteins. Further studies, such as cell protein
expression, protein-protein interaction and knock-in and knock-
out functional studies are required to establish the role of these
novel proteins. In conclusion, taken together the data show that at
the transcriptional level bone has a strong ability to adapt to
functional demands, and osteocyte play a critical role in the
process. The adaptive response involves ‘‘growth and develop-
mental processes’’, probably made possible through their ‘‘high
sensitivity to synaptic processes’’ and ‘‘matrix’’ engineering
properties.
Methods
Subject selectionThe participants numbered thirteen Caucasian men who were
all from North East England, U.K., who were undergoing spinal
decompression laminectomies or spinal fusions of the LS. This
study was conducted according to the principles expressed in the
Declaration of Helsinki. The study was approved by the
Institutional Review Board of Northumberland Local Research
Ethics Committee, Blyth, Northumberland NE24 2AG (REC
Reference: 04/Q0902/29), and all subjects gave their informed
written consent. Underlying secondary causes of osteoporosis were
excluded by medical history, physical examination and laboratory
investigations. Men with a history of treatment with antiresoptive
agents, steroid, anticonvulsant and anticoagulant were excluded
[32] (Text S1). The mean6SD (range) of age, weight and height
respectively were 53.9610.7 (35.0-69.0)yr, 86.668.6 (84.0-
Table 4. The validation of the array data was carried out byqRT-PCR of select number of transcripts for equal number ofiliac crest (ILC) and lumbar spine (LS) samples (n = 5).
GeneAffymetrix Absolute FoldChange (ILC vs. LS)
qRT-PCR RQ(ILC vs. LS)
COL1A1 27.2 222.8
SOST 253 290.7
DMP1 242 233.0
MEPE 223.5 240.7
CTSK 28.2 215.8
ZIC1 286.7 2666
PTHR2 1.5 1.7
OSCAR 1.7 1.4
doi:10.1371/journal.pone.0010692.t004
Trabecular Bone Transcriptome
PLoS ONE | www.plosone.org 5 May 2010 | Volume 5 | Issue 5 | e10692

Trabecular Bone Transcriptome
PLoS ONE | www.plosone.org 6 May 2010 | Volume 5 | Issue 5 | e10692

108.2)kg and 176.466.3 (167.0-184)cm, respectively. The
mean6SD (range) for BMD, given as areal density, for LS, total
hip, and femoral neck respectively were 1.06760.332 (0.760-
1.387), 1.04760.153 (0.820-1.271) and 0.87060.153 (0.620-
1.202) gm/cm2, respectively. None of the subjects had history of
low trauma fractures (Table S8 and Text S1).
All bone biopsies were trabecular and taken from a specific site
in the ILC site, 2 cm backwards from the anterior superior iliac
spine. Further consistency was achieved by ensuring that only one
senior surgeon supervised all biopsies with explicit instructions to
avoid attached tissues, specifically muscle. Similarly spinal biopsies
were all trabecular and all were from lamina processes of the
lumbar vertebrae two, three and four. A total of 24 biopsies were
obtained for analysis from 13 men, 19 from the lamina of the LS
and 5 from the ILC.
Biochemical and BMD measurementsSerum testosterone, sex-hormone-binding globulins, follicular
stimulating hormone and luteinizing hormone were measured by
commercially available radioimmunoassays (SAS laboratory,
Royal Victoria Infirmary, Newcastle upon Tyne). All bone density
measurements were performed by DXA using a Hologic QDR
2000 Bone Densitometer (Hologic, Waltham, MA). In vivo
precision for measurement with this system is 1.0% at the LS
(L1-L4) and 1.5% for the femoral neck. BMD results were
obtained as an areal density in g/cm2, but were also given as T-
and Z- scores. The T-score is the number of standard deviation
units above or below the mean for normal young men, whilst the
Z-score is the number of standard deviation units above or below
the age-related normal men (calculated using the manufacturer’s
standard normal reference database). The results of laboratory
investigations for all these subjects were within normal laboratory
ranges.
Extraction of RNAThe trabecular bone from the laminar and ILC that were excess
to the surgical requirement were collected as biopsies of size
approximately 0.25 to 1 cm3. The biopsies were immediately
frozen and stored in liquid nitrogen for later extraction of RNA.
The frozen bone biopsies were pulverized with a mortar in liquid
nitrogen with their content of marrow intact. RNA was then
extracted by homogenization in Trizol (Life Technologies,
Invitrogen, cat no 15596) 1 ml/100 mg, then following the
manufacturers procedure. RNA was further purified using the
RNeasy kit (Qiagen) to remove organic components and finally re-
suspended in RNAse free deionsed water and quantified using the
Nanodrop spectrophotometer. The total RNA integrity was
checked using Agilent 2100 BioAnalyzer (Agilent Technologies,
Inc.) prior to cDNA synthesis. In addition, the quality of the RNA
was controlled according to the Affymetrix test manual by
measuring the ratio between 39 and 59 end for GAPDH mRNA
(ratio always,2.0)
Microarray analysisDouble-stranded cDNA and biotin-labeled cRNA probes were
made from 5 mg total RNA using the Superscript Choice system
(Invitrogen) and the Enzo Bioarray respectively. Procedures were
performed according to recommendations from Affymetrix
[20,31]. This cRNA was hybridized to Affymetrix Human
Genome U133 Plus 2.0 Array containing cDNA oligonucleotides
representing more than 54,000 probe sets for 38,000 different
genes followed by washing and staining on the GeneChips Fluidics
Station 450 (Affymetrix) according to manufacturer’s instructions.
The chips were scanned on the Affymetrix GeneChipH 3000
scanner. The quality of the RNA and probe was controlled by an
Affymetrix based test measuring the ratio between 59 and 39
mRNAs for b-actin and GAPDH and found to be highly
satisfactory. The datasets originating from the specimens were
first processed by the Affymetrix Mas5.0 software, and signal
values representing the expression level of each transcript were
generated. Each sample was normalized as recommended by
Affymetrix by multiplying all signal values with a scaling factor
that results in an average signal value of 500 for all genes that are
classified as ‘‘present’’ calculated by the Affymetrix MAS 5.0
program. The scaling factor is set by examining all the probe sets
on the array to compute a trimmed mean signal and derive a scale
factor for the array so that: Target signal = Scale factor 6Trimmed mean signalprobe array. Thus, the scale factor
standardizes the trimmed mean signal of the array to the target
signal. The patients were coded, and all analyses were carried out
blindly. Both samples from each patient were analyzed in the same
kit for cRNA probe synthesis and hybridized to chips from the
same batch. One chip was used for each sample (cRNA synthesis)
as the variability between chips and cRNA syntheses is
significantly lower than the potential variability derived from
different biological samples.
Data AnalysisThe overview of differentially expressed genes in the LS relative
to ILC in male controls was generated by the use of Affymetrix
software, which made it possible to compare data from two arrays.
The statistical analysis is based on 22 different cDNA oligonucle-
otides to measure quantitatively one mRNA transcript, and each
cDNA probe is distributed as 22 different ‘‘micro-spots’’. Thus, 22
signals for each mRNA transcript (probeset) are generated and
enables the Affymetrix software GCOS to compute p-values for
differential expression when two transcripts on two different arrays
are compared. The Wilcoxon’s Signed Rank test uses the
differences between Perfect Match and Mismatch probe signal
intensities, as well as the differences between Perfect Match
intensities and background to compute each p-value difference.
From Wilcoxon’s Signed Rank test, a total of three, one-sided p-
values are computed for each probe set. The most conservative
value is chosen to determine the ‘‘change call’’. That is the value
closest to 0.5 signifying that no change is detected. These are
combined to give one final p-value.
Data from HGU-1333 plus 2 Affymetrix GeneChip arrays was
imported into GeneSpring GX 11 and summarised and
normalised with MAS5 and GC-RMA. Flag data from the
MAS5 analysis was used to derive a probeset list where at least 19
out of 25 samples had a present or marginal call. This left 20796
probesets, which was further reduced to 20764 probesets after
Affymetrix control probesets were removed from the list. This list
was used for all downstream statistical analysis. An unpaired t-test
between LS and ILC samples was used to detect differential
Figure 1. TNF receptor signaling in trabecular bone. Direct interaction network models were constructed by Pathway Architect analysis of thedifferentially expressed transcript in the lumbar spine and iliac crest trabecular bone. Up-regulated transcripts are indicated red whilst the down-regulated are shown in green. Arrows link interacting genes and positive (+) and negative (2) associations are marked respectively. Green boxesdenote regulation, blue boxes binding and orange circles indicating phosphorylation.doi:10.1371/journal.pone.0010692.g001
Trabecular Bone Transcriptome
PLoS ONE | www.plosone.org 7 May 2010 | Volume 5 | Issue 5 | e10692
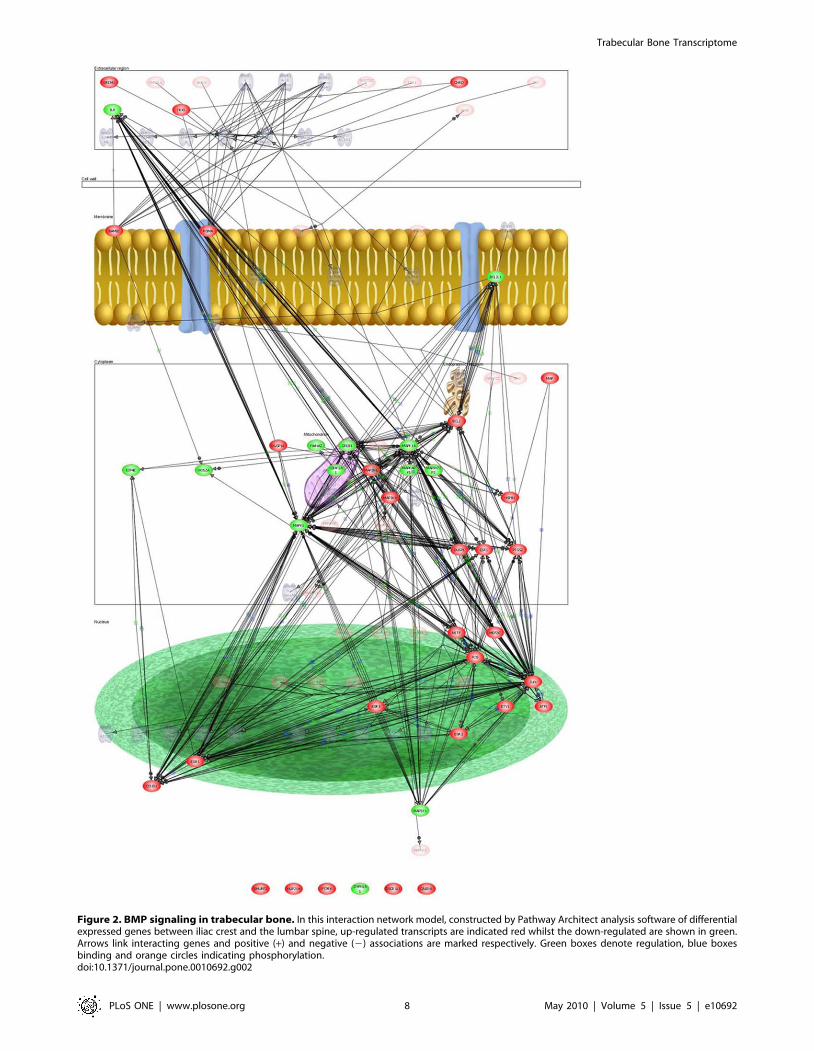
Figure 2. BMP signaling in trabecular bone. In this interaction network model, constructed by Pathway Architect analysis software of differentialexpressed genes between iliac crest and the lumbar spine, up-regulated transcripts are indicated red whilst the down-regulated are shown in green.Arrows link interacting genes and positive (+) and negative (2) associations are marked respectively. Green boxes denote regulation, blue boxesbinding and orange circles indicating phosphorylation.doi:10.1371/journal.pone.0010692.g002
Trabecular Bone Transcriptome
PLoS ONE | www.plosone.org 8 May 2010 | Volume 5 | Issue 5 | e10692

expression. Probesets reported as being differentially expressed if
they satisfy a corrected p-value cutoff of ,0.05 when performing
multiple testing correction with Benjamini-Hochberg False
Discovery Rate (FDR).
Pathway analysis was also carried out with Ingenuity Pathway
Analysis 8.5 (Ingenuity Systems http://www.ingenuity.com) on
probesets differentially expressed in lumbar and ILC biopsies.
Canonical pathways analysis identified the pathways from the
Ingenuity library of pathways that were most significant to the data
set. The significance of the association between the data set and
the canonical pathway was measured in 2 ways: 1) A ratio of the
number of molecules from the data set that map to the pathway
divided by the total number of molecules that map to the
canonical pathway is displayed. 2) Fisher’s exact test was used to
Figure 3. Proteogylcan Syndecan-mediated signaling in trabecular bone. Direct interaction network models constructed by PathwayArchitect analysis of the differentially expressed transcript in the lumbar spine and iliac crest trabecular bone. Up-regulated transcripts are indicatedred whilst the down-regulated are shown in green. Arrows link interacting genes and positive (+) and negative (2) associations are markedrespectively. Green boxes denote regulation, blue boxes binding and orange circles indicating phosphorylation.doi:10.1371/journal.pone.0010692.g003
Trabecular Bone Transcriptome
PLoS ONE | www.plosone.org 9 May 2010 | Volume 5 | Issue 5 | e10692

calculate a p-value determining the probability that the association
between the genes in the dataset and the canonical pathway is
explained by chance alone.
Affymetrix identifiers and fold change information was loaded
into IPA and each identifier was mapped to its corresponding
object in Ingenuity’s Knowledge Base. A 5-fold cutoff of fold
change was set to identify molecules whose expression was
significantly differentially regulated. These molecules, called
Network Eligible molecules, were overlaid onto a global molecular
network developed from information contained in Ingenuity’s
Knowledge Base. Networks of Network Eligible Molecules were
then algorithmically generated based on their connectivity. The
Functional Analysis of a network identified the biological functions
and/or diseases that were most significant to the molecules in the
network. The network molecules associated with biological
functions and/or diseases in Ingenuity’s Knowledge Base were
considered for the analysis. Right-tailed Fisher’s exact test was
used to calculate a p-value determining the probability that each
biological function and/or disease assigned to that network is due
to chance alone. All edges of the pathways generated are
supported by at least one reference from the literature, from a
textbook, or from canonical information stored in the Ingenuity
Pathways Knowledge Base. Human, mouse, and rat orthologs of a
gene are stored as separate objects in the Ingenuity Pathways
Knowledge Base, but are represented as a single node in the
network.
ArrayAssist (Stratagene) was further used to created a raw data
set and identify differential gene expression. The change in relative
expression of the remaining set of transcripts was assessed using t-
tests with Benjamin-Hochberg (false discovery rate, FDR)
correction (2-fold minimum cut-off and p,0.05). These tran-
scripts, i.e., showing FC$2 in bone biopsies taken from ILC and
Figure 4. Network enriched for genes involved in skeletal system. Molecules are represented as nodes, and the biological relationshipbetween two nodes is represented as an edge (line). The intensity of the node color indicates the degree of down- (red) or up- (green) regulationwhere lumbar spine is compared with iliac crest. Nodes are displayed using various shapes that represent the functional class of the gene product.Direct relationships are shown in solid arrows, indirect relationships in dashed arrows. Genes with no colour are added to the network by IngenuityPathway Analysis as part of the network generation algorithm.doi:10.1371/journal.pone.0010692.g004
Trabecular Bone Transcriptome
PLoS ONE | www.plosone.org 10 May 2010 | Volume 5 | Issue 5 | e10692

LS, were further analysed by PathwayArchitectTM software
(Stratagene). This analysis utilizes existing relevant literature for
pathway analysis and visualization and permits identification of
shared common direct regulators or downstream targets.
PathwayArchitectTM analysis software can identify gene-gene
interaction, gene regulation and their key functions in the complex
pathways.
The guidelines described in MIAME (Minimal Information
About a Microarray Experiment) has been followed in writing this
paper. The primary data has been submitted to the European
Bioinformatics Institute (EMBL-EBI) ArrayExpress repository.
The experiment name is ‘‘Skeletal Site-Related Variation in
Human Bone Transcriptome’’ and Signalling ArrayExpress
accession number is: E-MEXP-2219.
Quantitative RT-PCRThe Affymetrix gene expression data were validated for selected
transcripts using the TaqMan gene expression assays and the
Applied Biosystems Prism 7900 HT sequence detection system. Five
500 ng total RNA from each donor was reverse transcribed using
Omniscript (Qiagen Ltd.), and cDNA representing 2.5 ng total
RNA was used in each PCR reaction. The PCR reactions were run
in duplicates. The relative changes of each transcript, using
GAPDH (glyceraldehyde-3-phosphate dehydrogenase) as endoge-
nous control, were calculated using the 2(DDC(T) method [33], and
the gene expression results are given as RQ (relative quantitation).
Supporting Information
Table S1 Anatomical-site related comparison of overall molec-
ular homogeneity between different skeletal sites.
Found at: doi:10.1371/journal.pone.0010692.s001 (0.01 MB
.DOCX)
Table S2 Examination of Gene Ontology (GO) terms shows an
overrepresentation for a number of GO terms (p,0.005) including cell
adhesion, extracellular matrix formation and skeletal development.
Found at: doi:10.1371/journal.pone.0010692.s002 (0.03 MB
XLS)
Table S3 Top 30 signalling pathways identified by comparing
differential transcript expression in the lumbar spine versus iliac
crest (4244 gene transcripts with FC $2, p-value #0.05).
Found at: doi:10.1371/journal.pone.0010692.s003 (0.06 MB
DOC)
Table S4 TNF receptor signalling pathway gene transcripts
identification based on differential expression in lamina lumbar
spine and iliac crest; the analysis was carried out using Pathway
Architect Software and the pathway generated is shown in Fig. 2.
Found at: doi:10.1371/journal.pone.0010692.s004 (0.06 MB
DOC)
Table S5 BMP signalling pathway gene transcripts identification
based on the differential expression in iliac crest and in the lamina
of lumbar spine; the analysis was carried out using Pathway
Architect Software and the pathway generated is shown in Fig. 3.
Found at: doi:10.1371/journal.pone.0010692.s005 (0.06 MB
DOC)
Table S6 Proteoglycan Syndecan signalling events identification
based on analysis of differential expression in the lamina of lumbar
spine and iliac crest; the analysis was carried out using Pathway
Architect Software and the pathway generated is shown in Fig. 4.
Found at: doi:10.1371/journal.pone.0010692.s006 (0.06 MB
DOC)
Table S7 Probesets with a 5-fold or more change in expression
were analysed with Ingenuity Pathway Analysis (IPA), a list of 268
eligible entities for IPA analysis. The most significant biological
function classification was in skeletal and muscular development
and function.
Found at: doi:10.1371/journal.pone.0010692.s007 (0.04 MB
XLS)
Table S8 Anthropometric indices age and bone density of
individual subjects.
Found at: doi:10.1371/journal.pone.0010692.s008 (0.05 MB
DOC)
Text S1 Details of clinical evaluation, including medical history
and laboratory investigations, used for the subject selection.
Found at: doi:10.1371/journal.pone.0010692.s009 (0.04 MB
DOC)
Acknowledgments
We are grateful to all the volunteers for participating in the study and to
the theatre staff of Freeman Hospital and Newcastle General Hospital for
their help in collecting the bone biopsy samples. We would like to thank
Lynn Conroy of Musculoskeletal Unit, Freeman Hospital, for bone mineral
assessment and Dr. Paul Genever and the Technology Facility at the
University of York for access to the Analysis Software.
Author Contributions
Conceived and designed the experiments: KMG HKD. Performed the
experiments: SSV OKO VTG. Analyzed the data: SSV OKO DCS HKD.
Contributed reagents/materials/analysis tools: DCS SR RMF HKD.
Wrote the paper: HKD. Performed subject clinical assessment: PS RMF
KMG. Took biopsies: PS. Clinical assessment of the subjects: HKD.
Figure 5. Role of osteocytes in mechanotransduction intrabecular bone. The increased mechanical stress is detected bymechanosensors, a function which is primarily performed by theosteocytes (,90% of the total cell number). The increased mechanicalstress is mechano-transduced into intracellular biochemical signals byosteocytes and results in increased transcriptional activity of range ofgenes (SOST, MEPE and DMP1). Osteocytes also transmute mechanicalstress into intercellular biochemical signals to modulate the respectiveactivities of the osteoclasts and osteoblasts.doi:10.1371/journal.pone.0010692.g005
Trabecular Bone Transcriptome
PLoS ONE | www.plosone.org 11 May 2010 | Volume 5 | Issue 5 | e10692

References
1. Lanyon LE (1984) Functional strain as a determinant of bone remodeling. Calcif
Tissue Int 36: S56–S61.2. Rubin CT, Lanyon LE (1985) Regulation of bone mass by mechanical strain
magnitude. Calcif Tissue Int 37: 411–417.3. Mannion AF, Adams MA, Dolan P (2000) Sudden and unexpected loading
generates high forces on the LS. Spine 25: 842–852.4. Turner CH, Pavalko FM (1998) Mechanotransduction and functional response
of the skeleton to physical stress: the mechanisms and mechanics of bone
adaptation. J Orthop Sci 3: 346–355.5. Huiskes R, Ruimerman R, van Lenthe GH, Janssen JD (2000) Effects of
mechanical forces on maintenance and adaptation of form in trabecular bone.Nature 405: 704–706.
6. Aerssens J, Boonen S, Joly J, Dequeker J (1997) Variations in trabecular bone
composition with anatomical site and age: potential implications for bone qualityassessment. J Endocrinol 155: 411–421.
7. Peacock M, Turner CH, Econs MJ, Foroud T (2002) Genetics of osteoporosis.Endocr Rev 23: 303–326.
8. Koller DL, Econs MJ, Morin PA, Christian JC, Hui SL, et al. (2000) Genome
screen for QTLs contributing to normal variation in bone mineral density andosteoporosis. J Clin Endocrinol Metab 85: 3116–3120.
9. Karasik D, Myers RH, Cupples LA Hannan MT, Gagnon DR, et al. (2002)Genome screen for quantitative trait loci contributing to normal variation in
bone mineral density: the Framingham Study. J Bone Miner Res 17: 1718–1727.10. Peacock M, Koller DL, Hui S, Johnston CC, Foroud T, et al. (2004) Peak bone
mineral density at the hip is linked to chromosomes 14q and 15q. Osteoporos Int
15: 489–496.11. Ralston SH, Galwey N, Mackay I, Albagha OM, Cardon L, et al. (2005) Loci for
regulation of bone mineral density in men and women identified by genomewide linkage scan: the FAMOS study. Hum Mol Genet 2005;14: 943–951.
12. Richards JB, Rivadeneira F, Inouye M, Pastinen TM, Soranzo N, et al. (2008)
Bone mineral density, osteoporosis, and osteoporotic fractures: a genome-wideassociation study. Lancet 371: 1505–1512.
13. Styrkarsdottir U, Halldorsson BV, Gretarsdottir S, Gudbjartsson DF,Walters GB, et al. (2008) Multiple genetic loci for bone mineral density and
fractures. N Engl J Med 358: 2355–2365.14. Xiong DH, Shen H, Zhao LJ, Xiao P, Yang TL, et al. (2006) Robust and
comprehensive analysis of 20 osteoporosis candidate genes by very high-density
single-nucleotide polymorphism screen among 405 white nuclear familiesidentified significant association and gene–gene interaction. J Bone Miner Res
21: 1678–1695.15. Orwoll ES, Belknap JK, Klein RF (2001) Gender specificity in the genetic
determinants of peak bone mass. J Bone Miner Res 16: 1962–1971.
16. Naganathan V, Macgregor A, Snieder H, Nguyen T, Spector T, et al. (2003)Site and gender specificity of inheritance of bone mineral density. J Bone Miner
Res 18: 1531–1538.
17. Peacock M, Koller DL, Lai D, Hui S, Foroud T, et al. (2005) Sex-specific
quantitative trait loci contribute to normal variation in bone structure at the
proximal femur in men. Bone 37: 467–473.
18. Ioannidis JP, Ng MY, Sham PC, Zintzaras E, Lewis CM, et al. (2207) Meta-
analysis of genome-wide scans provides evidence for sex- and site-specific
regulation of bone mass. J Bone Miner Res 22: 173–183.
19. Enjuanes A, Garcıa-Giralt N, Supervıa A, Nogues X, Ruiz-Gaspa S, et al. (2006)
A new SNP in a negative regulatory region of the CYP19A1 gene is associated
with lumbar spine (BMD) in postmenopausal women. Bone 38: 738–743.
20. Reppe S, Stilgren L, Olstad OK, Brixen K, Nissen-Meyer LS, et al. (2006) Gene
expression profiles give insight into the molecular pathology of bone in primary
hyperparathyroidism. Bone 39: 189–198.
21. Lorentzon M, Eriksson AL, Nilsson S, Mellstrom D, Ohlsson C (2004) The
COMT val158met polymorphism is associated with peak BMD in men. J Bone
Miner Res 19: 2005–2011.
22. Semb H (1969) Experimental limb disuse and bone blood flow. Acta Orthop
Scand 40: 552–562.
23. Zerath E (1998) Effects of microgravity on bone and calcium homeostasis. Adv
Space Res 21: 1049–1058.
24. Bonewald L (2006) Osteocytes as Multifunctional Cells. Journal of Musculo-
skeletal and Neuronal Interactions 6: 331–333.
25. Datta HK, Ng FW, Walker J, Tuck SP, Varanasi SS (2008) The cell biology of
bone metabolism. J Clin Path 61: 577–587.
26. Zhao S, Zhang YK, Harris S, Ahuja SS, Bonewald LF (2002) MLO-Y4
osteocyte-like cells support osteoclast formation and activation. J Bone Miner
Res 17: 2068–2079.
27. Lanyon LE (1993) Osteocytes, strain detection, bone modelling and remodeling.
Calcif Tissue Int 53: S102–S107.
28. Datta HK, Wu JJ, Tuck SP, Walker J (2008) Emerging evidence of osteocytes as
mechanosensors and regulators of mineralisation. European Musculoskeletal
Review 3: 48–52.
29. Bonewald LF, Johnson ML (2008) Osteocytes, mechanosensing and Wnt
signaling. Bone 42: 606–615.
30. Datta HK, Varanasi SS, Olstad OK, Gautvik V, Sanderson P, et al. (2009)
ASBMR 31st Annual Meeting Abstract SU0078.
31. Kalogeropoulos M, Varanasi SS, Olstad OK, Sanderson P, Gautvik V, et al.
(2010) Zic1 Transcription Factor in Bone: Neural Developmental Protein
Regulates Mechanotransduction in Osteocytes. FASEB J. In press.
32. Al-oanzi ZH, Tuck SP, Raj N, Harrop JS, Summers G, et al. (2006) Assessment
of Vitamin D Status in Male Osteoporosis. Clin Chem 52: 248–54.
33. Livak KJ, Schmittgen TD (2001) Real-time quantitative PCR and the 2(Delta
Delta C(T) method. Methods 25: 402–408.
Trabecular Bone Transcriptome
PLoS ONE | www.plosone.org 12 May 2010 | Volume 5 | Issue 5 | e10692