trabecular bone tissue strains in the healthy and ... · images were made for the healthy and...
TRANSCRIPT

Trabecular Bone Tissue Strains in the Healthy and OsteoporoticHuman Femur
B VAN RIETBERGEN,1 R HUISKES,1 F ECKSTEIN,2 and P RUEGSEGGER3
ABSTRACT
Quantitative information about bone tissue–level loading is essential for understanding bone mechanicalbehavior. We made microfinite element models of a healthy and osteoporotic human femur and found thattissue-level strains in the osteoporotic femoral head were 70% higher on average and less uniformlydistributed than those in the healthy one.
Introduction: Bone tissue stresses and strains in healthy load-adapted trabecular architectures should be distributedrather evenly, because no bone tissue is expected to be overloaded or unused. In this study, we evaluate this paradigmwith the use of microfinite element (�FE) analyses to calculate tissue-level stresses and strains for the human femur.Our objectives were to quantify the strain distribution in the healthy femur, to investigate to what extent thisdistribution is affected by osteoporosis, to determine if osteoporotic bone is simply bone adapted to lower load levels,and to determine the “safety factor” for trabecular bone.Materials and Methods: �FE models of a healthy and osteoporotic proximal femur were made from microcomputedtomography images. The models consisted of over 96 and 71 million elements for the healthy and osteoporotic femur,respectively, and represented their internal and external morphology in detail. Stresses and strains were calculated foreach element and their distributions were calculated for a volume of interest (VOI) of trabecular bone in the femoralhead.Results: The average tissue-level principal strain magnitude in the healthy VOI was 304 � 185 microstrains and thatin the osteoporotic VOI was 520 � 355 microstrains. Calculated safety factors were 8.6 for the healthy and 4.9 forthe osteoporotic femurs. After reducing the force applied to the osteoporotic model to 59%, the average straincompared with that of the healthy femur, but the SD was larger (208 microstrains).Conclusions: Strain magnitudes in the osteoporotic bone were much higher and less uniformly distributed than thosein the healthy one. After simulated joint-load reduction, strain magnitudes in the osteoporotic femur were very similarto those in the healthy one, but their distribution is still wider and thus less favorable.J Bone Miner Res 2003;18:1781–1788
INTRODUCTION
ALREADY OVER A CENTURY ago, the anatomist Meyer(1)
and the engineer Culmann(2) discovered a remarkablesimilarity between the trabecular architecture of the proxi-mal femur and the patterns of stress trajectories, calculatedwith the new theory of “Graphical Statics,” developed byCulmann.(2) On these results, Wolff(3) based his “trajectorialtheory,” the match of trabecular morphology and stresstrajectories and the essence of ‘Wolff’s law. Accordingly,
trabecular architecture is assumed to minimize both bonestress and weight. This paradigm at least suggests that,normally, stresses and strains should be distributed ratherevenly over the trabecular architecture.
So far, however, there have been no possibilities for aquantitative evaluation of this paradigm. It has been arguedthat the premise of Wolff’s law is a false one and that thecorrespondence between trabecular architecture and stresstrajectories is just an optical illusion.(4) The “GraphicalStatics” technique for analysis of stress transfer in solids isbased on requirements for continuity of the material. Theresults of these analyses only tell us about the courses of theThe authors have no conflict of interest.
1Department of Biomedical Engineering, Eindhoven University of Technology, Eindhoven, The Netherlands.2Institute of Anatomy, Ludwig-Maximilians-Universitat, Munchen, Germany.3Institute of Biomedical Engineering, University and ETH Zurich, Zurich, Switzerland.
JOURNAL OF BONE AND MINERAL RESEARCHVolume 18, Number 10, 2003© 2003 American Society for Bone and Mineral Research
1781

stress trajectories if the bone would be made out of a singlehomogeneous and isotropic material with no trabecular ar-chitecture. It has been argued as well that the similaritybetween trabecular orientation and stress trajectories is cir-cumstantial rather than causal and that there are no mathe-matical rules for bone architecture.(5) Over the last decades,far more advanced computational models, as based on finiteelement (FE) analysis, were developed to calculate stressesand strains in complex three-dimensional (3D) structures.Where analyses of bones are concerned, however, this ap-proach still suffers from the same limitations: bone materialcan only be represented as a homogenized continuum. Al-though such methods can account for the local porosity andanisotropy of the material, they can only provide stressesand strains at the homogenized level and not those inindividual trabeculae.
Because of the lack of stress and strain information at thissmall level, it is not known if, and to what extent, evendistributions are possible for the actual tissue stresses andstrains, or whether this is only possible for the averagetissues stresses and strains over a loading cycle. Nor is itknown to what extent a potential even distribution of tissuestresses and strains is affected by structural changes causedby osteoporosis and what the “safety factor” of the bone isfor changes in loads.
In this study, we aim at finding answers to thesequestions by calculating bone tissue stresses and strain inthe femoral head of a healthy and osteoporotic femurusing high-resolution FE models that can represent indi-vidual trabeculae in the proximal end of the femur. Withthis technique, high-resolution sequential images ob-tained from, for example, microcomputed tomography(�CT) scanners are used as a basis for the geometry of a3D �FE model that can represent the trabecular structurein detail.(6) Because models generated in this way will ingenerally consist of a very large number of elements (onthe order of 105–106/cm3), special iterative FE solversand supercomputers are generally required.(7,8) To date,this technique has only been used to analyze test samplesof bone (loaded in a non-physiological way) and smallanimal bones because of limitations on CT scanningvolume and computer resources. For the calculation ofphysiological tissue loading, natural boundary conditionsmust be applied, which is possible only when �FE mod-els can represent whole bones. With recently developed�CT scanners for large pieces of bone and new parallelcomputers with many gigabytes of memory, this is nowpossible. The feasibility of this �FE approach to calcu-late tissue level stresses and strains in human bones withthis new hardware is explored here.
Specific purposes of this study are to quantify andcompare strain distributions in the healthy and osteopo-rotic femoral head, to investigate to what extent an evenstrain distribution can be obtained and to what extent thisdistribution is affected by osteoporosis, to determine ifosteoporotic bone is simply bone adapted to lower loadlevels, and to determine the safety factor for trabecularbone.
MATERIALS AND METHODS
Bone mineral density (BMD) values of the femoral neckwere measured (DPX-L, DXA scanner; Lunar) in situ in 80elderly cadavers from an anatomic dissection course. Basedon these measurements, a healthy femur (T-score: �0.5)and a severely osteoporotic (T-score: �4.0) femur wereselected, with closely matched age (healthy, 82 years; os-teoporotic, 89 years), body weight (healthy, 63 kg; osteo-porotic, 57 kg), length (healthy, 1.60 m; osteoporotic,1.61 m), and femoral head diameter (45 mm for both fe-murs) of the female donors.
Sequential cross-sectional images of the proximal 10 cmof these femurs were made using a �CT scanner (�CT80;Scanco, Bassersdorf, Switzerland) with an 80-mm field-of-view. The resolution of the images was chosen as 80 �m sothat the entire volume could be captured with images of1024 � 1024 pixels in size. A total of 1154 and 1152images were made for the healthy and osteoporotic femur,respectively, covering a length of approximately 92 mm ofeach femur. The slice distance was chosen the same as thepixel size at 80 �m. The total time needed for imaging andreconstruction was about 200 s per cross-section, resultingin a total scan time of approximately 3 days for each femur.After reconstruction of the bone in a voxel grid, a modestGauss filtering algorithm followed by a segmentation algo-rithm was applied to reduce the noise and to extract the bonetissue, respectively. The resulting 3D reconstructions of thehealthy and osteoporotic proximal femur represented theinternal and external architecture of the bone in great detail(Fig. 1). By comparing simulated radiographs made fromthe computer reconstruction data (Fig. 2) with real radio-graphs of the bone, it was concluded that all relevant fea-tures of the bone as seen on the real radiographs wereclearly recognizable in the simulated radiographs.
Bone voxels were converted to equally sized brick ele-ments, resulting in �FE models with over 96.8 and 71.6million elements and 130 and 100 million nodes for thehealthy and osteoporotic femurs, respectively. In each fe-mur, cortical and cancellous bone regions were identifiedbased on the number of bone voxels in the neighborhood ofeach voxel. Elements were assigned a stiffness of 22.5 GPafor cortical and 15 GPa for trabecular bone tissue.(9,10) Aphysiological distributed load was applied normal to thefemoral head surfaces. The radius and the center of thefemoral head sphere were found by calculating the radiusand center of the circle that best fits the contour of thefemoral head, as seen in the simulated radiographs in threespatial directions.
The direction and magnitude of the resultant externalforce acting on the femoral head were chosen to representthe stance phase of walking and were obtained from in vivotelemetry measurement.(11) The force magnitude was 234%of body weight (BW), corresponding to 1446N and 1308Nfor the healthy and osteoporotic femurs, respectively. Theforce was distributed normal to the surface of the femoralhead with its magnitude following a cosine function of thepolar angle as obtained from the telemetry data. The distalends of both models were fully constrained.
1782 VAN RIETBERGEN ET AL.

The �FE analyses were performed with an iterativeelement-by-element solver that was optimized for parallelprocessing.(7,8) Thirty processors of an SG/Cray Origin2000computer, with a total of 128 processors and 57 GB ofmemory, were used for the calculations. Memory require-ments were 17 GB for the healthy femur and 13 GB for theosteoporotic one. About 30,000 iterations were needed toobtain sufficiently converged results.(12) Total cpu time forsolving the healthy femur model was about 25.000 h, and totalwall-clock time was approximately 6 weeks. For the osteopo-rotic model, these figures were approximately 25% less.
Principal stresses and strains were calculated for eachelement in the model, and the component of the tissueprincipal strain with the largest magnitude was representedin 3D contour plots. Further analyses of tissues stresses andstrains in the trabecular bone tissue concentrated on a spher-ical volume of interest (VOI) located within the femoralhead (Fig. 2). This sphere, with a radius of 16 mm, com-prises most of the trabecular bone in the femoral head ofboth femurs. The number of elements in this sphere was15.3 and 8.4 million for the healthy and osteoporotic model,respectively. From these numbers, it was calculated that thetrabecular bone volume fraction was 0.46 for the VOI in thehealthy femur model and 0.25 for the VOI in the osteopo-rotic model, which clearly shows the large difference inbone density in this region. Histogram plots were created forthe component of the principal strain with the largest mag-nitude, further indicated as � ��i
princ�max, with the signdependent on the sign of �i
princ and i � 1, 2, or 3, repre-senting the three components of the principal strain. Thesame indicators were used for the component of the princi-
pal stress with the largest magnitude, further indicated as� ��i
princ�max, for the strain energy density (SED), for theVon Mises equivalent stress, indicated as �VM, and for themaximal principal strain magnitude, indicated as��i
princ�max.To check whether the osteoporotic architecture is adapted
to reduced load, we investigated if the strain distribution inthe osteoporotic bone would be similar to that in healthybone for a reduced hip-joint load. For this purpose, thestress and strain calculations for the osteoporotic bone wereredone after scaling the external load such that the averagevalue of the principal strain magnitude in the VOIs was thesame in the healthy and osteoporotic case. Because these arelinear FE analyses, the scaling of external loading condi-tions can be done without performing additional FE analy-ses. The calculated displacements and forces could simplybe scaled by the same factor, and the indices for the reducedhip-joint load were obtained by recalculation of the stressand strain values.
Finally, to determine a safety factor for bone in thefemoral head, we calculated the magnitude of the externalload for which local bone failure would occur. For thispurpose, we used a failure criterion that was developed in anearlier study of experimentally failure prediction in thehuman radius.(13) A good prediction of bone failure could beobtained from linear FE analyses, assuming that bone fail-ure would occur for an external force resulting in a tissuestrain distribution with 2% of the bone tissue loaded beyond7000 microstrains. In this study, we calculated the safetyfactor as the number by which the external load magnitudemust be multiplied to reach this tissue-level strain criterion.
FIG. 1. �FE models of the (A) healthy and (B) osteoporotic femurs. In the larger images, only the half-models are shown to show the trabecularbone regions. Insets: rendered image of the full model.
1783TRABECULAR BONE TISSUE STRESSES AND STRAINS

RESULTS
The contour plot for the component of the tissue principalstrain with the largest magnitude � ��i
princ�max in thehealthy femur (Fig. 3A) shows that compression is found fortrabeculae running from the femoral head to the medialcortex and tension for trabeculae in the perpendicular direc-tion. A similar loading pattern can be observed for theosteoporotic femur (Fig. 3B), although the strains in thisbone are generally higher.
The average tissue-level principal strain magnitude��i
princ�max in the healthy VOI was 304 microstrains and thatfor the osteoporotic VOI was 520 microstrains. Hence, tohave the same average value in the healthy and osteoporoticVOIs, the magnitude of the external load working on theosteoporotic femur had to be reduced to 767N or 59% of itsoriginal value.
Histograms of the bone tissue level loading distribution asrepresented by the parameters � ��i
princ�max, � ��iprinc�max,
SED, �VM, and ��iprinc�max in the VOI (Fig. 4) clearly show
the differences between the healthy and osteoporotic fem-oral heads. For the osteoporotic VOI, the distribution curvesare much wider, indicating that more material is subjected tohigh stress than for the healthy VOI. After downscaling theload to 59% of its original value (such that the average of��i
princ�max is the same as in the healthy situation), however,the curves for the osteoporotic bone and those for thehealthy bone closely match for all investigated parameters.
From the average values of the parameters investigated andtheir SDs (Table 1), it was calculated that, on average, the
stress and strain components in the osteoporotic VOI are in-creased by 57–71% relative to the healthy one. The increase inthe SED was much larger at 208%. After reducing the mag-nitude of the external load applied to the osteoporotic femur to59%, differences between the average values in the healthy andosteoporotic VOI were less than 8% for any of the parametersinvestigated. Nevertheless, the SDs of the parameters calcu-lated for the osteoporotic bone were larger in all cases (by12–25%) than in the healthy VOI. Even for parameter��i
princ�max, which has exactly the same average value as in thehealthy situation because its value was used as the reference forthe load scaling, the SD was 13% higher than in the healthycase. The safety factor calculated for the healthy femur was8.62. This means that the external load magnitude of 1446Nshould be multiplied with a factor of 8.62, corresponding to aforce magnitude of 12.5 kN, to reach a state where the tissuelevel strains exceed 7000 microstrains for 2% of the bonetissue. For the osteoporotic femur, this factor was much less at4.9, corresponding to a force magnitude of 6.4 kN. For theosteoporotic femur with reduced loading, this factor was onlyslightly less than that for the healthy case at 7.94. The corre-sponding magnitude of the load, however, was the same as forthe osteoporotic bone; the scaling factor is increased onlybecause the magnitude of the external load was reduced in thiscase.
DISCUSSION
One of the purposes of this study was to investigate towhat extent an even distribution of tissue-level strains can
FIG. 2. Simulated radiographs of the FE models of the (A) healthy and (B) osteoporotic femurs. Grayscale represents the density in each pixelof the projection image. The same scale is used for both images. The circles drawn in the femoral heads indicate the outer dimension of thespherical VOI in each femoral head.
1784 VAN RIETBERGEN ET AL.
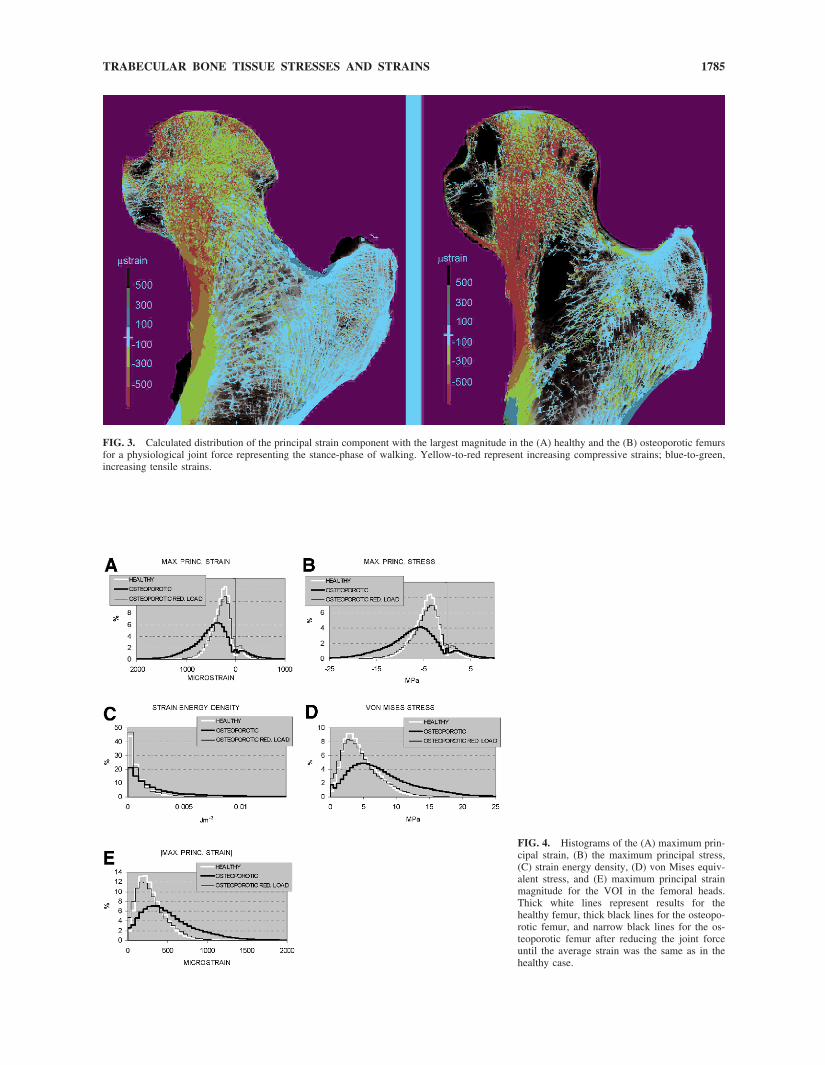
FIG. 3. Calculated distribution of the principal strain component with the largest magnitude in the (A) healthy and the (B) osteoporotic femursfor a physiological joint force representing the stance-phase of walking. Yellow-to-red represent increasing compressive strains; blue-to-green,increasing tensile strains.
FIG. 4. Histograms of the (A) maximum prin-cipal strain, (B) the maximum principal stress,(C) strain energy density, (D) von Mises equiv-alent stress, and (E) maximum principal strainmagnitude for the VOI in the femoral heads.Thick white lines represent results for thehealthy femur, thick black lines for the osteopo-rotic femur, and narrow black lines for the os-teoporotic femur after reducing the joint forceuntil the average strain was the same as in thehealthy case.
1785TRABECULAR BONE TISSUE STRESSES AND STRAINS

be expected for a single external load case. From the resultsobtained, it is clear that there is considerable variation in thetissue strains for the most common and largest external load(the stance phase of walking) working on the femoral head.Obviously, a perfectly even distribution cannot be expectedfor one single load case because the femur is subjected tovarying loading magnitudes and directions during normaldaily activities. The actual trabecular structure that is causedby load adaptive remodeling should reflect all these differ-ent loading configurations in a weighted manner. In thislight, the distribution found in this study is surprisinglysmall. Less than 2% of the tissue is loaded below 50microstrains, and only 0.0039% of the tissue is loadedbeyond 3000 microstrains.
The tissue-level stress and strain distributions calculatedin this study compare very well to those obtained in anearlier study of a beagle femur.(14) The average strain mag-nitude calculated in this study (304 microstrains) is only8.9% higher than that calculated for the beagle (279 micros-trains). The average Von Mises stress and strain energydensity found in the present study were 4.66 MPa and 1011Jm�3, respectively, which are almost the same as in thecanine study (4.60 MPa and 1020 Jm�3, respectively). It isinteresting to note that the SDs for the strain magnitude inthe canine femur (212 microstrains) are higher than thosefound in the present study (139 microstrains). This could beexplained by the fact that magnitudes and directions of jointloads in the dog vary much more than those in humans.(15)
It should be noted at this point that the sample size for eachof the investigated distributions is very large, and that,accordingly, any suitable statistical test would indicate thataverage values differ significantly in case that these are onlya fraction apart. However, statistical analyses are not veryuseful here because we have only analyzed one healthy andone osteoporotic bone. Hence, our results are exemplary.
A second purpose was to investigate to what extent thestress and strain distribution would be affected by osteopo-rosis. The strain distribution in the osteoporotic femur wasless favorable than that in the healthy femur, with strains70% higher on average, and with a much higher (though stillsmall) fraction of the tissue (0.045%) loaded beyond 3000microstrains. Interestingly, the amount of low-loaded bonewith a strain magnitude less than 50 microstrains (2.63%)was higher in the osteoporotic than in the healthy bone(1.98%), suggesting that osteoporosis does lead to the for-mation of loose trabecular ends.
A third purpose of this study was to determine if osteo-porotic bone is simply bone adapted to reduced load levels.To obtain the same average tissue level strain magnitudes,the external load applied to the osteoporotic femoral headhad to be reduced considerably to 59% of its original value.After this load reduction, the histograms of all investigatedparameters were very similar to those of the healthy femoralhead, although the distributions were still somewhat wider,as indicated by the larger SDs. It is worth noting, however,that the amount of low-loaded bone with a strain magnitudeless than 50 microstrains (4.69%) is more than twice as highas in the healthy case (1.98%), indicating that after this loadreduction an increased amount of bone would be subjectedto very small strains. Hence, although the tissue stress andstrain distributions after load reduction look very similar tothose of the healthy femur, the larger SDs and the largeramount of low-loaded bone indicate that osteoporotic boneis not the same as healthy bone adapted to lower loads.Following the paradigm that, normally, stresses and strainsshould be distributed rather evenly over the trabecular ar-chitecture, the larger SD found for the osteoporotic boneseems unfavorable. The interpretation of these findings alsodepends on the physical activities of both donors, whichunfortunately were not known. If both donors were equally
TABLE 1. STATISTICAL DESCRIPTION OF THE DISTRIBUTIONS FOUND FOR THE INVESTIGATED PARAMETERS
Average SD Minimum 1st quartile Median 3rd quartile Maximum Skewness Curtosis
eps_p_max (�strain)Healthy �283 217 �8576 �399 �265 �164 3514 �0.67 7.78Osteoporotic �455 436 �20994 �685 �431 �226 11213 �0.45 8.29Osteoporotic red. load �266 255 �12299 �401 �252 �133 6569 �0.45 8.29
sig_p_max (Mpa)Healthy �4.43 3.31 �128.25 �6.15 �4.18 �2.64 53.36 �0.79 8.57Osteoporotic �6.97 6.57 �307.09 �10.43 �6.63 �3.43 174.04 �0.53 8.59Osteoporotic red. load �4.08 3.85 �179.91 �6.11 �3.89 �2.01 101.96 �0.53 8.59
SED (Jm�3)Healthy 1011 1620 0.00 269 594 1283 552755 29.86 3746Osteoporotic 3110 5906 0.00 616 1624 3794 3338040 93.45 35660Osteoporotic red. load 1067 2027 0.00 211 557 1302 1145720 93.45 35660
VM (Mpa)Healthy 4.66 2.80 0.00 2.66 4.07 6.17 129.05 1.76 11.22Osteoporotic 7.94 5.32 0.00 4.18 6.83 10.56 324.33 1.83 15.92Osteoporotic red. load 4.65 3.12 0.00 2.45 4.00 6.18 190.01 1.83 15.92
�eps_p_max� (�strain)Healthy 304 185 0.00 174 269 401 8576 1.87 12.88Osteoporotic 520 355 0.00 268 448 694 20994 1.84 15.89Osteoporotic red. load 304 208 0.00 157 262 407 12299 1.84 15.89
1786 VAN RIETBERGEN ET AL.

active, the load magnitudes originally applied to the FEmodels, which were based on in vivo telemetry measure-ments in active subjects, should be realistic. In this case, thebone of the osteoporotic donor is clearly higher loaded andwill be more susceptible to fractures. It is possible, however,that the osteoporotic donor was (much) less active than thehealthy one, such that (part of) the osteoporotic bone loss iscaused by adaptation to lower load levels. In this case, theFE analyses with the reduced load would be more appro-priate, and the bone loading during normal activities wouldbe very similar to the healthy femur. It should be noted,however, that also in the latter case, the bone of the osteo-porotic donor would be much more susceptible to fracturescaused by non-physiological forces, such as falls, where theforces are largely determined by body weight, which wassimilar for both subjects.
A final purpose of this study was to establish a safetyfactor for trabecular bone in the human femur. We calcu-lated a safety factor of 8.62 for the healthy bone and a factorof 4.90 for the osteoporotic bone. These values correspondto 20 times BW and 11.5 times BW for the healthy andosteoporotic femur, respectively. In their study, Bergmannet al.(11) reported a maximum load magnitude measuredduring all measurements of 8.7 times BW (for stumbling).This indicates that the bone in the femoral head is unlikelyto fracture for any of the activities that have been measuredin these studies, including stumbling. It should be noted,however, that femoral fractures usually do not occur in hefemoral head but rather in the neck or trochanteric regionand usually are not caused by physiological loading, but toan unusual load, such as in a fall. As such, the numbers thatwe mention here are not directly representative for the bonefracture risk, but they are an indication for the safety factorof bone in the femoral head for physiological loading con-ditions.
Some limitations of this study should be mentioned. First,muscle forces were not included in the model. However,their net effect is included in the joint force because thesewere based on in vivo measurements. Hence, stresses andstrains in the femoral head and neck, which are determinedonly by the joint force, are correct. In the trochanteric andmore distal regions, however, the muscle forces will con-tribute to the stresses and strains as well. Hence, the resultsas represented in Fig. 3 represent physiological values in thefemoral head and neck that are determined by the joint forcealone, but do not represent physiological values in otherregions that are determined by the muscle forces as well.Second, in this study, we have assumed that the tissue levelmaterial properties in the healthy and osteoporotic situationare the same. This assumption is supported by recent studiesthat reported no significant changes in bone tissue materialproperties with osteoporosis.(16–18) It is possible to simplyscale the results of the osteoporotic analyses to accommo-date for changes in material behavior as long as these takeplace uniformly. For example, a 10% higher modulus in theosteoporotic case would result in 10% lower strains in thetissue. Third, numerical errors and the relatively large80-�m voxel size can limit the accuracy of the �FE mod-els.(19) However, earlier convergence studies have indicatedthat high-resolution FE models with an element size of 80
�m can produce accurate calculations in the femoralhead.(20,21) Although local errors in the strains might exist,in particular near the surface of the trabeculae, their effectson histograms and plots are small.(7,14) Fourth, we usedlinear elastic FE analyses to predict bone failure. In anearlier study, using similar FE analyses in combination withexperimental data provided good results for the predictionof the bone failure load measured in experiments.(13) Theconcept that bone failure would occur as soon as 2% of thetissue is overloaded also agrees with findings by others, whoused nonlinear �FE to predict bone yield behavior.(22,23)
Nevertheless, it is not known if the same values wouldprovide similar results for bone at other sites. The valuesreported here thus can only be used as a first estimate of theactual failure load. Finally, computational requirements forthese analyses are still excessive. The equivalent of 2.9years of cpu-time was used for each of the analyses. Con-sequently, large parallel computer systems are required toperform these analyses in a reasonable amount of wall-clocktime.
ACKNOWLEDGMENTS
This study was supported by an ETH research grant. Wethank Dr Bruno Koller from Scanco Medical (Bassersdorf,Switzerland) for making the �CT scans of the bones.
REFERENCES
1. Meyer GH 1867 Archief fur den anatomische und physiologischenWissenschaften im Medizin. Die Architektur der Spongiosa 34:615–628.
2. Culmann K 1866 Die Graphische Statik. Verlag von Meyer &Zeller, Zurich, Switzerland.
3. Wolff J 1892 Das gesetz der Transformation de Knochen. Hir-schwald, Berlin, Germany.
4. Cowin SC 1997 The false premise of Wolff’s law. Forma 12:247–262.
5. Huiskes R 2000 If bone is the answer, then what is the question?J Anat 197:145–156.
6. Hollister SJ, Brennan JM, Kikuchi N 1994 A homogenizationsampling procedure for calculating trabecular bone effective stiff-ness and tissue level stress. J Biomech 27:433–444.
7. van Rietbergen B, Weinans H, Huiskes R, Odgaard A 1995 A newmethod to determine trabecular bone elastic properties and loadingusing micromechanical finite-element models. J Biomech 28:69–81.
8. van Rietbergen B, Weinans H, Polman BJW, Huiskes R 1996Computational strategies for iterative solutions of large FEM ap-plications employing voxel data. Int J Num Meth Eng 39:2743–2767.
9. Rho JY, Ashman RB, Turner CH 1993 Young’s modulus oftrabecular and cortical bone material: Ultrasonic and microtensilemeasurements. J Biomech 26:111–119.
10. Turner CH, Rho J, Takano Y, Tsui TY, Pharr GM 1999 The elasticproperties of trabecular and cortical bone tissues are similar: Re-sults from two microscopic measurement techniques. J Biomech32:437–441.
11. Bergmann G, Deuretzbacher G, Heller M, Graichen F, RohlmannA, Strauss J, Duda GN 2001 Hip contact forces and gait patternsfrom routine activities. J Biomech 34:859–871.
12. van Rietbergen B, Eckstein F, Koller B, Huiskes R, Baaijens FPT,Ruegsegger P 1999 Feasibility of micro-FE analyses of humanbones. In: Middleton J, Jones ML, Shrive NG, Pande GN (eds.)Computer Methods in Biomechanics and Biomedical Engineering.Gordon and Breach Science Publishers, London, UK, pp. 51–56.
13. Pistoia W, van Rietbergen B, Lochmuller EM, Lill CA, Eckstein F,Ruegsegger P 2002 Estimation of distal radius failure load withmicro-finite element analysis models based on three-dimensionalperipheral quantitative computed tomography images. Bone 30:842–848.
1787TRABECULAR BONE TISSUE STRESSES AND STRAINS

14. van Rietbergen B, Muller R, Ulrich D, Ruegsegger P, Huiskes R1999 Tissue stresses and strain in trabeculae of a canine proximalfemur can be quantified from computer reconstructions. J Biomech32:443–451.
15. Bergmann G, Siraky J, Rohlmann A, Koelbel R 1984 A compar-ison of hip joint forces in sheep, dog and man. J Biomech 17:907–921.
16. Homminga J, McCreadie BR, Ciarelli TE, Weinans H, GoldsteinSA, Huiskes R 2002 Cancellous bone mechanical properties fromnormals and patients with hip fractures differ on the structure level,not on the bone hard tissue level. Bone 30:759–764.
17. Ding M 2000 Age variations in the properties of human tibialtrabecular bone and cartilage. Acta Orthop Scand Suppl 292:1–45.
18. Guo XE, Goldstein SA 2000 Vertebral trabecular bone micro-scopic tissue elastic modulus and hardness do not change inovariectomized rats. J Orthop Res 18:333–336.
19. Guldberg RE, Hollister SJ, Charras GT 1998 The accuracy ofdigital image-based finite element models. J Biomech Eng 120:289–295.
20. Ulrich D, van Rietbergen B, Weinans H, Ruegsegger P 1998 Finiteelement analysis of trabecular bone structure: A comparison ofimage-based meshing techniques. J Biomech 31:1187–1192.
21. Pistoia W, van Rietbergen B, Laib A, Ruegsegger P 2001 High-resolution three-dimensional-pQCT images can be an adequate
basis for in-vivo microFE analysis of bone. J Biomech Eng 123:176–183.
22. Niebur GL, Yuen JC, Hsia AC, Keaveny TM 1999 Convergencebehavior of high-resolution finite element models of trabecularbone. J Biomech Eng 121:629–635.
23. Niebur GL, Feldstein MJ, Yuen JC, Chen TJ, Keaveny TM 2000High-resolution finite element models with tissue strength asym-metry accurately predict failure of trabecular bone. J Biomech33:1575–1583.
Address reprint requests to:B van Rietbergen, PhD
Faculty of Biomedical EngineeringEindhoven University of Technology
PO Box 5135600 MB Eindhoven, The Netherlands
E-mail: [email protected]
Received in original form November 13, 2002; in revised formMarch 7, 2003; accepted May 7, 2003.
1788 VAN RIETBERGEN ET AL.