organization report: american physical …€¦ · organization report: american physical society...
TRANSCRIPT
ORGANIZATION REPORT:
AMERICAN PHYSICAL SOCIETY (APS)
PRINCIPAL INVESTIGATORS:
Dr. Erin A. Cech, University of Michigan
Dr. Tom Waidzunas, Temple University
FUNDS #1535385, 1535360

STEM Inclusion Study 2
TABLE OF CONTENTS
EXECUTIVE SUMMARY ............................................................................................................. 3
BACKGROUND ......................................................................................................................... 4
1. Inclusion and Marginalization .................................................................................................... 6
2. Professional (De)valuation ...................................................................................................... 11
3. Patterns of workplace fairness across sectors ........................................................................ 17
SUMMARY OF FINDINGS ....................................................................................................... 23
METHODOLOGICAL APPENDIX ............................................................................................... 26
Works Cited ........................................................................................................................... 27
Suggested Citation:
Cech, Erin and Tom Waidzunas. 2018. “STEM Inclusion Study Organization
Report: APS.” Ann Arbor, MI: University of Michigan.
The STEM Inclusion Study (https://www.steminclusion.com/) is funded by the National Science Foundation (#HRD 1535385, 1535360). Any opinions, findings, and conclusions or recommendations expressed in this material are those of the author(s)
and do not necessarily reflect the views of the National Science Foundation. We thank Michelle Pham and William Rothwell for excellent research assistance and Heidi Sherick, the project’s Professional Organization Liaison, for her efforts.

STEM Inclusion Study 3
EXECUTIVE SUMMARY The STEM Inclusion Study, led by Dr. Erin Cech (University of Michigan) and Dr. Tom Waidzunas (Temple University), is the first large-scale, national-level study to simultaneously examine the experiences of women, racial and ethnic minorities (REM), persons with disabilities, and lesbian, gay, bisexual, transgender, and queer (LGBTQ) individuals working in the science, technology, engineering and math (STEM) workforce.1 The study advances knowledge of the structures and cultures of STEM fields that may undermine equality of opportunities and outcomes on the basis of gender, racial/ethnic category, disability, and LGBTQ status. Overall, the goal of the study is to better understand processes of disadvantage experienced by members of STEM-related professional organizations in order to inform diversity and inclusion efforts in these organizations, as well as other STEM-related entities and institutions.
This organization participated in the survey phase of the STEM Inclusion Study, alongside a number of other STEM-related professional organizations. 2 With permission from the organization, the research team surveyed members of this organization on a variety of topics related to members’ day-to-day experiences in their workplaces and their encounters with other STEM professionals. Using data from this survey, this report examines trends regarding (a) experiences of inclusion and marginalization, analyzing employees’ perceptions of their workplace climate, feelings of personal fit, and harassment on the job; (b) professional valuation, the extent to which respondents believe they are respected and taken seriously as STEM professionals, and (c) reports of workplace fairness, the frequency with which respondents report instances of hostility and unfair treatment in their workplaces toward members of disadvantaged groups. We compare reports of fairness across employment sector (college or university, for profit sector and other employment sector).
1 The STEM Inclusion Study (https://www.steminclusion.com/) is funded by the National Science Foundation (#HRD 1539140). Any opinions, findings, and conclusions or recommendations expressed in this material are those of the author(s) and do not necessarily reflect the views of the National Science Foundation.
Regarding experiences of inclusion and marginalization, persistent patterns emerged by gender, disability status, LGBTQ status, and race/ethnicity in this organization. Specifically, controlling for employment sector, education level, and age, women, persons with disabilities, LGBTQ respondents, and some racial/ethnic minority group members are significantly more likely to report experiences of marginalization in their workplaces than their colleagues. A similar pattern emerged regarding professional valuation: women, persons with disabilities, LGBTQ respondents and certain racial/ethnic minority group members are significantly more likely to report having their professional expertise devalued, receiving less respect from their supervisors and co-workers, and feeling as though they have to work harder than their colleagues to be seen as competent STEM professionals.
Regarding patterns in workplace fairness, organization members across different employment sectors reported witnessing or experiencing instances of negative treatment and harassment with some frequency: for instance, 33% of respondents reported witnessing negative treatment by gender in their workplaces in the last three years, and 16% reported witnessing negative treatment along the lines of race/ethnicity. These instances of negative treatment were similarly prevalent among organization members across different employment sectors, but slightly better in the for-profit sector.
This report begins with a brief introduction to inequality issues within the STEM workforce, then summarizes the survey results of this organization and offers suggestions for addressing these issues. In particular, we highlight the finding that women report significantly less positive experiences than men on nearly every measure of marginalization and professional devaluation that we examine here, and the data show racial/ethnic differences, and differences by disability and LGBTQ status on several measures.
2 In total, the STEM Inclusion Study aims to include 15-20 professional organizations, seeking to maximize representation from the array of STEM disciplines, sectors, and industries. The names of the professional organizations are kept confidential to protect the confidentiality of individual survey participants.

STEM Inclusion Study 4
BACKGROUND In both public and scholarly discourse, there is growing interest surrounding the retention and representation of certain socio-demographic groups in the STEM workforce. Investigating the processes of disadvantage that underrepresented groups in STEM face helps illuminate the factors that prevent talented and motivated individuals from advancing in STEM. Yet, scholars are only beginning to understand the particular mechanisms that reproduce these disadvantages within STEM workplace interactions, within STEM organizations, and within the contexts of science and engineering professional cultures. There is a pressing need for more research on these issues.
Investigations such as those undertaken by the STEM Inclusion Study are especially timely, as research over the last three decades has documented processes reproducing the underrepresentation of women, racial/ethnic minorities, LGBTQ persons, and persons with disabilities in science and engineering. Historically, women have been underrepresented in STEM in the United States (Iskander et al. 2013), and similar patterns are recorded in countries such as Korea, Switzerland, and Australia (Buccheria, Abt Gurber and Bruhwiler 2011). Women are less likely than men to enter STEM fields and more likely than men to leave them (Frehill 2012). In attempts to explain these gaps, research has not found any evidence of a performance gap between men and women (Koul, Lerdpromkulrat and Chantara 2011). Rather, stereotypes regarding who “fits” STEM are strongly connected to women’s under-representation in STEM, help perpetuate “chilly” climates for women, and undermine the perception of women’s competence as STEM professionals (Archer et al. 2013, Cech 2013, Cech et al. 2011, Cheryan et al. 2011). For instance, in an experimental study of science faculty hiring a student lab manager, men applicants were rated as more competent and likable than women applicants and offered higher salaries, even though the applicants had otherwise identical applications (Moss-Racusin et al. 2012). Among faculty populations, women tend to receive fewer resources, less mentoring, face greater criticism and isolation from peers, and are shouldered with
more administrative and service work than men (McIlwee & Robinson 1991, NSF 2007).
Existing research has also detailed the experiences and challenges of racial/ethnic minorities in STEM fields. Racial/ethnic minorities (particularly African Americans and Hispanics) are highly underrepresented in STEM majors, in STEM faculty positions, and in STEM positions in industry, compared to their representation in US population more broadly (Babco 2003, Huradto et al. 2010). This underrepresentation is attributed to a range of issues, including unequal educational opportunities and mentoring (Moreno et al. 2006), implicit bias (Turner 2002, Moody 2004), and feelings of isolation within academic departments and communities (Zambrana et al. 2015). This underrepresentation of racial/ethnic minority faculty in STEM departments, furthermore, gives minority students the impression that they do not have a place in STEM or academic fields (Nelson and Brammer 2012). Thus, the under-representation of minority faculty and students in STEM are closely tied with one another—without mentors with whom minority students can relate, they are less likely to believe that they can be successful in STEM fields (Nelson and Brammer 2012). Less research has examined the experiences of racial/ethnic minority persons employed in STEM outside of academia, although there is reason to believe that experiences of marginalization and exclusion extend to non-academic sectors as well.
Scholars are only beginning to understand the experiences of LGBTQ individuals in STEM, but limited previous research indicates that LGBTQ persons frequently face marginalization and unfair treatment compared to their non-LGBTQ peers. Cumulatively, prior studies indicate the existence of negative climates for LGBTQ faculty and students in higher education and suggest a link between this climate and academic/career consequences. One campus climate study of students, faculty, and administrators revealed negative experiences for LGBTQ college students and faculty (Rankin et. al 2010). For example, 31 percent of LGBTQ students and faculty reported that they were not comfortable with the climate on their campus climate and 20 percent feared for their physical safety. Faculty and students in STEM departments specifically report similar, if

STEM Inclusion Study 5
not more extreme, experiences of marginalization in science and engineering departments (Cech 2013; Cech and Waidzunas 2011; Bilimoria and Stewart 2009; Gunckel 2009). Further, recent research on employees of STEM-related federal agencies found strong and persistent workplace experience inequalities for LGBTQ-identifying persons compared to their non-LGBTQ colleagues (Cech & Pham 2017).
Little is understood about the experiences of persons with disabilities in STEM education and employment as well. Early research suggests that STEM fields may be particularly difficult and marginalizing environments for those with disabilities. Disability is often associated with negative stereotypes about intellectual ability; those with disabilities are often perceived as less intellectually competent than their peers (Slaton 2013). In STEM, this association is further compounded by the fact that STEM culture often silences discussions of bodily ability when evaluating performance (Knorr-Certina 1995, Siebers 2010, Slaton 2013).
Methodological Summary: In the fall of 2017, the American Physical Society distributed a link to the STEM Inclusion Study survey to a random sample of its membership list.3 Members were sent an email with the URL survey link. Participation in the survey was voluntary and individual responses are kept strictly confidential. 4 All survey results below are presented in a way that ensures that any given individual’s responses are not individually identifiable. For the purposes of this report, we focus only on the workplace experiences of organization members who were employed at the time of the survey (N=1538).
Table 1 below presents the proportion of employed respondents by gender,5 race/ethnicity (respondents could identify with more than one racial/ethnic minority category), LGBTQ status, disability status, 6 and employment sector (university/college, for-profit, or other—including K-12, nonprofit, and self-employed members).
Table 1: Descriptive Statistics of 1 by Demographic Characteristics (N=1538)
Demographic Characteristics Percent of the Sample
Women 18.97%
Men 80.16%
Hispanic 3.72%
Asian 8.28%
Black 1.24%
White 82.27%
Other race/ethnicity 4.49%
LGBTQ 4.71%
Disability (physical, mental or emotional) 17.70%
Employed at University or College 57.61%
Employed in for-profit sector 15.15%
Employed in another sector 26.2%
3 This organization’s participation the study was approved by the University of Michigan Institutional Review Board. 4 Respondents participated in an online survey that took approximately 15-minutes to complete. The survey consisted of active members with a paid membership to this organization. The survey link was distributed via email by the organization to a random selection of its members. Survey sample size: 2,647, response rate: 16.5%. We include in this analysis only those non-student respondents who were employed (N=1538) at the time of the survey. Survey
data was analyzed using Stata statistical programming package. The survey results above report univariate statistics (means). 5 The category “women” includes both cis-gender and transgender women and the category “men” includes both cis-gender and transgender men. 6 Note: 13.33% of the sample identified as having a physical disability, and 4.81% of the sample identified as having a mental or emotional disability.

STEM Inclusion Study 6
1. Inclusion and Marginalization
As noted above, previous research has found that women, racial/ethnic minorities, LGBTQ persons, and persons with disabilities in various arenas in STEM education and employment report more frequent experiences of marginalization and isolation than their colleagues (Frehill 2012, Cech 2013; Cech and Waidzunas 2011; Bilimoria and Stewart 2009; Gunckel 2009). This marginalization has consequences for long-term satisfaction and retention of these groups in STEM education and employment (Eglash 2002, Chang et. al 2008, Zambrana et. al 2015, Laschinger et. al 2004).
We explore patterns of inclusion and
marginalization across demographic categories in this organization on five key indicators: (1) whether they feel like they fit in with other people
in their workplace, (2) whether they have read or heard insensitive comments in their organization in the last year, (3) whether they worry that their mistakes garner more visibility than those of their colleagues, (4) whether they have heard a negative comment of a joke about women, racial minorities, LGBTQ individuals, or people with disabilities while at work and (5) whether they have been harassed verbally or in writing in their workplace. In this work, we consider each axis of marginalization independently. However, we recognize that, from the theory of intersectionality (Crenshaw 1991), forms of marginalization across these dimensions are interlocking and interwoven. Our future research will aggregate data across professional organizations in the STEM Inclusion Study, providing a sample size large enough to explore these intersectional outcomes.
Fig 1: “I feel like I fit in with other people in my workplace.”
Predicted Probabilities by gender, race/ethnicity, LGBTQ and disability status, net of differences by sector, age, and education level. (1=strongly disagree to 5=strongly agree)
1
1.5
2
2.5
3
3.5
4
4.5
5
* *****+

STEM Inclusion Study 7
Figure 1 represents whether respondents
feel like they “fit in” with the colleagues in their
workplace (values range from 1-5, 1=Strongly
Disagree through 5=Strongly Agree). The values
are predicted probabilities, or the means for each
group holding variation by age, sector, and
education level constant.
Overall, the averages among all
demographic groups are relatively high, with
respondents feeling on average between “Neither
Disagree nor Agree” and “Agree” in regards to
fitting in with others at their work.
There are four significant differences on
this measure of marginalization, however, as
indicated by the asterisks above the bar
(***p<.001, **p<.01, *p<.05, †p<.10, two-tailed
test).7 First, women respondents are significantly
less likely than men to report that they fit in.
Hispanic respondents were also significantly less
likely to report feeling as though they fit in
compared to their white counterparts. Further,
respondents who reported having a disability were
marginally less likely than respondents without
disabilities to report that they fit in, and LGBTQ
respondents were significantly less likely than
their non-LGBTQ peers to report that they fit in,
net of controls.
Fig 2: “I have read or heard insensitive comments in my workplace that I found offensive.”
Predicted Probabilities by gender, race/ethnicity, LGBTQ and disability status, net of differences by sector, age, and education level. (1=Never, 2=At least once in the past year, 3=At least once a month or more)
7 Significance levels were determined by logistic, OLS, or ordered logistic regressions (depending on the dependent variable in question) that included measures for gender, racial/ethnic category, LGBTQ status, age, disability status,
education level and employment status. These models were multiply imputed (20 imputations using the chained command in Stata) so that all figures have an N=1,538.
1
1.5
2
2.5
3
+***

STEM Inclusion Study 8
This second measure indicates whether some groups are significantly more likely than others to have encountered insensitive or offensive comments in their workplace. Such comments are an important mechanism of marginalization in workplaces. Overall, across all demographic groups, respondents reported encountering an offensive comment at least once in the past year (a mean value of 2 or more).
Women reported these insensitive comments happening significantly more frequently than men reported them happening, net of controls. Black respondents reported insensitive comments happening marginally more frequently than white respondents reported encountering such comments.
Fig 3: “I worry that my mistakes are more noticeable than the mistakes of others.”
Predicted Probabilities by gender, race/ethnicity, LGBTQ and disability status, net of differences by sector, age, and education level. (1=strongly disagree to 5=strongly agree)
Another important indicator of marginalization is the extent to which persons fear that their mistakes are more visible than those of their colleagues. In the figure above, there are several significant group differences: net of variation by sector, education level, and age, women are more likely than men, Asian
respondents more likely than white respondents, and LGBTQ respondents more likely than non-LGBTQ respondents to say that their mistakes garner more negative attention than those of their colleagues.
1
1.5
2
2.5
3
3.5
4
4.5
5
*
*****

STEM Inclusion Study 9
Fig 4: “A co-worker makes a negative comment or joke about women, racial/ethnic minorities, LGBTQ people, or people with disabilities.”
Predicted Probabilities by gender, race/ethnicity, LGBTQ and disability status, net of differences by sector, age, and education level. (1=Never, 2=At least once in the past year, 3=At least once a month or more)
Figure 4 depicts an aggregated measure
that reports the frequency with which respondents reported hearing overtly offensive comments about disadvantaged groups in the workplace (1=never, 3=at least once a month or more). While the frequency of these overtly biased comments was rare, women are
significantly more likely than men to overhear offensive comments, black respondents are more likely than white respondents, and LGBTQ respondents are more likely than non-LGBTQ respondents to report hearing targeted comments about minority groups.
1
1.5
2
2.5
3
**** *

STEM Inclusion Study 10
Fig 5: “I was harassed verbally or in writing at my job in the last year.”
Predicted Probabilities by gender, race/ethnicity, LGBTQ and disability status, net of differences by sector, age, and education level. (1=Never, 2=At least once in the past year, 3=At least once a month or more)
Finally, Figure 5 depicts the frequency with which respondents report experiencing harassment in their workplace. Overall, as indicated in Fig 5, experiences of direct harassment are relatively rare. However, women were significantly more likely than men to report experiencing harassment at work in the last year, respondents with disabilities were significantly more likely to report harassment at work in the past year than respondents without disabilities, and Asian respondents were marginally less likely than white respondents to report harassment at work in the past year. Summary of Patterns of Marginalization
Several strong demographic patterns emerged on the marginalization measures above. The most persistent pattern was along the lines of gender: women respondents consistently reported more frequent experiences of marginalization in their workplaces than men, net of other demographic and work characteristics. These gender differences emerged on all of the marginalization measures we include in our analysis. For example, women were more likely than men to report witnessing offensive
comments in their workplace, more likely than men to report being harassed at work, and more likely to state that they worried their mistakes were more noticeable than others. These results point to a concerning pattern of institutional marginalization of women in their workplaces.
Another consistent pattern that emerged is the marginalization experienced by LGBTQ-identifying persons. Respondents identifying as LGBTQ were significantly less likely than their peers to feel that they fit in at their workplaces, more likely to report negative comments toward minority groups, and more likely to report feeling as though their mistakes were more noticeable than the mistakes of others in their workplace. These patterns by LGBTQ status indicate that this should be an important point of consideration for this organization as it advocates for the interests of its members.
Several other patterns of marginalization emerged. First, black respondents were marginally more likely than white respondents to report reading, hearing and/or seeing comments in their workplace that they found offensive. Hispanic respondents were also significantly more likely than white respondents to report negative
1
1.5
2
2.5
3
** †*

STEM Inclusion Study 11
comments toward minority groups in their workplace, and were less likely than whites to report feeling a sense of fit within their workplace. Further, Asian respondents were more likely than white respondents to state that they worried their mistakes were more noticeable than others, and were also marginally more likely than white respondents to report being harassed at work.
Lastly, respondents with disabilities reported more frequent experiences of marginalization in the workplace than non-disabled respondents. Respondents with disabilities were more likely than respondents without disabilities to report verbal or written harassment on the job. Further, they were marginally less likely to report feeling as though they fit in their current workplace.
In short, women, LGBTQ persons, persons with disabilities, and black, Asian and Hispanic respondents were significantly more likely than their men, non-LGBTQ, non-disabled and white counterparts to report a chilly, marginalizing climate in their workplaces.
2. Professional (De)valuation
Prior research has found that
disadvantaged groups within STEM often report that their colleagues question their scientific and engineering competence and performance (Moss-Racusin et. al 2012, Steele 2003, Chang et al. 2008, Williams 2014). Disparities in the recognition of the professional excellence of women, people of color, LGBTQ individuals, and persons with disabilities in STEM exacerbate the disciplinary issues of underrepresentation and attrition in STEM education and careers (Shapin 1995, Collins and Evans 2007, Williams 2014, Steele 2003, Chang et al. 2008, Nelson and Brammer 2012).
In this section, we examine five important indicators of professional devaluation: (1) whether they believe their work is respected in their workplace, (2) whether they believe their supervisor respects them, (3) whether they believe they are held to the same standard as their colleagues, (4) whether their boss gives them less credit than they deserve, and (5) whether they believe they have to work harder than their colleagues to be perceived as legitimate professionals.

STEM Inclusion Study 12
Fig 6: “In my workplace, my work is respected.”
Predicted Probabilities by gender, race/ethnicity, LGBTQ and disability status, net of differences by sector, age, and education level. (1=strongly disagree to 5=strongly agree)
As above, the bar charts in this section present the predicted means for each demographic category, net of variation by age, education level, and sector. The asterisks represent significant differences across those categories, as determined by OLS or ologit regression models (***p<.001, **p<.01, *p<.05, †p<.10, two-tailed test).
Figure 6 captures the extent to which respondents feel as though their work is respected within their workplaces (1-5; 1=Strongly Disagree, 5=Strongly Agree). Respondents typically feel that their professional work is respected—means lie on average between somewhat and strongly agree. However, women are significantly less likely than men to report that their work is respected by their colleagues, and Hispanic respondents are marginally less likely than white respondents to report that their work is respected in their workplaces.
1
1.5
2
2.5
3
3.5
4
4.5
5
* +

STEM Inclusion Study 13
Fig 7: “My supervisor treats me with respect.”
Predicted Probabilities by gender, race/ethnicity, LGBTQ and disability status, net of differences by sector, age, and education level. (1=strongly disagree to 5=strongly agree)
The second measure captures whether
respondents feel respected by their supervisors (Fig 7). In general, respondents typically report that they experience at least a modest degree of respect from their supervisors. However, there are important demographic differences.
Specifically, women respondents are significantly less likely than men to report that their supervisors respect them. Similarly, respondents with disabilities are marginally less likely than those without disabilities with the same education level, the same age, and in the same sector to report that their supervisors respect their work.
1
1.5
2
2.5
3
3.5
4
4.5
5
**+

STEM Inclusion Study 14
Fig 8: “I am held to the same standard as others for promotion and advancement.”
Predicted Probabilities by gender, race/ethnicity, LGBTQ and disability status, net of differences by sector, age, and education level. (1=strongly disagree to 5=strongly agree)
Another important indicator of
professional respect is the extent to which respondents believe that they are held to the same standard as their colleagues for advancement and promotion (Fig 8). Those who feel that they are held to a higher standard may not advance as quickly, and are not given the same level of respect for the same quality of work.
Consistent with the results above, women are significantly less likely than men, and black respondents significantly less likely than white respondents to report that they are held to the same standard as their colleagues. Additionally, respondents with disabilities are significantly less likely than respondents without disabilities to report that they are held to the same standard as their colleagues in their workplaces.
1
1.5
2
2.5
3
3.5
4
4.5
5
*
**
***
STEM Inclusion Study 15
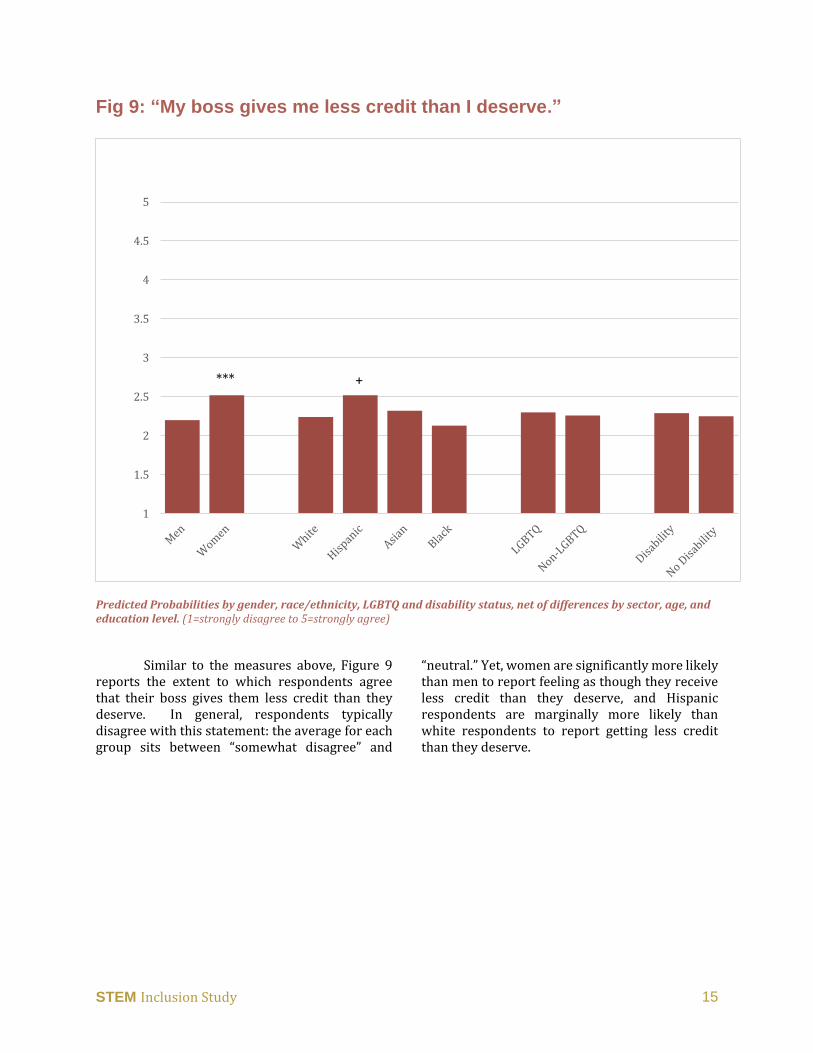
Fig 9: “My boss gives me less credit than I deserve.”
Predicted Probabilities by gender, race/ethnicity, LGBTQ and disability status, net of differences by sector, age, and education level. (1=strongly disagree to 5=strongly agree)
Similar to the measures above, Figure 9 reports the extent to which respondents agree that their boss gives them less credit than they deserve. In general, respondents typically disagree with this statement: the average for each group sits between “somewhat disagree” and
“neutral.” Yet, women are significantly more likely than men to report feeling as though they receive less credit than they deserve, and Hispanic respondents are marginally more likely than white respondents to report getting less credit than they deserve.
1
1.5
2
2.5
3
3.5
4
4.5
5
*** +

STEM Inclusion Study 16
Fig 10: “I have to work harder than my colleagues to be perceived as a legitimate professional.”
Predicted Probabilities by gender, race/ethnicity, LGBTQ and disability status, net of differences by sector, age, and education level. (1=strongly disagree to 5=strongly agree)
As a final measure of professional valuation, Figure 10 above reports the predicted means on a measure that asks respondents the extent to which they agree that they have to work harder than their colleagues to be perceived as a legitimate professional. As a whole, responses average between “disagree” and “neutral.”
But, as before, there is important demographic variation. Specifically, women are significantly more likely than men, Hispanic, Asian, and black respondents significantly more likely than white respondents, and LGBTQ respondents are significantly more likely than non-LGBTQ respondents to report that they have to work harder than their colleagues to be perceived as a legitimate professional in their workplace.
Summary of Patterns of Professional Devaluation Among the measures in this professional
devaluation category, we see similar trends as those reported in the measures relating to marginalization. Gender was once again the basis of the strongest pattern observed—women have more negative values than men on all measures in this category: women are less likely than men to report that their work is respected, less likely to report that their supervisor treated them with respect, less likely to report that they are held to the same standard for promotion as others, and more likely than men to report that they had to work harder than others to be viewed as a professional.
Individuals with disabilities also frequently reported instances of professional devaluation. Respondents with disabilities were significantly less likely than counterparts without
1
1.5
2
2.5
3
3.5
4
4.5
5
***
**
*
***

STEM Inclusion Study 17
disabilities to report that they are treated with respect by their supervisor, and more likely to report that they are held to a different standard than their colleagues. Again, these differences are net of variation in the sample by education level, age, and employment sector.
Lastly, a few differentials emerged by race/ethnicity. Black respondents, compared to white respondents, were less likely to report being held to the same standard as others for promotion of advancement. Black, Asian, and Hispanic respondents were also more likely than white respondents to report having to work harder than their colleagues to be perceived as a legitimate professional.
3. Patterns of workplace fairness
across sectors
In the sections above, we compared experiences of marginalization and professional devaluation across demographic categories, controlling for variation by several work factors, including employment sector. However, members of this organization work in a variety of employment sectors (e.g., universities, for-profit companies, the government); the climate for disadvantaged groups may vary considerably across these sectors. As such, this section compares indicators of chilly climates across different employment sectors. It allows us to ask, are certain employment sectors more positive for under-represented groups than others? The three figures below present the proportion of respondents in each sector who agree that women, racial/ethnic minorities, and LGBTQ persons must work harder than others to convince their colleagues of their competence.
Fig 11: Proportion of respondents by sector agreeing that “Women in my workplace must work harder than men to convince colleagues of their competence.”
Predicted Probabilities by employment sector. (proportion who agree between 0 and 1)
0.301
0.201
0.339
0.254
0
0.1
0.2
0.3
0.4
0.5
All ForProfit University OtherEmployed
**
*

STEM Inclusion Study 18
Fig 12: Proportion of respondents by sector agreeing that “Racial/ethnic minorities in my workplace must work harder than whites to convince colleagues of their competence.”
Predicted Probabilities by employment sector. (proportion who agree between 0 and 1)
Fig 13: Proportion of respondents by sector agreeing that “LGBTQ individuals in my workplace must work harder than non-LGBTQ persons to convince colleagues of their competence.”
Predicted Probabilities by employment sector. (proportion who agree between 0 and 1).
0.209
0.132
0.239
0.174
0
0.1
0.2
0.3
0.4
0.5
All ForProfit University OtherEmployed
+
**
0.066 0.0220.091
0.0430
0.1
0.2
0.3
0.4
0.5
All ForProfit University OtherEmployed
** *

STEM Inclusion Study 19
The figures above represent the proportion of respondents in each sector who agree with each statement, holding constant variation by demographics (gender, race/ethnicity, age, disability status, LGBTQ status, and education level). Asterisks indicate significant differences between university sector (the largest sector category, comprised of 4-year and 2-year institutions) and for-profit private sector or other sectors (a category that includes non-profit and governmental sectors). Significance levels determined by logistic regression models; see footnote 5 for more details (***p<.001, **p<.01, *p<.05, †p<.10, two-tailed test).
Starting with the first figure in this section, Figure 11, the leftmost column in the graph displays the proportion of respondents overall (30.1%) who report that women have to work harder than men to convince colleagues of their competence. Those in the for-profit sector, and those employed in other sectors (nonprofit or government sectors) were significantly less likely than those employed in a university context to report that women must work harder than men to convince colleagues of their competence in their workplace.
Figure 12 presents results on a question that asks whether respondents believe that people of color in their organization have to work harder than their white colleagues. Across all employment sectors, 20.9% of respondents agree that racial/ethnic minorities have to work harder than whites in their organization to be seen as competent professionals. Those in the for-profit sector were significantly less likely than those in the university sector, and those in other sectors were marginally less likely than those in a
university context to report that people of color must work harder than their white peers to convince colleagues of their competence in their workplace.
Although LGBTQ status is not always visible and able to be read off the body, as gender and race/ethnicity often are, workers still may witness differential treatment of LGBTQ colleagues in their workplaces (Cech & Rothwell 2017). Figure 13 indicates that 6.6% of respondents report that LGBTQ persons in their work environment have to work harder than their non-LGBTQ colleagues to convince others of their competence. Those employed in the for-profit sector, and those employed in other sectors (nonprofit or government sectors) are significantly less likely than those employed in the university sector to report that LGBTQ persons in their organization have to work harder than their colleagues.
Note that these figures represent all respondents (women and men, whites and people of color, LGBTQ and non-LGBTQ respondents) reporting on the climate of their employing organizations. To see how men and women report on their own experiences, see results part 1 and 2 above. Also note that these results are best understood relationally: to see which sectors have the strongest or weakest patterns of chilly climates. Estimates of bias in workplaces tend to underestimate levels of bias in organizations overall.
Figures 14-17 below present the proportion of respondents in each employment sector who report having personally witnessed people in their workplace being treated differently based on their demographic category.

STEM Inclusion Study 20
Fig 14: Proportion of respondents by sector who reported witnessing person(s) being treated differently due to gender in last three years.
Predicted Probabilities by employment sector. (proportion who agree, between 0 and 1)
Fig 15: Proportion of respondents by sector who reported witnessing person(s) being treated differently due to race/ethnicity in last three years.
Predicted Probabilities by employment sector. (proportion who agree, between 0 and 1)
0.329
0.247
0.357
0.298
0
0.1
0.2
0.3
0.4
0.5
All ForProfit University OtherEmployed
**
0.163
0.103
0.19
0.131
0
0.1
0.2
0.3
0.4
0.5
All ForProfit University OtherEmployed
*
*

STEM Inclusion Study 21
Fig 16: Proportion of respondents by sector who reported witnessing person(s) being treated differently due to LGBTQ status in last three years.
Predicted Probabilities by employment sector. (proportion who agree, between 0 and 1).
Fig 17: Proportion of respondents by sector who reported witnessing person(s) being treated differently due to disability status in last three years.
Predicted Probabilities by employment sector. (proportion who agree, between 0 and 1)
0.040.025
0.049 0.028
0
0.1
0.2
0.3
0.4
0.5
All ForProfit University OtherEmployed
0.0330.014
0.045 0.021
0
0.1
0.2
0.3
0.4
0.5
All ForProfit University OtherEmployed
†

STEM Inclusion Study 22
As with the previous set, Figures 14-17 present the proportion of respondents in each employment sector who report that they have observed women (Fig. 14), racial/ethnic minorities (Fig. 15), LGBTQ persons (Fig. 16) and persons with disabilities (Fig. 17) being treated differently in their workplace on the basis of these statuses. Significance levels indicate statistically significant differences between respondents in the average of all sectors versus individual employment sectors, as determined by logistic regression models; see footnote 5 for more details (***p<.001, **p<.01, *p<.05, †p<.10, two-tailed test).
Figure 14 depicts the frequency with which respondents reported that they observed a person or persons being treated differently in their workplace on the basis of gender in the last three years. Among all employment sectors, a third (32.9%) of respondents report witnessing instances where someone was treated differently on the basis of gender in their organization in the last three years. The statistic among those employed in higher education is particularly striking. Over 35% of respondents working in the university sector reported witnessing differential treatment by gender in the last three years. The results from those employed in the “other sector” category (including government and non-profit work) are generally similar to respondents in the university context: 29.8% of workers in other sectors report gender-based differential treatment. When compared to organization members employed in higher education, those employed in the for-profit sector report significantly better climates for women, as they are significantly less likely (at 24.7%) to report observing persons in their organization being treated differently on the basis of gender. Note that these employment sector differences are net of variation by demographic categories of respondents (gender, race/ethnicity, etc.).
The next figure (Fig. 15) presents the frequency with which respondents have observed differential treatment on the basis of race/ethnicity in their workplaces. Among respondents in all sectors, 16.3% reported observing at least one instance of race-based differential treatment in the last three years. Respondents employed in the university sector were significantly more likely to report race/ethnicity-based differential treatment in
their workplaces than respondents employed in other sectors: those employed in the for-profit sector and those employed in other sectors were significantly less likely than those employed in the university sector to report observing differential treatment on the basis of race/ethnicity in their workplaces.
Figure 16 depicts the proportion of respondents who reported observing differential treatment in their workplace on the basis of LGBTQ status. As before (possibly due to the frequent invisibility of LGBTQ status), a comparatively low proportion of respondents reported observing LGBTQ-based differential treatment. However, 4% overall reported observing an instance of this form of bias in the last three years. There were no significant difference in this outcome by sector.
Finally, Figure 17 presents the proportion of respondents who reported that they observed differential treatment on the basis of disability status. Among respondents across all employment sectors, 3.3% reported viewing an instance of disability-based differential treatment in the last 3 years. Those employed in the for-profit sector, and those employed in other sectors were marginally less likely than those employed in the university context to report observing a person being treated differently in their workplace due to disability.
As before, these results are best understood relationally—to test for patterns of chilly climates across employment sectors. People typically under-report harassment and differential treatment in their organizations, so these should be taken as conservative estimates of the actual bias occurring in these sectors. To see how different demographic groups report on their own experience of bias, see Parts 1 and 2 above. Summary of patterns
Part 3 of this report described patterns of workplace chilly climate by employment sector (university, for-profit, and other sectors). Overall, a sizeable proportion of respondents reported negative climates for women and racial/ethnic minorities in their workplaces. For example, 30% of respondents agree that women must work harder than men to convince colleagues of their competence, and 21% feel that racial/ethnic minorities should do the same. 33% of respondents witnessed differential treatment due

STEM Inclusion Study 23
to gender, and 16% of respondents saw differential treatment due to race/ethnicity in the last three years. The university sector is significantly worse on these climate measures than the for-profit sector and/or other sectors (governmental, non-profit) on most measures.
SUMMARY OF FINDINGS The results from this survey point to both
positive and negative aspects of diversity and inclusion experienced by members of this professional organization. First, personal experiences of harassment in general are relatively low, and respondents across demographic groups generally felt their work is respected by their colleagues and that their supervisors treated them with respect. Respondents on average generally did not believe their boss gives them less credit than they deserve, nor that they have to work harder than others to be given the same professional recognition. Most respondents in this organization did not report high levels of LGBTQ bias in their organizations (although it is not clear whether this is due to the lack of visibility of LGBTQ status vis a vis other demographic characteristics like gender and race/ethnicity). Lastly, the majority of respondents did not observe instances of chilly climates toward persons with disabilities. While these general trends suggest that members of this organization tend to have positive experiences in their workplaces, these patterns differed substantially across demographic category.
The survey results pointed to several concerning trends regarding the marginalization and professional devaluation of under-represented members of this organization. We find pervasive gender differences in workplace experiences: women had significantly more negative experiences on every measure in our analysis, net of variation by age, education level, employment sector, and other demographic factors. Similarly, persons with disabilities, LGBTQ respondents, and racial/ethnic minority respondents reported significantly more negative experiences than their peers across a number of different marginalization and professional devaluation measures.
Regarding marginalization, women, persons with disabilities, LGBTQ, black, Asian, and Hispanic respondents had more experiences of marginalization than men, persons without disabilities, non-LGBTQ and white respondents, respectively. Most of these patterns were echoed in the professional devaluation measures, whereby women, persons with disabilities, LGBTQ black, Asian, and Hispanic respondents more frequently reported that their competency and value was questioned in their workplace than their peers.
Finally, a notably high proportion of respondents across employment sectors reported systematic biases in their workplaces and witnessed differential treatment in their organizations in the last three years. For example, 33% of respondents reported witnessing differential treatment by gender in their organizations in the past 3 years, and over 30% of respondents believed that women have to work harder than men to be perceived as competent. Those employed in the university sector were more likely to report these chilly climates for women and racial/ethnic minorities, compared to respondents employed in for-profit, non-profit, or governmental sectors. However, there were substantial indications of bias in those non-university sectors as well. The fact that these chilly climates are present across sectors suggests that these are problems dealt with by persons across the membership of this organization, not just those employed in particular sectors.
Broadly speaking, results from this study highlight both areas that are encouraging and areas that require further consideration. These results indicate crucial considerations regarding the satisfaction and retention of talented women, racial/ethnic minorities, persons with disabilities, and LGBTQ individuals in STEM, as both workplace climate and experiences of discrimination have an impact on organization members’ satisfaction, and subsequent retention in STEM.
Suggestions for Moving Forward The results reviewed above point to three key
areas of intervention that the organization should
consider:
STEM Inclusion Study 24
1.
Women and racial/ethnic minorities report
persistently more negative work experiences
compared to white men. Feelings of
marginalization and experiences of exclusion
are significantly more common among these
respondents. The organization should consider
additional ways it can foster inclusion for women
and people of color, as well as having open dialog
about the ways that the STEM expertise of women
and people of color are undermined in members’
workplaces.
2.
LGBTQ-identifying respondents were also
more likely to experience marginalization and
exclusion. While LGBTQ identity may be less
visible, members of this organization identifying
as LGBTQ were significantly more likely than non-
LGBTQ respondents to report a chilly climate. Our
results here corroborate chilly climate issues
included in the “LGBT Climate in Physics” report
from the C-LGBT Ad Hoc Committee. These results
indicate that continued dialog and efforts
addressing anti-LGBTQ bias in this field are much
needed.
3.
Lastly, disability status was a significant factor
in a number of the marginalization and
devaluation measures. Disability status is rarely
considered and discussed within the context of
inclusion and diversity in STEM-related
professional organizations. However, over 17% of
members of this organization have some kind of
disability, whether physical or mental, and those
who do frequently report more negative
workplace experiences. The organization should
consider initiatives and programming that allow
persons with disabilities to articulate ways that
this organization could better provide support
and promote their interests.
Recommendations
Given the unique entity of the professional
organization and its reach, our recommendations
for STEM diversity and inclusion initiatives within
APS may also be applicable for APS members to
utilize within their own workplaces.
Our recommendations for the American Physical
Society include:
Regular dialog with constituencies of
disadvantaged groups (e.g., through focus
groups and panels) to identify ongoing issues
and ways the organization could provide
support through programming, networking,
and policy change.
Regular ‘climate surveys’ measuring factors
such as marginalization, inclusion, and
professional (de)valuation.
Recommend dual/multi membership and
other partnerships with minority-centered
STEM professional organizations.
Partner with companies and organizations
that offer employment opportunities for
physics teachers of minority status.
Provide and enhance programming at APS
conferences regarding disability etiquette,
hidden illnesses, work habits, and
accommodations testing.
Ensure that the diversity represented in the
organization is reflected in the choice of
keynote and plenary speakers at regional and
national conferences.
Share the events and materials of minority
and women centered STEM professional
organizations.
Spotlight individuals in physics (e.g., a
website feature) who are addressing issues of
marginalization and exclusion within the
field.
Ensure all organization websites and emails
are fully ADA compliant and compatible with
accessibility plug-ins.
Video-record and close-caption significant
keynote addresses at APS conferences and

STEM Inclusion Study 25
make them available online for those who are
unable to attend.
Expand the Diversity section of the APS
website.
o Consider adding information, Q&As, and
resources regarding disability etiquette,
gender identity etiquette, and so forth,
accessible to all who visit the APS
website.
o Consider featuring articles, stories, and
interviews regarding the
underrepresentation of women and
people of color in mathematics and STEM
as a whole.
o Consider adding a retention and
recruitment section on the website listing
advice and current research on
supporting women and people of color in
STEM education (geared toward those in
academia teaching minority students).
Develop a diversity, equity, and inclusion
(DEI) ‘seed fund’ for APS members to
establish DEI initiatives in their workplace.
Create a diversity & inclusion specialist role
(different from a Human Resources
Generalist role) in the organization to
provide support and further
recommendations for ongoing diversity and
inclusion efforts.
Collaborate with a diversity-centered
consulting firm to receive further
recommendations, learn hiring practices to
combat inequity, and create other methods of
increasing membership diversity.
Note that the findings here are reported along
single axes of inequality, and cannot reveal all
patterns of marginalization that may pertain to
groups experiencing multiple forms of
marginalization simultaneously. Further work in
the STEM Inclusion Study that aggregates survey
responses from multiple professional
associations will provide further analysis on
these intersections.
This organization’s participation in the STEM
Inclusion Study is an important signal of its
willingness to consider and confront diversity and
inclusion issues among its membership. Inequality
in STEM is an intractable problem that has no
silver bullet solution. It will take deliberate and
sustained effort to help move the needle in this
and other STEM-related professional
organizations.

STEM Inclusion Study 26
METHODOLOGICAL APPENDIX
Inclusion and Marginalization Questions
(a) Insensitive Comments
I have read, heard and/or seen insensitive comments in my workplace that I found offensive. (mean = 2.23)
(b) I Fit In Overall, I feel I ‘fit in’ with the other people in my workplace. (mean = 3.96)
(c) Noticeable Mistakes
I worry that my mistakes are more noticeable than the mistakes of others. (mean = 2.71)
(d) Chilly Climate How often does the following happen at work: (1) A co-worker makes a negative comment or joke about women, (2) A co-worker makes a negative comment or joke about racial/ethnic minorities, (3) A co-worker makes a negative comment or joke about LGBTQ people, (4) A co-worker makes a negative comment or joke about people with disabilities. (mean = 1.35)
(e) Harassed In the last 12 months, I was harassed verbally or in writing on the job. (mean = 1.14)
Professional (De)valuation Questions
(a) Same Standard I am held to the same standard as others for promotion or advancement. (mean = 3.93)
(b) Less Credit My boss gives me less credit than I deserve. (mean = 2.27)
(c) Work Harder I have to work harder than my colleagues to be perceived as a legitimate professional. (mean = 2.43)
(d) Supervisor Respect
My supervisor treats me with respect. (mean = 4.29)
(e) Respect Work In my workplace, my work is respected. (mean = 4.25)
Workplace Fairness Questions
(a) Women Work Harder
Generally speaking, women in my workplace must work harder than men to convince colleagues of their competence. (mean = .306)
(b) LGBTQ Work Harder
Generally speaking, LGBTQ individuals in my workplace must work harder than non-LGBTQ individuals to convince colleagues of their competence. (mean = .078)
(c) REM Work Harder
Generally speaking, racial/ethnic minority individuals in my workplace must work harder than non-minority individuals to convince colleagues of their competence. (mean = .219)
(d) Harassed Race Overall, in the last 3 years, have you ever observed a person or persons being treated differently in your workplace due to any of the following characteristics? Race or ethnicity. (mean = .179)
(e) Harassed Gender
Overall, in the last 3 years, have you ever observed a person or persons being treated differently in your workplace due to any of the following characteristics? Gender. (mean = .335)
(f) Harassed LGBTQ
Overall, in the last 3 years, have you ever observed a person or persons being treated differently in your workplace due to any of the following characteristics? Sexual Identity. (mean = .049)
(g) Harassed Disability
Overall, in the last 3 years, have you ever observed a person or persons being treated differently in your workplace due to any of the following characteristics? Disability. (mean = .042)
In the “Inclusion and Marginalization” questions, the variables InsensitiveComments, Harassed, and ChillyClimate were all coded on a 1-3 scale, with 1=Never, 2=At least once in the past year, and 3= At least once a month or more.
STEM Inclusion Study 27
Works Cited
1. Archer, Louise, Jennifer DeWitt, Jonathan Osborne, Justin Dillon, Beatrice Willis and Billy Wong. 2013.
“‘Not girly, not sexy, not glamorous’: primary school girls’ and parents’ constructions of science aspirations." Pedagogy, Culture & Society 21(1):171-194.
2. Bell, Amy E., Steven J. Spencer, Emma Iserman, and Christine ER Logel. 2003. "Stereotype threat and
women's performance in engineering." Journal of Engineering Education 92(4): 307-312. 3. Bilimoria, Diana and A. J. Stewart, ““Don’t Ask, Don’t Tell”: The academic climate for lesbian, gay,
bisexual, and transgender faculty in science and engineering,” NWSA Journal, vol. 21, pp. 85-103, 2009.
4. Buccheria, Grazia, Nadja Abt Gürber and Christian Brühwiler. 2011. “The Impact of Gender on Interest
in Science Topics and the Choice of Scientific and Technical Vocations." International Journal of Science Education 33(1):159-178.
5. Cech, Erin. 2013. “The Veiling of Queerness: Depoliticization and the experiences of LGBT engineers:
presented at the ASEE Annual Conference and Expositions, Atlanta. 6. Cech, Erin A. and Michelle V. Pham. 2017. “Queer in STEM Organizations: Workplace Disadvantages
for LGBT Employees in STEM Related Federal Agencies.” Social Sciences. 6(1):1-12. 7. Cech, Erin, Brian Rubineau, Susan Silbey, and Carroll Seron. 2011. “Professional Role Confidence and
Gendered Persistence in Engineering.” American Sociological Review 76(5): 641-66. 8. Cech, Erin and William R. Rothwell. Federally Unequal: Intersectional Contours and Organizational
Contexts of LGBT Work Experience Inequalities among Federal Employees. Work in Progress. University of Michigan, Ann Arbor.
9. Chang, Mitchell J., Oscar Cerna, June Han, and Victor Saenz. 2008. "The contradictory roles of
institutional status in retaining underrepresented minorities in biomedical and behavioral science majors." The Review of Higher Education 31(4): 433-464.
10. Cheryan, Sapna, John Oliver Siy, Marissa Vichayapai, Benjamin J. Drury and Saenam Kim. 2011. “Do
Female and Male Role Models Who Embody STEM Stereotypes Hinder Women’s Anticipated Success in STEM?” Social Psychological and Personality Science 2(6):656-664.
11. Crenshaw, Kimberle. 1991. "Mapping the Margins: Intersectionality, Identity Politics, and Violence
against Women of Color." Stanford Law Review 43(6):1241-99. 12. Dryburgh, Heather. 1999. Work Hard, Play Hard: Women and Professionalization in Engineering-
Adapting to the Culture. Gender and Society 13(5): 664-682. 13. Eglash, Ron. 2002. “Race, Sex, and Nerds: From Black Geeks to Asian American Hipsters.” Social Text
20(2): 49-64. 14. Frehill, L.M. 2012. “Gender and Career Outcomes of U.S. Engineers.” International Journal of Gender,
Science and Technology 4(2). http://genderandset.open.ac.uk/index.php/genderandset/article/view/199.

STEM Inclusion Study 28
15. Gunckel, K. L. 2009. “Queering Science for All: Probing Queer Theory in science education,” JCT (Online) 25: 62-75.
16. Herring, Cedric. 2009. “Does diversity pay? : Race, gender, and the business case for diversity,”
American Sociological Review 74:208-224. 17. Hughes, Roxanne. 2012. “Gender Conception and the Chilly Road to Female Undergraduates’
Persistence in Science and Engineering Fields.” Journal of Women and Minorities in Science and Engineering 18(3): 215-234.
18. Iskander. E. Tiffany, Paul A. Gore Jr., Cynthia Furse and Amy Bergerson. 2013. "Gender Differences in
Expressed Interests in Engineering-Related Fields ACT 30-Year Data Analysis Identified Trends and Suggested Avenues to Reverse Trends." Journal of Career Assessment 21(4):599-613.
19. Knorr-Cetina, K. (1995). Laboratory studies: The cultural approach to the study of science. In S.
Jasanoff, G.E. Markle, J.C. Petersen and T. Pinch (Eds.), Handbook of science and technology studies (pp. 140-166). Thousand Oaks: Sage Publications.
20. Koul, Ravinder, Thanita Lerdpornkulrat and Soontornpathai Chantara. 2011. “Relationship Between
Career Aspirations and Measures of Motivation Toward Biology and Mathematics, and the Influence of Gender.” Journal of Science Education 20(5): 761-770.
21. Laschinger, Heather K. Spence, Joan E. Finegan, Judith Shamian, and Piotr Wilk. 2004. "A longitudinal
analysis of the impact of workplace empowerment on work satisfaction." Journal of Organizational Behavior 25(4): 527-545.
22. Moody, JoAnn. 2004. Faculty diversity: Problems and solutions. Routledge. 23. Moss-Racusin, Corinne A., John F. Dovidio, Victoria L. Brescoll, Mark J. Graham and Jo Handelsman.
2012. “Science faculty's subtle gender biases favor male students.” Proceedings of the National Academy of Sciences of the United States of America 109(41):16474-16479.
24. Nelson, Donna J., and Christopher N. Brammer. 2010. A national analysis of diversity in science and
engineering faculties at research universities. Diversity in Science Association. 25. Patridge, E. V., R. n. S. Barthelemy, and S. R. Rankin, “Factors impacting the academic climate for
LGBQ STEM faculty,” Journal of Women and Minorities in Science and Engineering, vol. 20, 2014. 26. Ponjuan, Luis, Valerie Martin Conley, and Cathy Trower. 2011. "Career stage differences in pre-
tenure track faculty perceptions of professional and personal relationships with colleagues." The Journal of Higher Education 82(3): 319-346.
27. Rankin, S., G. Weber, W. Blumenfeld, and S. Frazer, “2010 State of higher education for lesbian, gay,
bisexual and transgender people,” ed: Campus pride, 2010. 28. Robinson, G. J., and J. S. Mcllwee. 1991. Men, women, and the culture of engineering. The
Sociological Quarterly 32(3): 403-21. 29. Sallee, Margaret W. 2011. “Performing Masculinity: Considering Gender in Doctoral Student
Socialization.” The Journal of Higher Education 82(2):187-216.

STEM Inclusion Study 29
30. Seron, Carroll, Susan Silbey, Cech, Erin, and Brian Rubineau, 2016. Persistence Is Cultural: Professional Socialization and the Reproduction of Sex Segregation. Work and Occupations 43(2):178
31. Severiens, Sabine and Geert ten Dam. 2012. “Leaving College: A Gender Comparison in Male and
Female-Dominated Programs.” Research in Higher Education 53(4):453-470. 32. Siebers, Tobin. 2008. "Disability theory." 33. Slaton, Amy E. 2013. "Body? What body? Considering ability and disability in STEM disciplines." age 23: 1. 34. Smeding, Annique. 2012. “Women in Science, Technology, Engineering, and Mathematics (STEM): An
Investigation of Their Implicit Gender Stereotypes and Stereotypes’ Connectedness to Math Performance.” Sex Roles 67(11):617-629.
35. Trower, C. A. Oct.2008. "Competing on culture: Academia’s new strategic imperative." Unpublished
presentation, (http://www. advance. iastate. edu/conference/conferencepdf/2008_10-11trower_hoc. pdf).
36. Turner, Caroline Sotello Viernes. 2002. Diversifying the faculty: A guidebook for search committees.
Association of American Colleges and Universities, 1818 R Street, NW, Washington, DC 20009. 37. Waldo, Craig R. 1999. "Working in a majority context: A structural model of heterosexism as
minority stress in the workplace." Journal of Counseling Psychology 46(2): 218. 38. Zambrana, Ruth Enid, Rashawn Ray, Michelle M. Espino, Corinne Castro, Beth Douthirt Cohen, and
Jennifer Eliason. 2015. "“Don’t Leave Us Behind” The Importance of Mentoring for Underrepresented Minority Faculty." American Educational Research Journal 52(1): 40-72.