oral health environmental scan - final report · web viewtitle oral health environmental scan -...
TRANSCRIPT
ORAL HEALTHENVIRONMENTAL SCAN
FINAL REPORT

<<!-- PICOTITLE="Oral Health Environmental Scan – Final Report" --> <!-- PICODATESET mmddyyyy=08042006 --> Prepared for the Funding Collaborative of the Oral Health Environmental Scan:
Delta Dental of Colorado FoundationColorado Department of Public Health
and Environment The Colorado TrustRose Community FoundationColorado Community Health NetworkHealthONE Alliance
Prepared by:The Colorado Health Institute1576 Sherman St., Suite 300Denver, CO 80203
September 26, 2005
ORAL HEALTHENVIRONMENTAL SCAN
FINAL REPORT
Prepared for the Funding Collaborative of the Oral Health Environmental Scan:
Delta Dental of Colorado FoundationColorado Department of Public Health
and Environment The Colorado TrustRose Community FoundationColorado Community Health NetworkHealthONE Alliance
Prepared by:The Colorado Health Institute1576 Sherman St., Suite 300Denver, CO 80203
September 26, 2005

ACKNOWLEDGMENTSThe Colorado Health Institute (CHI) wishes to thank the collaborative that funded this oral health environmental scan. On May 17, 2005, CHI entered into a contract with Delta Dental of Colorado Foundation on behalf of Delta Dental of Colorado Foundation, the Colorado Department of Public Health and Environment, The Colorado Trust, Rose Community Foundation, the Colorado Community Health Network and HealthONE Alliance. CHI greatly appreciates their financial support and guidance in shaping the framework of this report.
CHI staff also is grateful to the 16 individuals who served as members of the Project Advisory Panel (see Appendix A). Their participation in meetings, advice and feedback were invaluable.
The CHI team that researched, analyzed data, created maps and wrote this report included: Reid T. Reynolds, PhD, director for policy and research and project manager: Amy Downs, MPP, senior research analyst; Jeff Bontrager, MSPH, research analyst; Carol Reagan, research associate; and Valerie Orlando, intern. Pamela Hanes, PhD, president and CEO; Sherry Freeland Walker, communications director; and Kindle Fahlenkamp-Morell provided editorial guidance and support.
Table of contentsExecutive summary........................................................................1
I. Introduction...............................................................................3
II. The prevalence of dental disease and availability of dental insurance......................................................................................6
The prevalence of dental disease in children................................................6
Conclusions, policy considerations and options..........................................16
The prevalence of dental disease in adults.................................................18
Conclusions, policy considerations and options: Surveillance.....................26
Dental visits................................................................................................26
Conclusions, policy considerations and options: Dental access..................28
Conclusions, policy considerations and options: Oral and general health...30
Conclusions, policy considerations and options: Dental insurance.............35
III. Colorado oral health initiatives, programs and dental safety net clinics.........................................................................................36
Private initiatives: from Anthem to Caring for Colorado..............................36
Public initiatives and programs...................................................................39
The Medicaid dental benefit........................................................................45
Expenditures for Medicaid dental services .................................................47
Per-capita costs...........................................................................................49
Initiatives in other states to increase Medicaid access and utilization........57
Oral Health Program (OHP): Colorado Department of Public Health and Environment (CDPHE).................................................................................60
The Dental Safety Net.................................................................................66
Other Colorado Initiatives...........................................................................69
IV. Evidence-based dentistry and oral health best practices...........71
Best Practice #1: Public water system fluoridation.....................................72
Best Practice #2: School-based interventions.............................................74
Best practice #3: Fluoride Varnish..............................................................76
Best Practice #4: Dental interventions for pregnant women......................76
Best Practice #5: Mobile clinics..................................................................77
Best Practice #6: Non-dental providers......................................................79
Best Practice # 7: Xylitol gum.....................................................................80
V. Promising initiatives from other states.....................................82
Washington State: ABCD Program..............................................................82
North Carolina: Into the Mouths of Babes...................................................82
Minnesota: Apple Tree Dental.....................................................................82
South Carolina: Increasing Medicaid dental rates.......................................83
Ohio: School Sealant Program.....................................................................84
Appendices
A. Methods.....................................................................................................A1...........................................................................................................................
B. Colorado initiatives, programs and dental safety net provider network... .B1
C. Oral health best practices – interventions and evidence...........................C1
D. Other state initiatives................................................................................D1
E. Maps...........................................................................................................E1
Colorado Health Institute
Executive summaryThe oral health status of Coloradans has discernibly improved in recent years. Whether this is true for the vulnerable populations of the state is less clear. The visibility of oral health as a public health concern, however, has been clearly elevated in the public’s consciousness as a result of a variety of public and private funding and programmatic initiatives, particularly apparent since the late 1990s.
The Colorado Health Institute (CHI) was commissioned by a consortium of funders to conduct an environmental scan of the state of oral health, oral health initiatives and oral health policy in Colorado. This is a report of our findings.
CHI reviewed and analyzed a range of secondary data sources and found that:
Colorado is one of only a dozen states participating in the National Oral Health Surveillance System, and, in spite of this participation, timely and routine epidemiological data on the oral health status of Coloradans are still relatively limited.
CHI inventoried a comprehensive array of oral health initiatives, programs and dental safety net dental clinics and providers and found:
An impressive commitment of funding for oral health programs, particularly for low-income and underserved children, by many of Colorado’s health care foundations.
Publicly funded dental programs that have significantly expanded dental coverage for children through the Medicaid program and the dental benefit added to the CHP+ program in 2002.
A range of policy and program development activities that have been undertaken by community collaboratives and public-private partnerships, including the Colorado Commission on Children’s Dental Health in 2000, Oral Health Awareness Colorado!, which led to the development of a State Oral Health Plan released in August 2005, and others too numerous to mention here.
1
Colorado Health Institute
A sizeable group (43) of dental safety net clinics that is serving a growing number of low-income children, families and individuals in 26 counties around the state.
CHI reviewed evidence from professional journals and studies from other states, and sought counsel from dental practice experts in Colorado and elsewhere to identify tested best oral health practices. We found:
A broad consensus with regard to the efficacy and effectiveness of several prevention-oriented dental interventions and programs. The practices have a growing body of evidence to support their broad dissemination into clinical practice and school-based settings, and yet many Coloradans who could benefit do not currently have access to these programs.
Innovative programs in other states that are producing promising oral health outcomes, many of which could improve the oral health of Coloradans if implemented in the state.
CHI was also asked to highlight policy considerations and identify possible policy and program options that public and private policymakers could pursue in true public-private partnership. To summarize the thrust of these considerations and options (which are strategically located throughout the report), we have outlined the four broad categories of interventions that derive from the environmental scan.
With serious levels of untreated disease and untapped opportunities for expanding preventive programs, additional resources could be targeted to areas and populations in greatest need of dental care. This report identifies many prevention-oriented interventions and treatment services that reflect best practices. An enhanced focus on the systematic evaluation of existing initiatives, leading to strategic planning decisions for resource allocation that optimize evidence-based public and private investments, is needed.
Colorado is not alone among states seeking new strategies for reducing the prevalence of dental disease among vulnerable populations. The state could explore innovations proven to be effective in other states.
2
Colorado Health Institute
Improvements can be made in the area of performance monitoring and disease surveillance about the oral health status of children and other vulnerable populations in Colorado. Improvements in these areas could enhance the state’s ability to target resources more precisely to identified pockets of greatest dental health need.
With some notable exceptions, Colorado funders and program developers may be under-investing in the evaluation of promising dental health practices under way in the state.
Finally, in recognition of the voluminous and technical nature of this report, CHI staff has proposed a dissemination plan to make available one or more publications, including a white paper and policy brief for dissemination to a broader audience. Further, it intends to work with the funding collaborative to disseminate study findings to policymakers in alternative venues such as roundtable discussions and targeted presentations as appropriate.
I. IntroductionAs a result of improvements in diet, self-care, fluoridation of public water systems and broadening access to dental care, the oral health of Americans is better than ever before.1 Nevertheless, dental disease still plagues large numbers of Americans, especially those with low incomes and limited access to dental care. The 2000 Surgeon General’s report, Oral Health in America,2 represented a landmark study in furthering the public’s awareness of disparities in the prevalence of dental disease and highlighting that the most prevalent dental diseases – caries and periodontal disease – are fully preventable. The Surgeon General’s report also firmly established the integral relationship between oral and general health.
In Colorado, public agencies and private foundations in the late 1990s began focusing increased attention on the disproportionate prevalence of dental disease among low-income children. In 2000, the Colorado Commission on Children’s Dental Health3 released a series of recommendations on ways to
1 U.S. Department of Health and Human Services (DHHS). 2000. Oral Health in America: A Report of the Surgeon General. Rockville, MD: DHHS, National Institute of Dental and Craniofacial Research, National Institutes of Health.2 DHHS. 2000. Oral Health in America: A Report of the Surgeon General. 3 The Colorado Commission on Children’s Dental Health was a collaborative effort of policymakers and providers charged with studying improvements to children’s oral health and making recommendations for improvement.
3
Colorado Health Institute
improve the current system of oral health for Colorado’s children.4 Since the release of this report, there have been an impressive number of public and private initiatives implemented to improve the dental health of Colorado’s children.
In spring 2005, several organizations, spearheaded by Delta Dental of Colorado Foundation, asked the Colorado Health Institute (CHI) to undertake an oral health environmental scan to systematically survey the policy landscape and the conditions and activities that are affecting the availability, accessibility and quality of dental health care in Colorado. In particular, the organizations were interested in learning what has happened in the state with oral health since the commission.
The time period covered by the scan includes 2000 to 2005. The year 2000 was chosen as the start point because a number of notable events occurred in that year, most importantly the release of the Surgeon General’s report and a companion report released by the Colorado Commission on Children’s Dental Health. CHI also identified a number of salient activities related to dental health in the late 1990s and therefore has included select information during this period to include in this report.
4 Colorado Commission on Children’s Dental Health. 2000. Addressing the Crisis of Oral Health Access for Colorado’s Children.
4

Colorado Health Institute
The principal objectives of the scan were to:
Summarize information on the prevalence of dental disease, especially among vulnerable populations in Colorado;
Inventory oral health initiatives and ongoing programs, and identify dental safety net providers serving vulnerable populations in Colorado;
Identify evidence-based dentistry and oral health best practices (EBD/OHBP) that have proven to be effective at preventing and treating dental disease;
Determine the extent to which EBD/OHBP have been incorporated into initiatives and programs and used by dental safety net providers in Colorado;
Identify promising dental health practices in other states; and
Identify policy options for consideration by public and private policymakers in Colorado.
The CHI team employed a variety of methods in conducting the scan, including:
1. Conducting an extensive literature review;
2. Interviewing 40 key informants;
3. Convening a Project Advisory Panel of 16 experts, funders and advocates who participated in three meetings during the course of the project;
4. Inventorying a broad range of public and private initiatives, programs and safety net dental providers; and
5. Analyzing secondary data sources such as the Behavioral Risk Factor Surveillance Survey sponsored each year by the U.S. Centers for Disease Control and Prevention.
The final report consists of five sections:
1. Introduction
2. The prevalence of dental disease and dental insurance
3. Recent oral health initiatives in Colorado
4. Evidence-based dentistry and oral health best practices5
Colorado Health Institute
5. Promising initiatives from other states.
In addition, it includes five appendices:
A. Study methods
B. Colorado initiatives, programs and an inventory of Colorado’s dental safety net provider network
C. EBD/OHBP fact sheets
D. Other state oral health initiatives
E. Maps.
As defined in the Surgeon General’s report, “oral health” encompasses a wide range of craniofacial conditions, including oral cancers, cleft lip and cleft palate in addition to dental disease. This study focuses more narrowly on dental disease, its prevalence among vulnerable populations and current efforts to reduce its prevalence among vulnerable populations. For this study, vulnerable populations refer to those segments of the general population that lack access to dental care or that rely solely on publicly funded programs such as Medicaid and Child Health Plan Plus (CHP+), Colorado’s version of the State Child Heath Insurance Program (SCHIP). While vulnerable groups include low-income children and adults, the scan focuses primarily on dental care access and practices available to Colorado’s children. Whenever possible, we include data about the prevalence of dental disease among adults and describe a number of initiatives and providers that treat low-income adults. Unfortunately, there is a dearth of data about the dental health status of low-income adults, and limited resources exist to meet their dental health care needs.
6
Colorado Health Institute
II. The prevalence of dental disease and availability of dental insuranceThe practice of dentistry is primarily concerned with the treatment of three disease types. Two of these are infections caused by micro-organisms; the third is developmental.
Dental decay is an infectious disease in which bacteria in the mouth process simple sugars into acid, which erodes the enamel structure and causes tooth decay (cavities). The term “dental decay” is used for both the disease process and the disease by-product.
Tooth decay is caused by specific bacteria named Streptococcus mutans and is accelerated by:
The quantity of bacteria in a sticky substance called plaque which adheres to teeth and is only partially removed by toothbrushing and flossing;
The consumption of simple sugars which serve as fuel for the bacteria in their acid production;
The length of time that bacteria actively produce acid and remain in contact with the tooth; and
The relative hardness of the tooth structure.
Periodontal disease (pyorrhea or gum disease) is a destructive infectious disease affecting the gums and bone surrounding the teeth. If this interface becomes infected, an otherwise healthy tooth can be lost. Like dental decay, periodontal disease is a multi-faceted disease process that is influenced by type and amount of bacteria in the mouth, smoking and overall health status.
Occlusal conditions are developmental and affect the jaw relationship and alignment of teeth. These problems can significantly complicate the other two disease processes, as well as cause difficulty with eating and speaking. They are commonly treated with orthodontic interventions and, in severe cases, with jaw or joint surgery. Occlusal conditions, oral cancer, cleft palate and cleft lip are all included in the broad definition of “oral health” but excluded from this study.
7
Colorado Health Institute
THE PREVALENCE OF DENTAL DISEASE IN CHILDRENMuch of the focus of research efforts and policy discussions regarding dental disease relates to the oral health of children. Because childhood is the developmental stage during which both primary and permanent teeth are formed, childhood oral health has both immediate and long-term consequences. The importance of focusing on childhood dental disease is twofold: It involves a critical period during which preventive dental care reaps the greatest effect before dental disease affects primary and permanent teeth, and it increases the probability of improving overall health and well-being of adults over their lifespan.
National Health and Nutrition Examination Survey (NHANES)Ideally, the oral health of a population should be assessed at regular intervals by collecting data from a full in-mouth assessment of a representative sample of individuals. The Centers for Disease Control and Prevention’s (CDC) National Health and Nutrition Examination Survey (NHANES) is a model for this method of data collection. The National Center for Health Statistics has conducted some variant of NHANES since 1960; it currently collects these data in two-year cycles.
NHANES recruits and interviews a representative sample of adults and children from approximately 80 counties around the United States. Either at home or in a mobile clinic, survey participants undergo a thorough interview with a standardized questionnaire regarding health and nutrition practices and a physical examination that includes a dental examination. The data are weighted to allow for national population estimates, although state- and substate-level estimates are not possible due to small sample size. The NHANES oral health portion recently changed from a comprehensive dental examination by a dentist of participants age 2 years and older to a simplified oral screening of participants 5 years and older.5
The August 26, 2005, edition of Morbidity and Mortality Weekly Report (MMWR) focused on oral health trends at two periods using merged NHANES data: 1988-94 and 1999-2002. From its analysis, CDC highlighted three significant trends in the oral health status of children in the United States:
There was no significant difference in the prevalence of dental caries in primary teeth among children ages 2-11 years between the two time periods.
5 Personal communication with Kathy Brannan, National Center for Health Statistics. September 16, 2005.
8
Colorado Health Institute
There was a decrease in the prevalence of dental caries in the permanent teeth of children ages 6 years and higher.6
There was an increase in the presence of dental sealants among children and adolescents between 6-19 years of age.7
In addition, CDC found that the presence of mild or greater fluorosis among children and adolescents ages 6-19 years increased from 23 percent in 1986-87 to 32 percent in 1999-2002.8 Fluorosis was more severe among non-Hispanic African American children than among non-Hispanic white or Mexican-American children, although there is no clear explanation for this disparity.
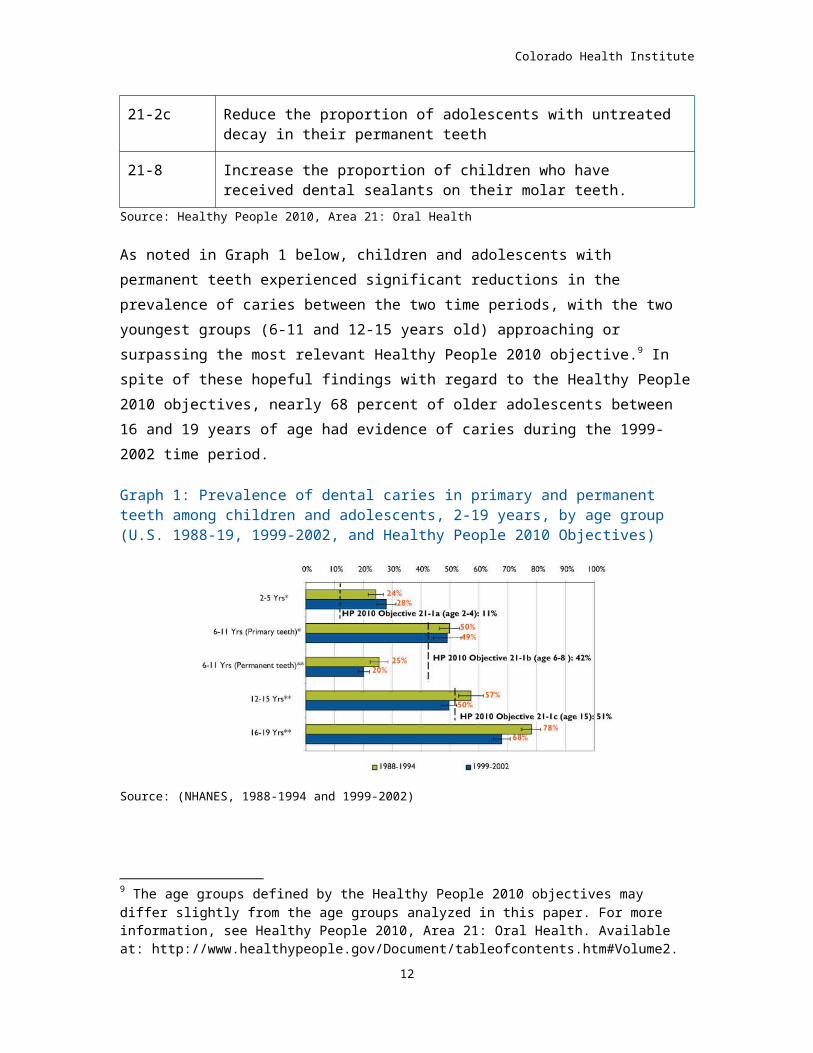
Graph 1 displays the percent of children who had evidence of dental caries (either treated or untreated) at the time of the NHANES dental examination. The five age classifications displayed include groups of children at various stages of tooth development. The Healthy People (HP) 2010 objectives for prevalence of caries (“caries experience”) by age group also are noted in Graph 1. Table 1displays the Healthy People 2010 objectives related to dental health.
Table 1: Healthy People 2010 dental objectives for children and adolescents
Objective Number
Objective
21-1a Reduce the proportion of young children with dental caries experience in their primary teeth.
21-1b Reduce the proportion of children with dental caries experience in their primary and permanent teeth.
21-1c Reduce the proportion of adolescents with dental caries
6 A similar trend was observed among dentate adults at least 20 years and older.7 Beltran-Aquilar, E.D., et al. August 26, 2005. “Surveillance for Dental Caries, Dental Sealants, Tooth Retention, Edentulism and Enamel Fluorosis -- United States 1988-1994 and 1999-2002.” Morbidity and Mortality Weekly Report 54(SS-3). 8 Fluorosis is an under-mineralization of tooth enamel resulting from excessive fluoride consumption that causes a greater porosity, or mottling, of the teeth. The CDC acknowledged methodological challenges in comparing the two time periods of data on fluorosis, and assessing the amount of fluoride exposure and the time lapse between exposure and clinical presentation. These findings may not reflect new fluoride supplementation schedules or CDC recommendations on fluoride toothpaste use by children under 6 years old (key informant interview and Beltran-Aquilar, 2005).
9
Colorado Health Institute
experience in their permanent teeth.
21-2a Reduce the proportion of young children with untreated dental decay in their primary teeth.
21-2b Reduce the proportion of children with untreated dental decay in primary and permanent teeth.
21-2c Reduce the proportion of adolescents with untreated decay in their permanent teeth
21-8 Increase the proportion of children who have received dental sealants on their molar teeth.
Source: Healthy People 2010, Area 21: Oral Health
As noted in Graph 1 below, children and adolescents with permanent teeth experienced significant reductions in the prevalence of caries between the two time periods, with the two youngest groups (6-11 and 12-15 years old) approaching or surpassing the most relevant Healthy People 2010 objective.9 In spite of these hopeful findings with regard to the Healthy People 2010 objectives, nearly 68 percent of older adolescents between 16 and 19 years of age had evidence of caries during the 1999-2002 time period.
Graph 1: Prevalence of dental caries in primary and permanent teeth among children and adolescents, 2-19 years, by age group (U.S. 1988-19, 1999-2002, and Healthy People 2010 Objectives)
Source: (NHANES, 1988-1994 and 1999-2002)
9 The age groups defined by the Healthy People 2010 objectives may differ slightly from the age groups analyzed in this paper. For more information, see Healthy People 2010, Area 21: Oral Health. Available at: http://www.healthypeople.gov/Document/tableofcontents.htm#Volume2.
10
Colorado Health Institute
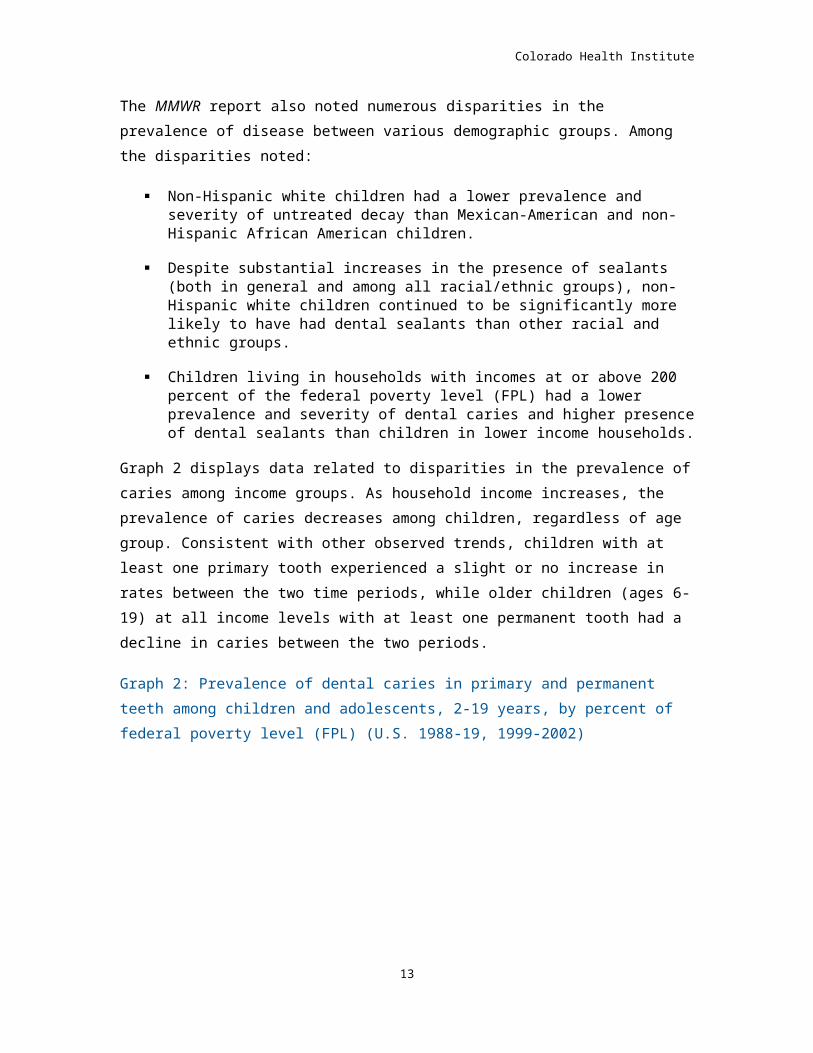
The MMWR report also noted numerous disparities in the prevalence of disease between various demographic groups. Among the disparities noted:
Non-Hispanic white children had a lower prevalence and severity of untreated decay than Mexican-American and non-Hispanic African American children.
Despite substantial increases in the presence of sealants (both in general and among all racial/ethnic groups), non-Hispanic white children continued to be significantly more likely to have had dental sealants than other racial and ethnic groups.
Children living in households with incomes at or above 200 percent of the federal poverty level (FPL) had a lower prevalence and severity of dental caries and higher presence of dental sealants than children in lower income households.
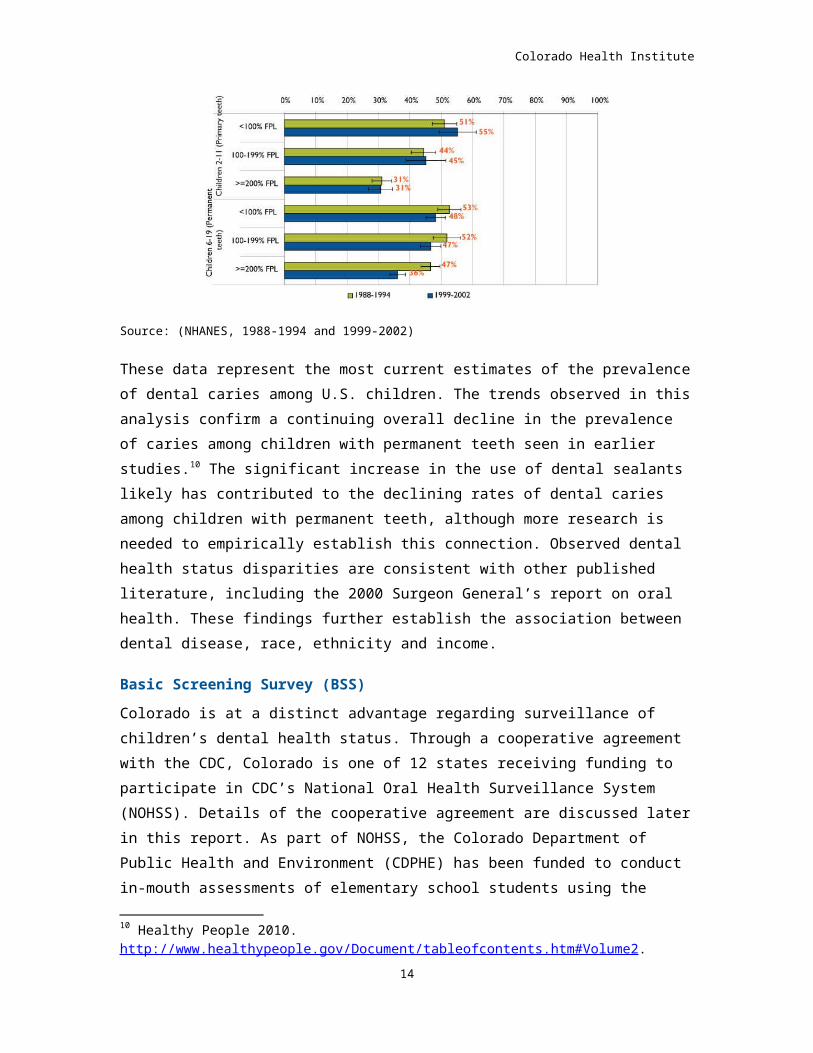
Graph 2 displays data related to disparities in the prevalence of caries among income groups. As household income increases, the prevalence of caries decreases among children, regardless of age group. Consistent with other observed trends, children with at least one primary tooth experienced a slight or no increase in rates between the two time periods, while older children (ages 6-19) at all income levels with at least one permanent tooth had a decline in caries between the two periods.
Graph 2: Prevalence of dental caries in primary and permanent teeth among children and adolescents, 2-19 years, by percent of federal poverty level (FPL) (U.S. 1988-19, 1999-2002)
Source: (NHANES, 1988-1994 and 1999-2002)
These data represent the most current estimates of the prevalence of dental caries among U.S. children. The trends observed in this analysis confirm a
11
Colorado Health Institute
continuing overall decline in the prevalence of caries among children with permanent teeth seen in earlier studies.10 The significant increase in the use of dental sealants likely has contributed to the declining rates of dental caries among children with permanent teeth, although more research is needed to empirically establish this connection. Observed dental health status disparities are consistent with other published literature, including the 2000 Surgeon General’s report on oral health. These findings further establish the association between dental disease, race, ethnicity and income.
Basic Screening Survey (BSS)Colorado is at a distinct advantage regarding surveillance of children’s dental health status. Through a cooperative agreement with the CDC, Colorado is one of 12 states receiving funding to participate in CDC’s National Oral Health Surveillance System (NOHSS). Details of the cooperative agreement are discussed later in this report. As part of NOHSS, the Colorado Department of Public Health and Environment (CDPHE) has been funded to conduct in-mouth assessments of elementary school students using the Basic Screening Survey (BSS). To date, the BSS has been conducted twice: once during the 2001-02 school year and again during the 2003-04 school year. Although the survey does not include a full mouth dental examination, it is currently the best source for assessing the prevalence of caries, untreated decay and presence of dental sealants among Colorado’s children.
Although the BSS may be used with any age group, Colorado uses it to screen students enrolled in the Early Start/Head Start program, kindergarten and the 3rd grade. Currently, no system exists statewide to screen or collect data on the oral health status of older children or adolescents, although some counties and school districts conduct their own screening and referral programs. For example, the Boulder Valley School District uses Medicaid funds to operate a dental screening program within selected schools. In 2005, Boulder Valley screened and provided referrals to approximately 1,100 students in elementary schools with high proportions of students eligible for free or reduced-price meals.11
The 2001-02 BSS was conducted using a convenience sample of elementary schools selected to include both rural and urban schools and balanced for geographic distribution. The 2003-04 school year was the first time a probability sample of elementary schools drawn from schools around the 10 Healthy People 2010. http://www.healthypeople.gov/Document/tableofcontents.htm#Volume2.11 CHI key informant interview, August 29, 2005.
12
Colorado Health Institute
state was conducted. Data were collected on more than 2,000 3rd graders statewide at each of the two time points; comparable kindergarten data were not available for the 2001-02 survey. Estimates of the prevalence of caries, untreated decay and presence of dental sealants are presented in Graphs 3-5.12
Three cautionary notes are suggested when interpreting these data. First, the results provide only rough estimates (particularly for 2001-02) of the prevalence of disease in Colorado’s children. Second, because the samples were selected using different methods, findings for the two time points are not directly comparable. Third, the 2003-04 results are adjusted for differences in the number of children who did not participate in the BSS within each of the sampled schools, whereas the 2001-02 results are not. 13
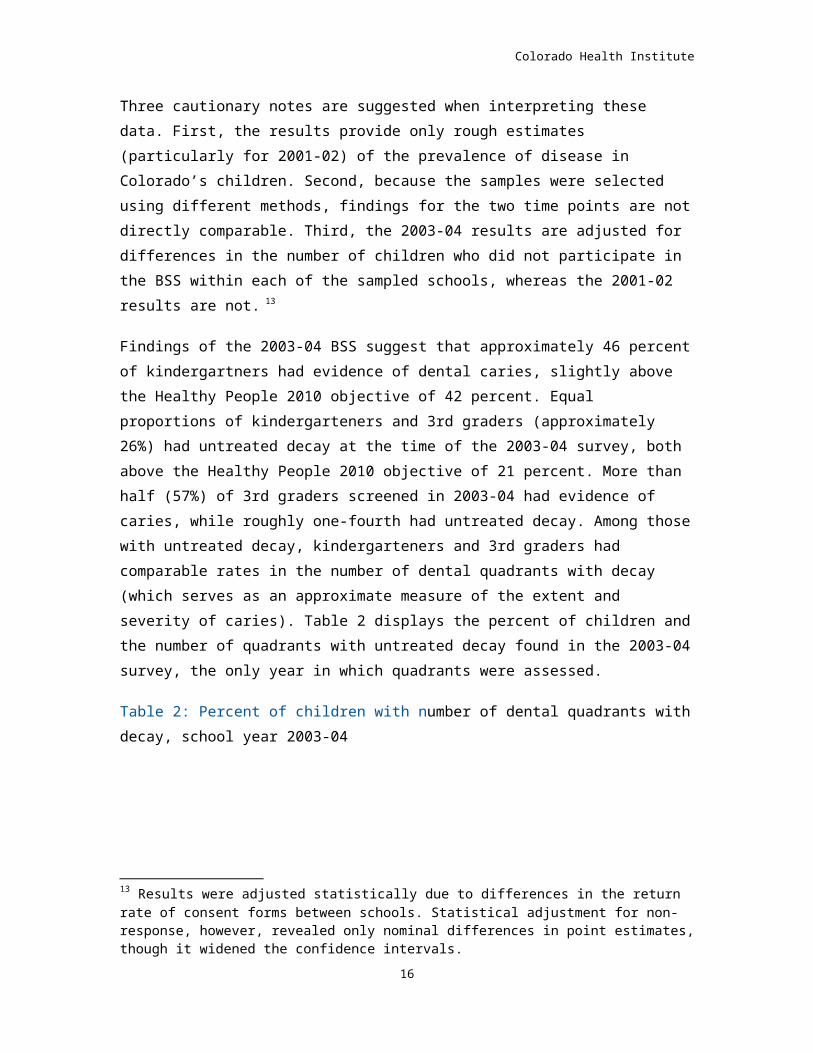
Findings of the 2003-04 BSS suggest that approximately 46 percent of kindergartners had evidence of dental caries, slightly above the Healthy People 2010 objective of 42 percent. Equal proportions of kindergarteners and 3rd graders (approximately 26%) had untreated decay at the time of the 2003-04 survey, both above the Healthy People 2010 objective of 21 percent. More than half (57%) of 3rd graders screened in 2003-04 had evidence of caries, while roughly one-fourth had untreated decay. Among those with untreated decay, kindergarteners and 3rd graders had comparable rates in the number of dental quadrants with decay (which serves as an approximate measure of the extent and severity of caries). Table 2 displays the percent of children and the number of quadrants with untreated decay found in the 2003-04 survey, the only year in which quadrants were assessed.
Table 2: Percent of children with number of dental quadrants with decay, school year 2003-04
12 Results of all 2003-04 BSS analyses supplied by the CDPHE Oral Health Program.13 Results were adjusted statistically due to differences in the return rate of consent forms between schools. Statistical adjustment for non-response, however, revealed only nominal differences in point estimates, though it widened the confidence intervals.
13
Colorado Health Institute
Quadrants with Decay
Kindergarteners 3rd graders
Percent with 0 quadrants
73.1% 73.9%
Percent with 1 quadrant
12.0% 13.7%
Percent with 2 quadrants
7.3% 6.7%
Percent with 3 quadrants
3.7% 2.2%
Percent with 4 quadrants
3.9% 3.4%
All children (mean) .53% .48%
Children with decay (mean)
1.98% 1.82%
Source: Colorado Basic Screening Survey, 2003-2004
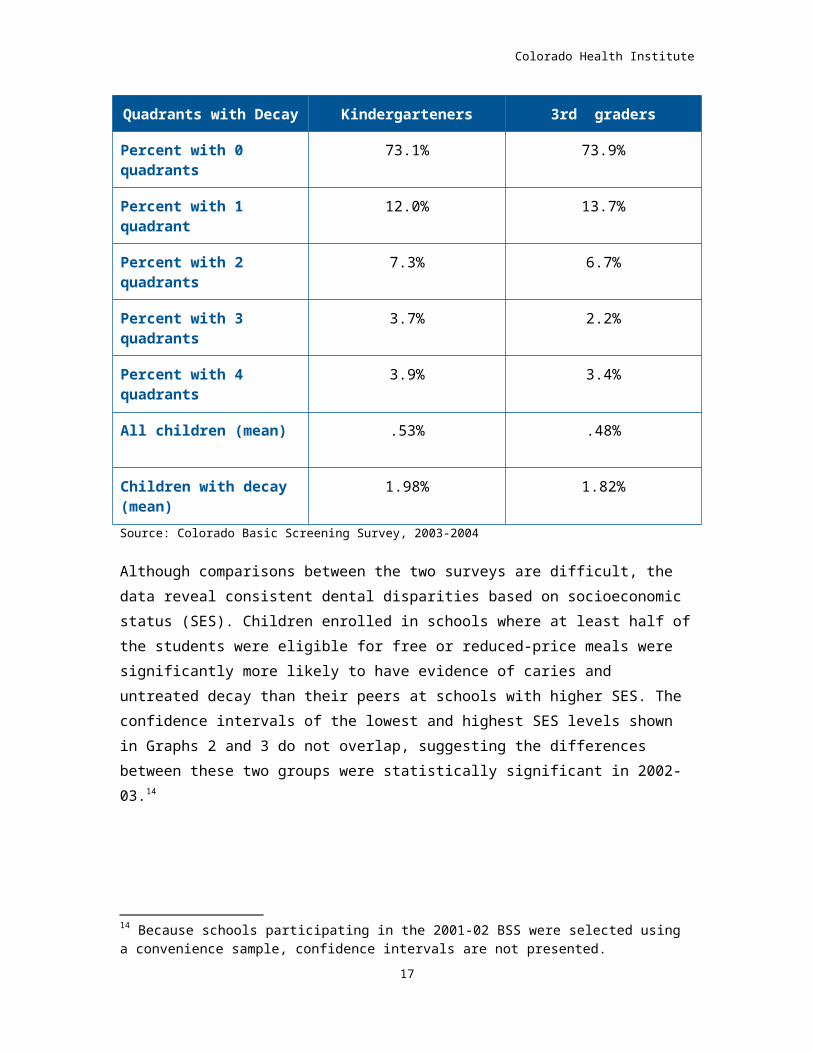
Although comparisons between the two surveys are difficult, the data reveal consistent dental disparities based on socioeconomic status (SES). Children enrolled in schools where at least half of the students were eligible for free or reduced-price meals were significantly more likely to have evidence of caries and untreated decay than their peers at schools with higher SES. The confidence intervals of the lowest and highest SES levels shown in Graphs 2 and 3 do not overlap, suggesting the differences between these two groups were statistically significant in 2002-03.14
14 Because schools participating in the 2001-02 BSS were selected using a convenience sample, confidence intervals are not presented.
14
Colorado Health Institute
Graph 3: Prevalence of dental caries, kindergarten and 3rd-grade children, by free and reduced- price meal status of school (Colorado 2001-02 and 2003-04 and Healthy People 2010 objective)
Source: Colorado Basic Screening Survey, 2001-2002 and 2003-2004 School Years and Healthy People 2010 Objectives
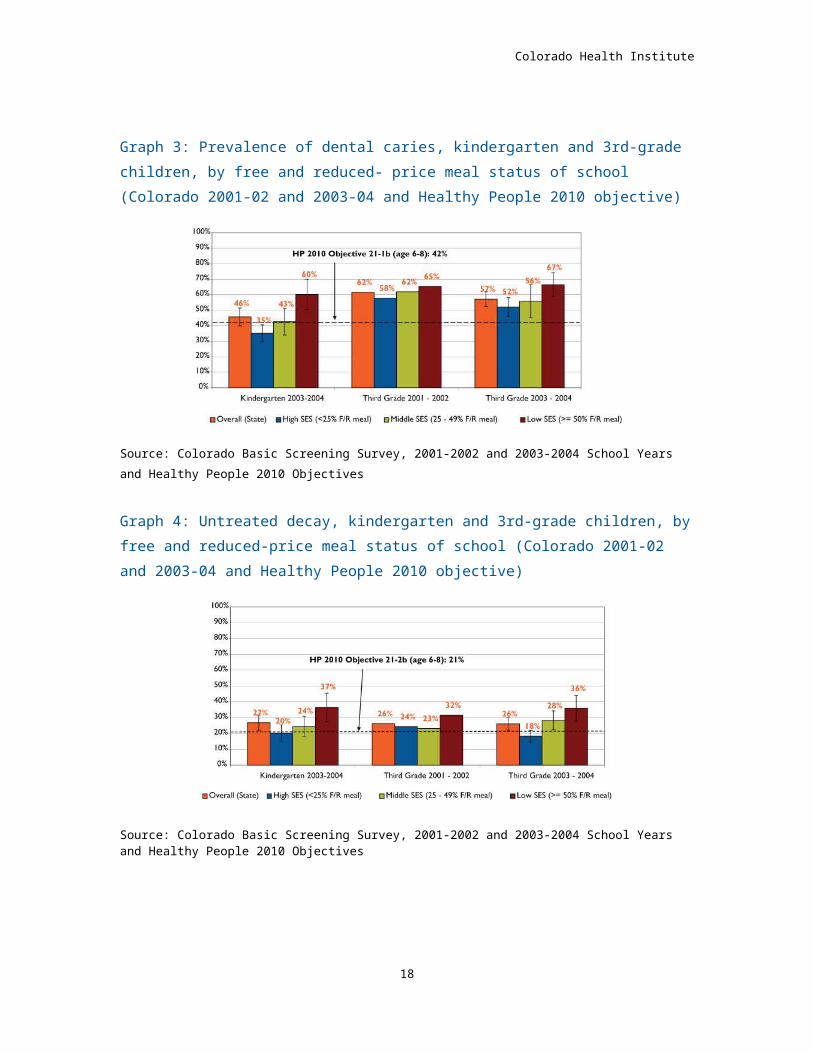
Graph 4: Untreated decay, kindergarten and 3rd-grade children, by free and reduced-price meal status of school (Colorado 2001-02 and 2003-04 and Healthy People 2010 objective)
Source: Colorado Basic Screening Survey, 2001-2002 and 2003-2004 School Years and Healthy People 2010 Objectives
15
Colorado Health Institute
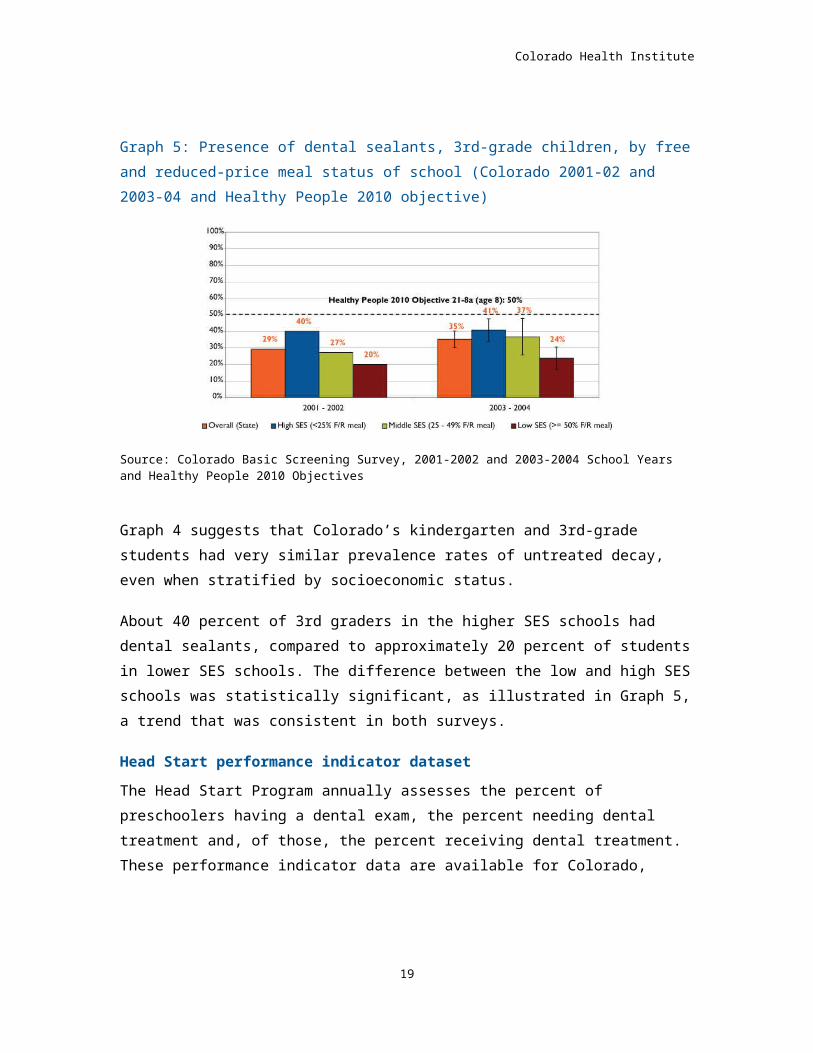
Graph 5: Presence of dental sealants, 3rd-grade children, by free and reduced-price meal status of school (Colorado 2001-02 and 2003-04 and Healthy People 2010 objective)
Source: Colorado Basic Screening Survey, 2001-2002 and 2003-2004 School Years and Healthy People 2010 Objectives
Graph 4 suggests that Colorado’s kindergarten and 3rd-grade students had very similar prevalence rates of untreated decay, even when stratified by socioeconomic status.
About 40 percent of 3rd graders in the higher SES schools had dental sealants, compared to approximately 20 percent of students in lower SES schools. The difference between the low and high SES schools was statistically significant, as illustrated in Graph 5, a trend that was consistent in both surveys.
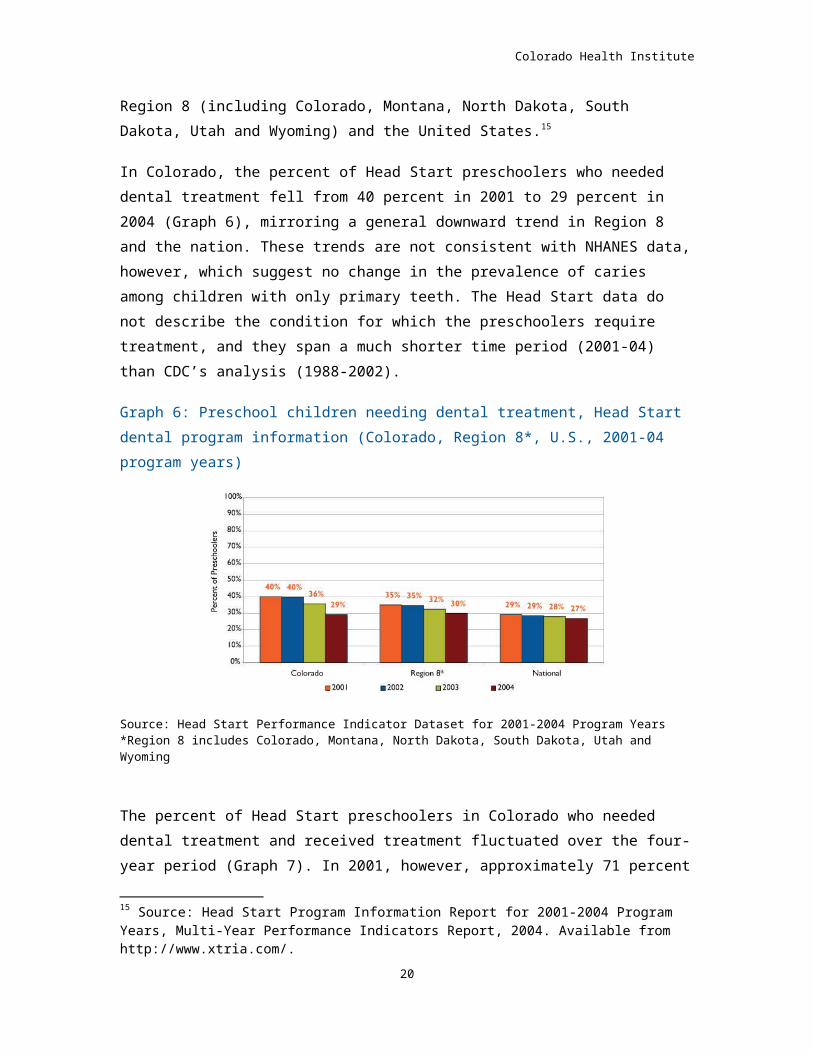
Head Start performance indicator datasetThe Head Start Program annually assesses the percent of preschoolers having a dental exam, the percent needing dental treatment and, of those, the percent receiving dental treatment. These performance indicator data are available for Colorado, Region 8 (including Colorado, Montana, North Dakota, South Dakota, Utah and Wyoming) and the United States.15
In Colorado, the percent of Head Start preschoolers who needed dental treatment fell from 40 percent in 2001 to 29 percent in 2004 (Graph 6),
15 Source: Head Start Program Information Report for 2001-2004 Program Years, Multi-Year Performance Indicators Report, 2004. Available from http://www.xtria.com/.
16
Colorado Health Institute
mirroring a general downward trend in Region 8 and the nation. These trends are not consistent with NHANES data, however, which suggest no change in the prevalence of caries among children with only primary teeth. The Head Start data do not describe the condition for which the preschoolers require treatment, and they span a much shorter time period (2001-04) than CDC’s analysis (1988-2002).
Graph 6: Preschool children needing dental treatment, Head Start dental program information (Colorado, Region 8*, U.S., 2001-04 program years)
Source: Head Start Performance Indicator Dataset for 2001-2004 Program Years*Region 8 includes Colorado, Montana, North Dakota, South Dakota, Utah and Wyoming
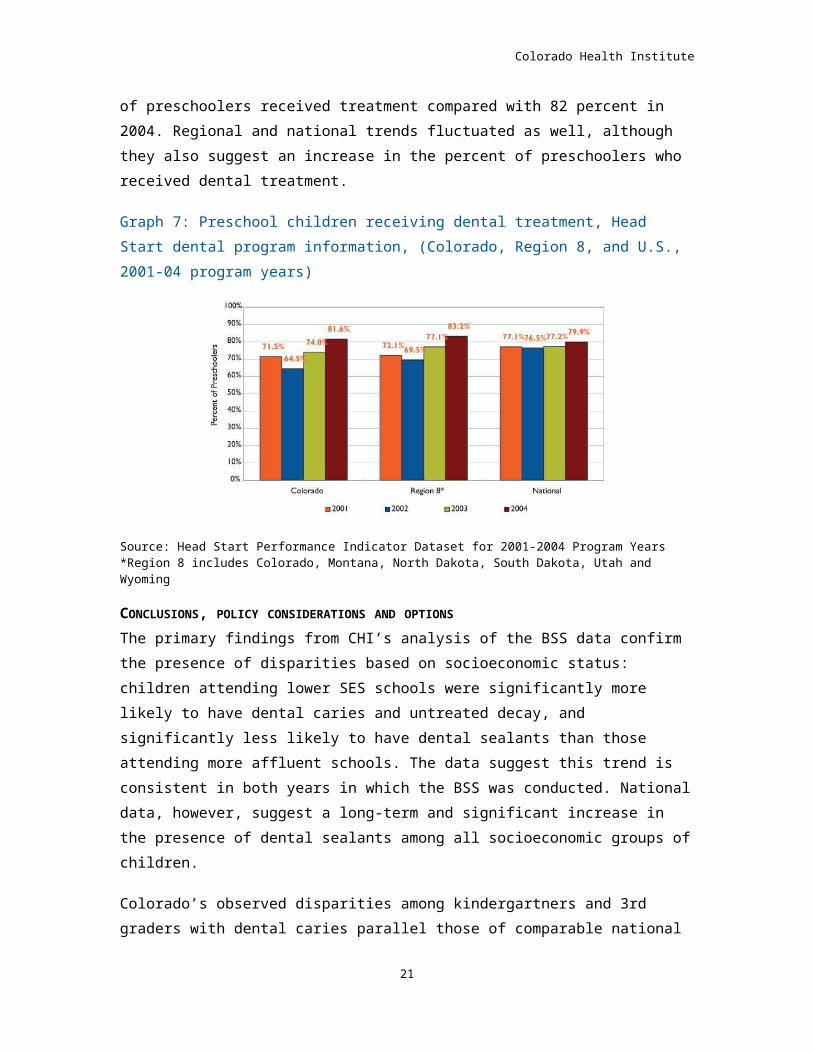
The percent of Head Start preschoolers in Colorado who needed dental treatment and received treatment fluctuated over the four-year period (Graph 7). In 2001, however, approximately 71 percent of preschoolers received treatment compared with 82 percent in 2004. Regional and national trends fluctuated as well, although they also suggest an increase in the percent of preschoolers who received dental treatment.
Graph 7: Preschool children receiving dental treatment, Head Start dental program information, (Colorado, Region 8, and U.S., 2001-04 program years)
17
Colorado Health Institute
Source: Head Start Performance Indicator Dataset for 2001-2004 Program Years*Region 8 includes Colorado, Montana, North Dakota, South Dakota, Utah and Wyoming
CONCLUSIONS, POLICY CONSIDERATIONS AND OPTIONSThe primary findings from CHI’s analysis of the BSS data confirm the presence of disparities based on socioeconomic status: children attending lower SES schools were significantly more likely to have dental caries and untreated decay, and significantly less likely to have dental sealants than those attending more affluent schools. The data suggest this trend is consistent in both years in which the BSS was conducted. National data, however, suggest a long-term and significant increase in the presence of dental sealants among all socioeconomic groups of children.
Colorado’s observed disparities among kindergartners and 3rd graders with dental caries parallel those of comparable national data. Whether Colorado has similar trends with regard to the presence of sealants remains to be demonstrated through future surveillance activities. A follow-up study with the same cohort of 3rd-grade students surveyed in 2003, when they become 6th graders, would provide more clarity about the effectiveness of dental sealants over two time periods.
Perhaps one of the most significant findings is that Colorado 3rd graders and kindergartners exhibited similar patterns of untreated decay and severity of decay in terms of numbers of quadrants with decay in 2003-04. The data suggest that untreated decay may be compromising children’s new permanent teeth with similar frequency and severity as that observed in their primary teeth.16
16 Findings are based on two separate samples of kindergartners and 3rd graders at a single time point, not on a single cohort of students over time.
18
Colorado Health Institute
Colorado preschoolers in the Head Start program are generally from economically disadvantaged families, and no comparative data exist on preschoolers from other socioeconomic strata. CHI’s analysis of data from Colorado’s Head Start program suggests the program is making gains in the number of students receiving needed dental health services. In addition, the overall proportion of children requiring dental care has declined more in Colorado than nationally. Additional research is needed to determine whether these findings are comparable to other preschool populations in the state and what other factors may explain any observed differences.
There are a range of options that policy makers and funders could consider that derive from the analysis provided in this study and that are confirmed by the recently released CDPHE impact study. Among these, the following three topical areas are highlighted:
1. Disease screening and monitoring
Conduct the BSS with a representative sample of schools at more frequent intervals to monitor trends over time for the prevalence of caries, untreated decay, quadrants with decay and presence of dental sealants. A biannual BSS would enable policymakers to determine whether they are gaining ground in the epidemic of dental caries among young children. Suggested populations to include in this monitoring effort are: Head Start children, kindergarten and 3rd-grade students. Including 7th graders would provide information on presence of sealants for second molars.
To assess the prevalence of dental disease and the concomitant effect of sealants over time, it would be optimal to conduct a follow-up in-mouth screening on a cohort of 3rd graders once they enter 6th grade.
2. Preventive dental care
Provide incentives for public programs (Medicaid and CHP+) and dental care providers to establish dental homes for children and adolescents. These incentives could take the form of enhanced payments to providers, reminder postcards to parents and establishment of care management programs to intervene with high-risk families and those with excessively high levels of “no-shows.”
19
Colorado Health Institute
Train medical professionals to screen for early childhood caries; investigate best practices, including allowing medical professionals to bill for dental screening and referrals.
Develop a comprehensive strategic plan for the expansion and ongoing support of school-based dental clinics that include prevention programs such as sealant and fluoride rinse programs.
Explore the development of integrated curriculum content to be offered to medical and dental students on the relationship between general health and oral health.
3. Dental health education
Identify and implement best practices to target dental health educational materials and media messages to parents and guardians of young children who are most at risk for dental disease.
Promote the integration of best practice dental health education and nutrition materials into elementary school curriculum.
Encourage dental health education and preventive dental care through the deployment of school-based dental educators trained in identifying and following children at high risk of developing dental disease or those with identified past or present dental caries.
Expand Colorado’s Be a Smart Mouth public education campaign on oral health and/or other best practice models, such as Watch Your Mouth in Washington State, that are being replicated in Massachusetts, New Hampshire and Maine.
THE PREVALENCE OF DENTAL DISEASE IN ADULTSAlthough much emphasis is placed on the prevention of dental disease in children, adults have their own unique oral health needs and issues. Throughout adulthood, oral disease and its dental consequences has been shown to have profound effects on quality of life, nutritional status, productivity, self-esteem, and the ability to work or find work. The U.S. Surgeon General’s report observed:
The baby boomers will be the first U.S. generation to age while maintaining their natural dentition. They are the first to benefit from the caries preventive effect of widespread community water fluoridation and fluoride dentifrices. As a result, the baby boomers
20
Colorado Health Institute
bring to the aging process higher expectations about oral health throughout the life cycle.17
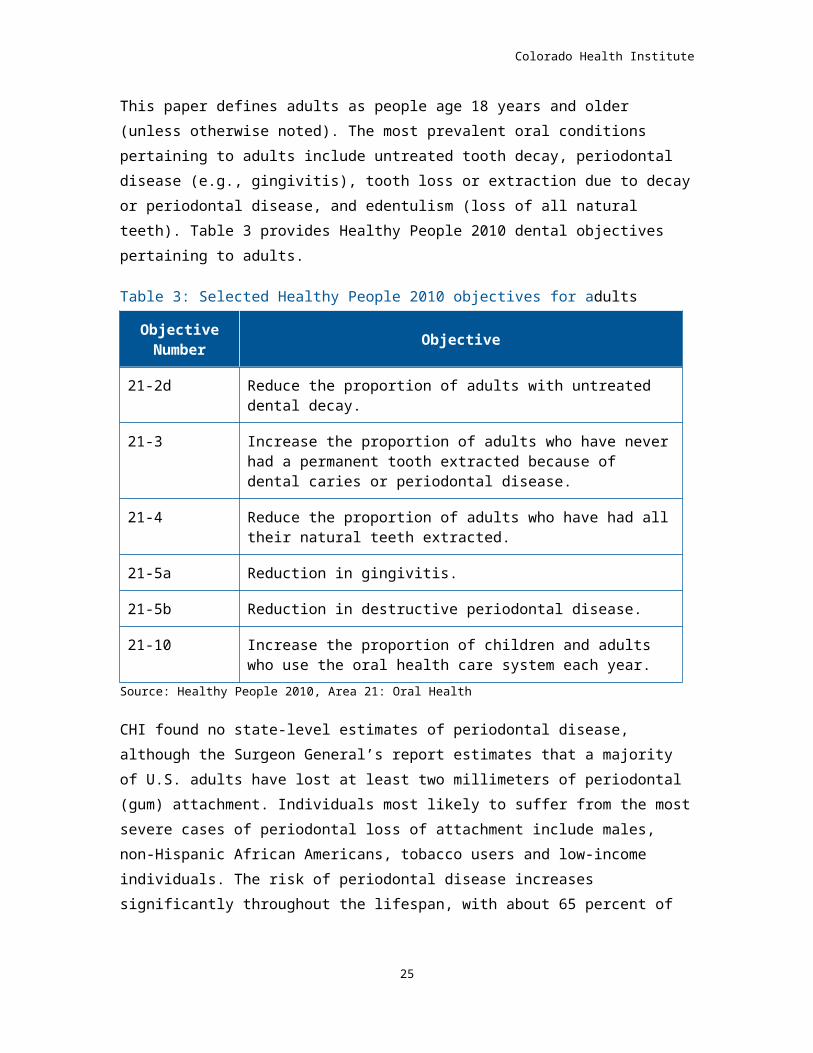
This paper defines adults as people age 18 years and older (unless otherwise noted). The most prevalent oral conditions pertaining to adults include untreated tooth decay, periodontal disease (e.g., gingivitis), tooth loss or extraction due to decay or periodontal disease, and edentulism (loss of all natural teeth). Table 3 provides Healthy People 2010 dental objectives pertaining to adults.
Table 3: Selected Healthy People 2010 objectives for adultsObjective Number Objective
21-2d Reduce the proportion of adults with untreated dental decay.
21-3 Increase the proportion of adults who have never had a permanent tooth extracted because of dental caries or periodontal disease.
21-4 Reduce the proportion of adults who have had all their natural teeth extracted.
21-5a Reduction in gingivitis.
21-5b Reduction in destructive periodontal disease.
21-10 Increase the proportion of children and adults who use the oral health care system each year.
Source: Healthy People 2010, Area 21: Oral Health
CHI found no state-level estimates of periodontal disease, although the Surgeon General’s report estimates that a majority of U.S. adults have lost at least two millimeters of periodontal (gum) attachment. Individuals most likely to suffer from the most severe cases of periodontal loss of attachment include males, non-Hispanic African Americans, tobacco users and low-income individuals. The risk of periodontal disease increases significantly throughout the lifespan, with about 65 percent of adults 75 years and older having lost at least four millimeters of gum attachment.
17 DHHS. 2000. Oral Health in America: A Report of the Surgeon General. 21
Colorado Health Institute
National Health and Nutrition Examination Survey (NHANES)CDC’s analysis of NHANES data found the prevalence of caries among adults at least 20 years old gradually fell from approximately 95 percent in the 1988-94 time period to 91 percent during the 1998-2002 period. Other findings from this analysis included:
The proportion of adults age 60 years and older who have lost all of their permanent teeth (edentulism) decreased from 31 to 25 percent.
Mexican-American adults had a lower rate of edentulism during both time periods than non-Hispanic white and non-Hispanic African American adults. Both non-Hispanic white and African American adults experienced a decrease in the prevalence of tooth loss, though blacks experienced the highest rate of edentulism among all racial and ethnic groups during both time periods.
Smokers were more likely to experience tooth loss and dental caries than nonsmokers.
Behavioral Risk Factor Surveillance System (BRFSS)18
At present, no screening and data collection effort such as the BSS exists for adults in Colorado.19 Rather, the best source for assessing the oral health of Colorado adults is the BRFSS survey. The CDPHE administers this telephone survey on a monthly basis to derive annual estimates. The oral health component is not included on an annual basis.
The BRFSS survey dental questions ask respondents about tooth loss due to decay or periodontal disease (perhaps the best direct indicator of oral health), and other process measures such as time since last dental visit and time since last professional teeth cleaning. In the 1997 BRFSS survey, respondents also were asked about the primary reason they did not visit a dentist (this question is slated to be asked again in 2006). Because the questionnaire includes a wide array of health-related questions, the BRFSS survey provides a comprehensive source of data for analysis and cross tabulation by various health status and behavioral and demographic variables. A disadvantage, however, is that the survey excludes certain 18 Throughout this report, the BRFSS survey data used were supplied by the Health Statistics Section of the Colorado Department of Public Health and Environment, which specifically disclaims responsibility for any analyses, interpretation or conclusions it has not provided.19 Other states have used the BSS to screen adults, namely long-term care and skilled nursing facility residents. Nevada attempted to screen a sample of assisted-living residents but found significant financial, time and methodological challenges (Key informant interview, September 13, 2005).
22
Colorado Health Institute
individuals, namely those who lack a telephone or only use a cell phone. Comparisons between the oral health status of distinct racial and ethnic groups in Colorado using BRFSS data are not possible because of small sample sizes.
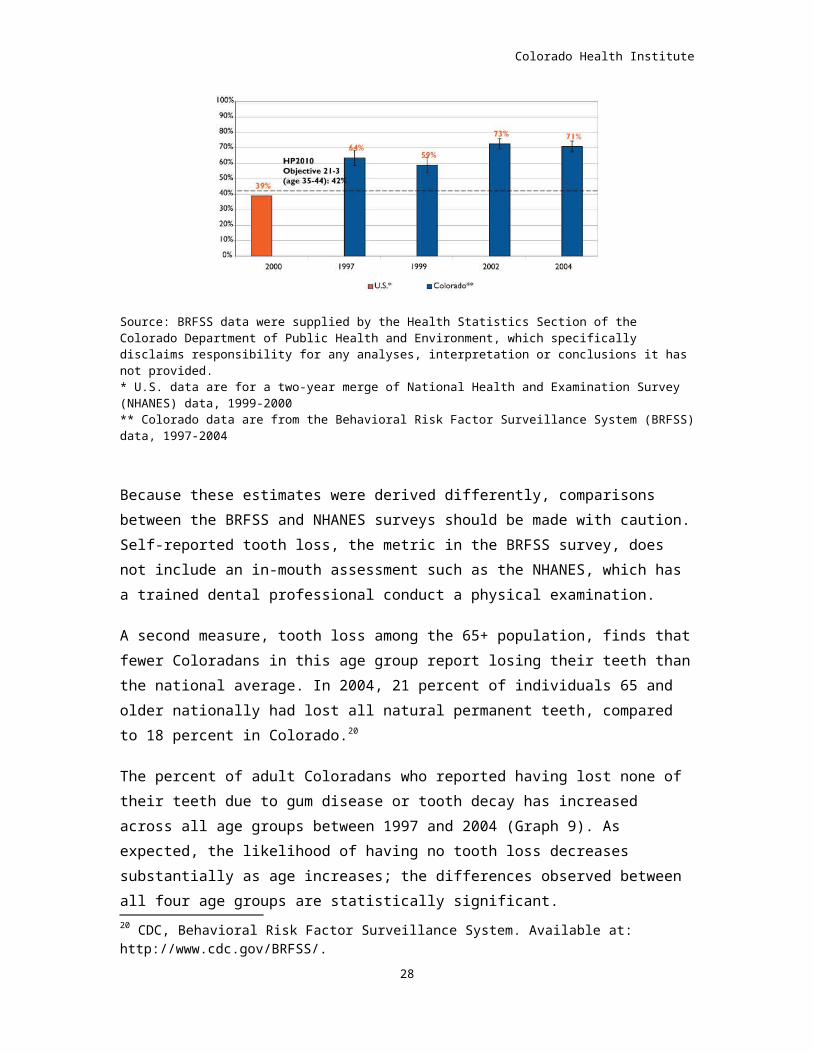
One of the long-term consequences of advanced tooth decay and periodontal disease that has a significant effect on quality of life is tooth loss. Graph 8 illustrates the positive finding that Colorado exceeds both the national average and the Healthy People 2010 objective for the number of adults ages 35-44 years who have not lost any of their permanent teeth due to decay or periodontal disease. Colorado has exceeded the 2000 national average for the last four years in which BRFSS survey oral health data were collected.
Graph 8: No permanent tooth loss due to decay or periodontal disease, adults 35-44 years (Colorado and U.S., 1997-2004 and Healthy People 2010 objective)
Source: BRFSS data were supplied by the Health Statistics Section of the Colorado Department of Public Health and Environment, which specifically disclaims responsibility for any analyses, interpretation or conclusions it has not provided. * U.S. data are for a two-year merge of National Health and Examination Survey (NHANES) data, 1999-2000** Colorado data are from the Behavioral Risk Factor Surveillance System (BRFSS) data, 1997-2004
Because these estimates were derived differently, comparisons between the BRFSS and NHANES surveys should be made with caution. Self-reported tooth loss, the metric in the BRFSS survey, does not include an in-mouth assessment such as the NHANES, which has a trained dental professional conduct a physical examination.
A second measure, tooth loss among the 65+ population, finds that fewer Coloradans in this age group report losing their teeth than the national
23

Colorado Health Institute
average. In 2004, 21 percent of individuals 65 and older nationally had lost all natural permanent teeth, compared to 18 percent in Colorado.20
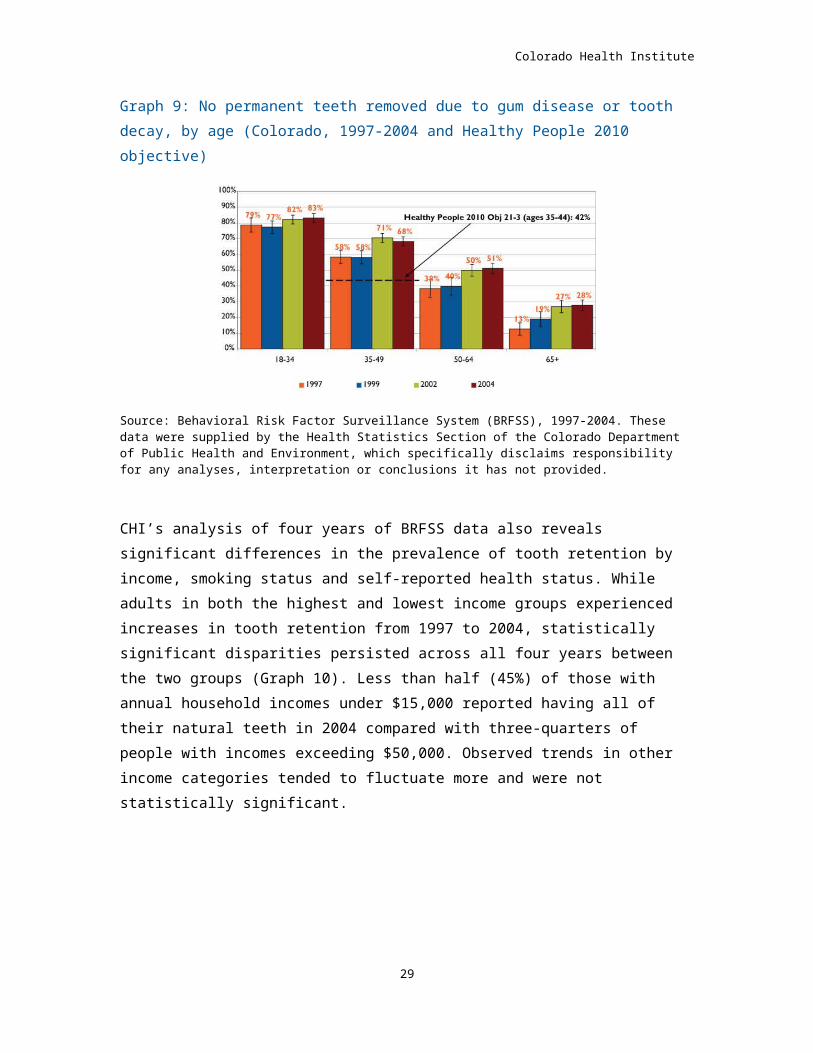
The percent of adult Coloradans who reported having lost none of their teeth due to gum disease or tooth decay has increased across all age groups between 1997 and 2004 (Graph 9). As expected, the likelihood of having no tooth loss decreases substantially as age increases; the differences observed between all four age groups are statistically significant.
Graph 9: No permanent teeth removed due to gum disease or tooth decay, by age (Colorado, 1997-2004 and Healthy People 2010 objective)
Source: Behavioral Risk Factor Surveillance System (BRFSS), 1997-2004. These data were supplied by the Health Statistics Section of the Colorado Department of Public Health and Environment, which specifically disclaims responsibility for any analyses, interpretation or conclusions it has not provided.
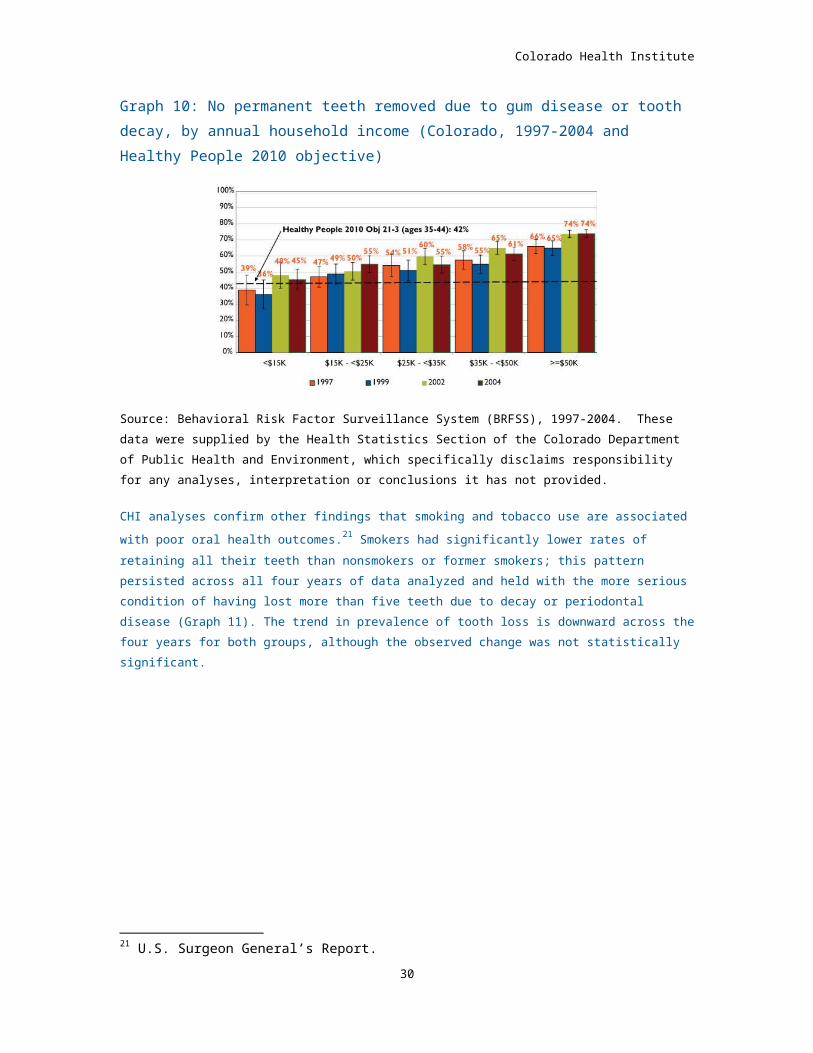
CHI’s analysis of four years of BRFSS data also reveals significant differences in the prevalence of tooth retention by income, smoking status and self-reported health status. While adults in both the highest and lowest income groups experienced increases in tooth retention from 1997 to 2004, statistically significant disparities persisted across all four years between the two groups (Graph 10). Less than half (45%) of those with annual household incomes under $15,000 reported having all of their natural teeth in 2004 compared with three-quarters of people with incomes exceeding $50,000. Observed trends in other income categories tended to fluctuate more and were not statistically significant.
20 CDC, Behavioral Risk Factor Surveillance System. Available at: http://www.cdc.gov/BRFSS/.
24
Colorado Health Institute
Graph 10: No permanent teeth removed due to gum disease or tooth decay, by annual household income (Colorado, 1997-2004 and Healthy People 2010 objective)
Source: Behavioral Risk Factor Surveillance System (BRFSS), 1997-2004. These data were supplied by the Health Statistics Section of the Colorado Department of Public Health and Environment, which specifically disclaims responsibility for any analyses, interpretation or conclusions it has not provided.
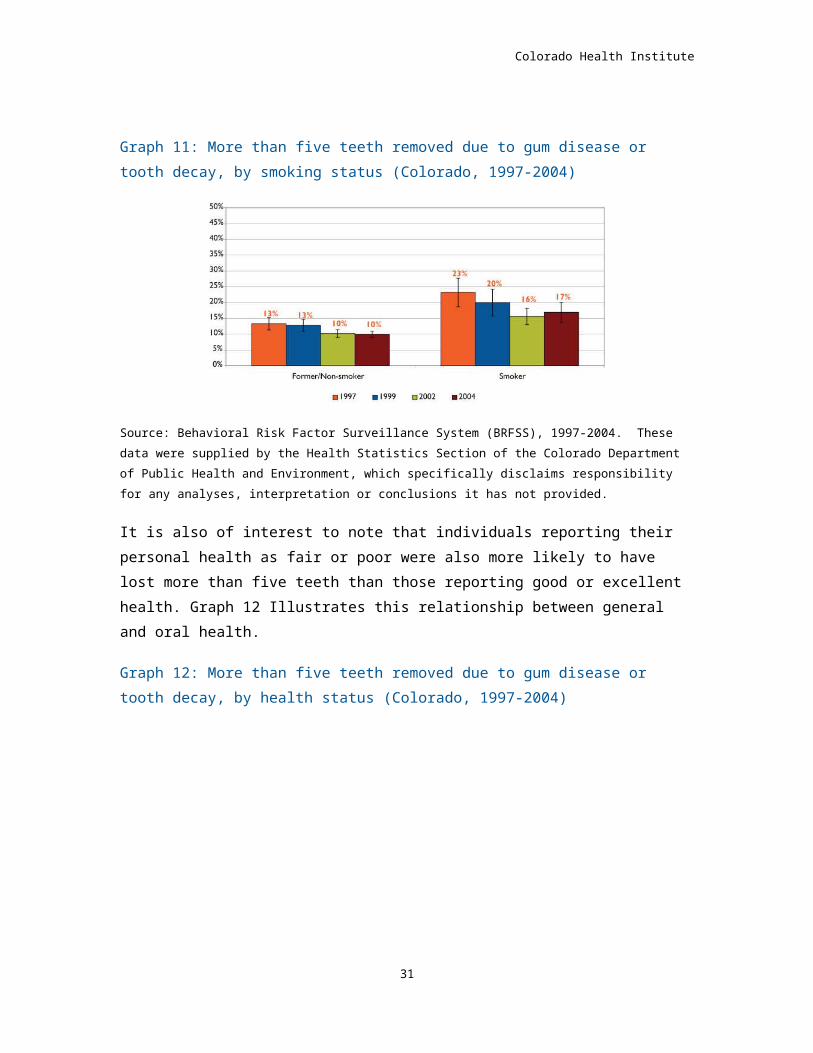
CHI analyses confirm other findings that smoking and tobacco use are associated with poor oral health outcomes.21 Smokers had significantly lower rates of retaining all their teeth than nonsmokers or former smokers; this pattern persisted across all four years of data analyzed and held with the more serious condition of having lost more than five teeth due to decay or periodontal disease (Graph 11). The trend in prevalence of tooth loss is downward across the four years for both groups, although the observed change was not statistically significant.
21 U.S. Surgeon General’s Report.25
Colorado Health Institute
Graph 11: More than five teeth removed due to gum disease or tooth decay, by smoking status (Colorado, 1997-2004)
Source: Behavioral Risk Factor Surveillance System (BRFSS), 1997-2004. These data were supplied by the Health Statistics Section of the Colorado Department of Public Health and Environment, which specifically disclaims responsibility for any analyses, interpretation or conclusions it has not provided.
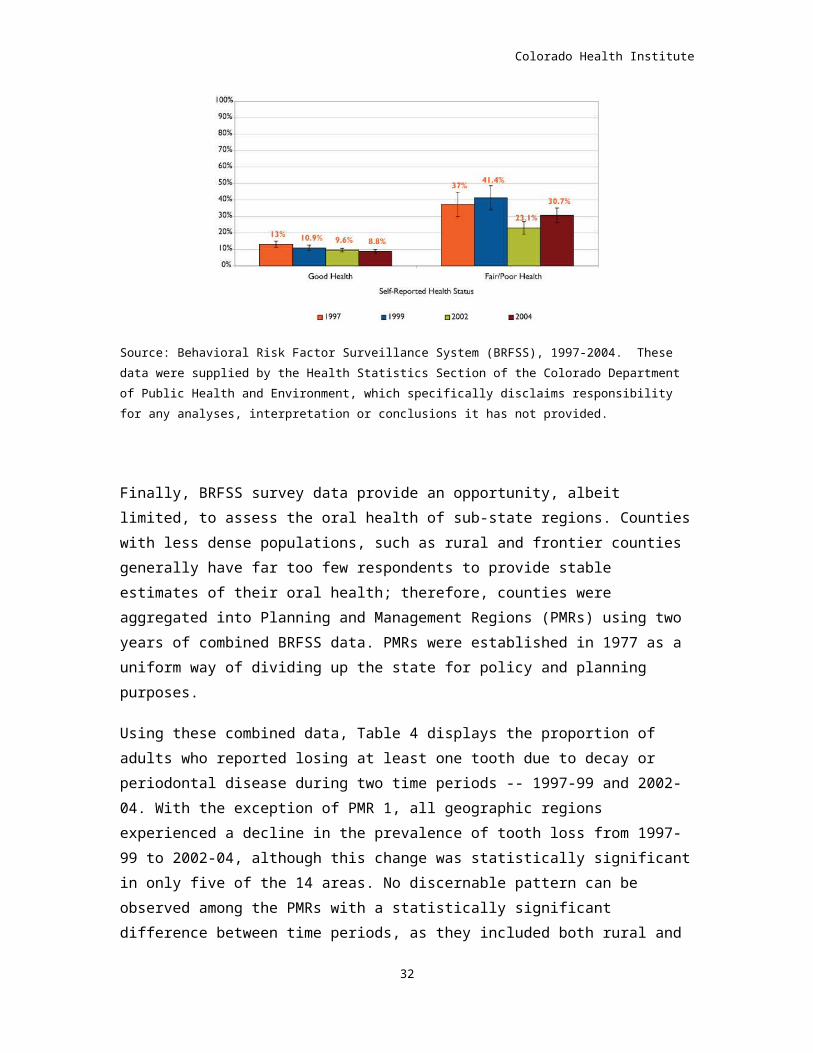
It is also of interest to note that individuals reporting their personal health as fair or poor were also more likely to have lost more than five teeth than those reporting good or excellent health. Graph 12 Illustrates this relationship between general and oral health.
Graph 12: More than five teeth removed due to gum disease or tooth decay, by health status (Colorado, 1997-2004)
Source: Behavioral Risk Factor Surveillance System (BRFSS), 1997-2004. These data were supplied by the Health Statistics Section of the Colorado Department of Public Health and
26
Colorado Health Institute
Environment, which specifically disclaims responsibility for any analyses, interpretation or conclusions it has not provided.
Finally, BRFSS survey data provide an opportunity, albeit limited, to assess the oral health of sub-state regions. Counties with less dense populations, such as rural and frontier counties generally have far too few respondents to provide stable estimates of their oral health; therefore, counties were aggregated into Planning and Management Regions (PMRs) using two years of combined BRFSS data. PMRs were established in 1977 as a uniform way of dividing up the state for policy and planning purposes.
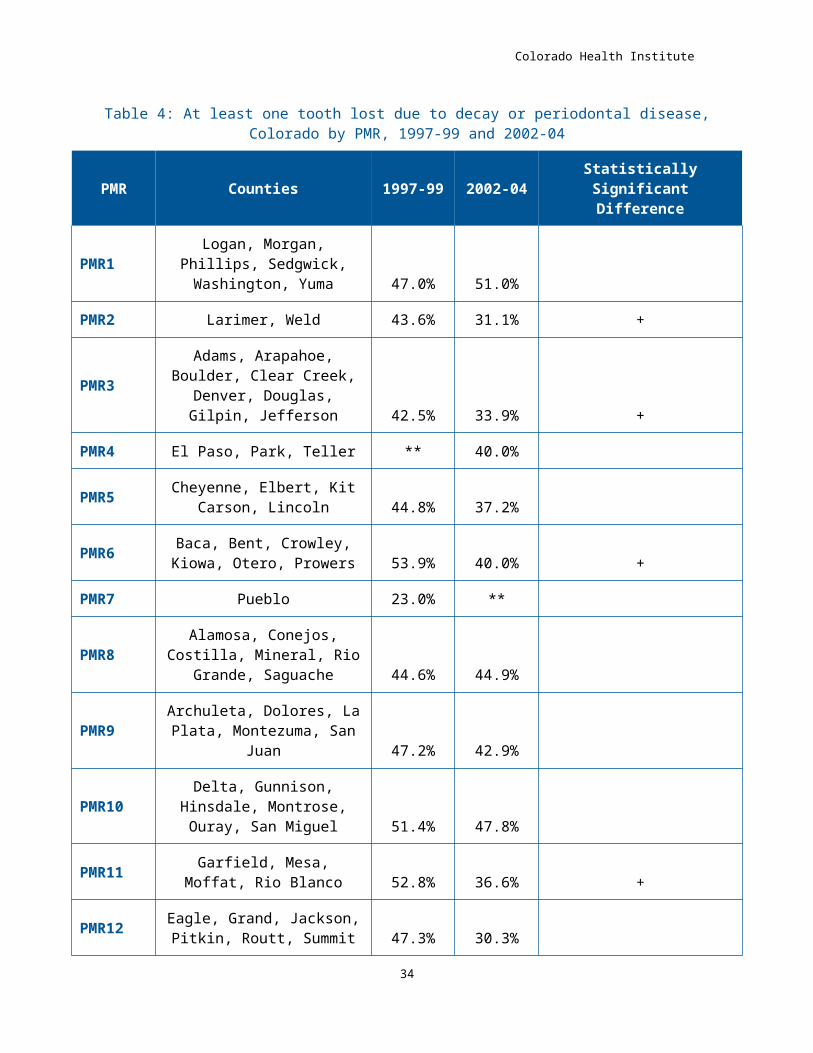
Using these combined data, Table 4 displays the proportion of adults who reported losing at least one tooth due to decay or periodontal disease during two time periods -- 1997-99 and 2002-04. With the exception of PMR 1, all geographic regions experienced a decline in the prevalence of tooth loss from 1997-99 to 2002-04, although this change was statistically significant in only five of the 14 areas. No discernable pattern can be observed among the PMRs with a statistically significant difference between time periods, as they included both rural and urban areas. Appendix E provides maps displaying rates of tooth loss by PMR.
27
Colorado Health Institute
Table 4: At least one tooth lost due to decay or periodontal disease, Colorado by PMR, 1997-99 and 2002-04
PMR Counties 1997-99 2002-04 Statistically Significant Difference
PMR1Logan, Morgan, Phillips, Sedgwick, Washington,
Yuma 47.0% 51.0%
PMR2 Larimer, Weld 43.6% 31.1% +
PMR3Adams, Arapahoe,
Boulder, Clear Creek, Denver, Douglas, Gilpin,
Jefferson 42.5% 33.9% +
PMR4 El Paso, Park, Teller ** 40.0%
PMR5 Cheyenne, Elbert, Kit Carson, Lincoln 44.8% 37.2%
PMR6 Baca, Bent, Crowley, Kiowa, Otero, Prowers 53.9% 40.0% +
PMR7 Pueblo 23.0% **
PMR8Alamosa, Conejos, Costilla,
Mineral, Rio Grande, Saguache 44.6% 44.9%
PMR9Archuleta, Dolores, La Plata, Montezuma, San
Juan 47.2% 42.9%
PMR10Delta, Gunnison, Hinsdale,
Montrose, Ouray, San Miguel 51.4% 47.8%
PMR11 Garfield, Mesa, Moffat, Rio Blanco 52.8% 36.6% +
PMR12 Eagle, Grand, Jackson, Pitkin, Routt, Summit 47.3% 30.3%
28
Colorado Health Institute
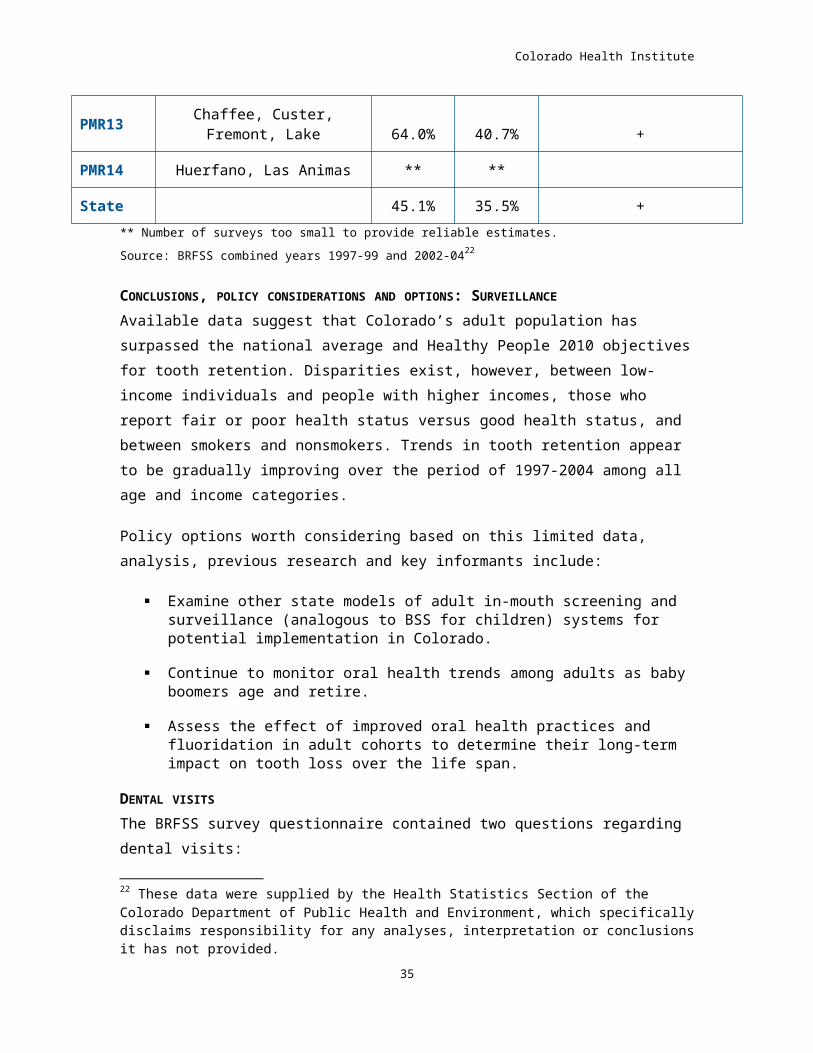
PMR13 Chaffee, Custer, Fremont, Lake 64.0% 40.7% +
PMR14 Huerfano, Las Animas ** **
State 45.1% 35.5% +** Number of surveys too small to provide reliable estimates.Source: BRFSS combined years 1997-99 and 2002-0422
CONCLUSIONS, POLICY CONSIDERATIONS AND OPTIONS: SURVEILLANCEAvailable data suggest that Colorado’s adult population has surpassed the national average and Healthy People 2010 objectives for tooth retention. Disparities exist, however, between low-income individuals and people with higher incomes, those who report fair or poor health status versus good health status, and between smokers and nonsmokers. Trends in tooth retention appear to be gradually improving over the period of 1997-2004 among all age and income categories.
Policy options worth considering based on this limited data, analysis, previous research and key informants include:
Examine other state models of adult in-mouth screening and surveillance (analogous to BSS for children) systems for potential implementation in Colorado.
Continue to monitor oral health trends among adults as baby boomers age and retire.
Assess the effect of improved oral health practices and fluoridation in adult cohorts to determine their long-term impact on tooth loss over the life span.
DENTAL VISITS The BRFSS survey questionnaire contained two questions regarding dental visits:
1. How long has it been since you last visited a dentist or a dental clinic for any reason?
2. How long has it been since you had your teeth cleaned by a dentist or dental hygienist?23
22 These data were supplied by the Health Statistics Section of the Colorado Department of Public Health and Environment, which specifically disclaims responsibility for any analyses, interpretation or conclusions it has not provided.
29
Colorado Health Institute
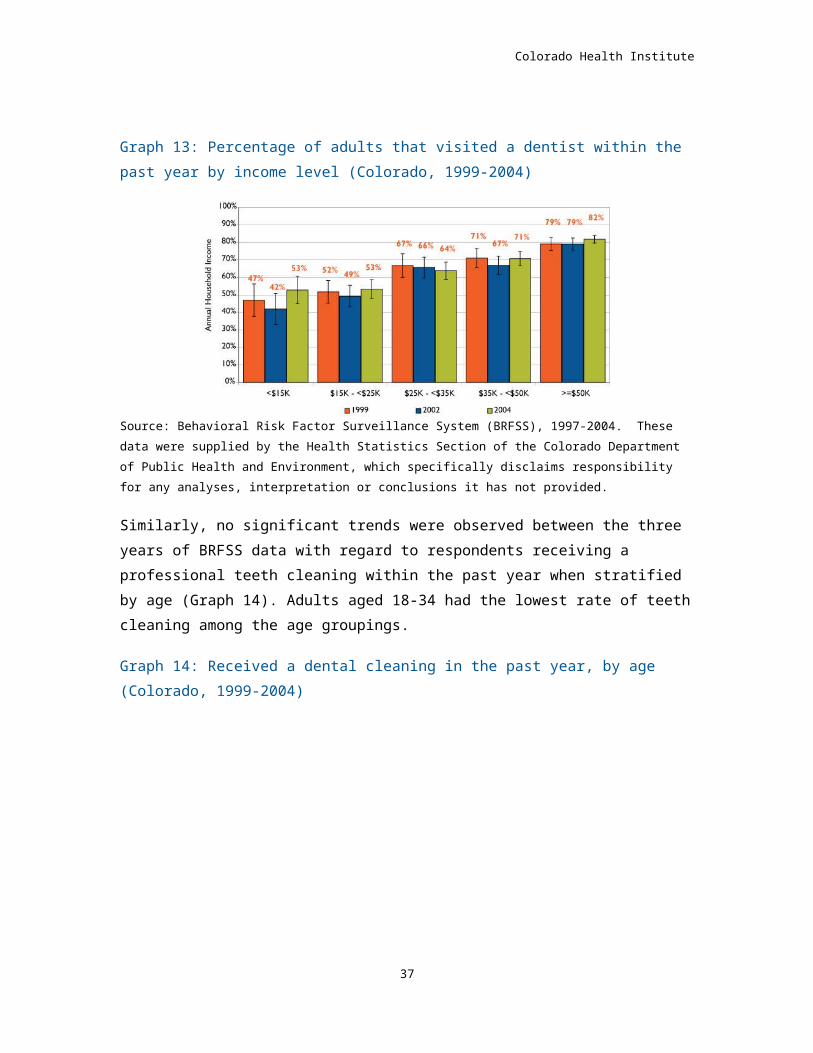
Analysis of three years of BRFSS survey data suggests that individuals with higher annual household incomes were significantly more likely to have visited a dentist or clinic within the past year than individuals with lower incomes. No significant trends were observed between the three years of BRFSS data analyzed (Graph 13).
23 Item included on BRFSS since 1999.30
Colorado Health Institute
Graph 13: Percentage of adults that visited a dentist within the past year by income level (Colorado, 1999-2004)
Source: Behavioral Risk Factor Surveillance System (BRFSS), 1997-2004. These data were supplied by the Health Statistics Section of the Colorado Department of Public Health and Environment, which specifically disclaims responsibility for any analyses, interpretation or conclusions it has not provided.
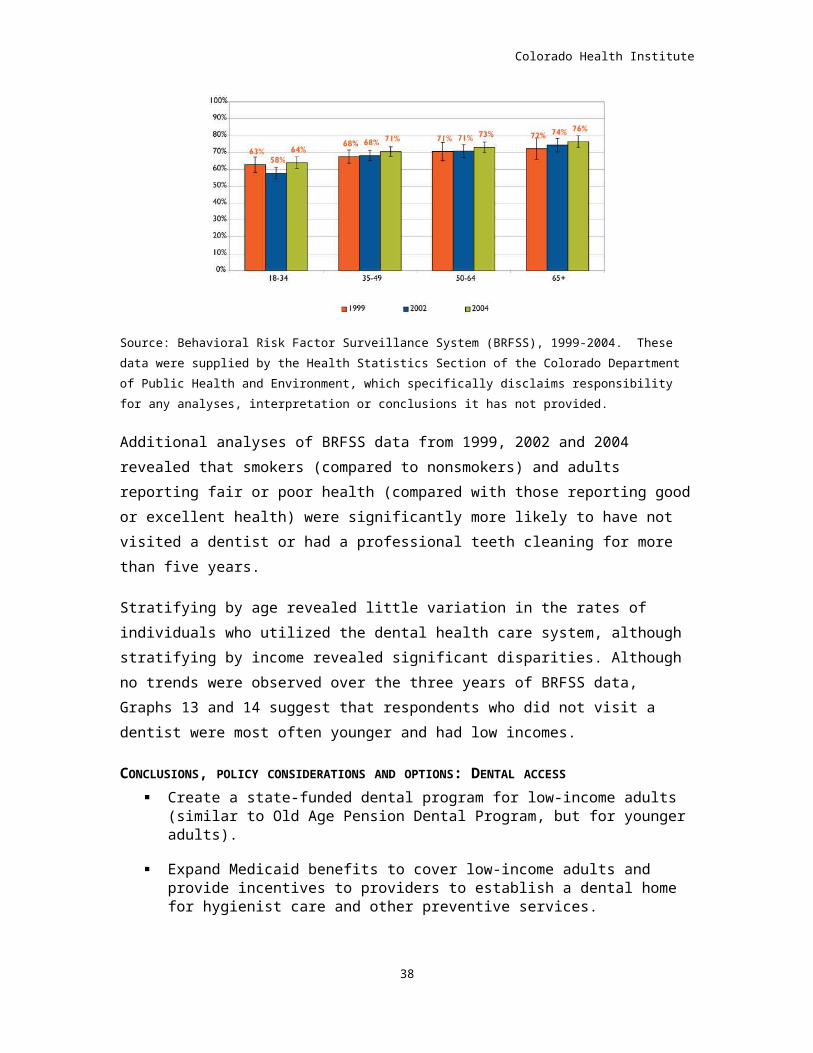
Similarly, no significant trends were observed between the three years of BRFSS data with regard to respondents receiving a professional teeth cleaning within the past year when stratified by age (Graph 14). Adults aged 18-34 had the lowest rate of teeth cleaning among the age groupings.
Graph 14: Received a dental cleaning in the past year, by age (Colorado, 1999-2004)
Source: Behavioral Risk Factor Surveillance System (BRFSS), 1999-2004. These data were supplied by the Health Statistics Section of the Colorado Department of Public Health and Environment, which specifically disclaims responsibility for any analyses, interpretation or conclusions it has not provided.
31
Colorado Health Institute
Additional analyses of BRFSS data from 1999, 2002 and 2004 revealed that smokers (compared to nonsmokers) and adults reporting fair or poor health (compared with those reporting good or excellent health) were significantly more likely to have not visited a dentist or had a professional teeth cleaning for more than five years.
Stratifying by age revealed little variation in the rates of individuals who utilized the dental health care system, although stratifying by income revealed significant disparities. Although no trends were observed over the three years of BRFSS data, Graphs 13 and 14 suggest that respondents who did not visit a dentist were most often younger and had low incomes.
CONCLUSIONS, POLICY CONSIDERATIONS AND OPTIONS: DENTAL ACCESS Create a state-funded dental program for low-income adults (similar to
Old Age Pension Dental Program, but for younger adults).
Expand Medicaid benefits to cover low-income adults and provide incentives to providers to establish a dental home for hygienist care and other preventive services.
The relationship between oral and general health and well-beingThe Surgeon General’s report on oral health points out that because oral and general health are provided in separate delivery systems, health care practitioners tend to focus on general health symptoms and treatment and leave oral and mental health to their professional colleagues in these fields. Research has found the following diseases have a potential link between oral and general health factors.
Dementia: Research regarding the prevalence of dementia in identical twins in Sweden was presented at the Alzheimer’s Association 2005 International Conference on Prevention of Dementia. The research found an association between periodontal disease early in life and dementia. They suggest this relationship is more powerful than genes. In fact, of the twins who were studied, those individuals who suffered from periodontal disease resulting in loose or lost teeth by age 35 experienced a fourfold increase in the risk of having dementia. 24 While the association between dementia and gum disease is not clearly understood, it is believed that chronic inflammation found in periodontal disease damages tissue, including brain tissue, and could be a factor in the development of dementia. Margaret Gatz, the study’s lead researcher, advises, “I would think of periodontal disease as a signpost,
24 Neergaard, L. June 20, 2005. “Brain Change Foretells Disease.” The Denver Post. 32
Colorado Health Institute
not a cause.”25 Rather, periodontal disease may be a marker for chronic exposure to disease which leads to an inflammatory response.26
Diabetes: According to the American Dental Association (ADA), diabetics tend to suffer disproportionately from tooth decay. This occurs when diabetes is not controlled and the high glucose levels in saliva allow bacteria to flourish, causing decay. In addition, because diabetes decreases resistance to infections, gums of diabetic patients are likely to be affected, thus increasing the risk of periodontal disease. As the ADA emphasizes, “patients with inadequate blood sugar control appear to develop periodontal disease more often and more severely, and they lose more teeth than persons who have good control of their diabetes.”27 Some researchers have suggested that not only are diabetic patients more at risk for periodontal disease, but also that individuals with periodontal disease are more likely to have problems with glycemic control which leads to diabetes.28
Bulimia Nervosa: Individuals with bulimia nervosa have been found to experience poor oral health outcomes. Because the human stomach contains acid needed to break down food for digestion, this acid reaches the mouth when vomiting occurs and subsequently damages tooth enamel. Teeth can become brittle and weak, and erosive lesions on the teeth may occur. The National Eating Disorders Association notes that close to 90 percent of bulimic patients experience tooth erosion.29 In fact, dentists and dental hygienists are often the first health care professionals who come in contact with bulimic patients because of oral health complications associated with the disease. Oral health professionals, however, often feel uncomfortable discussing the disease with their patients whom they suspect from suffer from bulimia.30 25 “Dental Signposts of Alzheimer’s.” Los Angeles Times. June 30, 2005. Available at http://www.azcentral.com/health/wellness/articles/0630teeth-alzheimers-ON.html (accessed August 31, 2005).26 “Dental Signposts of Alzheimer’s.” 27 American Dental Association. 2005. Diabetes and Your Oral Health. Available at http://www.ada.org/public/topics/diabetes_faq.asp#2 (accessed August 29, 2005). 28 DHHS. 2000. Oral Health in America: A Report of the Surgeon General.29 National Eating Disorders Association. 2005. Eating Concerns and Oral Health. Available at http://www.nationaleatingdisorders.org/p.asp?WebPage_ID=321&Profile_ID=69686 (accessed August 29, 2005). 30 National Eating Disorders Association. 2005. Dental Complications of Eating Disorders: Information for Dental Practitioners. Available at http://www.nationaleatingdisorders.org/p.asp?WebPage_ID=286&Profile_ID=73512 (downloaded August 29, 2005).
33
Colorado Health Institute
Cardiovascular Disease: Members of the American Academy of Periodontology have postulated several theories to explain an association between periodontal disease and cardiovascular disease.31 One theory is that the inflammation associated with periodontal disease leads to plaque build up and could lead to swelling of the arteries, resulting in cardiovascular disease. Another theory is that oral bacteria can attach to fatty plaque in the coronary arteries and lead to the creation of blood clots which can impede flow of blood to the heart and cause a heart attack.
Stroke: Several studies suggest that periodontal disease may increase the risk of stroke in the same way that it increases the risk of cardiovascular disease. As bacteria from infected gums circulate in the body, they may lead to an inflammatory response. In addition, periodontal pathogens may promote the formation of plaque that results in blockages and clotting. Results from a University of Buffalo study indicated that periodontitis was associated with a twofold increase in the risk for a non-hemorrhagic stroke.
In most cases, the postulated relationship between specific physical disease and oral complications is based on limited research. It is certainly an area of oral health that is emerging with greater emphasis and attention. In light of this increased attention, the following options are put forth for consideration.
CONCLUSIONS, POLICY CONSIDERATIONS AND OPTIONS: ORAL AND GENERAL HEALTH
Required or optional continuing medical education courses or curriculum content in undergraduate medical and dental education should be considered in evidence linking general and oral health and related clinical interventions.
Health and dental insurers and other third-party payers could consider providing incentives to dentists, dental hygienists and primary health care providers to coordinate care and treatment plans for those diseases and conditions for which a link between oral and general health has been established.
The use of referral networks with adequate follow up that ensures patients have both their oral and general health needs coordinated, ideally, through electronic medical records and interoperable electronic networks should be encouraged and funded.
31 American Academy of Periodontology. 2005. Heart Disease and Stroke. Available at http://www.perio.org/consumer/mbc.heart.htm (accessed September 1, 2005).
34

Colorado Health Institute
Dental insuranceDental insurance is a major instrument for ensuring access to dental care services. The 2000 U.S. Surgeon General’s report on oral health reported that approximately 85 million individuals in the United States had no dental insurance. As might be expected, those with dental insurance were more likely to utilize services. The report cited a 1992 published study that found approximately 70 percent of individuals with private dental insurance reported seeing a dentist within the past year, whereas only half (51%) of those without insurance saw a dentist.32 The Surgeon General’s report also noted that for every child without medical insurance, there are at least three children without dental insurance.
In addition, disparities in dental insurance coverage exist based on race, ethnicity, age, educational attainment and income. Nationally, whites (42%) and those with annual family incomes at or above $35,000 have the highest rates of dental coverage (61%), while Hispanics (30%), African Americans (32%) and individuals with fewer than nine years of education (14%) have the lowest rates.
How does Colorado compare? First, the most recent published findings on dental insurance come from the 2001 Colorado Household Survey (CHS) funded by the U.S. Department of Health and Human Services, Health Resource and Services Administration. CHS is the largest telephone survey of health coverage undertaken by the state. The survey contained one question regarding dental insurance coverage. Although CHI anticipates becoming the data steward for this database, we did not receive the file from the Division of Insurance in time to include its analysis in this report. We do know from previously published findings, however, that the survey found 70 percent of respondents under age 65 who reported having health insurance coverage also reported having dental coverage (Graph 15).33 Because private health and dental coverage are most often an employer benefit, this finding suggests that in Colorado a dental benefit is more often than not coupled with a health insurance benefit. In addition, although the Child Health Plan Plus (CHP+) program added a dental benefit in 2001, dental services long have been a benefit for children in the Colorado Medicaid program.
Graph 15: Dental coverage by health insurance status for persons under 65 years of age (Colorado, 2001)32 Oral Health in America. 2000.33 Office of the Governor. April 8, 2002. HRSA State Planning Grants, Interim Final Report to the Secretary.
35
Colorado Health Institute
Source: Colorado Household Survey, 2001
A CDPHE analysis of the 1997 BRFSS survey data found significantly fewer people in every age group above 18 years of age who had dental insurance as compared to medical insurance coverage.34 Notably, while virtually all individuals over 65 years of age are enrolled in and receiving health benefits through Medicare, only 30 percent of this population have dental insurance, a benefit not covered by Medicare.35
Despite differences in research time periods between state and national data, additional analyses of 1997 BRFSS data suggest similar findings to national estimates cited in the Surgeon General’s report. Of Colorado adults 18 years and older who reported having dental insurance, 76 percent said they saw a dentist within the past year, compared with 53 percent without dental insurance. The likelihood of having dental insurance increases with income, as significantly fewer individuals with annual household income below $15,000 have dental insurance (28%) than those with annual household income above $35,000 (70%). Graph 16 shows that people age 65 and older were significantly less likely to have dental insurance than people in other age groups.
Graph 16: Percent with dental insurance, by age (Colorado, 1997)34 The 1997 BRFSS oral health module included an item asking respondents whether they had dental coverage, and results of these data are presented below. CDPHE anticipates that the 2006 BRFSS will include the dental insurance question, allowing comparison between two time points.35 CDPHE, The Impact of Oral Disease on the Health of Coloradans, 2005
36
Colorado Health Institute
Source: Behavioral Risk Factor Surveillance System (BRFSS), 1997. These data were supplied by the Health Statistics Section of the Colorado Department of Public Health and Environment, which specifically disclaims responsibility for any analyses, interpretation or conclusions it has not provided.
Based on these 1997 findings, adults in Colorado without dental insurance tend to be sicker, older and poorer. Income and health status data were not adjusted for age, so one possible explanation is that the elderly (who tend to have lower incomes and greater health needs) make up the majority of the dentally uninsured. Another age group worth noting is young adults age 18 to 24, who have among the lowest rates of dental insurance (55%).36 This group generally does not qualify for public programs and are not as likely to have employer benefits as other age groups.
Another reasonable explanation is the cost of dental services. In 1997, 26 percent of Coloradans who did not see a dentist within the past year reported cost as being the major factor in not seeking care, second only to “no reason to go.” Of those who reported cost as being the primary reason, 58 percent had annual incomes under $25,000. Graph 17 shows that 54 percent of this group was between the ages of 18 and 34. In addition, individuals without dental insurance were most likely to report cost as the primary reason for not visiting a dentist (Graph 18).
Graph 17: Persons reporting cost as primary reason they did not see a dentist within the past year by age group (Colorado, 1997)
36 CDPHE, The Impact of Oral Disease on the Health of Coloradans. May 2005.37
Colorado Health Institute
Source: Behavioral Risk Factor Surveillance System (BRFSS), 1997. These data were supplied by the Health Statistics Section of the Colorado Department of Public Health and Environment, which specifically disclaims responsibility for any analyses, interpretation or conclusions it has not provided.
38
Colorado Health Institute
Graph 18: Proportion of people citing cost as the main reason for not visiting a dentist within past year, by dental insurance status (Colorado, BRFSS 1997)
Source: Behavioral Risk Factor Surveillance System (BRFSS), 1997. These data were supplied by the Health Statistics Section of the Colorado Department of Public Health and Environment, which specifically disclaims responsibility for any analyses, interpretation or conclusions it has not provided.
The most readily available data on the actual costs of dental care are available from the U.S. Medical Expenditure Panel survey (MEPS). Graph 19 displays the mean out-of-pocket expenses per person with a dental visit for five years.37 The U.S. and Western region (represented by trend lines) are shown alongside national average expenses by insurance status (private, public, or uninsured). Although the most recent data are from 2000, the graph shows a gradual upward trend in out-of-pocket expenses, with the United States and Western region reaching about $240 in 2000. Graph 19 also shows that the uninsured pay significantly higher out-of-pocket dental expenses than individuals with public or private insurance.
37 Brown E., and R. Manski. 2004. Dental Services: Use, Expenses and Source of Payment, 1996-2000. Rockville, MD: Agency for Healthcare Research and Quality. MEPS Research Findings No. 20. AHRQ Pub. No. 04-0018.
39
Colorado Health Institute
Graph 19: Dental services: Mean out-of-pocket expense per person with a dental visit by insurance status (U.S. and western states, 1996-2000)
Source: Medical Expenditure Panel Survey, 1996-2000** Western states include Montana, Idaho, Wyoming, Colorado, New Mexico, Arizona, Utah, Nevada, Washington, Oregon, California, Alaska, and Hawaii.
CONCLUSIONS, POLICY CONSIDERATIONS AND OPTIONS: DENTAL INSURANCE
Available data on dental health insurance are limited, dated and not currently state-specific. The following policy consideration relates primarily to this issue:
Assess dental insurance coverage in the state by adding a biannual question to the BRFSS survey about dental coverage.
Identify strategies for encouraging broader adoption of private dental insurance and including a dental benefit for adults in Medicaid.
40
Colorado Health Institute
III. Colorado oral health initiatives, programs and dental safety net clinicsA major objective of this environmental scan was to inventory the many public and private oral health initiatives undertaken in Colorado in recent years. During the course of our inventory, CHI identified a number of notable programs and the central role that dental safety net clinics play in preventing, identifying and treating dental disease in vulnerable populations. Thus, we expanded the scope of the scan to include an inventory of an expanded range of programs and providers.
Initiatives were initially conceptualized as dedicated funding streams for innovative oral health interventions. CHI intended to focus this inventory on oral health grants made by private philanthropy and publicly funded oral health initiatives. We quickly learned that grantmakers in Colorado were funding a broad range of agencies, organizations and clinics and that a more complete picture of the impact of these initiatives required inventorying the grantees they funded. We also learned that many of these initiatives also receive significant public dollars, most notably federal funds. Thus, the inventory was expanded to include initiatives, programs and the network of dental safety net clinics that operate across the state. CHI has defined a dental safety net clinic as a clinic whose mission and business model focuses on low-income uninsured, under-insured and publicly insured families and individuals.
The inventory fact sheets can be found in Appendix B. The fact sheets provide an initiative description, sources of funding, period of grant and populations served. Fact sheets are organized by funder and were compiled from Web sites, publications and key informant interviews. When possible, CHI staff interviewed knowledgeable individuals about each initiative.
The information gathered in the inventory presents an impressive picture of activities provided by public and private organizations to improve the oral health of low-income Coloradans. These efforts have been funded by Colorado’s philanthropic community and public resources. The efforts generally treat dental disease with an increasing emphasis on preventive-oriented dental interventions. This chapter summarizes findings gleaned from the inventory. Readers interested in a more detailed discussion of the individual initiatives are referred to Appendix B.
41
Colorado Health Institute
PRIVATE INITIATIVES: FROM ANTHEM TO CARING FOR COLORADOAnthem Blue Cross Blue Shield Foundation was a pioneer in identifying the seriousness of untreated dental disease among low-income children in Colorado and subsequently made a major financial commitment to both policy development and expanding services. More recently, the Caring for Colorado Foundation embarked on its largest single grant making commitment to date to improve the oral health of Coloradans through a five-year, $5 million Oral Health Improvement Initiative. In addition to these substantial funding initiatives, several other foundations have committed funding to support programs and clinic-based services. Section I.A of Appendix B contains fact sheets about foundation efforts and summarizes the details of their grant making activities in the area of oral health, including a list of grantees.
Anthem Blue Cross and Blue Shield FoundationThis foundation was an early underwriter of a number of important oral health initiatives in Colorado. Beginning in the late 1990s, the foundation identified unmet need for dental care among Colorado’s children as a major public health problem. To respond to this identified need, the foundation commissioned a number of studies, including Ensuring Shining Smiles for Colorado Kids.38 Additionally, it funded the Colorado Commission on Children’s Dental Health which developed nine policy recommendations, resulting in five related bills passed by the General Assembly.
Other dental health investments funded by the foundation included expanding dental services to low-income children in Mesa County at the Marillac Clinic that today serves both children and adults and is often cited as a model private, nonprofit dental safety net clinic. The Miles for Smiles program was also an early funded program of Kids in Need of Dentistry (KIND) funded by Anthem Blue Cross and Blue Shield Foundation.
In the late 1990s, the not-for-profit Blue Cross Blue Shield insurance company, which funded the foundation, received approval to convert to a private company with the corpus going to the Caring for Colorado Foundation. While Anthem has become less active in the oral health arena in recent years, it remains a major funder of the Miles for Smiles mobile dental clinic.
Caring for Colorado (CFC) FoundationCFC identified oral health as a significant area of unmet need early in its strategic planning process. In a series of community meetings held around 38 Buck, Beverly. May 2000. Ensuring Shining Smiles for Colorado Kids.
42
Colorado Health Institute
the state in 2000, participants consistently identified oral health as a serious area of unmet need. The CFC needs assessment report states:
In every community visited across Colorado, oral health issues were described as a top concern. Issues such as the lack of dental services for low-income people, inadequate facilities and equipment to provide dental care, dental professional shortages, insufficient financing and payment mechanisms for indigent dental care, and an overwhelming lack of prevention services were discussed repeatedly.
This led the CFC board to establish the Oral Health Improvement Initiative in 2001 with a five-year, $5 million funding commitment. Now in its fourth year, this initiative has funded twenty projects in urban and rural communities around the state. The funding has resulted in:
The construction or renovation of seven dental safety net clinics;
The purchase of 34 dental operatories for dental safety net clinics;
Nine new dental teams;
65,000 annual dental visits provided by dental safety net clinics;
15,000 children receiving oral health education and prevention services annually; and,
Ten care coordinators working to ensure access to dental care for underserved children and adults.
In addition to the five year, $5 million Oral Health Improvement Initiative, the Caring for Colorado Foundation made “responsive” oral health grants totaling over $2 million between 2001 and 2004. Responsive grants tend to be smaller and of shorter duration.
CFC’s Oral Health Improvement Initiative is by far the largest single source of private support for meeting the oral health needs of underserved children and adults in the state. At roughly 25 percent of its total giving, CFC may be devoting the largest single source of support to oral health than that of any U.S. health foundation.
HealthONE AllianceSince 2002, HealthONE Alliance has made 13 oral health grants totaling nearly one-half million dollars. Grantees include several safety net dental
43
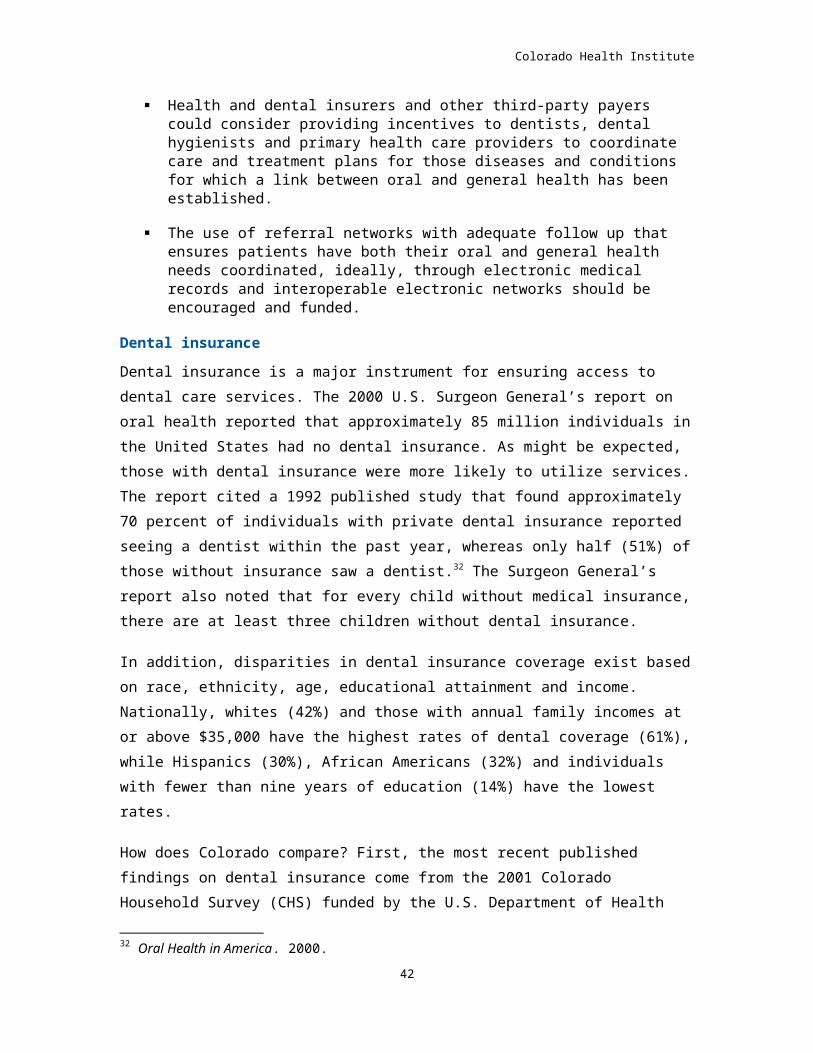
Colorado Health Institute
providers including the Howard Dental Center, Dental Aid, KIND and the Metro Community Provider Network. These grants have been used to equip a dental operatory in rural Colorado, extend the operations of the Miles for Smiles Mobile Dental Program, provide dental care to uninsured children and adults, and support the Chopper Topper program. In addition, HealthONE Alliance provided a planning grant to the Colorado Oral Health Network to help support a statewide Oral Health Summit.
The CHI inventory identified four other Colorado foundations that have each made oral health grants totaling more than $100,000 in the last few years. These are Delta Dental of Colorado Foundation, The Denver Foundation, The Colorado Trust and Rose Community Foundation.
Summary of private initiatives In the course of conducting this inventory, CHI documented an impressive outpouring of interest for supporting oral health initiatives by Colorado foundations beginning in the late 1990s and continuing through the first years of the current decade. This interest has propelled oral health to a higher level of visibility and funding within the state. The funding has now stabilized with grants averaging well over $1 million annually. These grants have enabled thousands of low-income Coloradans to gain access to preventive-oriented dental care and treatment services that have improved the oral health of the people served.
CHI does not have sufficiently detailed data to estimate the actual number of individuals receiving services from these initiatives or the net impact in terms of oral health status improvements resulting from the various initiatives. The absence of systematic evaluations of the initiatives makes it difficult to assess absolute reductions in the incidence of dental disease among served populations, although individual program initiatives have evaluation efforts under way to document the oral health achievements realized through their grant making efforts.
The foundation community may want to consider developing a systematic performance monitoring system that would provide uniform data and analysis with regard to the incidence and prevalence of dental disease among the vulnerable populations currently served by the grant making.
PUBLIC INITIATIVES AND PROGRAMSAs influential as private funding has been in elevating the importance of oral health status in Colorado, it is equally important to recognize the role of
44
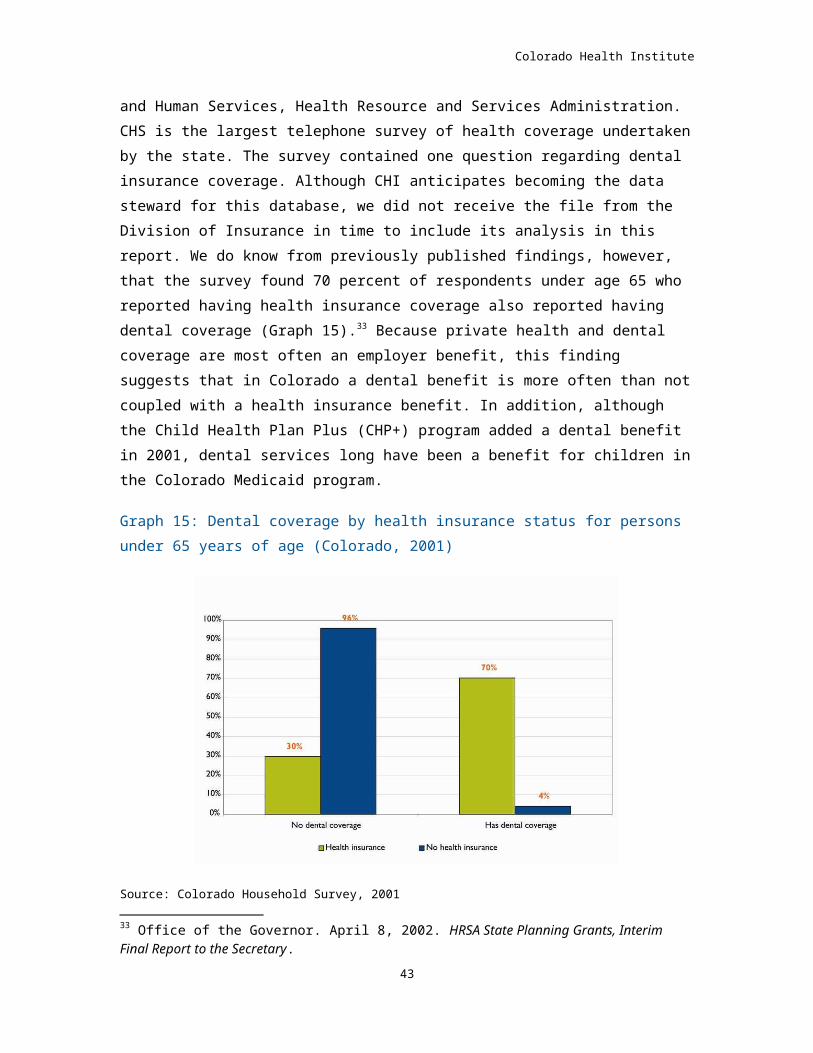
Colorado Health Institute
public funds and programs in enhancing the dental health status of vulnerable Coloradans. The largest single source of public funding for dental care among low-income children is the Medicaid program, which spent $39.2 million on dental care in FY 2003-04. Additionally, CHP+ spent $5.4 million in FY 2003-04. CHP+ has attracted recent attention both because it is a relatively new dental coverage program for low-income children and because it was recently proposed as the model for delivering dental care to all low-income children served by the Medicaid and CHP+ programs.
In addition to Medicaid and CHP+, both administered by the Department of Health Care Policy and Financing (HCPF), the Oral Health Program in the Department of Public Health and Environment (CDPHE) has played a significant and influential role in advancing public oral health policy. CDPHE has also played an important funding role for such public health initiatives as school-based dental sealant programs.
Colorado Commission on Children’s Dental Health In May 2000, Governor Bill Owens appointed a 19-member commission to study “a set of key public policy issues related to improving children’s oral health and to provide recommendations on how to improve the current system of dental care for Colorado’s children.”39 While the Commission on Children’s Dental Health had a broad mandate, a primary concern addressed was that Colorado was one of only three states to implement the new State Children’s Health Insurance Program (SCHIP) without a dental benefit. Meeting over a period of six months, the commission developed nine recommendations for improving the status of children’s oral health. Remarkably, these recommendations resulted in five successful legislative initiatives in the 2001 legislative session:
A dental benefit for the Child Health Plan Plus (CHP+);
A dental infrastructure grants program;
Addition of independent practice dental hygienists as Medicaid provider;
Addition of dentists and dental hygienists to the state income tax credit program for health professionals; and
39 Colorado Commission on Children’s Dental Health. 2001. Addressing the Crisis of Oral Health Access for Colorado’s Children.
45
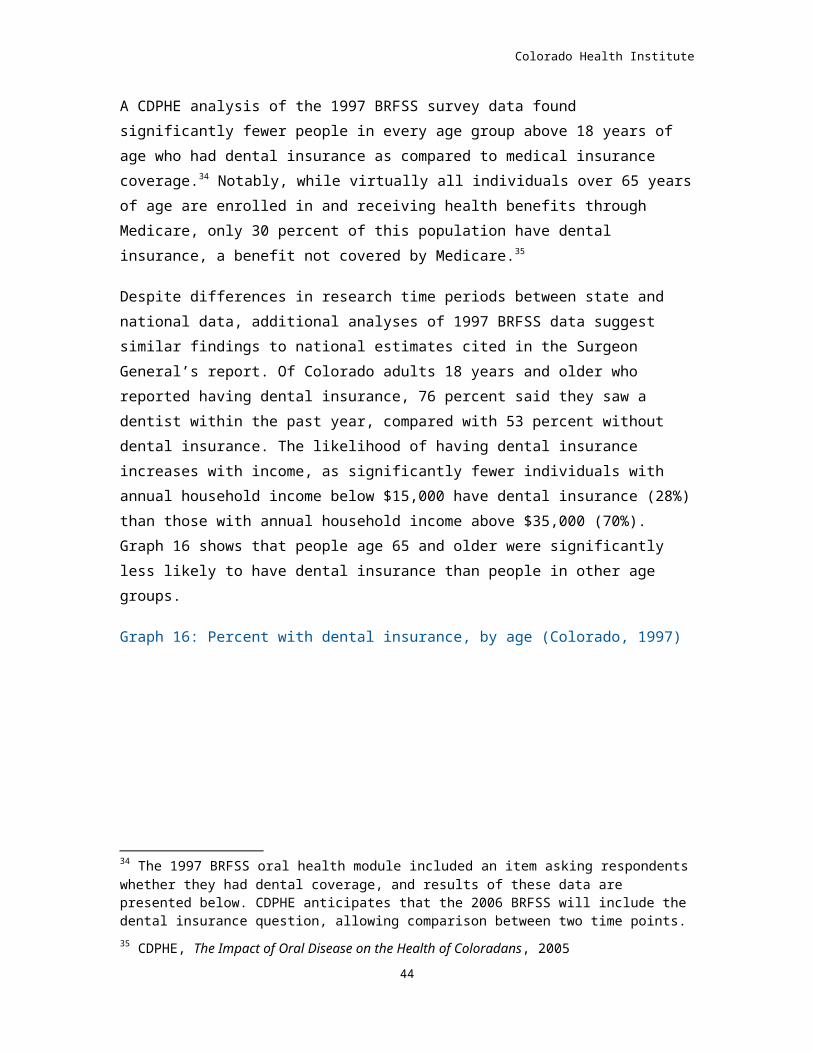
Colorado Health Institute
The creation of a dental loan repayment program for dentists and dental hygienists serving low-income populations.
Oral Health Awareness Colorado (OHAC)!Founded in 2003 to build on the work of the Colorado Commission on Children’s Dental Health, OHAC! is a coalition of professionals representing a wide range of public, private and nonprofit organizations interested in advancing oral health care in Colorado. Its mission is to develop and promote strategies that achieve optimal oral health for all Coloradans. OHAC activities focus on the following goals:
To reduce the burden of oral disease in Colorado;
To maximize preventive-oriented oral health practices;
To increase collaboration between oral health professionals and other health professionals; and
To change public perceptions about the importance of oral health.40
Colorado Oral Health PlanFollowing a statewide oral health summit held in November 2004, OHAC! members developed an action plan to focus on six topical areas that would improve the oral health of all Coloradans.41 The six areas included: dental care financing, dental health promotion, dental health policy development and advocacy, promising practices, systems of care and the dental health workforce. Each area includes several priority outcomes and strategies to be pursued, suggested partnerships, and suggested action steps. The state plan, developed with funds from the federal Health Resources and Services Administration (HRSA) and CDC, an agency within the U.S. Department of Health and Human Services, is consistent with recommendations put forth in the federal National Call to Action to Promote Oral Health from the Surgeon General’s office and also the Healthy People 2010 oral health goals.
CHP+ Dental Benefit Perhaps the most significant public oral health initiative in the last five years has been the addition of a dental benefit to the CHP+ program in 2002. Authorized by Congress in 1997 and implemented in Colorado in 1998, the 40 http://www.beasmartmouth.com/partners.php 41 Colorado Department of Public Health and Environment Oral Health Program. 2005. Smart Mouths, Healthy Bodies: An Action Plan to Improve the Oral Health of Coloradans.
46
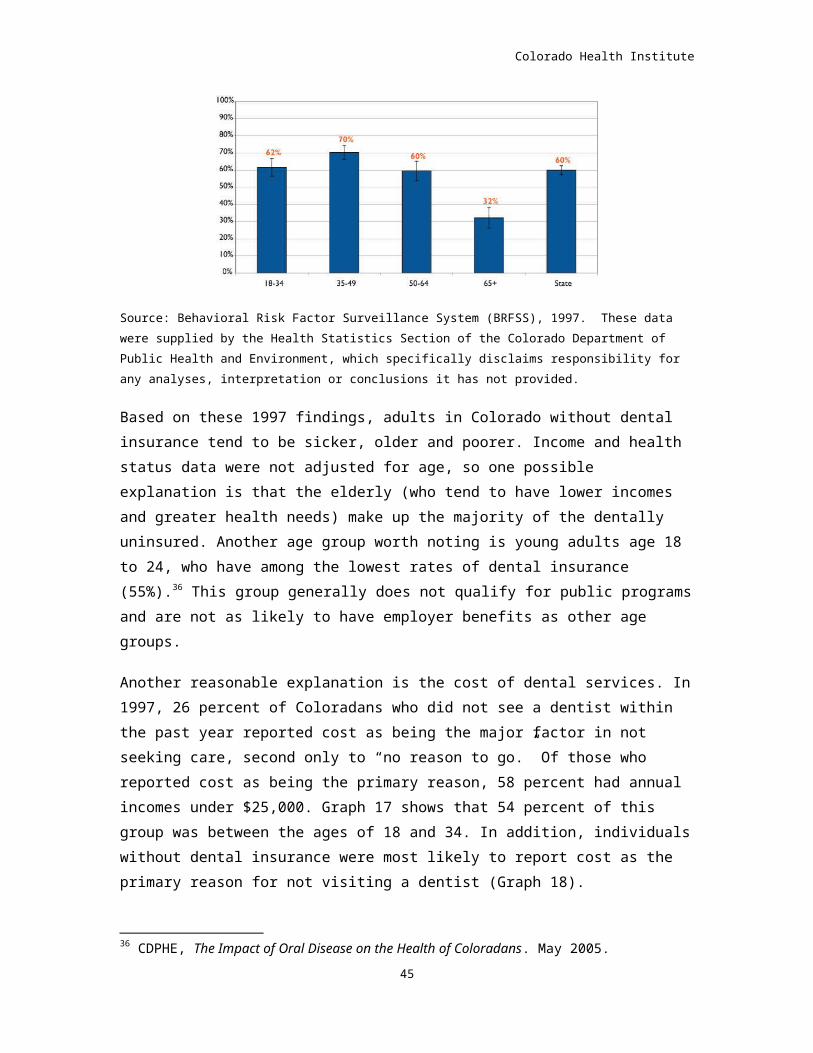
Colorado Health Institute
CHP+ program, known nationally as the State Child Health Insurance Program, or SCHIP, initially did not include a dental benefit. It had been originally modeled on a standard private health insurance plan for small employers which typically did not include a dental benefit.
A major recommendation of the Colorado Commission on Children’s Dental Health was to “design and implement the Child Health Plan Plus dental benefit package to be the same as the Medicaid dental package.” In FY 2001-02, HCPF received a legislative appropriation for a CHP+ managed care dental benefit with a $500 cap per calendar year per enrolled child. The federal government provides a 65 percent match for the funding for dental services, while the state pays the additional 35 percent.
HCPF contracted with the Delta Dental Plan of Colorado to provide a managed care dental benefit to CHP+ children. Covered benefits include preventive and diagnostic services, basic restorative services, oral surgery and endodontics care for children who are 18 years and younger. From the inception of the dental benefit through June 30, 2005, children who were at or below 185 percent of the federal poverty level were eligible for medical and dental services through the CHP+.42 With the passage of Amendment 35 in 2004, a tobacco tax increase initiative to fund health programs, children at or below 200 percent of the federal poverty level (FPL) are now eligible for CHP+. This eligibility expansion became effective on July 1, 2005.
The legislation implementing Amendment 35 also eliminated the asset test for Medicaid and increased funding for the marketing of CHP+. Elimination of the Medicaid asset test is expected to result in 15,063 children moving from CHP+ to Medicaid during FY 2005-06. The estimated net impact of the CHP+ eligibility expansion, increased marketing and removal of the Medicaid asset test is expected to result in a reduction of 7,301 children from the caseload growth.43
Families with incomes below 100 percent of FPL pay no co-payments for services. Families with incomes between 101-200 percent of FPL do not pay co-payments for preventive care services but do pay a co-payment of $5.00 (or less) for other services. Table 5 summarizes the funding levels for CHP+ dental program and average monthly enrollment, FY 2001-02 through FY 2005-06.
42 Because of the state’s fiscal situation, new enrollment in the program was temporarily suspended between November 2003 and June 30, 2004. 43 Joint Budget Committee. July 2006. FY 2005-06 Appropriations Report, p. 101.
47
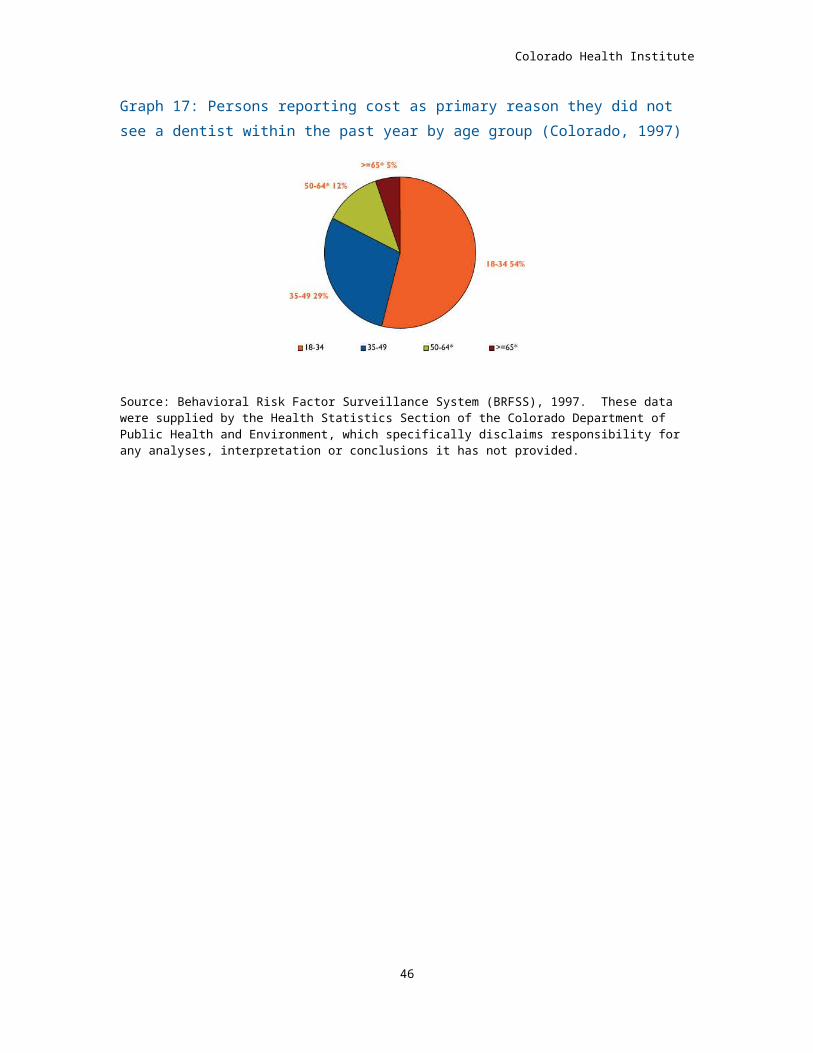
Colorado Health Institute
Table 5: Annual average monthly CHP+ enrollment and dental expenditures FY 2001-02 through FY 2005-06
FY 2001-
02
FY 2002-03
FY 2003-04
FY 2004-05 (appropriati
on)
FY 2005-06 (appropriati
on)
Annual CHP+ dental funding44
$2.0(mil)
$5.6(mil)
$5.4(mil)
$5.6(mil)
$5.5(mil)
CHP + average monthly enrollment45
,46
39,843
49,216 47,125 47,884 43,094
Unlike Medicaid, standardized federal reports that document the volume and types of dental services provided throughout the year are not required for CHP+. According to an analysis undertaken by the University of Colorado School of Dentistry, however, in the initial year of the CHP+ dental benefit (February 2002 through January 2003), 34 percent of enrolled CHP+ children received a dental care service.47 For comparative purposes, according to information provided to HCPF by the Colorado Dental Association, the utilization rate of children who have access to commercial dental insurance plans is approximately 55 percent.48 CHP+ utilization is influenced by the broad network of dental providers in the CHP+ managed care network. There are, however, rural areas of the state with no CHP+ dental providers.49
While procedures performed on CHP+ children tend to be less intensive than those billed to Medicaid, the reimbursement rates are generally higher. Table 6 compares the reimbursement rates between the two programs for the top 44 Joint Budget Committee. July 2006. FY 2005-06 Appropriations Report, p.101. Funding amounts for FY 2004-05 and FY 2005-06 are based on appropriations. 45 Joint Budget Committee. July 2006. FY 2005-06 Appropriations Report, p. 101. 46 Average monthly enrollment represents the monthly average enrollment of children in the program throughout the year. It does not represent the number of children in the dental program. 47 Mathematica, Policy Research, Inc. November 16, 2004. SCHIP Takes a Bite Out of the Dental Access Gap for Low-Income Children. p. 7.48 Department of Health Care Policy and Financing. June 30, 1999. Medicaid Dental Program Services Legislative Report, p. 1.49 CHI key informant interview, August 15, 2005.
48
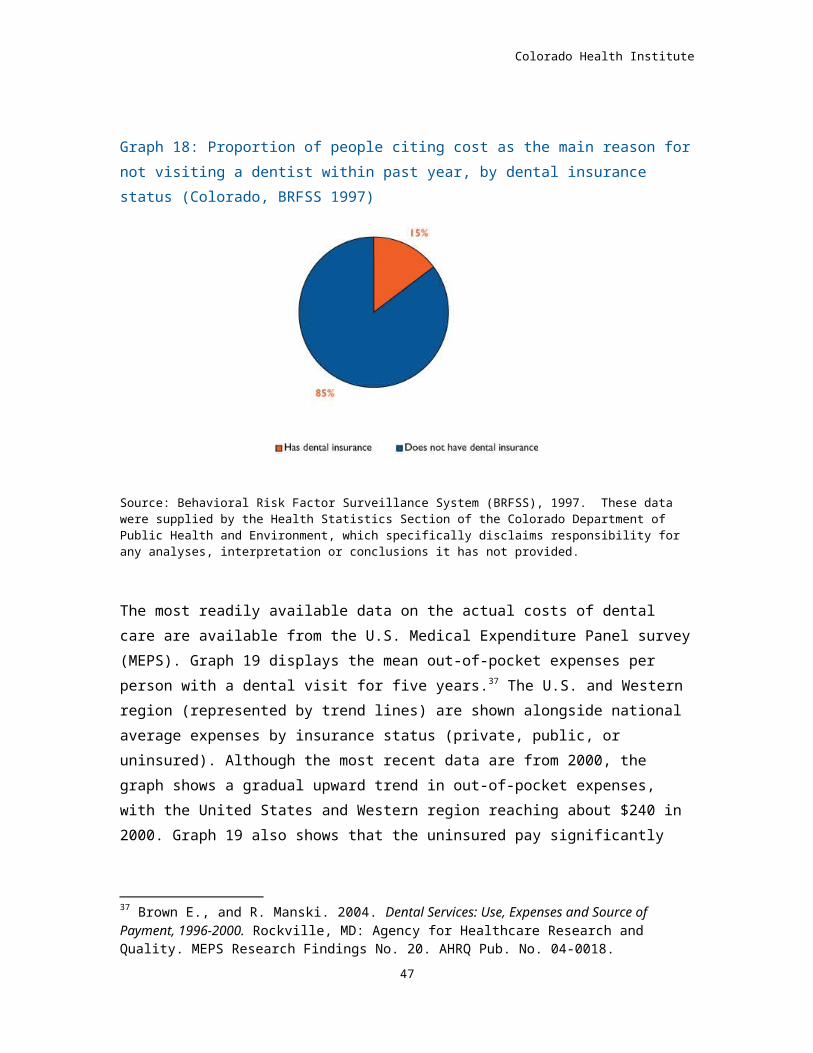
Colorado Health Institute
10 procedures that account for half of all Medicaid pediatric dental spending.50
Table 6: Comparison of CHP+ and Medicaid reimbursement rates (Regions 1 and 2), 2005.51
Procedure Code
Procedure
CHP+ Reimburse-ment rate Region 1
CHP+ Reimburse-ment
rate Region 2
Medicaid Reimburse-ment
rate
CHP+ (Region
1) as a % of
Medicaid
CHP+ (Region 2) as a % of
Medicaid
D 2930
Prefabricated
stainless steel
crown - primary
tooth $161 $130 $96 168% 135%
D 1201
Topical fluoride
application (incl.
prophylaxis) $45 $42 $39 115% 108%
D 2140
Amalgam-one
surface, primary or permanen
t $95 $82 $44 216% 186%
D 2391
Resin-based
composite, one
surface, posterior $102 $93 $53 192% 175%
50 Children’s Dental Health Project. June 15, 2005. Dental Benefits in the Medicaid/CHP+ Streamlining HIFA Waiver, p. 3.51 Delta Dental Plan of Colorado (2005). Delta Preferred Option (DPO) Schedule of Allowances.
49

Colorado Health Institute
Procedure Code
Procedure
CHP+ Reimburse-ment rate Region 1
CHP+ Reimburse-ment
rate Region 2
Medicaid Reimburse-ment
rate
CHP+ (Region
1) as a % of
Medicaid
CHP+ (Region 2) as a % of
Medicaid
D 3220
Therapeutic
pulpotomy $98 $75 $60 163% 125%
D 7140
Extraction, erupted tooth or exposed
root $77 $70 $50 154% 140%
D 0272Bitewings-two films $25 $23 $16 156% 144%
D 2150
Amalgam-two
surfaces, primary or permanen
t $124 $107 $55 225% 195%
D 0120
Periodic oral
evaluation $26 $24 $17 153% 141%
D 0150Comp. oral evaluation $41 $37 $26 158% 142%
Each child enrolled in CHP+ is eligible for dental health services that total up to $500 in each calendar year. In 2003, Delta Dental of Colorado provided $75,000 of services for children who exceeded the annual cap. In addition, Delta Dental of Colorado received a $50,000 grant from the Horwich Foundation and the Mile High United Way to offer care above the cap for these children. Children who need services in excess of the cap can also receive dental care through Smile-a-bration, a one-day program of free dental care for children sponsored by Delta Dental of Colorado. Because Smile-a-bration occurs in April, if a child reaches the cap after April, he or she would need to wait until January of the following year when $500 in new services
50
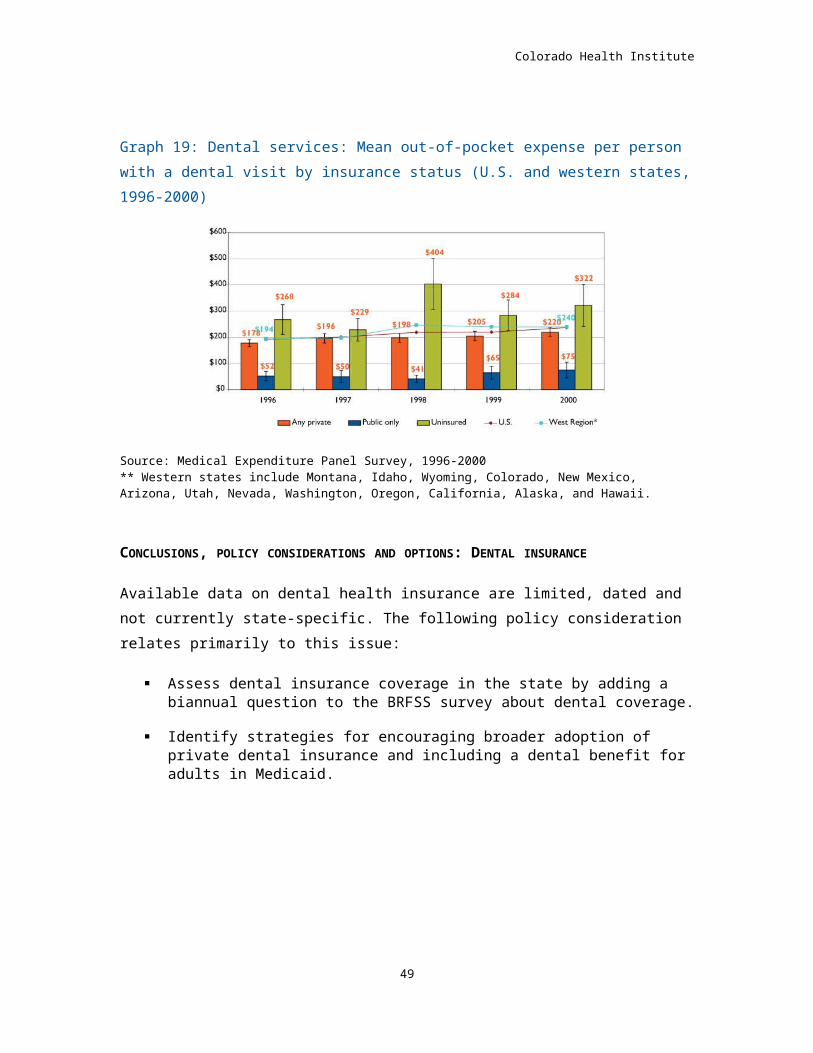
Colorado Health Institute
would be available or the following April to receive additional services through Smile-a-bration.
Based on information from key informants in dental safety net clinics, the $500 annual CHP+ dental services cap has resulted in some children not being able to complete needed dental treatment during a calendar year. Safety net and nonprofit clinics report that they attempt to fund dental needs above the $500 threshold with grant funding or by writing off the charges. In many cases, however, this is not possible and treatment remains incomplete. The CHP+ cap has been fixed since the inception of the program and is not indexed to inflation. As the Children’s Dental Health Project notes, “Experience in multiple states substantiates that failure to index dental fees and the annual cap to inflation results in rapid erosion of provider participation as the value of these dollar amounts diminishes over time.”52 As provider rates for CHP+ services have increased, the $500 cap remains constant, resulting in fewer services provided.
Policy considerations and options: Recommend that HCPF explore alternative provider options for CHP+
children living in rural communities that lack access to a network provider;
Investigate the feasibility of funding alternatives for children who reach the $500 cap;
Increase the $500 cap to reduce the number of children with incomplete treatment needs; and
Index the $500 cap to annual inflation and adjust it for provider rate increases so that the value of the cap is not eroded.
THE MEDICAID DENTAL BENEFIT
Children: eligibility and benefits Early Periodic Screening, Diagnosis and Treatment (EPSDT) services, which include periodic screening, vision, hearing and dental services, are required for all children under age 21 enrolled in Medicaid. Colorado EPSDT requires that children receive a dental exam once every six months, starting at least
52 Children’s Dental Health Project. June 15, 2005. Dental Benefits in the Medicaid/CHP+ Streamlining HIFA Waiver.
51
Colorado Health Institute
by age 1 year. Dental services must include the relief of pain and infections, restoration of teeth and maintenance of dental health.53
Children are eligible for Medicaid and thus the dental health care benefit if they are under the age of 6 years and have family incomes below 133 percent of FPL or if they are between 6 and 19 years old and have family incomes below 100 percent of FPL. Youth up to 20 years of age and in state-sponsored adoption assistance programs or foster care, and children with disabilities who qualify for SSI also are eligible to received dental benefits.
Dental services for children comprise the majority of the dental care expenditures in Medicaid. This is because, unlike adults, children enrolled in Medicaid have access to a comprehensive range of dental services. The primary dental benefits for children include: clinical oral evaluations, radiographs, dental prophylaxis, fluoride treatments, space maintainers, amalgams, resin-based composites, crowns, root canal therapy, prosthetics, oral surgery and, in some cases, orthodontics.54
Adults: eligibility and benefitsThere is a range of Medicaid eligibility categories for which adults qualify based on their income, assets, disability status and age. Adults in the Medicaid program, however, are only eligible for dental services if there is a medical necessity based on a concurrent medical condition that necessitates providing dental treatment. Concurrent medical conditions include:55
Infection or fracture of an oral facial structure;
Accident or trauma to an oral facial structure;
Disorder of temporomandibular structure;
Mental retardation, severe mental condition;
Physical handicap;
Pregnancy;
Suppressed immune system; 53 Centers for Medicare and Medicaid Services. Medicaid and EPSDT. Available at http://www.cms.hhs.gov/medicaid/epsdt/default.asp (accessed August 25, 2005). 54 Orthodontic treatment is available only to children who quality as having a handicapping malocclusion.55 Medical Assistance Program Bulletin, B0400189, December 2004, p. 11.
52
Colorado Health Institute
Chemotherapy for cancer;
Organ transplant; and
Other major medical conditions.
Dental caries, periodontal disease and tooth fractures are not considered concurrent conditions under Medicaid rules.56 According to HCPF, there is a proposed “Treatment of Oral Medical Conditions for Adults” rule scheduled to be considered at the December 2005 Medical Services Board Meeting. If passed, this rule would clarify that the adult dental benefit is a medical benefit and would limit the approved concurrent medical conditions.
Non-citizen Medicaid-eligible adults may only receive dental care in the case of an emergency situation. According to Medicaid guidelines, “A dental emergency exists when a non-citizen presents with pain, infection, fracture or trauma of an oral facial structure. Preventative, restorative, endodontic, periodontal and prosthetic care is not a benefit for non-citizen clients under any circumstances.”57
EXPENDITURES FOR MEDICAID DENTAL SERVICES58 59
The federal government matches Colorado’s expenditures on Medicaid dental services at a 50/50 match rate. For every one dollar the state spends on Medicaid dental health services, the federal government matches it with an additional dollar. Each state’s federal match is based on the average per-capita income of its population. As a relatively high per-capita income state, Colorado and a number of other states receive the minimum federal match rate allowable under Medicaid, which is 50 percent. 56 Colorado Medical Assistance Program, April 2004. Dental Services Manual. Available at http://www.chcpf.state.co.us/ACS/Pdf_Bin/Dental_081204.pdf (accessed August 30, 2005). 57 Medical Assistance Program Bulletin, B0400189, December 2004, p. 15. 58 Colorado Department of Health Care Policy and Financing. February 15, 2005. Final Request for Medicaid Premiums, pp. ES2-ES17.59 For the purposes of the following discussion, “elderly” refers to Medicaid clients in the Old Age Pension A (65+) category, Qualified Medicare Beneficiaries (QMBs) and Specified Low-income Medicare Beneficiaries (SLMBs). “Low-income adults” refers to adults who have incomes below 36 percent of the FPL or pregnant women with incomes below 133 percent of the FPL. “Low-income children” refers to children between 6-19 years with family incomes up to 100 percent of the FPL and children 5 and under with family incomes below 133 percent of the FPL. “Disabled” refers to clients in the AND/SSI and Old Age Pension B (ages 60 – 64) categories. Due to the Medicaid budgeting system, disabled children who are in the AND/SSI category are counted as disabled, not children.
53
Colorado Health Institute
Expenditures for Medicaid services in Colorado have been increasing rapidly since FY 1995-96. While Medicaid dental expenditures were $6.3 million in FY 1995-96, they increased to $39.2 million in FY 2003-04. The largest percentage increase in expenditures occurred in FY 1998-1999 when expenditures increased from $7.2 million to $13.3 million (an 85% increase). Not surprisingly, FY 1998-99 is the same year that reimbursement rates for dental services increased from 50 to 65 percent of the American Dental Association’s (ADA) mean for the mountain region.60
The second largest percentage increase in expenditures occurred in FY 1999-2000 when expenditures increased from $13.3 million to $18.4 million (a 38% increase). This increase reflects the second rate increase from 65 to 68 percent of the ADA mean that occurred in FY 1999-2000. While total expenditures for children’s dental care services leveled off in FY 2003-04, from 1997-98 to FY 2002-03, in total they increased by 317 percent.
60 The American Dental Association conducts a survey of dental fees by region. Colorado calculates its reimbursement rates off of the calculated mean from the ADA survey of the mountain region. In Colorado, however, Medicaid’s rates for oral health are not re-calibrated as the mean changes every year.
54
Colorado Health Institute
Graph 20: Annual cost of Medicaid dental services, by eligibility, FY 1995-96 through FY 2003-04
Source: HCPF Request for Medical Premiums, Feb. 15, 2005.
Graph 21 illustrates the annual percentage change in Medicaid dental expenditures relative to Medicaid medical services expenditures. In almost every year, dental care expenditures have increased at a higher rate than those of medical services.
Graph 21: Annual percentage change in dental and Medicaid services premiums, FY 1996-97 through FY 2003-04
55
Colorado Health Institute
Source: HCPF Request for Medical Premiums, Feb. 15, 2005.
In recent years, children’s dental care expenditures as a percentage of the total expenditures for dental services have been decreasing. For example, in FY 1995-96, expenditures for children’s services were $5.4 million or 86 percent of total dental expenditures. This percentage decreased to 78 percent in FY 2000-01 and 70 percent in FY 2003-04. Conversely, expenditures for disabled populations increased from 8 percent of total expenditures in FY 1995-96 to 15 percent in FY 2003-04.
PER- CAPITA COSTS To account for caseload changes, it is useful to analyze per-capita dental care expenditures by eligibility group. Graph 22 illustrates the per-capita expenditures for dental services between FY 1995-96 and FY 2003-04.
Graph 22: Cost per capita, by eligibility, FY 1995-96 through FY 2003-04
Source: HCPF Request for Medical Premiums, Feb. 15, 2005.
The per-capita costs of children’s dental services represent a general upward trend from $44 in FY 1995-96 to $133 in FY 2003-04. Between FY 2002-03 and FY 2003-04, however, the average per-capita cost per child actually decreased from $148 to $133.
While children consistently have the highest per-capita costs for dental care, the per-capita costs for the disabled and elderly also have increased significantly in recent years. The average per-capita cost for a disabled enrollee increased from $55 in FY 2002-03 to $114 in FY 2003-04; while the per-capita cost for a 65+ enrollee increased from $19 in FY 2002-03 to $55 in FY 2003-04.
56
Colorado Health Institute
Medicaid dental care reimbursement rates As previously noted, reimbursement rates were increased to 65 percent of the ADA mean, and in 1998-99 and from 65 to 68 percent in 1999-2000. Likely because of declines in state revenues, further fee increases have not occurred and reimbursement for Medicaid dental services has remained at the same level since FY 1999-2000.
The impact of provider rate increases since 1998 has been assessed and includes the following:
After dental fees increased, the number of dentists enrolling as Medicaid providers increased by 14 percent between July 1999 and December 2000. It is important to note, though, that a dentist can be enrolled as a Medicaid provider without actually providing a dental health service.61
During the same time period, the number of enrolled dentists who actually provided services to Medicaid eligible clients decreased by five percent.62
As noted earlier, when fees first increased in FY 1998-99, dental care expenditures increased by 85 percent; when fees increased again in FY 1999-00, expenditures increased by an additional 38 percent.
There was a net decline in the number of dentists providing services, therefore expenditure increases were likely the result of substantially higher per-capita costs for dental services.
Despite the increases in Medicaid dental fees implemented in Colorado in the late 1990s, fees are still substantially less than those recommended by the Colorado Dental Association (CDA) (68% versus 80% of the ADA mean). In addition, because fees were set at 68 percent of the ADA mean in FY 1999-2000, and the ADA mean increases annually, 2005 fees do not reflect current dollars. Table 7, published by the American Dental Association, summarizes the Medicaid fees paid by Colorado Medicaid for 15 dental care services and compares these fees with the ADA Mountain region‘s 50th percentile in 2003.63 61 Colorado Department of Health Care Policy and Financing. (HCPF). January 2002. 62 HCPF, January 2002. 63 American Dental Association. “Colorado Medicaid/SCHIP Dental Care for Children: Overview,” State Innovations to Improve Access to Oral Health Care for Low-Income Children and Compendium Update, Available at http://www.ada.org (accessed June
57
Colorado Health Institute
Table 7: Colorado 2005 Medicaid fees, 2003 mountain region 50th percentile fees, and 2003 Colorado 50th percentile fees64
Procedure Code (CDT4)
Procedure Description
Colorado Medicaid
fees, 200565 ($)
Mountain region median
fees, 200366
($)
Colorado 50th percentile,20
0367 ($)
Diagnostic Services
D0120 Periodic Oral Exam $17 $31 $33
D0150 Comprehensive Oral Exam
26 44 45
D0210 Complete X-rays with bitewings
48 82 90
D0272 Bitewing X-rays – 2 films
16 27 30
DO330 Panoramic x-ray film 43 69 75
Preventive Services
D1120 Prophylaxis $26 $45 $46
22, 2005). 64 2003 is the most recent year for which the ADA Survey of Dental Fees is available. Thus, in 2005, the Mountain Region Median fees and the Colorado 50th percentile fees are likely higher. 65 Provided by the Department of Health Care Policy and Financing, August 24, 2005. 66 American Dental Association, 2004. State Innovations to Improve Access to Oral Heath Care for Low-Income Children and Compendium Update, Colorado: Medicaid/SCHIP Dental Care for Children, p.3. Available at www.ada.org (accessed June 22, 2005) 67 Ibid.
58
Colorado Health Institute
Procedure Code (CDT4)
Procedure Description
Colorado Medicaid
fees, 2005
($)
Mountain region median
fees, 2003
($)
Colorado 50th percentile,20
03 ($)
(cleaning)
D1203 Topical fluoride (excluding cleaning)
13 20 23
D1351 Dental sealant 18 32 35
Restorative Services
D2150 Amalgam, two surfaces, permanent tooth
$55 $88 $100
D2331 Resin composite, two surfaces, anterior tooth
71 115 134
D2751 Crown, porcelain fused to base metal
382 598
D2930 Prefabricated steel crown, primary tooth
95 159 150
Endodontics
D3220 Removal of tooth pulp $60 $95 $90
D3310 Anterior Endodontic therapy
243 402 488
59
Colorado Health Institute
Procedure Code (CDT4)
Procedure Description
Colorado Medicaid
fees, 2005
($)
Mountain region median
fees, 2003
($)
Colorado 50th percentile,20
03 ($)
Oral surgery
D7140 Extraction, single tooth
$50 $82 $85
Utilization of dental care services by Medicaid children Despite ESPDT requirements regarding dental services, dental utilization among children enrolled in Medicaid remains relatively low. Graph 23 summarizes utilization rates for all children (regardless of eligibility group) who used any service between 2001 and 2004. It is important to note that the expenditure and utilization figures do not include services provided by Federally Qualified Health Centers (FQHCs). FQHCs are paid a visit fee per client and therefore are not included in the claims used for this analysis.
Graph 23: Total percentage of Medicaid children who received any dental services, 2001-04
Source: CMS 416 reports.
Between 2001 and 2004, children’s utilization for any dental services reached its peak at 34 percent in 2003, but subsequently dropped to 30 percent in
60
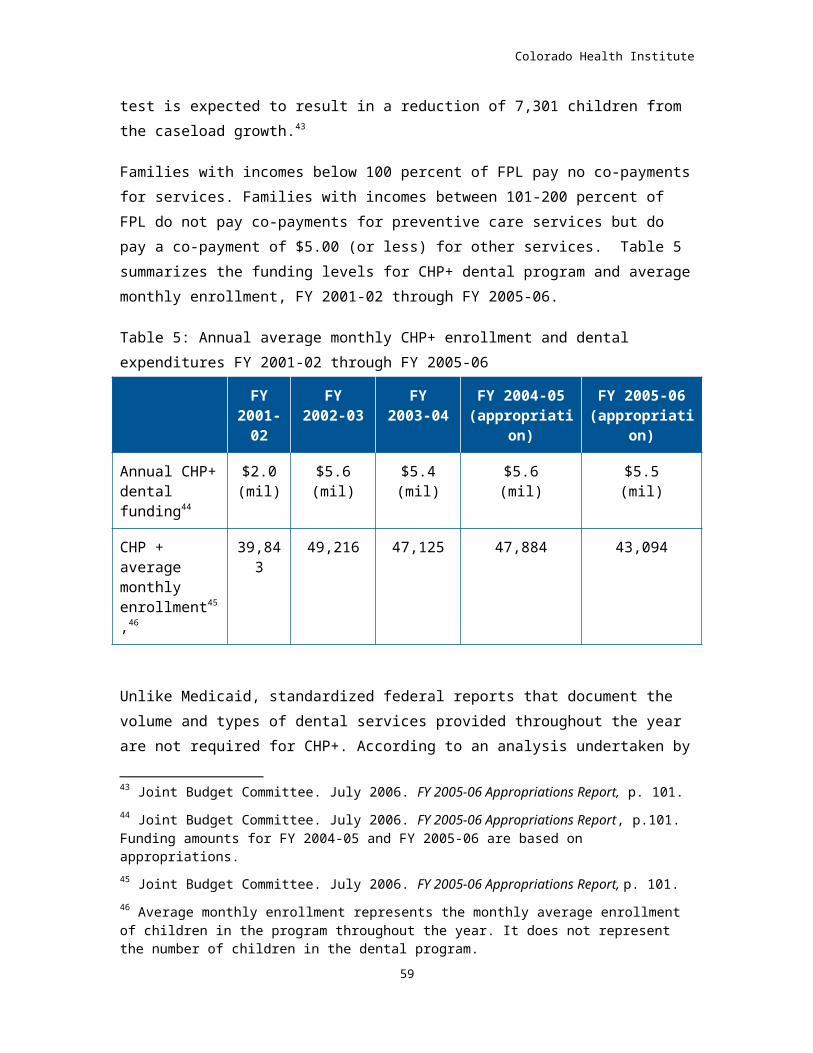
Colorado Health Institute
2004. For comparative purposes, the utilization rate of children who have access to commercial dental insurance plans is approximately 55 percent, according to information provided to HCPF by the CDA.68
68 HCPF. June 30, 1999. Medicaid Dental Program Services Legislative Report, p. 1.61
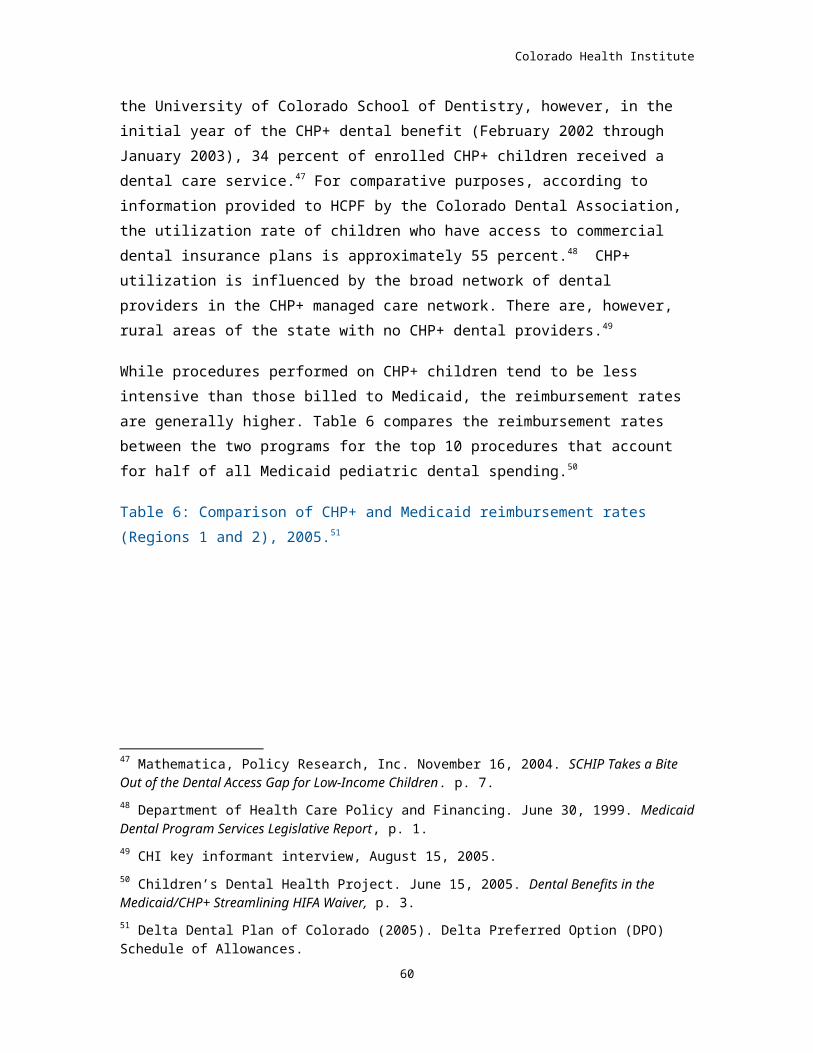
Colorado Health Institute
Graph 24: Percentage of Medicaid children who received preventive dental services, 2001-2004
Source: CMS 416 reports.
Utilization of preventive services increased from 21 percent in 2001 to 28 percent in 2003. In each year analyzed, utilization of preventive services was highest in the age group comprising 6-9 year-olds. Between 2001 and 2004, use of preventive services within this age group increased from 33 to 44 percent. Utilization of preventive services for children between 12 months and 2 years increased from 5 to 10 percent over the time frame analyzed. Less than 0.2 percent of eligible infants under the age of 12 months received a preventive dental visit in 2004. According to research conducted by the Children’s Dental Health Project, “Low-income children who have their first preventive dental visit by age one are not only less likely to have subsequent restorative or emergency room visits, but their average dentally related costs are almost 40 percent lower ($263 compared to $447) over a five-year period than children who receive their first preventive visit after age one.”69
Low provider participation in Medicaid In an issue brief of the National Conference of State Legislatures (NCSL), Colorado was noted as one of five states with fewer than10 percent of dentists billing for at least $10,000 in Medicaid dental services, a benchmark used to determine whether a dentist is a regular Medicaid provider. In Colorado, only 5 percent of dentists are at this benchmark.70
69 Savage, M., et al. 2004. “Early Preventive Dental Visits: Effects on Subsequent Utilization and Costs.” Pediatrics 114:418-23. As cited by the Children’s Dental Health Project. Cost Effectiveness of Preventive Dental Services. Available at http://www.cdhp.org/ (accessed August 23, 2005).
62
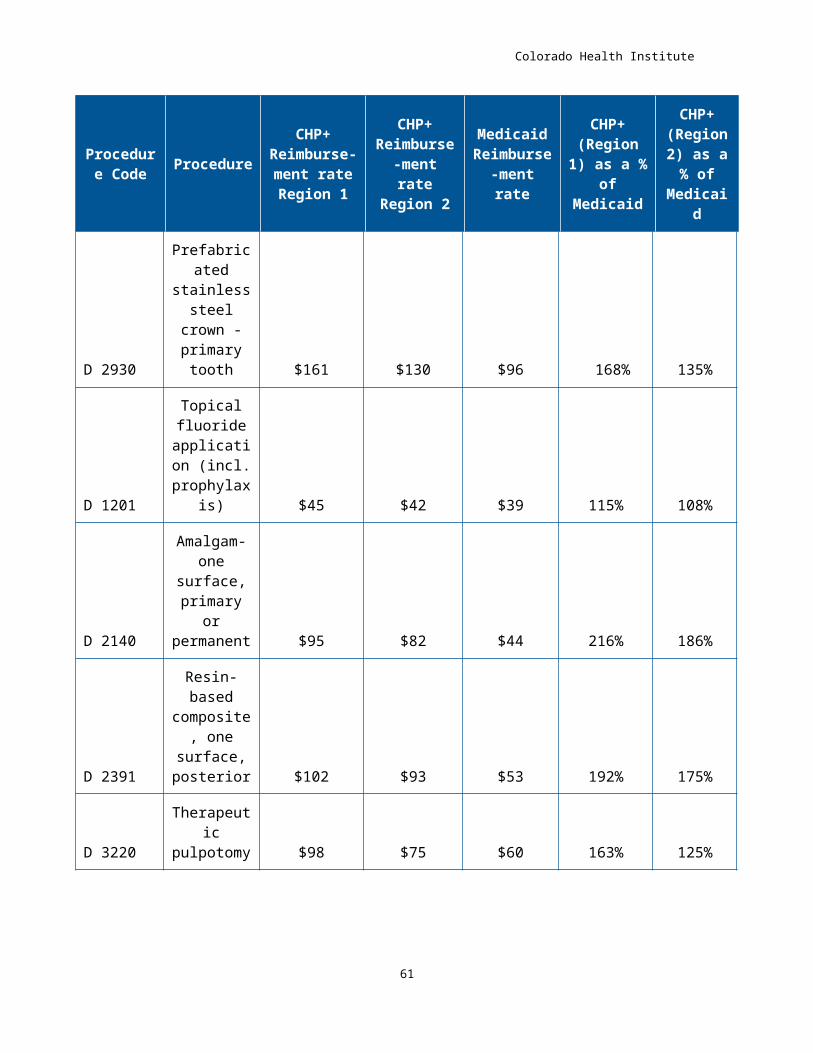
Colorado Health Institute
An interview with a representative of the CDA noted that low Medicaid reimbursement levels are the primary reason fewer dentists in Colorado see Medicaid clients. According to the spokesperson, Medicaid payments do not cover dentists’ overhead costs. Another reason cited was the high no-show rate for dental appointments by Medicaid clients (CDA data set this rate at 37 percent). The CDA conducted a survey of its members that validated these concerns from the dental community. 71 An article by Mahyar Mofidi notes the same frustrations on a national level. He notes that the “three major reasons for their [dentists’] lack of participation in the Medicaid program [are]: low reimbursement rates, broken appointments and patient noncompliance, and burdensome paperwork.”72
Another author confirmed Mofidi’s findings from the patient or caregiver’s point of view. Access barriers, including difficulty finding a provider, appointment scheduling and inconvenient or unreliable transportation to dental appointments all contribute to low utilization of the dental benefit. The quality of a patient’s dental care experience is affected by excessive wait times, demeaning interactions with front office staff, negative interactions with dentists and perceived discrimination based on Medicaid status.73 The author concluded that dissatisfaction of both dentists and Medicaid patients serve to deter both provider and patient participation. Other authors add that a lack of cultural competency contributes to this mutual dissatisfaction.
An Alabama dental task force made a series of recommendations to improve dentist participation in its Medicaid program. These recommendations included: simplifying the prior authorization process, adding coverage for procedures that were previously not covered, seeking a target reimbursement rate, clarifying program limits with revisions in the Dental Providers Billing Manual, and making targeted care management available to decrease the no-show rate of patients.
70 Gehshan, S., et al. 2001. “Increasing Dentists’ Participation in Medicaid and SCHIP.” National Conference of State Legislatures Promising Practices Issue Brief: Forum for State Health Policy Leadership, pp. 5-6.
71 HCPF. June 30, 1999. Medicaid Dental Program Services Legislative Report, p. 2.72 Mofidi, M., et al. 2002. “Problems With Access to Dental Care for Medicaid-Insured Children: What Caregivers Think.” American Journal of Public Health 92(1):53.73 Portnof, J. February 2004. “Medicaid Children: A Vulnerable Cohort.” Pediatric Dentistry Issue p. 24
63
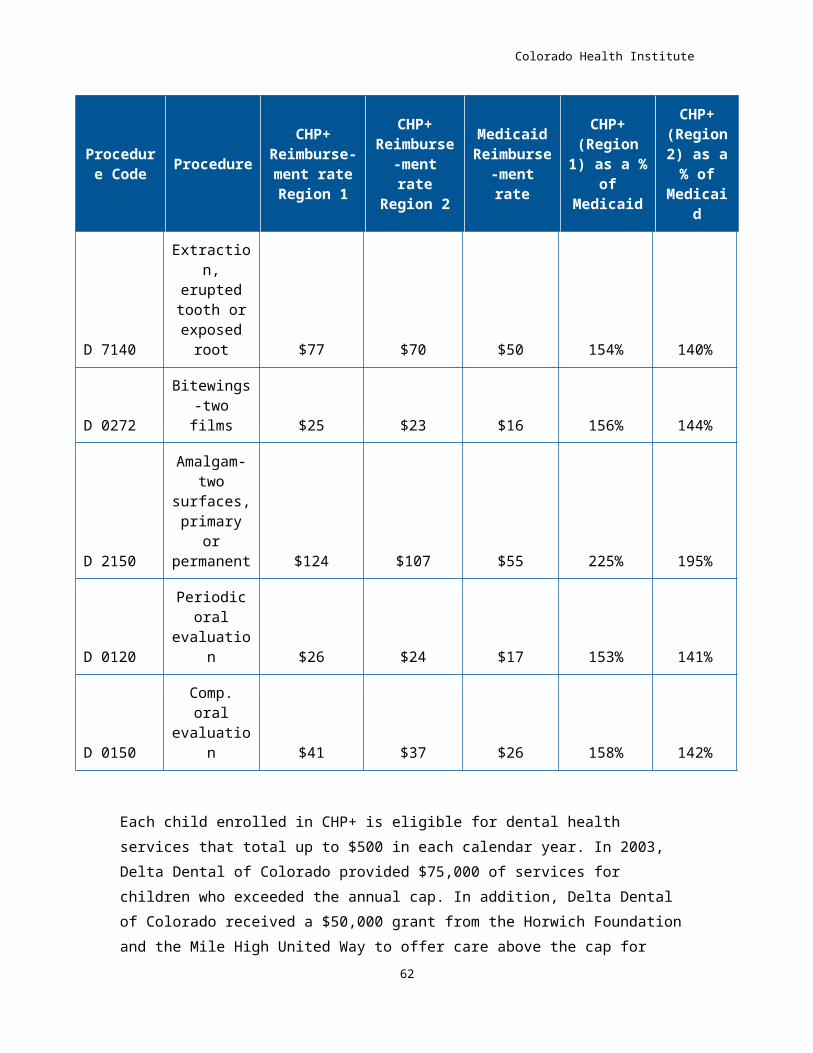
Colorado Health Institute
Other suggestions presented in an NCSL issue brief included partnering dental students with mentors who work in rural practices and increasing exposure to Medicaid and SCHIP patients during dental school with the hope that once dental students graduate they will continue to see these patients in their own practices.74
To assist patients in navigating the complexities of the health and dental care system, many Medicaid programs rely on case management services. Case management services assist clients by assessing their care and social-environmental needs; developing a specific care plan; providing referral services to practitioners accepting clients; and providing monitoring and follow up of clients’ needs.75
While case management has often been used in medical care settings, it more frequently is being recognized as an effective mechanism for helping Medicaid patients navigate the complexities associated with dental care services as well. According to the Medicaid/SCHIP Dental Program Representative Association, documenting the cost effectiveness of dental case management services is a recommended research priority because of the relatively low national utilization of dental services by Medicaid and SCHIP children.76 As a report by the Children’s Dental Health Project on the proposed HIFA waiver in Colorado notes:
As missed appointments are a significant deterrent to provider participation in dentistry, extension of administrative case management that facilitates appointment making and compliance with appointment keeping would enhance the efficiency of the program, increase provider willingness and improve children’s health outcomes.
Access issues While Medicaid clients’ access to dental health care services is a concern throughout the state, access problems are particularly acute in rural areas. Many rural counties in the state have no dentists participating in the Medicaid program. In FY 2000-01, 25 rural counties in Colorado did not have a dentist 74 Gehshan, S., et al. 2001. “Increasing Dentists’ Participation in Medicaid and SCHIP.” National Conference of State Legislatures Promising Practices Issue Brief: Forum for State Health Policy Leadership, p. 1275 Centers for Medicare and Medicaid Services. January 19, 2001. “Dear State Child Welfare and State Medicaid Director letter.” (SMDL #01-013) http://www.cms.hhs.gov/states/letters/smd119c1.asp76 http://www.fda.gov/ohrms/dockets/dailys/04/july04/070704/04S-0170-EC51-02-Attach-1.pdf (accessed September 9, 2005).
64
Colorado Health Institute
participating in Medicaid. These counties include Bent, Chaffee, Cheyenne, Costilla, Crowley, Custer, Dolores, Elbert, Gilpin, Grand, Hinsdale, Jackson, Kiowa, Lincoln, Mineral, Moffat, Ouray, Phillips, Pitkin, Saguache, San Juan, San Miguel, Summit, Teller and Washington.77 HCPF and CDPHE have implemented several initiatives to address the access constraints in rural areas.
Infrastructure grantsA recommendation of the 2000 Colorado Commission on Children’s Dental Health was to “replicate and/or expand existing systems of care that serve under-served populations through matching infrastructure grants.” In response to this recommendation, the General Assembly appropriated $2 million in FY 2001-02 to expand the state’s dental infrastructure for low-income Medicaid, CHP+ and uninsured children. An additional $2 million was allocated in 2003. These infrastructure grants have funded the constructing and/or renovating of new operatories, purchasing of equipment, staffing of a mobile clinic and providing preventive, restorative and orthodontic services to uninsured and underinsured low-income children. In return for the grant, a provider must agree to see a certain number of low-income children, including Medicaid and CHP+ enrollees.78
H.B. 01-1282 passed in 2001 enables dental hygienists to practice independently and bill Medicaid directly without being under the direct supervision of a dentist. Approximately 2,284 Medicaid children were served by 16 independent practice dental hygienists in FY 2003-04. Dental care services totaled $199,518, less than one percent of dental services provided to children during FY 2003-04.79
The Dental Loan Repayment program, administered by CDPHE, was implemented in FY 2001-02. The program assists dentists and dental hygienists with repayment of educational loans in return for providing services for a pre-determined period in rural and urban underserved areas. Approximately 6,807 Medicaid children were served by providers participating in this program in FY 2003-04.
77 HCPF, January 30, 2002. Report to the Joint Budget Committee on Footnote 45. 78 For a summary of how funds were distributed, see inventory of initiatives in appendix. 79 In FY 2003-04, low-income children received $24.3 million in dental services, while foster children received $3.2 million in services.
65
Colorado Health Institute
Dentists with outstanding educational loans who practice in rural health professional shortage areas became eligible for a state income tax credit in 2001. Dental hygienists were added to the tax credit program in 2002. The tax credit is not conditional on providing services to Medicaid clients; however, it is hoped that participating dental care providers will accept Medicaid patients into their practices. The credit is only available during years in which the state’s fiscal year ends with a qualified surplus. Thus, the tax credit could not be claimed for tax years 2002 through 2004. This program is also administered by CDPHE.
HCPF has focused some resources on EPSDT providing training, including care delivery protocols, enrollee tracking and reporting, and notifying families about the availability of EPSDT services (including dental care benefits).
INITIATIVES IN OTHER STATES TO INCREASE MEDICAID ACCESS AND UTILIZATION80 A number of state Medicaid programs have implemented programs to increase the utilization of dental care benefits to Medicaid clients.
In South Carolina, Medicaid-funded staff visits new clients to explain dental coverage and services available. A toll-free line provides direct referrals throughout the state.
In Georgia and Montana, notices are placed in Medicaid enrollment mailings containing identification cards informing clients of their entitlement to dental care benefits. These mailings encourage parents to schedule regular dental appointments for their children.
In Maine and Florida, enrolled children who have not had a dental visit in the previous year receive a letter encouraging parents to schedule an appointment.
In South Dakota, the Medicaid agency conducts an enrollee experience of care survey that includes questions regarding dental benefits to raise awareness of benefits and evaluates parents’ attitudes and experience with the dental care benefit.
In Washington State, dentists who undergo special training in pediatric dental care practice receive an enhanced reimbursement rate when billing Medicaid.
80 All examples are from the American Dental Association. March 2004. Enhancing Dental Medicaid Outreach and Care Coordination, Available at www.ada.org/prof/advocacy/issues/Medicaid_outreach.pdf (accessed June 22, 2005).
66
Colorado Health Institute
In Indiana, Medicaid clients can call a hotline that includes a GeoAccess mapping program. Enrollees’ zip codes are used to identify the closest dental provider accepting Medicaid clients. The service utilizes feedback from callers to evaluate whether or not a referral resulted in a successfully scheduled appointment.
In Arkansas, Connecticut, Indiana, Rhode Island and Virginia, Internet sites have been created to assist Medicaid recipients, case mangers and community organizations search online for Medicaid dental providers by location and specialty.
In Iowa and New Mexico, dental schools and dental associations maintain Web sites that contain information regarding participating dental providers.
Oklahoma Medicaid operates a program that pays for school-based dental screenings and treatment referrals. The Medicaid agency contracts with school districts that then subcontract with dentists to provide dental screening and treatment in school-based clinics.
North Dakota EPSDT coordinators work with dental providers and arrange for transportation as well as follow-up dental appointments for Medicaid children requiring access-enhancing services.
In Idaho, Ohio, and South Carolina, Medicaid will pay for a provider liaison to work with families that miss appointments and coach them on ways to keep scheduled appointments.
Dentists in Maine can call a toll-free number to receive assistance with families that chronically miss dental appointments. State employees and contractors contact families to discuss the importance of keeping appointments, review the program’s cancellation policy, and offer assistance in arranging transportation to dental appointments.
The proposed HIFA waiverDuring July and August of 2005, the Joint Committee on Health and Human Services of the Colorado General Assembly considered a proposal submitted by HCPF to create the Colorado Family Care (CFC) program through a federal Health Insurance Flexibility and Accountability (HIFA) waiver. If passed, the proposal would have led to significant changes in the provision of medical, dental and behavior health services for children and adults in the Medicaid and CHP+ programs. Although the waiver was not approved by the Joint
67

Colorado Health Institute
Committee, members of the General Assembly have expressed interest in introducing legislation in the 2006 legislative session to implement many of its provisions.
CFC would streamline eligibility and standardize benefits and the provision of services for low-income, non-disabled, parents, pregnant women and children currently in CHP+ and Medicaid. According to the proposal, medical and dental services would be provided primarily by managed care networks. A policy goal of CFC was to streamline the two programs as many children move between Medicaid and CHP+ eligibility as their families’ income changes. Providers would be relieved of the administrative burden of determining to which benefits the enrollee was entitled as both benefit packages would be the same. In addition, HCPF anticipated that managed care contracts would leverage “value purchasing” and make it possible to increase physician fees to 80 percent of Medicare RBRVS charges. Finally, the savings resulting from increased program efficiencies would be used to expand Medicaid eligibility to low-income adults.
Dental care services would be carved out of the health care program and the state would contract with a dental managed care organization to provide dental services to children in the consolidated program. According to information submitted by HCPF, “The [core] oral health benefit will be the CHP+ benefit. Core Plus will include extraordinary oral health benefits for children less than 21 years of age whose oral health needs require more extensive services.”81 With the appropriate prior authorization, Core Plus services would be provided and reimbursed on a fee-for-service basis.
Similar to the current CHP+ benefit, an annual benefit cap would be applied to dental services available through CFC. HCPF recommended that the $500 cap currently in place for CHP+ services undergo an actuarial analysis to determine if this threshold is indeed the appropriate cap for the CFC program. In addition, the department noted the state should consider indexing the cap to annual inflation to avoid eroding the value of services accessible to children within a given year. The proposal also included a provision that the cap could be exceeded for medically necessary dental needs.
Most of the CFC dental benefit could be implemented with State Plan Amendments (SPAs). Contracting, however, with a managed care network
81 HCPF. August 3, 2005. Questions for Colorado Department of Health Care Policy and Financing regarding the Colorado Family Care Program, p. 1.
68
Colorado Health Institute
would likely require a Freedom of Choice waiver from the federal government. As noted above, legislation will likely be introduced in the 2006 legislative session to accomplish many of the goals of the HIFA waiver, including the consolidated dental care benefit.
Policy considerations and options: MedicaidA range of policy options exist that could increase the capacity of Colorado’s Medicaid dental network, improve child dental health outcomes and the utilization of essential preventive dental services, and educate families about the importance of good oral health practices. Among these, the state could consider:
Minimizing administrative complexities with regard to billing and simplifying the prior authorization process;
Allowing dentists that undergo a Medicaid-sponsored pediatric training program to bill Medicaid at a higher rate (see Access to Baby and Child Dentistry (ABCD) program in Washington State in Appendix D);
Implementing pilot projects that encourage the establishment of dental homes for low-income children. Pilots should include patient navigation and care management services and provide reimbursement for these enabling services. Pilots should include a cost-benefit evaluation to determine the cost-effectiveness of such approaches as increasing participation in dental health programs for high-risk children;
Offering financial incentives to dentists who maintain an adequate threshold of Medicaid patients;
Adding oral health educational services to the Nurse Home Visitor program. Give nurse home visitors information packets regarding the importance of oral health care and include toothbrushes for distribution to families.
ORAL HEALTH PROGRAM (OHP): COLORADO DEPARTMENT OF PUBLIC HEALTH AND ENVIRONMENT (CDPHE) Located in the Preventive Services Division of CDPHE, the OHP is supported by a variety of federal and state funding sources. Since 2002, Colorado has been one of 12 states participating in a CDC-sponsored cooperative agreement program, Support for State Oral Disease Prevention Programs. This and other federal funding streams have enabled CDPHE to roughly double the staff (to five FTE) devoted to the OHP and expand a number of
69
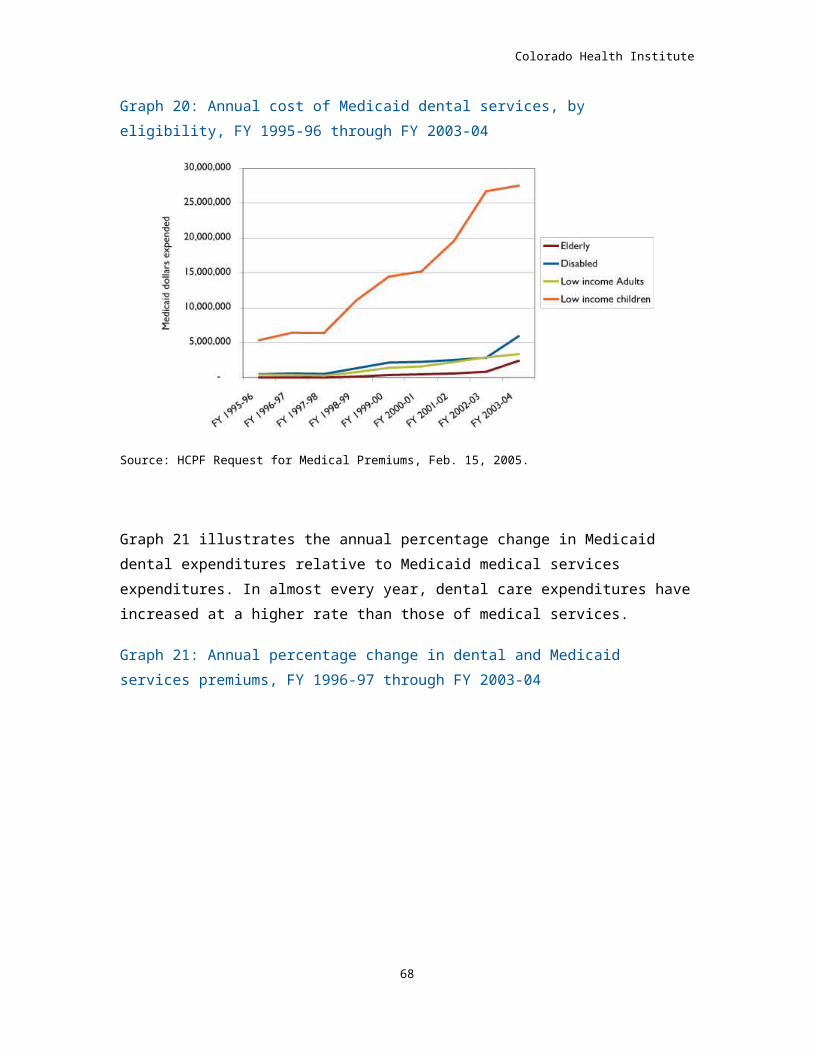
Colorado Health Institute
important initiatives, including an enhanced Oral Health Surveillance System. The OHP staff recently released a comprehensive study titled, The Impact of Oral Disease on the Health of Coloradans.82 It also manages all aspects of the Community Water Fluoridation Program, which assists communities adjust the fluoride levels of their public water system to optimal levels.
Another initiative of OHP is the School Fluoride Mouth Rinse Program, which operates school-based programs in communities where children are at high risk of caries because tap water is not optimally fluoridated. OHP also provides major funding for several school-based sealant programs. Despite the expanded capacity of OHP, the program is still unable to extend the fluoride mouth rinse and sealant programs to all schools with high levels of at-risk children. OHP also administers the Old Age Pension Dental Program and the State Dental Loan Repayment Program.
Community Water Fluoridation ProgramMany communities within Colorado participate in the Community Water Fluoridation Program and adjust the fluoride content of their public water supply to optimal levels recommended by the CDC. While the program is voluntary, once communities chose to participate, they must abide by federal and state laws and regulations regarding fluoridation levels.
To maximize the effectiveness and safety of fluoridation programs, the Community Water Fluoridation Program within OHP monitors fluoridation levels and ensures that the fluoride content and contaminant levels in drinking water meet CDC and Environmental Protection Agency (EPA) guidelines. OHP program staff provides required guidelines that participating communities are required to implement, such as adjusting fluoride levels based on the average daily high temperatures.
According to OHP, approximately 75 percent of the population in Colorado has access to a public water system that is either naturally fluoridated or adjusted to achieve optimal fluoride levels.
Dental loan repayment programThis program was created by Senate Bill 01-0164, passed in 2001. The purpose of the program is to provide an incentive for dental professionals to serve underserved populations. Since the implementation of the program, 24
82 Colorado Department of Public Health and Environment. 2005. The Impact of Oral Disease on the Health of Coloradans. Available at http://www/cdphe.state.co.us/pp/oralhealth/impact.pdf
70
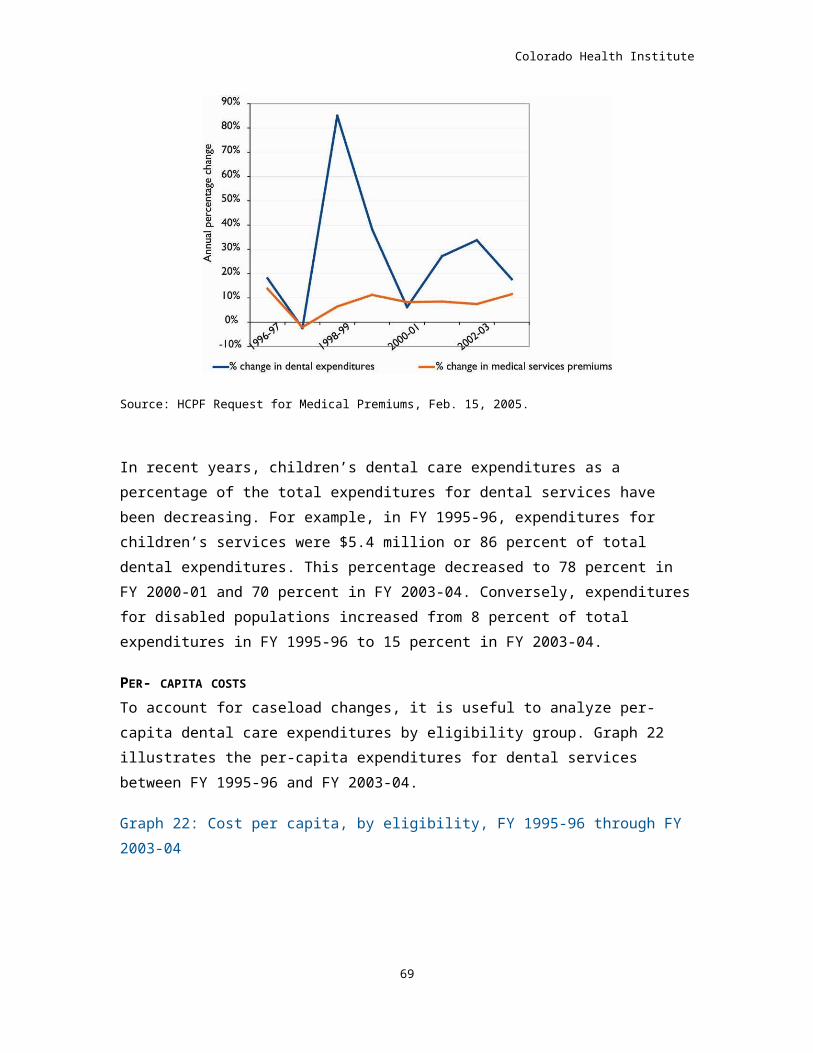
Colorado Health Institute
dental providers have participated. Dentists are eligible for up to $25,000 and dental hygienists are eligible for up to $6,000 depending on the level at which they participate. The program categorizes providers into three different levels. According to the 2004 Dental Loan Repayment Program Annual Report, the distribution of providers included 11 counties -- Larimer, Weld, Eagle, Logan, Adams, Jefferson, Denver, El Paso, Pueblo, Chaffee and Prowers. The total number of patients served by participating providers has been 35,520, with 20,520 served in Fiscal Year 2003-04 including 6,807 Medicaid- eligible children; 1,399 CHP+ children; 11,844 uninsured adults and children; and 478 Old Age Pension recipients.
School-based sealant programsThe state-funded dental sealant program began with the Chopper Topper program in 1998. Chopper Topper was originally conceived through collaboration of five organizations: HEALTH S.E.T., KIND, the Metropolitan Denver Dental Society, the CDPHE’s Oral Health Program, and Cheltenham Elementary School in the Denver Public School District. The program now includes a mobile van operated by Rocky Mountain Youth/Ronald McDonald that serves schools in the Denver Metro Area and a companion program operated by Summit County School District. The program is expected to expand to Weld, El Paso and Logan counties in the near future.
The program provides free dental sealants to the permanent molar teeth of 2nd graders (ages 7-9 years). Other services provided in conjunction with the dental sealant program include parent and child dental health education, dental screening and referrals for children who need urgent care, and program follow-up and evaluation. Participating schools are chosen based on the proportion of families that qualify for the free and reduced-price meal program operated by public schools. The threshold requirement is 70 percent for Chopper Topper, 50 percent for the Rocky Mountain Youth and Summit County School District.83. All 2nd graders in the selected schools are eligible to receive services, although parental permission is required via a signed consent form. The program has an 80 percent return rate for consent forms and serves 1,600-2,000 children a year, 33 percent of whom had never seen a dentist prior to the program.
The staff that participates in the Chopper Topper program includes a full-time program director (dental hygienist), a part-time coordinator, and volunteer professional and nonprofessional support staff. Staff participating in Rocky 83 Schools in Summit County are also eligible if they are a pilot school in the Department of Education’s and CDPHE’s Coordinated School Health Program.
71
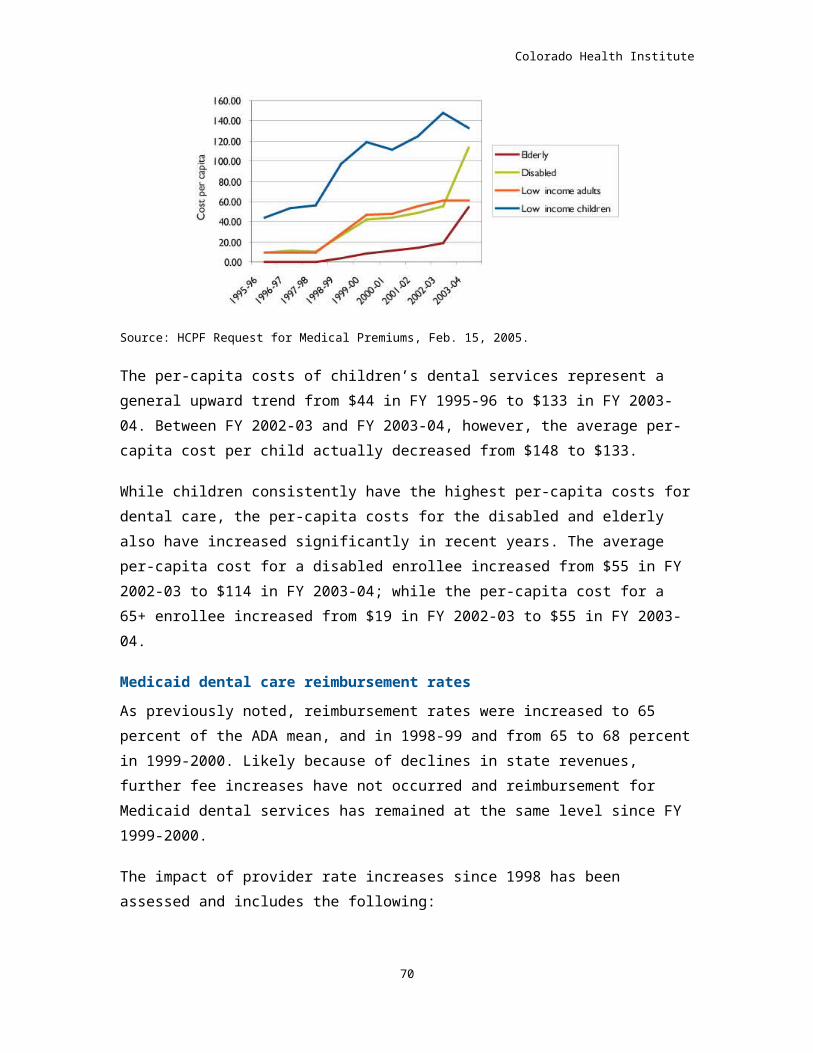
Colorado Health Institute
Mountain Youth and Summit County schools includes volunteer dentists and dental hygienists.
Fluoride mouth rinse programThe OHP operates a school-based fluoride mouth rinse program that targets elementary schools in communities without fluoridated water systems. Additional eligibility criteria include at least 25 percent of children qualifying for the free or reduced-price meal program and include at least 70 percent of children below 120 percent of FPL. Approximately 1,000 children in 25 elementary schools, mostly in southwest Colorado, participate in the program. A trained nurse, teacher or other adult administers a small cup of rinse once a week for 32 weeks to participating children in grades 1 through 6. Maternal and Child Health Block Grant funds are used to purchase approximately $15,000 of materials to participating schools each year.
Old Age Pension (OAP) Dental ProgramThe Old Age Pension Dental Program (also known as the Dental Assistance Program for the Elderly) was established in 1977 and is administered by CDPHE. According to CDPHE staff, there are only a few programs in the United States such as Colorado’s that are designed specifically for the dental health of seniors.84
To qualify for the OAP Dental Program, enrollees must be Colorado residents (U.S. citizens or legal immigrants), be 60 years or older and be recipients of OAP cash assistance payments from the state. Due to the low-income requirements to be eligible, providers of services cannot charge co-payments that exceed 20 percent of the cost of the dental service provided.
Services covered by the program include:
Dentures and partials;
Denture maintenance and repair;
Tooth extractions;
Fillings; and
Dental examinations and x-rays.
84 CDPHE. May 2005. The Impact of Oral Disease on the Health of Coloradans. 72
Colorado Health Institute
Passed during the 2003 legislative session and effective July 1, 2003, House Bill 03-1346 converted the program from a claims program to service grants. The impetus for this change was the passage of the Health Insurance Portability and Accountability Act (HIPAA) of 1996. Consequently, CDPHE awards grants to dental providers, community health centers, and Area Agencies on Aging to cover the dental services provided to eligible individuals. The organizations that have received grants include:85
– Five community health centers
Denver Health Loveland Community Health Center Marillac Clinic Pueblo Community Health Center Sunrise Community Heath Center.
– Seven Area Agencies on Aging, councils of government or senior agencies South Central Council of Government Northeastern Colorado Association of Local Governments Senior Answers and Services Lower Arkansas Valley Area Agency on Aging San Juan Basin Area Agency on Aging Upper Arkansas Area Agency on Aging San Luis Valley Christian Community Services.
– Three private dental providers located in Larimer and Weld counties.
Table 8 summarizes the number of OAP clients served by fiscal year, and procedures provided since the inception of the grant program.86
Table 8: OAP clients served, expenditures, procedures provided, FY 2003-04 and FY 2004-05
85 Information identifying grantees provided by CDPHE. 86 Data provided by CDPHE. In FY 2003-04, due to grant start-up, grants were only available for six months. FY 2004-05 data are from July 1, 2004-April 15, 2005.
73
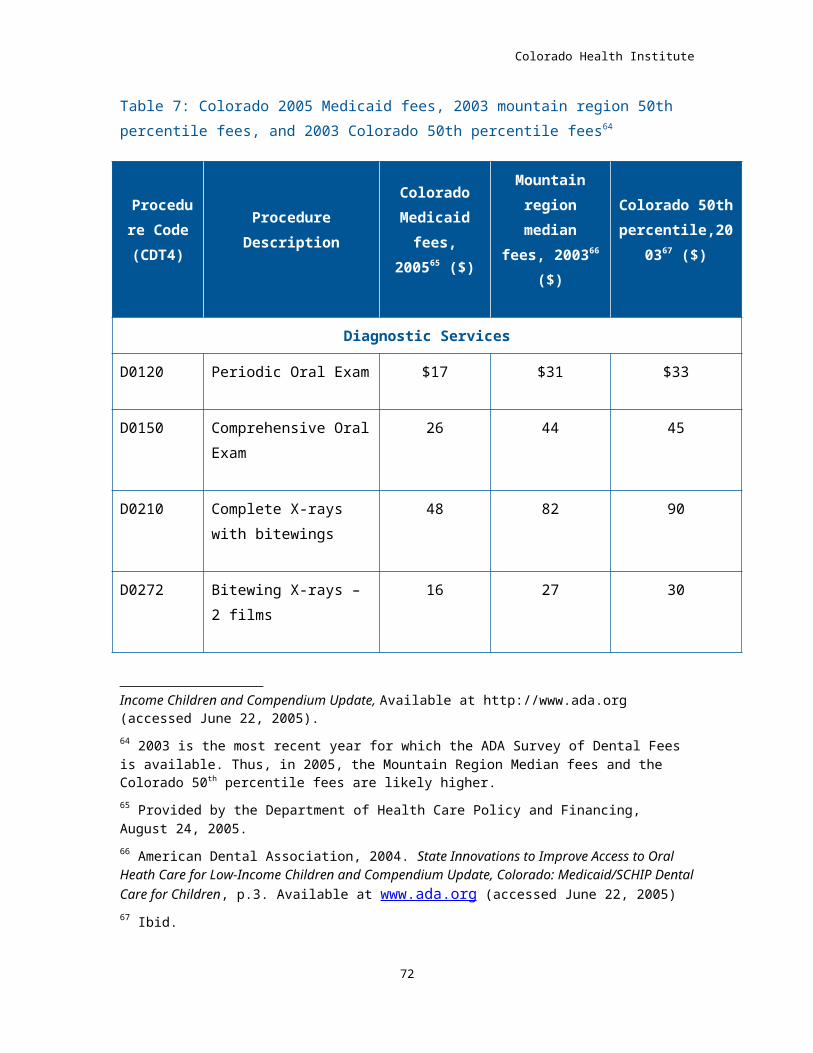
Colorado Health Institute
Fiscal Year
Expenditures
# of Client
s serve
d
Procedures provided
Preven-tive
Fillings and
Periodontal
Partials, Dentures
and Repairs
Oral Surger
y
Total
FY 2003-04
$398,200 539 46% (n=73
6)
18%(n=284)
27%(n=435)
9%(n=146
)
100%
(n=1,601)
FY 2004-05 (through 4/15/05
$396,400 451 37%(n=63
1)
19%(n=324)
22%(n=373)
23%(n=387
)
100%
(n=1,715)
Source: Colorado Department of Public Health and Environment
As noted in Table 8, preventive services make up the largest proportion of procedures provided, followed by dentures, partials and repairs. The number of clients served in FY 2004-05 was 451 through April 15, 2005. Annualizing this number with a straight line methodology, however, would suggest a caseload of 570 for FY 2004-05 (a 5.8 percent increase over 2003-04). According to the CDPHE, nearly 25,000 Colorado seniors are eligible for the program.87
Over the past 20 years, the number of individuals served by the program has declined significantly, while the cost per client has increased substantially. For example, between 1985 and 2002, the number of individuals served decreased from 1,122 to 705 (a decline of 37 percent). The cost per client, however, increased from $307 to $684 (an increase of 123 percent) during the same time period.88 Graph 25 summarizes the trends in the client caseload and cost per client from 1985 through 2002.
Graph 25: OAP patients served and costs per patient, 1985-2002
87 CDPHE. The Impact of Oral Disease on the Health of Coloradans. 88 Data provided by CDPHE.
74
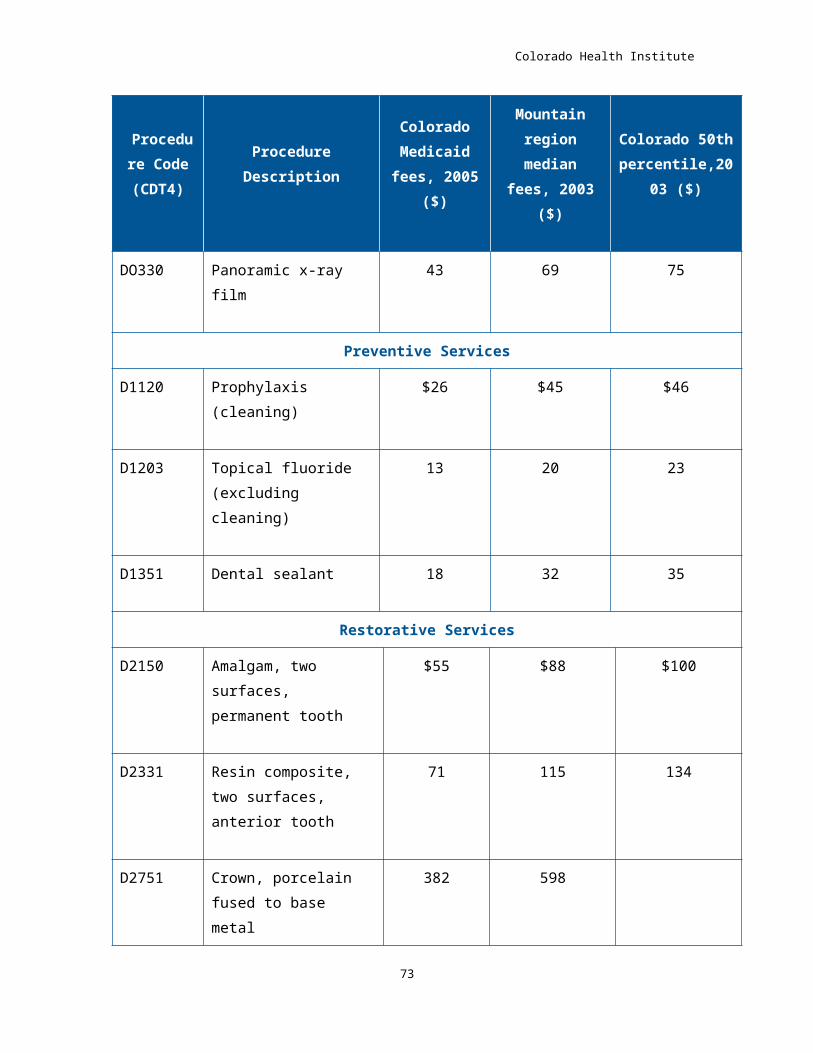
Colorado Health Institute
Source: Colorado Department of Public Health and Environment
OHP Web site and publicationsIn addition to the programs described above, OHP provides valuable oral health information on its Web site89 and in publications such as Snapshot of Oral Health in Colorado90 and the recently released The Impact of Oral Disease on the Health of Coloradans.91 The 2003 Snapshot document summarized findings from the first Basic Screening Survey conducted during the 2001-2002 school year, and discusses participation rates in the Medicaid dental program for pregnant women and children, as well as the relationship between chronic disease and oral health. The Impact document provides a more thorough and updated discussion of these topics. In addition, as the title implies, it explores more thoroughly the relationship between oral and physical health, addresses workforce issues and sets forth an agenda for filling gaps.
THE DENTAL SAFETY NET An important focus of the environmental scan has been the dental health safety net in Colorado, including federally qualified health centers (FQHCs), whose dental clinics provide a substantial portion of dental care to Colorado’s underserved populations.
FQHCs receive core funding from the Health Resources and Services Administration (HRSA). During the past four years, a number of grants have been awarded to FQHCs in Colorado for program expansions, including new dental clinics or expansions of existing dental clinics. Most FQHC dental clinics are affiliated with a medical clinic, and therefore operational core
89 http://www.cdphe.state.co.us/pp/oralhealth/OralHealth.htm 90 CDPHE Oral Health Program. 2003. Snapshot of Oral Health in Colorado.91 CDPHE. The Impact of Oral Disease on the Health of Coloradans.
75
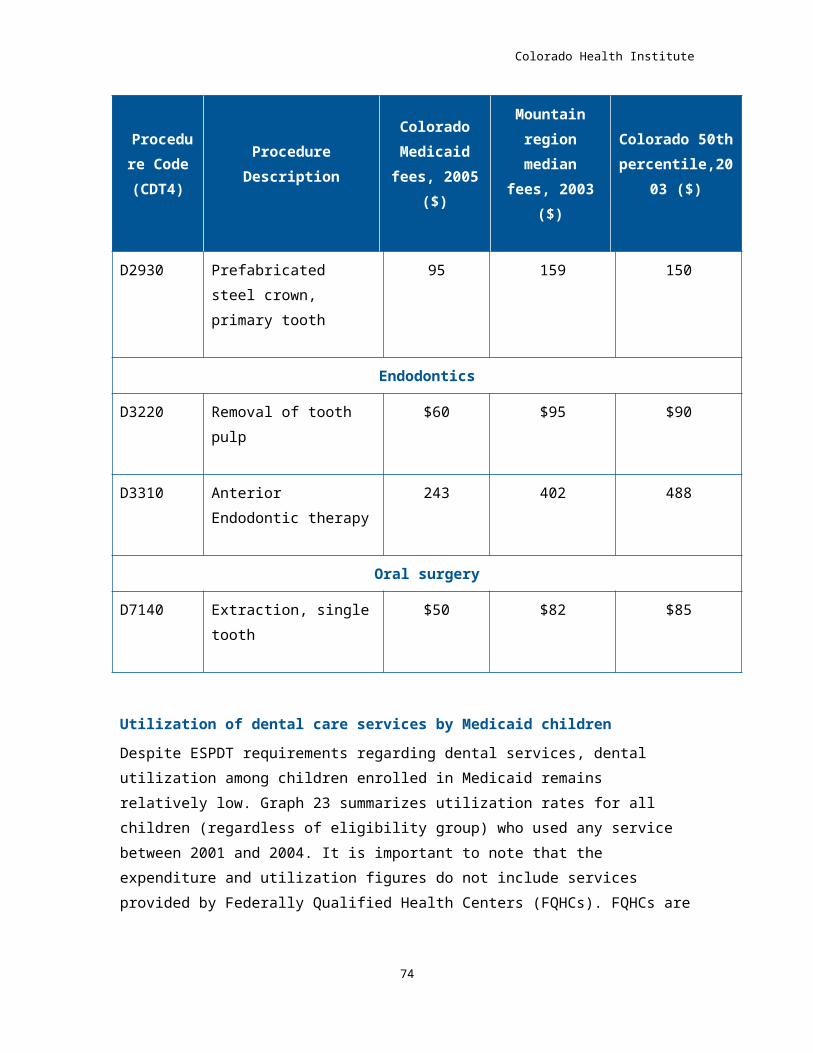
Colorado Health Institute
funding represents both the dental and medical components of the clinic. For the purposes of this report, CHI staff attempted to contact all identified FQHC dental clinics as well as other dental safety net programs to ascertain funding levels of their dental programs. Fact sheets on each of these clinics and programs are included in Section 3 of Appendix B. Map 3 in Appendix E shows the location of dental safety net clinics in relation to HRSA-designated Dental Health Professional Shortage Areas in Colorado.
FQHC dental clinics The backbone of the dental safety net is the network of FQHC dental clinics around the state. These clinics, established under Section 330 of the federal Public Health Service Act, have as their mission to provide oral health services to Medicaid, CHP+, and low-income uninsured and underinsured patients. There are 15 FQHCs in Colorado, 10 of which operate 25 dental clinics that serve patients in 26 counties. The FQHCs that do not operate a dental clinic refer patients to local dentists for services.
Funding for FQHC dental services comes from patients through a sliding-fee scale, Medicaid and CHP+ payments, federal grants, donations and other sources. CHI was able to obtain recent budget information for the dental component of five of the 13 dental clinics. These clinics, including several of the largest in the state, spent $9 million on their dental programs in the most recent year for which data are available (2003 or 2004).
Graph 26 below illustrates that the number of patients seen by these clinics has grown from 34,021 in 1998 to 57,510 in 2004, a 69 percent increase in just six years. While a large proportion of their patients are uninsured, the number of Medicaid patients (including CHP+ children) has more than doubled during this period.
76
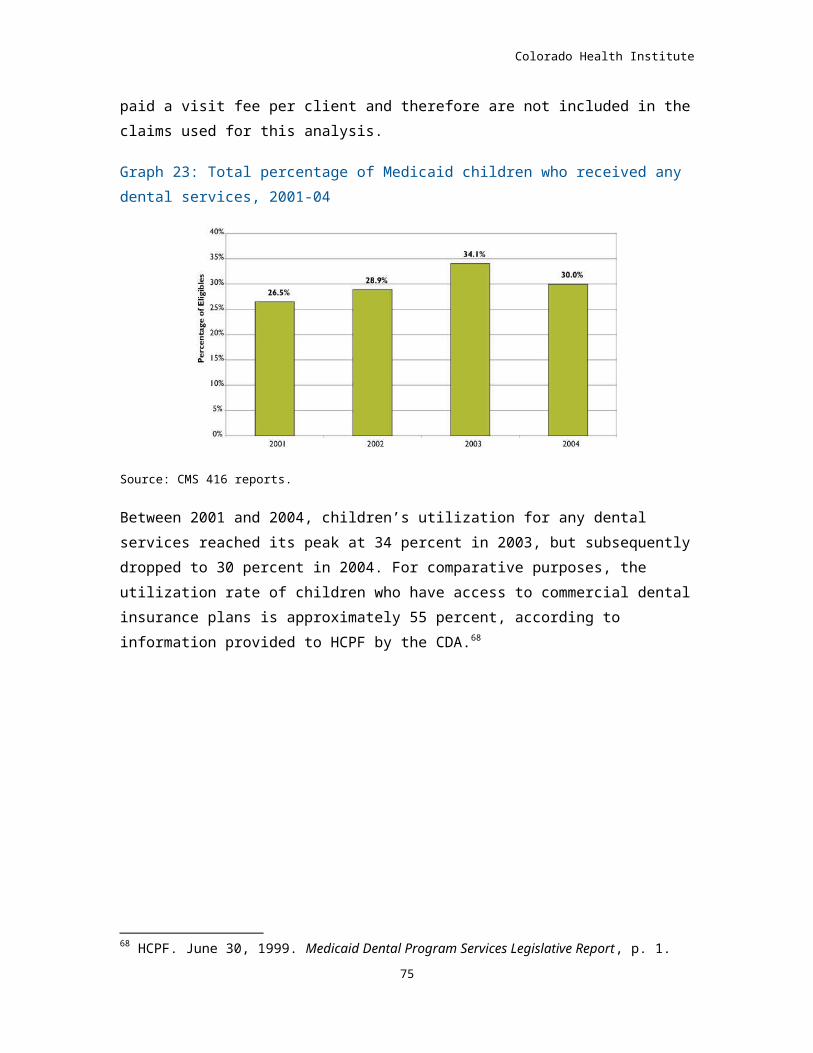
Colorado Health Institute
Graph 26: FQHC Dental patients by insurance coverage, 1998-2004
Source: CCHN and COHN annual reports
The ability of FQHC dental clinics to serve more clients is directly related to their ability to expand infrastructure and their dental workforce. In FY 2001-02, FQHCs received Dental Infrastructure Grants and/or Dental Facility Capital Expenditure Grants to expand the capacity of their dental programs (see Appendix B for a complete description of this program).
In 1998, FQHCs employed 22 dentists and by 2003, and the number of dentists had increased to 34 FTEs. 92 Average salaries for both dentists and dental hygienists are shown in Graph 27.
Graph 27: Average salaries, FQHC dentists and dental hygienists (2003 dollars)
92 Colorado Oral Health Network Annual Reports. Number of dentists and dental hygienists is on an FTE basis, salaries are expressed in 2003 dollars based on the Denver-Boulder-Greeley Consumer Price Index.
77
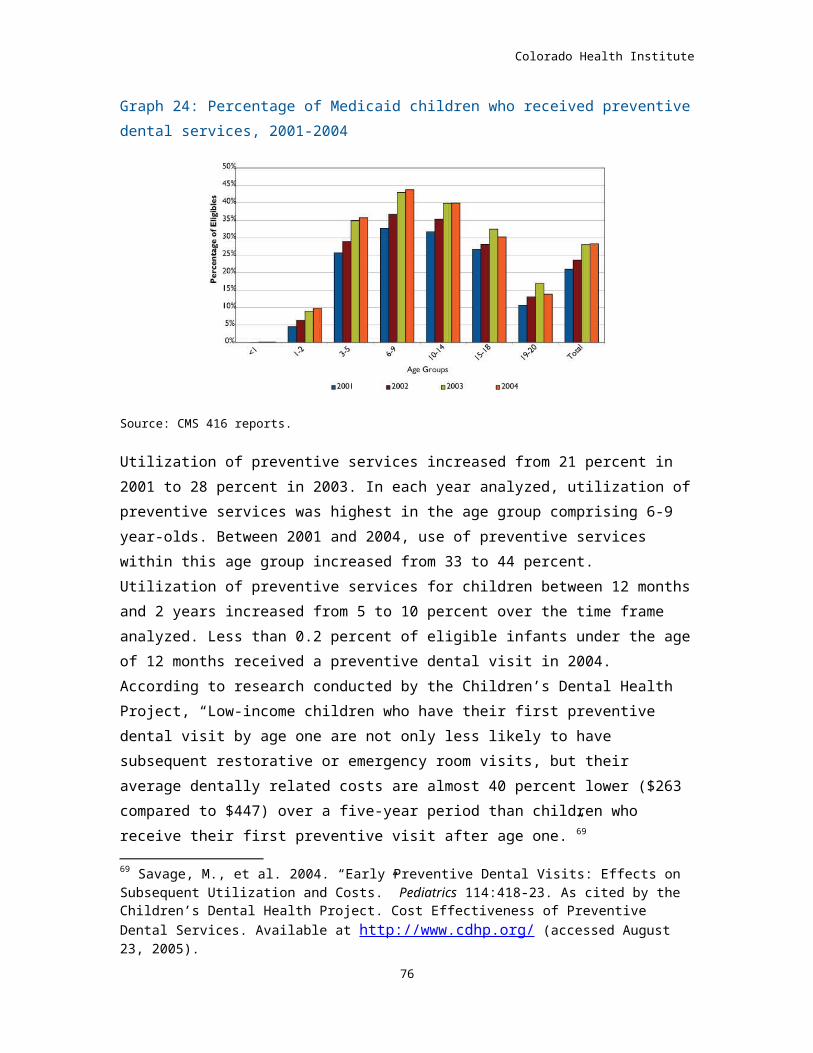
Colorado Health Institute
Source: Colorado Oral Health Network
While steadily increasing salaries have helped FQHCs in their recruitment of dentists, clinic dental directors report that recruitment remains challenging. Beginning salaries in private practice dental offices in the metro Denver area are reported to be far above what FQHCs are able to pay. Since newly graduated dentists typically graduate with as much as $100,000 in educational loans, one incentive that was instituted in 2001 for dental professionals to practice in an underserved area is the Dental Loan Repayment Program. Since its inception, 24 dentists and dental hygienists have provided dental care in 11 Colorado counties. Dentists are eligible for up to $25,000 in loan repayment and dental hygienists are eligible for up to $6,000, depending on the level at which they participate. To date, the total number of patients served by participating providers is 35,520; with 20,520 served in Fiscal Year 2003-04 including 6,807 Medicaid eligible children, 1,399 CHP+ children, 11,844 uninsured adults and children, and 478 Old Age Pension recipients.
Non-FQHC dental safety net clinicsCHI also identified 10 community-based organizations that operate 20 additional nonprofit dental clinics that serve primarily underserved populations in 12 counties. These organizations include Dental Aid in Boulder and Inner City Health Center in Denver, both long established dental clinics that rely on a combination of sliding-fee scale patient payments, Medicaid and CHP+. Additionally, newer clinics are being established like those in Craig and Montrose that have received substantial startup grants from Caring for Colorado Foundation, as well as those operated by the University of Colorado School of Dentistry and The Children’s Hospital.
In 2004, non-FQHC clinics reported seeing 27,363 patients to the Colorado Oral Health Network, slightly less than half the number seen by FQHC clinics. As illustrated in Graph 28, a higher proportion of non-FQHC patients were enrolled in Medicaid or CHP+ (59%) than was the case for FQHC clinics (35%).
Graph 28: Safety net dental patients, 2004
78
Colorado Health Institute
Source: Colorado Oral Health Network annual reports
While the dental care safety net is typically thought of as a network of clinics that primarily treat low-income Medicaid and uninsured populations, the dental safety net clearly extends beyond the boundaries of this definition to include other providers who provide free or discounted services to low-income patients. The CHI inventory has only begun to uncover this dimension of the dental safety net and it is unlikely that we will be able to come up with an estimate of the extent to which private practice dentists fulfill a safety net role. Nevertheless, when an organization such as Comfort Dental provides free care on Christmas Eve or a private dentist sees a handicapped patient referred through the Foundation for Dentistry for the Handicapped, they are making a contribution to the dental safety net.
OTHER COLORADO INITIATIVES
Colorado Oral Health NetworkFounded in 2001 with a planning grant from the Rose Community Foundation, the Colorado Oral Health Network (COHN) is a group of 24 nonprofit dental providers and their supporters whose mission is to “increase access to oral health care in Colorado and improve the oral health outcomes of traditionally underserved populations.”93 COHN is a dues-paying affiliate of Colorado Community Health Network, the membership association of FQHCs. COHN works to strengthen the financial viability of safety net dental providers and to aggregate uniform data about dental safety net clinics. It has also established the Children’s Oral Health Outcomes Project (COHOP), a collaboration representing medical and dental providers whose aim it is to improve the dental outcomes of Colorado's underserved children.
93 http://www.cchn.org/activities/cohn.asp79
Colorado Health Institute
University of Colorado School of Dentistry: Advanced clinical training and service programColorado has been a pioneer in providing dental students opportunities to treat underserved populations during the course of their training. From its inception in the mid-1970s, the University of Colorado School of Dentistry has required dental students to serve six months in an underserved area as part of its Advanced Clinical Training and Service Program (ACTS). Current ACTS locations include private practices in rural areas, FQHCs, private nonprofit dental clinics, a geriatric clinic, and school-based programs for low-income underserved children. One example, the Salud Family Health Centers, an FQHC that operates dental clinics in Commerce City, Fort Morgan, Sterling, Fort Lupton, and Frederick, has had approximately 1,000 dental students from the ACTS program as well as other dental schools acquire clinical experience over the past 30 years.
The ACTS program has attracted national attention. The Bureau of Primary Health Care within HRSA is working to expand ACTS nationally. Dental schools are encouraged to establish a similar program through the accreditation process; further, the Robert Wood Johnson Foundation recently awarded 10 dental schools grants to establish similar programs.
80
Colorado Health Institute
IV. Evidence-based dentistry and oral health best practicesEvidence-based dentistry is the adaptation of the principles of evidence-based medicine to the field of dentistry. Evidence-based medicine has been defined as a process that “uses a systematic approach to review and publish the evidence relevant to specific clinical questions…. The information from systematic reviews is then made available to practitioners for integration with their clinical experience and other factors relevant to specific patient needs and preferences.”94 Following from this, the American Dental Association has defined evidence-based dentistry as “an approach to oral health care that requires the judicious integration of systematic assessments of clinically relevant scientific evidence, relating to the patient’s oral and medical condition and history, with the dentist’s clinical expertise and the patient’s treatment needs and preferences.”95
At the outset of this project, CHI anticipated identifying findings from the field of evidence-based dentistry that could be described, summarized and held against a mirror to reflect back the extent to which local initiatives had adapted evidence-based practices into their program design and service delivery. The development and application of evidence-based dentistry substantially lags behind that of evidence-based medicine.96 With these limitations in mind, there is a growing body of research about what constitutes oral health best practices. The Association of State and Territorial Dental Directors define the best practice approach to dentistry as “a public health strategy that is supported by evidence for its impact and effectiveness. Evidence includes research, expert opinion, field lessons and theoretical rationale.”97 It has been asserted that “guidelines for the oral health care of children are more extensive than for oral health care of other
94 American Dental Association. 2003. ADA Policy on Evidence-based Dentistry. http://www.ada.org/prof/resources/positions/statements/evidencebased.asp 95 American Dental Association, 2003.96 Ismail AI, J.D. Bader, D.B. Kamerow. 1999. “Systematic Reviews and the Practice of Evidence-based Dentistry: Professional and Policy Implications.” Journal of the American College of Dentists 1999; 66:5-12 as cited in DHHS (2000) Oral Health in America: A report of the Surgeon General, 2000.
97 Association of State and Territorial Dental Directors. 2003. Proven and Promising Best Practices for State and Community Oral Health Programs. http://www.astdd.org/?template=bp_home.html&shell=best
81
Colorado Health Institute
populations.…”98 With this assertion in mind, we discuss several best practices culled from the literature and expert opinion.
Through the literature review and with the advice of the Project Advisory Panel, we have identified seven oral health best practices that are generally agreed to be effective in the prevention, diagnosis and treatment of dental disease, especially among vulnerable populations. Appendix C includes a fact sheet on each of these best practices. This chapter summarizes the findings for each and discusses the extent to which recent Colorado initiatives have been guided by these best practices.
BEST PRACTICE #1: PUBLIC WATER SYSTEM FLUORIDATION“Fluoridation, recognized as one of the 10 greatest public health achievements of the 20th century, is a safe and cost-effective means of preventing tooth decay.”99 In Colorado, 14 percent of the population has access to water systems that are naturally fluoridated. Because an additional 74 Colorado communities add fluoride to community drinking water systems, three-quarters of the population in Colorado (75%) has access to water which is fluoridated at optimal levels.100,101
In recent years, however, a number of Colorado communities have discontinued fluoridation of their public water systems, and the proportion of the population served by optimally fluoridated public water systems is estimated to have declined slightly. The communities that have discontinued supplemental fluoridation include: Kremmling, Buena Vista, Telluride, Pagosa Springs, Erie and part of Pueblo West.
After much debate and a thorough discussion of the issue by local health officials,102 in April 2005, Fort Collins residents voted by a two-to-one margin to keep their community water supply fluoridated. The Colorado Dental Association and other health-related organizations continue to play a key role in informing the public of the benefits of fluoridation.
98 Children’s Dental Health Project. 2005. Dental Benefits in the Medicaid/CHP+ Streamlining HIFA Waiver. Colorado Department of Health Care Policy and Financing.99 http://www.cdphe.state.co.us/pp/oralhealth/snapshot.html#Fluoridation100 CDPHE. 2005. The Impact of Oral Disease on the Health of Coloradans.101 An optimal fluoride level is between 0.7 and 1.2 parts per million.102 City of Fort Collins. 2005. Fluoride Technical Study Groups Report. http://www.healthdistrict.org/fluoridereport/FTSG.htm
82
Colorado Health Institute
It is interesting to note the early epidemiologic studies documenting the dental benefits of fluoride took place in Colorado Springs, which is also one of the largest public water systems in Colorado currently lacking a uniformly optimal fluoridation level. On more than one occasion the city council has voted not to adjust the fluoride level of those portions of the city’s water system that are not optimally fluoridated. According to the CDC,103 in El Paso County, where an estimated 88 percent of the population is served by public water systems, only 9 percent of the population is served by fluoridated public water systems. Knowledgeable individuals have asserted that this estimate is misleading because the Colorado Springs water system partially relies on water sources whose natural fluoridation varies seasonally, although the other water sources are consistently below optimal levels.
According to the CDC, an estimated 7 percent of Coloradans, most of who live in rural areas, are not served by public water systems and rely on private wells for drinking water. While some private wells are naturally fluoridated at optimal levels, CHI staff was not able to find an estimate of how many of residents drink well water that is below optimal levels. As more people move to the rural areas of the state, it is possible that this demographic trend will increase the number of Coloradans who do not benefit from fluoridated drinking water. It should also be noted that the cost of adding supplemental fluoridation to a private well is substantial.
The beneficial effects of fluoride can be obtained from other sources (fluoride supplements, varnishes, mouth rinses, dentifrices and topical applications), although many people with private wells may not be aware of the fluoridation status of their drinking water or about alternative sources. The natural fluoridation level of private well water can be determined by an inexpensive test that can be performed in a dental office or local public health department. For about $40, CDPHE will provide Colorado residents with a kit that includes instructions on submitting well water samples for analysis.
Fluoridation has been found to be a cost-effective public health measure at reducing the incidence of caries. The CDC has recently estimated that “the per-capita cost of water fluoridation over a person’s lifetime is less than the cost of one dental filling [and] every $1 invested in community water fluoridation yields $38 in savings each year from fewer cavities treated.”104 A recent study of fluoridation in Colorado found that “currently, approximately 103 http://apps.nccd.cdc.gov/gisdoh/table.asp104 Centers for Disease Control and Prevention. 2005. Oral Health: Preventing Cavities, Gum Disease, and Tooth Loss.
83
Colorado Health Institute
50 communities with public water systems and populations of 1,000 or more do not have community water fluoridation programs. If fluoridation programs were implemented in these communities, annual net savings are estimated to be in the range of $20-60 million, depending upon assumptions concerning fluoride use.”105
While some have expressed concern about unnecessarily sparking a public debate in communities that currently fluoridate, there is also general agreement among public health experts that accurate information about the benefits of fluoridation is what communities need to adopt or maintain this proven public health measure.
Both the CDPHE and the Department of Local Affairs (DOLA) currently provide financial assistance to local communities that wish to develop or upgrade their public water systems, although the number of applicants exceeds available funds. While the costs associated with supplemental fluoridation are eligible for financial assistance from both departments, neither provides a specific incentive for fluoridation.
In 2004-05 DOLA received requests to fund 44 projects for making improvements to drinking water systems in rural communities at a cost of $34 million. Of these, at least 18 involved some form of water treatment improvements, yet there was no reference to fluoridation as a component of any of these projects.106
Because an increasing number of people drink bottled water rather than tap water, the oral health benefit of fluoridated water systems is increasingly being compromised. Although some bottled waters have naturally occurring fluoride, most do not. The fluoridation level of bottled waters usually cannot be determined from the label. There is a Web site that provides this information http://www.pmgeiser.ch/mineral/index.php/.
The Web site has limited information about the most common brands sold in Colorado. The CDC has recommended that bottled waters be labeled with fluoride concentrations. Increasing manufacturer labeling of the fluoride content of bottled water on a voluntary basis would allow consumers to make an informed decision about their fluoride intake.107
105 The Impact of Oral Disease and personal communication from Joan O’Connell, September 2005.106 CHI key informant interview.
84
Colorado Health Institute
BEST PRACTICE #2: SCHOOL-BASED INTERVENTIONSBecause of existing access barriers to dental care for low-income children, there has been growing attention to school-based delivery systems for preventive dental health interventions that can be administered by a non-dentist. These programs typically focus on schools that serve a disproportionate number of low-income children as determined by the proportion of children participating in the free and reduced meal program. While two of the most frequently mentioned oral health best practices, sealants and fluoride rinses, are equally effective at the individual level, we discuss their effectiveness here in the context of a school-based intervention.
Fluoride rinsesSchool-based fluoride rinses contain a 0.20 percent concentration of sodium fluoride and are used as part of a weekly rinsing program. School-based fluoride rinse programs are convenient because they are administered, with parental consent, to an entire class of children. The fluoride rinse consists of vigorously rinsing for 60 seconds and then expectorating into a cup.
Roughly one million Coloradans, including many low-income children, live in communities that are not served by fluoridated public water systems, placing them at elevated risk for dental caries. School-based fluoride rinse programs are an effective alternative for delivering fluoride to children. Colorado’s program, which reaches approximately 1,000 children in 25 elementary schools, has an annual cost of $15,000. At the current time, the program reaches a relatively small portion of the population that could reap its benefits.
Dental sealantsDental sealants are a clear or opaque resin material applied to the pitted-and-fissured surfaces of teeth to prevent tooth decay. To be most effective, dental sealants should be placed on molars soon after they erupt. Permanent first molars generally erupt at age 6 and second molars at age 12. 108 Sealants are professionally applied to molars and, as such, differ from other
107 Centers for Disease Control and Prevention. 2001. Recommendations for Using Fluoride to Prevent and Control Dental Caries in the United States. www.cdc.gov.oralhealth/waterfluoridation/fact_sheets/fl_caries.htm 108 ASTDD. July 5, 2005. Proven and Promising Best Practices for State and Community Oral Health Programs. Retrieved July 5, 2005, from http://www.astdd.org/index.php?template=full_listing.html&shell=best
85
Colorado Health Institute
preventive dental health practices such as fluoridated water, toothpaste, gels, varnishes and rinses that target the smooth surfaces of a tooth.109
According to the CDC, if sealants were applied to tooth surfaces in conjunction with the appropriate use of fluoride, most tooth decay in children could be prevented. For children with a dental home, these sealants could be applied during a regular office visit. However, as documented elsewhere, many low-income children do not have access to regular dental care. School-based sealant programs are a response to this access problem. Colorado school-based sealant programs such as Chopper Topper target schools with high proportions of low-income children as determined by the proportion of children participating in the free and reduced-price meal program. All 2nd graders in select schools are eligible to receive dental services, although parental permission is required via a signed consent form.
An estimated 35 percent of Colorado 3rd graders had sealants applied to at least one tooth in the 2003-04 school year (see Section III). According to the BSS, children who attended schools where more than 50 percent of the students qualified for free or reduced-price meals were much less likely to have a sealant than children attending schools with fewer than 25 percent of the children qualified for free or reduced-price meals. However, even children in the latter group fell below the Healthy People 2010 goal of 50 percent of 8 year olds having a sealant on at least one tooth.
Section IV reported on school-based sealant programs funded by the state Oral Health Program and private foundations. In addition to state-funded school-based sealant programs, Caring for Colorado Foundation, The Colorado Trust and Delta Dental of Colorado Foundation all provide funding for sealant programs. After years of little growth, school-based sealant programs are now expanding in several areas of the state. Most recently, because of a coordinated effort between several public and private organizations in the Denver area, these programs will soon be reaching many more low-income children than previously reached.
BEST PRACTICE #3: FLUORIDE VARNISHFluoride varnish is a viscous resin solution containing fluoride, usually 5 percent sodium fluoride, applied topically to the tooth surface to protect
109 CDC National Oral Health Surveillance System Web site. Retrieved July 5, 2005, from http://www.cdc.gov/nohss/guideDS.htm
86
Colorado Health Institute
teeth against decay.110 Topically applied fluoride has been shown to prevent, delay and even reverse newly forming dental caries in process.111 In varnish form, fluoride is kept in contact with a tooth for 6-12 hours, prolonging the therapeutic effect and simultaneously reducing systemic uptake and associated risks, especially in young children. For 25 years, fluoride varnishes have been the standard of care for the prevention of dental caries in Western Europe, Scandinavia and Canada.112 Fluoride varnish has been approved by the FDA and endorsed by the ADA. The average cost of fluoride varnish application is four dollars, thus making it one of the most cost-effective fluoride treatments available.113
BEST PRACTICE #4: DENTAL INTERVENTIONS FOR PREGNANT WOMEN Due to hormonal changes that are associated with pregnancy, women are at higher risk of developing periodontal disease during pregnancy. Bacterial infections associated with periodontal disease tend to result in an inflammatory response which is biochemically similar to the hormonal process that leads to maternal dilation and contractions prior to giving birth. Consequently, a number of studies have documented an empirical relationship between periodontal disease in pregnant women, preterm delivery and late term miscarriages. Conversely, a more limited number of studies challenge this finding. The predominance of research has found that preterm delivery is associated with a number of poor birth outcomes including low birth weight, respiratory problems in newborns and underdeveloped organ systems.114
To improve patients’ and health practitioners’ understanding of the link between periodontal disease and premature deliveries, Oral Health Awareness Colorado! (OHAC!) has launched a statewide initiative in which information packets are distributed describing this phenomenon and ways to 110 Casamassimo, P. 1996. Bright Futures in Practice of Oral Health. Arlington, VA: National Center for Education in Maternal and Child Health.111 Gilliam, K. 2005. Getting Excited About Fluoride Again (accessed June 28, 2005, at www.rdhmag.com).112 Bawden, J. 1998. “Fluoride Varnish: A Useful New Tool for Public Health Dentistry.” Journal of Public Health Dentistry. (58)4:266-269. 113 Hawkins, R., et al. 2004. “A Comparison of the Costs and Patient Acceptability of Professionally Applied Topical Fluoride Foam and Varnish.” Journal of Public Health Dentistry. 64(2):106-110.114 National Institute of Child Health and Human Development. Research on Preterm Labor and Premature Birth. Available at http://www.nichd.nih.gov/womenshealth/premature_birth.cfm (accessed September 7, 2005).
87
Colorado Health Institute
mitigate it. The information packets are being disseminated to OB/GYNs, physician assistants, nurse practitioners, nurse midwives, lay midwives and other health providers to encourage health professionals to educate their pregnant patients regarding the risks of periodontal disease. Health professionals are also encouraged to advise their pregnant patients to visit a dentist while pregnant. In addition, the Colorado Community Health Network distributes materials suggesting that pregnant women maintain good oral hygiene and receive oral health care to prevent preterm deliveries.
BEST PRACTICE #5: MOBILE CLINICSA mobile dental clinic is a vehicle, most often a van or bus, containing a fully equipped clinic for dental examinations. Mobile dental clinics travel to underserved areas to deliver on-site dental care, e.g., schools, nursing homes and migrant worker centers.115 Mobile clinics have been described as an innovative way of bringing dental care to underserved populations.116 Anecdotal evidence, especially of long-standing and financially viable mobile dental programs, has found mobile clinics an efficacious approach to serving indigent populations.117 Few quantitative analyses, however, exist that assess and compare the effectiveness of mobile dental clinic programs. Therefore, the “evidence” presented herein is largely gleaned from program evaluations, key informants and qualitative research.
115 Self-contained mobile clinics are to be distinguished from portable dental clinics. The latter consist of dental equipment designed for relatively routine diagnostic and treatment services that can easily be transported and set up in a location such as a school, health fair, or nursing home. Anecdotal evidence and a few quantitative studies suggest that portable dental programs are a successful strategy for delivering dental services to nursing home residents (Grant makers in Health Issue Brief 10, Filling the Gap: Strategies for Improving Oral Health (2001) and public schools (Herman N.G., et al. Delivery of Comprehensive Children’s Dental Services Using Portable Dental Clinics in NYC Public Schools: A Six-Year Analysis. NY State Dental Journal. 1997 Apr; 63(4):36-41.). Advantages of this approach include greater space capacity than mobile clinics, the ability to see patients in their familiar surroundings, and they are less costly to purchase than a bus. The greater amount of time spent for clinic set up and clean up has been described as a disadvantage (L. Hill, presentation, May 1, 2005).
116 Murphy C., et al. “Mobile Health Units: Design and Implementation Considerations.” AAOHN Journal. 2000 Nov; 48(11):526-532.117 Domingo, M. “USC Mobile Clinic Fact Sheet.” August 2003. USC School of Dentistry. http://www.usc.edu/hsc/dental/community/mobile_clinic/htm (accessed July 13, 2005).
88
Colorado Health Institute
Mobile clinics have played a fairly prominent role among efforts aimed at providing dental care to low-income children in Colorado. In 1999, Anthem Blue Cross and Blue Shield provided a grant to the Kids in Need of Dentistry (KIND) dental charity to expand its outreach to rural areas of Colorado. The grant paid for the purchase of the Miles for Smiles Dental Van. Since the program’s inception, the Miles for Smiles van has treated approximately 6,000 children and traveled 9,000 miles. The van provides screenings, cleanings, x-rays, fillings, molar sealants, extractions and root canals.
One of Miles for Smiles early successes was bringing dental care to Craig in northwest Colorado. The story of the Miles for Smiles program in northwest Colorado illustrates both the strengths and weaknesses of a mobile clinic. In 1997, a public health nurse and other community members formed the Northwest Colorado Dental Coalition in response to children’s dental needs in a five-county area (Moffat, Rio Blanco, Grand, Routt and Jackson). At that time, there were no dentists accepting CHP+ or Medicaid children in the five counties, although five dentists had Medicaid provider numbers. There was a rumor that a dentist who accepted Medicaid was so overrun with Medicaid patients that he couldn’t cover his costs and his business went under. At the time, advocates had to “beg” private practitioners to see children. Children were often referred to Denver and not having transportation ended up in the hospital and given an antibiotic and/or pain killer. Families had no instruction on oral health.
Visits by the mobile clinic started out at three weeks a year, then advanced to six weeks, 10 weeks and three months (as of 2002). In July 2004, however, funding for the Miles for Smiles program ended. Fortuitously, the story has a happy ending. The community successfully solicited sufficient foundation funding and public grants, along with smaller donations of money and time from community members, to establish the Craig Dental Clinic.
The Miles for Smiles van is currently stationed in Denver, where the majority of KIND programs are responsible for its operation. It serves both inner-city neighborhoods and rural communities. A second mobile clinic will soon be put into operation by the University of Colorado School of Dentistry; funding for this clinic comes from a 2003 Dental Infrastructure Grant. The mobile clinic is scheduled to begin service in 2006. When the mobile clinic is not providing care to rural health centers and health fairs, it can be used in the state’s metropolitan areas.
89
Colorado Health Institute
An evaluation of the Miles for Smiles program was conducted by the Center for Human Investment Policy at the University of Colorado at Denver. The evaluation covered the first two years of program operation and investigated various dimensions of program operations including the collection of demographic data and treatment and outcome measures related to children served. Most of the children participating came from low-income families (58 percent had monthly incomes below $1,751) and were non-Hispanic white (60 percent). The majority of services provided were diagnostic (29 percent) or preventive (57 percent). Only 11 percent of the services were restorative. Nevertheless, 43 percent of the children for whom outcome data were collected had an improved condition from the initial to the most recent visit.118
The experience of the Miles for Smiles mobile van in rural Colorado demonstrated to funders that it was an efficacious way to reach populations with unmet need. Given the temporary availability of care and the challenges of staffing mobile clinics, however, it is not clear when mobile clinics are the most effective way to serve this population. Now that the Miles for Smiles van will be serving populations in Denver, which has a relatively rich combination of public and private safety net clinics and providers willing to accept Medicaid and CHP+ children, there appears to be a strong case for a careful evaluation of this mode of delivery.
BEST PRACTICE #6: NON-DENTAL PROVIDERSTooth decay is widely recognized as the most prevalent chronic disease among children. Because early childhood caries are known to be preventable, there is growing recognition that the risk of tooth decay should be assessed within the first few years of a child’s life.119 In his report on oral health care, Surgeon General David Satcher wrote, “Twenty-five percent of…children have never visited a dentist before entering kindergarten, despite widespread understanding that the dental caries process is established before age 2 and the recommendation of experts that children as young as 1 may benefit from a dental visit.”120
118 Center for Human Investment Policy. Final Report of a Two Year Evaluation of the Miles for Smiles Program.119 There are generally two schools of thought among professionals about when a child should have his or her first dental visit: by the first birthday or not until age 3. For a discussion of these perspectives, see CDHP White Paper listed below.120 DHHS. 2000. Oral Health in America: A Report of the Surgeon General..
90
Colorado Health Institute
The Children’s Dental Health Project asserts that because primary care providers see young children more frequently than dentists due to the American Academy of Pediatrics (AAP)-recommended periodicity of well-child visits, they have more opportunities to screen for tooth decay.121 Primary care clinicians who provide services to children include family practitioners, physician assistants, pediatricians, nurse practitioners, and obstetrician/gynecologists (during the pre-/postnatal care period).122 Involving primary health care providers in the screening for oral disease is a recent recommendation; therefore few quantitative studies were found demonstrating the efficacy of this approach.
In 2001 COHN, an organization of safety net dental clinics, formed the Children’s Oral Health Outcomes Partnership (COHOP) with the explicit purpose of increasing collaboration between dental and medical providers in Colorado. The group has established a quality improvement program to be instituted in medical settings and designed to intervene early and often in preventing childhood dental disease. Eight COHN member clinics are participating in this initiative.123
The outcome measures, based on current recommendations of the American Academy of Pediatric Dentistry and the AAP, include documenting the following information in a child’s medical chart: examination of teeth and gums; assessment of nutritional and eating habits that may put the teeth and gums at risk for dental disease; dietary counseling provided regarding tooth decay; parental guidance in teeth brushing; counseling on fluoride intake; and dental referral.
Beyond COHOP, it has been difficult to document the extent to which Colorado primary care clinicians screen patients, especially young children, for tooth decay. Full mouth dental evaluations by a medical provider are not a billable service under Medicaid. However, Medicaid’s EPSDT services, which include an assessment of vision, hearing, dental and mental health, should be conducted by a physician according to AAP’s periodicity schedule. While EPSDT screenings are billable under Medicaid, according to Colorado Medicaid rules, the dental component "shall not replace a full oral screen by a dentist." A further barrier to the effective implementation of this best practice
121 Children’s Dental Health Project (CDHP). 2003. The Interface between Medicine and Dentistry in Meeting the Oral Health Needs of Young Children: A White Paper.122 CDHP.123 http://www.cchn.org/activities/cohop.asp
91
Colorado Health Institute
is the limited availability of dental offices willing to treat low-income populations.
Colorado was recently chosen as the site for the Oral Health Disparities Collaborative Pilot by the Bureau of Primary Health Care and the Institute for Health Care Improvement. Five to six community health centers in Colorado will participate in this demonstration project to integrate the assessments and referrals of oral and primary health practitioners using evidenced-based strategies. The focus will be on the prevention of early childhood caries, improvement of perinatal outcomes, and strengthening the clinical linkage and management of diabetes and oral health. The pilot will include the tracking of physical and oral health outcomes.124
BEST PRACTICE # 7: XYLITOL GUMXylitol is a sweetener that is naturally found in some fruits, vegetables and plants. It has one-third the calories of sugar. Xylitol has generated a significant amount of interest in the last decade as numerous studies and analyses indicate that maternal and early childhood consumption of xylitol in chewing gum prevents the transmission and colonization of Streptococcus mutans (s. mutans) through the mother’s saliva and thus prevents the onset of caries in children. Little is known about the use of xylitol gum by mothers or children in Colorado. It appears, however, to hold promise as a low-cost, non-clinical preventive measure that could be added to school-based programs or instituted on a stand-alone basis.
124 Key informant interview, September 13, 2005.
92
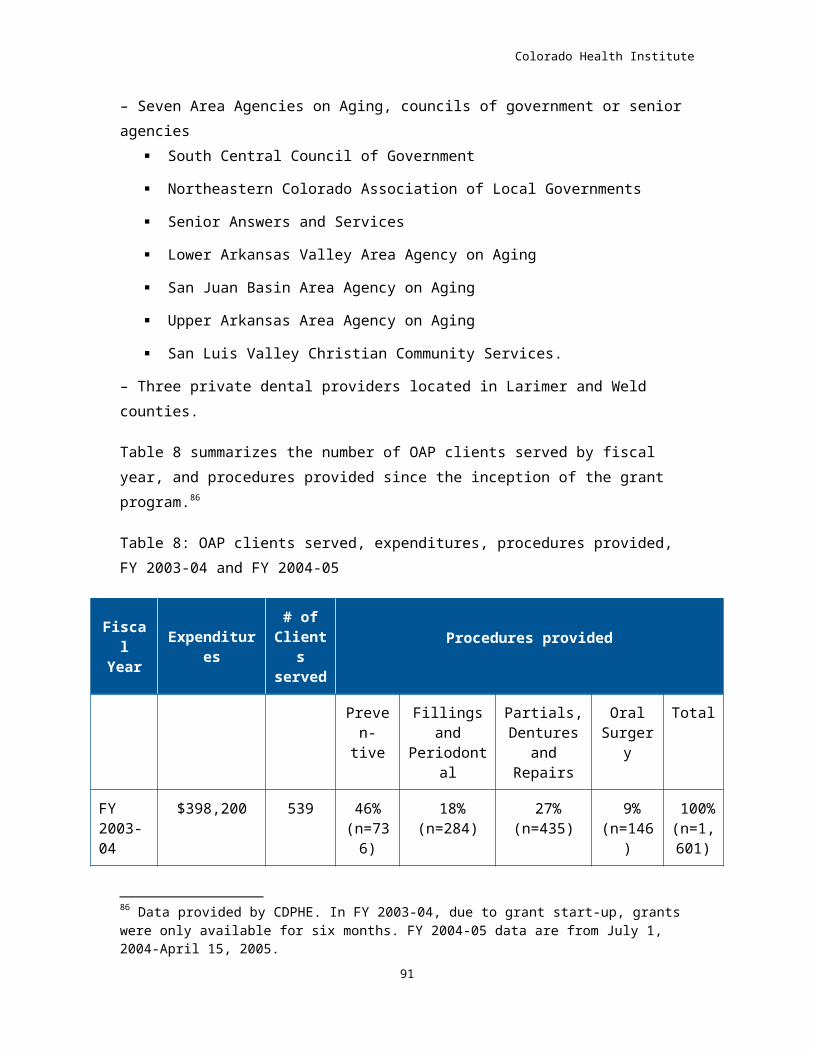
Colorado Health Institute
V. Promising initiatives from other states Based on research conducted by CHI, a number of states have implemented model programs that have received national recognition for attempting to improve dental health and access for underserved populations. (See Appendix D for complete descriptions of programs.) Many of these model programs could be considered for replication in Colorado.
WASHINGTON STATE: ABCD PROGRAMThe ABCD program works with dentists through a set of training modules to provide dental care to Medicaid-eligible infants and young children (birth through age 5) with an emphasis on seeing infants prior to their first birthday. Dentists can take continuing education courses in pediatric dentistry in the University of Washington Pediatric Dentistry program and receive certification in early pediatric dental care. Dental office staff is trained in interpersonal communication skills and specific follow-up strategies that enhance compliance with families enrolled in the program.
As an incentive to participate in the program, ABCD dentists receive higher reimbursements from Medicaid after completing the required training. For certain services, the Medicaid program increased the reimbursement from approximately 40-42 percent of usual and customary reasonable charges (UCR) to 70 percent.
NORTH CAROLINA: INTO THE MOUTHS OF BABESIn response to oral health care access concerns in North Carolina, a collaborative group created the Into the Mouths of Babes program. The group included the University of North Carolina (UNC) School of Dentistry, the state Medicaid agency, the state Division of Public Health, the UNC School of Public Health, the North Carolina Academy of Family Physicians and the North Carolina Pediatric Society.
The program trains physicians (pediatric and family practice), physicians’ assistants and nurse practitioners to deliver oral health services to high-risk Medicaid children from first tooth eruption until the age of 3 years. Medical providers are reimbursed for conducting a three-part procedure that consists of oral screening, face-to-face parent/caregiver education and the application of fluoride varnish. Children can have the procedure up to six times during the specified time period.
93
Colorado Health Institute
MINNESOTA: APPLE TREE DENTALApple Tree Dental provides oral health care to special needs populations, conducts education and research related to oral health, promotes health policy, and assists organizations and states in replicating the Apple Tree program.
Apple Tree has three clinic sites in Minnesota where patients can receive comprehensive dental care. These sites also provide mobile oral health care for special needs patients in nursing facilities, Head Start centers and group homes across the state. In addition, the program provides clinical training and education for dental students and practicing dentists.
SOUTH CAROLINA: INCREASING MEDICAID DENTAL RATESAfter a state assessment indicated that dental caries was the top health problem of children in South Carolina’s Early Periodic Screening, Diagnosis and Treatment program, the state implemented a number of reform measures to encourage more dental providers to participate in Medicaid. As part of the reform package, on January 1, 2000, the state increased rates for Medicaid dental health services from an average of 35 to 75 percent of South Carolina dentists’ average fees (based on 1998 fees).125
In the August 2005 edition of Health Services Research, Paul J. Nietert and others published their findings regarding the impact of the Medicaid reform package on utilization of oral health services. The researchers found that “…the percent of Medicaid enrollees receiving dental services was significantly greater in the year 2000 than what would have been expected had the reform not occurred, given the trends observed in 1998-99.”126 For example, in 1998 and 1999, the number of oral health procedures billed was 839,849 and 828,731, respectively. In 2000, however, the number of procedures increased to 1,175,882 or 42 percent over the previous year. In a separate analysis, the researchers found that the number of dentists who provided at least 10 Medicaid services per quarter increased from 26 percent in 1999 to 34 percent in 2000. According to the researchers’ informant interviews, while a number of factors influenced the reform package’s success, the increase in reimbursement was the main reason for increased participation and utilization.
125 Nietert, Paul, et al. August 2005. “The Impact of an Innovative Reform to the South Carolina Dental Medicaid System.” Health Services Research 40(4):1080.126 Nietert, Paul, et al. August 2005.
94
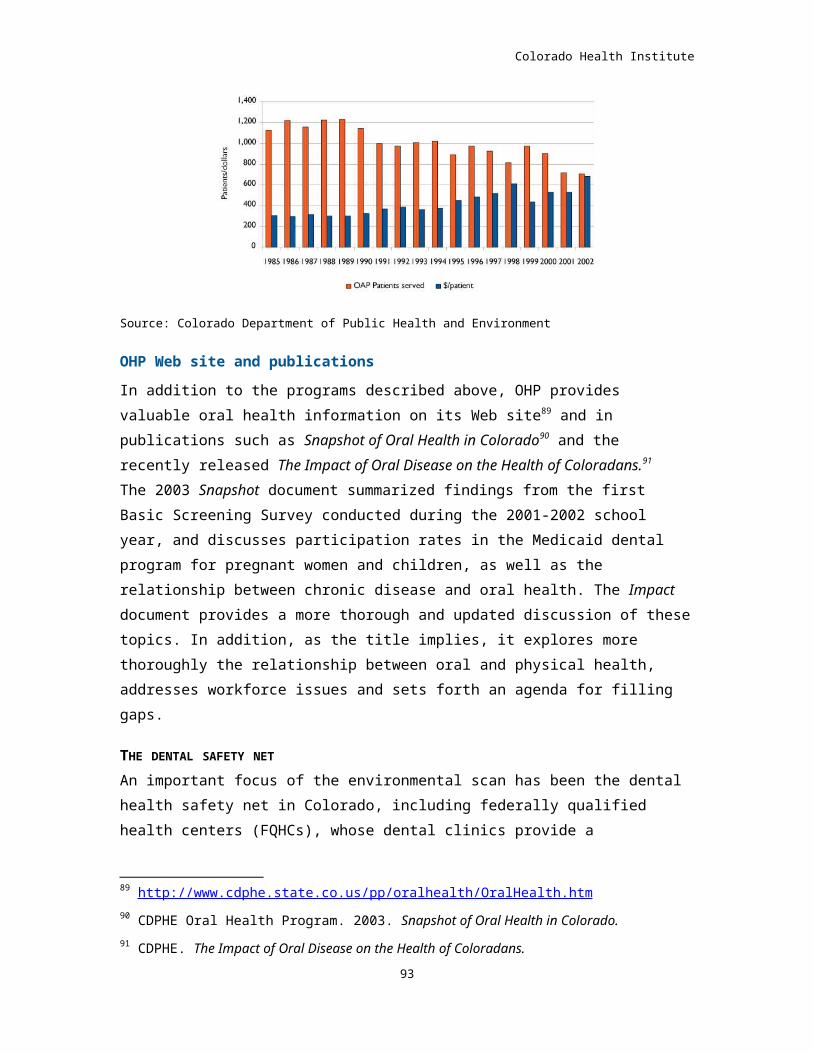
Colorado Health Institute
A number of other states have increased reimbursement rates in order to expand the number of dentists serving Medicaid clients. Table 9 summarizes the percent change in the number of Medicaid participating dentists after seven states implemented major fee increases in their Medicaid reimbursement rates.
95
Colorado Health Institute
Table 9. Percent change in dentist participation in Medicaid after major fee increases127
State
Months after major
fee increase
and March 2005
Percent change in dentists
participating in
Medicaid
Alabama 44 117%
Delaware 48From 1 to
130 dentists
Georgia 48 825%
Indiana 54 58%
Michigan (Healthy Kids Dental) 48 300%
South Carolina 42 88%
Tennessee 20 81%
OHIO: SCHOOL SEALANT PROGRAM The Ohio Department of Health’s Dental Sealant Program is the largest school-based sealant program in the United States. It began in 1984 as a demonstration program in Cincinnati and increased to 21 sealant programs in the state in 2005. Approximately 29,000 children were served in FY 2003-04. About four teeth were sealed per 2nd- and 6th-grade student at a cost of $35-40 per child during calendar year 2004. The program’s success has resulted in it being highlighted by the CDC and selected as a “state practice example” by the Association of State and Territorial Dental Directors.
Much of the program’s success is credited to the focus on local involvement. The state provides funding and monitoring and also organizes an annual “sealant sharing” day, which includes continuing education for local providers. The local grantees, however, are responsible for the program’s day-to-day implementation. 127 Children’s Dental Health Project. June 15, 2005. Dental Benefits in the Medicaid/CHP+ Streamlining HIFA Waiver, p. 25.
96

Colorado Health Institute
Research conducted by the Ohio Department of Health concluded that the prevalence of dental sealants among 8-year-old children in Ohio increased from 11 percent (1987-88) to 26 percent (1992-93) to 30 percent (1998-99). Data for the current year should be available shortly.
97