improving child oral health and reducing child oral … child oral health and reducing child oral...
TRANSCRIPT

Improving Child Oral Healthand Reducing Child Oral
Health Inequalities
Report to the Minister of Health from the
Public Health Advisory Committee
May 2003
Incorporating the Public Health Advisory CommitteeTe Ròpù Tohutohu I Te Hauora Tùmatanui

Members of the Public Health Advisory Committee
Mr Kevin Hagre (Chair)
Dr Cindy Kiro
Ms Lynette Stewart
Dr Robert Logan
Mr Geoff Forgere
Professor Neil Pearce
Margaret Earle and Bronwyn Petrie provided the Public Health Advisory Committeesecretariat support for this project.
Acknowledgements
The members of the Public Health Advisory Committee wish to acknowledge the usefulcontribution a number of people gave to this project.
ISBN (Document): 0-478-25309-5ISBN (Internet): 0-478-25310-9
HP: 3630
National Advisory Committee on Health and Disability(National Health Committee)
WellingtonMay 2003
This report is available on the NHC’s website: http://www.nhc.govt.nzCopies are available by phoning 04 496 2277, e-mail: [email protected]
This report can be freely quoted, copied and circulated with appropriate acknowledgement.

Foreword
Oral health is about much more than having good teeth. It is critical to good health and wellbeingfor children and in adulthood.
The Public Health Advisory Committee chose to look in detail at child oral health as an areawhere there are significant health inequalities. Child oral health provides a useful illustration ofhealth inequalities as there are relatively good data and a number of recent New Zealand studieshave examined the nature and causes of oral health inequalities.
Oral health was also chosen because it is often considered in isolation from other health issues andtends to be poorly integrated into health services. The Public Health Advisory Committee wasalso aware that the establishment of District Health Boards provides an opportunity to betterintegrate oral health into health planning and provision, both at local and national levels.
The following report, and attached background paper commissioned from a team at the Universityof Otago, detail inequalities in child oral health, examine factors that contribute to development ofthese inequalities, and identify areas for action.
The Public Health Advisory Committee hopes that this report will increase understanding abouthealth inequalities and their causes, provide a platform to improve child oral health, and increaseawareness of the inter-relationships between child oral health, health services and the widerdeterminants of health.
Kevin HagueChairPublic Health Advisory Committee
PHAC Advice to the Minister of Health i

ii PHAC Advice to the Minister of Health

Contents
Foreword .................................................................................................................................................... i
Executive Summary ................................................................................................................................ 1
Summary of recommendations ............................................................................................................. 3
1. SETTING THE SCENE .................................................................................................................. 6
1.1 About the Public Health Advisory Committee ................................................................. 6
1.2 About this report ................................................................................................................... 6
1.3 Child oral health and inequilities ........................................................................................ 7
2. PRIORITIES FOR ACTION ........................................................................................................... 9
2.1 Influencing socioeconomic determinants .......................................................................... 9
2.2 Improving Màori oral health status .................................................................................... 11
2.3 Fluoridation ............................................................................................................................ 15
2.4 Reorienting oral health services .......................................................................................... 19
2.5 A responsive and skilled workforce ................................................................................... 22
2.6 Better information about child oral health and inequalities ........................................... 24
2.7 Using child oral health as an indicator of health inequalities ......................................... 26
Child Oral Health in New Zealand :A background report to the Public Health Advisory Committee .............................................. 29–94
PHAC Advice to the Minister of Health iii

iv PHAC Advice to the Minister of Health

PHAC Advice to the Minister of Health 11
Executive Summary
Clear inequalities exist in the oral health of New Zealand children, especially among Màoriand Pacific children and those from low socioeconomic status (SES) families. There is,however, enormous scope to reduce these inequalities, as most dental disease is preventable.
This report by the Public Health Advisory Committee (PHAC) includes the Committee’sadvice to the Minister of Health on how to improve child oral health and reduce inequalitiesin child oral health in New Zealand. At the beginning of this project, the PHAC commissioneda background paper on child oral health and inequalities from a team at the University ofOtago. The paper provides detailed information about child oral health inequalities, and isattached at the end of this report.
By taking a lifecourse approach, which considers health and non-health influences throughoutthe life span and between generations, this PHAC report has identified a range of factorsthat contribute to oral health inequalities as well as potential areas for action.
Over recent decades, there have been gains made in child oral health in New Zealand, butthese have levelled off more recently. The prevalence and severity of child dental cariesvaries considerably between District Health Board (DHB) regions. On average Màori andPacific children have worse oral health than other New Zealand children. There is alsosubstantial evidence of poorer child oral health in lower SES groups relative to their higherSES counterparts. Children in rural areas are at higher risk of poor oral health than theirurban peers.
Socioeconomic differences in oral health reduce during school years when children generallyhave access to free dental care but these inequalities re-emerge in adulthood. This emphasisesthe impact and importance of access to free oral health services during school years.
Oral health data provide some understanding of how a range of health and non-health factors,from before birth and throughout life, influence health status. This lifecourse approachprovides an opportunity to develop a better understanding of the complexity of factors thatcontribute to health inequalities. The data from the Dunedin Multidisciplinary Health andDevelopment Study (DMHDS) suggests that as well as socioeconomic status and ethnicity,factors such as maternal oral health and maternal education levels influence child oral health.The data also suggest that adult oral health inequalities are strongly influenced by childhoodexperiences, such as knowledge of dental hygiene and access to services.
Actions to improve child oral health and reduce health inequalities need to occur both withinthe health sector and the wider policy arena. This is consistent with the principles of theOttawa Charter for Health Promotion.

2 PHAC Advice to the Minister of Health
The PHAC has identified seven areas where it believes changes or improvements can bemade:
1. Influencing socioeconomic determinants.
2. Improving Màori oral health.
3. Encouraging fluoridation.
4. Reorienting oral health services.
5. A responsive and skilled workforce.
6. Better information about child oral health and inequalities.
7. Using child oral health as an indicator of health inequalities.
Policy changes that improve socioeconomic status of families have the potential to benefitchild oral health. There is evidence of substantial oral health inequilities in New Zealandwith Màori children and adolescents experiencing a high prevalance and severity of dentalcaries. Improving Màori health must be a priority. At the community level, fluoridation ofwater supplies is an effective action to prevent tooth decay with clear benefits for Màori,Pacific people and children from low socioeconomic groups, which contribute to reducinginequalities in oral health status.
Changes are also needed within the oral health services to ensure that all children have accessto quality oral health services, particularly in their preschool years. Ensuring that all childrenlearn oral hygiene skills is also a key component of reducing child oral health inequalities. Areorientation of oral health services is needed to ensure that all children can access appropriateservices from preschool onwards. Reducing child oral health inequalities also has workforceimplications.
The background paper suggests that child oral health has the potential to be an effectiveindicator of health inequalities in New Zealand, as data are routinely collected on dentalcaries (tooth decay) at age 5 and Year 8 (Form II). In order to achieve this and reduceinequalities in child oral health, there is a need to reconsider the collection of data on childoral health and to research priority areas.

PHAC Advice to the Minister of Health 3
Summary of recommendations
1. Influencing socioeconomic determinants
A range of non-health factors across the lifespan influence child oral health inequalities.Changes to socioeconomic determinants of health are likely to have the greatest impact onreducing child oral health inequalities. However making changes at this level is challengingand hard to measure. One practical approach is to assess policy for its impact on healththrough health impact assessment. The Public Health Advisory Committee is currentlydeveloping tools to assist New Zealand policy makers to do this.
The Public Health Advisory Committee recommends that the Minister of Health:
♦ invites her parliamentary colleagues to require policy makers to work collaborativelyto improve child oral health
♦ recognises the value of health impact assessment tools in assessing the impact ofsocial and economic policy proposals on child oral health and promotes Public HealthAdvisory Committee’s health impact assessment tools widely among herparliamentary colleagues, once this work is completed.
2. Improving Màori oral health status
Urgent action is required to address oral health inequalities in New Zealand. He KorowaiOranga (the Màori Health Strategy) provides strong direction for improving the oral healthof Màori children in New Zealand. Action and commitment are needed at the broadgovernment level, within the health sector and the dental profession, and among Màori.
The Public Health Advisory Committee recommends that the Minister of Health:
♦ directs the Ministry of Health to fund evaluation of current Màori oral healthinitiatives
♦ requires the Ministry of Health to continue to evaluate and monitor mainstreamoral health services for their impact on Màori oral health
♦ encourages District Health Boards to make further funding available to improveMàori oral health status.
3. Fluoridation
Fluoridation of community drinking water is not only effective in reducing dental decay inchildren, but also contributes to reducing ethnic and socioeconomic inequalities in oral healthstatus. The Sanitary Works Subsidy Scheme provides a new funding mechanism to helpmeet the costs of setting up fluoridation schemes. This will provide an opportunity to increasethe number of communities with fluoridated water supplies. Alternatives to waterfluoridation need to be considered in small communities where water fluoridation is notfeasible.

4 PHAC Advice to the Minister of Health
The Public Health Advisory Committee recommends that the Minister of Health:
♦ urges local authorities to fluoridate community water supplies and requires theMinistry of Health to continue to monitor the effectiveness of fluoridation in reducingoral health inequalities
♦ requests the Ministry of Health and District Health Boards to actively encouragenon-fluoridated communities to make applications to the Sanitary Works SubsidyScheme
♦ requests District Health Boards and local authorities to work collaboratively topromote fluoridation of community water supplies
♦ requires the Ministry of Health to promote research into the most cost-effective andappropriate alternatives to water fluoridation in communities where fluoridation isnot feasible.
4. Reorienting oral health services
School dental services play a key role in the oral health of New Zealand children, but thereare disparities in access to services. Màori, Pacific, rural and transient children and childrenfrom low socioeconomic families are less likely to use oral health services than their peers,particularly in preschool years. Reorientation of oral health services is needed to ensure thatall children can access appropriate services from preschool onwards.
The Public Health Advisory Committee recommends that the Minister of Health:
♦ asks the Ministry of Health to actively promote research into effective strategies forimproving preschool uptake of dental services, especially among Màori, Pacific,rural, transient children and children from low socioeconomic groups
♦ requests the Ministry of Health to examine enhancing the national school-baseddental service with linkages into preschool and adolescent settings
♦ requests the Oral Health Advisory Group to monitor the actions taken on therecommendations in this Public Health Advisory Committee report.
5. A responsive and skilled workforce
New Zealand needs a dental health workforce that can respond to changes within dentalservice provision and the country’s demographic composition. At present there is a disparitybetween the ethnic composition of the dental workforce and New Zealand’s populationdemographics. A focus on improving Màori child oral health will increase demand for alarger and skilled Màori dental workforce. Likewise there will be a need for more Pacificdental workers.

PHAC Advice to the Minister of Health 5
The Public Health Advisory Committee recommends that the Minister of Health:
♦ asks the Oral Health Advisory Group to report on the progress that has been madeon the directions for the dental health workforce as outlined in the 1998 report ofthe Dental Council of New Zealand
♦ asks the Oral Health Advisory Group to report on strategies to develop the Màoriand Pacific oral health workforce.
6. Better information about child oral health and inequalities
Data on 5-year-olds and Year 8 students is the only systematic collection of information aboutthe oral health of New Zealand children. Further information and research is needed to gaina better understanding of appropriate strategies to reduce child oral health inequalities.
The Public Health Advisory Committee recommends that the Minister of Health:
♦ requires the Ministry of Health and District Health Boards to systematically re-examine child oral health data collection in order to improve data collection
♦ urges the Ministry of Health and District Health Boards to collect data on childhealth at unit record level for 5-year-old and Year 8 children
♦ asks the Oral Health Advisory Group to prioritise information and research gapsidentified in the background paper and propose a plan for actioning these.
7. Using child oral health as an indicator of health inequalities
Child oral health has the potential to be an indicator of health inequalities, as dental caries isa disease where data are routinely collected at age 5 and at Year 8, and for which inequalitiesare readily observed. The Public Health Advisory Committee is of the view that dental cariesdata for 5-year-olds should be used in preference to Year 8 data, as inequalities are morepronounced during the preschool period.
The Public Health Advisory Committee recommends that the Minister of Health:
♦ requests that the Ministry of Health use dental health data on 5-year-olds as anindicator of health inequalities.

6 PHAC Advice to the Minister of Health
1. SETTING THE SCENE
1.1 About the Public Health Advisory Committee
The Public Health Advisory Committee (PHAC/the Committee) was established as a sub-committee of the National Advisory Committee on Health and Disability (National HealthCommittee, NHC) in 2001 under the New Zealand Public Health and Disability Act 2000.The PHAC is required to provide advice to the Minister of Health on the following matters:
a. public health issues, including the factors underlying the health of people andcommunities
b. the promotion of public health
c. the monitoring of public health
d. any other matters the National Health Committee specifies by notice to the committee.
In 1998 the NHC published ‘The Social, Cultural and Economic Determinants of Health in Zealand’(the Determinants Report)1 which highlights large inequalities in health across the country.A focus on reducing health inequalities continues to be a major component of the NHC’swork. The PHAC is committed to providing ongoing and evidence-based advice on the bestways to reduce health inequalities in New Zealand.
1.2 About this report
This report provides information and advice to the Minister of Health about improving childoral health status and reducing child oral health inequalities. It:
♦ explains the PHAC’s reasons for examining child oral health
♦ details the PHAC’s recommendations on how to improve child oral health and reducehealth inequalities.
In 2001 the PHAC decided to undertake a project on child oral health as a case study of bothhealth inequalities and the lifecourse approach.
It commissioned a background paper2 from the University of Otago (hereafter referred to as‘the background paper’). The authors were: Murray Thomson, Associate Professor in DentalPublic Health; Kathryn Ayers, Senior Lecturer in Dental Public Health; and John Broughton,Associate Professor (Department of Social and Preventive Medicine) and Director of the NgaiTahu Màori Health Research Unit (Te Roopu Rangahau Hauora o Ngai Tahu). The backgroundpaper, Child oral health inequalities in New Zealand: A background paper to the Public HealthAdvisory Committee, was independently peer reviewed and is attached to this report.
On the basis of the evidence in the background paper, the PHAC formulated draft adviceand recommendations to reduce child oral health inequalities in New Zealand. It discussedthese with the authors of the paper and sought feedback from key stakeholders beforefinalising its advice to the Minister of Health.

PHAC Advice to the Minister of Health 7
1.3 Child oral health and inequalities
Child oral health in New Zealand
The most recent national dental survey showed that, in the 15 years to 1988, New Zealandwent from having one of the highest levels of dental disease in the developed world to a verylow level in children aged 12 and 13 years.15 Caries rates in New Zealand children continuedto decrease until the early 1990s, but have either remained static or increased slightly since.Data on caries severity and the percentage of caries-free children for the years 1990 to 1999are presented in Figures 3 and 4 of the background paper (page 48).
The background paper prepared by the University of Otago suggests considerable regionalvariation in the prevalence and severity of tooth decay.
♦ Five-year-olds in the Wellington, Waitemata and Otago DHBs had the least tooth decaywith the mean number of missing or filled teeth (mft)i being 1.1, 1.3, and 1.4 respectively.
♦ Five-year-olds in Northland, Tairawhiti and the West Coast DHBs had the most toothdecay with mean mft scores of 3.3, 3.2 and 2.6 respectively. This equates to 65 percentof 5-year-olds in Northland and Tairawhiti and 60 percent in the West Coast havingdental caries.
♦ Year 8 data showed that Wairarapa, Waitemata Nelson-Marlborough and Wellingtonregions had the greatest proportion of caries-free children (49%, 50%, 50% and 56%respectively), with MFTii scores of 1.2, 1.3, 1.3 and 1.0 respectively.
♦ The Year 8 data showed that the regions with the smallest proportion of caries-freechildren were the Bay of Plenty, Southland and Taranaki (29%, 29% and 34%respectively), with MFT scores of 2.4, 2.0 and 2.0.
Fluoridation of water supplies has an impact on reducing child oral health inequalities.Overall, the regions with the highest percentage of children receiving fluoridated water havethe lowest overall rates of tooth decay. Generally, these regions also have lower socioeconomicand ethnic differences in dental health.
Inequalities in child oral health
The PHAC chose to focus on child oral health inequalities for a number of reasons.
♦ Oral health affects health status.
♦ The New Zealand Health Strategy3 calls for inequalities in health to be addressed. Italso calls for child health to be improved and oral health to be addressed.
♦ There is a need to address child health as part of the Child Health Strategy.4
i missing or filled deciduous (baby) teeth.ii Missing or Filled (permanent) Teeth.

8 PHAC Advice to the Minister of Health
♦ There is enormous scope for reducing inequalities in oral health, as most dental diseaseis preventable. Reducing inequalities in oral health is fair, as children have only limitedcontrol over the factors that determine their oral health. Reducing child oral healthinequalities benefits wider society by potentially freeing up scarce health systemresources and reducing the time parents/whànau spend away from more productiveactivity.2
♦ Diseases of the teeth and gums are among the most common health problems for allage groups.5
♦ There is increasing concern that an epidemic of dental decay in certain parts of NewZealand is impacting negatively on certain groups of New Zealanders, namely Màoriand Pacific people, and people from low socioeconomic status (SES) groups. There issubstantial evidence of poorer oral health in lower SES groups relative to their higherSES counterparts.
The lifecourse approach
The PHAC considered it important to examine child oral health in the context of the lifecourseapproach and not simply to outline the state of child oral health inequalities at a point intime. The lifecourse approach is a framework that has grown out of research on healthinequalities. It provides a way of conceptualising how social, economic, cultural andenvironmental factors impact on health and contribute to health inequalities throughout thecourse of a person’s life.
The lifecourse approach shows how adverse exposures can gradually accumulate during thecourse of an individual’s life to create ill health episodes. The adverse exposures can forexample be due to environmental factors (eg, poorly insulated houses which can lead torespiratory problems throughout life) or to behaviours, which increase the risk of chronicdisease or mortality (eg, poor diet can lead to diabetes in later life).
The lifecourse approach also identifies some periods or phases in early life that are particularlycritical in determining health status in adulthood and later years. It illustrates theintergenerational nature of health inequalities and provides a valuable way of viewing healthinequalities over time.

PHAC Advice to the Minister of Health 9
2. PRIORITIES FOR ACTION
In reviewing the findings of the background paper prepared by the Otago University researchteam and additional information gathered by the PHAC, the Committee identified sevenareas for action:
1. Influencing socioeconomic determinants.
2. Improving Màori oral health.
3. Encouraging fluoridation.
4. Reorienting oral health services.
5. A responsive and skilled workforce.
6. Better information about child oral health and inequalities.
7. Using child oral health as an indicator of health inequalities.
The following section discusses these areas and presents the PHAC’s recommendations tothe Minister of Health.
2.1. Influencing socioeconomic determinants
The factors that determine child oral health do not lie only within the health sector.Intervention and action to influence socioeconomic determinants of health are likely to havethe greatest impact on improving child oral health and reducing inequalities. Specifically,improving Màori social and economic status will lead to health gains for Màori includingimproved Màori oral health. Changes at this level are the most challenging and hard tomeasure and evaluate.
In considering child oral health inequalities, the PHAC has looked at how factors from beforebirth, during childhood and throughout life impact on people’s health status. Most of thesefactors are outside the health sector.
The background paper on child oral health inequalities provides clear examples of factorsthat influence oral health. Data from the Dunedin Multi-disciplinary Health and DevelopmentStudy (DMHDS) indicates that a major component of adult oral health inequalities originatein childhood.2 It also highlights that children born to younger or less educated mothers, orwho live in rural areas, may have increased risk of dental caries compared with other children.Poor maternal oral health has also been linked to poor child oral health.2
The background paper presents evidence to suggest that the structural “reforms” which tookplace between 1990 and 1992 resulted in an increase in the prevalence of poverty amongNew Zealanders. This may be associated with a worsening of the inequalities in the oralhealth of Màori and Pacific 5-year-olds relative to their non-Màori and non-Pacificcounterparts (see Chapter 4 of the background paper for more detail).

10 PHAC Advice to the Minister of Health
Creating healthy public policy
Social and economic policies impact on oral health. The background paper suggests theneed for:
♦ close intersectoral scrutiny of any proposed policy changes which are likely to havehealth consequences (negative or positive)
♦ a reduction in the proportion of the population who are living in poverty
♦ improved education and income distribution
♦ an advancement of Màori oral health in a Treaty of Waitangi framework.2
A commitment is needed across government agencies to assess the potential health impactsof public policy. It is important to consider the negative and positive health impacts of socialand economic policies on child oral health. Assessing potential policies for their impact onhealth was raised in the National Health Committee’s 1998 Determinants Report.1 The NewZealand Health Strategy also recognises the need “to assess public policies for their impacton health and health inequalities.”3
The PHAC is currently undertaking work on Health Impact Assessment (HIA), a formalprocess to predict and assess the potential impacts of a policy on health. The HIA projectaims to:
a. advise the Minister of Health on ways of ensuring that health is considered in policymaking across all sectors
b. put health on the agenda of policy makers across sectors to ensure healthy public policy
c. facilitate the Government’s sustainable development approach to public policy byworking cross-sectorally to influence the wider determinants
d. develop a set of tools that can be used to assess the impacts of public policy on healthand health inequalities in New Zealand.
The PHAC will provide advice to the Minister of Health on health impact assessment,including recommendations for its application in New Zealand, in mid-2003.
Building healthy public policy is one of the five strands of the Ottawa Charter for HealthPromotion. The Ottawa Charter for Health Promotion provides a framework for recognisingactions that need to occur at both a policy level and within communities.6 This charterrecognises the importance of tackling determinants outside the health sector as well as usingpolicy to create environments that are supportive of healthy choices. Key policy initiativesthat will assist in reducing oral health inequalities are equitable access to educationalopportunities and adequate income for families.
A cohesive, collaborative and intersectoral approach to policy on oral health matters isrequired, specifically in addressing child oral health inequalities in New Zealand. Governmentagencies are acknowledging the value of working collaboratively. This is recognised in theState Services Commission’s Review of the Centre, which emphasised a whole of governmentapproach and recommended the need for integrated service delivery, tackling fragmentationand improving alignment between agencies.7

PHAC Advice to the Minister of Health 11
Summary
A range of non-health factors across the lifespan influence child oral health inequalities.Changes to socioeconomic determinants of health are likely to have the greatest impact onreducing child oral health inequalities. However making changes at this level is challengingand hard to measure. One practical approach is to assess policy for its impact on healththrough health impact assessment. The PHAC is currently developing tools to assist NewZealand policy makers to do this.
The Public Health Advisory Committee recommends that the Minister of Health:
♦ invites her parliamentary colleagues to require policy makers to work collaborativelyto improve child oral health
♦ recognises the value of health impact assessment tools in assessing the impact ofsocial and economic policy proposals on child oral health and promotes PHAC’shealth impact assessment tools widely among her parliamentary colleagues, oncethis work is completed.
2.2 Improving Màori oral health
There is evidence of substantial oral health inequalities in New Zealand with Màori childrenand adolescents experiencing a high prevalence and severity of dental caries. Urgent actionis required to address these inequalities. Addressing Màori oral health is a high priority forMàori health, with significant potential health gains.
Màori oral health status
Statistics and studies consistently show that Màori have worse oral health than non-Màori.For example, Màori children are three times more likely than other New Zealanders to havehigher caries rates.24 Data on the oral health status and service utilisation of Màori childrenclearly indicates higher oral health needs and major service gaps compared with non-Màori.8
Further, there is anecdotal evidence of very young Màori children needing teeth extractedbecause of decay9 and of Màori children not having a toothbrush or toothpaste and not learninghow to brush their teeth.
Effective brushing and other oral health messages must be appropriately delivered, and shouldnot ‘blame’ parents or families of children with poor oral health. A Health Funding Authorityreport on Màori suggests that Oranga Niho and Oranga Hata, oral health services developedin Otago, provide good examples of effective oral health messages.10
The background paper outlines a number of specific health-related behavioural andenvironmental factors that may be linked to the poor dental health status of tamarikiiii Màori,some of which are highlighted below.
♦ The perception of the “murder house” is still widespread among Màori, especiallyadults. This negative attitude may be transferred to the younger generation. Alsoparental oral care practices set important examples for their children, as oral healthcare is a learned behaviour.
iii Children.

12 PHAC Advice to the Minister of Health
♦ Parents may be whakamaiv about their own oral health, and as a consequence theymay avoid taking their preschool children to the school dental clinic.
♦ Accessibility (distance needed to travel and a lack of adequate transport) may precludethe use of oral health services by many Màori. This is particularly important in ruralor isolated areas, where, not only is the school dental clinic some distance away, butthe dental therapist may be there for only a few weeks every year.
♦ Some Màori families are highly mobile, living in different parts of the country forvarying periods of time, and it is not uncommon for some of these children to attend anumber of schools over a two-year period. School dental services are also more mobilethan in the past and so dental staff are unlikely to be aware of which children aremissing out on dental care.
♦ For Màori, living in non-fluoridated rural areas, topical fluoride may be the only sourceof fluoride. If toothpaste is not purchased, the whànau miss out on the benefits fluoride.
♦ Màori cultural constructs may impact on health care beliefs and practices, for example,the concept of tapuv of the body is very important. To avoid causing offence, oralhealth professionals need to be culturally competent.
Meeting Treaty obligations
The Treaty of Waitangi confers a special responsibility on the Crown to protect the healthand wellbeing of Màori and places an obligation on the Crown to address inequalities inhealth, which includes oral health. The Treaty principles of partnership, participation andprotection form the basis of the relationship between Màori and the Crown with respect tohealth and health services (including oral health and oral health services).
He Korowai Oranga (the Màori Health Strategy) outlines how these principles relate to healthand health services:
♦ Partnership means working together with iwi, hapù, whànau and Màori communitiesto develop strategies for Màori health gain and appropriate health and disabilityservices.
♦ Participation means involving Màori at all levels of the health sector in planning,development and delivery of health and disability services.
♦ Protection means ensuring Màori enjoy at least the same level of health as non-Màoriand safeguarding Màori cultural concepts, values and practices.11
The fundamental aim of He Korowai Oranga is whànau ora: Màori families supported to achievetheir maximum health and wellbeing. He Korowai Oranga sets a new direction for Màorihealth development over the next decade, while building on the gains made over the last 10years. A separate Màori Health Action Plan, Whakatàtaka accompanies He Korowai Oranga.This specifies the roles, responsibilities, performance expectations, measures and initiativesfor achieving the strategy.
iv A state of mind and the behaviour associated with it. There is no one word English translation for whakamabut it encompasses such things as shame, embarrassment or shyness.
v Restricted; sacred.

PHAC Advice to the Minister of Health 13
The health needs of Màori are paramount under the Treaty of Waitangi and effort needs tobe directed at improving Màori child oral health. He Korowai Oranga provides an effectiveframework for action to occur at all levels.
Action at a number of levels
The background paper identifies that in order to reduce child oral health inequalities actionis needed: at government level; within the health sector and dental profession; and amongMàori themselves.2
Government
The New Zealand Health Strategy identified oral health as one of 13 population healthobjectives.3 Oranga nihovi is an important part of He Korowai Oranga. To achieve this resourcesare required to be available and targeted where they are most needed.
The health sector
Consistent with the New Zealand Health Strategy and He Korowai Oranga, Màori oral healthmust be a focus for District Health Boards (DHB). Investing resources now in improvingchild oral health may prevent future costs.
In 1999, the New Zealand Dental Association report New Zealand Oral Health Goals for theNew Millennium12 identified Màori oral health as a key issue and set specific goals and targetsfor the profession to work towards in partnership with Màori. The objective was “to reducethe prevalence of dental caries among New Zealand children and adolescents”.
At a service provision level, dental providers under contract with DHBs are required to ensurethat their services are accessible and appropriate to meet the oral health care needs of Màori.The National Service Specifications for child dental services specify that dental services must“contribute to Màori health gain objectives, in particular, targeting services to impact onMàori oral health”.13
Strong Màori participation is needed if strategies and services are to respond to and be effectivefor Màori.10
Màori initiatives
There are a number of local Màori initiatives currently underway which seek to enhancelocal oral health services and improve Màori oral health. The background paper suggeststhat Màori dental provider services, operating under a kaupapavii Màori approach, havesignificantly improved the health of Màori, and some currently have the capability andcapacity to provide oranga niho services.2 Examples of such services include:
♦ Tipu Ora, Tupohopu Health Centre, Ohinemutu, Rotorua
♦ Te Whare Kaitiaki, School of Dentistry, The University of Otago
♦ Te Atiawa Dental Service, New Plymouth.
vi Oral health.vii Strategy, theme.
14 PHAC Advice to the Minister of Health
Other Màori responses to improving child oral health include:
♦ the establishment of Te Ao Marama (the New Zealand Màori Dental Association) in1996
♦ a number of Màori health promotion resources and approaches that have beensuccessfully developed and used over the last three to four years.
Hauora Whanui, a Màori health service provider in Northland, has developed one exampleof a Màori oral health initiative. As part of the “brush in” programme Hauora Whanuiprovides toothbrushes, toothpaste and oral health information to every child in the Mid-Northland area, whose parents consent to the service. Throughout the region, oral healthpromotion workers visit all local primary schools and kohanga reo. Daily tooth brushing atschool/kohanga is encouraged by Hauora Whanui, with the cooperation of the Board ofTrustees and school principals. Children enjoy being involved in the “brush in” programmesand schools and kohanga reo appear happy to have Hauora Whanui staff deliver a servicethat is “proactive in reducing health problems in their schools and kohanga reo”.viii
While at a local level this type of initiative appears to have been successful, there has beenlittle evaluation of the impact of specific initiatives on the oral health status of Màori children.A 2001 Ministry of Health review of publicly funded oral health care suggested there hadbeen little or no systematic cost-effectiveness evaluation of some Màori services andprogrammes.8
The PHAC recommends the evaluation of Màori initiatives and services in order to provideinformation about their effectiveness. PHAC also considers a need for ongoing evaluationof mainstream services, for example the school dental service, for the impact of their serviceson Màori and how they could be improved.
Summary
Urgent action is required to address oral health inequalities in New Zealand. He KorowaiOranga (the Màori Health Strategy) provides strong direction for improving the oral healthof Màori children in New Zealand. Action and commitment are needed at the broadgovernment level, within the health sector and the dental profession, and among Màori.
The Public Health Advisory Committee recommends that the Minister of Health:
♦ directs the Ministry of Health to fund evaluation of current Màori oral healthinitiatives
♦ requires the Ministry of Health to continue to evaluate and monitor mainstreamoral health services for their impact on Màori oral health
♦ encourages District Health Boards to make further funding available to improveMàori oral health status.
viii P Clarke, personal communication, February 2003.

PHAC Advice to the Minister of Health 15
2.3 Fluoridation
There is a wealth of evidence demonstrating the effectiveness of fluoride in preventing toothdecay.14 Fluoride is one of the most important preventive measures available against toothdecay at both the individual and the population level.14 Water fluoridation is an effectivepublic health measure for dental health and can reduce dental decay in children by as muchas 50 percent.15 However, despite a number of reviews indicating the health and cost benefits,controversy still surrounds the fluoridation of community water supplies.
The PHAC considers that the evidence on the benefits of fluoridation far outweighs anyevidence of risks associated with fluoridation. The Committee notes that there may be someminor risks associated with fluoridation, for example fluorosis.ix
One of the main concerns with water fluoridation relates to the individual’s right to choosetreatments, which opponents believe is compromised by mass fluoridation of water supplies.The PHAC is of the view that this concern has to be weighed against the rights of otherindividuals who wish to have fluoridated water supplies and the public health benefits offluoridation.
Currently about half of the New Zealand population receive an optimally fluoridated watersupply. The Drinking Water Standards for New Zealand 2000 recommend the adjustment ofwater fluoride to between 0.7mg/l and 1.0mg/l for oral health reasons.16
Responsibility for decision-making and funding for fluoridation lies with local authorities.Territorial local authorities have responsibilities to provide for the health and wellbeing ofthe public and therefore have to consider public health when making any decision aboutfluoridation. District Health Boards (DHB) also have a role to play and the Oral HealthToolkit15 emphasises the need for DHBs to work with communities and local authorities tosupport the introduction of fluoridated water.
Evidence about fluoridation
The National Health Service Centre for Reviews and Dissemination at the University of Yorkpublished a review of the epidemiological studies on water fluoridation and health (the YorkReport).17 This report reviewed the safety and efficacy of fluoridating drinking water. Inconfirming the beneficial effect of water fluoridation on dental caries, the York Report alsonoted that little high quality research on the impacts of fluoridation exists.
In 1999 the Ministry of Health published a report on the cost-effectiveness of fluoridatedwater in New Zealand. This report found that fluoridation is cost saving (dental costs savedexceeding fluoridation costs) for communities numbering 1,000 people or more.18 The reportconcluded that fluoridation is particularly cost-effective for communities with highproportions of children, Màori or people on low incomes.
Most studies show that water fluoridation provides benefits above and beyond those fromother fluoride sources alone (eg, toothpastes, tablets).16 Information has suggested that water
ix Dental fluorosis is a mild defect of the tooth enamel caused by the ingestion of fluoride during the developmentof the tooth. Fluorosis does not cause health problems beyond cosmetic effects. The level of fluoriderecommended by the New Zealand Drinking Water Standards 2000 of 0.7 to 1.0 mg/litre is specifically designed tominimise the risk of dental fluorosis.16

16 PHAC Advice to the Minister of Health
fluoridation is effective throughout the lifespan, not just for children.16 The lifetime benefitof exposure to water fluoridation is estimated to prevent a total of 2.4 to 12 decayed, missingor filled teeth for the average individual.19 At a population level, it is estimated that waterfluoridation prevents between 58,000 and 267,000 decayed, missing or filled teeth in NewZealand per year.19
Risks associated with fluoride
A number of studies and reports have examined the potential for adverse risks associatedwith fluoride. The York Report examined whether fluoride has negative effects and concludedthat there is no clear evidence of potential adverse effects on health, other than dentalfluorosis.17 With regard to fluorosis, it concluded that there is a strong association betweenwater fluoride concentration and the proportion of the population with dental fluorosis. It isestimated that at one part per million (mg/l), one in 24 people would develop fluorosis thatthey could find aesthetically concerning. This is the upper limit for the standards for addingfluoride to drinking water supplies in New Zealand.17
In 2000, the Institute of Environmental Science and Research Ltd in New Zealand examinedthe epidemiological evidence associated with fluoridation. This report, along with the YorkReport found no clear evidence of harmful effects associated with the optimal fluoridation ofcommunity water supplies but did suggest the need for further research.20
In 2002, an Irish Report from the Forum of Fluoridation also considered the benefits andrisks of water fluoridation and concluded that:
♦ Several ecological studies have found that rates of hip fracture are higher in communitieswith fluoridated drinking water compared with communities without fluoridation.However these studies did not control for several factors known to be associated withrates of fracture, including the use of oestrogen, smoking and body weight.
♦ Epidemiological studies have shown that long-term exposure to fluoridation does nothave an adverse effect on bone density, bone mineral density or fracture incidence.21
In considering the risks associated with fluoridation of community water supplies, the PHACconcludes that these are not well established and require further high quality research. TheCommittee considers that the evidence for the benefits of fluoridation outweighs the risks offluoridation.
Findings from the background paper on child oral health inequalities in New Zealand
An important finding of the background paper was that children in regions with the highestprovision of fluoridated water had the lowest prevalence and severity of tooth decay.
Variation in the prevalence and severity of tooth decay was more evident in regions with thelowest provision of fluoridated water. For example, in Nelson-Marlborough, no childrenreceive an optimally fluoridated water supply, yet the caries-free percentage and mft scoresof 5-year-olds are moderate (50% and 2.2 respectively) and even better at Year 8 (51% and1.3). In contrast in Northland, where children also do not receive optimally fluoridated water,only 35 percent of 5-year-olds are caries-free, (mean mft is 3.3) and for 12- and 13-year-olds(Year 8) only 35 percent are caries-free (MFT is 1.8).
PHAC Advice to the Minister of Health 17
Data from the school dental service outlined in the background paper suggest that ethnicinequalities in child oral health status are more pronounced in areas that do not receiveoptimally fluoridated water.2 The 1999 national-level data show that water fluoridation hasclear benefits for Màori and Pacific children, and contributes to reducing ethnic inequalitiesin oral health status.2
The effectiveness of community water fluoridation and its role in reducing oral healthinequalities should be monitored. In particular, there is a need to monitor and quantify theassociation between fluoridation and a reduction in demand for child dental care undergeneral anaesthesia.2
Encouraging community water fluoridation
The Ministry of Health actively encourages water fluoridation by a variety of approaches.
In May 2002, the Minister of Health announced government approval of a Sanitary WorksSubsidy Scheme (SWSS). The scheme aims to improve sewage treatment, but also coverscommunity water fluoridation schemes. Generally the funding will only be available forcommunities of more than 1,000 people. Communities with fewer than 1,000 people can stillapply, but must be able to prove that fluoridation is cost-effective, or that their population isparticularly disadvantaged.
The subsidies for water fluoridation will cover 50 percent of the cost of eligible capital works.x
Funding for the Sanitary Works Subsidy Scheme will be available from 1 July 2003.Communities have been able to apply since January 2003. Already, a number of non-fluoridated communities have expressed interest in this scheme. The PHAC considers itessential that this scheme be well promoted to non-fluoridated communities.
Alternatives to community water fluoridation
The PHAC recognises that where water fluoridation is not an option, alternative ways toaccess fluoride need to be considered. Potential alternatives include:
♦ Fluoridation of salt and milk
Several studies have shown caries reductions of up to 50 percent with salt fluoridation.22
Milk has also been considered as a way of delivering fluoride, although only small-scale studies have been carried out. A possible milk fluoridation trial in Christchurchmay see the provision and evaluation of fluoridated milk in primary schools in theregion. The project is in its early stages, but will aim to improve dental health and willbe targeted at low decile schools.
♦ Topical applications of fluoride
It is widely accepted that fluoride toothpaste has contributed to the decline in caries inmost developed countries.22 Fluoride gels and mouth rinses have also shown someeffectiveness.22 Available and affordable fluoride-containing toothpastes are considereda good population-based preventive strategy.
x Expenditure on water fluoridation cannot exceed more than 10 percent of the total annual appropriation for thesubsidy scheme. This is $1.5 million out of a total annual budget of $15 million.

18 PHAC Advice to the Minister of Health
Previous National Health Committee recommendations on fluoridation
A 1997 report to the National Health Committee (NHC) on preventive dental strategies forolder populations stressed the importance of water fluoridation.14 This report made a numberof recommendations about how to ensure older people have access to fluoride.
The NHC’s 1998 Determinants report1 made a clear recommendation about fluoridation. Asa population-based service and environmental measure the NHC recommended that theMinister of Health: “Urge local authorities to ensure that when decisions are made about thefluoridation of water supplies, the needs of children and disadvantaged groups are the firstpriority”.
The PHAC strongly supports these recommendations and reiterates the importance offluoridation for the oral health of people of all ages. The NHC’s recommendations still havecurrency and the PHAC considers that there should be a continuing commitment to theirimplementation.
Summary
Fluoridation of community drinking water is not only effective in reducing dental decay inchildren, but also contributes to reducing ethnic and socioeconomic inequalities in oral healthstatus. The Sanitary Works Subsidy Scheme provides a new funding mechanism to helpmeet the costs of setting up fluoridation schemes. This will provide an opportunity to increasethe number of communities with fluoridated water supplies. Alternatives to waterfluoridation need to be considered in small communities where water fluoridation is notfeasible.
The Public Health Advisory Committee recommends that the Minister of Health:
♦ urges local authorities to fluoridate community water supplies and requires theMinistry of Health to continue to monitor the effectiveness of fluoridation in reducingoral health inequalities
♦ requests the Ministry of Health and District Health Boards to actively encouragenon-fluoridated communities to make applications to the Sanitary Works SubsidyScheme
♦ requests District Health Boards and local authorities to work collaboratively topromote fluoridation of community water supplies
♦ requires the Ministry of Health to promote research into the most cost-effective andappropriate alternatives to water fluoridation in communities where fluoridation isnot feasible.

PHAC Advice to the Minister of Health 19
2.4 Reorienting oral health services
Oral health services have an important role to play in improving oral health through treatmentservices and providing health promotion and education.
Over the past 30 years, child oral health status in New Zealand has improved dramaticallybecause of preventive measures such as fluoridation. However, public dental services havebeen under pressure during the last decade.15 Reorganisation has led to fragmentation andwork pressures have meant some child and adolescent dental services have not beenmaintained at levels sufficient to ensure high levels of access and provision.15
Furthermore, oral health services tend to be overlooked and thus poorly integrated into publicand primary health services. Oral health is often seen as secondary to general health andwellbeing.
Child oral health services in New Zealand
A range of child oral health services are provided for New Zealand children, including careby dental therapists,xi private dental practitioners (under the Special or General Dental Benefitschemes), and specialist hospital departments.2
New Zealand’s school dental service (SDS) provides basic preventive and restorative dentalcare for preschoolers, primary and intermediate school children. Dental therapists employedby District Health Boards (DHB) provide the dental care.2
The SDS aims to see children annually, although six-monthly visits are available to those athigh risk of dental disease.2 Children who require dental care that is beyond the scope of theSDS are referred to a general dental practitioner or, if they have extensive treatment needs,may be referred to hospital dental units for treatment under general anaesthetic.2
After Year 8 (Form II) and until the age of 18, adolescents are eligible for dental care underthe General Dental Benefit system. Under this system, private dentists provide care under acontract with local DHBs.2
Child oral health services provided outside the SDS, for example, hospital departments andgeneral dental practitioners tend to be under recognised and are often poorly funded.
The Dunedin Multidisciplinary Health Development Study (DMHDS) suggests that clearsocioeconomic differences in dental caries existed in early childhood, but their magnitudewas reduced during school years with universal access to free dental care.2 Data suggeststhat by age 26 there had been a re-emergence of wide socioeconomic differences in cariesoccurrence, with more teeth being extracted (due to caries) in low socioeconomic status (SES)groups. These findings emphasise the impact of the universal school-based child dental healthservice.
The background paper suggests the amount of dental care received appears to be negativelyassociated with socioeconomic disadvantage. For example, by age 18 the time since the lastdental visit was clearly associated with the level of socioeconomic disadvantage.2
xi Dental therapists (formally school dental nurses) are health care providers who have undertaken two or threeyears training in primary oral health care. They work independently under indirect supervision by PrincipalDental Officers.

20 PHAC Advice to the Minister of Health
Access to oral health services
The PHAC believes access to services should be a high priority and a quality measure foreffective health services. Access is the extent to which people are able to receive a service onthe basis of need and irrespective of factors such as ethnicity, age, location, impairment orgender.23 Reasons for not accessing dental services include perceptions of cost, lack ofknowledge about the availability of services, and the acceptability or accessibility of services.
While the SDS has a very high uptake, with an estimated 95 percent of school-aged childrenenrolled, the uptake for preschool children is significantly less.2 Although there is limiteddata on utilisation of dental services, the Oral Health Toolkit states that in the late 1980s 70percent of preschool children (aged between two and a half and five years) were enrolled inthe SDS, but by 1997 this was down to 56 percent.15 The background paper from the Universityof Otago notes that the uptake of school dental services by preschool children is variable,and is considerably lower among Màori, Pacific children and those from lower SES groups.2
It is suggested in the background paper that historically there have been few inequities inaccess to care for primary school-aged children, due to the continuous presence of dentaltherapists in many primary schools. However, with most dental therapists now managingthe oral health needs of several schools, there has been increasing difficulty for some groupsin accessing care2, for example, Màori children and transient children. This points to a needto increase preschool uptake among these groups.2 To achieve this, research is required oneffective strategies to improve uptake followed by funding for implementation.
Access to care plays an important part in oral health ethnic inequalities during the lifecourse.2
A study in 1993 indicated that Màori children were over three times less likely than non-Màori to be enrolled in the SDS as preschoolers.24 Recent initiatives may have improved theuptake of dental services by preschool Màori children, but there is no strong evidence ofthis.2
Access to oral health services is also an issue for people from rural communities. Improvingaccess for rural communities requires easily available service information, as well as accessibleoral health services.
Access to oral health services for Pacific preschool children was one of the health issuesPacific communities in Auckland and Porirua identified during the Ministry of Pacific IslandAffairs’ Capacity Building process.xii In response, the Ministry of Health suggested that oralhealth be included as part of community health promotion programmes in these areas. Theseinclude programmes delivered to Pacific children through early childhood centres andchurches.
The Ottawa Charter for Health Promotion emphasises reorienting health services. To reducehealth inequalities, it is important that quality oral health services are accessible andappropriate for children from all socioeconomic backgrounds and ethnic groups, those livingin rural communities, and children with disabilities or special health care needs.
xii During 2000, Plans of Action were developed with Pacific communities in eight regions. As part of this process,communities identified actions to improve the wellbeing of Pacific peoples. These priorities were then consideredby the relevant government agencies in terms of priority and available funding. More information is availableon the Ministry of Pacific Island Affairs website: www.minpac.govt.nz

PHAC Advice to the Minister of Health 21
The oral health status of children with disabilities or special health care needs may varyaccording to both the type of disability and the level of dependence on others for oral hygieneand health care decisions.25 These children may encounter substantial barriers which preventthem receiving adequate dental and general health care, for example:
♦ requiring anaesthesia before dental treatment can occur due to physical or behaviouralissues
♦ having to travel to specialist dental care
♦ a tendency to neglect routine health and dental care and to focus on the main health orcare concerns of the child.
A child’s disability or health status may therefore adversely affect their oral health (for moredetailed discussion of this see page 61 of the background paper).
The PHAC believes that there are a number of strategies that may improve oral health servicesfor children with disabilities or special health care needs. These include:
a. changing of attitudes about treating people with disabilities and recognising thatchildren with disabilities should be able to access oral health services and receive oralhealth treatment, like anyone else
b. an awareness of particular oral health issues for children with disabilities, for exampleknowledge about particular disorders and the impact on oral health status.
Improving access to services is one area in which the government can take action. This couldoccur by raising the awareness of the oral health services available, increasing linkage betweenthe school dental service and preschool and adolescent services or by offering travel subsidiesto those who cannot access oral health services because of transport barriers.
Action needed
Child oral health services need to remain a high priority, as diseases of the teeth and gumsare among the most common health problems and disproportionately affect Màori, Pacificchildren and people from low socioeconomic groups.5 There is impetus currently on improvingchild oral health, for example, the Ministry of Health is reviewing the school dental servicewith the aim of developing a process to allocate extra funding to areas of high need, andincrease the focus on disease prevention.
The Oral Health Advisory Group (OHAG) was established in 2001 to provide advice to theMinister of Health on the priorities and options for future directions in oral health and oralhealth services in New Zealand. Being broadly based with professional and consumerrepresentation, OHAG could be well placed to assume accountability for monitoring that therecommendations in the PHAC’s report are actioned.

22 PHAC Advice to the Minister of Health
Summary
School dental services play a key role in the oral health of New Zealand children, but thereare disparities in access to services. Màori, Pacific, rural and transient children and childrenfrom low socioeconomic families are less likely to use oral health services than their peers,particularly in preschool years. Reorientation of oral health services is needed to ensure thatall children can access appropriate services from preschool onwards.
The Public Health Advisory Committee recommends that the Minister of Health:
♦ asks the Ministry of Health to actively promote research into effective strategies forimproving preschool uptake of dental services, especially among Màori, Pacific,rural, transient children and children from low socioeconomic groups
♦ requests the Ministry of Health to examine enhancing the national school-baseddental service with linkages into preschool and adolescent settings
♦ requests the Oral Health Advisory Group to monitor the actions taken on therecommendations in this Public Health Advisory Committee report.
2.5 A responsive and skilled workforce
A recent stocktake of the New Zealand health workforce by the Health Workforce AdvisoryCommittee (HWAC) estimated that in 2000 there were 2,615 dental health workers in NewZealand (not including dental assistants).26 This amounts to 69 dental workers per 100,000people. The stocktake also highlighted a number of key issues for the dental health workforceincluding:
♦ the increasing future demand for dental services
♦ the need for integration of dental care and training
♦ recruitment and retention difficulties for dentists in rural and provincial areas.
The stocktake highlighted that the dental workforce does not match the ethnic make-up ofthe population. Màori make up 2.8 percent of the total dental health workforce, while Pacificpeople make up 0.8 percent. There has been some recognition by government of the need toincrease the number of Màori and Pacific people entering the dental profession to reflectNew Zealand’s cultural and ethnic diversity.
There are increasing expectations by Màori consumers and communities for a multi-skilled,culturally competent, bilingual and technologically literate Màori health workforce.27 Thebackground paper from the University of Otago research team clearly outlines the need tocontinue to develop the Màori oral health workforce. The background paper also suggeststhat the collection of appropriate workforce monitoring data is essential when developingthe Màori dental workforce.2 As well as recruitment of Màori dental staff, there is a need forappropriate support and mentoring of trainees.

PHAC Advice to the Minister of Health 23
It is also important to ensure that New Zealand’s oral health workforce is culturally competent.Many non-Màori dental staff work with Màori children. For two decades, Màori culture andhealth has been included at an education/training level, and is an important aspect of trainingin dentistry and dental therapy.2 To ensure that all dental workers have the necessary culturalunderstanding, cultural competencies could be developed to guide staff on these issues.xiii
A report commissioned by the Dental Council of New Zealand in 1998, New Zealand: Dentists,Dental Therapists and Dental Hygienists – Workforce Analysis,28 discussed a number of strategicworkforce issues. The PHAC supports the recommendations made in this report as a path toenhancing child oral health services and reducing inequalities by providing better servicesto more people.
The report indicates that the dental provider workforce skill mix is a major issue now andwill continue to be an issue in the future. It suggests that research is required to determinethe proportions of dentists and other auxiliary providers necessary to deliver care.28
The report also highlights the retention of dentists and dental therapists as a major issue,with the high numbers of New Zealand graduate dentists leaving, especially in the first yearafter graduation. The report suggests there should be further research into the reasons whyrecently graduated dentists are not active in the New Zealand workforce, to help informestimates of future dental workforce availability.
A report by Waitemata District Health Board suggests that the low number of dental therapistsand high turnover in the younger age group indicates insufficient people, particularly schoolleavers, are entering the professions to meet the estimated workforce requirements andmaintain an adequate workforce level over the next five years.29 The report also recommendsthat urgent action be taken to attract (and retain) more people into the dental therapyprofession, particularly school leavers.
Currently there is no active recruitment of dental therapists in New Zealand. One possibleincentive to encourage people to train as dental therapists is to offer grants or scholarships.
The PHAC is of the view that further increasing the recruitment of health professionals,including dental therapists, hygienists and dental students is essential. The recruitment oforal health professionals to rural areas is a key workforce issue that needs to be addressed.
Summary
New Zealand needs a dental health workforce that can respond to changes within dentalservice provision and the country’s demographic composition. At present there is a disparitybetween the ethnic composition of the dental workforce and New Zealand’s populationdemographics. A focus on improving Màori child oral health will increase demand for alarger and skilled Màori dental workforce. Likewise there will be a need for more Pacificdental workers.
xiii These could be similar to the recovery competencies developed by the Mental Health Commission to guidemental health workers Recovery Competencies for New Zealand Mental Health Workers, Mental Health Commission,March 2001.

24 PHAC Advice to the Minister of Health
The Public Health Advisory Committee recommends that the Minister of Health:
♦ asks the Oral Health Advisory Group to report on the progress that has been madeon the directions for the dental health workforce as outlined in the 1998 report ofthe Dental Council of New Zealand
♦ asks the Oral Health Advisory Group to report to the Minister of Health on strategiesto develop the Màori and Pacific oral health workforce.
2.6 Better information about child oral health and inequalities
The background paper, prepared by the University of Otago, highlighted a number of areaswhere information is lacking about child oral health and inequalities. The researchersidentified a lack of data about oral disease in the New Zealand population.2 This createssignificant difficulties, for instance without appropriate epidemiological data it is difficult toevaluate the effectiveness of current public health programmes, or know how they should bemodified.
Data collection
The only systematically collected information on the oral health of children in New Zealandcomes from data collected routinely by the school dental service (SDS) on dental cariesprevalence and severity in 5-year-olds and in Year 8 children.2
This routinely collected data does not indicate the distribution of caries experience. Currently,regional data is combined to give weighted mean mft and MFT estimates for the entire country,as well as New Zealand-wide estimates of the caries-free proportions for each age group.These data are reported by ethnic group and by community water fluoridation status.2
The authors of the background paper suggest that the SDS dental caries data should becollected and collated at unit-record level by all DHBs. This would enable a national unit-record database to be assembled for all 5-year-olds and Year 8 children annually. This shouldalso enable better monitoring of trends in inequalities in the distribution of dental cariesamong New Zealand children.
Other gaps in data
The background paper also suggests that there is a paucity of data on the dental cariesexperience of preschool children, as well as information about other oral problems such asdental trauma, periodontal (gum) disease and enamel defects.2
Other gaps identified by the researchers include a lack of:
♦ monitoring of the demand for dental care under general anaesthesia
♦ data on dental care for children with intellectual disability.2
The background paper suggests a lack of up-to-date information on socioeconomic and ethnicinequalities in oral health among New Zealand children, although the SDS now collects dataon ethnicity. In preparing the background paper, it was not possible for the authors to monitor

PHAC Advice to the Minister of Health 25
trends in ethnic inequalities and in the distribution of dental caries among New Zealandchildren, as it is only recently that the data have been collected in this way. Moves tostandardise the collection of SDS data at unit-record level should enable better monitoring ofthe trends in distribution of ethnic inequalities of dental caries.
The background paper also suggests that ethnicity information on Pacific children should becollected in such a way that the data can be disaggregated and analysed according toindividual Pacific ethnic groups, and that similar breakdowns should be possible for otherethnic groups such as Asian and new immigrant children. Furthermore, the accuracy andquality of SDS ethnicity data should be assessed, as well as the impact of recent moves toimprove SDS data collection.2
As suggested above there needs to be a way to ensure that all SDS data on child oral health iscollected and analysed. The PHAC suggests that all DHBs set up an electronic informationsystem which will allow for SDS data collection and monitoring and also analysis.
Effects of service changes
In the last decade a number of changes have been made to the provision of dental care forchildren and adolescents. In 2000, the general dental benefit (GDB) contracts that many privatedentists now hold with the DHBs changed from fee-for-service to a capitation contract forthe provision of routine care.2 The background paper suggests that health services researchshould be conducted into how the new GDB contracts are affecting the care received byadolescents, and whether the changes have been advantageous for Màori and Pacificadolescents and low SES groups. Accordingly, appropriate ethnicity and SES (eg, NZDep96)data should be collected on GDB patients.
Over the past decade there has been increasing flexibility in the school dental service, withdental therapists no longer working only in school dental clinics. More dental therapistsnow work in the wider community, attempting to improve accessibility to dental care, byworking in mobile vans, and taking the service to smaller rural communities. The PHACsuggests that the impact of and effectiveness of these arrangements should be evaluated.
Further priorities for research
When consulting on this report, a number of research priorities were suggested. These includethe need for research into:
♦ the causes of dental caries in New Zealand and the impact on the family of managinga child with severe dental caries
♦ whether there is appropriate and timely care available for children with severe dentalcaries
♦ whether appropriate care is available and funded for children who fall outside theschool dental system because of medical, developmental, physical or behaviouraldisabilities
♦ other influences on child oral health, for example, family nutrition
♦ why young people are not taking up dental therapy as a career.

26 PHAC Advice to the Minister of Health
Improving information about oral health
There is a continuing requirement for high quality research into child oral health and childoral health services. The PHAC considers that robust and accessible information is neededto determine the effectiveness of initiatives to improve child oral health.
The PHAC recommend that the Oral Health Advisory Committee be asked to advise theMinister of Health on the priorities for action, in the research and information gaps, identifiedin the background paper prepared for the PHAC.
Summary
Data on 5-year-olds and Year 8 students is the only systematic collection of information aboutthe oral health of New Zealand children. Further information and research is needed to gaina better understanding of appropriate strategies to reduce child oral health inequalities.
The Public Health Advisory Committee recommends that the Minister of Health:
♦ requires the Ministry of Health and District Health Boards to systematically re-examine child oral health data collection in order to improve data collection
♦ urges the Ministry of Health and District Health Boards to collect data on childhealth at unit record level for 5-year-old and Year 8 children
♦ asks the Oral Health Advisory Group to prioritise information and research gapsidentified in the background paper and propose a plan for actioning these.
2.7 Using child oral health as an indicator of health inequalities
The background paper suggests that child oral health has the potential to be used as a healthinequality indicator,xiv using dental caries data routinely collected at age 5 and at the end ofYear 8.
The background paper examines the suitability of dental caries as a health inequality indicatorin the light of the indicators proposed by the Ministry of Health.xv It suggests that childdental caries has the potential to be an indicator of health inequalities, although there isroom for further investigation of validity.
Year 8 data has already been included in an indicative list of health inequality indicators.30
It is now clear, from data presented in the background paper, that the publicly funded dentalcare system reduces child oral health inequalities for Year 8 children and this is the period inthe lifespan when oral health inequalities are least evident. Therefore, a more valid and
xiv An indicator is defined as a characteristic (or variable) that can be measured and which can be taken to representanother characteristic, which is the actual object of interest.
xv Selection criteria for health inequality indicators, proposed by the Ministry of Health, include: validity, reliability,responsiveness, modifiability, accountability, monitorability, predictiveness, acceptability and sustainability.

PHAC Advice to the Minister of Health 27
responsive indicator of child oral health inequalities would be dental caries at age 5. Thebackground paper suggests that inequalities are likely to be greater at age 5 than at any timefor a number of reasons, including:
♦ ethnic and socioeconomic differences in the uptake of preschool dental services meanthat caries differentials are likely to be greatest
♦ oral health status at age 5 reflects household conditions and nutritional and self-carepractices, and there is less confounding by actual dental treatment
♦ other factors being equal, the development and progression of dental caries in thedeciduous dentition (baby teeth) is more rapid, meaning that (in theory, at least) thereis less lag time between changes in determinants and the subsequent appearance orabsence of disease.
Summary
Child oral health has the potential to be an indicator of health inequalities, as dental caries isa disease where data are routinely collected at age 5 and at Year 8, and for which inequalitiesare readily observed. The PHAC recommends that dental caries data for 5-year-olds shouldbe used in preference to Year 8 data, as inequalities are more pronounced during the preschoolperiod.
The Public Health Advisory Committee recommends that the Minister of Health:
♦ requests that the Ministry of Health use dental health data from 5-year-olds as anindicator of health inequalities.
28 PHAC Advice to the Minister of Health
References1 National Health Committee. 1998. The Social, Cultural and Economic Determinants of Health in Zealand.
Wellington: National Health Committee.2 Thomson WM, Ayers KM and Broughton JR. 2002. Child oral health inequalities in New Zealand: A
background paper to the Public Health Advisory Committee. Wellington: Public Health AdvisoryCommittee.
3 Ministry of Health. 2000. The New Zealand Health Strategy. Wellington: Ministry of Health.4 Ministry of Health. 1998. Child Health Strategy. Wellington: Ministry of Health.5 Ministry of Health. 2001. The Health and Independence Report: Director-General’s Annual Report on
the State of Public Health. Wellington: Ministry of Health.6 World Health Organization. 1986. Ottawa Charter for Health Promotion. World Health Organization:
Ottawa.7 State Services Commission. 2002. Report to the Advisory Group on the Review of the Centre. Wellington:
State Services Commission.8 Ministry of Health. 2001. Review of publicly funded oral health care in New Zealand. Wellington:
Ministry of Health.9 Public Health Association of New Zealand. 2002. PHA News. Wellington: Public Health Association.10 Health Funding Authority. 1999. Health Funding Authority Eight Gain Priority Areas for Maori Health
1999/2000. Report Seven: Oral Health. Wellington: Health Funding Authority.11 Ministry of Health. 2002. He Korowai Oranga: Màori Health Strategy. Wellington: Ministry of Health.12 Edward KM, Bain M, Bell JW, Hunter PB et al. 1999. New Zealand oral health goals for the new
millennium. Auckland: New Zealand Dental Association.13 Ministry of Health. 2000. National Service Specification: Child Dental Service. Wellington: Ministry
of Health.14 Thomson WM. 1997. Preventive Dental Strategies for Older Populations: A report to the National Health
Committee. Wellington: National Health Committee.15 Ministry of Health. 2001. DHB Toolkit: Improve Oral Health. Wellington: Ministry of Health.16 Ministry of Health. 2002. Working Document on Fluoridation. Wellington: Ministry of Health.17 McDonagh M, Whiting P, et al. Systematic review of water fluoridation. British Medical Journal
2000; 321: 855-9.18 Wright J, Bates M et al. 1999. The cost-effectiveness of fluoridating water supplies in New Zealand: A
report for the New Zealand Ministry of Health. Wellington: Environmental Science and ResearchCentre.
19 Public Health Commission. 1994. Water Fluoridation in New Zealand: an analysis and monitoringreport. Wellington: Public Health Commission.
20 Bates M. 2000. Fluoridation of Water Supplies – An evaluation of the recent epidemiological evidence.Porirua: Institute of Environmental Science and Research Limited.
21 Fottrell P. Forum on Fluoridation. 2002. Dublin: Department of Health. www.fluoridationforum.ir22 Pollard M, Duggal M, Fayle S, Toumba K, Curzon M. 1995. Caries Preventive Strategies. Belgium:
ILSI Europe.23 National Health Committee. 2002. Safe Systems Supporting Safe Care: Final report on Health Care
Quality Improvement in New Zealand. Wellington: National Health Committee.24 Thomson WM. 1993. Ethnicity and child dental status in the Manawatu-Wanganui Area Health
Board. New Zealand Dental Journal. 89: 12-14.25 Persson RE, Stiefel DJ, Griffith MV, Truelove EL, Martin MD. 2000. Characteristics of dental
emergency clinic patients with and without disabilities. Special Care in Dentistry; 20: 114-120.26 Health Workforce Advisory Committee. 2002. The New Zealand Health Workforce: A Stocktake of
Issues and Capacity 2001. Wellington: Health Workforce Advisory Committee.27 Health Workforce Advisory Committee. 2002. The New Zealand Health Workforce: Framing future
directions Discussion Document. Wellington: Health Workforce Advisory Committee.28 Hannah A. 1998. New Zealand: Dentists, Dental Therapists and Dental Hygienists – Workforce Analysis.
Wellington: Dental Council of New Zealand.29 Mune N. 2001. Dental Therapists and Dental Assistant National Workforce Survey Report. Waitemata:
Waitemata District Health Board.30 Ministry of Health. Indicators of inequality. Classification and Selection of Ethnic Health Disparity
Indicators. Public Health Intelligence Occasional Bulletin No 5. Wellington: Ministry of Health.

Child Oral Health Inequalitiesin New Zealand
A Background Paper to the
Public Health Advisory Committee
W. Murray Thomson
Kathryn M. S. Ayers
John R. Broughton
May 2003
Incorporating the Public Health Advisory CommitteeTe Ròpù Tohutohu I Te Hauora Tùmatanui

30 A Background Paper to the Public Health Advisory Committee
Table of contents
EXECUTIVE SUMMARY ................................................................................................................... 32
ACKNOWLEDGMENTS ................................................................................................................... 35
ABOUT THE AUTHORS ................................................................................................................... 35
GLOSSARY ............................................................................................................................................ 36
CHAPTER 1 : INTRODUCTION AND DEFINITIONS ............................................................ 37INTRODUCTION ................................................................................................................................... 37DEFINING ORAL HEALTH................................................................................................................ 38THE LIFE COURSE APPROACH ....................................................................................................... 39EQUALITY AND EQUITY ................................................................................................................... 40
CHAPTER 2 : THE STATE OF CHILD ORAL HEALTH IN NEW ZEALAND ................... 42CURRENT CHILD ORAL HEALTH SERVICES ............................................................................. 42
The collection of oral data by DHBs ............................................................................................ 43CARIES STATUS (PREVALENCE AND SEVERITY) BY REGION (DHB) ............................... 44TRENDS SINCE 1990 ............................................................................................................................ 47
CHAPTER 3 : SOCIO-DEMOGRAPHIC ASSOCIATIONS WITHCHILD ORAL HEALTH ..................................................................................................................... 50socioeconomic STATUS (SES) ............................................................................................................. 50
Measuring socioeconomic status .................................................................................................. 50Social class/socioeconomic status ................................................................................................ 51Modification by fluoridation ......................................................................................................... 52Maternal education level ................................................................................................................ 53Deprivation: area-based approaches ........................................................................................... 54
ETHNICITY ............................................................................................................................................. 55Some issues for tamariki Màori and their whanau .................................................................. 58
HOUSING AND HOUSEHOLD COMPOSITION .......................................................................... 59LOCALITY (RURALITY AND REGION) ......................................................................................... 60MATERNAL ORAL HEALTH ............................................................................................................ 61DISABILITY STATUS ............................................................................................................................ 61INTERNATIONAL EVIDENCE ON CHILD ORAL HEALTH INEQUALITIES ..................... 63
CHAPTER 4 : EFFECTS ON CHILD ORAL HEALTH IN NEW ZEALANDOF RECENT SOCIAL, ECONOMIC AND POLITICAL CHANGES .................................... 64
CHAPTER 5 : CHILD ORAL HEALTH AND ITS RELATION TOADULT ORAL HEALTH .................................................................................................................... 67THE DUNEDIN STUDY ....................................................................................................................... 67SES DIFFERENTIALS IN ORAL HEALTH IN THE DUNEDIN STUDY AT AGE FIVE....... 68SES DIFFERENTIALS IN ORAL HEALTH IN THE DUNEDIN STUDY BY AGE 26 ............ 68SUMMARY OF THE OBSERVATIONS FROM THE DUNEDIN STUDY ................................. 71
CHAPTER 6 : CHILD ORAL HEALTH AND ADULT GENERAL HEALTH ...................... 74POSSIBLE PATHWAYS TO POOR ADULT HEALTH ................................................................. 74

A Background Paper to the Public Health Advisory Committee 31
CHAPTER 7 : CHILD ORAL HEALTH AS AN INDICATOROF HEALTH INEQUALITIES .......................................................................................................... 76
CHAPTER 8 : PROMOTING GOOD ORAL HEALTH OUTCOMES:OPTIONS FOR EFFECTIVE ACTION ........................................................................................... 78RATIONALE AND PRINCIPLES ....................................................................................................... 78INTERVENTION POINTS ................................................................................................................... 79
1. Basic socioeconomic determinants ......................................................................................... 792. Intermediary factors ................................................................................................................... 803. Oral health services .................................................................................................................... 81
CHAPTER 9 : GAPS IN CHILD ORAL HEALTH INEQUALITIES INFORMATION ..... 87REFERENCES ........................................................................................................................................ 90
LIST OF FIGURES AND TABLES
Figures
1. Chains of oral health risk through the life course ................................................................. 40
2. The concepts of equity and equality in relation to dental care .......................................... 40
3. Trends in dental caries severity among 5-year-olds andYear 8 children since 1990 ........................................................................................................... 48
4. Trends in dental caries prevalence among 5-year-olds andYear 8 children since 1990 ........................................................................................................... 48
5. Social class gradients in caries experience by water fluoridationstatus among 5-year-olds ............................................................................................................ 52
6. Social class gradients in caries experience by water fluoridationstatus among 14-year-olds .......................................................................................................... 53
7. Caries severity among New Zealand 5-year-olds in 1999,by ethnicity and water fluoridation status ............................................................................. 58
8. The percentage caries-free among New Zealand 5-year-olds in 1999,by ethnicity and water fluoridation status ............................................................................. 58
9. Estimated ratio of geometric means for DMFT by ethnicityacross the observation period .................................................................................................... 65
10. Average number of decayed or filled tooth surfaces at age 26 by age-5 SES ................. 73
11. Average number of missing teeth at age 26 by age-5 SES ................................................... 73
12. SES gradients in the mean number of decayed or filled tooth surfacesat ages 5, 15, 18 and 26, adjusted for sex and residential fluoride history ...................... 73
13. Hypothetical pathways by which poor child health might affect general health ......... 74
14. The “prevention pyramid” ......................................................................................................... 81
Tables
1. 2001 SDS data by region, ranked by percentage of children caries-free at 5 years ....... 46
2. Dental caries experience by age in the DMHDS by SES, sex and exposure tocommunity water fluoridation .................................................................................................. 69
3. Oral disease experience by age 26 in the DMHDS by SES, sex and exposure tocommunity water fluoridation .................................................................................................. 72

32 A Background Paper to the Public Health Advisory Committee
Executive summary
1. Introduction
This background paper reviews child oral health inequalities in New Zealand, and wascommissioned by the Public Health Advisory Committee as part of the Reducing Inequalitiesin Health Programme. Child oral health is used here to illustrate health inequalities using thelife course approach, in which an individual’s health in adult life is the outcome of theaccumulation of disadvantage or advantage from childhood and the years which follow.Particular attention has been given to the recent international scientific literature, New Zealandliterature, and routinely collected data on oral health.
The concept of oral health is difficult to define, and is usually measured in terms of the absenceof disease. It is acknowledged that Màori and Pacific constructs of health are more holisticthan may be apparent from the narrower focus of this background paper. Because dentalcaries is the most common oral disease in childhood, it is given the greatest emphasis in thebackground paper. The main population-level indicators of dental caries are prevalence (theproportion who have had dental caries) and severity (the average number of teeth or surfacesthat have been affected). This is usually expressed as the DMFT value, which represents thenumber of Decayed, Missing or Filled Teeth due to dental caries. To further complicate thesituation, the former is usually expressed as the caries-free percentage, equivalent to 100minus the prevalence. Periodontal disease, dental trauma, enamel defects and malocclusionalso contribute to dental morbidity in the New Zealand child population.
2. The state of child oral health in New Zealand
A range of child oral health services is provided for New Zealand children, including careprovided by dental therapists, private dental practitioners (under the Special or General DentalBenefit schemes), or specialist hospital departments. The utilisation of the school dentalservices by school-age children is very high, but it is of concern that preschool uptake isvariable, and considerably lower among Màori, Pacific people and those from groups of lowersocioeconomic status (SES). The uptake of dental services by adolescents is considerably lowerthan is desirable.
Caries status by region
Recent routinely collected school dental service data indicate that, nationally, 53 percent offive-year-olds are caries-free, with a mean mft1 of 1.8. At Year 8 (12–13 years), 42 percent arecaries-free, with a mean MFT2 of 1.6. The prevalence and severity of dental caries vary byregion, with children in Wellington and Waitemata having the lowest caries prevalence, anddisease being more prevalent and severe in areas such as Northland and the West Coast.Overall, regions with the highest percentage of children receiving fluoridated water havethe lowest overall caries rates as well as lower socioeconomic and ethnic differentials in dentalhealth. Caries rates in New Zealand children decreased steadily from 1980 to the early 1990s,but have either remained static or increased slightly since that time.
1 missing or filled deciduous (baby) teeth.2 Missing or Filled permanent (adult) Teeth.

A Background Paper to the Public Health Advisory Committee 33
3. Socio-demographic associations with child oral health
Substantial ethnic inequalities in oral health are evident among New Zealand children, withMàori and Pacific children and adolescents having a higher prevalence and severity of dentalcaries. There is abundant evidence of poorer oral health being experienced by groups of lowerSES relative to their higher-SES counterparts. Children born to younger or less educatedmothers or who live in rural areas may have an increased risk of dental caries compared withother children. Poor maternal oral health has been linked to poor child oral health. The oralhealth of individuals with disabilities may be impaired. Barriers to accessing dental care arean important factor, particularly as a higher proportion of children with disabilities are poorand socially disadvantaged. Special diets and self-care difficulties may play a role in theirgreater caries experience.
4. Child oral health and its relation to adult oral health
Adequately determining the relationship of oral health to adult health requires longitudinalobservational research. Data from the Dunedin Multidisciplinary Health and DevelopmentStudy (DMHDS) show that clear socioeconomic differentials in dental caries experience existedin early childhood, but their magnitude was reduced during the school years when therewas universal access to free dental care. By age 26 (when most dental treatment is providedon a private basis), there had been a re-emergence of wide socioeconomic differences in cariesoccurrence, and with more teeth being extracted (due to caries) in low SES groups. Thesefindings suggest that a major component of adult oral health inequalities is their childhoodorigin.
5. Child oral health and adult general health
Evidence for the relationship between child oral health and adult general health is largelyequivocal, although several hypotheses have been suggested and further investigation iswarranted.
6. Effects on child oral health in New Zealand of recent social, economic and politicalchanges
The social, economic and political environment is inextricably linked to health. The structural“reforms” which took place between 1990 and 1992 resulted in an increase in the prevalenceof poverty among New Zealanders. Evidence is presented to suggest that they were associatedwith a widening of the inequalities in the oral health of Màori and Pacific five-year-oldsrelative to their European counterparts. These inequalities are likely to remain with this cohortthrough to adulthood.
7. Child oral health as an indicator of health inequalities
Child dental caries is a potentially useful indicator of health disparities more generally. Cariesdata for five-year-olds should be used in preference to Year 8 data, as inequalities are morepronounced during the preschool period.

34 A Background Paper to the Public Health Advisory Committee
8. Promoting good oral health outcomes: options for effective action
Inequalities in oral health are reducible; whether they can be eliminated is another matter,but it is society’s moral duty to work towards their elimination. Ideas for action are given ateach of three identified intervention points:
(i) socioeconomic determinants
(ii) intermediary factors
(iii) oral health services.
First, the basic socioeconomic determinants of oral health inequalities must be tackled throughincome distribution and support policies (including improving Màori socioeconomiccircumstances through addressing Treaty claims).
Second, population preventive strategies must be directed at the more proximate causes ofdental disease; a prime example of this is increasing the availability of topical fluoride throughboth extending community water fluoridation and increasing the availability of fluoridetoothpastes for disadvantaged groups. Other strategies are required to complement these,such as moves to reduce the consumption of highly sugared soft drinks and increase theavailability of healthier alternatives.
Third, at the oral health services level, much of the impact of poor oral health upon Màoriand Pacific children comes from existing disease going untreated, and more so in rural areas.A key strategy is to develop oral health services which meet the needs of those children, bothby developing new services (where feasible) and by making appropriate changes to existingservices.
Improving child oral health among Màori requires attention at three levels:
(1) Government
(2) the health sector (including the dental profession)
(3) Màori.
9. Gaps in child oral health inequalities information
Broader oral health measures for use in the child population are lacking, and there is a needto develop measures which encompass Màori and Pacific concepts of health. There is a paucityof data on the dental caries experience of children at ages other than five years and Form II(such as preschoolers and nine-year-olds), and the current SDS data need to be collected atunit-record level. There is also a need for studies of other child oral problems, such as dentaltrauma, periodontal disease and enamel defects. Work on the effectiveness of waterfluoridation should continue, particularly at the health services research level. Research isrequired on the impact of the new General Dental Benefit contracts on adolescent dentalcare, and on whether the changes have been advantageous for Màori and Pacific adolescents.Systematic evaluation is required of the impact of ongoing changes in the way in which theSDS delivers care to children. Finally, further longitudinal research is required on the impactof poor oral health in childhood on oral health in adulthood.

A Background Paper to the Public Health Advisory Committee 35
Acknowledgments
The authors are grateful to Dr Richie Poulton (Dunedin Multidisciplinary Health andDevelopment Research Unit, Department of Preventive and Social Medicine, Dunedin Schoolof Medicine) and Mrs Sheila Williams (Department of Preventive and Social Medicine,Dunedin School of Medicine) for their input and advice as consultants to this project.
We also thank Mr Peter Hunter, of the Ministry of Health, for enabling access to child oralhealth data. Mr Barry Milne (Dunedin Multidisciplinary Health and Development Unit,Department of Preventive and Social Medicine, Dunedin School of Medicine) is thanked forhis data analysis advice.
About the authors
W. Murray Thomson
Associate Professor in Dental Public Health, The University of Otago.
Murray Thomson conducts dental epidemiological research and teaches dental epidemiologyand public health at the School of Dentistry. He is best known for his longitudinal research,with work on the epidemiology of tooth decay, gum disease, dental anxiety and dry mouth.Dr Thomson has also had several years of “hands-on” experience at the DHB and clinicalpractice levels. He has done consultancy work for the World Health Organization, andcontinues to work with the Ministry of Health and the New Zealand Dental Association ondental public health issues. He is a member of the national Oral Health Advisory Groupestablished in 2001.
Kathryn M.S. Ayers
Senior Lecturer in Dental Public Health, The University of Otago.
Katie Ayers is a specialist paediatric dentist at the School of Dentistry. Her most recent researchinvestigated tooth wear in the primary dentition in Dunedin children and has been publishedin the International Dental Journal. She has also investigated reasons for attendance at aprivate Accident and Emergency dental clinic in Auckland. Dr Ayers recently wrote asubmission to the Ministry of Health on behalf of the New Zealand Dental Association relatingto dental caries and diet.
John R. Broughton
Associate Professor (Department of Social and Preventive Medicine), Director of the NgaiTahu Màori Health Research Unit (Te Roopu Rangahau Hauora o Ngai Tahu), Dunedin Schoolof Medicine, The University of Otago.
John Broughton teaches Màori health and conducts research at the Dunedin School ofMedicine. He is the facilitator for Te Whare Kaitiaki (the Màori dental health clinic) at theSchool of Dentistry, is Kaiwhakahaere of Te Ao Marama (the New Zealand Màori DentalAssociation), and was a member of the Màori Health Commission. He has worked in the oralhealth field for many years, first in general dental practice and then as an academic andresearcher. He has written extensively on Màori oral and general health, and is currentlyinvolved in a number of oral health research projects. He has worked closely with the Ministryof Health, and is a member of the national Oral Health Advisory Group established in 2001.

36 A Background Paper to the Public Health Advisory Committee
Glossary
Deciduous teeth – the 20 “baby teeth”, which erupt sequentially between six and 30 monthsof age and are eventually succeeded by the permanent teeth.
Dental caries – also known as “tooth decay”, this is a disease in which the fermentation ofsugars by oral bacteria produces weak acids which remove the mineral component of thedental hard tissues; if it occurs frequently and for long enough, it leads to the developmentof cavities (“holes”). See also: “Restorations” below.
Dental hygienist – an allied dental health professional whose prime responsibilities are theremoval of deposits from the teeth and the application of solutions to the teeth for the purposeof preventing disease.
Dental therapist – previously known as “school dental nurses”, dental therapists’ primeresponsibilities are the basic dental treatment of children and adolescents in the school dentalservices.
DMF index – the number of Decayed (D), Missing (M) and Filled (F) teeth (DMFT) or surfaces(DMFS), which gives an indication of the severity of past dental caries experience; that of thepermanent dentition is represented in upper case (DMFT), while the lower case dmftrepresents caries severity in the deciduous dentition.
Episodic use of dental services – the use of dental services only when the individual is awareof a problem; by contrast, the routine use of services entails regular, asymptomatic check-ups.
Longitudinal research – a form of epidemiological research in which individuals are usuallyfollowed prospectively (forward in time) and measurements made on two or more occasions;this is a powerful design which allows researchers to examine which factors or exposuresprecede the development of disease.
Orofacial trauma – injury to the oral or facial region due to externally applied force.
Periodontal disease – a disease of the soft tissues and bone which support the teeth in thejaws; it can ultimately lead to teeth loosening so much that they fall out or have to be extracted.
Permanent teeth – the 32 “adult” teeth, for which eruption begins at about 6 years of age andfinishes with the third molars (“wisdom teeth”) in late adolescence.
Restorations – also known as “fillings”, these are usually placed by the dentist (or dentaltherapist) to restore the form, function and aesthetics of the tooth once the caries (“decay”)has been surgically removed.
Risk factor – a behaviour or characteristic known to be associated with a particular diseaseor condition, and for which exposure has been shown to precede development of the condition.

A Background Paper to the Public Health Advisory Committee 37
Chapter 1 : Introduction and definitions
Introduction
Since the introduction of the School Dental Service (SDS) in 1921 (Hunter and Davis, 1982),New Zealand has prided itself on its dental care system for children and the resultant dentalhealth outcomes. The SDS was a revolutionary innovation at the time; the school dental nursebecame a New Zealand icon, and the dreaded “murder house” entered the nationalconsciousness.
The unfortunate reality today is that New Zealand’s publicly funded dental care system forchildren and teenagers does not adequately meet the dental health needs of that entirepopulation. Certain groups of children and adolescents not only have more dental diseasethan others, they suffer more discomfort, and they grow up to be adults with poor oral health.Those groups are highlighted in the New Zealand Health Strategy, which aims to reduceinequalities by ensuring accessible and appropriate services for:
♦ people from groups of lower socioeconomic status (SES)
♦ Màori
♦ Pacific peoples.
Data on the dental health of New Zealand children are collected and reported annually bythe school dental services, at least for five-year-olds and Year 8 (Form II; usually 12–13 yearsof age) children. Information on the dental health of adolescents is far less comprehensive,because it is not routinely collected (there is even less information on adults, as the mostrecent national survey of adult oral health was in 1988). Despite the “patchy” nature of theinformation, it is possible to come to some conclusions about (1) the dental health of NewZealand’s young people, (2) where the existing disparities are and (3) to offer someexplanations for these disparities. From such an analysis can come options for effective actionfor promoting good oral health among New Zealand children.
Compared to those who are better-off, more children from lower SES groups experience dentaldecay, and have more of it; those differences narrow as they pass through the publicly fundeddental care schemes, then re-emerge in adulthood once the State has no further role in theprovision of their dental care.3
Across all age groups, Màori do not enjoy the same oral health status as non-Màori (Broughton1993, 1995), but the situation is particularly acute for children. In Northland, for example,the situation for Màori children has been described as “an epidemic of dental decay”.4 Overthe last decade, the Màori response to those poor oral health outcomes has been an increasingacknowledgement and recognition of oranga niho (oral health), and enormous gains in thedevelopment of both oral health services and oral health promotion. However, there is still a
3 See Chapter 5: Child oral health and its relation to adult oral health.4 Radio New Zealand: Insight, 3 December 2000.

38 A Background Paper to the Public Health Advisory Committee
long path to travel before Màori can enjoy the same oral health as non-Màori. For Màori, theprinciples of the Treaty of Waitangi (partnership, protection and participation) are central toaddressing those oral health inequalities.
Apart from reports using school dental service data, there has been little, if any, documenteddiscussion on the oral health of Pacific children, and their situation can only be gauged fromanecdotal evidence, secondary sources, and by making inferences from studies of generalhealth and hospital admissions (Tukuitonga et al, 2000). These indicate that the oral health ofNew Zealand Pacific children is poor.
The purpose of this background paper to the Public Health Advisory Committee is to describethe nature, extent and consequences of oral health inequalities among New Zealand children,and to suggest ways in which those inequalities may be reduced.
Defining oral health
There is no accepted definition of oral health, despite considerable progress having beenmade over the last 15 years in conceptualising and measuring oral health. A number ofinstruments have been developed to measure oral health-related quality of life, but thesehave been developed for use with older adults. At least one leading commentator hassuggested that the concept of health is both elusive and abstract; being essentially subjective,multidimensional and dependent upon the social, cultural, political and practical context, itis extremely difficult to define (Locker, 1997).
This problem applies to oral health, which is usually defined in terms of the absence of disease(such as dental caries or periodontal disease), while the mouth remains the focus of attentionat the expense of the person-level perspective (Locker, 1997). This overly mechanistic, narrowfocus has some advantages. By concentrating (albeit separately) upon the manifestations ofcommon oral diseases such as dental caries and periodontal disease, dentistry has developedmeasures which have served it reasonably well to date, albeit while ignoring measures suchas those used by Màori, of which Te Whare Tapa Wha is one model. This represents fourdimensions: te taha tinana (the physical dimension), te taha hinengaro (the mental dimension),te taha whanau (the family dimension) and te taha wairua (the spiritual aspect), which canbe applied by Màori to oral (and other) disease. The current review must take the pragmaticcourse of using these measures for the simple reason that there are no other data availablefor the age groups on which the bulk of its scrutiny is concentrated. However, we concurwith a recent review (Ministry of Health, 2001a) which does not deny the validity of otherconstructs of health and oral health (particularly the more holistic concepts of Màori andPacific cultures).
Moreover, owing to the absence of routinely collected data on periodontal disease amongNew Zealand children, the bulk of the data presented in this review pertains to dental caries,which, in any case, is by far the greatest contributor to the burden of oral disease amongNew Zealand children. Orofacial trauma, another contributor to the oral burden in NewZealand, should also be considered, particularly as data are routinely collected by the ACC,but no reports have been published which examine socioeconomic or ethnic inequalities inits occurrence.

A Background Paper to the Public Health Advisory Committee 39
Dental caries is a chronic, progressive disease. Dental epidemiological information is atypicalin that the data are collected from many observation sites per person, but the analysis anddescription of those data is done at the level of the individual. What is observed in anindividual’s mouth during a clinical examination is the accumulation of that person’s diseaseexperience to date; what is not known is whether it reflects their current disease pattern. Forexample, one individual with only four filled teeth may have had all four develop carieswhich required filling during the previous 12-month period, while another person with onlyfour filled teeth may have had all four filled several years previously, with no further diseasehaving occurred since.
In reporting dental caries data from population surveys or routine monitoring activities, twomain indicators are used:
(1) the prevalence of caries – the proportion (usually expressed as a percentage) of thepopulation who have got the disease (that is, who have had caries experience)
(2) the severity of caries experience – defined as the average number of teeth or surfaceswhich have been affected (usually expressed as the mean number of decayed, missingor filled teeth or surfaces; expressed as “DMFT” or “DMFS” for permanent teeth, and“dmft” or “dmfs” for deciduous teeth).
When reporting data on dental caries in child populations, it is common practice to refer tothe “caries-free percentage”, which is equivalent to the disease prevalence subtracted from100 per cent, and depicts the proportion of children who have not yet experienced dentalcaries (to the point that it becomes clinically apparent).
The life course approach
The basic tenet of the life course approach is that, throughout the course of an individual’slife, adverse exposures gradually accumulate by way of ill health episodes, environmentalfactors or individual behaviours which increase the risk of chronic disease and mortality. Inthe context of chronic conditions such as dental caries or periodontal disease, the key notionfor this paradigm is the accumulation of risk through a range of biological events and socialexperiences over time. Depending on the condition, this may occur gradually throughoutthe entire life course, or there may be certain critical or sensitive periods when adverseexposures are likely to be more detrimental. Through the resultant chain of risk, certainexperiences or exposures in early life increase the likelihood of future events which, in turn,lead to greater or lower risk of adult disease (Kuh and Ben-Shlomo, 1997). Those chains ofrisk may be biological or social. With the former, exposures to causal factors through gestation,early childhood and early adulthood are part of long-term chains of risk which determinehealth in later adulthood. The latter begin with a socioeconomically compromised start tolife and are linked to adult socioeconomic conditions which influence disease risk throughlater life exposures to causal factors. Of course, the context is not the only consideration; fora given socioeconomic setting, an individual’s behaviour helps to shape not only his/hercurrent circumstances, but also his/her future health trajectory.

40 A Background Paper to the Public Health Advisory Committee
Dental caresystem
➧➧
C
B
A
DEquity/inequity
(opportunity)Equality/inequality
(outcome)
➧
➧
➧
➧
➧
This is a useful paradigm with which to study oral health. A poor childhood environmentcan either directly or indirectly increase the likelihood of poor child oral health (Figure 1).
Figure 1 : Chains of oral health risk through the life course (adapted from Kuh and Ben-Shlomo, 1997).
Where dental caries (and subsequent tooth loss) is concerned, an example of the directenvironmental effect would be having lower access to health-promoting environmentalexposures such as water fluoridation. The indirect effect could operate through having pooreror non-existent oral hygiene practices and an associated lower exposure to fluoride-containingtoothpaste.
Also pertinent to the life course approach is the notion of constitutional vulnerability,represented in Figure 1 as an underlying determinant of the individual’s susceptibility todisease. Such a notion is probably more appropriate when considering a disease such asperiodontal disease, where genetic susceptibility is thought to play a large role in the level oftissue destruction occasioned by the individual’s chronic inflammatory response to thebacterial challenge (Thomson et al, 2001).
Overall, the life course model identifies how early occurring events can be related to lateroutcomes, the multiple routes through which this can occur, and the linkages between biologyand psychosocial factors.
Equality and equity
For the purposes of this paper, a useful distinction can be made between the concepts ofequity and equality (Figure 2).
Figure 2 : The concepts of equity and equality in relation to dental care.
Poor childself-care
Poor adultself-care
Poor childenvironment
Poor childoral health
Poor adultoral health
Poor adultenvironment
Unfavourableuse of
services
CONSTITUTIONAL VULNERABILITY
➧
➧ ➧➧
➧
➧
➧
➧
➧➧
➧➧

A Background Paper to the Public Health Advisory Committee 41
Equity relates to fairness, or opportunity (Reading, 1993). In the case of the child oral healthcare system, it is concerned with ensuring that children have appropriate access, whether itbe to dental care services, or to topical fluoride which is at a concentration and frequencysufficient to reduce their chances of developing dental caries.
Equality relates to oral health outcome, whether or not the child has been using the oralhealth care system. For example, a situation where there is equality of outcomes would seesimilar oral health among Màori and non-Màori children, and between those from low andhigh SES groups.
In Figure 2, children A, B and C all participate in the dental care system, but child D does not.When inequalities are measured, the oral health of child D must also be included, as thesystem must also be judged on its performance with respect to equity.
Summary of main points – Chapter 1
The concept of oral health is difficult to define, and it is usually measured in terms of theabsence of disease. It is acknowledged that Màori and Pacific constructs of health are moreholistic than this. Dental caries is the most common oral disease in childhood and is giventhe greatest emphasis in this paper. The main population-level indicators of dental cariesare prevalence (the proportion who have had dental caries) and severity (the averagenumber of teeth or surfaces that have been affected). To further complicate the situation,the former is usually expressed as the caries-free percentage, equivalent to 100 minus theprevalence. Periodontal disease, dental trauma, enamel defects and malocclusion alsocontribute to dental morbidity in the New Zealand child population. A life course approachacknowledges that events occurring early in life are related to later outcomes, and is anideal paradigm in which to study oral health.

42 A Background Paper to the Public Health Advisory Committee
Chapter 2 : The state of child oral health in New Zealand
Current child oral health services
New Zealand’s school dental services (SDS) provide basic preventive and restorative dentalcare for preschoolers, primary and intermediate school children. The care is provided bydental therapists employed by District Health Boards (DHB). Dental therapists (formerlyschool dental nurses) are health care providers who have undertaken two or three years’training in primary oral health care. They work independently under indirect supervision byPrincipal Dental Officers (Hannah, 1998).
A wide range of basic dental care is provided, including:
♦ oral examination and prophylaxis (tooth cleaning)
♦ fissure sealing where appropriate
♦ cavity preparation and placement of fillings
♦ extraction of deciduous teeth when required
♦ referral of patients as required.
School dental services aim to see children annually, unless six-monthly visits are indicatedby a high risk of dental disease, usually determined on the basis of past disease experience.
Children are referred to a general dental practitioner for dental care that is beyond the scopeof this service. This includes the provision of root canal treatment, management of dentaltrauma or the extraction of permanent teeth. Some children with extensive treatment needs,particularly if they are very young, may be referred to hospital dental units for dentaltreatment under general anaesthetic.
The school dental service has a very high uptake, with enrolment for school-age childrenestimated to be greater than 95 percent. Those who do not participate usually opt for dentalcare from general dental practitioners on a privately funded basis. The reasons for the service’shigh uptake include its accessibility and acceptability, and the fact that it is a New Zealandtradition. Dental treatment is provided either at the child’s school or one nearby. Uptakelevels for preschool children are less favourable: although data on utilisation are limited, it isestimated that 70 percent of preschool children between two and a half and five years of agewere enrolled in the service in the late 1980s, while only 56 percent were enrolled in 1997.5
It has been the convention that dental therapists, as their name indicates, have always beenbased within primary or intermediate schools. In some Màori communities, however, thedental therapists could be more appropriately described as community dental therapistsbecause they are based with a Màori health provider rather than in a school, for example.This move has occurred over the last decade, with the aim of increasing access to the servicefor preschool children in particular. For example, Tipu Ora (a mother and child wellnessprogramme based at the Tunohopu Health Centre, Ohinemutu, Rotorua) has a dental clinicon site with the dental therapist still employed by the local school dental service, but co-
5 See http://www.newhealth.govt.nz/toolkits/oralhealth/introduction

A Background Paper to the Public Health Advisory Committee 43
located with the Màori health provider. Other models have been developed in different partsof the country, with considerable success and community acceptance.
Some parents prefer their children to receive dental care from a dentist or paediatric dentistrather than a dental therapist. Such care is provided on a private basis. Similarly, orthodontictreatment is usually performed by private practitioners, and, as a rule, is not funded by theState (except in special circumstances).6
After Year 8 (Form II), adolescents are eligible for dental care under the General Dental Benefitsystem until the age of 18.7 This dental care is provided by private dentists working under acontract with the local District Health Board (DHB). The type of care routinely offered differsslightly among DHBs. Most now have a capitation contract covering annual examinationand prophylaxis, intra-oral radiographs, basic restorative care and preventive care. Morecomplicated (or expensive) dental work can be provided at the discretion of the PrincipalDental Officer. In the late 1980s, over 80 percent of eligible teenagers were attending dentistsfor Dental Benefit care, while, in 1998, that proportion was estimated to be 68 percent (Hannah,1998).
The collection of oral data by DHBs
Dental caries data from two key age groups are collected annually by each DHB school dentalservice and reported to the Ministry of Health, enabling the collation of national-level statisticson the prevalence and severity of dental caries. The collection of data on caries in thepermanent dentition of Year 8 (Form II) children has been underway for over two decades,while the gathering of data on caries of the deciduous dentition in five-year-olds commencedin 1988. The data are gathered for each child at the end of his/her first (for five-year-olds)and last (for Year 8) completed course of treatment in the school dental service. At the Ministryof Health, the regional data are then combined to give weighted mean mft and MFT estimatesfor the entire country, as well as New Zealand-wide estimates of the caries-free proportionsfor each age group. The data are reported by ethnic group and by community waterfluoridation status.
A flaw of the current system is that there is no indication of the distribution of cariesexperience; aggregating means does not allow calculation of measures of dispersion (such asthe standard deviation). Moves are underway to enable the reporting of individual-leveldata, so that:
(a) the distribution of disease can be described and monitored
(b) the disease characteristics of particular groups can be examined
(c) multivariate techniques can be used in analysis so that the interpretation of patterns ismore accurate, and the effects of potential confounders such as SES, water fluoridestatus and ethnicity can be controlled.
However, progress in this area has been slow.
6 In past decades, the orthodontic treatment of cleft palate cases has been provided by the State through hospitalboards (and their various successors), and a number of needy orthodontic cases have also been treated; theprovision of these services has been consistent neither by period nor by region. Information on this aspect oforal health care provision has been extremely difficult to obtain.
7 The recent change in the GDB contracts system extended the upper limit for eligibility for this care from age 16to 18. Previously, a 16- or 17-year-old individual had to be in a full-time education or training programme inorder to qualify.

44 A Background Paper to the Public Health Advisory Committee
Caries status (prevalence and severity) by region (DHB)
Data are routinely collected by the school dental services for children at five years of age andin Year 8 (12–13 years). Dental caries among five-year-olds is reported annually by schooldental services throughout New Zealand using two main indicators: the caries-free percentage(from which the prevalence of the disease is easily calculated, being 100 minus that estimate),and the mft index (which denotes the severity of past deciduous caries experience). For Year8 children, the MFT index is used, as permanent teeth only are counted. The children areexamined and the data routinely recorded by dental therapists. At national level to date, thepractice has been to collate and report these data as weighted averages, with no measures ofdispersion, thereby imposing severe limitations on their analysis and interpretation.
The prevalence and severity of dental caries in children vary by region. This overview usedthe provisional statistics for 2001 which were obtained from the Ministry of Health website(http://www.moh.govt.nz). At five years, the national mean percentage of caries-free childrenwas 53 percent, with a mean mft of 1.8. At Year 8 (12–13 years), 42 percent were caries-free,and the mean MFT was 1.68 (Table 1).
For five-year-olds, the Wellington, Waitemata and Otago DHBs reported the greatestpercentage of caries-free children (63%, 63%, and 60% respectively); their mean numbers ofmissing or filled teeth (mft) were 1.1, 1.3 and 1.4 respectively. The DHBs reporting the smallestproportion of caries-free children were Northland and Tairawhiti, both with 35 percent caries-free, followed by the West Coast (40%), Waikato (41%), and Wanganui and Hawkes Bay (both43%). Their mean mft scores were 3.3 for Northland, 3.2 for Tairawhiti, 2.6 for the West Coast,1.6 for Waikato, 3.0 for Wanganui and 2.4 for Hawkes Bay.
The Year 8 (Form II) data for the same year show a slightly different pattern. The Wellington,Nelson-Marlborough, Waitemata and Wairarapa regions have the greatest proportion ofcaries-free children (56%, 51%, 50% and 49% respectively), with MFT scores of 1.0, 1.3, 1.3and 1.2. The regions with the smallest caries-free percentage were Bay of Plenty, Southlandand Taranaki (29%, 29% and 34% respectively); their respective MFT scores were 2.4, 2.0 and2.0.
About half of the New Zealand population receive an optimally fluoridated water supply. Itis noteworthy that the regions with the highest percentage of children receiving fluoridatedwater (Wellington and Waitemata) have the highest percentage of caries-free children at bothfive and 12–13 years, and the lowest mft/MFT rates. That is, the lowest prevalence and severityof dental caries. In the regions with the lowest provision of fluoridated water, the prevalenceand severity of dental caries are more variable. In Nelson-Marlborough, no children receivean optimally fluoridated water supply, yet the caries-free percentage and mft scores at fiveyears are moderate (50% and 2.2 respectively) and are even better than average at age 12–13(51% and 1.3). This is likely to be accounted for by the generally higher socioeconomic statusof residents in this region, where only 11 percent of children are considered to be of low SES.Similarly, for Canterbury, only 4 percent of children receive optimally fluoridated water, butonly 15 percent are low SES. Children in Canterbury have intermediate caries experience
8 It should be noted that dental caries is a disease continuum, ranging from preclinical demineralisation to grossinfection and destruction of the tooth tissue. Many children who are classified as ‘caries free’ may have lesionswhich either have not yet been detected or are not advanced enough to require restorative treatment (Edwardet al 1999). Thus, the true prevalence of dental caries is probably higher than reported in these routine data.

A Background Paper to the Public Health Advisory Committee 45
(49% of five-year-olds are caries free and mft is 1.8; 39 percent of Year 8 children are caries-free and MFT is 1.9). This contrasts with an area such as Northland, where children do notreceive optimally fluoridated water, and almost half (49%) of the population is considered tobe of low SES. In this region, only 35 percent of five-year-olds are caries-free, and the meanmft is 3.3. At Year 8, the difference is not as pronounced, but only 35 percent are caries-freeand the MFT is 1.8.

46 A Background Paper to the Public Health Advisory Committee
Tab
le 1
: 20
01 S
DS
data
by
regi
on, r
anke
d by
per
cent
age
of c
hild
ren
cari
es-f
ree
at 5
yea
rs (S
ourc
e: M
inis
try
of H
ealt
h w
ebsi
te)
DH
B/R
egio
nPe
rcen
t ide
ntif
ied
Perc
ent r
ecei
ving
Perc
ent c
arie
s-fr
eeM
ean
mft
Perc
ent c
arie
s-fr
eeM
ean
MFT
as lo
w S
ESfl
uori
date
d w
ater
at 5
yea
rsat
5 y
ears
at Y
ear 8
at Y
ear 8
Wel
lin
gton
2698
631.
156
1.0
Wai
tem
ata
4387
631.
350
1.3
Ota
go9
4760
1.4
392.
0
Mid
-Cen
tral
2858
531.
942
1.7
Tar
anak
i18
6250
2.1
342.
0
Nel
son
-Mar
lbor
ough
110
502.
251
1.3
Can
terb
ury
154
491.
839
1.9
Wai
rara
pa
2648
482.
149
1.2
Sou
thla
nd
2441
482.
329
2.0
Bay
of
Ple
nty
5519
442.
629
2.4
Wan
gan
ui
283
433.
040
1.9
Haw
kes
Bay
4039
432.
440
1.8
Wai
kato
2946
411.
638
1.6
Wes
t C
oast
130
402.
638
1.9
Tai
raw
hit
i47
6235
3.2
403.
0
Nor
thla
nd
490
353.
335
1.8
All
of
New
Zea
lan
d33
5253
1.8
421.
6

A Background Paper to the Public Health Advisory Committee 47
Although reliant on an ecological measure of fluoridated water exposure (the fluoridationstatus of the local water supply), these data provide further confirmation of the observationthat community water fluoridation acts to reduce socioeconomic differentials in dental cariesstatus, although the data from Tairawhiti indicate that the situation is not simply a fluoride-nonfluoride dichotomy at the regional level, given that a relatively high proportion (62%) ofthat area’s child population (comprising Gisborne city) drinks fluoridated water, but theirage-5 data compare poorly with other such areas.
It is of interest that the DHBs reporting the best and worst mft/MFT scores, and caries-freepercentages differ for the two age groups. There are several possible explanations for this. At12 years, many permanent teeth are newly erupted, so have had less opportunity to decay orto receive the benefits of fluoridation. The influence of having spent a number of years underSDS care is probably a factor; in addition, there are also likely to be operator-level differences,as the threshold for restoring teeth may vary between DHBs. The deployment of dentaltherapists varies greatly between DHBs. In 1998, it was reported that the therapist-to-enrolled-population ratio ranged from 1:806 in Tairawhiti Healthcare Ltd to 1:1667 in Eastbay Health,with a nationwide average of 1:980, and there are differences among DHBs in the extent anduse of dental assistants (Hannah, 1998). There may also be cohort or period effects operatingdifferently among regions, with differences in relative poverty or prosperity also perhapsbeing reflected in the caries statistics (see Chapter 6 for further discussion of this particularissue).
Trends since 1990
The most recent national dental survey showed that, in the 15 years up to 1988, NewZealanders went from having one of the highest levels of dental disease in the developedworld to a very low level in children aged 12 and 13 years.9 Data on caries severity and thepercentage of caries-free children for the years 1990–1999 are presented in Figures 3 and 4.The mean mft scores for five-year-olds fell steadily from 1990 to 1996, and have been slowlyrising since that time. A similar pattern is evident for 12-year-olds, who experienced a steadydecline in caries severity from 1990 to 1994, followed by an increase until 1997, then a levellingoff or slight decline over the next two years (Figure 3).
The percentage of caries-free five-year-olds has remained fairly constant during that period,at just over 50 percent. The percentage of caries-free Form II children has shown morevariation, with an increase until 1994, a decline over the next two years, and a plateau since1997 (Figure 4). An average eight percent annual decrease in MFT scores observed amongForm II children from 1980 to 1994 had turned into a five percent increase between 1994 and1995 (NZDA, 1999), and their mean MFT scores have remained relatively constant since then.Overall, the two decades since 1980 have seen a substantial fall in the prevalence and severityof dental caries.
9 http://www.newhealth.govt.nz/toolkits/oralhealth/

48 A Background Paper to the Public Health Advisory Committee
60
55
50
45
40
35
30
25
% C
arie
s-fr
ee
Year
Age 5
Year 8
1990 1991 1992 1993 1994 1995 1996 1997 1998 1999
2.3
2.1
1.9
1.7
1.5
1.3
1.1
0.9
0.7
0.5
mft
/MFT
Year
Age 5
Year 8
1990 1991 1992 1993 1994 1995 1996 1997 1998 1999
Figure 3 : Trends in dental caries severity among 5-year-olds and Year 8 children since 1990.
Figure 4 : Trends in dental caries prevalence among five-year-olds and Year 8 children since 1990.
Several explanations for these trends have been put forward. Radiography was introducedwithin the school dental service in the early 1990s. The increasing use of dental radiographsfrom the mid-1990s (enabling enhanced sensitivity in detecting dental caries) is likely to havecontributed to the apparent increase in dental caries experience of 12-year-olds. It is lesslikely to have influenced the data for five-year-olds because radiographs are not usuallytaken for this age-group. An additional hypothesis proposed by Thomson (1997) is thatincreasing socioeconomic marginalisation of substantial sections of New Zealand societyduring the 1990s has resulted in higher levels of disease. In addition, recent immigration isthought to be having an impact on child dental caries in some areas. Many immigrant childrenpresent to the school dental services with a considerable amount of untreated disease (Edwardet al, 1999).
It should be noted that the mean mft and MFT scores mask an increasing divide into a largegroup of children with low disease, and a smaller, but still substantial group with high disease(Whyman, 2000). Thus, examining the distribution of disease is of considerably more usethan concentrating upon changes in measures of central tendency (such as means). Moreover,it has not been possible to monitor ethnic differences over time in the distribution of dentalcaries, as it is only in recent years that the data have been collected in that way. Currentmoves to standardise the collection of SDS data at unit-record level should enable bettermonitoring of trends in inequalities in the distribution of dental caries among New Zealandchildren.

A Background Paper to the Public Health Advisory Committee 49
Summary of main points – Chapter 2
A range of child oral health services are provided for New Zealand children, includingcare provided by school and community dental therapists, private dental practitioners(under the Special or General Dental Benefit schemes), or specialist hospital departments.The utilisation of the school dental services by school-age children is very high, but it is ofconcern that preschool uptake is variable, and considerably lower among Maori, Pacificpeople and those from groups of lower SES. The uptake of dental services by adolescentsis considerably less than optimal.
Recent routinely collected school dental service data indicate that, nationally, 53 percentof five-year-olds are caries-free, with a mean mft of 1.8. At Year 8 (12–13 years), 42 percentare caries-free, with a mean MFT of 1.6. The prevalence and severity of dental caries varyconsiderably by region. Overall, regions with the highest percentage of children receivingfluoridated water have the lowest overall caries rates as well as lower socioeconomic andethnic differentials in dental health. Caries rates in New Zealand children decreased steadilyfrom 1980 to the early 1990s, but have either remained static or increased slightly sincethat time.

50 A Background Paper to the Public Health Advisory Committee
Chapter 3 : Socio-demographic associations with child oralhealth
This chapter examines the association between child oral health and the socio-demographiccharacteristics of ethnicity and culture, socioeconomic status and deprivation, housing, anddisability status. As with earlier chapters, New Zealand data are used wherever possible.
Socioeconomic status (SES)
Measuring socioeconomic status
The oral health inequalities literature provides plenty of evidence for the poorer oral healthof groups of lower SES relative to their higher SES counterparts. The differences are apparentnot only with different measures of oral health, but also with the various measures of socialinequality that can be used (Locker, 1993). These can be divided into individual-level andarea-level measures. These are briefly described below.
Individual-level measures represent a person’s social rank based on one or more characteristicslike occupation, income or education level, or, less commonly, home or car ownership.10 Theycan, of course, also be used at the household level; for example, all members of a householdcan be allocated to an SES category based upon the occupation of the main breadwinner.Using occupation as the SES measure can have problems:
(1) students, unemployed people and older people can be difficult to classify and musteither be omitted from analyses or arbitrarily assigned to a particular SES level
(2) the occupational classification which is used must be updated regularly
(3) in the New Zealand context, such classifications are likely to reflect Pakeha values andnorms, with little or no allowance for Màori values and concepts.
Income level is also not free of problems as a measure of SES, despite being easy to analyse(Locker, 1993). Accurate information can be difficult to collect, as questions which seekinformation on individual (or household) income level usually have the highest item refusalrate, and there may be doubts about the accuracy of the information which is collected. Incomecan also be unstable through the life course, with various life stages or events associatedwith income fluctuations. Education level is usually relatively easy to collect, tends to remainstable over time, and is strongly associated with people’s values, health beliefs and practices.There are problems, however, as it may now be insufficiently discriminatory for use as agood explanatory measure. Locker (1993) pointed out that the increasing prevalence of tertiaryeducation means that a university education now may not carry the same meaning for socialrank that it did some decades ago.
Several area-level measures of deprivation have been developed to overcome some of theweaknesses of the conventional individual-level measures. Such measures incorporate thecharacteristics of the immediate area in which people live, dividing a population into
10 Neither of these would be sufficiently discriminatory for use as sound measures in New Zealand.

A Background Paper to the Public Health Advisory Committee 51
neighbourhoods of similar individuals and considering the level of deprivation in each area.Unfortunately, the literature lacks a universal definition of deprivation, or consensus aboutwhich variables should be considered. Measures may be restricted to a single item, such astelephone or car ownership, but more commonly include several variables. Most measuresconsider material rather than social deprivation (Locker, 2000). In New Zealand, the NZDep96index (Crampton et al, 2000) assigned a deprivation score between 1 (least deprived) and 10(most deprived) to each Census meshblock using data from the 1996 Census on ninecharacteristics.11 A similar measure (which is commonly used by the school dental services)is the TFEA indicator (Ministry of Education, 1997), which was primarily designed to assistin targetting funding to schools in deprived areas. It assigns each school to a score between 1(most deprived) and 10 (least deprived) based on school catchment and Census data on sixcharacteristics.12 Area-level measures can be very useful for descriptive epidemiologicalpurposes, but their ecological nature13 limits their utility for analytical epidemiology.
The sections which follow describe current knowledge of the relationship between oral healthand SES using a range of individual- and area-level measures. New Zealand evidence ishighlighted.
Social class/socioeconomic status
An association between dental caries and family social rank in New Zealand children haslong been recognised. The pattern is similar to that observed in other western industrialisedcountries, in that epidemiological studies have invariably shown a distinct socioeconomicgradient in the prevalence and severity of dental caries, with disadvantaged people having ahigher caries experience than those who are less deprived (Cutress et al, 1976; Evans et al,1984; Hunter et al, 1992; Provart and Carmichael, 1995; Fergusson and Horwood, 1986; Brownand Treasure, 1992; Evans et al, 1984; Schou and Uitenbroek, 1995). The disadvantagedsocioeconomic position of Màori relative to Pakeha has long been noted (New ZealandPlanning Council, 1987), and that difference is also reflected in oral disease differentials.
A large quantity of international literature has investigated the association betweensocioeconomic and socio-demographic factors and dental health. The influence of these factorsappears to vary markedly, depending on cultural differences and the organisation of thedental care system (Bolin et al, 1997). Universally, an association exists between a population’slevel of socioeconomic development and dental caries. Dental caries occurrence has beenfound to be a good proxy measurement for socioeconomic development, with countries inthe throes of socioeconomic transition having the highest DMFT scores (Lalloo et al, 1999).Socio-demographic factors also influence caries risk within populations, with children ofhigher social classes displaying lower caries levels than more disadvantaged children(Tinanoff, 1995; Elley and Langford, 1993). In a study involving 3200 five- and 12-year-oldchildren from eight countries (Bolin et al, 1997), caries severity was lower if at least one parentbelonged to a high social class. In the case of the father, this finding was significant for bothages, but, if only the mother belonged to a high social class, the association reached statistical
11 Telephone access, means-tested benefits, unemployed, low income, car access, single-parent households,educational qualifications, home ownership, and crowding.
12 Household income, parents’ occupation, household crowding, parents’ educational qualificaitons, incomesupport payments, and Màori or Pacific Island ethnicity.
13 An ecological measure is one which assigns a characteristic measured at group level to an individual; for example,all persons living in an area rated ‘10’ using the NZDep96 are assumed to be highly deprived.
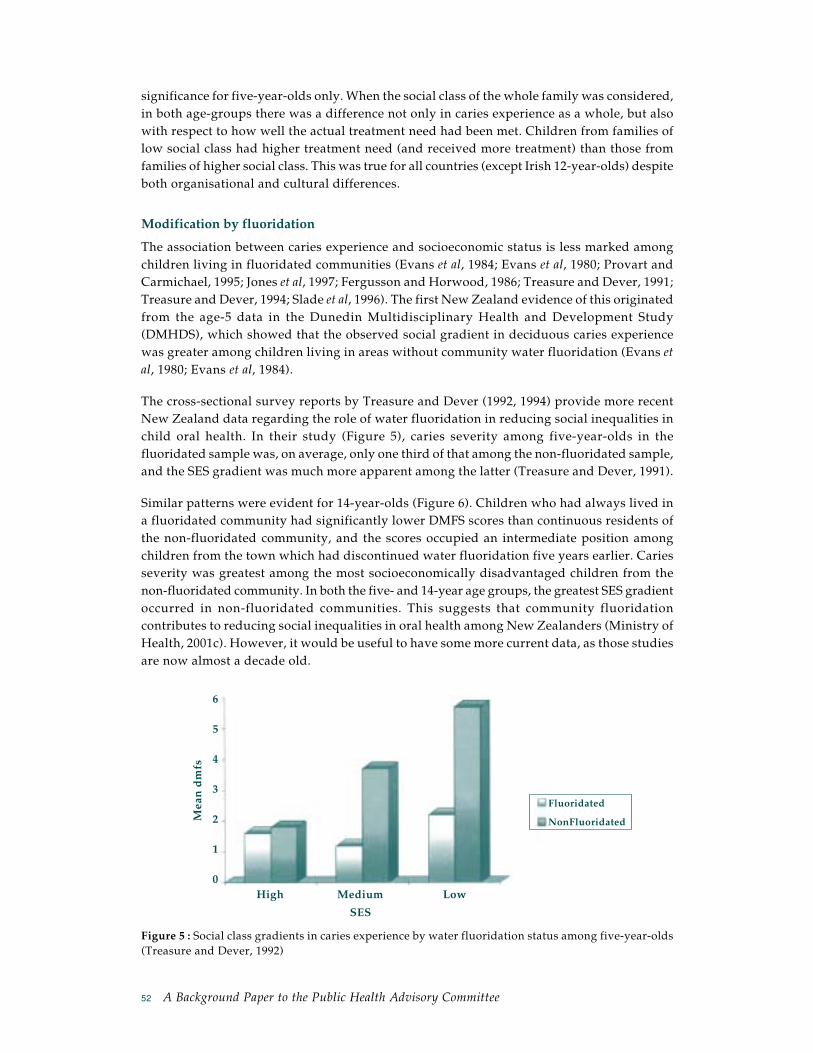
52 A Background Paper to the Public Health Advisory Committee
High Medium Low
Mea
n d
mfs
SES
Fluoridated
NonFluoridated
6
5
4
3
2
1
0
significance for five-year-olds only. When the social class of the whole family was considered,in both age-groups there was a difference not only in caries experience as a whole, but alsowith respect to how well the actual treatment need had been met. Children from families oflow social class had higher treatment need (and received more treatment) than those fromfamilies of higher social class. This was true for all countries (except Irish 12-year-olds) despiteboth organisational and cultural differences.
Modification by fluoridation
The association between caries experience and socioeconomic status is less marked amongchildren living in fluoridated communities (Evans et al, 1984; Evans et al, 1980; Provart andCarmichael, 1995; Jones et al, 1997; Fergusson and Horwood, 1986; Treasure and Dever, 1991;Treasure and Dever, 1994; Slade et al, 1996). The first New Zealand evidence of this originatedfrom the age-5 data in the Dunedin Multidisciplinary Health and Development Study(DMHDS), which showed that the observed social gradient in deciduous caries experiencewas greater among children living in areas without community water fluoridation (Evans etal, 1980; Evans et al, 1984).
The cross-sectional survey reports by Treasure and Dever (1992, 1994) provide more recentNew Zealand data regarding the role of water fluoridation in reducing social inequalities inchild oral health. In their study (Figure 5), caries severity among five-year-olds in thefluoridated sample was, on average, only one third of that among the non-fluoridated sample,and the SES gradient was much more apparent among the latter (Treasure and Dever, 1991).
Similar patterns were evident for 14-year-olds (Figure 6). Children who had always lived ina fluoridated community had significantly lower DMFS scores than continuous residents ofthe non-fluoridated community, and the scores occupied an intermediate position amongchildren from the town which had discontinued water fluoridation five years earlier. Cariesseverity was greatest among the most socioeconomically disadvantaged children from thenon-fluoridated community. In both the five- and 14-year age groups, the greatest SES gradientoccurred in non-fluoridated communities. This suggests that community fluoridationcontributes to reducing social inequalities in oral health among New Zealanders (Ministry ofHealth, 2001c). However, it would be useful to have some more current data, as those studiesare now almost a decade old.
Figure 5 : Social class gradients in caries experience by water fluoridation status among five-year-olds(Treasure and Dever, 1992)

A Background Paper to the Public Health Advisory Committee 53
High Medium Low
Mea
n D
MFS
Fluoridated
Discontinued
NonFluoridated
9
8
7
6
5
4
3
2
1
0
SES
Figure 6 : Social class gradients in caries experience by water fluoridation status among 14-year-olds(Treasure and Dever, 1992).
International evidence confirms these observations of the effectiveness of water fluoridationin reducing oral health inequalities. In an investigation of 2751 five-year-old children inCounty Durham (Provart and Carmichael, 1995), caries experience varied according to thelevel of deprivation and fluoridation status. Mean dmft values ranged from 0.8 among childrenfrom a fluoridated, low-deprivation area to 2.1 among children from non-fluoridated, high-deprivation wards. Community water fluoridation significantly reduced (but did noteliminate) the variation in mean dmft caries prevalence between high- and low-deprivationgroups. Fluoridation-associated reductions in caries experience were greater for the moredeprived, higher caries group. In contrast, the investigation of United Kingdom 14-year-oldsby Ellwood and O’Mullane (1995) found that the effect of water fluoridation in reducingdecay was the same for different strata of deprivation. It has been suggested that the interactionof the effect of fluoridation with social factors in this age-group becomes less important ormore difficult to demonstrate in areas with low caries levels, because absolute changes indental caries become very similar for different social groups (Provart and Carmichael, 1995).
A cross-sectional study of more than 1300 children from two Australian states examinedinequalities in dental caries experience by SES, and their association with community waterfluoridation. In Queensland, the SES inequalities were lower among children exposed tofluoride: dmfs ratios between low and high income groups ranged from 1.5 to 3.6 for childrenwith no exposure to fluoride, and from 0.8 to 2.1 for children with lifetime exposure to fluoride.However, multiplicative interactions were not statistically significant in South Australia orwhen the caries experience of the permanent dentition was considered (Slade et al, 1996).
Maternal education level
The association between child oral health status and the educational level obtained by theparents (usually the mother) has been investigated in a number of studies. Educational levelcan be considered to be a proxy for social class, and is frequently used because it is easy tomeasure. Maternal educational level has been found to be a risk indicator for dental caries inboth the primary and the permanent dentition (Verrips et al, 1993).

54 A Background Paper to the Public Health Advisory Committee
In a longitudinal study of 193 preschoolers observed over a three-year period (Roeters et al,1995), a significant negative correlation existed between the level of education of the motherand the children’s (a) frequency of eating, (b) number of sugar-containing food ingestions,and (c) dmfs score. As the children got older, the correlation got stronger. A longitudinalstudy of 828 Finnish children followed from before birth until five years of age (Mattila et al,2000), found that the higher the mother’s basic educational level, the more likely that herchild would be caries-free at five years (P<0.001). Similarly, an Irish study of 294 preschoolchildren found that maternal education level was significantly associated with child dentalhealth (Kinirons and McCabe, 1995). Grindefjord et al (1995) reported that maternal educationwas significantly associated with dental caries at three and a half years of age in a cohort of786 children. More recently, a cross-sectional study of 4315 children aged three to 15 years(Hjern et al, 2001) found that the odds of ever having had dental caries were higher for childrenwhose parents had low levels of education. However, this study was based on interviewdata and self-reported caries status, rather than clinical examinations.
Maternal education has also been found to influence a child’s dental attendance. Thomasand Startup (1991) reported that 70 percent of 405 mothers with A-levels, but only 39 percentof less educated mothers, had taken their child to a dentist before the age of three years.Kinirons and McCabe (1995) also found that children of highly educated mothers visited thedentist more frequently than children of less educated mothers. Parental education levelsalso appear to influence the adoption of good dental behaviours. The latter study found thatchildren of well educated mothers brushed their teeth more often, and this was independentlyassociated with a lower child dmfs. Conversely, the frequency of sweets consumption wasnot related to caries severity. Ethnicity and maternal education level were found to beindependently associated with caries risk (Kinirons and McCabe, 1995).
One possible (behavioural or social learning) explanation for the association between thecaries experience of the child and the education of the parents is that more highly educatedpeople have more favourable dental health behaviours, such as lower sweet consumption,more frequent brushing, and a routine (rather than episodic) dental visiting pattern. Thus,positive parental modelling exerts its effect. It has been suggested that the educational leveldoes not influence knowledge about dental caries prevention, but influences an individual’sability to put this knowledge into practice (Roeters et al, 1995). Contrary to this view, Thomasand Startup (1991) reported an association between a mother’s educational level and herknowledge of fluoride supplements. This could be influenced by better educated mothershaving earlier and more frequent contacts with dental services. Interventions to improve theeducational status may improve the oral health and general well-being of children (Verripset al, 1993).
Deprivation: area-based approaches
Measures of deprivation show a variable sensitivity to differences in oral health in children.For example, in a recent study, the proportion of the mean DMFT explained by deprivationindices ranged from 4.2 to 62.9 percent (Morgan and Treasure, 2001). Most compositedeprivation indices are able to demonstrate the relatively poor health experience of individualsliving in deprived areas, and show some evidence of differences in oral health behavioursamong affluent and deprived groups. Interestingly, in some cases, a single indicator, such asthe percentage unemployed, can be as reliable as the more sophisticated measures. If the linkbetween deprivation and disease exists, irrespective of which measure of health or

A Background Paper to the Public Health Advisory Committee 55
socioeconomic status is used, we can be confident that a true relationship exists (Locker,2000).
Provart and Carmichael (1999) examined the Townsend index of material deprivation andits relationship to the prevalence of dental caries in five-year-old children. They showed acorrelation between the level of material deprivation and the level of dental caries, with meandmft values increasing from 1.1 in the most advantaged group to 1.9 in the most deprivedgroup. Active, untreated caries comprised the greatest component of dmft, with the levels ofrestorative dentistry similar in each deprivation group, regardless of fluoridation status.
Gratrix and Holloway (1994) used an ecological approach to compare levels of deprivationamong English communities with high or low caries experience (mean dmft) in five-year-olds. Communities with greater caries severity were found to have lower proportions of babiesof normal birth weight and children living in two-parent families. They also had lower levelsof home and car ownership, and fewer households in the highest social classes. High-cariesareas had higher Townsend mean deprivation Z scores. Parents in high-caries communitieswere reported to have more social and financial problems. It was concluded that socialdeprivation may be an indicator of dental caries in communities of preschool children. Thefindings should be interpreted with caution, however, as the significance level was set at0.25 ‘to reduce the risk of rejecting any potential indicator of caries’, but thereby increasingthe risk of drawing a false positive conclusion (Type 1 error).
The level of disadvantage appears to influence the amount of dental care received. By age 18in the Dunedin Multidisciplinary Health and Development Study (DMHDS), the time sincethe last dental visit was clearly associated with the level of disadvantage: among the leastdisadvantaged individuals, the mean period since last attendance was 9.6 months, whereasit was 31.6 months for those most disadvantaged. The use of orthodontic services was loweramong the most disadvantaged individuals (Brown and Treasure, 1992). Similarly, a highprevalence of untreated dental injuries has been reported in a deprived English populationcompared to the average UK estimates (Marcenes and Murray, 2001).
Ethnicity
A recent review (Ministry of Health, 2001a) stated that ethnic inequalities in oral health cannotbe considered in isolation from other ways in which social stratification occurs in NewZealand, because ethnicity is a marker of both socioeconomic situation and identity. It wenton to point out that underlying those respective structural and cultural dimensions of healthis the experience of discrimination, defined as institutional and personal racism, which canact directly through psychological pathways to adversely affect health. The observed healthinequalities are brought about by the interaction of structure (socioeconomic situation),identity and discrimination, together with age, sex and social class. Thus, implicit in thefollowing discussion on ethnic inequalities in oral health is the acknowledgment thatcharacteristics such as SES are also involved and may, in a pure epidemiological sense, beconfounding the association by contributing to the observed disparities. This should, ofcourse, be tempered by the fact that (a) SES measures are far from perfect (especially whenused across different ethnic/cultural groups), and (b) non-Europeans are disproportionatelyrepresented among groups of lower SES.14
14 The policy implications of this are discussed further in Chapter 8.

56 A Background Paper to the Public Health Advisory Committee
It should also be remembered that the oral health system’s routinely-collected ethnicity dataare not without potential problems. The school dental services use the ethnicity informationentered on each child’s school record by school staff using the Ministry of Education’scategories (‘Màori’, ‘Pacific’ or ‘Other’), and the validity of that information is currentlyunclear.
Health disparities between Màori and non-Màori were recently highlighted in reports releasedby the Minister of Màori Affairs in 1998 (Te Puni Kokiri, 1998; Te Puni Kokiri, 2000). Whiledental health was not mentioned specifically due to the lack of any recent reliable data onadult Màori dental health, the concern was discussed in the Ministry of Health Report WellBeing of Whanau (Ministry of Health, 1998), which noted that the oral health of adult Màoriwas, on average, poorer than that of non-Màori.
Substantial ethnic inequalities in oral health status are evident among New Zealand children,with Màori (and Pacific) children and adolescents having a higher prevalence and severity ofdental caries than other New Zealand children. For example, an analysis of 1992 school dentalservice data on 3,283 five-year-olds in the Manawatu-Wanganui area showed that non-Màorichildren were three times more likely than Màori children to be caries-free upon completionof their first dental treatment (Thomson, 1993). Màori children were three times more likelythan non-Màori children to have had high caries experience (that is, a mft score greater than4). The dental health indicators for Pacific children were positioned between those for Màoriand European children. Although the Manawatu-Wanganui data were collected a decadeago, evidence from national and regional SDS data suggests that those ethnic inequalities inoral health are likely to have persisted. For example, a 1997 dental survey of 26 Northlandprimary schools showed that the caries-free proportion was 49 percent among non-Màorifive-year-old children, but only 17 percent among five-year-old Màori children.15 In the EasternBay of Plenty region, the difference between Màori and non-Màori in their proportion ofcaries-free five-year-olds was undiminished through the mid-1990s,16 with only one in fourMàori (but 6 out of 10 non-Màori) five-year-olds being unaffected by caries.
Approximately three percent of five-year-olds had dental decay severe enough to requiredental treatment under general anaesthetic, with the rate being twice as high among Màorichildren (Thomson, 1993). This may be due to a combination of factors; the higher cariesexperience of Màori children, the fact that they are less likely to be enrolled in the schooldental service as preschoolers, (meaning that the disease is more advanced at presentation),or that the clinical environment or the approach to treatment may have been seen by Màorias inappropriate for their children. It may also reflect decisions made by dental health careproviders, who may promote general anaesthetic as a ‘one-stop shop’ for high-risk children.The higher need for dental care provided under general anaesthetic for Màori children is ofconcern, as it places them at a higher risk within the dental care system. In 1997, Koopunoted that 66 percent of children referred to the Dental Unit of Capital Coast Health fordental treatment under general anaesthesia were Màori or Pacific children.17 Evidence isaccumulating of an increasing demand and escalating waiting times for this form of care(Thomson, 1994). This suggests that inequalities in dental health between Màori and non-
15 K Prime, personal communication.16 Eastbay Health school dental service data.17 Personal communication.

A Background Paper to the Public Health Advisory Committee 57
Màori young children may be increasing, and that more young children are experiencingadvanced dental disease. Alternatively, it may suggest a lower threshold for provision ofcare by this method, given that each dental therapist now manages a considerably largerpatient group (typically spread over a number of clinics) than a decade ago (Hannah, 1998).
Despite a largely free dental care system for children, access to care plays a substantial rolein ethnic inequalities in health care, and manifests in different ways through the life course.These inequalities are most evident in the preschool population, least evident in primaryschool aged children, and increase again in adolescence. In the above mentioned study byThomson (1993), Màori children were over three times more likely than non-Màori not tohave been enrolled in the school dental service as preschoolers. Recent initiatives may haveimproved the uptake of dental services by preschool children but we do not yet have anyevidence of this. Historically, there have been few inequities in access to care for primaryschool-aged children owing to the presence of dental therapists at the primary schools.However, concern has been expressed that, with most (if not all) dental therapists nowmanaging the oral health needs of several schools, there has been increasing difficulty inaccessing care for some groups. This is particularly true for Màori children, whose familiesmay also be mobile, meaning that children can attend several schools in one year (Broughton,2000).
Under-utilisation by some groups of adolescents is a concern. A 1980s cohort study of 1045New Zealand adolescents reported that 72 percent received care under the General Dentalbenefit until 16 years. The mean DMFT score for the children who did not enrol for DentalBenefit care was higher than those who continued to receive dental treatment. There werelarge differences in utilisation by Europeans and non-Europeans (predominantly Màori), at78 and 45 percent respectively (de Liefde, 1988). Seven years later, the Midlands RegionalHealth Authority reported that only 50 percent of Màori adolescents were accessing dentalcare (Te Puni Kokiri, 1998). It is acknowledged that, for many Màori and Pacific people, theuse of health care tends to be symptom-related rather than preventive in orientation. This isof concern, as the insidious and chronic nature of most oral conditions means that oral painusually suggests advanced disease (Brown and Treasure, 1992). Although GDB care at age 15does not predict greater routine use of dentistry (or better health outcomes), episodic usershave been shown to experience poorer dental health, with more teeth extracted due to caries,and a higher overall caries experience (Thomson, 2001). Adolescents who fail to access dentalcare may present with substantial dental problems in adulthood.18 Anecdotal evidence alsosuggests high prevalence and severity of dental caries among immigrant children, with manyfrom countries such as Croatia, Bosnia, Serbia and various Asian countries enrolling in theschool dental services with considerable untreated disease (Edward et al, 1999). However,data on dental caries rates among children in those other ethnic groups are lacking.
New Zealand school dental service data suggest that ethnic inequalities in child oral healthstatus are more pronounced in areas that do not receive optimally fluoridated water. The1999 national data in Figures 7 and 8 show that water fluoridation has clear benefits fordifferent ethnic groups, and contributes to reducing ethnic inequalities in oral health status(Ministry of Health, 2001c).
18 See the next section “Issues for tamariki Màori and their whanau” for discussion of the possible reasons forthis.

58 A Background Paper to the Public Health Advisory Committee
Figure 7 : Caries severity among New Zealand five-year-olds in 1999, by ethnicity and water fluoridationstatus
Figure 8 : The percentage caries-free among New Zealand five-year-olds in 1999, by ethnicity andwater fluoridation status
Some issues for tamariki Màori and their whanau
A number of specific health-related behavioural and environmental factors are linked to thepoor dental health status of tamariki Màori. These are listed below and briefly discussed.
1. The perception of the “Murder House” is still very widespread among Màori, especiallyadults, and this negative attitude is transferred to the younger generation. Earliergenerations’ view of the school dental nurse as the “Great White Starched Taniwha”may lead to some Màori parents avoiding contact with the school dental service,meaning that their children are also denied access.
2. Parents may be whakama19 about their own oral health, and consequently avoid takingtheir preschool children to the school dental clinic.
3. Distance and a lack of adequate transport may preclude the use of oral health servicesby many Màori people, particularly in rural or isolated areas, where, not only is the
19 Whakama is a state of mind and the behaviour associated with it. Whakama does not have a one-word Englishtranslation but encompasses such things as shame, embarrassment or shyness.
Fluoridated
NonFluoridated
Màori Pacific Pakeha/Other
% c
arie
s-fr
ee
70
60
50
40
30
20
10
0
SES
Màori Pacific Pakeha/Other
Mea
n M
FT Fluoridated
NonFluoridated
4
3.5
3
2.5
2
1.5
1
0.5
0
SES

A Background Paper to the Public Health Advisory Committee 59
school dental clinic some distance away, but the dental therapist may only be there fora few weeks every year. For example, the dental therapist in the Hokianga20 reportedthat, while there had been a high enrolment of preschool Màori children in the area(due to enrolment programmes), there had been a very poor subsequent attendancefor dental care. This was attributed largely to a lack of transport to the clinic.
4. The more recent phenomenon of mobility, by both whanau and dental therapist, isalso responsible for a lower uptake of dental care among Màori preschool and school-age children. Many Màori families are mobile, living in different parts of the countryfor varying periods of time, and it is not uncommon for some children to attend anumber of schools over a two-year period. Where the service side is concerned, thenumber of practising dental therapists has almost halved since 1990. As a consequence,many dental therapists are required to take charge of three or more school dental clinics,meaning that there is only limited time spent in a given clinic. With both therapist andclient being mobile in this way, the chances of some children missing out altogether ondental care are greater.
5. Today’s ready accessibility to and heavy television marketing of junk foods, and thedirect marketing of soft-drinks as loss-leading supermarket specials21, has made highsugar content diets relatively common. By volume, milk is considerably more expensivethan the leading soft drinks.
6. Access to topical fluoride may be lower for many Màori. Fluoridated public watersupplies are seen only in larger communities, and many Màori live in non-fluoridatedrural areas. If toothpaste is not purchased, the whanau miss out on the most effectivealternative means of delivering topical fluoride.
7. Parental oral care practices set important examples for their children, as oral healthbehaviour is learned behaviour.
8. Màori cultural constructs may impact upon health care beliefs and practices; forexample, the concept of the tapu of the body is a very important factor (the head inparticular). Oral health professionals should be conversant with the health beliefs,attitudes and practices of the diverse ethnic groups which they treat.22
Recently, there have been positive developments in Màori oral health services, Màori oralhealth promotion resources, and the Màori oral health workforce which are addressing theabove points (see Chapter 8 for more details).
Housing and household composition
There is a paucity of data available concerning the association between oral health and housingstandard or crowding. The past decade has seen a number of investigations of health andhousing in New Zealand (Isaacs and Donn, 1993; Howden-Chapman et al, 2000; Howden-
20 Margaret Tahere, personal communication.21 It is worth noting that the highest selling supermarket grocery item in New Zealand, determined by the number
of units sold, is the 1.5L bottle of a well known cola-flavoured soft drink.22 It is only in the last decade that this issue has been developed in the undergraduate education of dentists, and
it has been part of the education of dental therapists for the last three years.

60 A Background Paper to the Public Health Advisory Committee
Chapman et al, 1996); the early 1990s introduction of “market rents” for State housingconcentrated a great deal of research attention on housing and health, but this work has notincluded oral health.
A recent English cross-sectional study investigated clinical evidence of dental injuries in 268414-year-olds (Marcenes and Murray, 2001), and reported that living in an overcrowdedhousehold increased the risk of having a dental injury. Neither the overall Jarman Indexscores, nor the individual components of the Jarman index were associated with the occurrenceof dental injuries in the sample, but this may have been due to the small variation in thelevels of deprivation in this area.
There is more information available concerning factors such as household composition,maternal age and a child’s birth order in relation to dental caries. In a large multicentreEuropean study, children living with both parents had lower mean dmfs values than childrenliving in other household types, but this only reached statistical significance for Italian children(Bolin et al, 1997). Conversely, Mattila et al found more recently that the prevalence of dentalcaries in five-year-olds was independently associated with parents’ cohabitation (OR 3.3;95% CI 1.5-7.6). The prevalence of dental caries was lower among children of single mothers(11%) than those whose parents were married (25%) or cohabiting (50%). Children born toyounger mothers were more likely to have experienced dental caries than those born to oldermothers; caries prevalence among children whose mother was less than 20 years of age was55 percent, whereas it was only 24 percent among those whose mother was over 25 years oldat childbirth (Mattila et al, 2000).
A study of 340 randomly selected Irish children reported a statistically significant relationshipbetween the dental caries experience of the child and its position in the family; the lowestcaries experience occurring in the second and third born. First-born children were less likelyto be caries-free, and those who were fourth or more were the least likely to be caries-free(P<0.05) (Kinirons and McCabe, 1995). This corroborates the findings of an earlier report,that children at greatest risk of caries were those whose birth rank was one or greater thanthree (Primosch, 1982). Suggested explanations for these findings include: the first born maybe overindulged; improved parenting skills may benefit the dental health of the second- andthird-born; and children of higher birth rank may receive less attention concerning preventivebehaviours and control of dietary sugars.
Locality (rurality and region)
Although New Zealand evidence is lacking, it has been reported that Australian childrenand adolescents living in rural areas experience higher rates of dental caries than in thoseliving in metropolitan regions (Crowley et al, 2000). Tennant et al (2000) recently reportedthat, in Western Australia, a rural preschool child was more likely to be admitted to hospitalwith dental caries than a metropolitan preschool child, but the association was not a strongone, and there was no significant difference in the rates of hospitalisation for older childrenby place of residence. A lack of fluoridated water supplies is likely to be a major factorcontributing to an increased prevalence and severity of dental caries in rural areas. Such asituation holds in New Zealand, where community water fluoridation is found in largercommunities, and children in rural areas such as Northland, Eastern Bay of Plenty andTairawhiti do not have access to the benefits. Màori children are disproportionately affectedby this, given their greater numbers in those areas.

A Background Paper to the Public Health Advisory Committee 61
In Finland, 38 percent of five-year-old children living in a rural environment had a dmftgreater than 0, compared to only 26 percent of those living in an urban environment (p<0.01;Mattila et al, 2000). This observation had previously been observed for three-year-olds, and itwas noted that rural children’s teeth were brushed less frequently than those of urban children(Paunio, 1993a and b). It has been hypothesised that dental health may not be as positive andimportant a value for rural residents than for urban populations (Mattila et al, 2000).
Maternal oral health
The mother is known to have a biological role in the first microbial colonisation of her child’steeth. In a recent study of five-year-olds, the father’s dental caries history was also a significantcontributor to a child’s dental health (Mattila, 2000). In studies comparing salivary counts ofS. mutans23 in children with those of their parents, children whose mothers had lowconcentrations of salivary S. mutans rarely harboured these micro-organisms. Conversely,children whose mothers exhibited high salivary levels tended to be infected and those havingthe highest salivary levels tended to have the highest caries experience (Febres et al, 1997). Inanother study, the odds ratio for a child to develop caries was 4.3 times higher if the childwas colonised by mutans streptococci at one year of age than in the children where mutansstreptococci were not detected (Grindefjord et al, 1995). A mother’s dental attendance patternand her anxiety about dental care may also be important factors affecting a child’s dentalcare (Kinirons and McCabe, 1995).
Disability status
Individuals with disabilities comprise a heterogeneous group: their disabilities may bephysical, psychiatric, medical or developmental. Their oral health may vary according toboth the type of disability and the level of dependence on others for oral hygiene andhealthcare decisions (Persson et al, 2000). Children with special health care needs aredisproportionately poor and socially disadvantaged, and many encounter substantial barrierswhich prevent them receiving adequate dental and general health care (Newacheck et al,1998; Persson et al, 2000). A recent US study reported that significantly more individualswith disabilities (than those without) reported that oral health problems affected their generalhealth (Persson et al, 2000).
There are many ways in which children’s disability status may adversely affect their oralhealth.
(a) Alterations in oral health status can be associated with the disability itself. An exampleis the rapid progression of periodontal disease seen in individuals with Down syndrome,and which is due to defective neutrophil chemotaxis (Izumi et al, 1989). Cleft lip orpalate is invariably accompanied by dental anomalies and malocclusion (Vasan 1999).
(b) The presence of a disability can adversely affect the child’s ability to undertake oralself-care. Children with severe cerebral palsy or juvenile rheumatoid arthritis may beunable to clean their own teeth, and instead rely on carers for their daily oral hygieneprocedures. Although caregivers can be trained to remove plaque effectively, some
23 Streptococcus mutans is the main bacterial pathogen involved in dental caries.
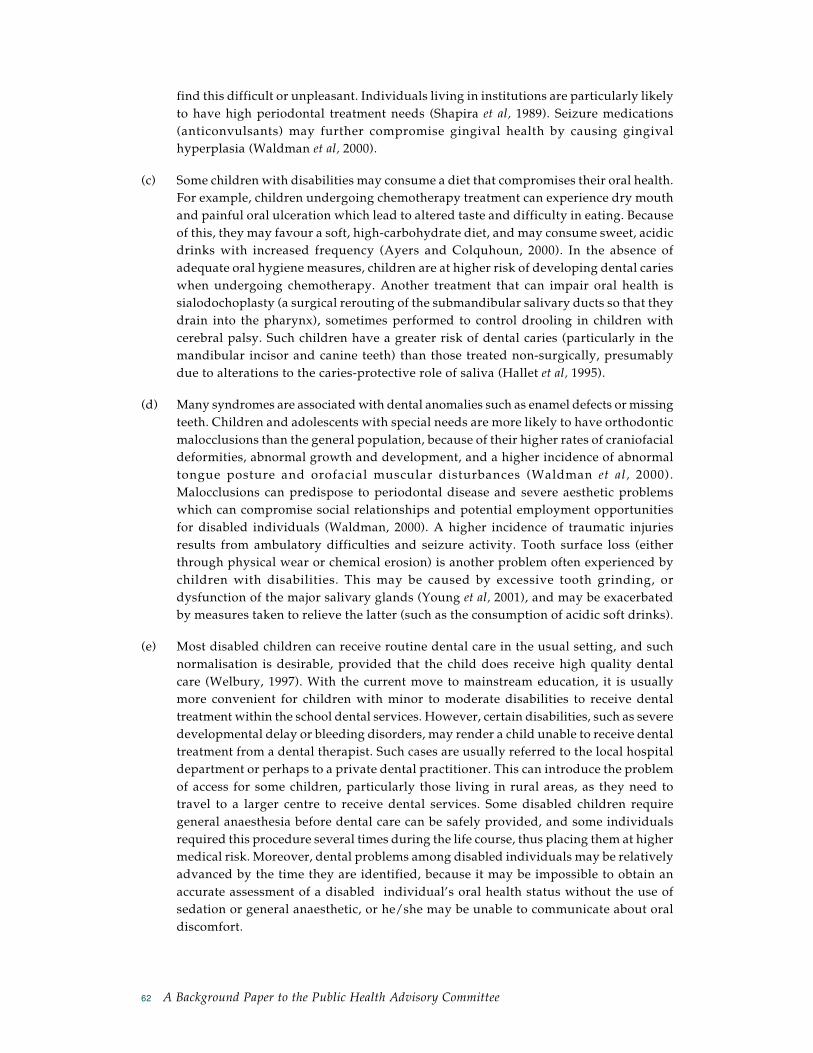
62 A Background Paper to the Public Health Advisory Committee
find this difficult or unpleasant. Individuals living in institutions are particularly likelyto have high periodontal treatment needs (Shapira et al, 1989). Seizure medications(anticonvulsants) may further compromise gingival health by causing gingivalhyperplasia (Waldman et al, 2000).
(c) Some children with disabilities may consume a diet that compromises their oral health.For example, children undergoing chemotherapy treatment can experience dry mouthand painful oral ulceration which lead to altered taste and difficulty in eating. Becauseof this, they may favour a soft, high-carbohydrate diet, and may consume sweet, acidicdrinks with increased frequency (Ayers and Colquhoun, 2000). In the absence ofadequate oral hygiene measures, children are at higher risk of developing dental carieswhen undergoing chemotherapy. Another treatment that can impair oral health issialodochoplasty (a surgical rerouting of the submandibular salivary ducts so that theydrain into the pharynx), sometimes performed to control drooling in children withcerebral palsy. Such children have a greater risk of dental caries (particularly in themandibular incisor and canine teeth) than those treated non-surgically, presumablydue to alterations to the caries-protective role of saliva (Hallet et al, 1995).
(d) Many syndromes are associated with dental anomalies such as enamel defects or missingteeth. Children and adolescents with special needs are more likely to have orthodonticmalocclusions than the general population, because of their higher rates of craniofacialdeformities, abnormal growth and development, and a higher incidence of abnormaltongue posture and orofacial muscular disturbances (Waldman et al, 2000).Malocclusions can predispose to periodontal disease and severe aesthetic problemswhich can compromise social relationships and potential employment opportunitiesfor disabled individuals (Waldman, 2000). A higher incidence of traumatic injuriesresults from ambulatory difficulties and seizure activity. Tooth surface loss (eitherthrough physical wear or chemical erosion) is another problem often experienced bychildren with disabilities. This may be caused by excessive tooth grinding, ordysfunction of the major salivary glands (Young et al, 2001), and may be exacerbatedby measures taken to relieve the latter (such as the consumption of acidic soft drinks).
(e) Most disabled children can receive routine dental care in the usual setting, and suchnormalisation is desirable, provided that the child does receive high quality dentalcare (Welbury, 1997). With the current move to mainstream education, it is usuallymore convenient for children with minor to moderate disabilities to receive dentaltreatment within the school dental services. However, certain disabilities, such as severedevelopmental delay or bleeding disorders, may render a child unable to receive dentaltreatment from a dental therapist. Such cases are usually referred to the local hospitaldepartment or perhaps to a private dental practitioner. This can introduce the problemof access for some children, particularly those living in rural areas, as they need totravel to a larger centre to receive dental services. Some disabled children requiregeneral anaesthesia before dental care can be safely provided, and some individualsrequired this procedure several times during the life course, thus placing them at highermedical risk. Moreover, dental problems among disabled individuals may be relativelyadvanced by the time they are identified, because it may be impossible to obtain anaccurate assessment of a disabled individual’s oral health status without the use ofsedation or general anaesthetic, or he/she may be unable to communicate about oraldiscomfort.

A Background Paper to the Public Health Advisory Committee 63
(f) Medical conditions can influence the type of restorative dental care able to be providedto children. For example, pulp treatment is contraindicated in children with cardiacdisease because of the risk of subsequent bacteraemia; teeth affected by deep dentalcaries would need to be extracted in children with significant heart disease (Cameronand Widmer, 1997). There are also consent issues, with some disabled children unableto take part in the consent/assent process.
(g) There is some evidence to suggest that, although the caries experience of children witha disability and their peers is similar overall, they differ in the extent and type oftreatment that they receive (Welbury, 1997). Children with disabilities are more likelyto have unmet dental need than any other medical need (Newacheck et al, 2000). Arecent US study found that, although children with a developmental disability weremore likely to have had contact with a physician within the previous six months thantheir non-disabled peers, there was no such differential with respect to contact with adentist. Proportionately fewer developmentally disabled children had received neededoral health care. The greatest disparity was seen among the poorest families, wherechildren with developmental disabilities were more than twice as likely not to havereceived needed oral health care (Schultz et al, 2001). No association was observedbetween long-term illness and dmft scores in a recent study of 788 Finnish children,192 of whom had a long-term illness (Mattila, 2000). An English study of 150 childrenwith cerebral palsy and 191 controls found that the two groups’ caries experience wassimilar, yet the former had more extracted and unrestored teeth, and fewer and poorerquality restorations. Their oral hygiene, gingival health and tooth wear were also worse(Pope and Curzon, 1991).
International evidence on child oral health inequalities
The patterns described above are not unique to New Zealand. Child oral health inequalitieshave been extensively documented in recent years in industrialised countries such as theUnited Kingdom (Pitts et al, 2002), the United States (Edelstein, 2002) and a number of others(Chen, 2002). Despite this descriptive activity, limited information is available regarding whichpolicies and interventions are most effective in reducing or eliminating disparities in generalor oral health (Ismail and Sohn, 2001).
Summary of main points – Chapter 3
Substantial ethnic inequalities in oral health are evident among New Zealand children,with Maori and Pacific children and adolescents having a higher prevalence and severityof dental caries. There is abundant evidence of poorer oral health being experienced bygroups of lower SES relative to their higher SES counterparts. Children born to younger orless educated mothers or who live in rural areas may have an increased risk of dentalcaries compared to other children. Poor maternal oral health has been linked to poor childoral health. The oral health of individuals with disabilities may be impaired. Barriers toaccessing dental care are an important factor, particularly as a higher proportion of childrenwith disabilities are poor and socially disadvantaged. Special diets and self-care difficultiesmay play a role in their greater caries experience.

64 A Background Paper to the Public Health Advisory Committee
Chapter 4 : Effects on child oral health in New Zealand ofrecent social, economic and political changes
Just as the oral health of a community cannot be satisfactorily considered without examiningthe nature and extent of any inequalities which exist, a satisfactory elucidation of those oralhealth inequalities cannot be obtained if their societal context is ignored. The social, economicand political environment is inextricably linked to health, and we are therefore concernednot only (a) with what individual socioeconomic circumstances are doing to oral health, butalso (b) with what the wider socioeconomic structure is doing to those individualcircumstances (Graham, 2001). It follows that social or economic changes which impactadversely upon the individual’s life circumstances (thus exacerbating the “chain of adversity”;Kuh et al, 1997) will consequently have a negative effect on his/her oral health, given that theoral disease burden is largely chronic in nature. To date, there have been no reports from thedental literature on the oral health effects of social or economic policy changes, althoughthere is an abundance of anecdotal evidence of the effects of those changes on the health ofpeople – particularly children – in disadvantaged households.
By virtue of its rapid changes in social and economic policy in recent years, New Zealandoffers a convenient case study for examining the effects of those changes on oral health,because a series of substantial structural “reforms” occurred between 1990 and 1992, whichresulted in a sharp increase in the prevalence of poverty. Notable among those changes werethe cutting of welfare benefits in 1990, increasing the cost of State housing from 1991, and theintroduction of the Employment Contracts Act, also in 1991. Social Welfare benefits were cutby a mean $25 per week, and these reductions had their greatest effect upon people whowere already most disadvantaged. It has been estimated that people on benefits lost, onaverage, 20 percent of their disposable income, and that those who were most affected werebenefit-dependent households with children (Stephens, 1999).
The structural changes to the State housing sector involved a move to “market rents” andincreased private-sector involvement. That policy change resulted in the median weekly rentfor State-owned housing rising from approximately half that of private-sector rental housingin 1991 to almost parity by 1996 (Walsh and Brosnan, 1999), and there were deficiencies inthe implementation of an “Accommodation Supplement” intended to assist with the shortfall.Increases in housing costs can indirectly affect health by absorbing funds, which could havebeen spent on food, oral self-care commodities (such as toothbrushes and fluoride toothpaste)and the use of health services.
The Employment Contracts Act was designed to improve “labour market flexibility”, withthe introduction of individual employment contracts seeing a substantial power shift in favourof employers, a large drop in union membership, and the creation of a vulnerable underclassof workers (Walsh and Brosnan, 1999).
The combined outcome of these policy changes was an increase in poverty and a heightenedsense of social exclusion and alienation among disadvantaged households, a sector of societywhich steadily increased in number through the 1990s (Boston, 1999). Màori and Pacific peoplehave borne a disproportionate amount of the burden because of their being over-representedamong more socioeconomically deprived households (Howden-Chapman and Tobias, 2000).

A Background Paper to the Public Health Advisory Committee 65
5
4
3
2
1
0
Rat
io o
f ge
omet
ric
mea
ns
Year
Màori (observed)
Pacific Island (observed)
European (reference group)
Màori (fitted)
Pacific Island (fitted)
1995 1996 1997 1998 1999 2000
A secondary data analysis of a routinely collected, unit-record-level time-series of schooldental service data on five-year-olds in the greater Wellington area during the latter half ofthe last decade tested the hypothesis that introduction of the social and economic policychanges in 1990–91 was associated with a subsequent increase in socioeconomic and ethnicinequalities in the dental caries experience of five-year-old children.24 Multivariate modelswere developed for deciduous caries prevalence and severity using the following asindependent variables: year, sex, fluoridation status, ethnicity, and SES (the latter using theMinistry of Education’s area-based TFEA indicator).25
The study showed that substantial ethnic and socioeconomic differences were apparent, andthey persisted during the observation period. Màori or Pacific ethnicity was associated withconsiderably greater odds of having caries (and more of it) by age five. On average, childrenin the fluoridated area had less severe caries experience. Multivariate modelling showedthat, during the five-year observation period, disease severity among Màori and Pacificchildren worsened relative to Europeans (Figure 9).
Figure 9 : Estimated ratio of geometric means for DMFT by ethnicity across the observation period(controlling for sex, dental therapist, and fluoride status)
Pacific children appeared to fare worse than Màori children during the observation period,but the differences did not reach statistical significance in the model. Similarly, the differencesbetween children from low or medium SES areas relative to those in high SES areas did notreach statistical significance.26
Although the study has a number of weaknesses, being essentially an ecological analysis andcircumstantial evidence at best, it does provide some evidence that the early 1990s structural
24 Thomson WM, Williams SM, Dennison PJ, Peacock DW. Were New Zealand’s structural changes to the WelfareState in the early 1990s associated with a measurable increase in oral health inequalities among children? Underreview.
25 Ministry of Education Data Management and Analysis Section (1997). Ministry of Education Socio-economic Indicatorfor Schools. Wellington: Ministry of Education.
26 Ethnicity and SES could not be included in the same models because of the substantial ethnic component to theSES variable (the TFEA decile rating).

66 A Background Paper to the Public Health Advisory Committee
“reforms” (reduced welfare benefits, increased rents for State housing, and the EmploymentContracts Act) were detrimental to the health of non-European New Zealand children. It isalso consistent with anecdotal evidence from a wide cross-section of health workers in NewZealand, and with the predictions that were made at the time of the changes by variousobservers.
The data are consistent with the hypothesis that the social and economic policy changes inthe early 1990s contributed to an increase in oral health inequalities between Màori and Pacificpreschool children and their counterparts in the greater Wellington population (although itis not possible to confirm the hypothesis because data collection did not include all possiblefactors which were likely to be relevant over that time). While the absence of systematicallycollected unit-record data on other, more general child health indicators from the same periodmeans that it is not possible to state whether the same phenomenon would have been observedwith general health, such an assertion would be intuitively sound, and consistent with ourknowledge of the comorbidity which occurs with the diseases of poverty. Given currentunderstanding of the accumulation of oral health disadvantage through the life course, it islikely that the effects of the changes will be felt among those children for many decades tocome.
Summary of main points – Chapter 4
The social, economic and political environment is inextricably linked to health. The‘structural reforms’ which took place between 1990 and 1992 resulted in an increase in theprevalence of poverty among New Zealanders. Evidence is presented to suggest that theywere associated with a widening of the inequalities in the oral health of Maori and Pacificfive-year-olds relative to their European counterparts. These inequalities are likely to remainwith this cohort through to adulthood.

A Background Paper to the Public Health Advisory Committee 67
Chapter 5 : Child oral health and its relation to adult oral health
It has long been suspected that children with poor oral health grow up to be adults with poororal health. Anecdotal evidence offers some support for the notion; for example, Dr TonyRuakere’s observation that oral health problems were second in number only to respiratoryproblems among adult Màori presenting at the Te Atiawa Medical Centre in New Plymouth.(Broughton, 2000) suggests that at least some of the severity of those problems could beattributed to the poor oral health of those individuals as children. However, while every oralhealth professional can point to individual patients who bear this out, other individuals canbe identified who contradict it.
Systematically conducted longitudinal observational research is the only satisfactory methodfor investigating the relationship of child oral health to adult oral health; that is, it is imperativethat the same individuals are followed from childhood to adulthood. Key requirements forsuch research include: that the sample is both representative (using a probability-basedpopulation sample) and of adequate size; the length of follow-up is such that a clear pictureof the association is able to be discerned; and that appropriate dental measures have beenused in a prospective manner and for sufficiently long for the patterns to be identified. Thereare very few studies which can meet these criteria, and the longstanding DunedinMultidisciplinary Health and Development Study (DMHDS) is the only study which is ableto provide information on the relationship of child oral health to adult oral health amongNew Zealanders.
The Dunedin study
The DMHDS is a longitudinal study of a birth cohort of children who were born at the QueenMary Hospital, Dunedin, New Zealand during 1972–73. Periodic collections of health anddevelopmental data have been undertaken since then (Silva and Stanton, 1996). Those eligiblefor the sample were all babies born at Queen Mary Hospital between 1 April 1972 and 31March 1973, whose mothers lived within the Dunedin Metropolitan Health Districtboundaries. The initial sample was 1037 children (91% of the eligible sample) who wereassessed within a month of their third birthdays.
Compared to the rest of the New Zealand population, the DMHDS sample is slightlyadvantaged socioeconomically (but has the full range of SES), and Màori and Pacific peopleare under-represented, together making up 8.5 percent. To date, dental examinations havebeen conducted at ages five, 15, 18 and 26.27
Over the course of the study, the sample has manifested a wide range of oral diseaseexperience, with clear socioeconomic differentials in dental caries experience at ages five(Evans et al, 1984) 15 (Brown, 1996), 18 (Lee, 1999) and 26 (Thomson et al, 2000). An interestingfinding has been profound socioeconomic differentials in tooth loss incidence in the cohortsince the loss of entitlement to State-funded dental care at age 18 (Thomson et al, 2000). Todate, no reports from the study have been published on poor child oral health as an antecedent
27 A description of the dental examination procedures is provided in any of the published DMHDS papers whichhave used dental data.

68 A Background Paper to the Public Health Advisory Committee
of poor adult oral health. The analyses which follow must be regarded as preliminary only,as they have not yet been subject to the scientific peer review process. The key explanatoryvariable for these analyses is the socioeconomic status of the parental breadwinner, measuredusing the Elley-Irving index (Elley and Irving, 1976), a classification which allocatesindividuals to a category from 1 (high) to 6 (low) based on their occupational status.
Dental examination data at ages five and 26 were available for 922 and 930 study membersrespectively. Of the 838 who were dentally examined at both ages, 738 (88.1%) could beassigned to an SES score at age five. The remaining 100 could not be classified because theparent was either a student, unemployed, or a home-maker. Subsequent analyses are limitedto the 738 who were dentally examined and classifiable by SES.
Residential fluoride exposure to age five was computed as the percentage of those yearsspent living in a fluoridated area: 47.8 percent of the 738 study members had never lived inone, while 48.6 percent had spent all of their lives to date in one. The remaining 3.5 percent(N = 26) were distributed as follows: six had spent one year in a fluoridated area; three hadspent two; eight had spent three; and nine had spent four years in one. For the purposes ofthe bivariate analyses which follow, residential fluoride exposure was dichotomised todistinguish those who had spent all five years in a fluoridated area from those who had not.
SES differentials in oral health in the Dunedin study at age five
Examination of the SES patterns in dental caries experience at age five (Table 2) shows thatthere were clear differentials in some important indicators. The prevalence of caries waslowest in the high SES group (in that it had the highest “caries-free” proportion). The severityof caries experience showed clear inequalities, being greatest in the low SES group anddecreasing across ascending SES categories. The average number of untreated decayedsurfaces showed a similar pattern. Residential fluoride exposure to age five was associatedwith the number of untreated decayed surfaces, but not with caries prevalence or severity.
Some insight into the structural nature of the differences at age five is offered by examiningmaternal oral health at that time: for the high, medium and low SES groups, the proportionof mothers rating their oral health as “excellent” or “fairly good” was 43.5 percent, 31.3 percentand 25.2 percent respectively, and the proportion without any teeth at all was 8.2 percent,15.2 percent and 22.7 percent respectively.
SES differentials in oral health in the Dunedin study by age 26
Examination of the SES patterns in dental caries experience by age 26 (Table 3) reveals thatthe age-5 oral health inequalities tended to persist into adulthood. There were statisticallysignificant SES gradients in age-26 DFS, the prevalence of teeth missing due to caries, and inthe mean number of those teeth missing by age 26. However, there are a number of likelyconfounders of the association, and these should be controlled before making a definitivestatement about the persistence of patterns of age-5 oral health equalities into adulthood.For example, it is possible that disease experience at age-5 could have confounded therelationship by being associated with both age-5 SES and disease experience by age 26. Anotherlikely confounder of the association is the dental visiting pattern, whereby, consistent with

A Background Paper to the Public Health Advisory Committee 69
Tab
le 2
: D
enta
l car
ies
expe
rien
ce b
y ag
e 5
in th
e D
MH
DS
by S
ES, s
ex a
nd e
xpos
ure
to c
omm
unit
y w
ater
flu
orid
atio
n
Nu
mb
erP
erce
nt
cari
es-f
reea
Mea
n d
mfs
b (
sd)
Mea
n d
sb (
sd)
Per
cen
t m
issi
ng
1or
mor
e te
eth
c
Sex Fe
mal
e36
740
.33.
5 (5
.5)
0.7
(5.5
)b5.
7M
ale
371
40.2
3.9
(6.1
)0.
9 (2
.4)
5.9
SES
grou
p a
t ag
e 5
Hig
h18
447
.82.
4 (3
.8)
0.4
(1.2
)2.
7M
ediu
m43
537
.94.
0 (6
.1)
0.9
(2.3
)6.
7L
ow11
937
.04.
9 (6
.9)
1.3
(3.1
)7.
6
Tim
e sp
ent
livi
ng
infl
uor
idat
ed a
rea
0–4
year
s37
939
.13.
8 (5
.7)
0.9
(2.5
)b5.
55
year
s35
941
.53.
7 (5
.9)
0.7
(2.0
)6.
1
All
com
bin
ed73
840
.23.
7 (5
.8)
0.8
(2.3
)5.
8
aP
= 0
.05;
�2
test
.b
P<
0.05
; K
rusk
al-W
alli
s te
st.
cP
>0.
05; �
2 te
st.

70 A Background Paper to the Public Health Advisory Committee
the inverse care law (Tudor Hart, 1971), those who use dentistry routinely have less diseaseexperience (as shown in Table 3), while those who only attend when they have a problem aremore likely to experience tooth extraction when they do attend. The time spent living influoridated areas was not statistically associated with age-5 SES, but it is prudent to controlfor fluoride exposure (albeit using an ecological measure) when examining caries-associatedoutcomes.
Accordingly, linear regression modelling (using Stata Version 7) was used; first to estimatethe effect of each of the characteristics of interest, and then to estimate adjusted means for (a)age-26 DFS and (b) the number of missing teeth by age 26, for each of the age-5 SES groups,in order to examine the persistence of the patterns of age-5 oral health equalities intoadulthood. The outcomes of those procedures are depicted in Figures 10 and 11. Whilecumulative caries experience was greater among the medium and low SES groups (Figure10), the gradient was not as strong as expected. This is largely accounted for by the morestriking SES gradient in tooth loss (Figure 11), whereby study members of lower SES had, onaverage, greater numbers of teeth missing due to dental caries by age 26. When it is consideredthat, by age 18, only two study members had lost a permanent tooth due to caries (Thomsonet al, 2001), the substantial socioeconomic differential in tooth loss appears to have developedin the eight years since age 18. Using logistic regression to model the prevalence of caries-associated tooth loss by age 26 shows that, after controlling for sex, age-5 caries and residentialfluoride history, study members in the low SES group at age five had nearly four times theodds of losing a tooth by age 26 (Odds ratio = 3.97; 95% confidence interval 1.73, 9.11)compared to those in the high SES group. This suggests that the SES differential did notmerely develop since 18, it essentially re-emerged once access to State-funded dental caredisappeared.
The adjusted SES gradients at ages five, 15, 18 and 26 are presented in Figure 12. As might beexpected, the gradient was greatest at age five, reflecting both the wide variation in uptakeof dental services by the study members as preschoolers and the greater socio-demographicvariation in disease experience which is usually observed in the deciduous dentition than inthe permanent dentition in children. At ages 15 and 18, the gradients were much lesspronounced, and even appeared to have slightly reversed by age 18. Together with thetransition from parentally imposed choices to greater “dental self-determination” in theirpattern of use of dental services, the loss of entitlement to state-funded dental care after age18 was associated with an increase in the SES gradient in caries experience by age 26.
The Low:High SES ratios for caries severity at ages five, 15, 18 and 26 were 1.98, 1.06, 0.97and 1.11 respectively. It should be noted that Figure 10 does not include the missing teethpresented in Figure 11.
SES inequalities were also apparent in periodontal disease among the study members, withonly 11.5 percent of those in the high SES group at age five having periodontal disease28 byage 26, compared with 17.9 percent of medium SES and 27.7 percent of those in the low SESgroup. When adjusted for sex, episodic use of dental services, smoking status and plaquescore at age 26, the low SES group had 2.3 times the odds (compared to those of high SES) ofhaving periodontal disease (95% CI 1.2, 4.3).
28 Defined as having one or more sites with 4 or more mm of attachment loss by age 26.

A Background Paper to the Public Health Advisory Committee 71
Summary of the observations from the Dunedin study
The Dunedin study is unique; there are no comparable longitudinal dental data from anyother study.29 So what do the Dunedin study’s data on oral health inequalities through thelife course show us? The observations of SES inequalities in oral health though the life course(to date) can be summarised as follows:
♦ the profound inequalities in caries experience which were apparent at age five haddeveloped during the preschool years
♦ their magnitude reduced during the years of universal access to State-provided or-funded dental care
♦ the late teens transition to the adult dental care system was associated with a wideningof socioeconomic differences again, particularly where tooth loss was concerned
♦ SES inequalities in periodontal disease were also apparent by age 26.
These longitudinal data support the model (illustrated in Figure 1) which contends that adultoral health inequalities have their origin in childhood, and whereby the accumulation of riskthrough a range of biological events and social experiences over time manifests itself in thedisparities observed by age 26. The next assessment in this singular study is planned for age32, and will enable examination of the nature and scale of oral health inequalities into thefourth decade of life. Adults entering their middle years have been so rarely studied usingthe prospective longitudinal approach that there is a scarcity of sound information on whichto base clinical and public health decisions or interventions which might be used to reduceoral health inequalities among adults.
Summary of main points – Chapter 5
Adequately determining the relationship of oral health to adult health requires longitudinalobservational research. Data from the Dunedin study show that clear socioeconomicdifferentials in dental caries experience existed in early childhood, but their magnitudewas reduced during the school years when there was universal access to free dental care.By age 26 (when dental treatment has been provided on an almost exclusively privatebasis for eight years), there had been a re-emergence of wide socioeconomic differences incaries occurrence, and with more teeth being extracted (due to caries) in low SES groups.These findings suggest that poor child oral health leads to poor adult oral health.
29 There are main two issues pertaining to the generalisability of the Dunedin data. First, the sample has beenshown to be largely representative of their South Island peers (Silva and Stanton, 1996); in terms of the NewZealand population, however, Màori are under-represented, with approximately 7% of Study membersidentifying as Màori at age 26. Thus, generalising from the Dunedin data to their New Zealand peers should bedone with caution; however, Poulton, Milne, Wilson and Scott (in preparation) have recently compared theDMHDS participants with similar-aged participants in the 1996–97 NZ Health Survey and the National NutritionSurvey. Dunedin study members looked remarkably similar to the nationally representative studies in terms ofmeasures of self-reported physical and mental health, weight, smoking, participation in physical activity, anduse of health services. Second, cohort studies by their very nature are very much bounded by time and place; inthe case of the Dunedin study, this means that there is a possibility that the very conditions which led to theobserved patterns no longer hold. This is unlikely, however, given that the observed patterns are both consistentwith expectations and intuitively sound.

72 A Background Paper to the Public Health Advisory Committee
Tab
le 3
: O
ral d
isea
se e
xper
ienc
e by
age
26
in th
e D
MH
DS
by S
ES, s
ex a
nd e
xpos
ure
to c
omm
unit
y w
ater
flu
orid
atio
n
Mea
n D
FS (
sd)
Net
DFS
in
crem
ent
Per
cen
t w
ith
1 o
rM
ean
nu
mb
er o
ffr
om a
ges
18–2
6 (s
d)
mor
e m
issi
ng
teet
ha
mis
sin
g te
eth
Sex Fe
mal
e11
.3 (
10.2
)4.
2 (6
.1)
9.8
0.18
(0.
63)
Mal
e11
.4 (
9.5)
4.6
(5.5
)9.
40.
15 (
0.58
)
SES
grou
p a
t ag
e 5
Hig
h10
.2 (
10.1
)b4.
0 (6
.1)
4.9c
0.07
(0.
31)b
Med
ium
11.6
(10
.0)
4.4
(5.7
)9.
40.
16 (
0.61
)L
ow12
.4 (
8.9)
5.1
(6.0
)17
.60.
33 (
0.87
)
Tim
e sp
ent
livi
ng
infl
uor
idat
ed a
rea
0–25
yea
rs11
.6
(9.7
)4.
3 (5
.9)
11.5
c0.
20 (
0.68
)b
26 y
ears
10.9
(10
.1)
4.8
(5.7
)5.
30.
08 (
0.40
)
Usu
al d
enta
lvi
siti
ng
pat
tern
Rou
tin
e10
.2 (
9.0)
b4.
1 (5
.5)
3.4c
0.06
(0.
35)b
Ep
isod
ic12
.5 (
10.5
)4.
7 (6
.0)
15.4
0.27
(0.
76)
All
com
bin
ed11
.4 (
9.9)
4.4
(5.8
)9.
60.
17 (
0.61
)
aIn
clu
des
onl
y te
eth
rem
oved
du
e to
car
ies;
exc
lud
es t
hird
mol
ars
and
tee
th r
emov
ed f
or o
rtho
don
tic
pu
rpos
es.
bP
<0.
01; K
rusk
al-W
alli
s te
st u
sed
for
SE
S gr
oup
; Man
n-W
hitn
ey t
est
use
d f
or f
luor
ide
exp
osu
re.
CP
<0.
01; �
2 te
st.

A Background Paper to the Public Health Advisory Committee 73
5 (dmfs) 15 18 26
DFS
14
12
10
8
6
4
2
0
Age
High
Medium
Low
High Medium Low
Mea
n n
o. m
issi
ng
teet
h b
y 26
0.35
0.3
0.25
0.2
0.15
0.1
0.05
0
SES at age 5
High Medium Low
Mea
n D
FS b
y 26
12
11.5
11
10.5
10
9.5
9
8.5
8
SES at age 5
Figure 10 : Average number of decayed or filled tooth surfaces at age 26 by age-5 SES.
Figure 11 : Average number of missing teeth at age 26 by age-5 SES.
Figure 12 : SES gradients in the mean number of decayed or filled tooth surfaces at ages five, 15, 18 and26, adjusted for sex and residential fluoride history (and age-5 disease status for ages 15, 18 and 26).

74 A Background Paper to the Public Health Advisory Committee
➧
Poor childoral health
Loss of oralintegrity (egtooth loss)
Adultperiodontal
disease
Predisposingcondition (eg
congenitalheart defect
Damage toheart
Stigma
Poor adulthealth➧
➧
➧
➧
➧ ➧
➧
Chapter 6 : Child oral health and adult general health
The relationship between oral and general health among adults has received increasingattention in the past decade. Almost all of this research has focused on the putative relationshipbetween periodontal disease and systemic conditions such as cardiovascular disease (CVD),stroke and premature births (American Academy of Periodontology, 1998). However, theevidence remains largely equivocal, and a recent review of the strength and quality of theevidence for the association between periodontal disease and CVD concluded that theepidemiological research to date has been less than convincing, largely because of the use ofinadequate exposure measures for periodontal disease. It has been suggested that molecularepidemiological approaches are required to fully explore the relationship (Beck andOffenbacher, 2001).30
In theory, child oral health can affect adult general health in a number of ways (Figure 13). Itshould be pointed out that adequate epidemiological evidence for most of these processes islacking, either because of ethical (and other) difficulties in conducting appropriate researchto demonstrate them, or because the research has been done but the evidence is equivocal.
Figure 13 : Hypothetical pathways by which poor child oral health might affect adult general health(solid lines indicate direct effects, dashed lines indirect effects); only the middle pathway has a soundevidence base.
What follows, then, is a consideration and discussion of possible/potential linkages that mightexist between (a) oral health during childhood and (b) physical health in adulthood.
Possible pathways to poor adult health
In the uppermost pathway, for example, a child with severe dental caries might either haveunsightly restorations, untreated lesions or lose teeth early. Speech development and theability to articulate certain speech sounds is partially dependent on the presence of themaxillary anterior teeth. It has been suggested that a degree of speech impairment, particularlyin s and z sounds, may result from loss of the maxillary primary incisors (because of trauma
30 Recent work on the association between maternal periodontal disease and low birthweight looks more promising.Such work is, of course, easier to conduct because of the considerably shorter time between exposure andoutcome.

A Background Paper to the Public Health Advisory Committee 75
or extractions due to early childhood caries) prior to three years of age (Riekman and ElBadrawy, 1985). Any of these dental conditions might be sufficient to socially stigmatise thechild, affecting his/her social functioning to the point that life choices are made which increasethe likelihood of poor health or compromised life chances as an adult.
In the middle pathway, a child with high dental caries experience and a congenital heartdefect (or one acquired through untreated rheumatic fever) suffers an oral infection whichresults in a bacteraemia and subsequent infective endocarditis; this directly affects his/hercardiac functioning and health as an adult. The higher prevalence and severity of dentalcaries among low SES and non-European groups (Crump et al, 2001) means that, other factorsbeing equal, orofacial infections will occur disproportionately among those groups. Togetherwith their higher incidence of rheumatic fever31, this means that the longer term burden ofthe cardiac sequelae will also be experienced disproportionately by those groups.
The lower pathway is, of course, dependent upon the assumption that periodontal disease isa contributing factor in the aetiology of conditions like CVD or stroke. Whether poorperiodontal health in childhood necessarily leads to poor periodontal health in adulthood iscurrently unclear, because no data have been reported on this aspect of the condition. Whilegenetic make-up is a major determinant of periodontal disease experience (Page, 1999),smoking is a recognised risk factor (Gelskey, 1999), and the habit’s disproportionate prevalenceamong low SES groups means that they may not only be at risk from the direct effects ofsmoking, but also from its indirect effects through the systemic effects of periodontal disease.That the age-26 SES inequalities in periodontitis in the Dunedin study cohort persist aftercontrolling for smoking history suggests that low SES also exerts its effects in other, lessobvious ways which nonetheless contribute to an accumulation of “periodontal disadvantage”through the life course. It is reasonable to assume that poor periodontal health in childhoodpredisposes to the same in adulthood, with the attendant risks of that condition.
Localised juvenile periodontitis (LJP) is a rapidly destructive, early form of periodontal diseasewhich can manifest in early adolescence around the time of puberty. It has a predilection forthe permanent central incisors and first molars (Jenkins and Papapanou, 2001). The prevalenceof LJP is very low; one study reported an estimate of 0.4 percent, retrospectively diagnosedfrom a clinical sample of Saudis (Nassar et al, 1994), while a more recent review presentedestimates ranging from 0.1 to 0.8 percent (Jenkins and Papapanou, 2001). None of the studiesreviewed found a sufficient number of cases to allow analysis by socio-demographiccharacteristics. The Dunedin study data suggest that there were no cases among the cohort(Thomson et al, 2000). The lack of information from long-term follow-up studies means thatthe contribution of LJP to inequalities in oral health and in adult general health remainsunknown.
Summary of main points – Chapter 6
Evidence for the relationship between child oral health and adult general health is largelyequivocal, although several hypotheses have been suggested. The lack of a sound evidencebase means that further investigation is warranted before any valid conclusions can bedrawn.
31 In 1998, the age-standardised rate for rheumatic fever hospitalisations was 7 per 100,000; for Màori, it was 13per 100,000, and for Pacific peoples it was 47 per 100,000 (Ministry of Health, Progress on Health OutcomeTargets 1999).

76 A Background Paper to the Public Health Advisory Committee
Chapter 7 : Child oral health as an indicator of healthinequalities
A recent review of health indicators outlined the characteristics of a sound indicator (Ministryof Health, 2001b). An indicator is defined as a characteristic (or variable) that can be measuredand which can be taken to represent another characteristic (or latent variable) which is theactual object of interest. Thus, if the extent and nature of inequalities in child oral healthwere to be used as indicators of the extent and nature of inequalities in children’s generalhealth, the latter would be designated the latent variable.
Child oral health has both potential and face validity as a health inequality indicator,particularly with a disease such as dental caries, where data are routinely collected at agefive and at the end of Form II, and for which inequalities are readily observed. Selectioncriteria for health inequality indicators which have been proposed include validity, reliability,responsiveness, modifiability, accountability, monitorability, predictiveness, acceptability andsustainability (Ministry of Health, 2001b). The suitability of dental caries as a health inequalityindicator can be examined in the light of these criteria.
Validity requires that the indicator represents what it purports to measure; that is, that iteither measures the inequality or an important component of it, and with high sensitivityand specificity. The latter two characteristics are crucial to the use of oral health inequality asan indicator for general health inequality: high sensitivity would be manifest if most of thechildren with severe dental caries were also those with other health problems; high specificityrequires that most of those who were caries-free, or whose caries experience was less severe,did not have other health problems.
Reliability requires that the indicator be measurable accurately and precisely. In the case ofdental caries, the reliability of the routinely collected school dental service data is unknown,as no formal examination of that aspect has been reported.
Responsiveness implies that the indicator is capable of showing measurable short- or medium-term change (over periods of 1–3 or 3–5 years respectively). In the case of dental caries, theWellington data reported below (in Chapter 10) indicate that caries data routinely collectedfrom five-year-olds are able to do that.
Modifiability requires that the occurrence of the indicator itself can be modified by (a)strategies which aim to improve it, or (b) other changes which may have detrimental changesto the indicator as an unintended side-effect.
Accountability means that a specific agency can be held accountable for implementingstrategies which aim to modify the indicator condition or its determinants. This implies thatthe inequality indicator itself would be linked to performance measures for the agencyinvolved. In the case of child dental caries, the school dental services are held accountablefor reducing its prevalence and severity.
Monitorability requires the indicator to be measured at regular intervals. Dental caries amongNew Zealand children is measured and reported annually.

A Background Paper to the Public Health Advisory Committee 77
Predictiveness means that the indicator is future-oriented; that is, it can be used to predictfuture or potential need rather than accumulated health need. Where dental caries isconcerned, the routinely collected data represent cumulative disease experience to date; theindividual’s current or future disease pattern is unknown, although past caries experienceremains a strong predictor of future disease.
Acceptability and sustainability require that the indicator be understandable to policy-makers and other key interests, is acceptable to Màori, and is unlikely to fall victim to politicalchanges. The two main dental indicators used are easily understood by lay people. The currentsystem of collecting and reporting school dental service data is relatively robust, havingwithstood two decades of the most turbulent changes in the country’s political and healthsystems.
Judged by these criteria, child dental caries appears to have potential as an indicator of healthinequalities, although further investigation of its validity (including sensitivity and specificity)for this purpose is probably warranted. The Form II data have already been included in anindicative list of health inequality indicators (Ministry of Health, 2001b). However, it isapparent from the data presented in this report that, because their time in the publicly fundeddental care system does reduce child oral health inequalities, a more valid and responsiveindicator of child health inequalities would be dental caries at age five. Inequalities are likelyto be greater at age five than at any time in the following two decades, for a number ofreasons:
♦ ethnic and socioeconomic differences in the uptake of preschool dental services meanthat caries differentials are likely to be maximised
♦ oral health status at age five largely reflects household conditions and nutritional andself-care practices, and there is less confounding by actual dental treatment
♦ other factors being equal, the development and progression of dental caries in thedeciduous dentition is more rapid, meaning that (in theory, at least) there is less lagtime between changes in determinants and the subsequent appearance of the disease.
The data are currently collected by school dental services, and are part of a wider nationalminimum dental data-set.32 However, a challenge for those seeking to monitor healthinequalities over time is that, while the caries and ethnicity data are collected for eachindividual, the only SES data collected in this way use an area-based measure. Thus, ethnicinequalities will be able to be monitored in rather more detail than SES inequalities, for whommonitoring will be limited to descriptive analyses only, because of the ecological measureused. Collection of parental SES data would be a useful development. Most importantly, theuse of SDS data on dental caries as an indicator of child health inequalities requires that thedata be collected, collated and analysed at unit-record level. As mentioned in Chapter 2,current moves in that direction are a positive development.
Summary of main points – Chapter 7
Child dental caries is a potentially useful indicator of more general health disparities. Cariesdata for five-year-olds should be used in preference to Year 8 data, as inequalities aremore pronounced during the preschool period.
32 See http://www.newhealth.govt.nz/toolkits/oralhealth.htm

78 A Background Paper to the Public Health Advisory Committee
Chapter 8 : Promoting good oral health outcomes: options foreffective action
Rationale and principles
Should we be concerned about child oral health inequalities in New Zealand? Does it matterthat particular groups and individuals have more disease and discomfort, and that thosepeople are disproportionately found among Màori, Pacific people and groups of low SES?
A number of arguments have been offered in support of action to reduce health inequalities(National Advisory Committee on Health and Disability, 1998), and these are no less applicableto the oral health of children.
1. Inequalities in child oral health are reducible.
2. Reducing inequalities in oral health is fair, because children have only limited controlover the (structural and other) factors which determine their oral ill-health.
3. Reducing child oral health inequalities benefits wider society by both freeing up scarcehealth system resources (an example would be enabling the hospital resources whichare currently struggling to cope with child caries to be used for the treatment of otherdisorders and groups) and reducing the time spent by attending parents/whanau awayfrom more productive activity.
However, while the moral imperative to eliminate oral health inequalities is clear, the abilityof any society to do so completely is a matter for debate: whether it is achievable is unclear,and it may be that the best that can be hoped for is a reduction in inequalities, recognisingthat certain characteristics, practices and societal structures are less amenable to change. SouthAuckland represents a prime example of the scale of the problems which face us, containing“the largest concentration of urban poor, the largest Màori catchment in New Zealand, thelargest Polynesian city in the world and it is characterised by a health status that isunacceptable in modern times. Diseases such as...rheumatic fever....should not occur at therate that they do in South Auckland”.33 If oral health inequalities in South Auckland can bereduced, then, by implication, the rest of New Zealand is likely to be less of a problem. In thefinal analysis, however, the reduction of oral health inequalities is an inexact science at best,and any reductions will be both hard-won and incremental; a longer-term focus is essential.The Hon. Annette King, Minister of Health, commented in 2000: “I believe the problems canbe solved, but you won’t solve them overnight. But if you want to have a better society 30years hence, we need to do something now”.34 New Zealand society would be the poorerwere we not to invest considerable energy and resources in an effort to reduce inequalities inoral health.
33 Excerpt from the South Auckland Health Annual Report, 1999, by Chief Executive Officer, David Clarke.34 Quoted in Johns G. Suffer the little children. Metro, April 2000, pp70–78.
A Background Paper to the Public Health Advisory Committee 79
Intervention points
The 1998 National Advisory Committee on Health and Disability report listed a number ofpossible points for intervention to reduce health inequalities, and these are used as theframework for this chapter.35 Implicit within such a framework is recognition that the healthneeds of Màori are paramount under the Treaty of Waitangi, and that particular effort toreduce child oral health inequalities should be directed at improving Màori oral health. Themagnitude of the differences in oral health between Màori and non-Màori means that such astrategy is also likely to achieve the greatest gains in the reduction of child oral healthinequalities.
The three intervention points for reducing inequalities in oral health are:
1. Basic socioeconomic determinants, such as reducing the prevalence of poverty andimproving employment opportunities.
2. Intermediary factors between oral health and its socioeconomic determinants, such asincreasing the availability of topical fluoride.
3. Developing oral health services which are more suitable, both by developing newservices where appropriate, and by making appropriate changes to existing services.
Each of these is discussed in turn, and each can be related to the mechanisms depicted inFigure 1 (page 12): tackling the basic socioeconomic determinants directly addresses the poorchildhood and adulthood environments; the second strategy affects both environmental (suchas diet and topical fluoride availability) and self-care factors; and the third strategy enablesmore favourable use of services.
An important set of underlying principles is embodied in the Ottawa Charter for healthpromotion (WHO, 1986), which recognises the need to take a broad, policy-based, community-focused approach to improving health. Watt and Sheiham (1999) pointed out that oral healthinequalities will only be reduced through the implementation of effective and appropriateoral health promotion policies, as treatment services alone will not address the underlyingcauses of oral disease. Accordingly, a strategic oral health promotion approach is required.Interventions based upon dental health education have been shown to be ineffective atproducing long-term sustainable changes in oral health behaviours, and have failed to addressinequalities. Aiming to tackle the underlying social, political and environmental determinantsof oral health is appropriate, and requires a multi-sectoral approach (Watt and Sheiham,1999).
1. Basic socioeconomic determinants
The data presented in Chapter 6 suggest that social and economic policies which forcesubstantial sections of New Zealand society into poverty can indeed have a detrimental (andmeasurable) impact upon oral health. Thus, close intersectoral scrutiny is required for anyproposed policy changes which are likely to have health consequences, whether negative or
35 We have, however, omitted the third of the areas suggested in that report, as it was felt that reverse causalitydid not apply to the situation of child oral health.

80 A Background Paper to the Public Health Advisory Committee
positive. A logical inference from that observation is that policies which are based on theprinciples of social justice and aim to reduce the proportion of New Zealanders who areliving in poverty will also have positive oral health benefits, in that they are likely to beassociated with improvements in oral health (and bring other benefits) in vulnerable groups.Education levels and the distribution of income are fundamental targets for such interventions(National Health Committee, 1998), in that currently disadvantaged whanau, householdsand individuals will be more likely to have the wherewithal to participate more fully insociety. In this way, reductions in child oral health inequalities are likely to be observed.
However, a social justice approach alone is not sufficient; as outlined above, advancing Màorioral health in a Treaty of Waitangi framework is likely to have far-reaching effects in oralhealth inequalities in New Zealand. At the basic level of the socioeconomic determinants ofhealth, upholding the principles of the Treaty of Waitangi (partnership, participation andprotection) helps to address all four dimensions of Te Whare Tapa Wha.
While intervening at the socioeconomic determinants level is likely to have the greatest impacton oral health inequalities, it is politically the most difficult; moreover, the measurementand evaluation of such interventions is not easy.
2. Intermediary factors
Intervening at this level to reduce inequalities in oral health means using strategies whichare aimed at the more proximate causes of oral disease. Where dental caries is concerned,only a small number of simple preventive strategies are needed:
(1) increase the availability of topical fluoride;
(2) ensure the regular removal of plaque; and
(3) reduce the frequency and amount of fermentable sugars consumed.
Both the first and second can be achieved by promoting the availability and use of fluoridetoothpastes, while community water fluoridation is also a key strategy.
Two main approaches have been described in relation to preventive dental strategies forpopulations (Burt, 1998). The high-risk approach involves identifying those who have thegreatest risk36 of developing disease and then targetting them for intensive preventiveintervention. By contrast, the population approach means allocating preventive resourcesand activities at everyone in the population, regardless of risk status.
The approaches can be further distinguished by thinking about them as part of a “preventionpyramid” (Figure 14), in which individual care and targetted programmes are built upon abase of population-level interventions.
At the base of the pyramid are strategies such as community water fluoridation, the use offluoride toothpastes (which dominate the New Zealand market to such an extent that theyare virtually universally used), and mass-media dental health education campaigns. The Stateis usually the agency responsible for this level.
36 Assuming that both the targetting process and the preventive intervention being targetted are effective (that is,they work) and efficient (that is, they are worth doing).

A Background Paper to the Public Health Advisory Committee 81
Figure 14 : The “prevention pyramid”.
The next level is that of group-based targetting, which is usually done on the basis of eithergeography, ethnicity or some other characteristic by which disease experience is seen to differat the group level. As with the lower level, the State is usually the agency responsible for thislevel (most notably through school dental services), although this may be shared withcommunity or other groups.
At the top of the pyramid is individual-based prevention, usually the responsibility ofindividual oral health practitioners (whether State-funded or not). From an economicperspective, the efficiency of the interventions reduces the further up the pyramid they aresituated (Burt, 1998).
Population-based interventions hold the most potential for reducing inequalities in NewZealand. While community water fluoridation per se has not been the primary focus of thepreceding chapters, a finding common to much of Chapters 2, 3 and 4 has been itsdemonstrated effectiveness at reducing both ethnic and socioeconomic inequalities in theoccurrence of dental caries. Currently, 53 percent of the New Zealand population (who areon reticulated water supplies) drink water which has had it fluoride concentration adjustedupwards from approximately 0.3 parts per million (ppm) to between 0.7 and 1.0 ppm. Thereis clearly scope for that to be extended, given the recent demonstration of the cost-effectivenessof water fluoridation for communities as small as 1000 people (Wright et al, 2000).
Other strategies are appropriate at this “intermediary factors” level. For example, the situationwhere highly sugared, carbonated soft drinks are both (a) heavily promoted (through bothadvertising and ready availability), and (b) considerably cheaper than milk, is not one whichis conducive to good oral health. A healthy public policy approach would be to rectify thatsituation by not only curbing the advertising of such beverages, but also changing their relativecosts to the consumer, such as by either taxing sugar or subsidising milk (or a combination ofboth strategies).
3. Oral health services
One strategy that has been applied in several countries, including New Zealand, is to improveaccess to dental services. Improving access to dental care (by reducing or eliminating thecost factor) is seen as a way to improve oral health. The underlying assumption is that aninability to pay for dental treatment is a principal reason for the observed social inequalitiesin oral health. The National Health Service (NHS) was established in the United Kingdom
Care forindividual
patients
Group-based targetting
Population strategies

82 A Background Paper to the Public Health Advisory Committee
more than 50 years ago, and aimed to reduce the social gradient in oral health by enablingaccess to dental treatment independent of the ability to pay (Gelbier, 1998). However, childoral health data suggest that this scheme has not succeeded in eliminating the influence ofSES on the caries experience of children, as profound SES gradients persist (O’Brien, 1993;Watt and Sheiham, 1999). Although there have been overall improvements in child oral healthstatus, a substantial social class gradient in dental caries experience remains. This can bepartially explained by the residual social gradient in service usage, suggesting that there areadditional barriers to accessing care (Gelbier, 1998).
Recent US initiatives have focused on improving access to dental and other health care bylow income children. Again, these initiatives are based on the assumption that if access todental care for low income children improves, oral health inequalities will be reduced (Ismailand Sohn, 2001). This hypothesis is supported by the successful Rand Health InsuranceExperiment, in which preschool children enrolled in a ‘free’ dental insurance programmehad a significantly lower mean number of decayed teeth and were more likely to be caries-free than those enrolled in co-payment plans. Children from low income families benefitedthe most from having free access to dental care (Bailit et al, 1986). However, much experimentaland routinely collected data does not support the assumption that improving access to dentalcare can reduce socioeconomic inequalities in oral health. Even when children have free accessto diagnostic, preventive and basic restorative services, most dental caries experience remainsclustered in children from poor or ethnic minority backgrounds (Ismail and Sohn, 2001;Moynihan and Holt, 1996; Evans et al, 1996).
Another recent report has suggested that the type of dental care system can significantlyinfluence the oral health of a population. Standards of living are comparable in Denmarkand Sweden, but the dental care systems are quite different. Adult oral health (measured bymissing teeth and lack of prostheses) was found to be poorer in Denmark (where citizens arerequired to pay for their dental treatment personally) than in Sweden, where treatment isheavily subsidised by the State (Palmqvist et al, 2000).
School-based prevention programmes have been tried in a number of countries, includingNew Zealand. Children in deprived or rural areas constitute an important target group forthe implementation of school-based dental prevention programmes. Questions remain aboutthe efficacy of those programmes, however, as there is a shortage of adequate, systematicevaluation. A publicly funded dental prevention programme for adolescents from two non-fluoridated towns in Victoria (Australia) involved the provision of fissure sealants and fluoridemouth-rinsing. It proved to be efficacious and cost-effective over the three-year trial period.The authors of the study pointed out that such a programme is likely to have longer-termbenefits as the interventions are likely to reduce future caries experience (Crowley et al, 2000).However, Hausen et al (2000) recently evaluated the high-risk preventive strategy with apopulation of 1465 12-year-olds. Children considered to be at high risk of dental caries wererandomised into intervention and control groups. The intervention was an intensivepreventive programme including counselling, fluoride varnish applications, fluoride lozenges,fissure sealants and chlorhexidine. The control group received the normal preventive careincluding counselling and fluoride varnish. After three years, there was no significantdifference between the two groups in the DMFS increment, indicating that the intensiveintervention was no more beneficial than the routinely offered preventive care. The outcomeof this important study suggests that the cost-benefit ratio of intensive preventive programmesrequires further investigation, particularly in populations with low overall caries experience.Until this is clarified, the place of the high-risk preventive strategy in reducing oral healthinequalities remains unclear at best.

A Background Paper to the Public Health Advisory Committee 83
Reducing inequities in access to dental care is an important goal, but this will not necessarilyreduce inequalities in oral health. Successful provision of professional dental care alone isunlikely to eliminate disparities in dental caries severity because treatment does not addressthe underlying causes of diseases (Watt and Sheiham, 1999).
While Màori oral health is the primary focus of the discussion which follows, it is recognisedthat improving oral health among Pacific children will require a number of similar strategies.
Much of the impact of poor oral health upon Màori children comes from existing diseasegoing untreated, and more so in rural areas. Tamariki are disproportionately representedamong those children who must be subjected to a general anaesthetic in hospital dental unitsin order to have their grossly decayed teeth treated to restore their smiles and enable them toeat properly. In the past, some aspects of the school dental services have been viewed asbeing alienating. A reasonable strategy is to develop oral health services which meet theneeds of those children, both by developing new services (where feasible) and by makingappropriate changes to existing services. Recent developments in school dental servicedelivery (such as involving extended whanau presence at clinical appointments) have beenviewed positively. The principle of kaupapa Màori services (Broughton, 2000) is one whichshould be embodied in child oral health services wherever possible.
There is scant evidence in the literature for the effectiveness of preventive strategies whichrely solely upon clinical interventions (as discussed above), but having appropriate oral (andother) health services is likely to bring health and community development benefits for Màori.Such an approach is consistent with three of the five tenets of the Ottawa Charter for healthpromotion.37
Improving child oral health among Màori requires attention at three levels:
(1) Government
(2) the health sector (including the dental profession)
(3) Màori.
(1) Government
The Government response has already commenced on a number of fronts. In October 1998,the Board of the Health Funding Authority (HFA) identified oral health as one of eight Màorihealth gain priority areas. The New Zealand Health Strategy indicated the intention to reducehealth inequalities, and identified 13 population health objectives for immediate action, oneof which was to improve oral health. Moreover, in He Korowai Oranga: Màori Health Strategy(April 2001), oranga niho was identified as a heath priority for Màori.38 The overall aim ofKorowai Oranga is whanau ora; that is, healthy Maori families being supported to achievetheir maximum health and well-being. Oranga niho (oral health) is an important part ofKorowai Oranga, and this dimension is reflected in the overall aim, directions, endorsementsand pathways of Korowai Oranga.
37 Create supportive environments; strengthen community action; reorient health services.38 He Korowai Oranga. Maori Health Strategy Discussion Document. Hon Annette King, Minister of Health, April
2001.

84 A Background Paper to the Public Health Advisory Committee
Where Government action at the oral health provision level is concerned, the 1999 Budgetsignalled a pilot project for integrated dental care for children and emergency care for lowincome adults. The contract for this pilot was awarded to Te Taiwhenua o Heretaunga inHastings, and the service opened in 2001.
(2) The health sector (including the dental profession)
The health sector/dental profession response includes a number of strategies. The NewZealand Dental Association report Oral Health Goals for the New Millennium (Edward et al,1999) identified Màori oral health as a key issue, and set out goals and targets (for the year2010) for the profession to work towards in partnership with Màori. Specific targets fortamariki included: ensuring that all Màori preschool tamariki enrol with and access treatmentthrough the School Dental Service; reducing dental caries experience in the deciduousdentitions of Màori five-year olds to a level which is equal to that of non-Màori; and increasingthe proportion of Màori five-year-olds with caries-free deciduous dentitions to be equal tothat of non-Màori. At the service provision level, dental providers who are contractors withthe DHB must ensure that the delivery of their service is appropriate for Màori. At theeducation/training level, Màori culture and health has been an important aspect ofundergraduate education for dentistry for the last two decades, and is now also part of theprogramme in dental therapy.
(3) Màori initiatives
The Màori community response has proceeded in a number of ways.
(a) Te Ao Marama (the New Zealand Màori Dental Association) was formed in 1996, andhas a wide membership which comprises not only dentists and dental therapists, butany other oral health workers with an interest in oranga niho. It has acted as an effectivelobby group, being essentially responsible for the HFA Board’s identification of oralhealth as a priority area for Màori health gain, and provides a voice for Màori oralhealth at various national dental health sector forums. Te Ao Marama also publishes ajournal and holds an annual national hui.
(b) Through a recent deprivation-based funding initiative,39 the Màori dental healtheducator has evolved as a new Màori community health worker, and provides animportant community-based link between whanau and dental services (essentially theschool dental services): “The role of the community health worker is probably the mostimportant person in dental health education of our people. Only through educationand motivation can a behaviour change take place, and only then will we see ourtamariki improve their oral health.” (Betty, 1998). Most are employed either by a Màoriprovider or by the School Dental Service. A number of Màori health promotion resourcesand approaches have been successfully developed and used over the last three or fouryears by Màori providers. Examples include: “He Kete Oranga Niho” (Te Waka Hauora,HealthCare Otago; “He Kete Oranga Niho, Oranga Tinana, Oranga Whanau; PacificHealth, Bay of Plenty); and a resource developed by Te Whare Kaitiaki (School ofDentistry, Dunedin), which features Taine Randell as a positive oral health role modelfor tamariki.
39 $3 million was made available over three years to improve access to oral health services for children from lowincome, Màori and Pacific groups, and from rurally isolated areas. The money was allocated to regions accordingto their proportion of Decile 1 (“most deprived”) schools.

A Background Paper to the Public Health Advisory Committee 85
(c) Màori dental provider services, operating under kaupapa Màori, have made substantialcontributions to improving the health of Màori, and some currently have the capabilityand capacity to provide oranga niho services. Examples of such services are: Tipu Ora,Tunohopu Health Centre, Ohinemutu, Rotorua; Te Whare Kaitiaki, School of Dentistry,The University of Otago (now in its 12th year); Te Atiawa Dental Service, New Plymouth;Te Taiwhenua O Heretaunga, Hastings; Te Whanau O Waipareira Trust, West Auckland;Ngati-Hine Health Trust, Kawakawa; and Ngati Porou Hauora, Ruatoria.
Màori are participating at all levels of the oral health workforce (including those ofmanagement, statutory governance,40 policy advice41 and teaching42), and the currentpresident43 of the New Zealand Dental Therapists’ Association is Màori. However, greaternumbers are required in order for kaupapa Màori services to be adequately resourced andsupported. A key issue is therefore the continued development of the Màori oral healthworkforce, which currently comprises community oral health workers, allied oral healthprofessionals (dental hygienists, dental therapists, clinical dental technicians), dentists anddental specialists. Màori oral health provider issues are currently being investigated in aresearch project44 which is funded by the Health Research Council of New Zealand. Essentialto the process of developing the Màori dental workforce is the collection of appropriateworkforce monitoring data. Such information is directly available for dentists, dentalspecialists and dental technicians as a result of their annual registration procedures, butreliable data are not currently available for dental therapists, dental hygienists or communityoral health workers. Over the last few years, Te Ao Marama has had over 50 members whoare dental therapists, but retirements have meant that it is not possible to say for sure howmany Màori dental therapists there are in the workforce. Currently, only 2 percent of dentaltechnicians identify as Màori, and attracting more Màori into the profession has been identifiedas a priority.45 In 1994, there were four Màori dentists registered with the Dental Council ofNew Zealand; by 2001, there were 28, indicating that there has been considerable success inattracting Màori into the profession. The number of Màori dental students at the School ofDentistry is increasing, and bodes well for the future. Issues such as further increasing theproportion of Màori dentists, dental therapists, hygienists and dental students, and attractingdentists to rural areas are currently being examined by both the Health Workforce AdvisoryCommittee and the dental profession.
Pacific health services are currently being developed, and it is anticipated that theirdevelopment will be similar in scope and focus to those which have been developed by andfor Màori.
40 Including two Màori members (Mrs C Rimene and Mr WR Sparks) on the New Zealand Dental Council, andMrs Inez Kingi on the New Zealand Dental Technicians’ Board.
41 Including Mrs Vicki Kershaw, Dr Pauline Koopu and Associate Professor John Broughton on the Oral HealthAdvisory Group, and Associate Professor John Broughton on the New Zealand Health Strategy Sector ReferenceGroup.
42 Mrs Helen Tane is Dental Therapy Course Co-ordinator at the School of Dentistry.43 Mrs Vicki Kershaw of Taranaki.44 Associate Professor John Broughton, Ngai Tahu Màori Health Research Unit, Dunedin School of Medicine,
University of Otago. Oranga niho: A kaupapa Màori review of Màori dental health service provision.45 Dental Technicians Board, personal communication.

86 A Background Paper to the Public Health Advisory Committee
Summary of main points – Chapter 8
Inequalities in oral health are reducible; whether they can be eliminated is another matter,but it is society’s moral duty to work towards that goal. Three intervention points areidentified, and ideas are given for action at each of the points of (i) socioeconomicdeterminants, (ii) intermediary factors, and (iii) oral health services. First, the basicsocioeconomic determinants of oral health inequalities must be tackled through incomedistribution and support policies (including improving Maori socioeconomic circumstancesthrough addressing Treaty claims). Second, population preventive strategies must bedirected at the more proximate causes of dental disease; a prime example of this is increasingthe availability of topical fluoride through both extending community water fluoridationand increasing the availability of fluoride toothpastes for disadvantaged groups. Otherstrategies are required to complement these, such as moves to reduce the consumption ofhighly sugared soft drinks and increase the availability of healthier alternatives. Third, atthe oral health services level, much of the impact of poor oral health upon Maori andPacific children comes from existing disease going untreated, and more so in rural areas.A key strategy is to develop oral health services which are more suitable for those children,both by developing new services (where feasible) and by making appropriate changes toexisting services. Improving child oral health among Maori requires attention at the threelevels of (1) Government, (2) the health sector (including the dental profession), and (3)Maori.

A Background Paper to the Public Health Advisory Committee 87
Chapter 9 : Gaps in child oral health inequalities information
In the course of this review, several areas have been identified where information in theliterature is lacking. Some of these deficiencies in knowledge are relevant to all industrialcountries, while others are specific to New Zealand. There is an urgent need for health servicesresearch with regard to inequalities in the oral health of New Zealand children.
First, as mentioned in Chapter 1, there is no universally accepted definition of oral health.Although instruments are available (and now being used in health services research) tomeasure oral health-related quality of life, these have been designed primarily for use witholder adults. Measures for use in the child population are lacking. This is particularly true inthe New Zealand context, where more holistic models must be considered in order toencompass Màori and Pacific concepts. The development of composite deprivation measuresfor use in the child population would be useful.
A major deficiency in our knowledge relates to a lack of data about oral disease in the NewZealand population. We cannot assess the effectiveness of our current public healthprogrammes, or know how they should be modified, if we lack appropriate information aboutthe epidemiology of dental disease in the population. The school dental service routinelycollects data on dental caries prevalence and severity in children at five years of age and inYear 8 (Form II). These data provide almost the only systematically collected information wehave of the oral health of children, and have been discussed in detail in this review. However,there is a paucity of data on the dental caries experience of children at other ages (such aspreschoolers), as well as information about other oral problems such as dental trauma,periodontal disease and enamel defects.
Dental trauma data are routinely collected in New Zealand by ACC, but this material is under-utilised, and no reports have been published on inequalities in the occurrence of dental trauma.
Periodontal disease is known to be less common in children than dental caries, and dataconcerning the periodontal status of children are not routinely collected. Periodontal diseasehas a high prevalence in the adult population, particularly for Màori and Pacific people, butit is unclear when this disease develops, and hence when preventive intervention would bemost timely.
Enamel defects have not been discussed in this review, as no work on this problem has beenconducted since a group of studies in the 1980s, and those did not report on inequalities inthe occurrence of enamel defects. A research project on this topic is currently being conductedin Southland. Some enamel defects can be related to a high exposure to fluoride and theprevalence of these defects should be monitored, along with ongoing work on the effectivenessof water fluoridation.
There are particular groups of New Zealand children who need to be considered in terms ofinequalities in dental care. Groups of children who have been identified in this paper includethose living in rural areas, children from deprived or single-parent families, and childrenwith disabilities. A particular area that was not able to be addressed in this paper is the effectof mental disabilities on oral health. Do children with conditions such as attention deficit-

88 A Background Paper to the Public Health Advisory Committee
hyperactivity disorder or autism have higher treatment needs; are they accessing adequatecare; what are the long-term consequences of poor oral health in childhood and adolescencefor these children; or is their treatment simply more difficult?
There is a need for up-to-date information on socioeconomic and ethnic inequalities in oralhealth among New Zealand children. Although the school dental service does now collectdata on ethnicity, there are still some issues to be addressed. It has not been possible tomonitor ethnic differences over time in the distribution of dental caries, as it is only in recentyears that the data have been collected in that way. Current moves to standardise the collectionof SDS data at unit-record level should enable better monitoring of trends in ethnic inequalitiesin the distribution of dental caries among New Zealand children. Ethnicity information onPacific children should be collected in such a way that the data can be disaggregated andanalysed according to individual Pacific ethnic group. We also lack data on oral disease ratesin other ethnic groups such as Asian and new immigrant children. There is a need for theaccuracy and quality of ethnicity data to be assessed, as well as the impact of recent moves toimprove SDS data collection. Needs analysis is required to enable effective planning anddecision-making with respect to child oral health in all ethnic groups. There is also the needto continue to monitor the effectiveness of community water fluoridation and its role inreducing oral health inequalities, particularly at the health services research level inquantifying the fluoridation-association reduction in demand for child dental care undergeneral anaesthesia.
There have been some major changes in the provision of dental care for New Zealand childrenand adolescents in the last decade. In 2000, the general dental benefit (GDB) contracts thatprivate dentists hold with the DHBs changed from a fee-for-service arrangement to a capitationcontract for the provision of routine care. It is not known whether this has resulted in anincrease in the number of dentists holding contracts to provide care for adolescents. Inaddition, the upper limit for eligibility for care under this scheme has been raised from 16 to18. Previously, 16- or 17-year-olds were only eligible if they were in full-time education or ona training scheme. There is currently no information regarding how the new GDB contractsare affecting the care received by adolescents, and on whether the changes have beenadvantageous for Màori and Pacific adolescents.
Another transition that has taken place over the past decade is the increasing flexibility ofthe school dental service. Therapists are no longer based only in schools, but have extendedinto the wider community, often working alongside other health professionals such as Màorihealth providers. Some therapists work in mobile vans, taking the service to smallercommunities, improving the accessibility to dental care, particularly for rural and Màoripreschool children. Evaluation of the success of these newer initiatives is required. Another(less well accepted) change, which has been taking place over several years, is a decrease inthe number of dental therapists, meaning that many are now required to service severalschools in a year. Anecdotal evidence suggests that this has adversely affected the accessibilityof the service for some primary school-aged children, and it is of particular concern when achild has an acute problem and the therapist is difficult to locate.
Finally, further longitudinal research is required on the impact of poor oral health in childhoodin relation to adult oral health, in order to (a) elucidate the mechanisms by which inequalitiesdevelop and persist, and (b) assist in identifying potential intervention points.

A Background Paper to the Public Health Advisory Committee 89
Summary of main points – Chapter 9
Broader oral health measures for use in the child population are lacking, and there is aneed to develop measures which encompass Maori and Pacific concepts of health. Otherthan for five-year-olds and Form II children, there is a paucity of data on the dental cariesexperience of children at other ages (such as preschoolers and nine-year-olds), and thecurrent data need to be collected at unit-record level throughout the country. There is alsoa need for studies of other child oral problems, such as dental trauma, periodontal diseaseand enamel defects. Work on documenting the effectiveness of water fluoridation shouldcontinue, particularly at the health services research level. Research is required on theimpact of the new General Dental Benefit contracts on adolescent dental care, and onwhether the changes have been advantageous for Maori and Pacific adolescents. Systematicevaluation is required of the impact of ongoing changes in the way in which the SDS deliverscare to children. Finally, further longitudinal research is required on the impact of poororal health in childhood on oral health in adulthood.

90 A Background Paper to the Public Health Advisory Committee
References
American Academy of Periodontology. Periodontal disease as a potential risk factor for systemic disease.Journal of Periodontology 1998; 69: 841-850.
Ayers KMS, Colquhoun AN. Leukaemia in children. Part 1: Orofacial complications and side-effects oftreatment. New Zealand Dental Journal 2000; 96: 60-65.
Bailit HL, Newhouse J, Brook R, Duan N, Collins C, Hanley J, Chisick M, Goldberg G. Dental insuranceand the oral health of preschool children. Journal of the American Dental Association 1986; 113: 773-6.
Bates MN. Fluoridation of water supplies – an evaluation of the recent epidemiological evidence.Wellington: Ministry of Health, 2000.
Beck JD, Offenbacher S. The association between periodontal diseases and cardiovascular diseases: astate-of-the-science review. Annals of Periodontology 2001; 6: 9-15.
Betty, B. General anaesthesia for our tamariki: the ambulance at the bottom of the cliff. Journal of Te AoMarama, New Zealand Màori Dental Association 1998; 3: 9-11.
Bolin A-K, Bolin A, Jansson L, Calltorp J. Children’s dental health in Europe. Swedish Dental Journal1997; 21: 25-40.
Boston J. New Zealand’s welfare state in transition. In: Boston J, Dalziel P, St John S. Redesigning theWelfare State in New Zealand: problems, policies, prospects. Auckland: Oxford University Press, 1999.
Broughton JR. The development of Oranga niho services. Pacific Health Dialog 2000; 7: 70-73.
Broughton, J. Te mahi niho hauora ki Ratana Pa: the dental health project at Ratana Pa. New ZealandDental Journal 1995; 91: 55-57.
Broughton, J. Te Niho Waiora Me Te Iwi Màori: dental health and Màori people. New Zealand DentalJournal 1993; 88: 15-18.
Brown RH. Dental health. In: Silva PA, Stanton W. From Child to Adult: the Dunedin MultidisciplinaryChild Development Study. Auckland: Oxford University Press, 1996.
Burt BA. Prevention policies in the light of the changed distribution of dental caries. Acta OdontologicaScandinavica 1998; 56: 179-186.
Cameron A, Widmer R. Handbook of Pediatric Dentistry. London, Mosby-Wolfe, 1997.
Chen MS. Oral health status and its inequality among education groups: comparing seven internationalstudy sites. International Journal of Health Services 2002; 32:139-61, 2002.
Corrigan M, Newton JT, Gibbons DE, Locker D. The mouth-body split: conceptual models of oral healthand their relationship to general health among ethnic minorities in South Thames Health Region.Community Dental Health 2001; 18: 42-46.
Crampton P, Salmond C, Blakely T, Howden-Chapman P. Socioeconomic inequalities in health: howbig is the problem and what can be done? Pacific Health Dialog 2000; 7: 94-98.
Crowley SJ, Campain AC, Morgan MV. An economic evaluation of a publicly funded dental preventionprogramme in regional and rural Victoria: an extrapolated analysis. Community Dental Health 2000; 17:145-151.
Crowley SJ, Campain AC, Morgan MV. An economic evaluation of a publicly funded dental preventionprogramme in regional and rural Victoria: an extrapolated analysis. Community Dental Health 2000; 17:145-151.
Crump JA, Murdoch DR, Baker MG. Emerging infectious diseases in an island ecosystem: the NewZealand perspective. Emerging infectious diseases 2001; 7: 767-772.
Cutress TW, Hunter PBV, Davis PB, Beck DJ, Croxson LJ. Adult Oral Health and Attitudes to Dentistry inNew Zealand 1976. Wellington: Medical Research Council of New Zealand, 1979.
de Soet JJ, Bokhout B, Buijs JF, Loveren CV, de Graaff J, Prahl-Andersen B. Transmission of MutansStreptococci between mothers and children with cleft lip and/or palate. Cleft Palate-Craniofacial Journal1998; 35: 460-464.
Demos LL, Kazda H, Cicuttini FM, Sinclair MI, Fairley CK. Water fluoridation, osteoporosis, fractures– recent developments. Australian Dental Journal 2001; 46: 80-87.
A Background Paper to the Public Health Advisory Committee 91
Edelstein BL. Disparities in oral health and access to care: findings of national surveys. AmbulatoryPediatrics 2002; 2(2 Suppl):141-7.
Edward SJ, Bain M, Bell JW, Hunter PBV, Nepia R, Pringle C, Ross CB, Thomson WM, Whyman RA.New Zealand oral health goals for the new millennium. Auckland: New Zealand Dental Association, 1999.
Elley KM, Langford JW. The use of a classification of residential neighbourhoods (ACORN) todemonstrate differences in dental health of children resident within the South Birmingham healthdistrict and of different socioeconomic backgrounds. Community Dental Health 1993; 10: 131-138.
Elley WB, Irving JC. Revised socioeconomic index for New Zealand. New Zealand Journal of EducationalStudies 1976; 11: 25-36.
Ellwood R, O’Mullane D. The association between area deprivation and dental caries in groups withand without fluoride in their drinking water. Community Dental Health 1995; 12: 18-22.
Evans DJ, Rugg-Gunn AJ, Tabari ED, Butler T. The effect of fluoridation and social class on class oncaries experience in 5-year-old Newcastle children in 1994 compared with results over the previous 18years. Community Dental Health 1996; 13: 5-10.
Evans RW, Beck DJ, Brown RH, Silva PA. Relationship between fluoridation and socioeconomic statuson dental caries experience in 5-year-old New Zealand children. Community Dentistry and OralEpidemiology 1984; 12; 5-9.
Febres C, Echeverri EA, Keene HJ. Parental awareness, habits, and social factors and their relationshipto baby bottle tooth decay. Pediatric Dentistry 1997; 19: 22-27.
Fergusson DM, Horwood LJ. Relationships between exposure to additional fluoride, social backgroundand dental health in 7-year-old children. Community Dentistry and Oral Epidemiology 1986; 14: 48-52.
Gelbier S. The National Health Service and social inequalities in dental health. British Dental Journal1998; 185: 28-29.
Gelskey SC. Cigarette smoking and periodontitis: methodology to assess the strength of evidence insupport of a causal association. Community Dentistry and Oral Epidemiology 1999; 27: 16-24.
Graham H. From science to policy: options for reducing health inequalities. In: Leon D, Watt G (eds).Poverty, health and inequality. Oxford: Oxford University Press, 2001.
Gratrix D, Holloway PJ. Factors of deprivation associated with dental caries in young children.Community Dental Health 1994; 11: 66-70.
Grindefjord M, Dahllof G, Nilsson B, Modeer T. Prediction of dental caries development in 1-year-oldchildren. Caries Research 1995; 29:343-348.
Hallett KB, Lucas JO, Johnston T, Reddihough DS, Hall R. Dental health of children with cerebralpalsy following sialodochoplasty. Special care in Dentistry 1995; 15: 234-238.
Hashim R, Thomson WM, Pack ARC. Smoking in adolescence as a predictor of early loss of periodontalattachment. Community Dentistry and Oral Epidemiology 2001; 29: 130-135.
Hjern A, Grindefjord M, Sunddberg H, Roaen M. Social inequality in oral health and use of dental carein Sweden. Community Dentistry and Oral Epidemiology 2001; 29: 167-74.
Howden-Chapman P, Isaacs N, Crane J, Chapman R. Housing and health: the relationship betweenhealth and policy. International Journal of Environmental and Health Research 1996; 6: 173-185.
Howden-Chapman P, Pene G, Crane J, Green R. Open Houses and closed rooms: Tokelau housing inNew Zealand. Heath Education and Behaviour 2000; 27: 351-362.
Howden-Chapman P, Tobias M (eds). Social inequalities in health: New Zealand 1999. Wellington: Ministryof Health and the University of Otago.
Hunter PBV, Davis PB. International Collaborative Study of Dental Manpower Systems. The CanterburyStudy. Wellington: Department of Health, 1982.
Hunter PBV, Kirk R, de Liefde B. The Study of Oral Health Outcomes. The New Zealand Section of the WHOSecond International Collaborative Study. Wellington: Department of Health, 1992.
Isaacs N, Donn M. Health and Housing – seasonality in New Zealand mortality. Australian Journal ofPublic Health 1993; 17: 68-70.
Ismail A, Sohn W. The impact of universal access to dental care on disparities in caries experience inchildren. Journal of the American Dental Association 2001; 132: 295-303.
Izumi Y, Sugiyama S, Yamazaki T, Ohyama T, Ishikawa I. Defective neutrophil chemotaxis in Down’ssyndrome patients and its relationship to periodontal destruction. Journal of Periodontology 1989; 60:238-42.

92 A Background Paper to the Public Health Advisory Committee
Jenkins WMM, Papapanou PN. Epidemiology of periodontal disease in children and adolescents.Periodontology 2000 2001; 26: 16-32.
Jones C, Taylor G, Whittle J, Evans D, Trotter D. Water fluoridation, tooth decay in 5-year-olds andsocial deprivation measured by the Jarman score: analysis of data from British dental surveys. BritishMedical Journal 1997; 315: 514-517.
Klein H, Palmer CE, Knutson JW. Studies on dental caries. 1. Dental status and dental needs ofelementary schoolchildren. Public Health Reports 1938; 53: 751-765.
Klein JO. Infectious diseases and day care. Reviews of Infectious Diseases 1986; 8: 521-216.
Kohler B, Andreen I, Jonsson B. The earlier the colonisation by mutans streptococci, the higher thecaries prevalence at 4 years of age. Oral Microbiology and Immunology 1988; 3: 14-17.
Kuh D, Ben Shlomo Y. A life course approach to chronic disease epidemiology. Oxford: Oxford UniversityPress, 1997.
Lalloo R, Myburgh NG, Hobdell MH. Dental caries, socio-econimic development and national oralhealth policies. International Dental Journal 1999; 49: 196-202.
Lee JM. Psychological characteristics and disorders as risk factors for oral ill-health in adolescents. MComDentthesis, The University of Otago, 1999.
Locker D. Concepts of oral health, disease and the quality of life. In: Slade GD, ed. Measuring OralHealth and Quality of Life. Chapel Hill: University of North Carolina, Dental Ecology, 1997.
Locker D. Deprivation and oral health: a review. Community Dentistry and Oral Epidemiology 2000; 28:161-9.
Locker D. Measuring oral health: a conceptual framework. Community Dental Health 1988; 5: 3-18.
Locker D. Measuring social inequality in dental health services research: individual, household andarea-based measures. Community Dental Health 1993; 10: 139-150.
Marcenes W, Murray S. Social deprivation and traumatic dental injuries among 14-year-old schoolchildren in Newham, London. Dental Traumatology 2000; 17: 17-21.
Mattila M-L, Rautava P, Sillanpaa M, Paunio P. Caries in five-year-old children and associations withfamily-related factors. Journal of Dental Research 2000; 79: 875-881.
Ministry of Education Data Management and Analysis Section. Ministry of Education Socio-economicIndicator for Schools. Wellington: Ministry of Education, 1997.
Ministry of Health. Action for Health and Independence Conference. Wellington, August 1998.
Ministry of Health. Indicators of inequality. Classification and selection of ethnic health disparity indicators.Public Health Intelligence Occasional Bulletin No 5. Wellington: Ministry of Health, 2001b.
Ministry of Health. Monitoring ethnic inequalities in health. Public Health Intelligence Occasional BulletinNo 4. Wellington: Ministry of Health, 2001a.
Ministry of Health. The Proceedings of the National Forum on Water Fluoridation 13 June 2001. Wellington:Ministry of Health, 2001c.
Ministry of Health. Whaia Te Whanaungatanga: Oranga Whanau. The Wellbeing of Whanau. Ministry ofHealth: Wellington, 1998.
Morgan MZ, Treasure ET. Comparison of four composite deprivation indices and two consensusvariables in predicting dental caries in 12-year-old children in Wales. Community Dental Health 2001;18: 87-93.
Moynihan PJ, Holt RD. The national diet and nutrition survey of 1.5- to 4.5-year-old children: summaryof the findings of the dental survey. British Dental Journal 1996; 181: 328-32.
Nassar MM, Afifi O, Deprez RD. The prevalence of localized juvenile periodontitis in Saudi subjects.Journal of Periodontology 1994; 65: 698-701.
National Advisory Committee on Health and Disability. The social, cultural and economic determinants ofhealth in New Zealand: action to improve health. Wellington: National Advisory Committee on Healthand Disability, 1998.
Newacheck PW, McManus M, Foz HB, Hung YY, Hlafon N. Access to health care for children withspecial health care needs. Pediatrics 2000; 105: 760-766.
Newacheck PW. Strickland B, Shonkoff JP, Perrin JM, McPherson M, McManus M, Lauver C, Fox H,Arango P. An epidemiologic profile of children with special health care needs. Pediatrics 1998; 102:117-121.

A Background Paper to the Public Health Advisory Committee 93
O’Brien M. Children’s dental health in the United Kingdom 1993. London: HMSO, 1993.
Page RC. Milestones in periodontal research and the remaining critical issues. Journal of PeriodontalResearch 1999; 34: 331-339.
Palmqvist S, Soderfeldt B, Vigild M. Influence of dental care systems on dental status. A comparisonbetween two countries with different systems but similar living standards. Community Dental Health2000; 18: 16-19.
Paunio P, Rautava P, Helenius H, Alanen P, Sillanpaa M. The Finnish Family Competence Study: therelationship between caries, dental health habits and general health in 3-year-old Finnish children.Caries Research 1993a; 27: 154-160.
Paunio P, Rautava P, Sillanpaa M, Kaleva O. Dental health habits of 3-year-old Finnish children.Community Dentistry and Oral Epidemiology 1993b; 21: 4-7.
Persson RE, Stiefel DJ, Griffith MV, Truelove EL, Martin MD. Characteristics of dental emergencyclinic patients with and without disabilities. Special Care in Dentistry 2000; 20: 114-120.
Pitts NB, Evans DJ, Nugent ZJ, Pine CM. The dental caries experience of 12-year-old children in Englandand Wales. Surveys coordinated by the British Association for the Study of Community Dentistry in2000/2001. Community Dental Health 2002; 19:46-53.
Pope JEC, Curzon MEJ. The dental status of cerebral palsied children. Pediatric Dentistry 1991; 11: 156-162.
Primosch RE. Effect of family structure on the dental caries experience of children. Journal of PublicHealth Dentistry 1982; 42: 155-168.
Provart SJ, Carmichael CL. The relationship between caries, fluoridation and material deprivation infive-year-old children in County Durham. Community Dental Health 1995; 12: 200-203.
Provart SJ, Carmichael CL. The use of an index of material deprivation to identify groups of childrenat risk to dental caries in County Durham. Community Dental Health 1995; 12: 138-142.
Provart, S.J. and Carmichael, C.L. (1995). The relationship between caries, fluoridation and materialdeprivation in five-year-old children in County Durham. Community Dental Health 12: 200-203.
Reading R. Equity and community child health. Archives of Disease in Childhood 1993; 68: 686-690.
Reisine ST. Dental health and public policy: the social impact of dental disease. American Journal ofPublic Health 1985; 75: 27-30.
Riekman GA, El Badrawy HE. Effect of premature loss of primary maxillary incisors on speech. PediatricDentistry 1985; 7: 119-122.
Riley JC, Lennon MA, Ellwood RP. The effect of water fluoridation on social inequalities on dentalcaries in 5-year-old children. International Journal of Epidemiology 1999; 28: 300-305.
Roeters J, Burgersdijk R, Truin G-J, van’t Hof M. Dental caries and its determinants in 2-to5-year-oldchildren. Journal of Dentistry for Children. 1995; 62: 401-8.
Rozier RG. Dental Public Health. In: Wallace RB (ed). Public Health and Preventive Medicine 14th ed.Norwalk, Connecticut: Appleton and Lange. 1998; p1091-1112.
Schou L, Uittenbroek D. Social and behavioural indicators of caries experience in 5-year-old children.Community Dentistry and Oral Epidemiology 1995; 23: 276-281.
Schultz ST, Shenkin JD, Horowitz AM. Parental perceptions of unmet need and cost barriers to care fordevelopmentally disabled children. Pediatric Dentistry 2001; 23: 321-325.
Shapira J, Maan J, Tamari I, Mester R, Knobler H, Yoeli Y, Newbrun E. Oral health status and dentalneeds of an autistic population of children and young adults. Special Care in Dentistry 1989; 9: 38-41.
Stephens R. Poverty, family finances and social security. In: Boston, J., Dalziel, P., and St John, S.Redesigning the Welfare State in New Zealand: problems, policies, prospects. Auckland: Oxford UniversityPress, 1999.
Te Puni Kokiri. Progress Towards Closing Social and Economic Gaps Between Màori and Non-Màori. A Reportto the Minister of Màori Affairs. Wellington: Te Puni Kokiri, Ministry of Màori Development, 1998.
Te Puni Kokiri. Progress Towards Closing Social and Economic Gaps Between Màori and Non-Màori. A Reportto the Minister of Màori Affairs. May 2000. Wellington: Te Puni Kokiri, Ministry of Màori Development,2000.
Tennant N, Nammjoshi D, Silva D, Codde J. Oral health and hospitalisation in Western Australianchildren. Australian Dental Journal 2000; 45: 204-207.

Thomas JFG, Startup R. Social influences on the dental health behaviour of 5 year-olds. Health EducationJournal 1991; 50: 111-114.
Thomson WM, Edwards SJ, Dobson-Le DP, Tompkins GR, Knight D, Poulton R, Braithwaite AW. IL-1genotype and adult periodontitis among young New Zealanders. Journal of Dental Research 2001; 80:1700-1703.
Thomson WM, Hashim R, Pack ARC. The prevalence and intra-oral distribution of periodontal loss ofattachment in a birth cohort of 26-year-olds. Journal of Periodontology 2000; 71: 1840-1845.
Thomson WM, Poulton R, Kruger E, Boyd DM. Socio-economic and behavioural risk factors for toothloss from age 18 to 26 among participants in the Dunedin Multidisciplinary Health and DevelopmentStudy. Caries Research 2000; 34: 361-366.
Thomson WM, Williams SM, Dennison PJ, Peacock DW. Were New Zealand’s structural changes tothe Welfare State in the early 1990s associated with a measurable increase in oral health inequalitiesamong children? Australian and New Zealand Journal of Public Health 2002; 26: 525-30.
Thomson WM. Day-stay treatment for dental caries at a New Zealand hospital dental unit: a 5-yearretrospective audit. New Zealand Dental Journal 1994; 90: 139-142.
Thomson WM. Ethnicity and child dental health status in the Manawatu-Wanganui Area Health Board.New Zealand Dental Journal 1993; 89: 12-14.
Thomson WM. The ups and downs of dental caries. NZDA News 1997; 85: 10.
Thomson WM. Use of dental services by 26-year-old New Zealanders. New Zealand Dental Journal 2001;97: 44-48.
Tinanoff N. Dental caries risk assessment and prevention. Dental Clinics of North America 1995; 39: 709-719.
Treasure ET, Dever JG. Relationship of caries with socioeconomic status in 14-year-old children fromcommunities with different fluoride histories. Community Dentistry and Oral Epidemiology 1994; 22: 226-230.
Treasure ET, Dever JG. The prevalence of caries in 5-year-old children living in fluoridated and non-fluoridated communities in New Zealand. New Zealand Dental Journal 1991; 88: 9-13.
Vasan N. Management of children with clefts of the lip or palate: an overview. New Zealand DentalJournal 1999; 95: 14-20.
Verrips GH, Kalsbeek H, Eijkman MAJ. Ethnicity and maternal education as risk indicators for dentalcaries, and the role of dental behaviour. Community Dentistry and Oral Epidemiology 1993; 21: 209-14.
Waldman HB, Perlman SP, Swerdloff M. Orthodontics and the population with special needs. AmericanJournal of Orthodontics and Dentofacial Orthopaedics 2000; 118: 14-7.
Walsh P, Brosnan P. Redesigning industrial relations: the Employment Contracts Act and itsconsequences. In: Boston J, Dalziel P, St John S. Redesigning the Welfare State in New Zealand: problems,policies, prospects. Auckland: Oxford University Press, 1999.
Watt R, Sheiham A. Inequalities in oral health: a review of the evidence and recommendations foraction. British Dental Journal 1999; 187: 6-12.
Welbury RR. Paediatric Dentistry. Oxford: Oxford University Press, 1997
Wendt L-K, Svedin C-G, Hallonsten A-L, Larsson I-B. Infants and toddlers with caries. Mental health,family interaction, and life events in infants and toddlers with caries. Swedish Dental Journal 1995; 19:17-27.
Whyman RA. Proposal 1: Do we have the right work force and delivery system? New Zealand DentalJournal 2000; 96: 94-96.
World Health Organization. Ottawa Charter for Health Promotion. World Health Organization, Ottawa,1986.
Wright JC, Bates MN, Cutress TW, Lee JM. The cost-effectiveness of fluoridating water supplies inNew Zealand. Australia and New Zealand Journal of Public Health 2001; 25: 170-8.
Young W, Khan F, Brandt R, Savage N, Razek AA, Huang Q. Syndromes with salivary dysfunctionpredispose to tooth wear: Case reports of congenital dysfunction of major salivary glands, Prader-Willi, congenital rubella, and Sjogren’s syndromes. Oral Surgery, Oral Medicine, Oral Pathology, OralRadiology, and Endodontics 2001; 92: 38-48.
94 A Background Paper to the Public Health Advisory Committee