maternal and child health agency … maternal and child health agency ... performance measures.1 in...
TRANSCRIPT

Task Order #HHSH250201100026C, Year 1 – Task 3.3 Vanessa Lee, COTR
Victoria A. Freeman, RN, DrPH Page 0 of 33 December 29, 2011
STATE MATERNAL AND CHILD HEALTH AGENCY PRIORITY NEEDS AND PERFORMANCE MEASURES FOR 2000, 2005, AND 2010 Report of Findings
Victoria A. Freeman, RN, DrPH Child Health Services Program Cecil G. Sheps Center for Health Services Research University of North Carolina at Chapel Hill April 28, 2013 Prepared for the Maternal and Child Health Bureau, Health Resources and Services Administration, US Department of Health and Human Services under contract #HHSH250201100026C.

1
PAGE
INTRODUCTION AND PURPOSE ……………………….…………………………………… 2 REVIEW PROCESS FOR THIS REPORT…..…………..…..……………………….………. 3 OVERVIEW OF STATE TITLE V GRANTEE REPORTING REQUIREMENTS….. 6 PART I – STATE MCH TODAY – PRIORITY NEEDS IN 2010 …………….……. 7 PART II – CHANGES IN PRIORITIES ‐ ISSUES NOT INCLUDED.……….………. 13 PART III – PRIORITY NEEDS AND MEASURES OF PERFORMANCE………..… 16 PART IV – TRENDS IN PRIORITY NEEDS – 2000, 2005, AND 2010…………… 21
TABLE OF CONTENTS

2
The Federal Maternal and Child Health Bureau (MCHB) and State Maternal and Child Health (MCH) programs work in concert to meet the needs of women and children in all 59 States and jurisdictions. As a condition for Federal MCH Title V block grant funding, States identify the needs of the populations they serve, develop strategies to meet those needs, and document progress each year. A comprehensive needs assessment is conducted every five years and guides program development and measurement of performance. In addition, grantees complete an annual document that is both an application for further Title V funding and a report on activities and performance.
State Needs Assessments and Application/Annual Reports contain rich information used in planning and evaluation of MCH programs. In addition to face‐to‐face review of each grantee’s Needs Assessment document and Application/Annual Report, the Bureau uses these documents to understand MCH needs and resources in individual States as well as in the country.
In the past, the Bureau has contracted with the Cecil G. Sheps Center for Health Services Research at the University of North Carolina at Chapel Hill to examine various issues regarding State MCH programs including exploration of promising practices and a review of trends in State priority needs and performance measures.1 In addition, specific areas of MCH practice such as oral health, women’s health, and appropriate perinatal care for very low birth weight infants have been explored. The Bureau again contracted with the Sheps Center to examine the current focus of State MCH activity as expressed in their Needs Assessment statements of priority needs, how States selected their 2010 priority needs and how they reported that their priorities compared to 2005, how States will measure success in meeting their goals, and how State priority needs have changed over three time periods. This report has four parts:
PART I: STATE MCH TODAY ‐ PRIORITY NEEDS FOR 2010 Part I enumerates and describes the major categories of priority needs for MCH grantees and the most prevalent subcategories within each group. Details regarding each priority category, e.g., healthy lifestyle priorities or obesity reduction as part of healthy lifestyle priorities, are included.
PART II: CHANGES IN PRIORITY NEEDS ‐ ISSUES NOT INCLUDED In this section, the changes in priority needs from 2005 to 2010 are considered for each State. How States report that priority needs changed, which remained, which were dropped and why, and which were added and why are explored. Also described are priorities considered by States that were not included in their final priority needs.
PART III: PRIORITY NEEDS AND MEASURES OF PERFORMANCE Part III examines State Performance Measures (SPMs) developed to gauge success in meeting those priority needs that individual States have identified as most important for their unique populations. Additional measures of performance such as National Performance Measures (NPMs), National Outcome Measures (NOMs), Health System Capacity Indicators (HSCIs) and Health Status Indicators (HSIs) are also explored.
PART IV: TRENDS IN PRIORITY NEEDS – 2000, 2005, AND 2010 One advantage of this serial review of priority needs and performance is that it provides an opportunity to look at how State MCH priorities and focus are changing. In Part IV, trends in priority needs for three time periods are explored comparing 2010 priorities with those identified by grantees in 2000 and in 2005.
1Freeman VA, Guild PA. Meeting State MCH Needs: A Summary of State Priorities and Performance Measures. A report for the Maternal and Child Health Bureau, Health Resources and Services Administration, January 31, 2008.
INTRODUCTION AND PURPOSE

3
This review has at its center each State’s Needs Assessment document and the priority needs that States declare on Form 14 of the Title V MCH Block Grant Application. The Needs Assessment document should discuss priority need setting, the resultant list of priority needs, and performance measures to gauge success in addressing priorities. If information in the Needs Assessment document is incomplete or unclear, State Application/Annual Reports are available and can provide additional information. Each aspect of this review and report required a different process to obtain the State information needed.
For simplicity, in all parts of this report, references to States or grantees include all 59 State and jurisdictional MCH grantees.
Priority Need Review
Information in Part I, which discusses MCH priority needs today, i.e., those from their 2010 Needs Assessment document, and information in Part IV, comparison of previous categories of priority needs with current ones is informed by a systematic review of the wording for each priority need statement for each State. This review is based on a classification system developed in previous work by the Sheps Center to examine trends in priority needs from 2000 to 2005. Each priority need for each grantee was broken down into two components with subcomponents, as necessary:
1. Topic
a. What is the health issue or program activity identified in the priority need? A priority need may cover more than one issue.
Examples: Injury Access to care Pregnancy rate
b. Is the issue or activity further described or limited in scope? Examples: Injury – motor vehicle crash injuries Access to care – access to mental health services Pregnancy rate – unintended pregnancy
2. Population
a. What is the target population? Examples: Children Pregnant women Children with Special Health Care Needs (CSHCN)
b. Is the target population further described or limited in scope? Examples: Children – school‐aged children Pregnant women – African‐American pregnant women CSHCN– youth with special health care needs
Basic classification rules developed during the previous review of priority need statements guided this review. Two decision rules are particularly important:
• Priority needs statements can specify outcomes (improve oral health) or process (improve access to oral health care). Occasionally, a statement is broadly specified to include both, e.g., “Improve access to oral health care to improve oral health.” In the case of a needs statement that includes both broad outcomes and process, the process was considered the focus. It is
REVIEW PROCESS FOR THIS REPORT

4
assumed that the goal of all MCH programs is to improve health. If the priority need is more specific, e.g., “reduce LBW by improving access to prenatal care”, the priority need is considered to address both outcome and process.
• The target population of the priority need is determined from the wording of the priority. In some cases, priorities are stated simply, e.g., “improve access to health care” or “reduce injuries”. In the case of priorities without a specified population, the target group is considered to be all MCH populations.
Topic and population codes for all priority needs were entered in an Excel spreadsheet to facilitate counts of the number of States with a particular priority need. States with multiple priority need statements addressing one issue are counted only once.
Priority needs are fluid and less easily classified than numerical outcomes. It is unlikely that all reviewers would interpret the intent of priority needs in the same way. This review made every attempt to be consistent over time. Priority needs for each state for 2010 were compared to the 2000 and 2005 priorities to ensure that like statements were coded in the same manner. Small adjustments were made when a new statement clarified an older statement.
Changes in Priority Needs – Issues Not Included
Guidance for the Needs Assessment document included instructions for the States to not only describe the process they used to determine priority needs but also to compare their 2010 priority needs to their 2005 priorities and discuss health or health care issues identified in the needs assessment process that they did not include in their priority needs.
Each State’s Needs Assessment document was reviewed, focusing on the section entitled “Selection of Priority Needs” which was included by most grantees. The following information was abstracted:
• How did a State’s 2010 priority needs compare to those developed in 2005? Were they identical or were they changed in some way, e.g., refocused, or dropped? If they were dropped, why were they dropped?
• Which issues, among the many identified by stakeholders and other participants, were not included in the State’s priority needs? Why were they not included?
As with other parts of this overall review of priority needs and performance measures, specific guidelines were established to compare the 2005 and 2010 priority needs, relying in part on each State’s description of change. A State might indicate that one priority need was dropped and replaced with another, which would be true from the State’s perspective. For the purposes of this review, however, the 2010 priority need might be similar to the 2005 need, only refocused. For example, a 2005 priority might target a specific unintentional injury among adolescents such as motor vehicle injuries but the 2010 priority is stated more broadly and addresses reduction of all injuries for all MCH populations. Because this report focuses on the health or health care issues encompassed in each priority need, this priority need would be considered to have been revised. The State, however, might regard it as new.
A second guideline addressed determination of issues considered and not included. Because the guidance asked for this specificity, only States that listed and/or discussed issues not included and the State’s reasons for not including them are included in this review.
Performance Measure Review
Each State’s Needs Assessment document was the primary source for review of performance measures linked to priority needs. In addition, 2012 Application/2010 Annual Reports provided additional or explanatory information on how States linked performance measures and indicators to their priority
5
needs. Detailed descriptions for each State Performance Measure (SPM) are available in the State Application (Form 16) and these descriptions were consulted when there was a question about the data source being used for an SPM. Every attempt was made to use the most accurate, comprehensive, and up‐to‐date information regarding SPMs and to consider the most current iteration of each measure since measures sometimes change during the interim years of the five‐year needs assessment cycle.
In this review, the questions asked about SPMs and other measures included:
• Did each State link their priority needs to measures of performance in their Needs Assessment document or in subsequent documents?
• Do they specify an SPM for each priority need? Are multiple SPMs developed for any priorities? • For each category of priority needs, what specific SPMs have States developed? What data do
they use? • Do States link other measures such as NPMs to their priority needs? • What other measures are being used to monitor progress for specific categories of priority
needs?
Trends in Priority Needs
Trends in priority needs over the three time periods were compared across the broad and detailed specific categories described in Part I.

6
The Federal government’s commitment to the health of mothers and children goes back a century with the creation of the Children’s Bureau. The current MCH Title V Program, established in 1935 under the Social Security Act, provides Federal financial support to States to support MCH programs. Title V has evolved in the ensuing years. Three specific changes in the administration of the Title V program are particularly relevant to this review. The first occurred in 1981 when the program was changed from a categorical program that provided funds for specific programs to a block grant program that allows States more latitude in how they use Title V dollars. Other changes of note include establishment in 1990 of the Maternal and Child Health Bureau to administer the Title V program, following on the heels of more stringent application and reporting requirements for States receiving these dollars.
Today State MCH agencies that receive and administer Title V funds are required to plan for the use of these funds and report how they have done so and the health improvements that result. States complete and submit a statewide Needs Assessment document every five years. Annually, each State prepares a document that both outlines progress to date and plans for the next year of funding. Guidance for the preparation of both Needs Assessment and Application/Annual Report documents has evolved and both documents are now submitted electronically through the Title V Information System (TVIS) established in 1998. Overall, the grantee Application/Annual Report document provides a snapshot of how each State is progressing in meeting the goals laid out by their five‐year needs assessment process.
The long history and evolution of the Title V program has resulted in a comprehensive Federal program with reporting requirements that are recognized as innovative. State documents are prepared in accordance with guidelines that ensure consistency in reporting and that allow comparison across grantees and over time.
The relevant reporting requirement for this analysis is the Needs Assessment report each grantee prepares every five years as a product of their comprehensive needs assessment process. This detailed review of the needs of all MCH populations served by the State, resources available to address needs, and progress in meeting both Federal and State goals, provides a blueprint for the State’s plan over the next five years. It is important to note that needs assessment processes can vary widely from State to State and from year to year for any given State and review of this process over the years illustrates the change that can occur. For example, the direction a State takes in meeting the needs of the MCH population may be influenced by the overall philosophy and goals of the State health department. A State MCH agency may be reorganized or otherwise change how it approaches its mission perhaps focusing on broad issues in one year and more specific ones in another. In the most recent needs assessment period (2010) it is noted that Life Course theory proved to be an important construct on which many States based their review and selection of priorities (see p 15 of this report for an example from Wyoming.) The needs assessment process is fluid and is as varied as the States themselves and the priorities identified in Needs Assessment documents can change due to a change in mission as well as due to change in needs of the populations served.
Grantees are required to list at least seven but no more than ten priority needs, reported on Form 14 of the application and written in statement format, e.g., to reduce the rate of obesity among children. States may specify a longer list to use at their own discretion if this format suits their needs. There is no prescribed format for priority needs statements in terms of topic or specificity of the priority.
Priority needs statements are only one process for State planning and do not stand alone. Grantees link their priority needs to specific measures of performance. Various national measures (NPMs, NOMs, HSCIs and HSIs) and State Performance Measures, previously developed or newly developed, are linked to each priority need.
OVERVIEW OF STATE TITLE V GRANTEE REPORTING REQUIREMENTS

7
AN OVERVIEW OF 2010 PRIORITY NEEDS
MCH grantees acknowledge and address the complexities of promoting positive health outcomes by specifying priority needs that may be multi‐faceted and emphasize the interrelatedness of lifestyle, health care, and health outcomes. As such, many of the 2010 priority needs fall into multiple categories (discussed below) and clearly demonstrate this interrelatedness. For example, priority needs to ensure healthy pregnancies may focus on reducing risk behaviors among pregnant women, as seen in West Virginia’s 2010 priority need to “decrease smoking among pregnant women.” Other priority needs to ensure healthy pregnancies may promote healthy behaviors such as diet and exercise as stated by Alabama in its 2010 priority need to “reduce the prevalence of obesity among children, youth, and women of childbearing age.” Similarly, access to prenatal care to ensure healthy pregnancies may be part of overall efforts to ensure effective and comprehensive health care for all MCH populations. In examples for other MCH populations, priority needs for children or adolescents may include access to comprehensive care that includes promoting positive health behaviors. All States have identified priority needs to improve health or health care among the MCH populations. When examined in detail, more than 90% of priority needs developed by MCH Title V grantees for 2010 fall into four broad categories of focus (see box on page 8):
Access to Care and Health Status – This category includes not only primary care but also other health care areas such as oral health and mental/behavioral health, areas where access for MCH populations may be limited. Other care in this category includes specialized services identified by States as a possible challenge for their populations.
All but one grantee2 include a priority need to improve health or access to health care. While many States have identified priorities for primary care, just as many have identified access to dental care and mental health care as a need for their populations. Even more States have identified other specific health care priorities, particularly transition care for CSHCN and others and developmental screening/early intervention services. Other specialized care prioritized less frequently includes specialist care, cancer screening for women, immunizations, newborn genetic, hearing and vision screening, and lead monitoring.
Healthy Living – This category includes health promotion, e.g., programs for healthy weight, among all
MCH populations or specific populations, as well as reducing risk behaviors including those that lead to injury.
The Healthy Living category includes the single most common priority need theme, i.e., healthy lifestyles in general, and healthy weight, exercise and nutrition, in particular. There is almost universal agreement on the need for programs to promote healthy weight. For the 56 States with Healthy Living priority needs, these priorities make up, on average, three of their stated priorities, and the majority of grantees have priority needs in more than one of the subcategories listed. Injury prevention and risk behavior reduction are mentioned less frequently but are still important for more than one‐half of MCH grantees.
Healthy Pregnancies – These priority needs address the wellbeing of the traditional population served
by MCH agencies since the inception of Federal support for mothers and children. Depending on the
2The single State not included in this category does have a priority need to improve prenatal or pre‐ or interconceptional health care which could be included in this broad category of access to care but is discussed separately below.
PART I STATE MCH TODAY – PRIORITY NEEDS IN 2010

8
philosophy and practice of the Title V agency, priorities can be stated as process priorities (health care) or outcome (healthy births).
Healthy Pregnancy priority needs are specified by 50 of 59 grantees. There is not a predominant focus for healthy pregnancy priorities. Focus on poor birth outcomes, typically low birth weight and infant mortality, is only slightly more common than focus on preventive measures to reduce poor outcomes. Of the nine grantees without a specifically stated need for healthy pregnancies, many crafted broadly stated priority needs and likely included healthy pregnancies in these priorities without stating such.
Building MCH Capacity – Some priority needs are not client‐focused but instead identify issues to
improve functioning of the Title V agency or specific actions for improvement that must be taken at the agency level.
Improving MCH capacity is a priority for more than one‐half of all MCH grantees. Data and surveillance capacity is the most common priority and other priorities vary in response to the unique needs of each State. Examples of other priorities include strategic partnerships, availability of safety net providers, and education for providers and families, to name a few.
PRIORITY NEEDS FOR 2010 IN DETAIL
PRIORITY NEEDS FOR 59 MCH STATE AND JURISDICTIONAL GRANTEES IN 2010
IMPROVED HEALTH AND HEALTH CARE 59 States
Access to Care and Health Status 58 States
Health in General and Access to Health Care 31 States Oral Health and Access to Oral Health Care 32 States Mental Health and Access to Mental Health Care 30 States Specialists, Screening, Immunizations, Other Specialized Care 45 States
Healthy Living 56 States
Healthy Lifestyles in General, Nutrition, Exercise, Weight 50 States Injury Prevention 37 States Risk Behavior in General, Substance Use, STIs, Sexual Risk 34 States
Healthy Pregnancies 50 States
Prenatal, Preconceptional & Interconceptional Health and Care 28 States Pregnancy, Fertility and Birth Rates 25 States Pregnancy Outcomes ‐ Low Birth Weight and Infant Mortality 31 States
Building MCH Capacity 32 States
Data and Surveillance 18 States Other 22 States

9
Access to Care and Health Status Addressing health problems or access to health care is a priority need for all Title V grantees. The wording of such priorities reflects two different approaches ‐ one can address the outcome (health) or the process for improvement (health care) – and sometimes depends on the operating philosophy of the grantee or on what can be measured. Similarly, States have identified health in general but also specific health problems such as oral health or mental health or access to other specialized care. All are included in this overall category and all are described in more detail below. Health in General and Access to Health Care: Improving health or improving access to health care as a means to improve health is a common priority need for Title V grantees. While virtually all priority needs have a goal of health improvement, needs statements in this category include those that specifically specify health and wellbeing or access to care as the priority. States are more likely to focus on access to care than on health outcomes. These priority needs statements are among the most broadly worded. Some States include medical home or care coordination as a strategy in this broad category of improving access to health care. Children with Special Health Care Needs (CSHCN) are a traditional target group but increasingly all MCH populations have been included. Disparity reduction can also be included as a focus in this category and States targeted specific populations, including minorities and disadvantaged populations for their health or health care priority. Examples from States include:
“Improve the Health of Children and Adolescents.” – Minnesota
“Increase the number of women, children, and families who receive preventive and treatment health services within a medical home.” – Wisconsin
“Racial disparities in maternal and child health outcomes.” – Iowa
“Health disparities among Families with Children with Special Health Care Needs should be reduced.” ‐ Delaware
Oral Health and Access to Oral Health Care: Priority needs that specifically address oral health were listed by more than one‐half of grantees. Oral health priorities are also most often stated in terms of access to oral health care and may include all MCH populations or specific populations as the target group. Examples from States include:
“Address the oral health needs of the MCH population through prevention, screening, referral, and appropriate treatment.” – Illinois
“Prevent development of dental caries in all children ages birth to 5.” ‐ Colorado Mental/Behavioral Health and Access to Mental/Behavioral Health Care: Priority needs to improve mental or behavioral health and access to care are as common as priority needs to improve health in general in 2010 State Needs Assessments. Addressing mental health, with depression being most often cited, is specified in priority needs as often as addressing access to mental health care. Examples from States include:
“Improve the behavioral health of women and children.” – Arizona
“Increase universal screening for post partum depression in women.” – Alaska
“Improve Mental/Behavioral Health Services.” ‐ Connecticut Other Specialized Health Services: Even more than the health services described above, States have identified priorities for specialized services among the populations they serve. Almost 75% of States have a priority need that falls in this category. Most commonly identified specialized care priorities include developmental screening and early intervention services and transition services for adolescents, particularly youth with special health care needs. Other special health care priorities identified include

10
immunizations, cancer screening for women, and lead screening, among others. Examples from States include:
“Improve developmental and social emotional screening and referral rates for all children ages birth to 5.” – Colorado
“Increase successful transition of special needs children from pediatric/adolescent to adult health care systems.” – Ohio
“Improve trauma care for children.” – Arkansas
“To increase the proportion of women aged 40 years and older who have ever received a mammogram.” – Northern Mariana Islands
Healthy Living
Healthy Living includes promoting healthy lifestyles as well as reducing risk behaviors and injury. Nine of ten State Title V grantees included a priority need to promote healthy lifestyles among MCH populations and those States have dedicated, on average, three of their seven to ten priority needs to address these critical preventive behaviors. Healthy Lifestyles: The importance of lifestyle for optimal health is acknowledged by the States in their selection of healthy lifestyles as the most frequently listed priority need in State 2010 Needs Assessment documents. The most common focus within this category is on reducing overweight and obesity. However, prevention programs, e.g., programs to promote nutrition and exercise, are also targeted by some States. Breastfeeding as a healthy start for newborns is included in this category, as is improved nutrition in general. Healthy lifestyle priority needs may be targeted to a single MCH population, such as children, or may include all MCH populations. Examples from States include:
“Promote healthy lifestyle practices among children and adolescents with emphasis on smoking prevention, adequate nutrition, regular physical activity, and oral health” – California
“Reduce obesity across the lifespan: Promote needed actions to reduce overweight and obesity among children and adolescents and adults” – Maryland
“Reduce the prevalence of obesity among children, youth, and women of childbearing age.” ‐ Alabama
“Enhance nutrition and increase physical activity for children and youth through increased access to healthy foods and physical activity opportunities and through breastfeeding promotion.” – District of Columbia
Injury Prevention: Prevention of injury is a priority need for more than 60% of grantees. States with specific injury prevention goals target both intentional and unintentional injuries. The most common specific types of injuries on which States will focus include suicide, intimate partner violence, child abuse, and motor vehicle crashes. Adolescents were often a population specifically targeted for injury prevention. Examples from States include:
“Reduce suicide and self‐inflicted injury in the maternal and child population in Maine” – Maine
“Decrease the incidence of domestic violence among women of child‐bearing age.” – Nevada
“Reduce the rate of deaths resulting from intentional and unintentional injuries among children and adolescents.” – North Dakota
“Reduce rates of fatal and non‐fatal unintentional injury among children and teens, with emphasis on interventions to prevent motor vehicle crash and household accident injuries.” – New Mexico
Risk Behavior: Reducing risk behavior, particularly tobacco cessation, is a longstanding priority need for MCH grantees. Many States specify risk behavior reduction in general while others target specific risk behaviors such as substance use and, less commonly, sexual risk behavior. Reducing the use of tobacco is
11
still the most common specific targeted behavior. Priority needs to reduce risk behavior may focus on all MCH populations or specific populations, particularly adolescents. Examples from States include:
“To decrease the use and abuse of alcohol, tobacco and other substances among youth, pregnant women and families.” – New Hampshire
“Decrease smoking among pregnant women.” – West Virginia
“Reduction of Adolescent Risk Taking Behavior.” – New Jersey
Healthy Pregnancies
Almost 85% of States have identified a priority need for healthy pregnancies although the priorities they identify and the outcomes they target may differ. Many States are increasing their efforts to ensure that women are healthy before they become pregnant. They are working to increase intendedness of pregnancy. States defining their priorities in terms of outcome are targeting low birth weight and infant mortality.
In this review, priority needs in this category specifically identify pregnancy outcomes or care for healthy pregnancies. It is possible and even likely that States without a priority need for healthy pregnancies have healthy pregnancies as a goal in their more broadly stated priority needs to improve health.
Prenatal, Preconceptional and Interconceptional Health Care3: Many States included priority needs to improve access to and use of health care to ensure healthy pregnancies. Access to prenatal care was the target for some States, but more of them focused on ensuring preconceptional or interconceptional care. Examples from States include:
“Increasing adequacy of prenatal care for pregnant women.” – American Samoa
“Improve Preconception Health among Women of Childbearing Age.” ‐ Missouri Pregnancy, Fertility and Birth Rates: Priority needs focusing on pregnancy, fertility, or birth rates were included by 42% of grantees in 2010. Most States specifically targeted intendedness of pregnancy although a few specified pregnancy spacing or repeat pregnancies. A priority with adolescents as the target population was noted by some States. Examples from States include:
“To lower the birth rate among Chamorro teenagers aged 15‐18.” – Northern Mariana Islands
“Prevent unintended and unwanted pregnancies.” – Florida
“Decrease the percentage of births occurring within 18 months of a previous birth to the same mother.” – Indiana
Pregnancy Outcomes – Low Birth Weight and Infant Mortality: While some States frame their priority need in terms of access to care to ensure healthy pregnancies, others focus on pregnancy outcomes, particularly on low birth weight and infant mortality. More than 50% of States include improved pregnancy outcomes as a priority need. Examples from States include:
“Reduce premature births and low birth weight.” – Idaho
“Decrease infant mortality and injury.” – Georgia
“Decrease infant mortality through reduction of preterm births in the African American population.” – Louisiana
3 To be counted in the latter two categories, priority needs statements had to include the term preconceptional or interconceptional health/health care or indicate that the goal of improving health or access to care was to improve pregnancy outcomes. Priorities to address women’s health per se are not included.

12
Building MCH Capacity
The wording of some priority needs indicates a recognition of the need to improve the ability of the agency to serve the MCH population. Among the most common priorities in this area is the need for data to inform service provision and to evaluate success in meeting goals. Data and surveillance priorities may be specific or general. Other capacity needs include promoting collaboration, building partnerships, strengthening the workforce, and education for providers and families. Examples from States include:
“Improving and Integrating Information Systems.” – New Jersey
“Invest in building existing MCH workforce leadership competencies and skills related to data analysis and program evaluation” – South Carolina
“Enhance data systems” – Connecticut
“Provide technical assistance, education, training materials and programs for community‐based family support organizations that serve the maternal and child population.” – Virgin Islands
“Maintain and/or increase the number of specialty providers in health shortage areas” – West Virginia
“Strategic Partnerships: Sustain, strengthen and maximize strategic partnerships through the Community of Care Consortium to address CSHCN core outcomes in Maryland.” ‐ Maryland
ALL MCH POPULATIONS ARE INCLUDED IN PRIORITY NEEDS
The majority of grantees developed priority needs specifically for mothers and infants or for children (see box below.) About three‐quarters included priority needs specifically targeting CSHCN. Those that did not specifically name CSHCN could have included them in generally stated priority needs, e.g. a priority need to “improve access to oral health services.” CSHCN would also be counted in priority needs for “all MCH populations.”
The priority needs for specific MCH populations were similar to those for the MCH population in general with the exception of pregnancy‐related priority needs. Healthy lifestyle, risk behavior reduction, injury prevention, and access to care priorities sometimes were targeted for all populations but could also target a specific population with a particular need.
An increasing number of grantees select priorities that focus on women or on women of childbearing age not only in priorities which address pre‐ or interconceptional health care but also in priorities that promote healthy lifestyles and access to all types of care for women. This is consistent with the focus on life course as a guiding principle noted by almost one‐half of States in their 2010 Needs Assessment.
Priority needs where the MCH agency was the target population included areas such as data and surveillance and development of systems of care or collaboration among programs.
States with Priority Needs for MCH Populations
Maternal and Infant 53 States
Children, including adolescents 55 States
Children with Special Health Care Needs 45 States
All populations (implied) 33 States
Subsets of Core MCH PopulationsPriority Needs
Adolescents 49 States
Parents or Families 20 States
Women including 33 States those of childbearing age
Other Populations Priority Needs
State MCH Agencies 32 States
Citizens or Community 6 States

13
As noted on page 4, the guidance for the 2010 Needs Assessment asked that States describe not only their process for selecting priority needs but how priorities changed from 2005 to 2010 and, also, which priority needs were considered but not selected as priorities and why. These new instructions were added to an already complex process and several States deserve recognition for including this new information in a concise and informative way. The descriptions included by Alabama, Arkansas, Georgia, Illinois, Kansas, Massachusetts, Michigan and Minnesota were all exemplary and provided a more complete picture of their review process, their decision‐making process, and their final plans.
Results of this “change in priority needs from 2005 to 2010” review lend themselves more to a summary of change rather than a tally of priority needs in one needs assessment cycle compared to another. For example, one State with a 2005 priority need that ranked low on their list might drop it because another organization has authority and will continue to work on the problem. A second State with the same priority need with the same low ranking might incorporate it into a comprehensive and more broadly stated priority. The following conclusions are drawn from this review.
Changes in Priority Needs Specified in 2005 Compared to 2010
By the numbers (discussion to follow):
• Of the 561 priority needs specified in 2005, almost two‐thirds (n=361) were retained in 2010 but most of them were modified in some way. Reasons for exclusion of 200 priority needs was not discussed by many States. Those States that provided a discussion for the priority needs that were excluded cited varied reasons.
• Of the 536 priority needs specified in 2010, 36% were considered to be new by the guidelines
for this review. Almost two‐thirds were variations of previously specified priority needs.4 The majority of States revised or, in rare cases, completely revamped their 2005 priority needs during the 2010 needs assessment process. A few States, however, retained their 2005 priorities unchanged.
Four States (NC, NJ, SD, VT) retained their 2005 priority needs almost verbatim. Vermont explained that “These goals were first created in 2002…(and) continue to be useful for Vermont state government.” Priority needs that were continued unchanged were broadly stated. No state developed a 2010 set of priorities that was completely different from 2005 in terms of the issues addressed.
The 2005 priority needs that were retained but modified fell into four general categories: priorities that were reworded, priorities that were refocused, priorities that were encompassed in a new priority need and priorities that were split among new priority needs.
The majority of 2005 priorities that were retained but modified were rewritten with a change in focus. The change could be in a particular aspect of the health or health care issue addressed, a change in the population targeted, or specificity or clarification of the 2005 priority need. In the case
4For an explanation of the process for classifying priority needs as new or changed, please see page 4.
PART II CHANGES IN PRIORITY NEEDS – ISSUES NOT INCLUDED

14
of changes that resulted in a more specific priority need, the modification sometimes made it easier to measure change and gauge success. Examples of refocused priority needs include:
Wyoming continued a priority for risk behavior reduction but was more specific about the behavior and the target population:
2005: Decrease tobacco and other substance use in the MCH population. 2010: Reduce the percentage of women who smoke during pregnancy.
Kansas continued a priority need to improve mental/behavioral health but changed the target population:
2005: Improve behavioral/mental health status of children and adolescents. 2010: The mental health and behavioral health needs of pregnant women and new mothers
should be addressed.
Hawaii continued a 2005 priority need for transition support for CSHCN but is more specific in 2010:
2005: Improve transition to adult life for youth with special health care needs. 2010: Improve the percentage of youth with special health care needs age 14‐21 years who
receive services necessary to make transitions to adult health care
Florida shifted the focus of their preconception health priority from outcome to process: 2005: Improve preconceptional and interconceptional health and well‐being. 2010: Promote preconception health screening and education.
More than 50 priority needs from 2005 were encompassed in more comprehensive priorities in 2010, allowing States to include more issues in their 2010 priority needs and form a comprehensive plan for improving MCH health. For example:
Oklahoma wrote a broadly stated, comprehensive priority needs statement for 2010 under which several of their 2005 priority needs could fall:
2005: Improve transition services of adolescents. 2005: Increase access to prenatal care. 2005: Improve utilization of dental health services by pregnant women and children. 2005: Increase the proportion of fully immunized children entering school. 2010: Improve access to comprehensive health services for the MCH population.
Conversely, some 2005 priorities were split among new 2010 priority needs. For example: Maine’s broadly stated 2005 priority need to reduce injuries is now three separate priority needs
that consider injury overall and specific injuries: 2005: Improve the safety of the MCH population, including the reduction of intentional and
unintentional injuries. 2010: Reduce the incidence of unintentional injuries to Maine’s MCH population. 2010 Reduce the prevalence of domestic violence and sexual assault and associated health
disparities. 2010 Reduce suicide and self‐inflicted injury in the maternal and child population in Maine.
Four reasons were commonly cited by the States that explained their decision to drop a priority need. Many States, however, did not explain their decisions.
The most common explanation for dropping a priority need was that the priority had ranked too low in the scoring process used, i.e., it was not identified as a priority by the stakeholders providing input. There were no particular health or health care issues that predominated in this group of dropped priorities.

15
MCH agencies also cited their lack of authority or ability to address an issue as a reason for dropping a priority need. Some also noted that another agency had responsibility for the area or that progress had been made and another agency would continue to monitor.
Some dropped priorities were noted by States to be overarching principles that apply to all priority needs. For example, disparity reduction may be dropped as a specific priority because there is an understanding that disparity reduction will be part of all agency activities and priority needs.
Some States described a new process for their needs assessment activity and indicated that a 2005 priority need was not consistent with their new focus or new process.
Exclusion of previous priority needs because of measurement issues or because it was already covered by a National Performance Measure, was cited but not frequently.
Issues Considered in the Needs Assessment Process That Were Not Identified as Priorities
Twenty‐five (25) States listed more than 200 issues that were considered but not selected as priorities and discussed why they were not selected.
There were no specific health or health care issues that predominated among the list of issues not included as priority needs by States. Topics covered all populations and all health problems.
The reasons varied for why issues discussed by participants were not included in a State’s list of 2010 priority needs, and these reasons were similar to those States listed for dropping priority needs. At the most basic level and most commonly, States noted that topics not chosen had not ranked highly enough in their participant ranking process. In many cases, the State noted that the issue was either too broad or too narrow, sometimes reflecting the overall focus of the organization to establish measurable goals or all‐encompassing goals. Finally, identified areas of concern were not included because they were not in the purview of the MCH agency or were the specific responsibility of another agency.
Other Observations Regarding Priority Setting as Described by States
Almost one‐half of States note using a life course perspective as a guide for their 2010 needs assessment process or for specific programs.
Looking broadly at the needs of women and children using a life course perspective led, in some cases, to more broadly focused priority needs statements rather than specific ones. On the other hand, this broad perspective that considers multiple influences on health also includes risk factors considered to be beyond the scope of influence of MCH agencies, issues such as education and poverty. This increased use of a life course perspective to evaluate the needs of populations is one factor that has contributed to the inter‐relatedness of many priority needs.
Wyoming’s Needs Assessment (p 7,17) provides an illustrative example of the use of a life course perspective:
“MFH [Maternal and Family Health Section] focused on a life course perspective throughout the needs assessment process. The life course perspective emphasizes the long term impact early life events and exposures have on health. It also highlights the interplay of biological, behavioral, psychological, and social protective/risk factors that contribute to health outcomes across the span of a person’s life…By selecting priorities that impact the life course at several points, MFH can increase the impact of interventions.”

16
MCH GRANTEES LINK PRIORITY NEEDS TO MEASURES AND INDICATORS
Setting MCH priorities to guide activities for 5‐year cycles is a major outcome of the needs assessment process but it is not the only outcome. In order to evaluate success in meeting the goals of priority needs, States should determine, at the time of priority setting, how they will know if their priority goals have been met. State Performance Measures may be developed and tailored specifically to a priority need. Other performance measures used by States might include National Performance Measures (NPMs) or other Title V indicators such as National Outcome Measures (NOMs), Health System Capacity Indicators (HSCIs) and Health Status Indicators (HSIs).
A comprehensive plan to address MCH priorities includes this second step and should be described in the Needs Assessment document. In this review of State documents, States were given “credit” for linking performance measures to priority needs if these linkages were described in their Needs Assessment document or in their Application/Annual Report. The majority of States that provided a description of how they will measure success did so in the Needs Assessment document.
The majority of grantees (47 of 59 or 80%) provided a “roadmap” that links priority needs to measures to gauge how well priority needs have been met.
Some States include extensive detail such as the rationale for including a priority need, targeted activities for that priority, and lists of performance measures that will be used. Other States provide linkages in tabular form, listing priorities and corresponding performance measures.
The following excerpt from Maine’s 2010 Needs Assessment document (p 260) provides an excellent example of how States link their priority needs to performance:
“Priority: Reduce suicide and self‐inflicted injury in the maternal and child population in Maine.
Suicide is the second leading cause of death among youth and the 4th leading cause of death among women age 15‐44 years in Maine. Each year, approximately 1 in 10 adolescents consider taking their own lives. The impact of suicide is devastating to survivors including family, friends, schools and entire communities. Risks for suicide include poor mental health, substance abuse, and trauma.
Progress on this priority will be measured using the following:
National Performance Measure #16: The rate (per 100,000) of suicide deaths among youths aged 15 through 19.
State Performance Measure # 1 (New in 2011): The rate of suicide deaths (per 100,000) among those age 20‐44 years.
This measure was chosen because the MIPP5 is expanding its efforts to address suicide and self‐ inflicted injury across the lifespan. The number of suicides among males and females in this age group is among the highest of any age group in Maine. When an adult dies by suicide, it can have serious consequences for the families and children who are survivors. Data from this measure are from death certificates maintained by the Maine ODRVS within the Maine CDC.
5 Maine Injury Prevention Program
PART III PRIORITY NEEDS AND MEASURES OF PERFORMANCE

17
Other related measures include: SPM # 2, SPM #6, SPM #7” North Dakota’s Needs Assessment (p 174) included a table to link priority needs to performance measures and also to levels of the MCH pyramid. Selected priority needs from this informative table appear below.
Pyramid Level of Service
Priority Need Statement
State Performance Measure
Component HPO NPM
DHCS ES PBS IBS
Form and strengthen partnerships with families, American Indians and underrepresented populations.
The degree to which families and American Indians participate in Title V program and policy activities.
*
HPO Goal 2 NPM 2 NPM 5
X
Support quality health care through medical homes.
The percentage of children birth through age 17 receiving health care that meets the American Academy of Pediatrics (AAP) definition of medical home
*
HPO16‐22 NPM 3 NPM 5
Promote healthy eating and physical activity within the MCH population.
The percentage of healthy weight among adults 18 through 44.
*
HPO19‐1 HPO19‐2 NPM 14 NPM 11
X
*While the performance measure may be targeted to a specific component, all of the priority need statements represent both service components and include children with special health‐care needs. The Pyramid Level of Services will vary depending on activities related to the priority need.
Needs Assessment documents for the following States also provide good examples of informative linkage of priority needs to performance measures:
Idaho Marshall Islands New York Indiana Maryland Oklahoma Kentucky Missouri

18
STATE PERFORMANCE MEASURES ARE THE MOST COMMONLY USED MEASURES OF PERFORMANCE LINKED TO PRIORITY NEEDS
Many priority needs are framed in terms of specific State goals and an SPM is often the most appropriate measure of performance. But, an SPM is not always a complete measure of a priority need and may be enhanced through other measures such as NPMs or NOMs.
Seventy‐eight percent (78%) of grantees (46 of 59) developed an SPM for three‐quarters or more of their priority needs. Almost 60% of grantees had multiple SPMs for at least one priority need.
The table below comes from Michigan’s Needs Assessment (p35‐36) and is a good example of how States link single or multiple SPMs to their priority needs.
2011‐2016 Priorities State Performance Measure
Increase the proportion of intended pregnancies SPM #01 – Percent of pregnancies that are intended
Increase the proportion of CSHCN population that has access to a medical home and integrated care planning
See NPM #03
Reduce obesity in children and women of child‐bearing age, including children with special health care needs
SPM #04 – Percent of singleton births by mother’s BMI at start of pregnancy >29.0
Address environmental issues (asthma, lead and second‐hand smoke) affecting children, youth and pregnant women.
SPM #05 – Ratio between black and white children under 6 years of age with elevated blood lead levels
Reduce African American and American Indian infant mortality rates.
SPM #02 – Percent of low birth weight births (<2500 grams) among live births SPM #03 – Percent of preterm births (<37 weeks gestation) among live births
Decrease the rate of sexually transmitted diseases among youth 15‐24 years of age
SPM #06 – Rate, per 100,000, of Chlamydia cases among 15‐19 year olds
Reduce intimate partner violence and sexual violence
SPM #07 – Percent of women physically abused during the 12 months prior to pregnancy SPM #08 – Percent of high school students who experienced dating violence
Increase access to early intervention services and developmental screening within the context of a medical home for children
SPM #9 – Percent of children receiving standardized screening for developmental or behavioral problems
Increase access to dental care for pregnant women and children, including children with special health care needs
See NPM #09
Reduce discrimination in health care services in publicly‐funded programs.
SPM #10 – Proportion of the minority population served in relation to the general minority population.
Needs Assessment documents for the following States also provide illustrative examples of the use of single and multiple SPMs.
Vermont Puerto Rico Pennsylvania North Carolina Louisiana Nebraska Wyoming Hawaii Oregon

19
MCH GRANTEES USE MULTIPLE AND VARIED MEASURES OF PERFORMANCE
While most MCH grantees developed one or more SPMs for their priority needs, many also linked priority needs to one or more of the other Title V measures/indicators about which grantees are required to report (Figure 1). It may be the case, particularly for priority needs that are broadly stated, e.g., “improve access to care for the MCH population”, that multiple measures will best demonstrate progress. The number and types of measures to be used for each priority need were examined.
Figure 1: Types of Performance Measures/Indicators Used by States for Priority Needs in Different Categories
Multiple performances measures for priority needs are the rule rather than the exception.
Fifty‐one (51) States had at least one priority need that was linked to more than one measure. Of the 537 priority needs, 41% were linked to two to five measures and 16% were linked to six or more measures. Several States are notable for specifying multiple measures for most priority needs. They include California, Kansas, Massachusetts, Minnesota, North Carolina, Pennsylvania, Rhode Island, and Washington.
While SPMs are the most commonly used measures for priority needs, the next most frequently used measures are the 18 National Performance Measures.
The majority of States (69%) will use one or more NPMs to gauge how well they are meeting their priority need goals. Just more than 50% of priority needs are linked to at least one NPM. States are also using National Outcome Measures (17 States), Health Status Indicators (14 States), and Health Systems Capacity Indicators (16 States). Also mentioned, although much less frequently, were State Outcome Measures and Healthy People 2020 objectives.
It is not surprising that States use the broadest range of State or National Performance Measures and indicators for their pregnancy outcome priority needs and that Healthy Lifestyles is the category of priorities for which States are most likely to develop an SPM. Pregnancy outcomes are a long standing focus for State MCH agencies and Title V, and vital records and specialized national datasets such as PRAMS have been available as measures to evaluate success for these traditional goals. Newer areas including the emerging focus on healthy lifestyles must depend on more creative use of existing data, often local, until national data collection in a systematic manner becomes the norm.
0
5
10
15
20
25
30
35
40
45
Number of States
SPMs
NPMs
NOMs
HSIs orHSCIs

20
FOCUS OF STATE PERFORMANCE MEASURES BY PRIORITY NEED TOPIC AREA
Priority Need Category Focus of SPMS Health in general or access to health care
Access to care is the more common SPM focus including primary and preventive care and medical homes. Fewer SPMs measure health improvement or health behaviors. A few States use SPMs measuring of health behaviors for these priorities.
Oral health or access to oral health care
The vast majority of SPMs measure access to oral health care rather than oral health outcomes.
Mental health or access to mental health care
The primary focus of mental health SPMs is access to care. Other SPMs measure change in mental/behavioral health or in behaviors such as intentional injuries that are associated with mental health.
Specialist, screening, immunizations, and other care
SPMs in this category are predominantly focused on 2 areas: services for CSHCN and measures of development screening and early intervention. Measures for immunizations, cancer screening, lead screening, and follow‐up for newborn screening are specified less often.
Healthy lifestyles Reduction of obesity and overweight is the most common focus; other areas include nutrition/folic acid/breastfeeding, physical activity, family planning and positive youth development.
Injury Reduction of intentional injury is the most common focus, particularly intimate partner and dating violence, child abuse and neglect, school safety and bullying, and suicide. Fewer injury SPMs address injury in general or unintentional injury.
Risk behaviors Many risk behavior SPMs measure smoking among adolescents and among women. Alcohol and illicit drug use are also measures.
Prenatal, pre‐ and interconceptional care
Pre‐ or interconceptional health care priorities are the focus of many SPMs and these SPMs examine improvement in health status or health behavior by measuring changes in weight, use of alcohol or tobacco, or multivitamin use, for example. Measures for comprehensive preconceptional care are rare.
Pregnancy, fertility, or birth rates
SPMs focused on birth rates are directed primarily at adolescents. Some SPMs measure pregnancy intendedness or interpregnancy interval.
Low birth weight and infant mortality
There are multiple SPMs for this category that include not only low birth weight and infant mortality, but also maternal health and risk behaviors, care for healthy pregnancies, and pregnancy spacing and intendedness.
Data and Surveillance Most SPMs address State data capacity, general and specific, and all rely on internal or agency data.
For detailed information about the indicators that States have selected to measure progress, including a listing of State
Performance Measures, please see the Appendix to this report.

21
A distinct advantage of a continued examination of priority needs identified by the States is the ability to look at change in State‐specified priorities over three needs assessment time periods. This longitudinal review of MCH priorities provides information on the changes in priority needs identified by States and can support the Bureau as it positions itself to assist the States in meeting State needs. Detailed changes in specific priority needs are summarized in Table 1 using the broad categories of priority needs that have been used to frame exploration of 2010 priorities and measures of performance throughout this report. The table shows the change from 2000 to 2005 and to 2010 for each category and the discussion that follows provides detail regarding more specific priorities within each category and how they changed over the three time periods studied. Additional detailed information appears in Section B of the Appendix to this report.
Table 1: Change in the Percent and (Number) of State MCH Grantees with Specific Priority Needs Identified through Three Needs Assessment Cycles
2000 2005 2010
IMPROVED HEALTH AND HEALTH CARE 100% (59) 100% (59) 100% (59)
Access to Care and Health Status 98% (58) 100% (59) 98% (58) Health in General and Access to Health Care 66% (39) 80% (46) 53% (31)
Oral Health and Access to Oral Health Care 58% (34) 59% (35) 54% (32)
Mental Health and Access to Mental Health Care 29% (17) 53% (31) 51% (30)
Specialists, Screening, Immunizations, Other Care 59% (35) 53% (31) 75% (45)
Healthy Living 93% (55) 98% (58) 95% (56)
Healthy Lifestyles in General, Nutrition, Exercise, Weight 51% (30) 81% (48) 85% (50)
Injury Prevention 69% (41) 58% (34) 63% (37)
Risk Behavior in General, Substance Use, STIs, Sexual Risk 69% (41) 66% (39) 58% (34)
Healthy Pregnancies 92% (54) 85% (50) 85% (50) Prenatal, Pre‐ and Interconceptional Health or Care 34% (20) 39% (23) 47% (28)
Pregnancy, Fertility, and Birth Rates 61% (36) 44% (26) 42% (25)
Low Birth Weight and Infant Mortality 51% (30) 47% (28) 53% (31)
Building Title V Capacity 71% (42) 64% (38) 54% (32)
Data and Surveillance 56% (33) 29% (17) 31% (18)
Other 46% (27) 49% (29) 37% (22)
In addition, the review of priority needs over time is summarized for specific target populations including children, adolescents, and children with special health care needs.
These broad trends only scratch the surface of State priorities and augmented with performance measures can provide guidance for further exploration of specific State activities and programs to address longstanding and emerging needs.
PART IV TRENDS IN PRIORITY NEEDS – 2000, 2005, AND 2010

22
CHANGES IN FOCUS AREAS FOR PRIORITY NEEDS
ACCESS TO CARE AND HEALTH STATUS A nearly universal focus for State Title V agencies, most grantees identified at least one priority need to improve health or health care during every needs assessment process. The specific health or health care problems identified by individual States do differ, however.
HEALTH IN GENERAL AND ACCESS TO HEALTH CARE
The number and percent of States with a priority need to improve health in general or access to health care has fluctuated over the three needs assessment periods but that fluctuation is likely due to changes in the way that States word their priority needs rather than a change in priority.
• In 2005, as many as 80% of States had a priority need to improve health in general or improve access to health care, up from 66% in 2000. Most recently, the percent of States that included this type of broadly stated health or health care priority had dropped to just more than 50%. It is not unusual for States to change how they word priority needs statements while focusing on the same challenges. The example from Oklahoma highlighted in Part II (page 14) illustrates this by showing how multiple specific health care priorities in one year can become a single priority need for comprehensive care in the next. In all years, States were more likely to specify a priority to improve access to care than they were to specify a priority to improve health, a difference likely driven in part by the ability to measure performance.
Priority needs classified as those to improve health or health care are stated that way, e.g., “Improve the health of mothers and children” or “improve access to care for MCH populations.” It is recognized and acknowledged, however, that the intent of all priority needs is to improve health.
The increase in focus on a medical home or care coordination from 2000 to 2005 was not noted in 2010, but expansion to populations other than CSHCN is still evident.
• The number of States with a priority need that focused on medical homes or care coordination increased to from 31% in 2000 to 49% in 2005. In the most recent needs assessment year, only 36% of States specified this priority. In early years, priority needs focusing on medical homes or care coordination targeted children with special health care needs. In recent years, these priorities have expanded to other groups including all children, pregnant women, or all MCH populations in general.
Disparity reduction, specifically stated, has decreased although it is discussed as an overarching principle in the Needs Assessment documents for some States.
• Almost one‐half of all States (n=28) specified reduction of disparities (stated or implied) in one or more priority needs in 2000. That percentage fell to 44% in 2005 and fell further to 34% in the most recent year. To be included in this category, States had to specifically target an underserved or disparate population in their priority needs statement. Priority needs to reduce disparities included as their target populations low‐income groups, racial and ethnic minorities, geographic groups, as well as vulnerable populations in general.
ORAL HEALTH AND ACCESS TO ORAL HEALTH CARE
Oral health and oral health care are priority concerns consistently identified by almost 60% of grantees over the three needs assessment periods.
• Identification of oral health and health care as a priority has changed little since 2000. More than 50% of grantees reported this priority in all time periods. By 2010, improvement in oral health or

23
oral health care is included by States as often as they include improvement in overall health. In all years, more States focus on access to oral health care (37% of States in 2010) although some word their priorities in terms of improving oral health (19% in 2010).
MENTAL/BEHAVIORAL HEALTH AND ACCESS TO MENTAL/BEHAVIORAL HEALTH CARE
The number of States identifying a priority need to improve mental or behavioral health and services almost doubled from 2000 to 2005 and is currently stable at 50% of States.
• Only 17 States included this priority in their 2000 list of priority needs. By 2005 and 2010, that number had increased to 31 and 30, respectively. Unlike most priority need categories that can include outcome (health) or process (improving access to care) and where States generally have focused on process, States with a 2010 mental/behavioral health priority need are more likely to focus on improving health (21 States) than they are on improving access to care (16 States.) This is a marked change from 2000 where most of the focus was on improving care and a focus on postpartum depression may be driving this change to an outcome priority. The number of States targeting depression went from zero to four to eight over the three time periods.
• Behavioral health is mentioned more frequently in 2010 than in previous years.
SPECIALISTS, SCREENING, IMMUNIZATIONS, OTHER CARE
The number of States identifying specialized health care services as a priority need increased notably in 2010, and two areas, transition care and developmental screening/early intervention, predominate compared to previous years. • In 2010, more States (75% vs. 53% and 58% in earlier years) included specialized health care
services as a priority for their work going forward. In previous years, the focus of these priorities varied among many services that included, among others, immunizations, lead screening, cancer screening and newborn screening. In the most recent year, 19 States identified transition care for CSHCN and others as a priority and 13 States identified developmental screening/early intervention. Other services were identified less often.
HEALTHY LIVING
An almost universal focus of State Title V agencies since the 2000 needs assessment process, the healthy living category for individual grantees has changed since 2000 with more States targeting healthy lifestyles in general plus nutrition and healthy weight, and fewer States focusing on risk behavior such as substance use and, to a lesser extent, on injury.
HEALTHY LIFESTYLES IN GENERAL, NUTRITION, EXERCISE AND WEIGHT
Promoting healthy lifestyles in general, with specific emphasis on nutrition and healthy weight, is now the most common specific priority need among all grantees.
• In 2000, only 51% of grantees identified healthy lifestyles as a priority. There was a notable increase in the number of grantees with this priority need by 2005 which continued in 2010 when 85% of grantees included one or more priority needs with a healthy lifestyle focus. In 2000, States were more likely to frame their healthy lifestyle priorities as improvement in nutrition or promotion of exercise rather than priorities to reduce weight. By 2005, almost twice as many States focused on obesity and overweight as did on nutrition and exercise and that dichotomy remains in 2010. Breastfeeding is a priority mentioned less frequently than obesity or exercise but was included by twice as many States in 2005 than in 2000 (12 vs. 6) with emphasis continuing in 2010. Breastfeeding is included in this category for this review because in recent priority setting

24
discussions we begin to see breastfeeding included in comprehensively stated priority needs to promote healthy lifestyles.
INJURY PREVENTION
Injury prevention is cited as a priority need less often over the years but remains a focus for the majority of States.
• The number of grantees with a priority need addressing injury decreased from 41 in 2000 to 34 in 2005. There was a small increase to 37 grantees in the most recent Needs Assessment document review.
• States are more likely to specify intentional injury prevention in their priority need although the number of such States decreased from 2000 (32 vs. 24). At the same time, the number of States with priorities to reduce unintentional injuries is increasing (20 in 2010 vs. 14 in 2000). Specific types of injuries targeted included suicide, domestic/intimate partner violence, child abuse and neglect. The number of States specifically targeting motor vehicle crashes, while small, has doubled since 2000 (3 vs. 6.)
RISK BEHAVIOR
Risk behavior reduction remains a priority need for more than one‐half of grantees and the focus has shifted to addressing multiple risks.
• Forty‐one (41) States, almost 70%, included a priority need to reduce risk behavior of any type in their 2000 priority needs lists. This percentage dropped to 58% in 2010. Some grantees frame their risk behavior reduction priorities in broad terms, e.g., “reduce adolescent risk behavior” while others target specific behaviors.
• Tobacco remains the most common substance targeted but risk behavior priorities are increasingly inclusive and not limited to a single behavior. About one‐third of States target smoking for risk reduction activities, down from 50% in 2000. Alcohol use and other substance use are included in priority needs statements by only 13 States for each behavior in the most recent year.
HEALTHY PREGNANCIES
Almost all States (85%) identified a priority need to ensure healthy pregnancies in 2005 and in 2010, down slightly from 2000 when 92% of States identified a priority need that focused on at least one aspect of healthy pregnancies, i.e., health care, health behavior or health outcomes.
PRENATAL, PRECONCEPTIONAL & INTERCONCEPTIONAL HEALTH AND CARE
Ensuring care for healthy pregnancies was cited as a priority by almost one‐half of States, up from one‐third of States, and that change is driven by an increased focus on preconceptional and interconceptional care.
• Care for healthy pregnancy typically includes assuring access and utilization of prenatal care but States increasingly promote access to pre‐ and interconceptional care. The percent of States with a pre‐ or interconceptional health care priority increased notably over the three time periods, from 5% to 20% to 31% of the States in the most recent year. Prenatal care as a focus declined modestly from 29% to 25%.
PREGNANCY, FERTILITY AND BIRTH RATES
The number of States identifying priority needs that target pregnancy rates, fertility rates, or birth rates has decreased by 30% since 2000.

25
• Just 25 States included this priority need in 2010 compared to 26 in 2005 and 36 in 2000. Unintended pregnancy reduction is the most common subgroup in this category of priorities in all years and has also decreased as a focus since 2000 with only 11 States including it in 2010. Interpregnancy interval or pregnancy spacing is mentioned, but rarely, with only 2 States with this priority in 2010. Those grantees that do include a priority need to address pregnancy or birth rates frequently identify adolescents as the target population.
PREGNANCY OUTCOMES –INFANT MORTALITY AND LOW BIRTHWEIGHT
Important markers of healthy pregnancies such as low birth weight and infant mortality are a priority focus of just more than one‐half of grantees. Focus on these important outcomes has been relatively unchanged over the three time periods examined.
• Preventing infant mortality is the more common pregnancy outcome targeted with 41% of States citing this among their priority needs in 2010. Less commonly listed were priority needs to reduce low birth weight or prematurity with 22% of States including it on their priority need list in the most recent year. This pattern of the broader area of infant mortality reduction being the predominant focus (compared to low birth weight) is consistent across all years.
BUILDING TITLE V CAPACITY
Many States attempt to address needs of specific MCH populations by identifying priorities aimed at improving the capacity of the Title V agency and its partners. Over the years, fewer States have included a capacity building priority need but still more than 50% of them do. The need for improved data and surveillance is the specific priority identified most often in all years but the number of States focusing on data capacity building has decreased since 2000, probably due to the extensive support available to grantees in the past for these activities. Other priority needs are diverse, are often unique to the State, and include improved systems of care, care integration, collaboration among partners, and workforce enhancement, to name a few.

26
TRENDS IN PRIORITY NEEDS FOR DIFFERENT MCH POPULATIONS
PRIORITY NEEDS FOR CHILDREN
At least 93% of grantees have included one or more priority need for children in all needs assessment periods.
General health and wellbeing and access to health care remain the most common priority needs for children. Almost 60% of grantees include a priority need for children that seeks to improve health or improve access to care.
Increased State MCH agency focus on healthy lifestyles includes children as the target population. The percent of States with a priority need regarding healthy lifestyles specifically for children dropped from 51% in 2005 to 44% in 2010 but is still higher than in 2000 when it was 32%.
Consistent with the trend for all MCH populations, risk behavior and injury prevention with children as a specific target population is included less often as a priority need. The percent of States with a injury or risk behavior priority need specifically mentioning children decreased from 49% in 2000 to 32% in 2010. Most grantees target intentional injuries among this population.
PRIORITY NEEDS FOR ADOLESCENTS
Over all years, more than 80% of grantees include a priority need with adolescents specifically stated as the target population.
Reducing risk behaviors and/or injuries remains the most common priority need for adolescents although the number of States with this priority has decreased. The percent of States with a risk behavior/injury priority need specifically targeting adolescents decreased from 61% in 2000 to 51% in 2010. Intentional injury is more commonly targeted than unintentional injury.
Reproductive health for adolescents continues to decrease as a stated priority need. Fewer States have included reproductive health for adolescents as a priority need over the three time periods (41% to 34% to 22%). Most have the goal of reducing adolescent pregnancy although some target improved access to prenatal care or risk reduction during pregnancy.
MCH agencies have included adolescents in their increased focus on healthy lifestyles. The percent of States with a priority need regarding healthy lifestyles specifically among adolescents dropped from 42% in 2005 to 27% in 2010, but is still higher than in 2000 when it was 12%.
PRIORITY NEEDS FOR CHILDREN AND YOUTH WITH SPECIAL HEALTH CARE NEEDS
Eighty percent (80%) of grantees include a priority need that specifically addresses the needs of CSHCN. Others may include the population in broadly framed needs statements that target all MCH populations.
Access to transition care for CYSHCN continues to increase as a focus for Title V agencies. Five to seven more States add this priority to their list at each needs assessment period. In 2010, 34% of States included it.
Access to comprehensive care as well as availability of a medical home and care coordination are constant priority needs listed by States. Access to care including specialists or comprehensive care was listed by fewer States in 2010 but the change was not large (42% compared to 37%). Ensuring a medical home or care coordination for CYSHCN remains a priority need for one‐fourth of the States.
For detailed information about the changes in the number of States with different priority needs in the three time periods examined, please see
the Appendix to this report.

Task Order #HHSH250201100026C, Year 1 – Task 3.3 Vanessa Lee, COTR
Victoria A. Freeman, RN, DrPH Page 0 of 33 December 29, 2011
STATE MATERNAL AND CHILD HEALTH AGENCY PRIORITY NEEDS AND PERFORMANCE MEASURES FOR 2000, 2005, AND 2010 Appendices
Victoria A. Freeman, RN, DrPH Child Health Services Program Cecil G. Sheps Center for Health Services Research University of North Carolina at Chapel Hill March 28, 2013 Prepared for the Maternal and Child Health Bureau, Health Resources and Services Administration, US Department of Health and Human Services under contract #HHSH250201100026C.

1
PAGE
APPENDIX A: STATE PERFORMANCE MEASURES RELATED TO SPECIFIC
PRIORITY NEEDS ……………………………………………………………….…………..…… 2
HEALTH IN GENERAL AND ACCESS TO HEALTH CARE……………………………………………………… 3
ORAL HEALTH AND ACCESS TO ORAL HEALTH CARE……………………………….………………..…… 6
MENTAL HEALTH AND ACCESS TO MENTAL HEALTH CARE……………..……………………………… 8
SPECIALISTS, SCREENING, IMMUNIZATIONS, AND OTHER SPECIALIZED CARE……………..… 12
HEALTHY LIFESTYLES……………..…………………………………………………………………………………….… 14
INJURY PREVENTION.……………..………………………………………………………………………….……….… 17
RISK BEHAVIOR REDUCTION…….………………………………………………………………………….……….… 19
PRENATAL, PRE‐ AND INTERCONCEPTIONAL HEALTH CARE…………….…………………........…… 19
PREGNANCY, FERTILITY, OR BIRTH RATES……………..…………………………..………………..……….… 21
LOW BIRTH WEIGHT AND INFANT MORTALITY…………….………………………………………………… 22
DATA AND SURVEILLANCE……………………………………………………………………………………………… 24
APPENDIX B: TRENDS IN PRIORITY NEEDS RELATED TO SPECIFIC HEALTH
PROBLEMS, HEALTH CARE NEEDS, AND MCH POPULATIONS ……………………… 25
HEALTH IN GENERAL OR ACCESS TO HEALTH CARE……………………………….………………..……… 26
ORAL HEALTH OR ACCESS TO ORAL HEALTH CARE.……………..……………………………………….… 27
MENTAL/BEHAVIORAL HEALTH AND ACCESS TO CARE……………………………………………...…… 28
SPECIALISTS, SCREENING, IMMUNIZATIONS, AND OTHER SPECIALIZED CARE………………… 29
HEALTHY LIFESTYLES IN GENERAL / NUTRITION, EXERCISE AND WEIGHT…….……………….… 30
INJURY PREVENTION…….………………………………………………………………………………………………… 31
RISK BEHAVIOR INCLUDING LEGAL AND ILLEGAL SUBSTANCE USE…….…………………………… 32
PRENATAL, PRECONCEPTIONAL, AND INTERCONCEPTIONAL HEALTH CARE…….…………..… 33
PREGNANCY, FERTILITY, OR BIRTH RATES………………………………………………………………….…… 34
LOW BIRTH WEIGHT AND INFANT MORTALITY…….………………………………………………………… 35
DATA AND SURVEILLANCE…….……………………………………………………………………………………..… 36
INCLUSION OF ALL TITLE V POPULATIONS IN PRIORITY NEEDS………………………………….…… 37
PRIORITY NEEDS ADDRESSING THE HEALTH OF CHILDREN…….…………………………………….… 38
PRIORITY NEEDS ADDRESSING THE HEALTH OF ADOLESCENTS………………………………………. 39
PRIORITY NEEDS ADDRESSING THE HEALTH OF CSHCN………………………………………………….. 40
TABLE OF CONTENTS

2
STATE PERFORMANCE MEASURES
RELATED TO SPECIFIC PRIORITY NEEDS Performance measures specifically related to priority needs are tallied on the pages that follow. All relevant SPMS are included in tables in each section. Bolded words in the tables indicate the general focus of the SPM. In each table, SPMs are grouped by category in order to compare and identify States with like SPMs. Some priority needs are complex and include multiple outcomes. In those cases, a State may have SPMs for the same priority need listed in more than one table. A list of data source abbreviations appears at the bottom of each table.
APPENDIX A
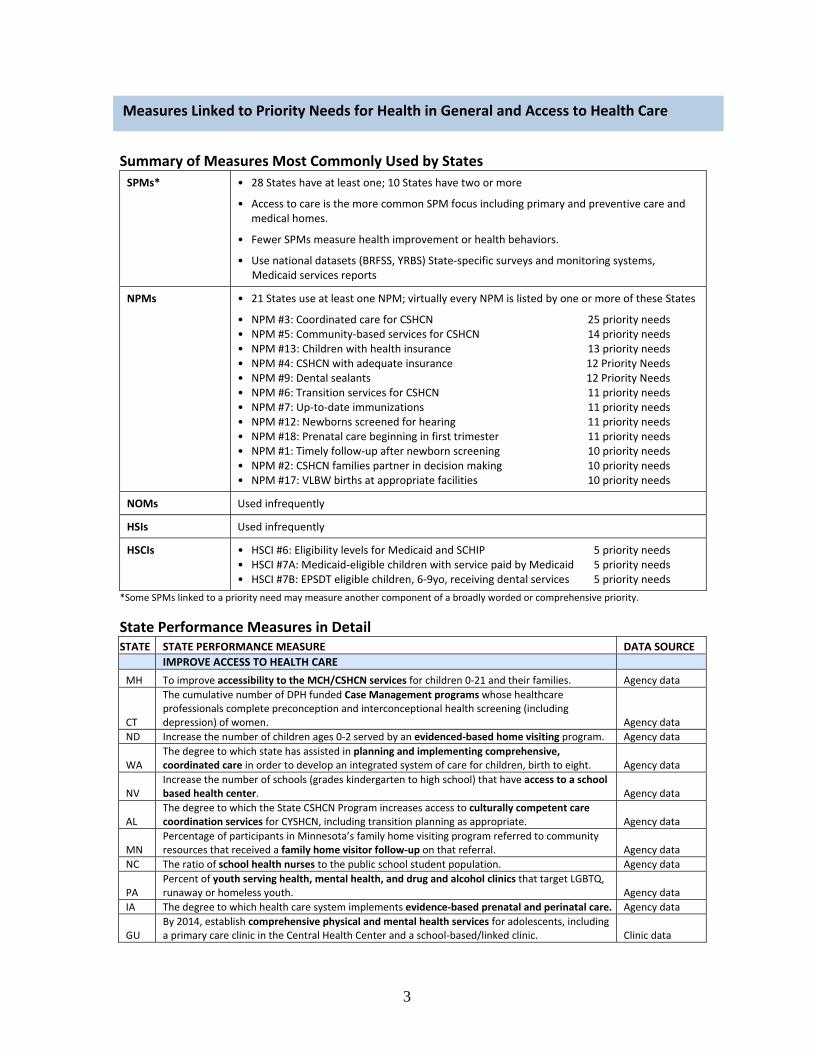
3
Summary of Measures Most Commonly Used by States
SPMs* • 28 States have at least one; 10 States have two or more
• Access to care is the more common SPM focus including primary and preventive care and medical homes.
• Fewer SPMs measure health improvement or health behaviors.
• Use national datasets (BRFSS, YRBS) State‐specific surveys and monitoring systems, Medicaid services reports
NPMs • 21 States use at least one NPM; virtually every NPM is listed by one or more of these States
• NPM #3: Coordinated care for CSHCN 25 priority needs • NPM #5: Community‐based services for CSHCN 14 priority needs • NPM #13: Children with health insurance 13 priority needs • NPM #4: CSHCN with adequate insurance 12 Priority Needs • NPM #9: Dental sealants 12 Priority Needs • NPM #6: Transition services for CSHCN 11 priority needs • NPM #7: Up‐to‐date immunizations 11 priority needs • NPM #12: Newborns screened for hearing 11 priority needs • NPM #18: Prenatal care beginning in first trimester 11 priority needs • NPM #1: Timely follow‐up after newborn screening 10 priority needs • NPM #2: CSHCN families partner in decision making 10 priority needs • NPM #17: VLBW births at appropriate facilities 10 priority needs
NOMs Used infrequently
HSIs Used infrequently
HSCIs • HSCI #6: Eligibility levels for Medicaid and SCHIP 5 priority needs • HSCI #7A: Medicaid‐eligible children with service paid by Medicaid 5 priority needs • HSCI #7B: EPSDT eligible children, 6‐9yo, receiving dental services 5 priority needs
*Some SPMs linked to a priority need may measure another component of a broadly worded or comprehensive priority.
State Performance Measures in Detail STATE STATE PERFORMANCE MEASURE DATA SOURCE IMPROVE ACCESS TO HEALTH CARE
MH To improve accessibility to the MCH/CSHCN services for children 0‐21 and their families. Agency data
CT
The cumulative number of DPH funded Case Management programs whose healthcare professionals complete preconception and interconceptional health screening (including depression) of women. Agency data
ND Increase the number of children ages 0‐2 served by an evidenced‐based home visiting program. Agency data
WA The degree to which state has assisted in planning and implementing comprehensive, coordinated care in order to develop an integrated system of care for children, birth to eight. Agency data
NV Increase the number of schools (grades kindergarten to high school) that have access to a school based health center. Agency data
AL The degree to which the State CSHCN Program increases access to culturally competent care coordination services for CYSHCN, including transition planning as appropriate. Agency data
MN Percentage of participants in Minnesota’s family home visiting program referred to community resources that received a family home visitor follow‐up on that referral. Agency data
NC The ratio of school health nurses to the public school student population. Agency data
PA Percent of youth serving health, mental health, and drug and alcohol clinics that target LGBTQ, runaway or homeless youth. Agency data
IA The degree to which health care system implements evidence‐based prenatal and perinatal care. Agency data
GU By 2014, establish comprehensive physical and mental health services for adolescents, including a primary care clinic in the Central Health Center and a school‐based/linked clinic. Clinic data
Measures Linked to Priority Needs for Health in General and Access to Health Care

4
STATE STATE PERFORMANCE MEASURE DATA SOURCE
IMPROVE ACCESS TO HEALTH CARE ‐ continued
PW Increase the percentage of well‐child service attendance for 12, 24, & 36 months olds and 4 and 5 years olds, enumerated by age and averaged for the reporting year. Clinic data
CT Increase the number of people served by increasing the number and area covered by Health Professional Shortage Area (HPSA) Designations in CT. HRSA data
RI Percent of women with health insurance who had a preventive care visit in the past year. BRFSS
RI Percent of insured adolescents who receive an annual preventive care visit. Insurance data
AL Of children and youth enrolled in AL Medicaid's Early Periodic Screening, Diagnosis, and Treat‐ ment (EPSDT) Program, the percentage who received any dental service in the reporting year. Medicaid data
AZ Percent of Medicaid enrollees age 1‐14 who received at least one preventive dental service within the last year. Medicaid data
MN Percentage of children enrolled in Medicaid who receive at least one recommended Child and Teen Checkup (C&TC) visit (EPSDT is known as C&TC in Minnesota). Medicaid data
ND The percent of Medicaid enrollees receiving Early Periodic Screening, Diagnosis and Treatment (EPSDT) screening services. Medicaid data
NC The number of children in the State less than three years old enrolled in early intervention services to reduce the effects of developmental delay, emotional disturbance, or chronic illness. NC CECAS
NC Percent of children age 13‐17 who have received 1 or more doses of Tdap since the age of 10 NIS
NJ Percent of live children registered with the BDARS who have been referred to NJ’s Special Child Health Services Case Management Unit who are receiving services. NJ BDARS
NJ Average age of diagnosis for children reported to the NJ Birth Defects & Autism Reporting System (BDARS) with an Autism Spectrum Disorder. NJ BDARS
AL The percentage of 0‐17 year‐old children and youth who do not have a medical home. NSCH
MN Percentage of families of children age 0‐17 that report costs not covered by insurance are usually or always reasonable. NSCH
UT The percent of children with special health care needs in the rural areas of the state receiving direct clinical services through the state CSHCN program. NSCSHCN
MN Percentage of children and youth with special health care needs who have received all needed health care services. NSCSHCN
OR Among CYSHN who needed specialized services in the past 12 months, percent of CYHSN who received all needed care. NSCSHCN
NY The percentage of Medicaid enrolled children between the ages of 3 and 6 years who had a well‐child and preventive health visit in the past year NY QARR
OK The percentage of Medicaid eligible children with special health care needs who report receiving dental services other than for routine dental care. OK HCA
OR Percent of 8th grade students who went to a doctor or nurse practitioner for a check‐up or physical exam when they were not sick or injured during the past 12 months.
OR Healthy Teens
NC The percent of women responding to the Pregnancy Risk Assessment Monitoring System survey that they either wanted to be pregnant later or not then or at any time in the future. PRAMS
NM Decrease the percent of women with a live birth who had no health care coverage for prenatal care. PRAMS
NM Decrease the percent of women initiating prenatal care after 10 weeks that did not get care as early as they wanted PRAMS
NM Increase the percent of pregnant women and new mothers receiving support services through community home visiting programs. PRAMS
VT The percent of Vermont women who indicate that their pregnancies are intended. PRAMS
MO Percent of children ages 0‐19 years old who received health care at a FQHC/CHC. Primary Care Assn data
LA Percent of all children and adolescents enrolled in public schools in Louisiana that have access to school‐based health center services. Program data
VI Increase access to comprehensive primary and preventive health care for adolescents 10‐19 yrs. VI Community Survey
CA The percent of women whose live birth occurred less than 24 months after a prior birth Vital records
CA The percent of cesarean births among low‐risk women giving birth for the first time. Vital records
NC Number of children affected in substantiated reports of abuse and/or neglect as compared with previous years. Agency data
IA The degree to which Iowa’s state MCH Title V program addresses health equity in MCH programs. Agency data

5
STATE STATE PERFORMANCE MEASURE DATA SOURCE
IMPROVE ACCESS TO HEALTH CARE ‐ continued
WA Percent of households with children (0‐18yrs) in which the reporting adult has an Adverse Childhood Experience (ACE) score of 3 or more. BRFSS
MD Rate of emergency department visits for asthma per 10,000 children, ages 0‐4
MD Asthma Surveillance System
WA The percent of children 6‐8 yo with dental caries experience in primary and permanent teeth. Smile Survey
MA With technical assistance from MCHB, develop an MCH measure for emotional wellness and social connectedness across the lifespan at the individual and systems levels by July 2011.
To be developed
WA Decrease the rate of infant mortality among the Native American population. Vital records
SD Accidental death rate (per 100,000) among adolescents aged 15 through 19 years Vital records
IMPROVE HEALTH BEHAVIORS CA The percent of women of reproductive age who are obese. BRFSS
VT The percent of women of childbearing age who consume at least two servings of fruit and three servings of vegetables daily. BRFSS
NC Percent of women of childbearing age taking folic acid regularly. BRFSS
CA The percent of women with a recent live birth who reported binge drinking during the three months prior to pregnancy. MIHA
NC Percent of children 2‐18 who are obese. Obese is defined as a body mass index (BMI) greater than or equal to the 95th percentile for gender and age. NC NPASS
NC Percent of women with live, term births who gain within the Institute of Medicine (IOM) Recommended Weight Gain Ranges. NC PNSS
NC Percent of non‐pregnant women of reproductive age who are overweight/obese (BMI>26). NC PNSS
SD Percent of WIC infants breastfed at 6 months of age PedNSS
SD Percent of infants exposed to secondhand smoke. PHRAS
SD Percent of school‐aged children and adolescents with a Body Mass Index (BMI) at or above the 95th percentile. School data
SD Percent of high school youth who self‐report tobacco use in the past 30 days. YRBS
OTHER
OK The extent to which the MCH program area develops and maintains the capacity to access and link health‐related data relevant to targeted MCH populations. Agency data
BDARS= Birth Defects & Autism Reporting System NSCH=National Survey of Children’s Health BRFSS=Behavioral Risk Factor Surveillance System NSCSHCN=National Survey of Children with Special Health Care Needs CECAS=Comprehensive Exceptional Children Accountability System PedNss=Pediatric Nutrition Surveillance System HCA=Health Care Authority PHRAS=Perinatal Health Risk Assessment Survey HRSA=Health Resources and Services Administration PNSS=Pregnancy Nutrition Surveillance System MIHA=Maternal and Infant Health Assessment PRAMS=Pregnancy Risk Assessment Monitoring System NIS=National Immunization Survey QARR=Quality Assurance Reporting Requirements NPASS=Nutrition and Physical Activity Surveillance System YRBS=Youth Risk Behavior Survey

6
Summary of Measures Most Commonly Used by States
SPMs* • 27 States have at least one; 2 States have two or more
• Virtually all SPMs measure access to care.
• Use national datasets (PRAMS) and Medicaid services reports
NPMs • 19 States use at least one NPM; 3 States use more than one.
• NPM #9: Dental sealants 18 Priority Needs
NOMs Not used
HSIs Not used
HSCIs • HSCI #7B: EPSDT eligible children, 6‐9yo, receiving dental services 6 priority needs
*Some SPMs linked to a priority need may measure another component of a broadly worded or comprehensive priority.
State Performance Measures in Detail STATE STATE PERFORMANCE MEASURE DATA SOURCE
ORAL HEALTH CARE AR Percentage of people on community water systems whose water is appropriately fluoridated. Agency data
CT
Percent of child health/dental providers who serve at risk populations that perform dental caries risk assessments, and provide oral health education and risk‐based preventive strategies by age one. Agency data
FL The percentage of low‐income children who access dental care Agency data
MO Percentage of women aged 18‐44 years who visited a dentist or a dental clinic for any reason within the past year BRFSS
CO Percent of parents reporting that their child (age 1 through 5) first went to the dentist by 12 months of age. CHS
AS Percent of 1 year old children attending well baby clinics who receive a package of oral hygiene services (caregiver education, fluoride varnishes, 1 toothbrush/washcloth, sticker) Clinic data
FM Percent children 1‐5 years old who treated for fluoride varnish. Clinic data
NV Increase the rate of significant Medicaid dental providers to the Medicaid population of children, youth and pregnant women. Medicaid data
AL
Of children and youth enrolled in Alabama Medicaid's Early Periodic Screening, Diagnosis, and Treatment (EPSDT) Program, the percentage who received any dental service in the reporting year. Medicaid data
AZ Percent of Medicaid enrollees age 1‐14 who received at least one preventive dental service within the last year. Medicaid data
IA Percent of Medicaid enrolled women receiving preventive dental health services during pregnancy. Medicaid data
IA Percent of Medicaid enrolled children ages 0‐5 years who receive a dental service. Medicaid data
IL Improve access and utilization of child dental services Medicaid data
KY The number of Medicaid covered women who had at leastone dental visit during their pregnancy. Medicaid data
MT The percent of Medicaid clients 0 through 6 years of age who have had a dental screening during the year. Medicaid data
NY The percentage of Medicaid enrolled children and adolescents between the ages of 2‐21 years who had at least one dental visit within the last year Medicaid data
OR Percent of children less than 4 years of age on Medicaid who received preventive dental services from a dental provider in the year. Medicaid data
UT The percentage of Medicaid eligible children (1‐5) receiving any dental service. Medicaid data
VT The percent of low income children (with Medicaid) who utilize dental services in a year. Medicaid data
WV Increase the percentage of the state's children <18 who are Medicaid beneficiaries who have at least one preventive dental service in a 12‐month period. Medicaid data
NH The percent of public water systems that optimally fluoridate the water system on a monthly basis. Agency data
Measures Linked to Priority Needs for Oral Health and Access to Oral Health Care

7
STATE STATE PERFORMANCE MEASURE DATA SOURCE
ORAL HEALTH CARE ‐ continued
MA The percentage of women with a recent live birth reporting that they had their teeth cleaned recently (within 1 year before, during, or after pregnancy). PRAMS
VA Percent of women with a live birth who went to a dentist during pregnancy PRAMS
VA Percent of low‐income children (ages 0‐5) with dental caries Head Start data
ORAL HEALTH AK Percent of mothers who report tooth decay in their 3‐year old child. AK CUBS
NE The percent of young children (1‐5) who have excellent/very good dental health. NSCH
VA Percent of low income third grade children with dental caries School dataBRFSS=Behavioral Risk Factor Surveillance System CHS=Child Health Survey CUBS=Childhood Understanding Behaviors Survey NSCH=National Survey of Child Health PRAMS=Pregnancy Risk Assessment Monitoring System

8
Summary of Measures Most Commonly Used by States
SPMs* • 30 States have at least one; 5 States have two or more
• The primary focus on mental health SPMs is on access to care. Other SPMs measure change in mental/behavioral health or in behaviors such as intentional injuries that are associated with mental health.
• Use national datasets (PRAMS, YRBS) to measure health and agency‐specific data to measure care.
NPMs • 19 States use at least one; 7 States use more than one.
• NPM #16: Adolescent suicide 13 Priority Needs
NOMs Used infrequently
HSIs Used infrequently
HSCIs Used infrequently
*Some SPMs linked to a priority need may measure another component of a broadly worded or comprehensive priority.
State Performance Measures in Detail STATE STATE PERFORMANCE MEASURE DATA SOURCE MENTAL OR BEHAVIORAL HEALTH CARE
AK Percent of women who delivered a live birth and had a provider talk to them about post partum depression since their new baby was born. PRAMS
CO Percent of mothers reporting that a doctor, nurse, or other health care worker talked with them about what to do if they felt depressed during pregnancy or after delivery. PRAMS
IL Maintain the distribution of mental health information and depression screening of pregnant and postpartum women PRAMS
ME The percent of women with depressive symptoms receiving medication or treatment for a mental health or emotional condition by a doctor or other healthcare provider. BRFSS
NH The rate of psychotherapy visits for adolescents 12‐18 years, with a diagnosed mental health disorder Medicaid data
MN Percentage of MN children birth to 5 enrolled in Medicaid who received a mental health screening using a standardized instrument as part of their C&TC visit.
Medicaid data
OR Among CYSHN who needed mental health/counseling in the past 12 months, percent of CYHSN who received all needed care. NSCSHCN
Build capacity for promoting social and emotional health in children from birth to age 5. Agency data
GU By 2014, establish comprehensive physical and mental health services for adolescents, including a primary care clinic in the Central Health Center and a school‐based/linked clinic. Clinic data
OR Percent of women who reported that they received education about depression during their most recent pregnancy from a prenatal care provider. PRAMS
PA Percent of infants and children (1‐5) receiving WIC services screened for mental health concerns (through MCH consultants/state health nurses) at participating WIC clinics or their umbrella agencies. WIC data
PA Percent of women receiving WIC services screened for behavioral health concerns (through MCH consultants or state health nurses) at participating WIC clinics and/or their umbrella agencies. WIC data
LA Percent of Louisiana resident women giving birth who undergo screening for substance use, depression, and domestic violence using the SBIRT approved methods.
Vital records, NTI
CT Percent of students that had a risk assessment with a mental health component conducted during a comprehensive, annual physical exam at a SBHC. Agency data
PA Percent of youth serving health, mental health, and drug and alcohol clinics that target LGBTQ, runaway or homeless youth. Agency data
MENTAL OR BEHAVIORAL HEALTH AZ Percent of women age 18 years and older who suffer from frequent mental distress. BRFSS
MO Percentage of women with recent live birth who reported frequent postpartum depressive symptoms PRAMS
ND Decrease the percent of students who reported feeling so sad or hopeless almost every day for 2 weeks or more in a row that they stopped doing some usual activities during the past 12 months. YRBS
Measures Linked to Priority Needs for Mental Health and Access to Mental Health Care

9
STATE STATE PERFORMANCE MEASURE DATA SOURCE MENTAL OR BEHAVIORAL HEALTH ‐ continued RI Percent of high school students with special needs who report feeling sad or hopeless YRBS
PR The number of preschool children who present behavioral problems. Head Start data
UT The percent of youth during the last 12 months who feel so sad or hopeless almost every day for two weeks or more in a row that they stopped doing usual activities. YRBS
HEALTH BEHAVIORS
KS The percent of women in their reproductive years (18‐44 years) who report consuming four or more alcoholic drinks on an occasion in the past 30 days. Vital records
LA Percent of women who use alcohol during pregnancy PRAMS
CA The percent of women with a recent live birth who reported binge drinking during the three months prior to pregnancy. MIHA
INTENTIONAL INJURIES ME The rate of suicide deaths (per 100,000) among those age 20‐44 years. Vital records
ME Percent of adult women reporting sexual assault or intimate partner violence within the previous 12 months. BRFSS
ME Rate of substantiated cases of child abuse and neglect assessed by ME Office of Child & Family Svcs. Agency data
NM Reduce the proportion of women who report being physically abused by husband or partner during pregnancy. PRAMS
NV Increase the percent of women of child‐bearing age who receive screening and assistance for domestic violence. Agency data
WI Rate per 1,000 of substantiated reports of child maltreatment to WI children, 0‐17yo, during the year. Agency data
OTHER
MA With technical assistance from MCHB, develop an MCH measure for emotional wellness and social connectedness across the lifespan at the individual and systems levels by July 2011. Composite tool
CT The cumulative number of DPH funded Case Management programs whose healthcare professionals complete preconception and interconceptual health screening (including depression) of women. Agency data
WA Percent of households with children (0‐18yrs) in which the reporting adult has an Adverse Childhood Experience (ACE) score of 3 or more. BRFSS
BRFSS=Behavioral Risk Factor Surveillance System PRAMS=Pregnancy Risk Assessment Monitoring System MIHA= Maternal and Infant Health Assessment WIC=Special Supplemental Nutrition Program for Women, Infants, and Children NSCSHCN=National Survey of Children with Special Health Care Needs YRBS=Youth Risk Behavior Survey

10
Summary of Measures Most Commonly Used by States
SPMs* • 37 States have at least one; 6 States have two or more • SPMs in this category are predominantly focused on 2 areas: services for CSHCN and
measures of development screening and early intervention. Measures for immunizations, cancer screening, lead screening, and follow‐up for newborn screening are specified less often.
• Use national surveys (NSCSHCN, NSCH, NIS) and program data.
NPMs • 26 States use at least one NPM; 10 States use more than one. • NPM #6: Transition services for CSHCN 16 priority needs • NPM #4: CSHCN with adequate insurance 7 priority needs • NPM #12: Newborns screened for hearing 7 priority needs • NPM #1: Timely follow‐up from newborn screening 6 priority needs • NPM #3: Coordinated care for CSHCN 6 priority needs • NPM #5: Community‐based services for CSHCN 6 priority needs
NOMs Used infrequently
HSIs Not used
HSCIs Used infrequently
*Some SPMs linked to a priority need may measure another component of a broadly worded or comprehensive priority.
State Performance Measures in Detail STATE STATE PERFORMANCE MEASURE DATA SOURCE SERVICES FOR CSHCN
IL Provide comprehensive transition planning for CSHCN ages 14 and above and their families Program data
VI Increase the percent of CSHCN families' participation in transition planning to at least 50%. Program data
OK The number of families with a child with special health care needs receiving respite careprovided through the CSHCN program. Program data
FM Percent of children with special needs who have a completed reevaluation by the CSN team within the last 12 months. Program data
KY Degree to which CCSHCN transition action plan is successfully completed and implemented. Program data
AL The degree to which the State CSHCN Program increases access to culturally competent care coordination services for CYSHCN, including transition planning as appropriate. Program data
TN Increase the percentage of children and youth with special health care needs age 14 years and older who have formal plans for transition to adulthood. NSCSHCN
HI The percentage of youth with special health care needs who received the services necessary to make transitions to all aspects of adult life, including adult health care, work, and independence. NSCSHCN
OR Among CYSHN who needed specialized services in the past 12 months, percent of CYHSN who received all needed care. NSCSHCN
KS The percent of youth with special health care needs (YSHCN) whose doctors usually or always encourage development of age appropriate self management skills. NSCSHCN
PA Percent of CYSHCN ages 14‐21 transitioning into adulthood who received services necessary to make appropriate transitions to adult health care, work and independence. NSCSHCN
DEVELOPMENTAL SCREENING / EARLY INTERVENTION
GA Among children five years of age and younger who received services through the MCH Program, the percent who received a developmental screen
Being developed
UT The percentage of primary care providers/medical homes that conduct routine age‐specific developmental screenings in their practice.
Being developed
CT
Percent of 0‐3 year olds participating in the state Medicaid Program (HUSKY ‐ Health Insurance for Uninsured Kids and Youth) who received a developmental screening within the last twelve months. Medicaid data
Measures Linked to Priority Needs for Specialists, Screening, Immunizations and Other Specialized Care

11
STATE STATE PERFORMANCE MEASURE DATA SOURCE DEVELOPMENTAL SCREENING / EARLY INTERVENTION ‐ continued
HI
The percentage of parents of children 10 months to 5 years who report completing a standardized developmental and behavioral screener (SDBS) during a health care visit in the past 12 months. NSCH
CO Percent of parents asked by a health care provider to fill out a questionnaire about development, communication, or social behavior of their child ages 1 through 5. NSCH
NH The percent of parents who self‐report that they completed a standardized, validated screening tool used to identify children at risk for developmental, behavioral or social delays NSCH
MI Percent of children receiving standardized screening for developmental or behavioral problems NSCH
DE The percentage of children aged 4 months to 5 years with no or low risk for developmental, behavioral or social delays. NSCH
NC The number of children in the State less than three years old enrolled in early intervention services to reduce the effects of developmental delay, emotional disturbance, or chronic illness. Program data
CO Percent of Early Intervention Colorado referrals coming from targeted screening sources. Program data
MN Percentage of children under the age of one year participating in early intervention through Part C of the Individuals with Disabilities Education Act. Program data
FL The percentage of Part C eligible children receiving service Program data
MN The number of children enrolled in the Follow‐Along Program. Program data
WI Percent of children under 1 year of age enrolled in Wisconsin’s Birth to 3 Program during the calendar year. Program data
IMMUNIZATIONS
MT The percent of children 19‐35 months of age who have received the 4th immunization in the diphtheria, tetanus, and pertussis (DTaP) series. NIS
ID Percent of children at kindergarten enrollment who meet state immunization requirements. Program data
ID Percent of children at seventh grade enrollment who meet state immunization requirements. Program data
MS Percent of women aged 144 years who received an influenza vaccination within the last year. Program data
MT The percent of children 19‐35 months of age who have received an immunization against varicella. NIS
AS Percent of 15 month old children with completed immunizations. Program data
OTHER
MT The percent of children with cleft lip and/or palate receiving care in interdisciplinary clinics. Program data
AZ Percent of newborns who fail their initial hearing screening who receive appropriate follow up services. Program data
MP Percent of women who have ever received a mammogram. Program data
MP Percent of women who have ever received a pap smear. Program data
MH To increase the number of women who are screened for cervical cancer. Program data
NY Percentage of children who were tested for lead two or more times before the age of three. Program data
DC Prevalence of Elevated Blood Lead among children less than 6 years of age. Program data
IN The percentage of children less than 72 months of age with blood lead levels (BLL) equal to or greater than 10 micrograms per deciliter. Program data
AR Proportion of children aged 0‐14 years with Injury Severity Score (ISS) of greater than 15 who receive definitive treatment in a Level I pediatric trauma center. Hospital data
MD Rate of emergency department visits for asthma per 10,000 children, ages 0‐4 Program data
MA The rate (per 10,000) of hospitalizations due to asthma among Black, non‐Hispanic and Hispanic children aged 0‐4 years. Hospital data
MD Percent of children enrolled in evidence based home visiting programs in Maryland Program data
RI Percent of pregnant women determined at risk for poor outcomes, residing in selected communities, who receive a home visit during the prenatal period.
KIDSNET database
OK The percentage of children with special health care needs who receive child care services at licensed child care facilities and homes. Program data
LA Percent of all children and adolescents enrolled in public schools in Louisiana that have access to school‐based health center services. Program data
MA With technical assistance from MCHB, develop an MCHmeasure for emotional wellness and social connectedness across the lifespan at the individual and systems levels by July 2011.
Being developed
NIS:National Immunization Survey NSCH=National Survey of Children’s Health NSCSHCN= National Survey of Children with Special Health Care Needs
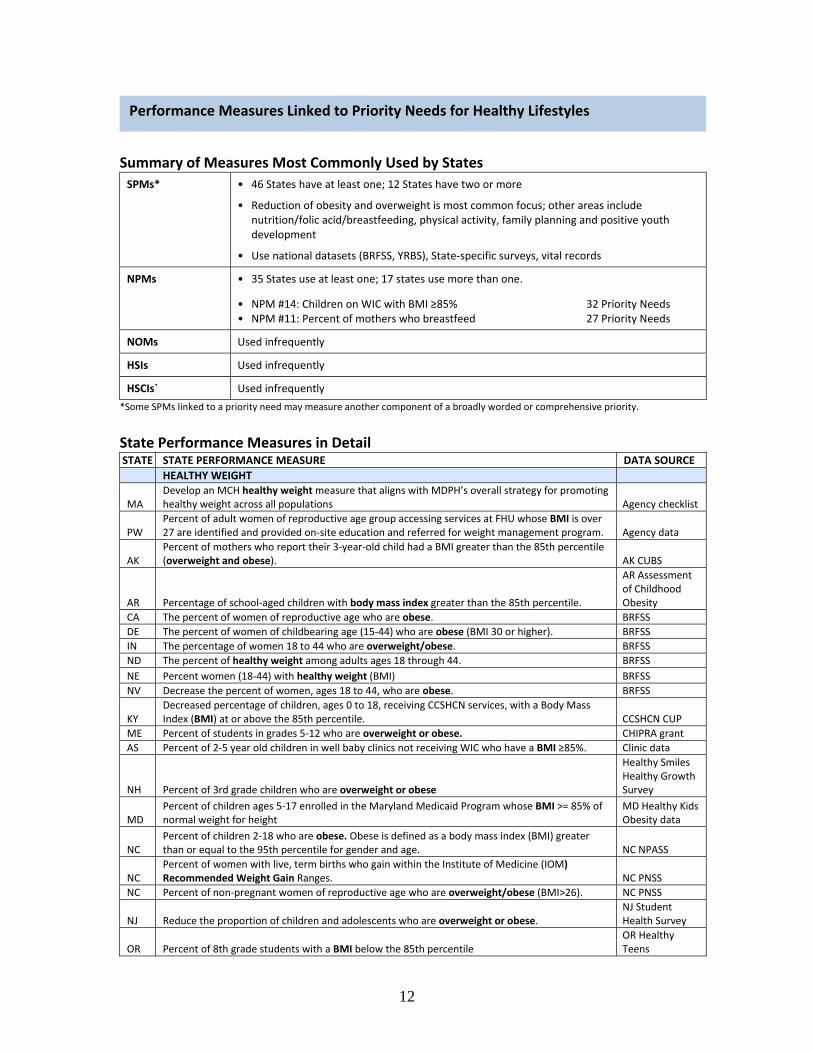
12
Summary of Measures Most Commonly Used by States
SPMs* • 46 States have at least one; 12 States have two or more
• Reduction of obesity and overweight is most common focus; other areas include nutrition/folic acid/breastfeeding, physical activity, family planning and positive youth development
• Use national datasets (BRFSS, YRBS), State‐specific surveys, vital records
NPMs • 35 States use at least one; 17 states use more than one.
• NPM #14: Children on WIC with BMI ≥85% 32 Priority Needs • NPM #11: Percent of mothers who breastfeed 27 Priority Needs
NOMs Used infrequently
HSIs Used infrequently
HSCIs` Used infrequently
*Some SPMs linked to a priority need may measure another component of a broadly worded or comprehensive priority.
State Performance Measures in Detail STATE STATE PERFORMANCE MEASURE DATA SOURCE
HEALTHY WEIGHT
MA Develop an MCH healthy weight measure that aligns with MDPH’s overall strategy for promoting healthy weight across all populations Agency checklist
PW Percent of adult women of reproductive age group accessing services at FHU whose BMI is over 27 are identified and provided on‐site education and referred for weight management program. Agency data
AK Percent of mothers who report their 3‐year‐old child had a BMI greater than the 85th percentile (overweight and obese). AK CUBS
AR Percentage of school‐aged children with body mass index greater than the 85th percentile.
AR Assessment of Childhood Obesity
CA The percent of women of reproductive age who are obese. BRFSS
DE The percent of women of childbearing age (15‐44) who are obese (BMI 30 or higher). BRFSS
IN The percentage of women 18 to 44 who are overweight/obese. BRFSS
ND The percent of healthy weight among adults ages 18 through 44. BRFSS
NE Percent women (18‐44) with healthy weight (BMI) BRFSS
NV Decrease the percent of women, ages 18 to 44, who are obese. BRFSS
KY Decreased percentage of children, ages 0 to 18, receiving CCSHCN services, with a Body Mass Index (BMI) at or above the 85th percentile. CCSHCN CUP
ME Percent of students in grades 5‐12 who are overweight or obese. CHIPRA grant
AS Percent of 2‐5 year old children in well baby clinics not receiving WIC who have a BMI ≥85%. Clinic data
NH Percent of 3rd grade children who are overweight or obese
Healthy Smiles Healthy Growth Survey
MD Percent of children ages 5‐17 enrolled in the Maryland Medicaid Program whose BMI >= 85% of normal weight for height
MD Healthy Kids Obesity data
NC Percent of children 2‐18 who are obese. Obese is defined as a body mass index (BMI) greater than or equal to the 95th percentile for gender and age. NC NPASS
NC Percent of women with live, term births who gain within the Institute of Medicine (IOM) Recommended Weight Gain Ranges. NC PNSS
NC Percent of non‐pregnant women of reproductive age who are overweight/obese (BMI>26). NC PNSS
NJ Reduce the proportion of children and adolescents who are overweight or obese. NJ Student Health Survey
OR Percent of 8th grade students with a BMI below the 85th percentile OR Healthy Teens
Performance Measures Linked to Priority Needs for Healthy Lifestyles

13
STATE STATE PERFORMANCE MEASURE DATA SOURCE
HEALTHY WEIGHT ‐ continued
HI Percentage of children, ages 2 to 5 years, receiving WIC services with a Body Mass Index (BMI) at or above the 85th percentile. PedNSS
KS The Percent of children who are obese. PedNSS
WY Percent of women gaining adequate weight during pregnancy. PRAMS
MH To decrease overweight and obese school children by 5% yearly. School data
SD Percent of school‐aged children and adolescents with a Body Mass Index (BMI) at or above the 95th percentile. School data
TN Reduce the percentage of obesity and overweight among Tennessee K‐12 students School data
GU By 2014, decrease obesity among public school children and the early childhood population by 10%. To be developed
CO Percent of live births where mothers gained an appropriate amount of weight during pregnancy according to pre‐pregnancy BMI. Vital records
CO Percent of live births to mothers who were overweight or obese based on BMI before pregnancy. Vital records
KY Percentage of first time births to Kentucky resident women aged 18 and older who had a pre‐pregnancy BMI in either the overweight or obese category. Vital records
MI Percent of singleton births by mother's BMI at start of pregnancy greater than 29.0 Vital records
MO Percentage of live births to women who are prepregnancy overweight or obese Vital records
MP Increase the proportion of primary care physicians who regularly measure the body mass index of their patients. WIC data
AZ The percent of high school students who are overweight or obese. YRBS
DE The percent of children and adolescents who are overweight or obese. YRBS
GA Percent of high school students who are obese (BMI > or = 95th percentile) YRBS
ID Percent of 9th – 12th grade students that are overweight. YRBS
NV Decrease the percentage of at‐risk for overweight and overweight children in NV public schools. YRBS
NY The percentage of high school students who were overweight or obese YRBS
WV Decrease the percentage of high school students in grades 9‐12 who are overweight or obese. YRBS
OK The percentage of adolescents overweight and obese (greater than or equal to 85th percentile of gender‐specific body mass index [BMI] distribution
YRBS, School data
NUTRITION / BREASTFEEDING / FOLIC ACID MH To increase the percentage of mothers who receive nutrition counseling during prenatal care. Clinic data
WY Percent of WY high school (grades 9‐12) students who ate fruits and vegetables less than 5 times per day. YRBS
CT Increase the redemption rate of fruit and vegetable checks issued to women and children enrolled in the Connecticut WIC program. WIC data
MH Increase the percentage of mothers who breastfeed their newborns at 12 months after delivery. Clinic data
GU By 2014, promote overall infant heath through increasing breastfeeding rates in Guam Memorial in new mothers to 70%. Hospital data
KS The percent of infants exclusively breastfed at 6 months. NIS
NM Increase the proportion of women who exclusively breastfeed their babies through six months. NIS
NY The percentage of infants who were exclusively fed breast milk between birth and hospital discharge
NY Perinatal Data System
SD Percent of WIC infants breastfed at 6 months of age PedNSS
IN The percentage of mothers who initiate exclusive breastfeeding. Vital records
MP The percent of mothers who breastfeed their infants at hospital discharge. Vital records
WY The percent of mothers who initiate breastfeeding their infants at hospital discharge. Vital records
UT Percent of women of reproductive age (18‐44 years) who report that they take a multivitamin pill or supplement containing at least 400mcg of folic acid daily. BRFSS
FM The percent of one year old babies with anemia. Clinic data
FM Percent pregnant women attending prenatal care who are screened for low hemoglobin Clinic data
NC Percent of women of childbearing age taking folic acid regularly. BRFSS
WY Percent of postpartum women reporting multivitamin use four or more times per week in the month before becoming pregnant. PRAMS
VA Percent of children eligible for WIC that are enrolled in WIC, ages 0 to 5 WIC data
VA Percent of eligible children in day cares that participate in Child and Adult Care Feeding Programs (CACFP) WIC data
VA Percent of eligible children participating in Summer Food Services Program (SFSP) WIC data

14
STATE STATE PERFORMANCE MEASURE DATA SOURCE
PHYSICAL ACTIVITY IL Increase the percentage of youth participating in daily physical education at school YRBS
MO Percent of high school students who met currently recommended levels of physical activity. YRBS
MS Percent of students in grades 9‐12 who met recommended levels of physical activity. YRBS
UT Percentage of students who were physically active for a total of at least 60 minutes per day on five or more of the past 7 days. YRBS
WV Increase the percentage of high school students who participate in physical activity for at least 60 minutes a day, 3 days a week. YRBS
WY Percent of Wyoming high school (grades 9‐12) students who were physically active for at least 60 minutes per day. YRBS
AS Number of youth and families who participate in BodyWorks class during the project year Program data
FAMILY PLANNING
CO Percent of sexually active high school students using an effective method of birth control to prevent pregnancy. YRBS
CO Percent of sexually active women and men ages 18‐44 years using an effective method of birth control to prevent pregnancy. BRFSS
WA The percent of pregnancies (live births, fetal deaths, abortions) that are unintended. PRAMSVital records
POSITIVE YOUTH DEVELOPMENT
PR The degree to which selected organizations incorporate the Positive Youth Development Model (PYDM) in the services provided to adolescents.
Program checklist
PR The percent of youth 10‐19 y/o who adopt specific healthy life styles while served by selected organizations working with the Positive Youth Development Model. To be developed
VT The percent of youth who do not binge drink on alcoholic beverages. YRBS BRFSS=Behavioral Risk Factor Surveillance System PedNSS=Pediatric Nutrition Surveillance System CUBS=Childhood Understanding Behaviors Survey PNSS=Pregnancy Nutrition Surveillance System CCSHCN CUP= Commission for CHSCN Cost and Utilization Program PRAMS=Pregnancy Risk Assessment Monitoring System CHIPRA=Child Health Insurance Program Reauthorization Act WIC=Special Supplemental Nutrition Program for Women, Infants, & Children NIS=National Immunization Survey YRBS=Youth Risk Behavior Survey NPASS=Nutrition and Physical Activity Surveillance System

15
Summary of Measures Most Commonly Used by States
SPMs* • 34 States have at least one; 13 States have two or more
• Reduction of intentional injury is most common focus, particularly intimate partner and dating violence, child abuse and neglect, school safety and bullying, and suicide.
• Fewer injury SPMs address injury in general or unintentional injury.
• Use national datasets (PRAMS, YRBS), agency or program data, vital records
NPMs • 19 States use at least one; 7 states use more than one.
• NPM #10: Motor vehicle crash deaths <14yo 16 Priority Needs • NPM #16: Adolescent suicide 12 Priority Needs
NOMs Used infrequently
HSIs • HSI #3A‐C: Injury deaths including MVC injuries 6 Priority Needs
• HSI #4A‐C: Nonfatal injuries including MVC injuries 6 Priority Needs
HSCIs Used infrequently
*Some SPMs linked to a priority need may measure another component of a broadly worded or comprehensive priority.
State Performance Measures in Detail STATE STATE PERFORMANCE MEASURE DATA SOURCE
DOMESTIC / INTIMATE PARTNER / DATING VIOLENCE
OR Percent of family planning clinic encounters in which relationship safety was discussed with the client. Ahlers database
ME The percent of adult women reporting sexual assault or intimate partner violence within the previous 12 months. BRFSS
LA Percent of Louisiana resident women giving birth who undergo screening for substance use, depression, and domestic violence using the SBIRT approved methods.
NTI data, Vital records
AK Percent of women who recently had a live‐born infant and experienced intimate partner violence during pregnancy. PRAMS
MI Percent of women physically abused during the 12 months prior to pregnancy PRAMS
NM Reduce the proportion of women who report being physically abused by husband or partner during pregnancy. PRAMS
MA The percentage of School Based Health Center clients for whom an assessment for intimate partner/teen dating/sexual violence was done. Program data
NV Increase the percent of women of child‐bearing age who receive screening and assistance for domestic violence. Program data
AK Percent of high school students who were hit, slapped, or physically hurt on purpose by their boyfriend or girlfriend during the previous 12 months. YRBS
AZ The percent of high school students who report having experienced physical violence by a dating partner during the past 12 months. YRBS
MI Percent of high school students who experienced dating violence YRBS
WY Percent of teens reporting that they were hit, slapped, or physically hurt by boyfriend/girlfriend. YRBS
CHILD ABUSE AND NEGLECT / SCHOOL SAFETY / BULLYING HI Rate of confirmed child abuse/neglect reports per 1,000 for children aged 0 5 years. Agency data
KY Proportion of Kentucky children birth to 5 years of age who die from child abuse. Agency data
LA Rate of children (per 1,000) under 18 who have been abused or neglected. Agency data
ME The rate of substantiated cases of child abuse and neglect assessed by Maine’s Office of Child and Family Services. Agency data
MN Incidence rate of child maltreatment reports per 1,000 children ages birth through 17 years. Agency data
NE The rate per 1,000 infants of substantiated reports of child abuse and neglect. Agency data
PW To increase the rate of children who are victims of abuse and neglect that receive appropriate and comprehensive services Agency data
AK Rate of reports of maltreatment per thousand children 0 ‐ 14 years of age SCAN
Performance Measures Linked to Priority Needs for Injury Prevention

16
STATE STATE PERFORMANCE MEASURE DATA SOURCE
CHILD ABUSE AND NEGLECT / SCHOOL SAFETY / BULLYING ‐ continued
VA Percent of 9‐12th graders who have ever been bullied on school property during past 12 months VA Youth Survey
DC Percentage of high school students who were in a physical fight on school property one or more times in the past 12 months. YRBS
MA The percentage of high school students having missed a school day due to feeling unsafe at or on the way to school. YRBS
MS Percent of students in grades 9‐12 who had ever been bullied on school property during the past 12 months. YRBS
ND Reduce the percent of students who were bullied on school property during the past 12 months. YRBS
AL The degree to which the Bureau of Family Health Services promotes a positive youth development model. State checklist
SUICIDE PW To reduce the rate of suicide ideation for adolescents 11 to 19 year olds. School data
ME The rate of suicide deaths (per 100,000) among those age 20‐44 years. Vital records
GU By 2014, decrease the rate of suicide among children and adolescents (ages 10‐19 years) by 50%. Vital records
INTENTIONAL AND UNINTENTIONAL INJURY IN GENERAL
PR The rate per 100,000 of emergency room visits due to all unintentional injuries among children aged 1 to 14 years.
Health insurance data
AZ Emergency department visits for unintentional injuries per 100,000 children age 1‐14. Hospital data
VA Rate of childhood injury hospitalizations per 100,000 children ages 0‐19 Hospital data
IA Rate of hospitalizations due to unintentional injuries among children ages 0‐14 years Hospital data
NV Decrease the percent of children and youth ages birth through 18 who die from unintentional injuries.
Injury data
PA The death rate per 100,000 due to unintentional injuries among children aged 19 years and younger Vital records
SD Accidental death rate (per 100,000) among adolescents aged 15 through 19 years Vital records
TN Reduce unintentional injury death in children and young people ages 0‐24 Vital records
WY Rate of deaths (per 100,000) to children and youth ages 0‐24 due to unintentional injuries. Vital records
DE The mortality rate among children and youth (0‐21 years) due to unintentional injuries. Vital records
MT The rate of death to children 0 through 17 years of age caused by unintentional injuries. Vital records
ND The rate of deaths to individuals ages 1 through 24 caused by intentional and unintentional injuries per 100,000 individuals. Vital records
MOTOR VEHICLE CRASH AND OTHER SPECIFIC UNINTENTIONAL INJURIES
ME The hospitalization rate (per 10,000) of unintentional poisonings among children and youth age 0‐24 years.
Hospital data
GA Deaths to children ages 15 ‐ 17 years caused by motor vehicle crashes per 100,000 children Vital records
CO Motor vehicle death rate for teens ages 15‐19 years old. Vital records
NH The rate (per 100,000) of emergency department visits among youths aged 15‐19 resulting from being an occupant in a motor vehicle crash Vital records
MA The rate (per 100,000) of motor vehicle deaths among youth aged 15‐24 years. Vital records
WV Decrease the number of high school students who never or rarely wear a seatbelt when riding in a car driven by someone else. YRBS
WV Decrease the percentage of high school students who drink alcohol and drive. YRBS
OTHER
ME The percent of women with depressive symptoms receiving medication or treatment for a mental health or emotional condition by a doctor or other healthcare provider. BRFSS
LA Percent of African American women who most often lay their baby on his or her back to sleep. PRAMS
FL The percentage of infants not bed sharing. PRAMS
FL The percentage of infants back sleeping. PRAMS
OK Percent of infants who are put to sleep on their backs PRAMSBRFSS=Behavioral Risk Factor Surveillance System PRAMS=Pregnancy Risk Assessment Monitoring System SCAN=Surveillance of Child Abuse and Neglect YRBS=Youth Risk Behavior Survey

17
Summary of Measures Most Commonly Used by States
SPMs* • 32 States have at least one; 7 States have two or more
• Many risk behavior SPMs target smoking among adolescents and among women. Alcohol and illicit drug use are also targeted.
• Use national datasets (PRAMS, YRBS, BRFSS)
NPMs • 17 States use at least one; 7 states use more than one.
• NPM #15: Smoking during pregnancy 14 Priority Needs
NOMs Used infrequently
HSIs Used infrequently
HSCIs` Used infrequently
*Some SPMs linked to a priority need may measure another component of a broadly worded or comprehensive priority.
State Performance Measures in Detail STATE STATE PERFORMANCE MEASURE DATA SOURCE
SMOKING AR Percentage of women aged 18‐44 years who report being current smokers. BRFSS
MO Percentage of women aged 18‐44 years who are current cigarette smokers BRFSS
IN Percentage of pregnant women on Medicaid who smoke. Multiple datasets
WV Decrease percentage of pregnant women who smoke within the last 3 months of their pregnancy. PRAMS
MT The percent of women who smoke during pregnancy Vital records
WY Percent of infants born to women who smoked during pregnancy. Vital records
DE The percent of Delaware public high school students who currently smoke. YRBS
MO Percent of cigarette smoking among high school students. YRBS
MS Percent of students in grades 9‐12 who reported current cigarette use, current smokeless tobacco use, or current cigar use. YRBS
OK The percent of adolescents grades 9‐12 smoking tobacco products YRBS
PW The percentage of children and adolescents ages 18 and under who report using (smoke and/or chew) tobacco products in the past 30 days. YRBS
RI Percent of middle school students who have initiated tobacco use. YRBS
SD Percent of high school youth who self‐report tobacco use in the past 30 days. YRBS
UT The percentage of students who smoked cigarettes; smoked cigars, cigarillos, or little cigars; or used chewing tobacco, snuff, or dip on at least 1 day during the 30 days before the survey. YRBS
WV Decrease the percentage of high school students who smoke cigarettes daily. YRBS
KY Percent of KY high school students who smoked cigarettes on one or more of the past thirty days. YRBS, YTS
NY Percent of High School Students Who Smoked Cigarettes in the Last Month YTS
ALCOHOL AND/OR ILLICIT DRUGS
OR Percent of 11th grade students who were 14 years old or younger when they had more than a sip or two of beer, wine, or hard liquor for the first time
Healthy Teens Survey
NH Percent of 18‐25 year olds reporting binge alcohol use in the past month NSDUH
HI Percent of women who report use of alcohol during pregnancy. PRAMS
MD Percent of women reporting alcohol use in the last three months of pregnancy PRAMS
AK Percent of women who recently delivered a live‐born infant and reported having one or more alcoholic drinks in an average week during the last 3 months of pregnancy. PRAMS
KY Percent of 12‐17 year old Kentucky residents reporting illicit drug use in the past month. NSDUH
MA The percentage of adolescents reporting no current use (in past 30 days) of either alcohol or illicit drugs. MA YHS
MS Percent of students in grades 9‐12 who reported current alcohol, marijuana or cocaine use. YRBS
WV Decrease the percentage of high school students who drink alcohol and drive. YRBS
Performance Measures Linked to Priority Needs for Risk Behavior Reduction

18
STATE STATE PERFORMANCE MEASURE DATA SOURCE
ALCOHOL AND/OR ILLICIT DRUGS ‐ continued NM Decrease the percent of middle school students that report using alcohol within the past 30 days. YRBS
KS The percent of students who had at least one drink of alcohol on at least one day during the previous 30 days. YRBS
NE Percent of teens who report use of alcohol in last 30 days YRBS
UNHEALTHY EATING TN Reduce the percentage of obesity and overweight among Tennessee K‐12 students Agency Data
NV Decrease the percent of women, ages 18 to 44, who are obese. BRFSS
SD Percent of school‐aged children and adolescents with a Body Mass Index (BMI) at or above the 95th percentile. School data
NV Decrease the percentage of at‐risk for overweight and overweight children in NV public schools. YRBS
OTHER RISK BEHAVIORS, E.G., SEXUAL RISK, MP The rate of birth (per 1,000) for Chamorro teenagers aged 15 through 18 years. Agency data
WA Percent of households with children (0‐18yrs) in which the reporting adult has an Adverse Childhood Experience (ACE) score of 3 or more. BRFSS
NM Reduce the proportion of women who report being physically abused by husband or partner during pregnancy. PRAMS
AL The degree to which the Bureau of Family Health Services promotes a positive youth development model. State checklist
MA The rate (per 100,000) of motor vehicle deaths among youth aged 15‐24 years. Vital records
SD Accidental death rate (per 100,000) among adolescents aged 15 through 19 years Vital records
IN Percentage of high school students who become infected with STI Agency data
MS Rate of Chlamydia, gonorrhea, and syphilis cases per 100,000 women aged 13‐44 years. Agency data
MI Rate per 100,000 of Chlamydia cases among 15‐19 year‐ olds Agency data
MH To reduce the rates of sexually transmitted diseases among women of child bearing age Agency data
NE The percentage of live births that were intended at the time of conception. PRAMS
NM Reduce unintended pregnancy in New Mexico to less than 30% of births PRAMSBRFSS=Behavioral Risk Factor Surveillance System YHS=Youth Health Survey NSDUH=National Survey on Drug Use and Health YRBS=Youth Risk Behavior Survey PRAMS=Pregnancy Risk Assessment Monitoring System YTS=Youth Tobacco Survey

19
Summary of Measures Most Commonly Used by States
SPMs* • 27 States have at least one; 8 States have two or more
• Pre‐ or interconceptional health care priorities are the focus of many SPMs and focus on improving health status or health behavior by measuring changes in weight, use of alcohol or tobacco, or multivitamin use, for example. Measures for comprehensive preconceptional care are rare.
• Use national datasets (PRAMS), vital records, and agency data
NPMs • 15 States use at least one; 7 States use more than one.
• NPM #18: Prenatal care beginning in first trimester 12 priority needs
• NPM #15: Smoking during pregnancy 9 priority needs
NOMs Used infrequently
HSIs Used infrequently
HSCIs • HSCI #4: observed to expected prenatal care visits 6 priority needs
*Some SPMs linked to a priority need may measure another component of a broadly worded or comprehensive priority.
State Performance Measures in Detail STATE STATE PERFORMANCE MEASURE DATA SOURCE PRENATAL CARE PW Percent of pregnant women entering prenatal care in the first trimester Agency data
VI Increase the rate of pregnant women who enroll in prenatal care in the first trimester. DoH data
ID Percent of pregnant women 18 and older who received dental care during pregnancy. ID PRATS
MH To increase the percentage of mothers who access prenatal care in the first trimester of pregnancy. MCH Program
AS Percent of pregnant women who receive adequate prenatal care based on the Kotelchuck Index. Postpartum records
GU By 2014, increase early entry into prenatal care by the 1st trimester to 75% of pregnant women. Vital records
IN The percent of black women (15 thru 44) with a live birth whose prenatal visits were adequate. Vital records
KS The percent of women who receive prenatal care beginning in the first trimester of pregnancy with health insurance. Vital records
NY The percentage of infants born to Black and Hispanic women receiving prenatal care beginning in the first trimester. Vital records
PA Percent of women (15 through 44) with a live birth whose observed to expected prenatal visits are greater than or equal to 80% on the Kotelchuck index.
Vital records
MP Percent of pregnant women enrolled in the Medicaid Program receiving prenatal care beginning in the first trimester. Vital records
PRECONCEPTION OR INTERCONCEPTION HEALTH AND CARE
FM Percent of women of child‐bearing age who attended workshops in the schools and communities during the reporting period. Agency data
IA Percent of family planning clients (women and men) who are counseled about developing a reproductive life plan. Ahlers database
PR The prevalence at birth of neural tube defects (NTD's) Birth defects surveillance
CA The percent of women of reproductive age who are obese. BRFSS
CO Percent of sexually active women and men ages 18‐44 years using an effective method of birth control to prevent pregnancy. BRFSS
PR The proportion of women of childbearing age consuming folic acid ESMIPR
ID Percent of women 18 and older who regularly (4 or more times per week) took a multivitamin in the month prior to getting pregnant. ID PRATS
ID Percent of women 18 and older who gave birth and drank alcohol in the 3 months prior to pregnancy. ID PRATS
Measures Linked to Priority Needs for Prenatal, Pre‐ and Interconceptional Care

20
STATE STATE PERFORMANCE MEASURE DATA SOURCE PRECONCEPTION OR INTERCONCEPTION HEALTH AND CARE ‐ continued
MT The percent of Medicaid clients who have gestational diabetes and have their blood glucose measured during the time period of six weeks to six months postpartum. Medicaid data
CA The percent of women with a recent live birth who reported binge drinking during the three months prior to pregnancy. MIHA
FL
The percentage of women having a live birth who received preconception counseling about healthy lifestyle behaviors and prevention strategies from a health care provider prior to pregnancy. PRAMS
GA Percent of women of reproductive age who consume an appropriate amount of folic acid prior to pregnancy PRAMS
MD Percent of pregnancies that are unintended PRAMS
LA Percent of women who use alcohol during pregnancy. PRAMS
LA Percent of women having a live birth who reported being told prior to pregnancy that they had Type 1 or Type 2 diabetes PRAMS
MD Percent of women reporting alcohol use in the last three months of pregnancy PRAMS
MO Percentage of women with a recent live birth who reported taking a multivitamin or a prenatal vitamin four or more times per week in the month prior to pregnancy PRAMS
NM Reduce the proportion of women who report being physically abused by husband or partner during pregnancy. PRAMS
OK The percentage of women receiving quality [American College of Obstetrics and Gynecology (ACOG) standards] preconception care. PRAMS
SC Increase the number of perinatal regions with an established pre/inter‐conception health coalition working to identify and address pre/interconception health needs of women. Program data
AZ The percent of women having a subsequent pregnancy during the inter‐pregnancy interval of 18‐59 months. Vital records
PRECONCEPTION OR INTERCONCEPTION HEALTH AND CARE CA The percent of women whose live birth occurred less than 24 months after a prior birth Vital records
CO Percent of live births to mothers who were overweight or obese based on BMI before pregnancy. Vital records
ID Percent of women 18 and older who fell into the “normal” weight category according to the body Mass Index (BMI=18.5 to 24.9) prior to pregnancy. Vital records
MO Percentage of live births to women who are prepregnancy overweight or obese Vital records
MS Percent of women having a live birth who had a previous preterm or small‐for‐gestational‐age infant. Vital records
AZ The percent of high school students who are overweight or obese. YRBS
OTHER MS Percent of infants born with birth weight less than 1,500 grams. Vital records
BRFSS=Behavioral Risk Factor Surveillance System ESMIPR= Estudio de Salud Materno Infantil de Puerto Rico MIHA= Maternal and Infant Health Assessment PRAMS=Pregnancy Risk Assessment Monitoring System PRATS=Pregnancy Risk Assessment Tracking System YRBS=Youth Risk Behavior Survey

21
Summary of Measures Most Commonly Used by States
SPMs* • 20 States have at least one; 2 States have two or more
• Birth rates SPMs are directed primarily at adolescents. Some SPMs measure pregnancy intendedness or interpregnancy interval.
• Use national datasets (PRAMS) and vital records.
NPMs • 17 States use at least one NPM; 1 State uses more than one.
• NPM #8: Adolescent pregnancy 16 Priority Needs
NOMs Not used
HSIs Used infrequently
HSCIs Not used
*Some SPMs linked to a priority need may measure another component of a broadly worded or comprehensive priority.
State Performance Measures in Detail
STATE STATE PERFORMANCE MEASURE DATA SOURCE ADOLESCENT PREGNANCY AR Rate of births per 1,000 for teenagers aged 18 through 19 years. Vital records
MS Rate of pregnancy per 1,000 female adolescents aged 15‐19 years. Vital records
DC Incidence of repeat teen births among girls less than 19 years of age. Vital records
MO Birth rate (per 1,000) among teenage girls aged 15‐19 years Vital records
PA Rate of pregnancy per 1,000 females ages 17 and under. Vital records
NY The ratio of the Hispanic teen (ages 15‐17) pregnancy rate to the non‐Hispanic White teen (ages 15‐17) pregnancy rate Vital records
MP The rate of birth (per 1,000) for Chamorro teenagers aged 15 through 18 years. Vital records
FL The percentage of teen births, ages 15‐17, that are subsequent (repeat) births. Vital records
ID Percent of 9th ‐ 12th grade students that report having engaged in sexual intercourse. YRBS
PREGNANCY INTENDEDNESS LA Percent of unintended pregnancies among women who had a live birth. PRAMS
MI Percent of pregnancies that are intended PRAMS
HI The percent of pregnancies (live births, fetal deaths, abortions) that are unintended. PRAMS
OK The percentage of women who have an unintended pregnancy (mistimed or unwanted) resulting in live birth. PRAMS
NE The percentage of live births that were intended at the time of conception. PRAMS
NM Reduce unintended pregnancy in New Mexico to less than 30% of births PRAMS
SD Percent of pregnancies which are unintended (mistimed or unwanted) and result in live birth or abortion.
PHRA, Vital records
INTERPREGNANCY INTERVAL FL The percentage of births with inter pregnancy interval less than 18 months. Vital records
LA Percent of women delivering a live birth in less than 24 calendar months of delivering a previous live birth. Vital records
IN The percentage of births that occur within 18 months of a previous birth to same birth mother. Vital records
OTHER
CO Percent of sexually active women and men ages 18‐44 years using an effective method of birth control to prevent pregnancy. BRFSS
AK Percent of women who recently delivered a live‐born infant and are not doing anything now to keep from getting pregnant. PRAMS
FM The rate of maternal deaths in the reporting year. Vital records
CO Percent of live births to mothers who were overweight or obese based on BMI before pregnancy. Vital records
BRFSS=Behavioral Risk Factor Surveillance System PHRA=Perinatal Health Risk Assessment PRAMS=Pregnancy Risk Assessment Monitoring System YRBS=Youth Risk Behavior Survey
Performance Measures Linked to Priority Needs for Pregnancy, Fertility, or Birth Rates

22
Summary of Measures Most Commonly Used by States
SPMs* • 30 States have at least one; 12 States have two or more
• Multiple outcomes for these measures: low birth weight, infant mortality, and maternal health.
• Use national datasets (PRAMS) and vital records.
NPMs • 19 States use at least one NPM; 14 States use more than one.
• NPM #17: VLBW births at appropriate facility 14 Priority Needs • NPM #18: Prenatal care in first trimester 13 Priority Needs • NPM #15: Smoking in pregnancy 12 Priority Needs • NPM #8: Adolescent pregnancy 8 Priority Needs • NPM #11: Breastfeeding at six months 6 Priority Needs • NPM #1: Timely follow‐up from newborn screening 5 Priority Needs
NOMs • NOM #1: Infant mortality rate 8 Priority Needs • NOM #2: Black:white infant mortality ratio 6 Priority Needs • NOM #3: Neonatal mortality rate 6 Priority Needs • NOM #4: Postneonatal mortality rate 5 Priority Needs • NOM #5: Perinatal mortality rate 4 Priority Needs
HSIs • HSI #1: Percent live births <2500gm 6 Priority Needs • HSI #2: Percent live births <1500gm 6 Priority Needs
HSCIs` • HSCI #4: Observed to expected prenatal visits 5 priority Needs • HSCI #5a‐d: Infant mortality, LBW, PNC – Medicaid vs NonMedicaid 7 Priority Needs
*Some SPMs linked to a priority need may measure another component of a broadly worded or comprehensive priority.
State Performance Measures in Detail STATE STATE PERFORMANCE MEASURE DATA SOURCE PRETERM/LBW BIRTHS DC Percent of preterm births. Vital records
DE The rate of live births at 32 to 36 weeks of gestation (preterm birth). Vital records
DE The rate of low birth weight and very low birth weight deliveries. Vital records
GA Percent of very low birth weight infants (<1,500 grams at birth) enrolled in First Care Vital records
IN Percentage of preterm births Vital records
KS The percent of live births that are born preterm less than 37 weeks of gestation. Vital records
KY Percent of singleton live births to Kentucky residents that are 34‐36 weeks (late preterm) at delivery.
Vital records
LA Percent of singleton live births delivered at 34‐36 weeks gestation. Vital records
MI Percent of low birth weight births (<2500 grams) among live births. Vital records
MI Percent of preterm births (<37 weeks gestation) among live births Vital records
MS Percent of infants born with birth weight less than 1,500 grams. Vital records
NJ The percentage of Black non‐Hispanic preterm infants in New Jersey Vital records
NY The ratio of the Black infant low birth weight rate to the White infant low birth weight rate Vital records
PR The percent of late preterm births (34‐36 weeks of gestation). Vital records
PW Percent of Pre‐term delivery Vital records
UT The percentage of live births born before 37 completed weeks gestation. Vital records
VA Percent of infants born preterm (gestational age less than 37 weeks) Vital records
INFANT MORTALITY
NC Number of children affected in substantiated reports of abuse and/or neglect as compared with previous years. Agency data
NJ The number of Regional MCH Consortia conducting community‐based Fetal and Infant Mortality Review (FIMR) Teams and implementing recommendations through a Community Action Team. Agency data
AL The degree to which statewide fetal and infant mortality review (FIMR) is implemented. FIMR
Performance Measures Linked to Priority Needs for Low Birth Weight & Infant Mortality

23
STATE STATE PERFORMANCE MEASURE DATA SOURCE INFANT MORTALITY ‐ continued SD Percent of infants exposed to secondhand smoke. PHRAS
AK Percent of women who recently had a live‐born infant and reported having one or more environmental factors in the home that are associated with SIDS/unexplained asphyxia. PRAMS
LA Percent of African American women who most often lay their baby on his or her back to sleep. PRAMS
OK Percent of infants who are put to sleep on their backs PRAMS
GU By 2014, decrease Guam Infant mortality rate to <7% Vital records
TN Reduce the infant mortality rate Vital records
DE The rate of infant deaths between birth and 1 year of life. Vital records
GA Infant mortality rate among infants born weighing 1,500 grams or more who survive past the first 27 days of life Vital records
IN Rate of suffocation deaths of infants. Vital records
MH To reduce the infant mortality rate Vital records
PA Black infant mortality rate per 1,000 live births. Vital records
SC Reduce the percent of combined infant deaths due to SIDS and accidents due to unsafe sleeping environments Vital records
WV Decrease the number of infant deaths due to SIDS/SUID. Vital records
MATERNAL HEALTH AND RISK BEHAVIORS CA The percent of women of reproductive age who are obese. BRFSS
NC Percent of women of childbearing age taking folic acid regularly. BRFSS
VA Percent of women ages 18‐44 who report good/very good/excellent health BRFSS
CA The percent of women with a recent live birth who reported binge drinking during the three months prior to pregnancy. MIHA
NC Percent of non‐pregnant women of reproductive age who are overweight/obese (BMI>26). NC PNSS
NC Percent of women with live, term births who gain within the Institute of Medicine (IOM) Recommended Weight Gain Ranges. NC PNSS
LA Percent of women who use alcohol during pregnancy. PRAMS
DC Prevalence of tobacco use among pregnant women. Vital records
MI Percent of singleton births by mother's BMI at start of pregnancy greater than 29.0 Vital records
MS
Percent of women having a live birth who had a previous preterm or small‐for‐gestational‐age infant. Vital records
NH Of women who had a preterm birth: Percent who reported smoking before pregnancy Vital Records
SD Percent of singleton birth mothers who achieve a recommended weight gain during pregnancy. Vital records
SD Percent of pregnant women aged 18 through 24 who smoked during pregnancy Vital records
LA Percent of Louisiana resident women giving birth who undergo screening for substance use, depression, and domestic violence using the SBIRT approved methods.
Vital records, NTI
WV Decrease the percentage of pregnant women who smoke within the last three months of their pregnancy.
Vital records, PRAMS
CARE FOR HEALTHY PREGNANCIES OK Percent of women receiving quality (ACOG stds) preconception care PRAMS
DC Percent of resident women who give birth with no prenatal care or no early entry into prenatal care by the 3rd trimester. Vital records
DC Percent of women who initiated care in the first trimester. (Kessner index) Vital records
PREGNANCY INTENDEDNESS / PREGNANCY SPACING IL Reduce the percentage of unintended pregnancies PRAMS
MI Percent of pregnancies that are intended PRAMS
NC
The percent of women responding to the Pregnancy Risk Assessment Monitoring System (PRAMS) survey that they either wanted to be pregnant later or not then or at any time in the future. PRAMS
CA The percent of women whose live birth occurred less than 24 months after a prior birth Vital records
OTHER
MI Proportion of the minority population served in publicly‐funded health programs in relation to the general minority population Agency data
BRFSS=Behavioral Risk Factor Surveillance System PHRAS=Perinatal Health Risk Assessment Survey FIMR=Fetal and Infant Mortality Review PNSS=Pregnancy Nutrition Surveillance System MIHA=Maternal and Infant Health Assessment PRAMS=Pregnancy Risk Assessment Monitoring System
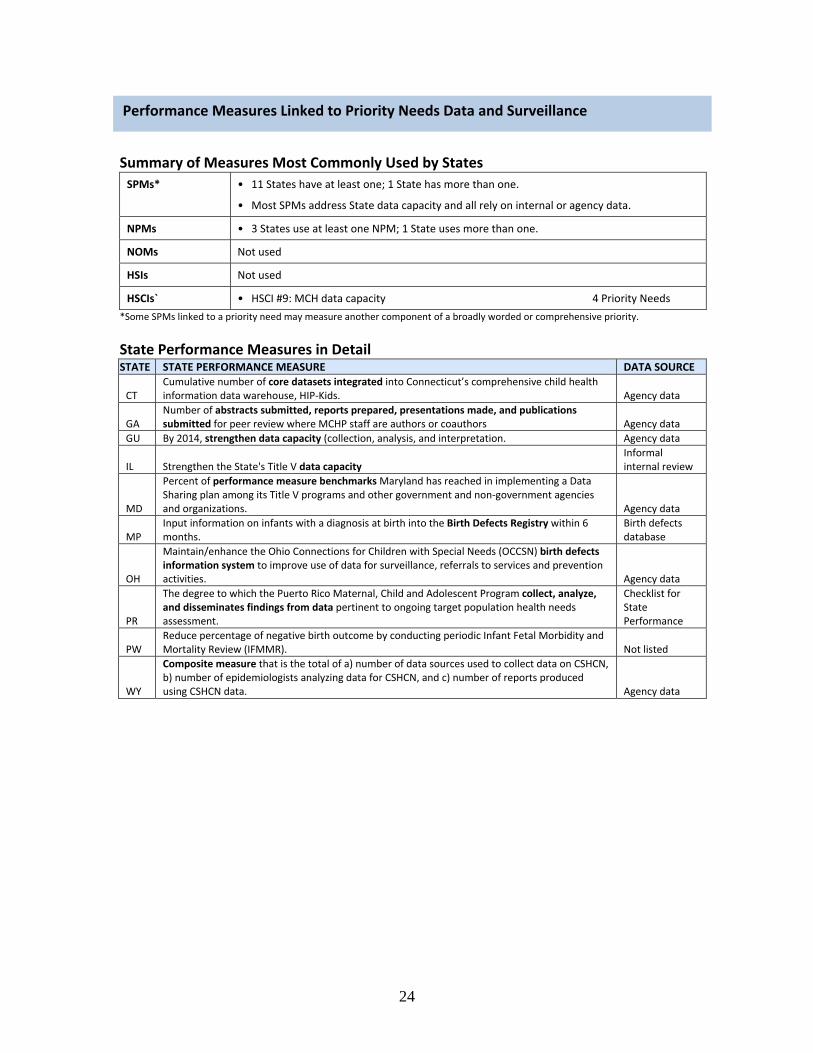
24
Summary of Measures Most Commonly Used by States
SPMs* • 11 States have at least one; 1 State has more than one.
• Most SPMs address State data capacity and all rely on internal or agency data.
NPMs • 3 States use at least one NPM; 1 State uses more than one.
NOMs Not used
HSIs Not used
HSCIs` • HSCI #9: MCH data capacity 4 Priority Needs
*Some SPMs linked to a priority need may measure another component of a broadly worded or comprehensive priority.
State Performance Measures in Detail STATE STATE PERFORMANCE MEASURE DATA SOURCE
CT Cumulative number of core datasets integrated into Connecticut’s comprehensive child health information data warehouse, HIP‐Kids. Agency data
GA Number of abstracts submitted, reports prepared, presentations made, and publications submitted for peer review where MCHP staff are authors or coauthors Agency data
GU By 2014, strengthen data capacity (collection, analysis, and interpretation. Agency data
IL Strengthen the State's Title V data capacity Informal internal review
MD
Percent of performance measure benchmarksMaryland has reached in implementing a Data Sharing plan among its Title V programs and other government and non‐government agencies and organizations. Agency data
MP Input information on infants with a diagnosis at birth into the Birth Defects Registry within 6 months.
Birth defects database
OH
Maintain/enhance the Ohio Connections for Children with Special Needs (OCCSN) birth defects information system to improve use of data for surveillance, referrals to services and prevention activities. Agency data
PR
The degree to which the Puerto Rico Maternal, Child and Adolescent Program collect, analyze, and disseminates findings from data pertinent to ongoing target population health needs assessment.
Checklist for State Performance
PW Reduce percentage of negative birth outcome by conducting periodic Infant Fetal Morbidity and Mortality Review (IFMMR). Not listed
WY
Composite measure that is the total of a) number of data sources used to collect data on CSHCN, b) number of epidemiologists analyzing data for CSHCN, and c) number of reports produced using CSHCN data. Agency data
Performance Measures Linked to Priority Needs Data and Surveillance
25
PRIORITY NEEDS RELATED TO SPECIFIC HEALTH PROBLEMS, HEALTH CARE NEEDS AND MCH
POPULATIONS
This appendix includes details on the number of States with priority needs in broad categories and specific categories of need. The information includes comparison over the three needs assessment periods, 2000, 2005 and 2010.
APPENDIX B

26
IMPROVED HEATLH AND HEALTH CARE
HEALTH IN GENERAL OR ACCESS TO HEALTH CARE
Improving health in general or access to health care in general as a means to improve health remains a common priority need for Title V grantees. While virtually all priority needs have a goal of health improvement, priority needs statements in this category include those that specifically state health and wellbeing or access to care as goals. The number of grantees with these stated priorities increased in 2005 but decreased in the most recent year. In all years, States were more likely to frame these priorities in terms of improving access (process) rather than improving health (outcome.)
The number of States with a priority need to ensure a medical home or care coordination increased notably during the 2005 needs assessment process but decreased in the most recent time period. An increased focus on medical homes and care coordination for all MCH populations, not just children with special health care needs, continues in the most recent period.
A specific focus on disparity reduction, often stated in terms of improving outcomes for specific populations, was included less often in 2010.
Year 2000 Year 2005 Year 2010 # of States of 59 # of States of 59 # of States of 59
Improving Health OR Access to Care 39 46 31
Improving Health 17 21 11 Improving Access to Health Care 34 37 29
Medical Home OR Care Coordination 18 29 21
Disparity Reduction 28 26 20
Examples of priority needs include:
Improving health
• “More children should be in good health, be safe and be protected” (AZ) • “Improve the Health of Children and Adolescents” (MN) • “Pregnant women and young children thrive” (VT)
Improving access to care
• “Women of child bearing age should have access to preventive health care” (AZ) • “Increase access to health care for the maternal and child health population, including children with special health care needs” (FL)
• “Increase access to care for women, children, and families” (NC)
Medical home OR care coordination
• “Increase care coordination among children with special health care needs” (LA) • “Increase the number of women, children, and families who receive preventive and treatment health services within a medical home.” (WI)
Disparity reduction
• “Eliminate racial/ethnic, immigrant status and class disparities in birth outcomes” (DC) • “To improve access to early, adequate and high quality prenatal care, with a specific focus on eliminating health disparities” (NY)

27
ORAL HEALTH OR ACCESS TO ORAL HEALTH CARE
Improving oral health continues to be a priority need for more than one‐half of grantees. Priority needs are most often stated in terms of access to care.
Year 2000 Year 2005 Year 2010 # of States of 59 # of States of 59 # of States of 59
Oral Health Or Access to Oral Health Care 34 35 32
Improving Access to Oral Health Care 24 22 23
Improving Oral Health 13 13 11
Examples of priority needs include:
Improving oral health
• “Improve oral health” (GA) • “Reduce and Prevent Oral Health Conditions among MCH Populations” (MO) • “Decreasing dental caries in children” (AS)
Improving access to oral health care
• “Increase access to oral health services, providers, facilities, resources, and payer sources among the MCH populations” (NV)
• “Address the oral health needs of the MCH population through prevention, screening, referral, and appropriate treatment” (IL)
• “Reduce the percentage of children and adolescents who need oral health care and do not receive it” (OH)

28
MENTAL/BEHAVIORAL HEALTH AND ACCESS TO CARE
An increased emphasis on mental or behavioral health and health care noted in the 2005 needs assessments has continued in 2010. The focus of identified mental health priorities also changed from 2000 with a constant number of States framing priorities in terms of access to care but an increasing number of States framing priorities in terms of improving health. This focus on health rather than health care is in contrast to other categories such as oral health care and may relate to States’ ability to measure mental health using national surveys such as BRFSS and PRAMS. Although still small, the number of States identifying depression as a target issue has increased, with most States targeting women particularly in the perinatal period.
Year 2000 Year 2005 Year 2010 # of States of 59 # of States of 59 # of States of 59
Mental/Behavioral Health Or Access to 17 31 30 Mental/Behavioral Health Care
Improving Access to Mental/ 14 17 16 Behavioral Health Care
Improving Mental/Behavioral Health 4 17 21
Depression 0 4 8
Examples of priority needs include:
Improving mental or behavioral health
• “Improve the behavioral health of women and children” (AZ) • “Improving mental health status” (WA)
Depression
• “Establish a system to better identify, screen and refer for maternal depression” (MI) • “Increase universal screening for post partum depression in women” (AK)
Improving access to mental or behavioral health care
• “Establish an integrated system of comprehensive mental health services for children in Iowa” (IA)
• “Increase capacity of community‐based medical home providers to detect and refer for treatment women, children, and youth with emotional and behavioral health conditions” (NE)
• “Improve Mental/Behavioral Health Services” (CT)

29
SPECIALISTS, SCREENING, IMMUNIZATIONS, AND OTHER CARE
More States identified specialist care as a priority in 2010. Two specific types of specialty care increased over the three time periods. Developmental screening and/or early intervention services were identified by twice as many States in 2010 compared to 2000. Similarly, a priority need for transition care, primarily for CSHCN, was identified by more than twice as many States in 2010 compared to 2000. Transition care priorities have been increasing steadily over the three time periods. Other priorities in this category include immunizations and pediatric specialists which have been consistently identified by a small number of States. Cancer screening, lead screening, home visiting, and follow‐up to newborn screening are among the other specialty care priorities identified.
Year 2000 Year 2005 Year 2010 # of States of 59 # of States of 59 # of States of 59
Any Specialist, Screening or Other Care 35 32 44
Developmental Screening / 6 5 13 Early Intervention
Transition Care 8 13 19
Immunizations 8 6 6
Specialists 6 4 4
Examples of priority needs include:
Developmental screening/Early intervention
• “Developmental delay in early childhood should be identified early and appropriate intervention services should be provided to children at risk of developmental delay.” (DE)
• “Ensure that all children 0‐3 years who are developmentally delayed, or biologically or environmentally at‐risk receive needed early intervention services” (HI)
• “Increase access to early intervention services and developmental screening within the context of a medical home for children” (MI)
Transition Care
• “Improve supports for the successful transition of youth with special health needs to adulthood” (MA)
• “Kansas CYSHCN need early transition planning and services necessary to achieve maximum potential in all aspects of adult life, including health care, work and independence” (KS)
• “Increase successful transition of special needs children from pediatric/adolescent to adult health care systems” (OH)
Immunizations
• “Improve immunization rates for all children” (CO) • “Eliminate vaccine‐preventable diseases” (NC) • “Increase the number of children who receive the recommended varicella vaccine” (MT)
Specialists
• “Assure access to pediatric specialty care for all children” (IA) • “Improve access to medical specialists for CSHCNs” (ID) • “To improve geographic access to pediatric specialty care providers” (ND)

30
HEALTHY LIVING HEALTHY LIFESTYLES IN GENERAL / NUTRITION, EXERCISE AND WEIGHT
Recognition of the importance of healthy lifestyles was evident in the notable increase from 2000 to 2005 in the number of States with healthy lifestyles as a priority need. States have continued to address this important priority in their most recent specification of priority needs and two more States have included healthy lifestyles in their list of priority needs. The most common approaches to promoting healthy lifestyle included programs to reduce overweight and obesity. Priorities that take a more proactive approach, i.e., programs to promote nutrition and exercise, are cited less frequently but have also increased in number since 2000. Breastfeeding is included in this category as States seek to improve health behaviors across the lifespan. This category does not include other negative health behaviors such as substance use. Trends in that area are described later.
Year 2000 Year 2005 Year 2010 # of States of 59 # of States of 59 # of States of 59
Healthy Lifestyles – any focus 30 48 50
Obesity and Overweight 10 34 35
Nutrition and/or Exercise 17 20 20
Breastfeeding 6 12 13
Examples of priority needs include:
Healthy Lifestyles – any focus
• “Promote healthy lifestyle practices among children and adolescents with emphasis on smoking prevention, adequate nutrition, regular physical activity, and oral health” (CA)
• “To increase the number of children and adolescents who make healthy lifestyle choices for themselves.” (TX)
Nutrition and/or exercise
• “Increase proper nutrition and physical activity, particularly among children and adolescents” (KS)
• “Promote nutrition and exercise to reduce obesity” (CT)
Obesity and overweight
• “The prevalence of childhood overweight and obesity will be reduced” (VT) • “Reduce Obesity among Children, Adolescents and Women” (MO) • “Reduce Obesity Across the Lifespan: Promote needed actions to reduce overweight and obesity among children and adolescents and adults ” (MD)
Breastfeeding
• “Promote healthy nutrition and physical activity among MCAH populations throughout the lifespan beginning with exclusive breastfeeding of infants to six months of age.” (CA)
• “Support behaviors and environments that encourage initiation and extend duration of breastfeeding.” (WY)

31
INJURY PREVENTION
The number of States with a priority need to address any type of injury dropped in 2005 but increased modestly in 2010. States with specific injury prevention goals are more likely to target intentional injury without specifying any particular injury. The number of States with a priority need to reduce motor vehicle crash injuries doubled over the ten years but was still a small number of States. Most priorities regarding unintentional injuries did not target specific injuries although falls and home safety issues were mentioned.
Year 2000 Year 2005 Year 2010 # of States of 59 # of States of 59 # of States of 59
Any Injury 41 34 37
Intentional Injury – any type 32 26 24
Suicide 9 7 6 Domestic/Intimate Partner Violence 10 9 8 Child Abuse or Maltreatment 11 8 8
Unintentional Injury – any type 14 19 20
Motor Vehicle Crash 3 4 6
Examples of priority needs include:
Any injury
• “Reduce the rates of childhood injury” (MI) • “Reduce preventable injuries to children and adolescents” (DE)
Intentional Injury
• “Intentional injury needs to be reduced, especially suicide rates of adolescents in the state” (UT)
• “Reduce suicide and self‐inflicted injury in the maternal and child population in Maine” (ME) • “Decrease the incidence of domestic violence among women of child‐bearing age” (NV) • “Reduce the rate of substantiated incidence of child abuse, neglect or dependency” (KY) Unintentional Injury
• “Reduce the number of unintentional injuries to children” (AR) • “Increase the integration of unintentional injury prevention into relevant MCH programs” (MA) • “Reduce rates of child and adolescent motor vehicle injury and death” (CO) • “Decrease the incidence of fatal accidents caused by drinking and driving” (WY)

32
RISK BEHAVIOR INCLUDING LEGAL AND ILLEGAL SUBSTANCE USE
Reducing risk behavior in general has been a priority need for many States since the 2000 needs assessment but the number has decreased steadily. Some States write broad risk behavior reduction statements. The number targeting substance use has decreased since 2000. Mention of or a focus on alcohol and illegal substances was consistent but less common than a focus on tobacco. Most States with this priority need were very specific as is seen in the examples below. States might also include substance use or abuse in a list of behaviors to address in a comprehensive priority need to promote healthy lifestyles. Reducing injury risk is also included in risk reduction priority needs and counts of States with injury priority needs are included in the previous section. Year 2000 Year 2005 Year 2010 # of States of 59 # of States of 59 # of States of 59
Risk Behavior in General 41 39 34 Any Substance Use 35 28 23
Tobacco Use 29 23 21
Alcohol Use 14 12 13
Drug/Substance Use 17 15 13
Examples of priority needs include:
Risk behavior
• “Assess the adolescent population risk behaviors and design interventions to target this population with input from teenagers and parents of targeted groups” (ID)
• “Reduction of Adolescent Risk Taking Behaviors” (NJ) Any substance use
• “Reduce drug, alcohol and tobacco use” (MN) • “To decrease the use and abuse of alcohol, tobacco and other substances among youth, pregnant women and families” (NH)
• “Youth and maternal rates of alcohol and tobacco use will be reduced” (VT)
Alcohol
• “To reduce the use of alcohol by children and pregnant women” (NY) • “Reduce alcohol use and binge drinking among youth.” (NE)
Tobacco
• “To reduce the number of women smoking during pregnancy due to its effect on low birth weight infants” (WV)
• “The prevalence of smoking among teens should be reduced” (DE)
Drug/Substance
• “Reduce the percent of adolescents aged 12 through 17 with substance use/abuse” (GU) • “Prevent substance use in MCH populations” (MT)

33
HEALTHY PREGNANCIES PRENATAL, PRECONCEPTIONAL AND INTERCONCEPTIONAL HEALTH CARE
States may single out prenatal care as a priority need or may specifically include prenatal care in a priority need to expand overall access to care. There have been only modest changes in the number of States with a priority need to address prenatal care over the 10‐year time period. Addressing the need for preconceptional and interconceptional care increased notably from 2000 to 2005 but less since then. In order to be counted in this category priority needs statements needed to include the term preconceptional or interconceptional health or indicate improvement of health to improve pregnancy outcomes. Priority needs designed to address the overall health of women or women of childbearing age specifically with or without a stated goal to improve pregnancy outcomes would not be included.
Year 2000 Year 2005 Year 2010 # of States of 59 # of States of 59 # of States of 59
All Healthy Pregnancy Care Types Combined 20 23 28 Prenatal Care 17 14 15 Pre‐ or Interconceptional Care 3 12 18
Examples of priority needs include: Prenatal care
• “Assure access to prenatal care, especially for low income, minority, and immigrant populations” (AL)
• ”To increase the percentage of women receiving adequate prenatal care” (FM) • “To improve access to early, adequate and high quality prenatal care, with a specific focus on eliminating health disparities” (NY)
Preconceptional or Interconceptional care
• “Increase access to preconceptional and interconceptional care” (SC) • “Improve preconception and interconception health among Louisiana women” (LA) • “Improve preconceptional and interconceptional health and well‐being” (FL)

34
PREGNANCY, FERTILITY OR BIRTH RATES Care for pregnant women and their infants is a long‐standing focus of Maternal and Child Health programs and priority needs targeting mothers and infants were included by almost all grantees. Priority needs regarding pregnancy, fertility or birth rates were included by 60% of grantees in 2000 but by fewer grantees in 2010. The number of States with a priority need to address unintendedness of pregnancy dropped in half over the past 10 years.
Year 2000 Year 2005 Year 2010 # of States of 59 # of States of 59 # of States of 59
Pregnancy, Fertility or Birth Rate 36 26 25
Unintended Pregnancy Rates 22 16 11
Pregnancy Spacing/Repeat Pregnancy 3 4 2
Examples of priority needs include:
Pregnancy, fertility or birth rates
• “To lower the birth rate among Chamorro teenagers aged 15‐18” (MP) • “To reduce teen pregnancies” (PR)
Unintended pregnancy rates
• “Reduce teen pregnancy and unintended pregnancy in women of all ages” (CO) • “Reduce unwanted, unplanned pregnancies” (OK)
Pregnancy spacing/repeat pregnancies
• “Reduce repeat teen births” (MS) • “Reduce unintended pregnancies and reduce births spaced at less than 24 months apart” (LA) • “To promote planned pregnancies and child spacing” (MN)

35
LOW BIRTH WEIGHT AND INFANT MORTALITY
As previously noted in most categories of priority needs statements, grantees phrase their priorities in terms of outcomes or process. While some States focus on care for healthy pregnancies, others focus on ensuring healthy pregnancy outcomes. The number of States with priority needs to reduce low birth weight and infant mortality has been relatively stable over the 10‐year period. There has been an increase in the number of States identifying a need to improve breastfeeding rates, sometimes in conjunction with promoting healthy nutrition for all MCH populations.
Year 2000 Year 2005 Year 2010 # of States of 59 # of States of 59 # of States of 59
Low Birth Weight OR Infant Mortality 30 28 31
LBW, VLBW, Prematurity 17 13 13
Infant Mortality 26 23 24
Examples of priority needs include: Low birth weight and prematurity
• “To reduce the rate of low birth weight births” (MD) • “Addressing disparities in the rates of low birth weight and premature birth” (PA) • “Reduce the percentage of preterm births” (WY) Infant mortality
• “Reduce rates of infant mortality with an emphasis on eliminating racial/ethnic disparities” (NE)
• “Decrease infant mortality and morbidity in collaboration with regional coalitions comprised of public and private health and social service providers” (LA)
• “Reduce infant mortality” (NC)

36
BUILDING MCH CAPACITY DATA AND SURVEILLANCE
The number of States identifying a priority to improve data and surveillance capacity decreased by half from 2000 to 2005. Today the number of States is essentially unchanged from 2005 with 30% of States citing a priority for data to support program development and evaluation.
Year 2000 Year 2005 Year 2010 # of States of 59 # of States of 59 # of States of 59
Data and Surveillance 33 17 18
Examples of priority needs include: • “Improve the maternal and child health surveillance and evaluation infrastructure” (GA) • ” Create a unified data system and surveillance system to monitor services delivered to the MCH populations” (NV)
• “To improve birth outcome through routine and timely IFMMM review” (PW) • “To integrate information systems which facilitate early identification and provision of services to children with special health care needs” (IN)
• “Increase Surveillance and Reporting Rates for Asthma” (AK) • “Enhance data collection and dissemination efforts to promote evidence‐based decision making in planning, policy, evaluation, resource allocation, and accountability” (VA)

37
INCLUSION OF ALL TITLE V POPULATIONS IN PRIORITY NEEDS
Populations targeted were examined to determine if all MCH populations were included and if the health and health care issues for different populations has changed over time. The majority of grantees included priority needs for mothers and infants and children. About three‐quarters included priority needs specifically targeting children with special health care needs. Those that did not specifically cite these populations could have included them in generally stated priority needs and would be counted in the all populations category, e.g., “improve access to oral health services.” An increasing number of grantees specify priority needs targeting women or women of childbearing age. With the exception of pre‐ and interconceptional care, the focus of needs for women mimics that of other population and includes, for example, healthy lifestyles and access to care.
Year 2000 Year 2005 Year 2010 Number of States Number of States Number of States (of 59) (of 59) (of 59)
Core MCH Populations Maternal and Infant 53 55 53
Children (including adolescents) 57 56 56
Children with Special Health Care Needs 43 42 46
All populations (implied) 38 38 33
Subsets of Core MCH Populations
Adolescents 51 51 49
Parents or Families 22 21 20
Women including those of childbearing age 15 21 32
Other Populations
Citizens or Community 8 8 6

38
PRIORITY NEEDS ADDRESSING THE HEALTH OF CHILDREN
States with priority needs with children as the target population are included here. These priorities may include adolescents but were not focused solely on adolescents. Most States include a priority need to improve health or health care for children regardless of the year although there are small fluctuations from year to year. Addressing risk behavior or reducing injury is included by fewer States but also consistent over time. The most notable change in priorities for children occurred between 2000 and 2005 when the number of States with healthy lifestyle priorities almost doubled. That focus continues today.
Year 2000 Year 2005 Year 2010 # of States of 59 # of States of 59 # of States of 59
Health OR Health Care 45 41 42
Access to Care of Any Type 34 29 35
General Health and Wellbeing 22 21 17
Healthy Lifestyles Particularly 17 32 30 Nutrition, Exercise, Obesity Reduction
Reducing Risk Behavior or Injury 27 20 23
Other Priorities 16 10 12
Examples of priority needs for children include:
Access to care
• “Assure access to dental treatment services for children in Iowa.” (IA 2000) • “To assure that children and adolescents receive quality, comprehensive health care, including well child care, immunizations, and dental health care.” (MN 2005)
• “To prevent lead poisoning /exposure among children, and to screen and treat children for lead exposure and poisoning.” (MD 2000)
General health and wellbeing
• “Improve the health of children.” (CO 2005) • “Decrease morbidity due to chronic conditions in the pediatric population. (PR 2010)
Healthy lifestyles
• “Prevent overweight and obesity in children.” (HI 2000) • “Enhance nutrition and increase physical activity for children and youth through increased access to healthy foods and physical activity opportunities and through breastfeeding promotion.” (DC 2010)
Risk behavior or injury
• “Reduce the rate of child abuse and neglect.” (AK 2000) • “Reduce rates of fatal & non‐fatal unintentional injury among children and teens, with emphasis on interventions regarding injuries in motor vehicular crashes and home‐safety practices” (NM 2005)
Other priorities
• “Promote healthy schools and students who are ready to learn.” (NC 2005) • “Address environmental issue (asthma, lead, second‐hand smoke) affecting children, youth and pregnant women.” (MI 2010)

39
PRIORITY NEEDS ADDRESSING THE HEALTH OF ADOLESCENTS
Among priority needs with adolescents as the target (either specifically or as a subset of children), reduction of risk behavior or injury continues to be the most common focus for States. Priority needs for adolescent reproductive health, once a priority of almost one‐half of States, is now cited by only 18 States. The number of healthy lifestyle priority needs specifically targeting adolescents increased notably in 2005 but decreased in 2010.
Year 2000 Year 2005 Year 2010 # of States of 59 # of States of 59 # of States of 59
Health OR Health Care 16 21 21
Access to Care of Any Type 6 10 15
General Health and Wellbeing 14 14 6
Healthy Lifestyles Particularly 9 25 15 Nutrition, Exercise, Obesity Reduction
Reducing Risk Behavior or Injury 37 37 32
Reproductive Health 24 23 18
Other Priorities 2 8 11
Examples of priority needs include:
Risk Behavior or Injury
• “Reduce the rate of teen suicide.” (AK 2000) • “The incidence of unintentional injury and the mortality rate among children and youth should be reduced.” (DE 2010)
Reproductive Health
• “To reduce the rate of adolescent and unintended pregnancies..” (NY 2005) • “Reduce the rate of births to teen mothers in Kentucky.” (KY 2010)
Healthy Lifestyles
• “Increase proper nutrition and physical activity, particularly among children and adolescents.” (KS 2000)
• “The percent of Guam high school students who are overweight.” (GU 2010)
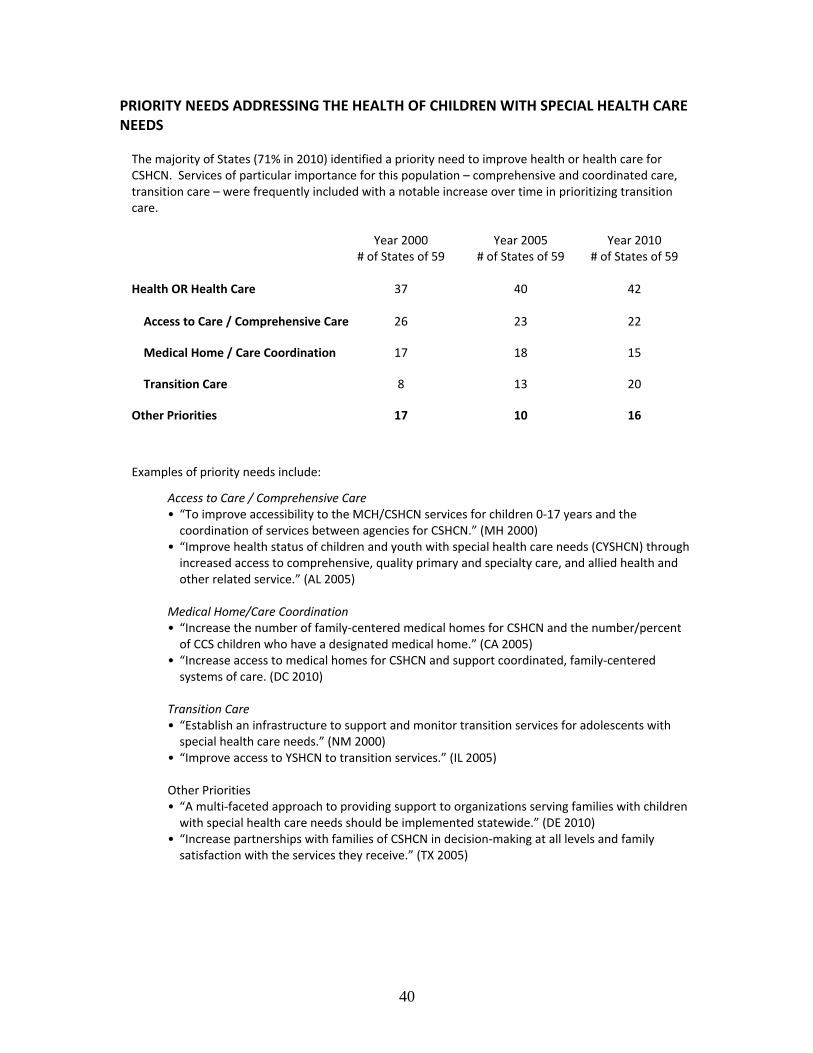
40
PRIORITY NEEDS ADDRESSING THE HEALTH OF CHILDREN WITH SPECIAL HEALTH CARE NEEDS The majority of States (71% in 2010) identified a priority need to improve health or health care for CSHCN. Services of particular importance for this population – comprehensive and coordinated care, transition care – were frequently included with a notable increase over time in prioritizing transition care.
Year 2000 Year 2005 Year 2010 # of States of 59 # of States of 59 # of States of 59
Health OR Health Care 37 40 42 Access to Care / Comprehensive Care 26 23 22
Medical Home / Care Coordination 17 18 15
Transition Care 8 13 20
Other Priorities 17 10 16
Examples of priority needs include:
Access to Care / Comprehensive Care
• “To improve accessibility to the MCH/CSHCN services for children 0‐17 years and the coordination of services between agencies for CSHCN.” (MH 2000)
• “Improve health status of children and youth with special health care needs (CYSHCN) through increased access to comprehensive, quality primary and specialty care, and allied health and other related service.” (AL 2005)
Medical Home/Care Coordination
• “Increase the number of family‐centered medical homes for CSHCN and the number/percent of CCS children who have a designated medical home.” (CA 2005)
• “Increase access to medical homes for CSHCN and support coordinated, family‐centered systems of care. (DC 2010)
Transition Care
• “Establish an infrastructure to support and monitor transition services for adolescents with special health care needs.” (NM 2000)
• “Improve access to YSHCN to transition services.” (IL 2005) Other Priorities • “A multi‐faceted approach to providing support to organizations serving families with children with special health care needs should be implemented statewide.” (DE 2010)
• “Increase partnerships with families of CSHCN in decision‐making at all levels and family satisfaction with the services they receive.” (TX 2005)