optimized and validated spectrophotometric determination ... · by october pharma drug company,...
TRANSCRIPT

Journal of Taibah University for Science 10 (2016) 26–37
Available online at www.sciencedirect.com
ScienceDirect
Optimized and validated spectrophotometric determination of twoantifungal drugs in pharmaceutical formulations using an ion-pair
complexation reaction
Ayman A. Gouda a,b,∗, Ragaa El Sheikh a, Alaa S. Amin c, Sara H. Ibrahim a
a Chemistry Department, Faculty of Science, Zagazig University, Zagazig, Egyptb Faculty of Public Health and Health Informatics, Umm AL-Qura University, Makkah, Saudi Arabia
c Chemistry Department, Faculty of Science, Benha University, Benha, Egypt
Available online 8 April 2015
Abstract
Simple, rapid, cost-effective, sensitive and extractive spectrophotometric methods were developed for the determination of twoantifungal drugs (i.e., sertaconazole nitrate (SER) and miconazole nitrate (MCO)) in pure and dosage forms. The methods are basedon the formation of ion-pair complexes between the drugs and acid dyes (i.e., bromocresol purple (BCP), bromophenol blue (BPB)and methyl orange (MO)) in acidic buffer solutions. The formed complexes were extracted with chloroform and measured at 410,416 and 427 nm for SER and at 408, 415 and 426 nm for MCO using BCP, BPB and MO, respectively. The analytical parametersand their effects on the reported systems were investigated. Beer’s law was obeyed in the 1.0–20 and 1.0–24 �g mL−1 ranges forSER and MCO, respectively. The composition of the ion pairs was determined to be 1:1. The molar absorptivity, Sandell sensitivity,limits of detection and limits of quantification were calculated. Other method validation parameters, such as precision, accuracy,robustness, ruggedness and selectivity, were satisfactory. The proposed methods have been successfully applied for the analysis of
the studied drugs in their pure and dosage forms. Statistical comparison of the results with the reference methods indicated excellentagreement and no significant difference in accuracy and precision.© 2015 The Authors. Production and hosting by Elsevier B.V. on behalf of Taibah University. This is an open access article underthe CC BY-NC-ND license (http://creativecommons.org/licenses/by-nc-nd/4.0/).complex
Keywords: Sertaconazole; Miconazole; Spectrophotometry; Ion pair∗ Corresponding author. Present address: Faculty of Public Healthand Health Informatics, Umm AL-Qura University, Makkah, SaudiArabia. Tel.: +20 552420204.
E-mail address: [email protected] (A.A. Gouda).Peer review under responsibility of Taibah University.
http://dx.doi.org/10.1016/j.jtusci.2015.02.0181658-3655 © 2015 The Authors. Production and hosting by Elsevier B.V. on
CC BY-NC-ND license (http://creativecommons.org/licenses/by-nc-nd/4.0/).
; Acid dyes; Pharmaceutical formulations
1. Introduction
Imidazole drugs are a group of antifungal drugs thathave broad-spectrum antifungal activities against a widerange of fungi that cause various mycotic infections[1]. The members of this group are structurally relatedand have similar physicochemical properties andmechanisms of action. The members of the imidazolegroup are miconazole (base or nitrate salt) and ser-
behalf of Taibah University. This is an open access article under the
taconazole (base or nitrate salt) [1]. Although thereare a number of imidazole drugs currently available,their efficacy may not be completely achieved for

A.A. Gouda et al. / Journal of Taibah University for Science 10 (2016) 26–37 27
e of the
twtiTadp1i
iocc[e[p
tpeprim
uarm
retpmbM
Fig. 1. Chemical structur
he treatment of human mycoses due to their poorater solubility and limited dissolution properties
hat are associated with slow drug absorption, lead-ng to inadequate and variable bioavailability [1,2].he chemical structures of the studied imidazolesntifungal drugs (i.e., sertaconazole (SER); (±)-1-{2,4-ichloro-�-[(7-chlorobenzo[b] thien-3-yl)methoxy]henethyl}imidazole nitrate and miconazole (MCO),-[2,4-dichloro-�-(2,4-dichlorobenzyloxy) phenethyl]midazole nitrate) are shown in Fig. 1.
A survey of the literature revealed that several analyt-cal methods have been reported for the determinationf the studied drugs in the pure drug form, pharmaceuti-al dosage forms and biological samples using liquidhromatography, either in single or combined form3–18], capillary zone electrophoresis methods [19],lectrochemical methods [20], non-aqueous titration2], spectrofluorimetric methods [16,21] and spectro-hotometric methods [21–32].
Visible spectrophotometry has remained competi-ive in the area of chromatographic techniques forharmaceutical analysis due to its simplicity and costffectiveness, sensitivity and selectivity, fair accuracy,recision and available in most quality control laborato-ies. In addition, this method does not require the costlynstrumentation that is required for the published HPLC
ethods.Extractive spectrophotometric procedures are pop-
lar due to their sensitivity in the assay of drugs,nd therefore, ion-pair extractive spectrophotometry haseceived considerable attention for the quantitative deter-ination of many pharmaceutical compounds [33–40].In the current study, the development of accurate,
eproducible, simple, precise, sensitive and economicalxtractive spectrophotometric method for the determina-ion of both antifungal drugs (SER and MCO) in their
ure and dosage forms was investigated based on the for-ation of chloroform soluble ion–associate complexesetween the studied drugs and acid dyes (BCP, BPB orO).
studied antifungal drugs.
2. Experimental
2.1. Apparatus
All of the absorption spectra were recorded ona Kontron Unikon 930 (UV–vis) spectrophotometer(Germany) equipped with 10 mm matched quartz cellsat a scanning speed of 200 nm/min and a band widthof 2.0 nm. The pH values of the various buffer solutionswere confirmed using a Hanna pH-metre instrument (pH211) (Romania) equipped with a combined glass calomelelectrode.
2.2. Materials and reagents
All of the chemicals and reagents were of analyticalgrade and used without further purification. In addition,all of the solutions were prepared fresh daily, and thewater was doubly distilled.
2.2.1. MaterialsPure grade sertaconazole nitrate (SER) was provided
by October Pharma Drug Company, Egypt, and themiconazol nitrate (MCO) working standard was suppliedby Amriya Pharmaceutical Industries Co., Egypt.
2.2.2. Pharmaceutical formulationsAll of the pharmaceutical preparations were obtained
from commercial sources in the local markets (i.e., Der-mofix cream labelled to contain 2.0 mg SER/g (OctoberPharma. Co., Egypt, Ferrer International, SA, Spain),Miconaz cream labelled to contain 2.0% MCO/15 g(Medical Union Pharmaceuticals, Abu-Sultan, Ismailia,Egypt), Micoban cream labelled to contain 2.0%MCO/15 g (Amriya Pharmaceutical Industries Co.,Egypt)).
2.2.3. Preparation of stock standard solutionsStock standard solutions with concentrations of
100 �g mL−1 and 1.0 × 10⁻³ mol L−1 of SER or MCO,
h Univ
28 A.A. Gouda et al. / Journal of Taibawere prepared by dissolving an exact mass of pure drugin bidistilled water containing a few drops of 0.1 mol L−1
hydrochloric acid and completed to 100 mL with bidis-tilled water. The standard solutions were stable for atleast one week without alteration when maintained inamber collared bottles and stored in a refrigerator whennot in use.
2.2.4. ReagentsBromocresol purple (BCP), bromophenol blue (BPB)
and methyl orange (MO) (BDH Chemicals Ltd., Poole,England) were used without further purification.
The stock solutions (1.0 × 10⁻³ mol L−1) of thereagents were prepared by dissolving the appropriateweight of each reagent in 10 mL of 96% ethanol followedby dilution to 100 mL with bidistilled water. These solu-tions were stable for at least 1 week when maintained inthe refrigerator.
A series of buffer solutions consisting of KCl–HCl(pH = 1.5–4.2), NaOAc–HCl (pH = 1.99–4.92),NaOAc–AcOH (pH = 3.0–5.6) and potassium hydrogenphthalate–HCl (pH = 2.0–7.0) were prepared accordingto previously published standard methods [41].
2.3. General procedures
2.3.1. For SERAliquots (0.1–2.4 mL) of the standard SER solution
(100 �g mL−1) were transferred to 10-mL measuringflasks, and 2.0 mL of acetate buffer at a pH of 3.0and 4.0 containing BCP, BPB or MO, respectively,were added. Then, 2.0 mL of the reagent solution(1.0 × 10⁻³ mol L−1) was added. The total volume ofeach solution was brought up to 10 mL with bidis-tilled water. The formed ion–associate complexes wereextracted twice with 10 mL of chloroform by shakingfor 2.0 min. Then, the solution was allowed to stand forclear separation of the two phases, and the chloroformlayer was passed through anhydrous sodium sulphate.The absorbance of the yellow collared complexes wasmeasured at 410, 416 and 427 nm using BCP, BPB andMO, respectively, against a corresponding reagent blankthat was similarly prepared. All of the measurementswere performed at room temperature (25 ± 2 ◦C). Theprocedures were repeated for other analyte aliquots, andcalibration plots were drawn to calculate the amount ofSER in the unknown analyte samples.
2.3.2. For MCOAliquots (0.1–2.0 mL) of the standard MCO solution
(100 �g mL−1) were transferred to 10 mL measuringflasks and 2.0 mL of acetate buffer at a pH of 3.0
ersity for Science 10 (2016) 26–37
containing BCP, BPB or MO, respectively, wereadded. Then, 2.0 mL of the reagent solution(1.0 × 10⁻³ mol L−1) was added. The total vol-ume of each solution was completed to 10 mL withbidistilled water. The formed ion–associate complexeswere extracted twice with 10 mL of chloroform byshaking for 2.0 min. Then, the solution was allowedto stand for clear separation of the two phases, andthe chloroform layer was passed through anhydroussodium sulphate. The absorbance of the yellow collaredcomplexes was measured at 408, 415 and 426 nm usingBCP, BPB and MO, respectively, against a correspond-ing reagent blank that was similarly prepared. All ofthe measurements were performed at room temperature(25 ± 2 ◦C). The procedures were repeated for the otheranalyte aliquots, and calibration plots were drawn tocalculate the amount of MCO in the unknown analytesamples.
2.4. Applications to pharmaceutical formulations
An accurately weighed portion of the cream or topicalsolution samples equivalent to 20 mg of the drug wasshaken and gently heated in ethanol until the samplewas completely dissolved and then filtered. The resultingclear solution was diluted to 50 mL with ethanol. Then,an appropriate dilution of the solution was prepared withwater, and the recommended procedure was followed.The standard addition method was also employed forthe accurate determination of the content of SER andMCO.
2.5. Stoichiometric relationship
The stoichiometric ratios of the ion–associate com-plexes formed between the studied drugs and thereagents were determined by applying the continuousvariation [42] and molar ratio [43] methods at the wave-lengths of maximum absorbance. In the continuousvariation method, equimolar solutions were employed(i.e., 5.0 × 10⁻⁴ mol L−1 standard solutions of drug and5.0 × 10−4 mol L−1 solutions of dye). A series of solu-tions were prepared in which the total volume of thestudied drugs and the dye was maintained at 2.0 mL.The drug and reagent were mixed in various com-plementary proportions (0:2, 0.2:1.8, 0.4:1.6, . . ., 2:0,inclusive) and completed to volume in a 10 mL cali-brated flask with the appropriate solvent for extraction
according to the previously mentioned procedure. In themolar ratio method, the concentrations of SER and MCO(5.0 × 10⁻⁴ mol L−1) are held constant by using 1.0 mL,and the concentrations of the dyes (5.0 × 10⁻⁴ mol L−1)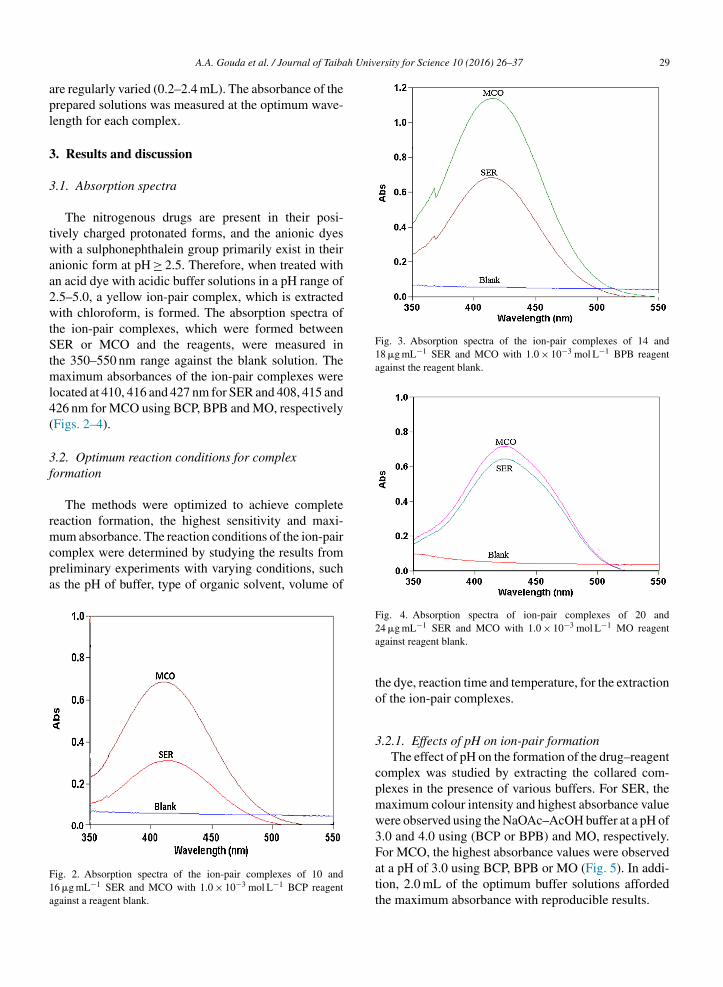
h University for Science 10 (2016) 26–37 29
apl
3
3
twaa2wtStml4(
3f
rmcpa
F1a
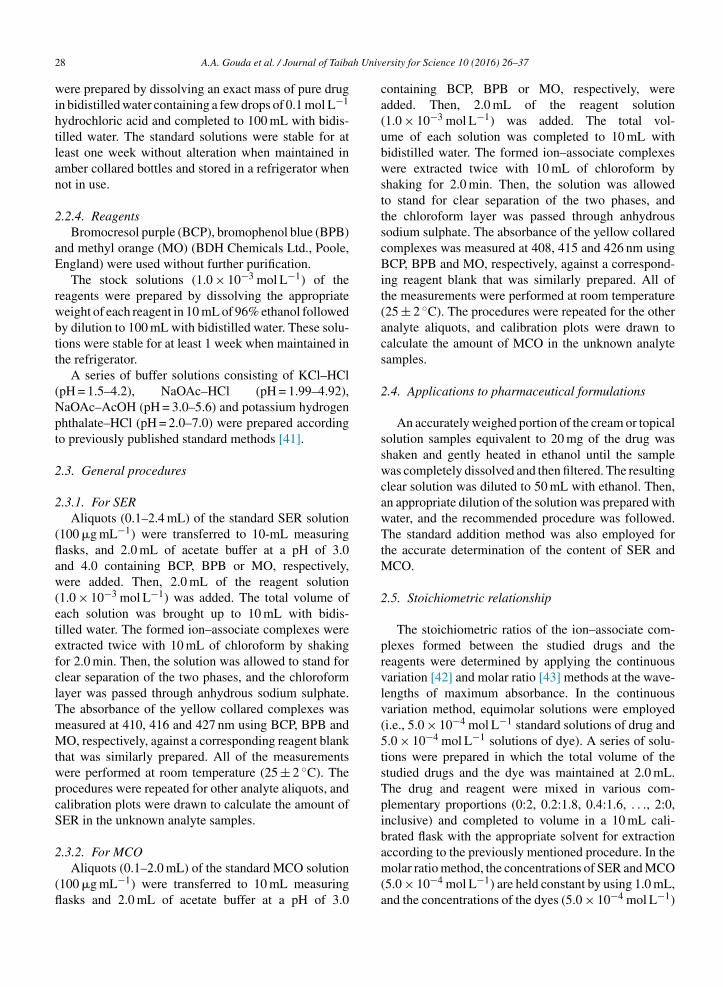
Fig. 3. Absorption spectra of the ion-pair complexes of 14 and18 �g mL−1 SER and MCO with 1.0 × 10⁻³ mol L−1 BPB reagentagainst the reagent blank.
A.A. Gouda et al. / Journal of Taiba
re regularly varied (0.2–2.4 mL). The absorbance of therepared solutions was measured at the optimum wave-ength for each complex.
. Results and discussion
.1. Absorption spectra
The nitrogenous drugs are present in their posi-ively charged protonated forms, and the anionic dyesith a sulphonephthalein group primarily exist in their
nionic form at pH ≥ 2.5. Therefore, when treated withn acid dye with acidic buffer solutions in a pH range of.5–5.0, a yellow ion-pair complex, which is extractedith chloroform, is formed. The absorption spectra of
he ion-pair complexes, which were formed betweenER or MCO and the reagents, were measured in
he 350–550 nm range against the blank solution. Theaximum absorbances of the ion-pair complexes were
ocated at 410, 416 and 427 nm for SER and 408, 415 and26 nm for MCO using BCP, BPB and MO, respectivelyFigs. 2–4).
.2. Optimum reaction conditions for complexormation
The methods were optimized to achieve completeeaction formation, the highest sensitivity and maxi-um absorbance. The reaction conditions of the ion-pair
omplex were determined by studying the results fromreliminary experiments with varying conditions, suchs the pH of buffer, type of organic solvent, volume of
ig. 2. Absorption spectra of the ion-pair complexes of 10 and6 �g mL−1 SER and MCO with 1.0 × 10⁻³ mol L−1 BCP reagentgainst a reagent blank.
Fig. 4. Absorption spectra of ion-pair complexes of 20 and
24 �g mL−1 SER and MCO with 1.0 × 10⁻³ mol L−1 MO reagentagainst reagent blank.the dye, reaction time and temperature, for the extractionof the ion-pair complexes.
3.2.1. Effects of pH on ion-pair formationThe effect of pH on the formation of the drug–reagent
complex was studied by extracting the collared com-plexes in the presence of various buffers. For SER, themaximum colour intensity and highest absorbance valuewere observed using the NaOAc–AcOH buffer at a pH of3.0 and 4.0 using (BCP or BPB) and MO, respectively.
For MCO, the highest absorbance values were observedat a pH of 3.0 using BCP, BPB or MO (Fig. 5). In addi-tion, 2.0 mL of the optimum buffer solutions affordedthe maximum absorbance with reproducible results.
30 A.A. Gouda et al. / Journal of Taibah University for Science 10 (2016) 26–37
0
0.1
0.2
0.3
0.4
0.5
0.6
0.7
0.8
2 2.5 3 3.5 4 4.5 5 5.5 6 6.5
pH
Abs
orba
nce
BCPBPBMO
plex fo
(aq) (aq) (aq) (org)
+ −
Fig. 5. Effect of the pH of the acetate buffer solution on ion-pair com(1.0 × 10⁻³ mol L−1).
3.2.2. Effect of the extracting solventsThe effect of several organic solvents (i.e., chloro-
form, carbon tetrachloride, methanol, ethanol, acetoni-trile, n-butanol, benzene, acetone, ethyl acetate, diethylether, toluene, dichloromethane and chlorobenzene) wasstudied to achieve effective extraction of the collaredspecies from the aqueous phase. Among the studiedreagents, chloroform was determined to be the most suit-able solvent for quantitative extraction of the collaredion-pair complexes. The experimental results indicatedthat a double extraction with a total volume of 10 mL ofchloroform yielded the maximum absorbance intensity,stable absorbance for the studied drugs and considerablylower extraction ability for the reagent blank with theshortest time to reach equilibrium between both phases.
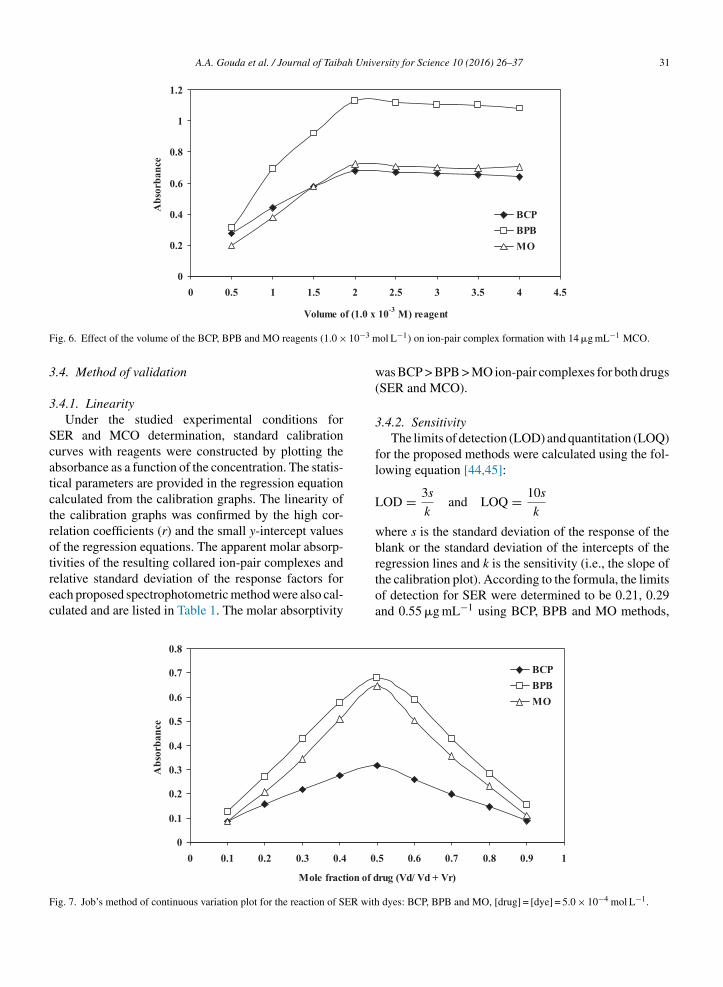
3.2.3. Effects of reagents concentrationThe effect of the reagents was studied by measuring
the absorbance of the solutions containing a fixed con-centration of the studied drugs and varied amounts ofthe respective reagents. The maximum colour intensityof the complex was achieved with 2.0 mL of each ofthe reagent solutions (1.0 × 10⁻³ mol L−1). However, alarger volume of the reagent had no pronounced effecton the absorbance of the formed ion-pair complexes(Fig. 6).
3.2.4. Effect of time and temperatureThe optimum reaction time was investigated from
0.5 to 5.0 min by following the colour developmentat ambient temperature (25 ± 2 ◦C). Complete colourintensity was achieved after 2.0 min of mixing for eachof the complexes. The effect of temperature on the
rmation between 14 �g mL−1 SER and BCP, BPB and MO reagents
collared complexes was investigated by measuring theabsorbance values at different temperatures. The col-lared complexes were stable up to 35 ◦C. At highertemperatures, the drug concentration increased due tothe volatile nature of chloroform. For all of the reagents,the absorbance remains stable for at least 12 h at roomtemperature.
3.3. Stoichiometric relationship
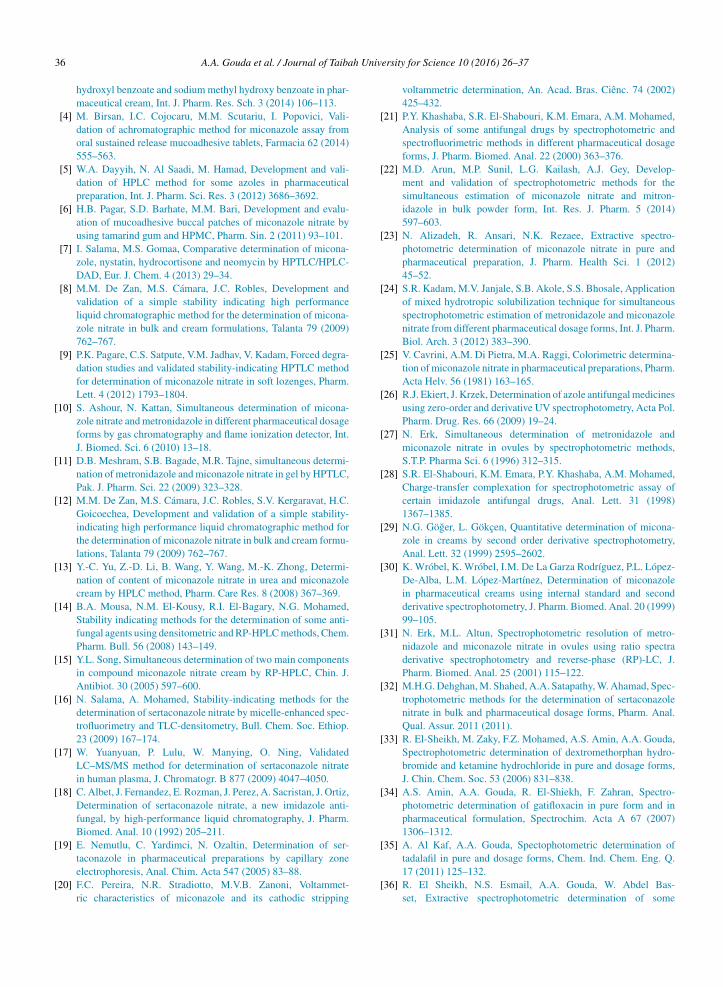
Job’s method of continuous variation [42] of equimo-lar solutions was employed, and a 5.0 × 10⁻⁴ mol L−1
standard solution of the drugs and a 5.0 × 10⁻⁴ mol L−1
solution of BCP, BPB or MO were used. A series of solu-tions was prepared in which the total volume of the drugand reagent was maintained at 2.0 mL. The absorbancewas measured at the optimum wavelength.
The molar ratio of the reagents (drug: dye) in theion-pair complexes was determined by the continuousvariations method (Job’s method) (Fig. 7). The resultsindicated that 1:1 (drug: dye) ion-pair complexes wereformed due to electrostatic attraction between the posi-tively charged protonated SER+ or MCO+ and negativelycharged BCP−, BPB or MO−. The extraction equilib-rium can be represented as follows:
SER+ + D− ↔ SER+D− ↔ SER+D−
where SER and D represent the protonated SER andthe anion of the dye, respectively, and the subscript (aq)and (org) refer to the aqueous and organic phases, respec-tively (Scheme 1).
A.A. Gouda et al. / Journal of Taibah University for Science 10 (2016) 26–37 31
0
0.2
0.4
0.6
0.8
1
1.2
0 0.5 1 1.5 2 2.5 3 3.5 4 4.5
f (1.0 x -3
Abs
orba
nce
BCPBPBMO
F 10−3 m
3
3
Scatctrotrec
F
Volume o
ig. 6. Effect of the volume of the BCP, BPB and MO reagents (1.0 ×
.4. Method of validation
.4.1. LinearityUnder the studied experimental conditions for
ER and MCO determination, standard calibrationurves with reagents were constructed by plotting thebsorbance as a function of the concentration. The statis-ical parameters are provided in the regression equationalculated from the calibration graphs. The linearity ofhe calibration graphs was confirmed by the high cor-elation coefficients (r) and the small y-intercept valuesf the regression equations. The apparent molar absorp-
ivities of the resulting collared ion-pair complexes andelative standard deviation of the response factors forach proposed spectrophotometric method were also cal-ulated and are listed in Table 1. The molar absorptivity0
0.1
0.2
0.3
0.4
0.5
0.6
0.7
0.8
0 0.1 0.2 0.3 0.4 0
Mole fraction of d
Abs
orba
nce
ig. 7. Job’s method of continuous variation plot for the reaction of SER with
10 M) reagent
ol L−1) on ion-pair complex formation with 14 �g mL−1 MCO.
was BCP > BPB > MO ion-pair complexes for both drugs(SER and MCO).
3.4.2. SensitivityThe limits of detection (LOD) and quantitation (LOQ)
for the proposed methods were calculated using the fol-lowing equation [44,45]:
LOD = 3s
kand LOQ = 10s
k
where s is the standard deviation of the response of theblank or the standard deviation of the intercepts of the
regression lines and k is the sensitivity (i.e., the slope ofthe calibration plot). According to the formula, the limitsof detection for SER were determined to be 0.21, 0.29and 0.55 �g mL−1 using BCP, BPB and MO methods,.5 0.6 0.7 0.8 0.9 1
rug (Vd/ Vd + Vr)
BCPBPBMO
dyes: BCP, BPB and MO, [drug] = [dye] = 5.0 × 10⁻⁴ mol L−1.

32 A.A. Gouda et al. / Journal of Taibah University for Science 10 (2016) 26–37
C
O
OSO2
Br
HO
Br
Br
Br
OH
C
O
SO3H
Br
HO
Br
Br
Br
O
C
O
SO3
Br
HO
Br
Br
Br
O
Bromophenol blue(Lactoid ring) (Quinoid ring)
H
C
O
SO3
Br
HO
Br
Br
Br
O
pH= 3.0
C
O
SO3
Br
HO
Br
Br
Br
O
com
BPBH
Cl
N NO
S
Cl
Cl
NH NO
S
Cl
SER
e ion-p
calculated. The relative error was calculated using thefollowing equation:
SER- BPB io n-pair
Scheme 1. Proposed reaction mechanism for th
respectively, and for MCO, the LODs were determinedto be 0.25, 0.28, and 0.57 �g mL−1 using BCP, BPB andMO methods, respectively. The limit of quantitations forSER were determined to be 0.70, 0.97 and 1.83 �g mL−1
using BCP, BPB and MO methods, respectively, andfor MCO, the LOQs were determined to be 0.83, 0.93and 1.90 �g mL−1 using BCP, BPB and MO methods,respectively (Table 1). Therefore, according to the lowervalues of the detection limits, the sensitivity of the pro-posed methods is higher than that of the previouslyreported spectrophotometric methods.
3.4.3. Accuracy and precisionTo evaluate the accuracy and precision of the pro-
posed methods, solutions containing three differentconcentrations of each of the studied drugs were
plex
air complex formation between SER and BPB.
prepared. The assay procedure was analysed in six repli-cates, and the relative standard deviation given as apercentage (RSD%) was obtained within the same day toevaluate the repeatability (intra-day precision) and overfive different days to evaluate the intermediate preci-sion (inter-day precision). The analytical results of theintra-day and inter-day precision and accuracy are sum-marized in Tables 2 and 3. Low values for the relativestandard deviation of the precision and relative error(RE%) of the accuracy of the proposed methods were
RE% =[founded − added
added
]× 100

A.A. Gouda et al. / Journal of Taibah University for Science 10 (2016) 26–37 33
Table 1Statistical analysis of the calibration graphs and analytical data in the determination of SER and MCO using the proposed methods.
Parameters SER MCO
BCP BPB MO BCP BPB MO
Wavelengths λmax (nm) 410 416 427 408 415 426pH 3.0 3.0 4.0 3.0 3.0 3.0Beer’s law limits (�g mL−1) 1.0–10 1.0–18 2.0–20 1.0–18 1.0–16 2.0–24Molar absorptivity ε,
(L/mol−1 cm−1) × 1041.612 1.870 1.602 1472 3.33 1.482
Sandell’s sensitivity(ng cm−2)
31.07 26.78 31.26 32.55 14.39 32.33
log Kf 4.962 ± 0.342 4.817 ± 0.279 5.026 ± 0.326 4.947 ± 0.251 5.156 ± 0.178 4.89 ± 0.273Regression equationa
Intercept (a) 0.0029 −0.0028 −0.0005 −0.0034 −0.0037 0.0039Slope (b) 0.0311 0.0383 0.0319 0.0379 0.0713 0.00298Correlation coefficient (r) 0.9994 0.9998 0.9998 0.9995 0.9998 0.9997LOD (�g mL−1)b 0.21 0.29 0.55 0.25 0.28 0.57LOQ (�g mL−1)b 0.70 0.97 1.83 0.83 0.93 1.90Mean ± SD 100.10 ± 1.09 99.95 ± 1.24 100.05 ± 1.20 99.86 ± 1.02 100.04 ± 0.95 99.90 ± 0.92RSD% 1.09 1.24 1.20 1.02 0.95 0.92RE% 1.15 1.30 1.26 1.07 0.997 0.97t-testc 0.60 0.74 0.63 0.42 0.16 0.38F-testc 1.84 1.42 1.52 1.27 1.41 1.56
a A = a + bC, where C is the concentration in �g mL−1 and A is the absorbance units.sorptivispective
tr
3
i(
TI
M
B
B
M
b LOD, limit of detection; LOQ, limit of quantification; ε, molar abc The theoretical values of t and F at P = 0.05 are 2.571 and 5.05, re
These results for the accuracy and precision indicatehat the proposed methods exhibit good repeatability andeproducibility.
.4.4. Robustness and ruggedness
The robustness of the method were evaluated by mak-ng small incremental changes in the volumes of the dye2.0 ± 0.2 mL), the volumes of the buffer (2.0 ± 0.2 mL)
able 2ntra-day and inter-day precision and accuracy data for SER obtained using th
ethod Added(�g mL−1)
Intra-day
Recovery%
PrecisionRSD%a
AccuracyRE%
Confidenclimitb
CP 2.0 100.10 0.79 0.10 2.002 ±6.0 99.50 1.17 −0.50 5.97 ±
10 100.40 1.28 0.40 10.04 ±PB 4.0 99.70 0.62 −0.30 3.988 ±
10 99.30 0.96 −0.70 9.93 ±16 100.20 1.65 0.20 16.032 ±
O 5.0 99.60 0.81 −0.40 4.98 ±10 100.30 1.65 0.30 10.03 ±20 99.70 1.92 −0.30 19.94 ±
a Mean of six determination, RSD%, percentage relative standard deviationb Confidence limit at 95% confidence level and five degrees of freedom (t =
ty.ly.
and the reaction times (2 ± 0.5 min), and the effectof these changes on the absorbance of the collaredsystems was studied. These changes had a negligi-ble influence on the results, which was revealed bythe small intermediate precision values expressed as
RSD (≤3.0%). The ruggedness of the method wasdemonstrated by performing the analysis with threeanalysts as well as by performing the analysis withe proposed methods.
Inter-day
e Recovery%
PrecisionRSD%a
AccuracyRE%
Confidencelimitb
0.017 99.70 0.68 −0.30 1.994 ± 0.014 0.073 99.30 0.84 −0.70 5.958 ± 0.053 0.135 99.40 1.50 −0.60 9.94 ± 0.156
0.026 100.50 0.56 0.50 4.02 ± 0.024 0.100 99.60 0.95 −0.40 9.96 ± 0.099 0.278 99.40 1.160 −0.60 15.904 ± 0.194
0.042 99.40 0.75 −0.60 4.97 ± 0.039 0.174 99.70 1.10 −0.30 9.97 ± 0.115 0.402 99.50 1.75 −0.50 19.9 ± 0.366
; RE%, percentage relative error. 2.571).

34 A.A. Gouda et al. / Journal of Taibah University for Science 10 (2016) 26–37
Table 3Intra-day and inter-day precision and accuracy data for MCO obtained using the proposed methods.
Method Added(�g mL−1)
Intra-day Inter-day
Recovery%
PrecisionRSD%a
AccuracyRE%
Confidencelimitb
Recovery%
PrecisionRSD%a
AccuracyRE%
Confidencelimitb
BCP 4.0 99.80 0.78 −0.20 3.992 ± 0.033 99.40 0.68 −0.60 3.976 ± 0.02810 99.10 1.35 −0.90 9.91 ± 0.140 99.80 0.94 −0.20 9.98 ± 0.09816 100.20 1.80 0.20 16.032 ± 0.303 99.50 1.32 −0.50 15.92 ± 0.221
BPB 4.0 99.60 0.54 −0.40 3.984 ± 0.023 100.20 0.46 0.20 4.008 ± 0.01910 99.70 1.26 −0.30 9.97 ± 0.132 99.10 0.94 −0.90 9.91 ± 0.09816 99.20 1.94 −0.80 15.872 ± 0.323 99.90 1.24 −0.10 15.984 ± 0.208
MO 6.0 100.50 0.70 0.50 6.03 ± 0.044 99.40 0.55 −0.60 5.964 ± 0.03412 99.60 1.15 −0.40 11.952 ± 0.144 100.30 0.89 0.30 12.036 ± 0.11224 100.20 1.70 0.20 24.048 ± 0.429 99.70 1.40 −0.30 23.928 ± 0.352
eviationom (t =
a Mean of six determination, RSD%, percentage relative standard db Confidence limit at 95% confidence level and five degrees of freed
a single analyst on three different instruments in thesame laboratory. The intermediate precision values(RSD) of this study were ≤3.0%, indicating acceptableruggedness.
3.4.5. Effects of interferenceTo assess the usefulness of the method, the effect
of diluents, excipients and additives that often accom-pany SER and MCO in its dosage forms (i.e., starch,lactose, glucose, saccharose, talc, sodium chloride, tita-nium dioxide, and magnesium stearate) was studied. Theresults indicated that there was no interference from theexcipients and additives, indicating a high selectivity forthe determination of the studied SER and MCO in itsdosage forms.
3.5. Analysis of pharmaceutical formulations
The proposed methods have been successfullyapplied to the determination of SER and MCO in phar-maceutical dosage forms. Six replicate determinations
Table 4Application of the standard addition technique for the determination of SER a
Sample Taken(�g mL−1)
BCP BPB
Added(�g mL−1)
Recoverya
(%)Added(�g mL−1
Dermofix cream 2.0 – 99.60 –
2.0 99.10 2.0
4.0 99.80 6.0
8.0 100.40 10
12 98.80 14
14 99.00 18
; RE%, percentage relative error. 2.571).
were performed. In addition, to confirm the validity ofthe proposed methods, the dosage forms were tested forpossible interference using the standard addition method(Table 4). There was no significant difference betweenthe slopes of the calibration curves and the standardaddition methods. Therefore, the excipients in the phar-maceutical dosage forms of SER and MCO did interferein the analysis of SER and MCO. The results were com-pared to those obtained using the previously reportedmethods for the determination of SER and MCO [2].Based on Student’s t-value and variance ratio F-value atthe 95% confidence level, statistical analysis indicatedno significant difference between the accuracy and preci-sion of the proposed methods and the previously reportedmethods for pharmaceutical formulations [45]. Theresults indicated that Student’s t- and F-values at the 95%confidence level did not exceed the theoretical values,
which confirmed the good agreement between the resultsobtained from the proposed methods and the referencemethods with respect to the accuracy and precision(Table 4).nd MCO in dosage forms using the proposed methods.
MO Officialmethod [2]
)Recoverya
(%)Added(�g mL−1)
Recoverya
(%)
98.70 – 100.1099.50 4.0 99.70
100.30 10 100.60100.50 16 99.20
99.20 22 100.3099.60 26 99.50

A.A. Gouda et al. / Journal of Taibah University for Science 10 (2016) 26–37 35
Table 4 (Continued)
Sample Taken(�g mL−1)
BCP BPB MO Officialmethod [2]
Added(�g mL−1)
Recoverya
(%)Added(�g mL−1)
Recoverya
(%)Added(�g mL−1)
Recoverya
(%)
Mean ± SD 99.45 ± 0.599 99.63 ± 0.674 99.90 ± 0.525 99.50 ± 0.73RSD% 0.602 0.677 0.525V 0.359 0.455 0.276t-valueb 0.12 0.29 1.0F-valueb 1.09 1.17 1.90
Miconaz cream 2.0 – 99.10 – 100.40 – 99.202.0 100.40 2.0 100.20 4.0 100.804.0 99.00 6.0 99.10 10 99.508.0 98.50 10 99.60 16 99.30
12 99.50 14 99.20 22 100.6014 99.80 18 99.40 26 99.90
Mean ± SD 99.38 ± 0.668 99.65 ± 0.536 99.88 ± 0.68 99.64 ± 0.46RSD% 0.668 0.536 0.68V 0.446 0.287 0.462t-valueb 0.72 0.03 0.654F-valueb 2.11 1.36 2.19
Micoban cream 2.0 – 99.60 – 99.30 – 99.102.0 99.10 2.0 98.90 4.0 99.704.0 99.80 6.0 99.00 10 99.508.0 98.70 10 99.40 16 98.60
12 98.60 14 99.20 22 99.4014 99.30 18 98.50 26 99.30
Mean ± SD 99.18 ± 0.48 99.05 ± 0.327 99.27 ± 0.383 99.08 ± 0.67RSD% 0.48 0.327 0.383V 0.23 0.107 0.147t-valueb 0.27 0.09 0.55F-valueb 1.95 4.20 3.06
a Average of six determinations.b The theoretical values of t and F are 2.57 and 5.05, respectively, at the confidence limit at the 95% confidence level and five degrees of freedom
(
4
iqisrittmpoeife
p = 0.05).
. Conclusion
This paper describes the application of an extractiveon-pair complexation reaction with acid dyes for theuantification of two antifungal drugs (SER and MCO)n pure and dosage forms. In comparison to the existingpectrophotometric methods, the proposed methods areelatively simple, rapid, cost-effective, free from auxil-ary reagents and more sensitive for the determination ofhe studied drugs in pure and dosage forms. In addition,he proposed methods are free from the tedious experi-
ental steps, such as heating, that are employed in thereviously reported methods. The most attractive featuref these methods is their relative freedom from interfer-
nce by the usual diluents and excipients in amounts farn excess of their normal occurrence in pharmaceuticalormulations. The statistical parameters and the recov-ry data indicate good accuracy and precision of themethods. Therefore, the validated methods could be use-ful for routine quality control assays of the studied drugsin the raw pharmaceutical materials and dosage forms.
Conflict of interest
The authors declare that they have no conflict of inter-ests with the company name used in the paper.
References
[1] S. Sweetman, Martindale (the Complete Drug Reference), 36thed., The Pharmaceutical Press, London, 2009.
[2] British Pharmacopoeia, Vol. I &II, Monographs: Medicinal andPharmaceutical Substances, The Stationary Office, London, UK,
2012 (electronic version).[3] S. Asghar, S. Sheikh, S. Ahmad, Simultaneous determination andvalidation of miconazole nitrate with the antimicrobial preserva-tives using RP-HPLC method: for benzoic acid, sodium propyl
h Univ
[
[
[
[
[
[
[
[
[
[
[
[
[
[
[
[
[
[
[
[
[
[
[
[
[
[
36 A.A. Gouda et al. / Journal of Taiba
hydroxyl benzoate and sodium methyl hydroxy benzoate in phar-maceutical cream, Int. J. Pharm. Res. Sch. 3 (2014) 106–113.
[4] M. Birsan, I.C. Cojocaru, M.M. Scutariu, I. Popovici, Vali-dation of achromatographic method for miconazole assay fromoral sustained release mucoadhesive tablets, Farmacia 62 (2014)555–563.
[5] W.A. Dayyih, N. Al Saadi, M. Hamad, Development and vali-dation of HPLC method for some azoles in pharmaceuticalpreparation, Int. J. Pharm. Sci. Res. 3 (2012) 3686–3692.
[6] H.B. Pagar, S.D. Barhate, M.M. Bari, Development and evalu-ation of mucoadhesive buccal patches of miconazole nitrate byusing tamarind gum and HPMC, Pharm. Sin. 2 (2011) 93–101.
[7] I. Salama, M.S. Gomaa, Comparative determination of micona-zole, nystatin, hydrocortisone and neomycin by HPTLC/HPLC-DAD, Eur. J. Chem. 4 (2013) 29–34.
[8] M.M. De Zan, M.S. Cámara, J.C. Robles, Development andvalidation of a simple stability indicating high performanceliquid chromatographic method for the determination of micona-zole nitrate in bulk and cream formulations, Talanta 79 (2009)762–767.
[9] P.K. Pagare, C.S. Satpute, V.M. Jadhav, V. Kadam, Forced degra-dation studies and validated stability-indicating HPTLC methodfor determination of miconazole nitrate in soft lozenges, Pharm.Lett. 4 (2012) 1793–1804.
10] S. Ashour, N. Kattan, Simultaneous determination of micona-zole nitrate and metronidazole in different pharmaceutical dosageforms by gas chromatography and flame ionization detector, Int.J. Biomed. Sci. 6 (2010) 13–18.
11] D.B. Meshram, S.B. Bagade, M.R. Tajne, simultaneous determi-nation of metronidazole and miconazole nitrate in gel by HPTLC,Pak. J. Pharm. Sci. 22 (2009) 323–328.
12] M.M. De Zan, M.S. Cámara, J.C. Robles, S.V. Kergaravat, H.C.Goicoechea, Development and validation of a simple stability-indicating high performance liquid chromatographic method forthe determination of miconazole nitrate in bulk and cream formu-lations, Talanta 79 (2009) 762–767.
13] Y.-C. Yu, Z.-D. Li, B. Wang, Y. Wang, M.-K. Zhong, Determi-nation of content of miconazole nitrate in urea and miconazolecream by HPLC method, Pharm. Care Res. 8 (2008) 367–369.
14] B.A. Mousa, N.M. El-Kousy, R.I. El-Bagary, N.G. Mohamed,Stability indicating methods for the determination of some anti-fungal agents using densitometric and RP-HPLC methods, Chem.Pharm. Bull. 56 (2008) 143–149.
15] Y.L. Song, Simultaneous determination of two main componentsin compound miconazole nitrate cream by RP-HPLC, Chin. J.Antibiot. 30 (2005) 597–600.
16] N. Salama, A. Mohamed, Stability-indicating methods for thedetermination of sertaconazole nitrate by micelle-enhanced spec-trofluorimetry and TLC-densitometry, Bull. Chem. Soc. Ethiop.23 (2009) 167–174.
17] W. Yuanyuan, P. Lulu, W. Manying, O. Ning, ValidatedLC–MS/MS method for determination of sertaconazole nitratein human plasma, J. Chromatogr. B 877 (2009) 4047–4050.
18] C. Albet, J. Fernandez, E. Rozman, J. Perez, A. Sacristan, J. Ortiz,Determination of sertaconazole nitrate, a new imidazole anti-fungal, by high-performance liquid chromatography, J. Pharm.Biomed. Anal. 10 (1992) 205–211.
19] E. Nemutlu, C. Yardimci, N. Ozaltin, Determination of ser-
taconazole in pharmaceutical preparations by capillary zoneelectrophoresis, Anal. Chim. Acta 547 (2005) 83–88.20] F.C. Pereira, N.R. Stradiotto, M.V.B. Zanoni, Voltammet-ric characteristics of miconazole and its cathodic stripping
[
ersity for Science 10 (2016) 26–37
voltammetric determination, An. Acad. Bras. Ciênc. 74 (2002)425–432.
21] P.Y. Khashaba, S.R. El-Shabouri, K.M. Emara, A.M. Mohamed,Analysis of some antifungal drugs by spectrophotometric andspectrofluorimetric methods in different pharmaceutical dosageforms, J. Pharm. Biomed. Anal. 22 (2000) 363–376.
22] M.D. Arun, M.P. Sunil, L.G. Kailash, A.J. Gey, Develop-ment and validation of spectrophotometric methods for thesimultaneous estimation of miconazole nitrate and mitron-idazole in bulk powder form, Int. Res. J. Pharm. 5 (2014)597–603.
23] N. Alizadeh, R. Ansari, N.K. Rezaee, Extractive spectro-photometric determination of miconazole nitrate in pure andpharmaceutical preparation, J. Pharm. Health Sci. 1 (2012)45–52.
24] S.R. Kadam, M.V. Janjale, S.B. Akole, S.S. Bhosale, Applicationof mixed hydrotropic solubilization technique for simultaneousspectrophotometric estimation of metronidazole and miconazolenitrate from different pharmaceutical dosage forms, Int. J. Pharm.Biol. Arch. 3 (2012) 383–390.
25] V. Cavrini, A.M. Di Pietra, M.A. Raggi, Colorimetric determina-tion of miconazole nitrate in pharmaceutical preparations, Pharm.Acta Helv. 56 (1981) 163–165.
26] R.J. Ekiert, J. Krzek, Determination of azole antifungal medicinesusing zero-order and derivative UV spectrophotometry, Acta Pol.Pharm. Drug. Res. 66 (2009) 19–24.
27] N. Erk, Simultaneous determination of metronidazole andmiconazole nitrate in ovules by spectrophotometric methods,S.T.P. Pharma Sci. 6 (1996) 312–315.
28] S.R. El-Shabouri, K.M. Emara, P.Y. Khashaba, A.M. Mohamed,Charge-transfer complexation for spectrophotometric assay ofcertain imidazole antifungal drugs, Anal. Lett. 31 (1998)1367–1385.
29] N.G. Göger, L. Gökcen, Quantitative determination of micona-zole in creams by second order derivative spectrophotometry,Anal. Lett. 32 (1999) 2595–2602.
30] K. Wróbel, K. Wróbel, I.M. De La Garza Rodríguez, P.L. López-De-Alba, L.M. López-Martínez, Determination of miconazolein pharmaceutical creams using internal standard and secondderivative spectrophotometry, J. Pharm. Biomed. Anal. 20 (1999)99–105.
31] N. Erk, M.L. Altun, Spectrophotometric resolution of metro-nidazole and miconazole nitrate in ovules using ratio spectraderivative spectrophotometry and reverse-phase (RP)-LC, J.Pharm. Biomed. Anal. 25 (2001) 115–122.
32] M.H.G. Dehghan, M. Shahed, A.A. Satapathy, W. Ahamad, Spec-trophotometric methods for the determination of sertaconazolenitrate in bulk and pharmaceutical dosage forms, Pharm. Anal.Qual. Assur. 2011 (2011).
33] R. El-Sheikh, M. Zaky, F.Z. Mohamed, A.S. Amin, A.A. Gouda,Spectrophotometric determination of dextromethorphan hydro-bromide and ketamine hydrochloride in pure and dosage forms,J. Chin. Chem. Soc. 53 (2006) 831–838.
34] A.S. Amin, A.A. Gouda, R. El-Shiekh, F. Zahran, Spectro-photometric determination of gatifloxacin in pure form and inpharmaceutical formulation, Spectrochim. Acta A 67 (2007)1306–1312.
35] A. Al Kaf, A.A. Gouda, Spectophotometric determination of
tadalafil in pure and dosage forms, Chem. Ind. Chem. Eng. Q.17 (2011) 125–132.36] R. El Sheikh, N.S. Esmail, A.A. Gouda, W. Abdel Bas-set, Extractive spectrophotometric determination of some

h Univ
[
[
[
[
[
[
[
[
A.A. Gouda et al. / Journal of Taiba
�-adrenergic-antagonists in pure forms and in pharmaceuticalformulations, Chem. Ind. Chem. Eng. Q. 18 (2012) 179–191.
37] A.A. Gouda, Z. El Shafey, N. Hossny, R. El-Azzazy, Spec-trophotometric determination of hyoscine butylbromide andfamciclovir in pure form and in pharmaceutical formulations,Spectrochim. Acta A 70 (2008) 785–792.
38] W.S. Hassan, M.M. El- Henawee, A.A. Gouda, Spectro-photometric determination of some histamine H1-antagonistdrugs in their pharmaceutical preparations, Spectrochim. ActaA 69 (2008) 245–255.
39] A.A. Gouda, A.S. Amin, R. El-Sheikh, A.G. Yousef, Spec-trophotometric determination of gemifloxacin mesylate, mox-ifloxacin hydrochloride, and enrofloxacin in pharmaceutical
formulations using acid dyes, J. Anal. Methods Chem. 2014(2014) 1–16 http://dx.doi.org/10.1155/2014/28637940] R. El-Sheikh, M. Zaky, A.A. Gouda, S.A. Aboal Ezz, Extrac-tive spectrophotometric determination of vardenafil HCl and
[
ersity for Science 10 (2016) 26–37 37
yohimbine HCl in pure and pharmaceutical dosage forms, J. Chil.Chem. Soc. 59 (2014) 2248–2255.
41] R. Scorpio, Fundamentals of Acids, Bases, Buffers & Their Appli-cation to Biochemical Systems, 2000.
42] P. Job, Spectrochemical Methods of Analysis, Wiley Intersience,New York, 1971, pp. 346.
43] D.A. Skoog, D.M. West, F.J. Holler, Fundamentals of AnalyticalChemistry, seventh ed., Saunders College Publishing, Philadel-phia, 1996.
44] ICH harmonized tripartite guideline, Validation of analyticalprocedures: text and methodology, Q2(R 1), complementaryguideline on methodology dated 06 November 1996, in: Interna-tional Conference on Harmonization of Technical Requirements
for Registration of Pharmaceuticals for Human Use, ICH, Lon-don, 2005.45] J.N. Miller, J.C. Miller, Statistics and Chemometrics for Analyt-ical Chemistry, fifth ed., Prentice Hall, England, 2005.