validated spectrophotometric assay of cefepime...
TRANSCRIPT
ISSN: 0973-4945; CODEN ECJHAO
E-Journal of Chemistry
http://www.ejchem.net 2012, 9(4), 2261-2267
Validated Spectrophotometric Assay of
Cefepime Hydrochloride and Cefuroxime
Sodium Using a Tetrazolium Salt
MARWA S. ELAZAZY*
AND ABDALLA SHALABY
Analytical Chemistry Department, Faculty of Pharmacy,
Zagazig University, Zagazig, Egypt
Received 29 August 2011; Accepted 28 October 2011
Abstract: A simple, rapid and sensitive spectrophotometric method for the
determination of micro amounts of cefepime hydrochloride and cefuroxime sodium
is described. The method is based on reduction of 2,3,5-triphenyltetrazolium
chloride (TTC) by the cited drugs in slightly alkaline medium leading to formation
of a highly colored formazan derivative. Different variables affecting the color
development were investigated and optimized. Absorbance measurements were
made at 483 nm. Under the proposed conditions, this method is applicable over
concentration range of 4 – 50 µg ml-1 with molar absorpitivities ranging from 5.208
x 103 – 1.217 x 10⁴ L.mol-1.cm-1 and Sandell’s sensitivities ranging from 1.007 x 10⁻³
– 2.727 x10⁻³ µg cm-2. The proposed method was successfully applied for analysis of
the cited drugs in formulations and the recovery percentages ranged from 99.47 to
99.8%. The results obtained demonstrated that the proposed method is equally
accurate, precise and reproducible as the reported methods thus it is recommended
for quality control and routine analysis where time, cost effectiveness and high
specificity of analytical techniques are of great importance.
Keywords: Spectrophotometry, Triphenyltetrazolium Chloride, Pharmaceutical Analysis, Validation.
Introduction
Cephalosporins are penicillinase – resistant antibiotics derived from moulds of
“Cephalosporium” species. They differ in their antimicrobial spectrum, resistance to
β – lactamase and method of administration1. In this work two cephalosporins have been
determined; cefepime HCl and cefuroxime Na. Several procedures were reported in
literature for their determination e.g. spectrophotometry2-5
, fluorometry6,7
, polarography8, IR
spectroscopy9, HPLC
10, potentiometry
11 and FIA
12.
The present work develops a colorimetric method for the determination of the studied
drugs using TTC as an oxidizing agent. The drugs under study were previously determined
using ammonium molybdate13
and 1,10 – phenanthroline – ferric reagent14
as oxidizing
agents depending on their reducing properties – the author’s previous work.
The purpose of this study was to determine the two drugs in their bulk and dosage forms
without prior extraction by simple and selective assays for quality control and routine
analysis purposes using TTC as an oxidizing agent. This paper presents a validated
MARWA S. ELAZAZY et al. 2222
colorimetric method. The validation was performed in respect of the ICH Q2R1
regulations15
for analytical procedures. The following parameters were taken into account:
specificity, linearity, limits of detection and quantification, accuracy, precision.
Experimental
A Shimadzu 260 - UV recording spectrophotometer with 10 mm quartz cell was used for all
absorbance measurements.
Materials and reagents
All chemicals were of analytical grade and doubly distilled water was used throughout all
measurements.Cefepime hydrochloride (Bristol Myers Squibb, Egypt), Cefuroxime
sodium (Glaxo Wellcome Egypt), Triphenyltetrazolium chloride (TTC) (Aldrich,
Germany), 0.5% w/v aqueous solutions, prepared and stored in dark closed bottles,
Sodium hydroxide (El-Nasr Chemical Co., Egypt); 0.2 N ethanolic solution. Standard
solutions of antibiotics were freshly prepared by dissolving the appropriate amounts of
each in methanol to form 1 mg mL-1
solutions. Working solutions of 20 µg mL-1
were also
prepared in methanol.
Procedure
For pure pharmaceuticals
Accurately measured aliquots of the standard drug solutions ranging from 40 - 500 µg mL-1
were transferred into separate 10 mL volumetric flasks, followed by 0.3 mL aliquots of 0.5%
w/v TTC reagent and 0.3-1 mL of 0.2 N NaOH. The reaction mixture was heated at 75 °C in
water bath for 10 minutes. Volume was made up to the mark with methanol. The absorbance
was measured at the specified wavelength (Table 1) and the concentration was then
determined from calibration graphs or the corresponding regression equations.
For vials
The contents of two vials were mixed well. An amount of powder equivalent to 50 mg of the
active ingredient was transferred into 50 mL volumetric flask and the volume was made up to the
mark with methanol. Twenty ml of this solution were further diluted to 100 mL with methanol.
Drug content in the obtained solution was determined following the general procedures.
For tablets
Ten tablets were accurately weighed and ground into a fine powder. A weight of powder
equivalent to 100 mg of the drug was transferred into 100 mL volumetric flask and extracted
with 3x25 mL portions of methanol. These portions were filtered into 100 mL calibrated
flasks then the volume was made up to the mark with the suitable solvent. The drug content
in the obtained extract was determined following the general procedures.
Results and Discussion
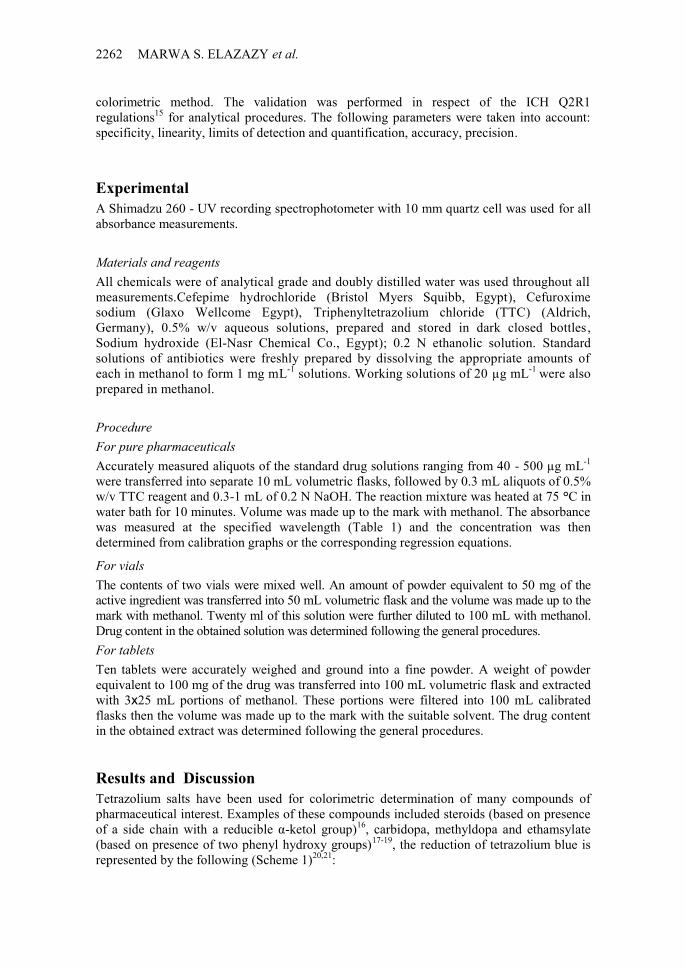
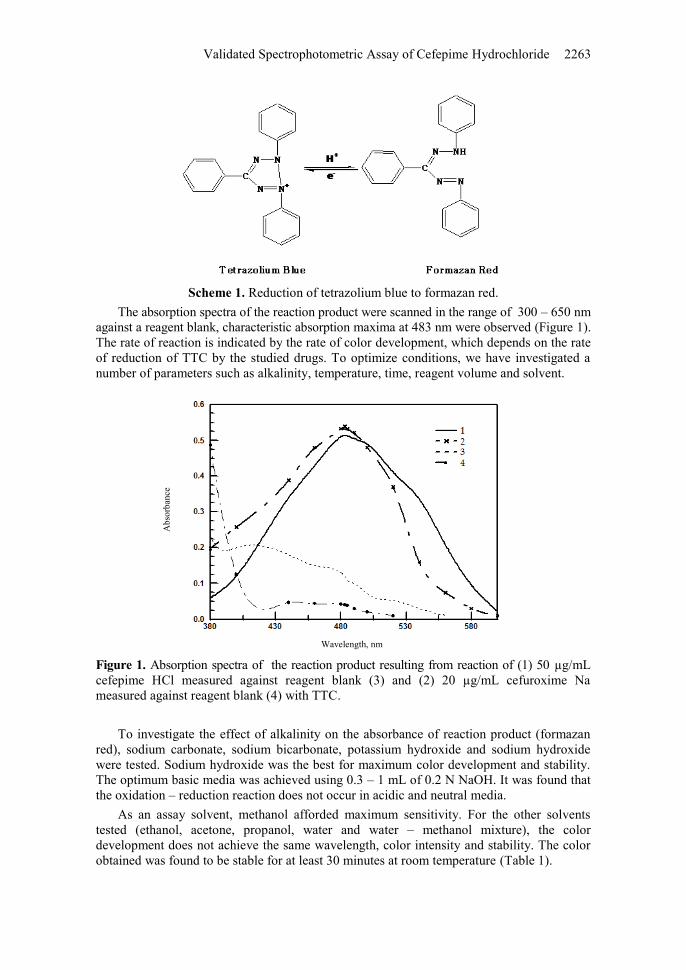
Tetrazolium salts have been used for colorimetric determination of many compounds of
pharmaceutical interest. Examples of these compounds included steroids (based on presence
of a side chain with a reducible α-ketol group)16
, carbidopa, methyldopa and ethamsylate
(based on presence of two phenyl hydroxy groups)17-19
, the reduction of tetrazolium blue is
represented by the following (Scheme 1)20,21
:
Validated Spectrophotometric Assay of Cefepime Hydrochloride 2222
Wavelength, nm
Ab
sorb
ance
Scheme 1. Reduction of tetrazolium blue to formazan red.
The absorption spectra of the reaction product were scanned in the range of 300 – 650 nm
against a reagent blank, characteristic absorption maxima at 483 nm were observed (Figure 1).
The rate of reaction is indicated by the rate of color development, which depends on the rate
of reduction of TTC by the studied drugs. To optimize conditions, we have investigated a
number of parameters such as alkalinity, temperature, time, reagent volume and solvent.
Figure 1. Absorption spectra of the reaction product resulting from reaction of (1) 50 µg/mL
cefepime HCl measured against reagent blank (3) and (2) 20 µg/mL cefuroxime Na
measured against reagent blank (4) with TTC.
To investigate the effect of alkalinity on the absorbance of reaction product (formazan
red), sodium carbonate, sodium bicarbonate, potassium hydroxide and sodium hydroxide
were tested. Sodium hydroxide was the best for maximum color development and stability.
The optimum basic media was achieved using 0.3 – 1 mL of 0.2 N NaOH. It was found that
the oxidation – reduction reaction does not occur in acidic and neutral media.
As an assay solvent, methanol afforded maximum sensitivity. For the other solvents
tested (ethanol, acetone, propanol, water and water – methanol mixture), the color
development does not achieve the same wavelength, color intensity and stability. The color
obtained was found to be stable for at least 30 minutes at room temperature (Table 1).
MARWA S. ELAZAZY et al. 2222
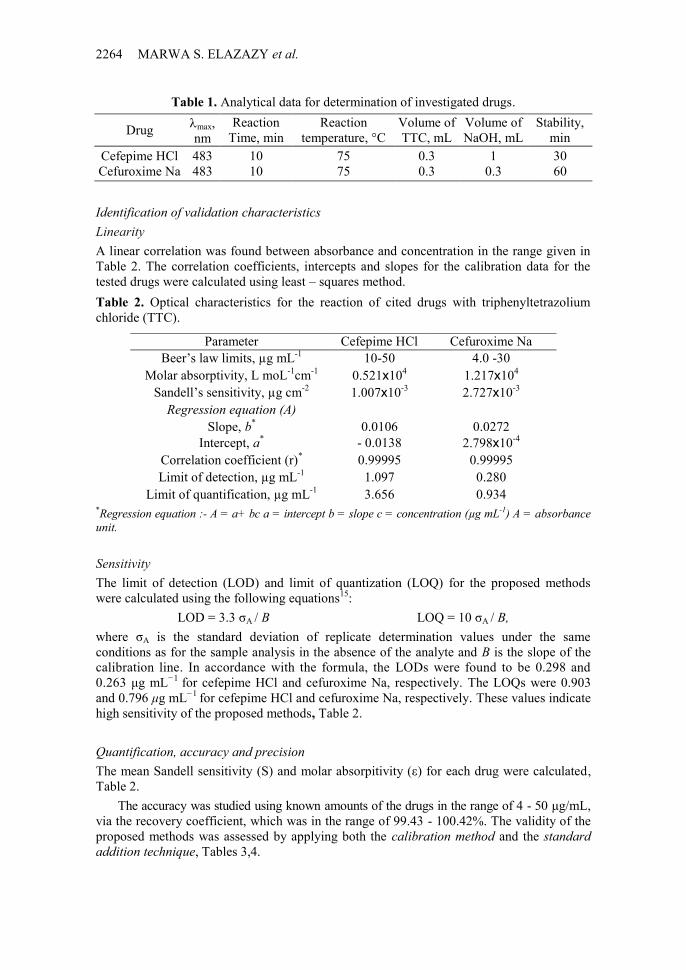
Table 1. Analytical data for determination of investigated drugs.
Drug max,
nm
Reaction
Time, min
Reaction
temperature, °C
Volume of
TTC, mL
Volume of
NaOH, mL
Stability,
min
Cefepime HCl
Cefuroxime Na
483
483
10
10
75
75
0.3
0.3
1
0.3
30
60
Identification of validation characteristics
Linearity
A linear correlation was found between absorbance and concentration in the range given in
Table 2. The correlation coefficients, intercepts and slopes for the calibration data for the
tested drugs were calculated using least – squares method.
Table 2. Optical characteristics for the reaction of cited drugs with triphenyltetrazolium
chloride (TTC).
*Regression equation :- A = a+ bc a = intercept b = slope c = concentration (µg mL-1) A = absorbance
unit.
Sensitivity
The limit of detection (LOD) and limit of quantization (LOQ) for the proposed methods
were calculated using the following equations15
:
LOD = 3.3 σA / B LOQ = 10 σA / B,
where σA is the standard deviation of replicate determination values under the same
conditions as for the sample analysis in the absence of the analyte and B is the slope of the
calibration line. In accordance with the formula, the LODs were found to be 0.298 and
0.263 μg mL−1
for cefepime HCl and cefuroxime Na, respectively. The LOQs were 0.903
and 0.796 μg mL−1
for cefepime HCl and cefuroxime Na, respectively. These values indicate
high sensitivity of the proposed methods, Table 2.
Quantification, accuracy and precision
The mean Sandell sensitivity (S) and molar absorpitivity (ε) for each drug were calculated,
Table 2.
The accuracy was studied using known amounts of the drugs in the range of 4 - 50 μg/mL,
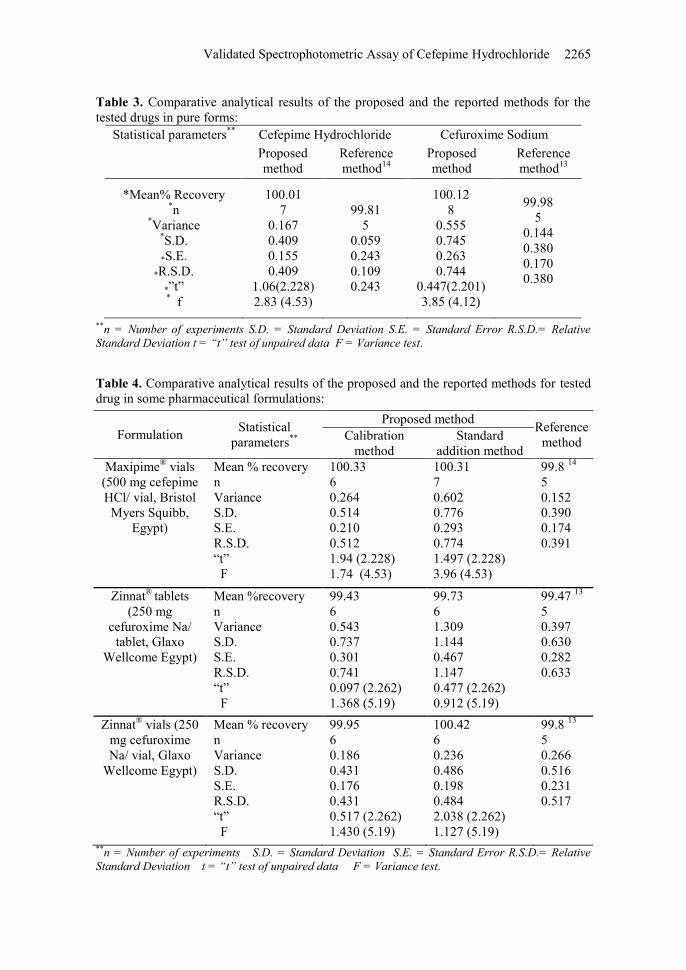
via the recovery coefficient, which was in the range of 99.43 - 100.42%. The validity of the
proposed methods was assessed by applying both the calibration method and the standard
addition technique, Tables 3,4.
Parameter Cefepime HCl Cefuroxime Na
Beer’s law limits, µg mL-1
10-50 4.0 -30
Molar absorptivity, L moL-1
cm-1
0.521x10⁴ 1.217x10
4
Sandell’s sensitivity, µg cm-2
1.007x10⁻³
2.727x10⁻³
Regression equation (A)
Slope, b* 0.0106 0.0272
Intercept, a* - 0.0138 2.798x10
-4
Correlation coefficient (r)* 0.99995 0.99995
Limit of detection, µg mL-1
1.097 0.280
Limit of quantification, µg mL-1
3.656 0.934
Validated Spectrophotometric Assay of Cefepime Hydrochloride 2222
Table 3. Comparative analytical results of the proposed and the reported methods for the
tested drugs in pure forms:
Statistical parameters**
Cefepime Hydrochloride Cefuroxime Sodium
Proposed
method
Reference
method14
Proposed
method
Reference
method13
*Mean% Recovery *n
*Variance
*S.D.
*S.E.
*R.S.D.
*”t” * f
100.01
7
0.167
0.409
0.155
0.409
1.06(2.228)
2.83 (4.53)
99.81
5
0.059
0.243
0.109
0.243
100.12
8
0.555
0.745
0.263
0.744
0.447(2.201)
3.85 (4.12)
99.98
5
0.144
0.380
0.170
0.380
**n = Number of experiments S.D. = Standard Deviation S.E. = Standard Error R.S.D.= Relative
Standard Deviation t = “t” test of unpaired data F = Variance test.
Table 4. Comparative analytical results of the proposed and the reported methods for tested
drug in some pharmaceutical formulations:
Formulation Statistical
parameters**
Proposed method Reference
method Calibration
method
Standard
addition method
Maxipime® vials
(500 mg cefepime
HCl/ vial, Bristol
Myers Squibb,
Egypt)
Mean % recovery
n
Variance
S.D.
S.E.
R.S.D.
“t”
F
100.33
6
0.264
0.514
0.210
0.512
1.94 (2.228)
1.74 (4.53)
100.31
7
0.602
0.776
0.293
0.774
1.497 (2.228)
3.96 (4.53)
99.8 14
5
0.152
0.390
0.174
0.391
Zinnat®
tablets
(250 mg
cefuroxime Na/
tablet, Glaxo
Wellcome Egypt)
Mean %recovery
n
Variance
S.D.
S.E.
R.S.D.
“t”
F
99.43
6
0.543
0.737
0.301
0.741
0.097 (2.262)
1.368 (5.19)
99.73
6
1.309
1.144
0.467
1.147
0.477 (2.262)
0.912 (5.19)
99.47 13
5
0.397
0.630
0.282
0.633
Zinnat® vials (250
mg cefuroxime
Na/ vial, Glaxo
Wellcome Egypt)
Mean % recovery
n
Variance
S.D.
S.E.
R.S.D.
“t”
F
99.95
6
0.186
0.431
0.176
0.431
0.517 (2.262)
1.430 (5.19)
100.42
6
0.236
0.486
0.198
0.484
2.038 (2.262)
1.127 (5.19)
99.8 13
5
0.266
0.516
0.231
0.517
**n = Number of experiments S.D. = Standard Deviation S.E. = Standard Error R.S.D.= Relative
Standard Deviation t = “t” test of unpaired data F = Variance test.
MARWA S. ELAZAZY et al. 2222
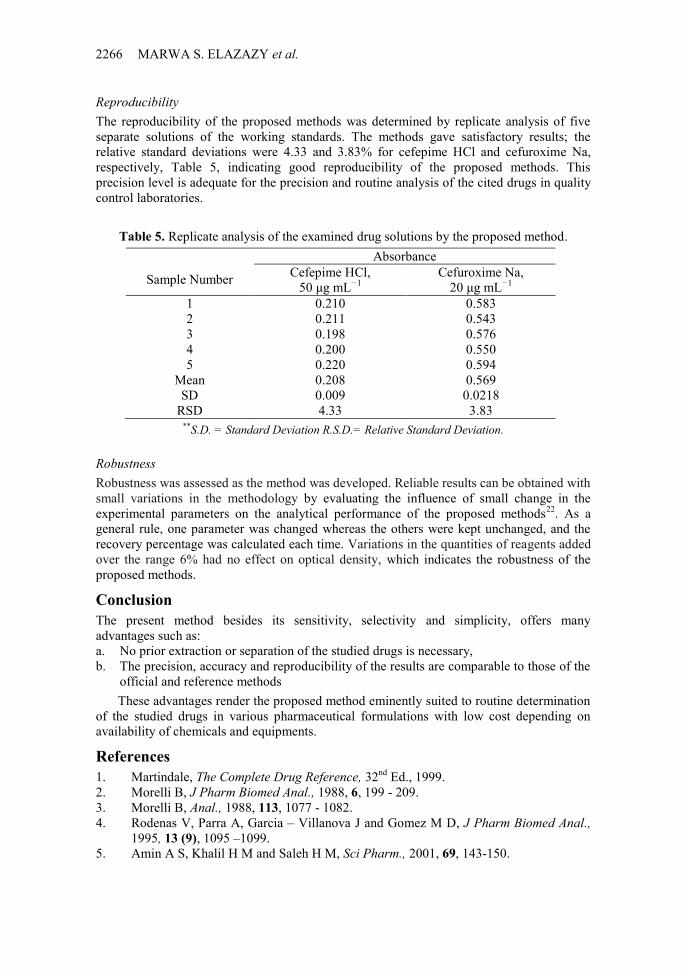
Reproducibility
The reproducibility of the proposed methods was determined by replicate analysis of five
separate solutions of the working standards. The methods gave satisfactory results; the
relative standard deviations were 4.33 and 3.83% for cefepime HCl and cefuroxime Na,
respectively, Table 5, indicating good reproducibility of the proposed methods. This
precision level is adequate for the precision and routine analysis of the cited drugs in quality
control laboratories.
Table 5. Replicate analysis of the examined drug solutions by the proposed method.
Sample Number
Absorbance
Cefepime HCl,
50 μg mL−1
Cefuroxime Na,
20 μg mL−1
1 0.210 0.583
2 0.211 0.543
3 0.198 0.576
4 0.200 0.550
5 0.220 0.594
Mean 0.208 0.569
SD 0.009 0.0218
RSD 4.33 3.83 **S.D. = Standard Deviation R.S.D.= Relative Standard Deviation.
Robustness
Robustness was assessed as the method was developed. Reliable results can be obtained with
small variations in the methodology by evaluating the influence of small change in the
experimental parameters on the analytical performance of the proposed methods22
. As a
general rule, one parameter was changed whereas the others were kept unchanged, and the
recovery percentage was calculated each time. Variations in the quantities of reagents added
over the range 6% had no effect on optical density, which indicates the robustness of the
proposed methods.
Conclusion
The present method besides its sensitivity, selectivity and simplicity, offers many
advantages such as:
a. No prior extraction or separation of the studied drugs is necessary,
b. The precision, accuracy and reproducibility of the results are comparable to those of the
official and reference methods
These advantages render the proposed method eminently suited to routine determination
of the studied drugs in various pharmaceutical formulations with low cost depending on
availability of chemicals and equipments.
References
1. Martindale, The Complete Drug Reference, 32nd
Ed., 1999.
2. Morelli B, J Pharm Biomed Anal., 1988, 6, 199 - 209.
3. Morelli B, Anal., 1988, 113, 1077 - 1082.
4. Rodenas V, Parra A, Garcia – Villanova J and Gomez M D, J Pharm Biomed Anal.,
1995, 13 (9), 1095 –1099.
5. Amin A S, Khalil H M and Saleh H M, Sci Pharm., 2001, 69, 143-150.
Validated Spectrophotometric Assay of Cefepime Hydrochloride 2222
6. Murillo J A, Lemus J M and Garcia L F, J Pharm Biomed Anal., 1994, 12(7), 875 - 881.
7. Omar M A, Abdelmageed O H and Attiaa T Z, Talanta., 2009, 77, 1394-1404.
8. Palucios J J, Mochon C M, Sanches J C and Carranza H J, Electroanalysis (NY).,
2000, 12, 296 - 300.
9. Bugay D E, Newman A W and Findlay W P, J Pharm Biomed Anal., 1996, 15, 49-61.
10. El - Khalili H, Linger L, Monteil H and Jehl F, J Chromatogr B Biomed Sci Appl.,
1997, 690, 181 - 188.
11. Evagelou V, Tsantili-Kakoulidou A and Koupparis M, J Pharm Biomed Anal., 2003,
31, 1119 - 1128.
12. Can N, Altiokka G and Aboul-Enein H Y, Anal Chim Acta., 2006, 576, 246-252.
13. Elazazy M S, Shalaby A, Elbolkiny M N and Khalil H M, Sci Pharm., 2003, 71,
211- 228.
14. Elazazy M S, Shalaby A, Elbolkiny M N and Khalil H M, Sci Pharm., 2004, 72, 73-86.
15. Validation on Analytical Procedures: Text and Methodology – ICH Q2 (R1) –
International Conference on Harmonisation, Geneva, Switzerland, 2005.
16. Short P M and Rhodes C T, Steroids, 1970, 16, 217 - 224.
17. Issopoulos P B, Pharm Weekbl Sci., 1989, 11, 213 - 217.
18. Issopoulos P B, J Pharm Pharmacol., 1992, 4, 1020 - 1022.
19. Tarkhanova O A and Vasyuk S A, Pharm Chem J., 2010, 44, 52-56.
20. Amin A S, Mikrochim Acta., 1997, 126, 105 - 108.
21. Amin A S, Euro J Pharm Biopharm., 2001, 51, 267-272.
22. Heyden Y V, Nijhuis A, Smeyers-Verbeke J and Vandeginste BGM and Massart D L,
J Pharm Biomed Anal., 2004, 24, 723-753.

Submit your manuscripts athttp://www.hindawi.com
Hindawi Publishing Corporationhttp://www.hindawi.com Volume 2014
Inorganic ChemistryInternational Journal of
Hindawi Publishing Corporation http://www.hindawi.com Volume 2014
International Journal ofPhotoenergy
Hindawi Publishing Corporationhttp://www.hindawi.com Volume 2014
Carbohydrate Chemistry
International Journal of
Hindawi Publishing Corporationhttp://www.hindawi.com Volume 2014
Journal of
Chemistry
Hindawi Publishing Corporationhttp://www.hindawi.com Volume 2014
Advances in
Physical Chemistry
Hindawi Publishing Corporationhttp://www.hindawi.com
Analytical Methods in Chemistry
Journal of
Volume 2014
Bioinorganic Chemistry and ApplicationsHindawi Publishing Corporationhttp://www.hindawi.com Volume 2014
SpectroscopyInternational Journal of
Hindawi Publishing Corporationhttp://www.hindawi.com Volume 2014
The Scientific World JournalHindawi Publishing Corporation http://www.hindawi.com Volume 2014
Medicinal ChemistryInternational Journal of
Hindawi Publishing Corporationhttp://www.hindawi.com Volume 2014
Chromatography Research International
Hindawi Publishing Corporationhttp://www.hindawi.com Volume 2014
Applied ChemistryJournal of
Hindawi Publishing Corporationhttp://www.hindawi.com Volume 2014
Hindawi Publishing Corporationhttp://www.hindawi.com Volume 2014
Theoretical ChemistryJournal of
Hindawi Publishing Corporationhttp://www.hindawi.com Volume 2014
Journal of
Spectroscopy
Analytical ChemistryInternational Journal of
Hindawi Publishing Corporationhttp://www.hindawi.com Volume 2014
Journal of
Hindawi Publishing Corporationhttp://www.hindawi.com Volume 2014
Quantum Chemistry
Hindawi Publishing Corporationhttp://www.hindawi.com Volume 2014
Organic Chemistry International
Hindawi Publishing Corporationhttp://www.hindawi.com Volume 2014
CatalystsJournal of
ElectrochemistryInternational Journal of
Hindawi Publishing Corporation http://www.hindawi.com Volume 2014