optimization of the process of chemical hydrolysis of...
TRANSCRIPT

1
Optimization of the process of chemical hydrolysis of cellulose to 1
glucose 2
Silvia Morales-delaRosa, Jose M. Campos-Martin* and Jose L. G. Fierro* 3
Sustainable Energy and Chemistry Group (EQS), Instituto de Catálisis y 4
Petroleoquímica, CSIC, Marie Curie, 2 Cantoblanco, 28049 Madrid, Spain, 5
http://www.icp.csic.es/eqsgroup/ 6
*e-mail: [email protected] (JMCM), [email protected] (JLGF) 7
8
Abstract 9
We studied the acid hydrolysis of cellulose in an aqueous medium with the aim of 10
maximizing glucose yield and minimizing the formation of by-products. The influence 11
of reaction parameters such as temperature, acid concentration, acid strength and 12
type of cellulose precursor on glucose yield was investigated. We observed that 13
moderate reaction temperature and low acid concentration resulted in the highest 14
glucose yield with little formation of levulinic acid. Strong acid (pKa < 0) is required to 15
achieve high glucose yield. The crystallite size of the cellulose also affects its 16
reactivity; cellulose with higher crystallite size is more resistant to hydrolysis 17
catalyzed by acid. The highest selectivity for glucose over levulinic acid was recorded 18
at a reaction temperature of 413 K and a sulfuric acid concentration in the range of 19
0.2-0.5 mol/L. Under these reaction conditions, no levulinic acid was detected, but 20
the glucose yield reached 20% in only 2 h. 21
22
Keywords: cellulose, hydrolysis, sulfuric acid, glucose, levulinic acid. 23
24
2
1. Introduction 25
Lignocellulosic biomass, which comes from the woody parts of plants, can be 26
hydrolyzed to yield chemical components that can be used as renewable carbon 27
sources to produce biofuels. Lignocellulose comprises three main C-based polymers 28
(cellulose, hemicellulose and lignin) which, when taken apart, yield chemical 29
components that can be used to produce biofuels. 30
The conceptual approach to deconstruct cellulose into sugar monomers is similar to 31
the one followed for decades in conventional oil refineries to produce fuels and 32
chemicals. Thus, it is believed that, in the future, different biorefinery platforms 33
(thermal, oily, chemical and biochemical) can supply marketable biofuels and 34
biochemical products to replace, at least in part, those obtained from fossil 35
precursors. The development of second and third generation biofuels has made it 36
possible to use lignocellulosic biomass and algae for large-scale biofuel production 37
that does not compete with food production as did first-generation biofuels made 38
from corn, sugar cane, canola and soy (Morales-delaRosa & Campos-Martin 2014). 39
Lignocellulosic biomass can be used to produce bio-ethanol, a promising alternative 40
to crude oil as an energy source. There are two main processes involved in the 41
conversion: (i) hydrolysis of the cellulose present in the lignocellulosic biomass into 42
sugar monomers, and (ii) fermentation of the sugars to produce ethanol (Limayem & 43
Ricke 2012; Sun & Cheng 2002). 44
Cellulose is a glucose polymer that can be easily deconstructed via hydrolysis into 45
monomers, which can be used at a sugar biorefinery to produce high energy-density 46
fuels and chemicals (Alonso et al. 2010; Brandt et al. 2013; Geboers et al. 2011; 47
Huang et al. 2008). A simple way to hydrolyze the cellulose to glucose is to use an 48
3
acid catalyst. The glucopyranosyl monomers are linked by β-(1,4) glycosidic bonds, 49
and these bonds can be hydrolyzed in the presence of an acid catalyst (El-Zawawy 50
et al. 2011; Tian et al. 2010). Chemocatalytic hydrolysis of cellulose has seen several 51
periods of revival and has occasionally been combined with biocatalytic fermentation 52
steps to convert sugars to secondary chemicals (Maki-Arvela et al. 2011). The most 53
industrially important process is hydrolysis by concentrated or dilute mineral acids, 54
predominantly sulfuric acid (Van de Vyver et al. 2011). An advantage of this process 55
over enzymatic hydrolysis is its high hydrolysis rate. However, depending on the 56
reaction conditions, glucose can be further degraded into other smaller molecules, 57
thus decreasing the yield (Geboers et al. 2011). Moreover, some of the degradation 58
products of glucose act as inhibitors in subsequent fermentation steps. In the 59
degradation reactions, glucose is dehydrated to yield 5-hydroxymethylfurfural (5-60
HMF), which in turn undergoes further decomposition to levulinic acid and formic acid 61
in aqueous media (Alonso et al. 2013; Brandt et al. 2013). 62
To the best of our knowledge, there is no report describing a way to optimize glucose 63
yield in the chemoselective hydrolysis of cellulose into glucose. Accordingly, this 64
work was undertaken with the aims of optimizing the process variables of the 65
chemical hydrolysis of cellulose to glucose and defining the operational conditions of 66
temperature, acid concentration, catalyst strength and type of cellulose that maximize 67
the glucose yield. 68
69
2. Experimental Section 70
Acids, fibrous cellulose (C6288) and microgranular cellulose (C6413) both from 71
cotton linters were purchased from Sigma-Aldrich and used without any further 72
4
purification or treatment. Hydrolysis reactions were carried out batch-wise in a 73
magnetically stirred 100 mL thermostated Teflon-lined steel Berghof reactor 74
equipped with a pressure addition funnel. In a typical run, 0.5 g of cellulose and 40 75
mL of water were mixed in the reactor, and the suspension was heated to the 76
reaction temperature (393 to 453 K). Then, 10 mL of acid solution was added 77
dropwise to the reactor, and “reaction time” was measure from this moment. The total 78
volume of liquid in the reactor was 50 mL. The acid concentration in the reactor 79
ranged from 0.2 to 2.5 mol/L. Aliquots were periodically taken from the reactor. In all 80
cases, the reaction was stopped after 2 h, and the mixture was quickly cooled. The 81
solution was filtered off, centrifuged and thoroughly washed with distilled water, and 82
finally the solid was dried at 353 K overnight. The amount of solid isolated was 83
determined by weighing. 84
The liquid was analyzed by HPLC (Agilent Technologies HPLC 1200 series). The 85
chromatographic separations were carried out in an AMINEX HPX-87H column at 86
338 K, using 0.6 mL/min of sulfuric acid aqueous solution (0.01 mol/L) as the mobile 87
phase. The sugars (glucose, xylose, etc.) and dehydration products (5-hydroxy-88
methylfurfural and levulinic acid) were analyzed by using a refractive index detector. 89
The components were identified by comparing their retention times with those of 90
reference samples. The products were quantified by using internal calibration curves. 91
The glucose and levulinic acid yields were calculated with the following equations: 92
% Glucose Yield = Gcon *100 / GMx (1) 93
% Levulinic Avid Yield = Lcon *100 / LMx (2) 94
Gcon is the glucose concentration measured, GMx is the maximum concentration of 95
glucose that can be obtained based on the amount of cellulose fed to the reactor, Lcon 96

5
is the levulinic acid concentration and LMx is the maximum concentration of levulinic 97
acid that can be formed from the cellulose added. 98
X-ray diffraction profiles of samples were recorded with a X’Pert Pro PANalytical 99
diffractometer equipped with a CuKα radiation source (λ = 0.15418 nm) and 100
X’Celerator detector based on RTMS (Real Time Multiple Strip). The samples were 101
ground and placed on a stainless steel plate. The diffraction patterns were recorded 102
in steps over a range of Bragg angles (2θ) between 4 and 90°, at a scanning rate of 103
0.02° per step and an accumulation time of 50 sec. Diffractograms were analyzed 104
with the X’Pert HighScore Plus software. 105
106
3. RESULTS 107
We studied the hydrolysis of cellulose to sugar with the objective of maximizing 108
glucose yield. For this purpose, we investigated several reaction variables, such as 109
reaction temperature, catalyst concentration, acid catalyst strength and cellulose 110
precursor type (fibrous or microgranular). No attention was paid to the behavior of 5-111
hydroxymethyl furfural (5-HMF) because its concentration was very low. The 5-HMF 112
concentration was low because the hydrolysis reaction was carried out in an aqueous 113
medium and because secondary reactions occurred simultaneously (Figure 1), which 114
has been observed by other authors under similar reaction conditions (Girisuta et al. 115
2013). Indeed, 5-HMF decomposes by hydration into levulinic acid and formic acid. 116
Therefore, this work focuses only on the conversion of cellulose into glucose and 117
levulinic acid. 118
119
3.1. Effect of acid concentration 120

6
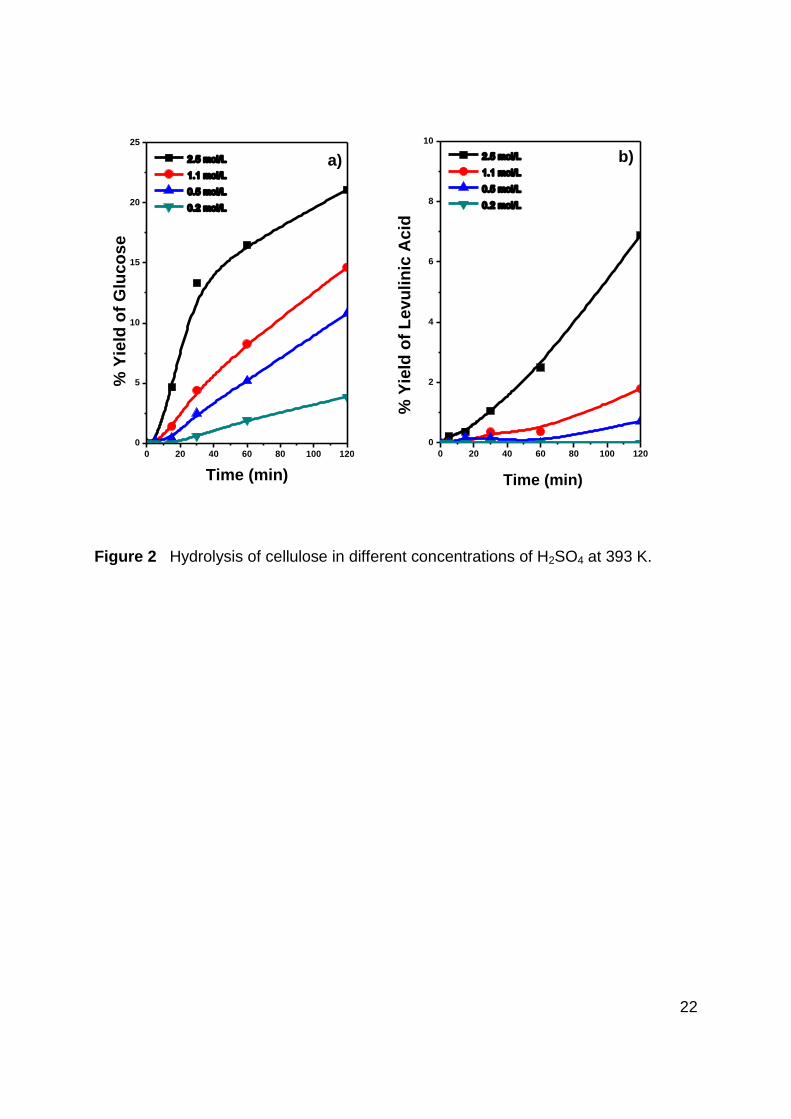
First, we investigated the effect of catalyst (sulfuric acid) concentration on the 121
glucose yield. At low reaction temperature, using a higher concentration of sulfuric 122
acid, results in a higher glucose yield (Figure 2). The concentration of glucose 123
increases linearly with acid concentration, except at the highest concentration (2.5 124
mol/L). The glucose concentration was found to drop slightly when long reaction 125
times are used. In general, the extent of levulinic acid formation is low, and it 126
increases with the sulfuric acid concentration (Figure 2). This increase is abrupt, 127
however, for a sulfuric acid concentration of 2.5 mol/L. Moreover, the concentration 128
of levulinic acid increases sharply with long reaction times. Such changes in levulinic 129
acid formation occur in parallel with a drop in glucose concentration (Figure 2). A 130
similar trend was observed when reaction temperature was increased to 413 K 131
(Figure 3). The rate of glucose formation increases linearly versus time when acid 132
concentration is increased as in the previous case but it deviates from linearity at 133
long reaction times when 2.5 mol/L acid is used. A different behavior is observed in 134
the profile of glucose formation: the concentration increases sharply at short reaction 135
times (up to 30 min), then reaches a maximum and finally decreases sharply (Figure 136
3). It is also observed in Figure 3 that the levulinic acid concentration is very low if 137
sulfuric acid concentration is low (0.5 and 0.2 mol/L). A low concentration of levulinic 138
acid is obtained at short reaction times when 1.1 mol/L acid is used, although it 139
increases at long reaction times. In contrast, the formation of levulinic acid is fast for 140
an acid concentration of 2.5 mol/L, and it reaches a concentration that corresponds 141
to a yield of 60% with respect to the cellulose fed. 142
The kinetic profiles of glucose formation at 433 K are somewhat different. With the 143
exception of a sulfuric acid concentration of 0.2 mol/L, the glucose concentration 144

7
increased at low reaction times, then reached a maximum and finally decreased 145
(Figure 4). The consecutive reactions of cellulose hydrolysis to glucose and glucose 146
conversion to levulinic acid have been observed by other authors (Girisuta et al. 147
2013; Gurgel et al. 2011). Significantly, both the reaction time and concentration that 148
provide maximum yield depend on the acid concentration. Higher concentration of 149
acid corresponded to an earlier maximum and a lower concentration of glucose 150
(Figure 4). The concentration profiles indicate that, at a reaction temperature of 433 151
K, levulinic acid is formed at all concentrations of the acid (Figure 4). However, the 152
shape profiles are somewhat different for different concentrations. For an acid 153
concentration of 2.5 mol/L, the levulinic acid profile shows a quick increase at short 154
reaction times (15 min), and then the increase slows at longer reaction times. At 1 h 155
reaction time, the concentration of levulinic acid corresponds to a yield of 60% with 156
respect to the cellulose fed. As the concentration of acid decreases, the formation 157
rate of levulinic acid drops. However, the increase in the concentration of levulinic 158
acid is not linear: an increase in the formation rate was found once the glucose 159
concentration reached its maximum (Figure 4). The observed behavior is related to 160
the reaction scheme (Figure 1). Strong acids catalyze the hydrolysis of cellulose to 161
glucose, but these acids also catalyze the subsequent dehydration reaction to 5-162
hydroxy-methylfurfural (HMF) and the formation of levulinic acid (Girisuta et al. 2013; 163
Gurgel et al. 2011; Pilath et al. 2010). The observed behavior is clearly an example 164
of consecutive reactions; the higher concentration of acid and higher temperature 165
clearly favors secondary reactions that yield levulinic acid. Because the cellulose 166
hydrolysis was conducted in aqueous media, HMF was not detected. When it forms, 167
the HMF quickly reacts to form levulinic acid. 168
8
169
Effect of temperature 170
The yield to levulinic acid was very low for sulfuric acid concentrations in the range of 171
0.5 - 0.2 mol/L and temperatures of 393 and 413 K, as the main objective of this work 172
was the optimization of glucose yield from cellulose hydrolysis, so we decided to 173
focus on studying the effect of temperature in the lowest region of acid concentration. 174
When a concentration of 0.5 mol/L was used, a linear increase in the concentration of 175
glucose was observed at the lowest temperature even though a reduction in the 176
increase of glucose concentration at long reaction times was recorded at a reaction 177
temperature of 433 K (Figure 2a, Figure 3a, Figure 4a). In general, levulinic acid 178
formation is rather low but increases with reaction temperature (Figure 2b, Figure 3b, 179
Figure 4b). However, at a reaction temperature of 413 K, the levulinic acid 180
concentration is moderate at short reaction times, but increases quickly at longer 181
reaction times. This change in levulinic acid formation happens at the same time as 182
the slowing of the increase in glucose concentration (Figure 2, Figure 3, Figure 4), 183
this decrease in sugars formation was observed previously (Amarasekara & Wiredu 184
2012). 185
A similar trend is observed with a concentration of 0.2 mol/L (Figure 2a, Figure 3a, 186
Figure 4a), an increase in the reaction temperature causes an increase in the rate of 187
formation of glucose, and an increase in the glucose concentration is linear for the 188
lower temperatures tested (393 and 413 K). This linearity is lost at long reaction 189
times with a reaction temperature of 433 K (Figure 4a). In general, the levulinic acid 190
formation is low and increases with sulfuric acid concentration (Figure 2b, Figure 3b, 191
Figure 4b). However, when the reaction temperature is 433 K, the levulinic acid 192

9
concentration is not very high at short reaction times, but increases at longer times. It 193
is clear that the change in levulinic acid formation occurs when the glucose formation 194
is higher because is a secondary product from glucose (Figure 4b). 195
The catalytic behavior is in agreement with previous studies of the degradation of 196
cellulose, which reported that secondary products are formed from glucose at 197
temperatures higher than 413 K (Girisuta et al. 2013; Gurgel et al. 2011; Pilath et al. 198
2010). These data indicate unambiguously that conditions of low sulfuric acid 199
concentration (0.5 mol/L and 0.2 mol/L) and moderate temperature (413 K) yield the 200
highest concentration of glucose and produce a very low concentration of levulinic 201
acid. 202
203
3.2. Effect of the acid strength of the catalyst 204
We determined the effect of acid strength on cellulose hydrolysis. For this purpose, 205
several acids with pKa values ranging from 4.8 to -6.6 were used (Table 1). The 206
concentration of every acid catalyst was kept constant at 0.2 mol/L. We note that the 207
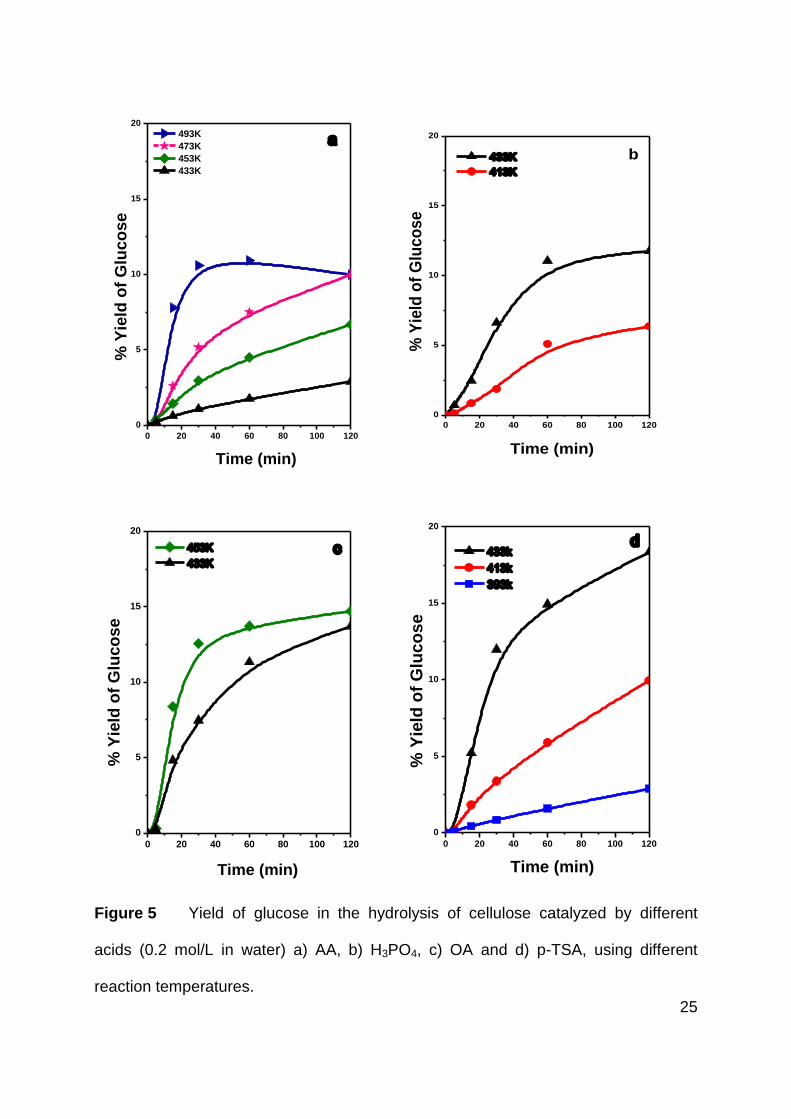
reaction temperature used depends on the acid strength of the catalyst (Figure 5); 208
the less acidic catalyst requires a higher reaction temperature to produce measurable 209
amounts of glucose product. There is a correlation between the cellulose conversion 210
and acid strength: the higher the pKa, the less active the catalyst (Figure 5, Table 1). 211
Consequently, a higher reaction temperature is needed. For all samples, glucose 212
yield increases at higher temperatures. However, as all catalysts were tested at 433 213
K, their performances can be compared. Figure 2a, Figure 3a, Figure 4a and Figure 214
5 show the hydrolysis yields, which indicate that the strength of the acid has a strong 215
effect on glucose yield: higher glucose yields are obtained with stronger acids (lower 216
10
pKa). This trend is similar to what was reported for the hydrolysis of cellulose 217
dissolved in ionic liquids (Morales-delaRosa et al. 2012; Rinaldi & Schüth 2009). 218
However, the two acids with negative pKa values produced similar glucose yields. 219
This is due to the fact that a strong acid is needed to hydrolyze the -glycosidic 220
bonds (Shimizu et al. 2009). The most promising results have been obtained with 221
acids like sulfuric acid and p-TSA, which have negative pKa values. For these two 222
acids, the yield of levulinic acid was also quantified (Figure 6). These two catalysts 223
produced a very low concentration of levulinic acid at lower temperatures (393 K and 224
413 K), but the yield increased slightly at 433 K. We also observed that the levulinic 225
acid concentration increases at long reaction times, as the linearity of glucose yield 226
decreases. 227
228
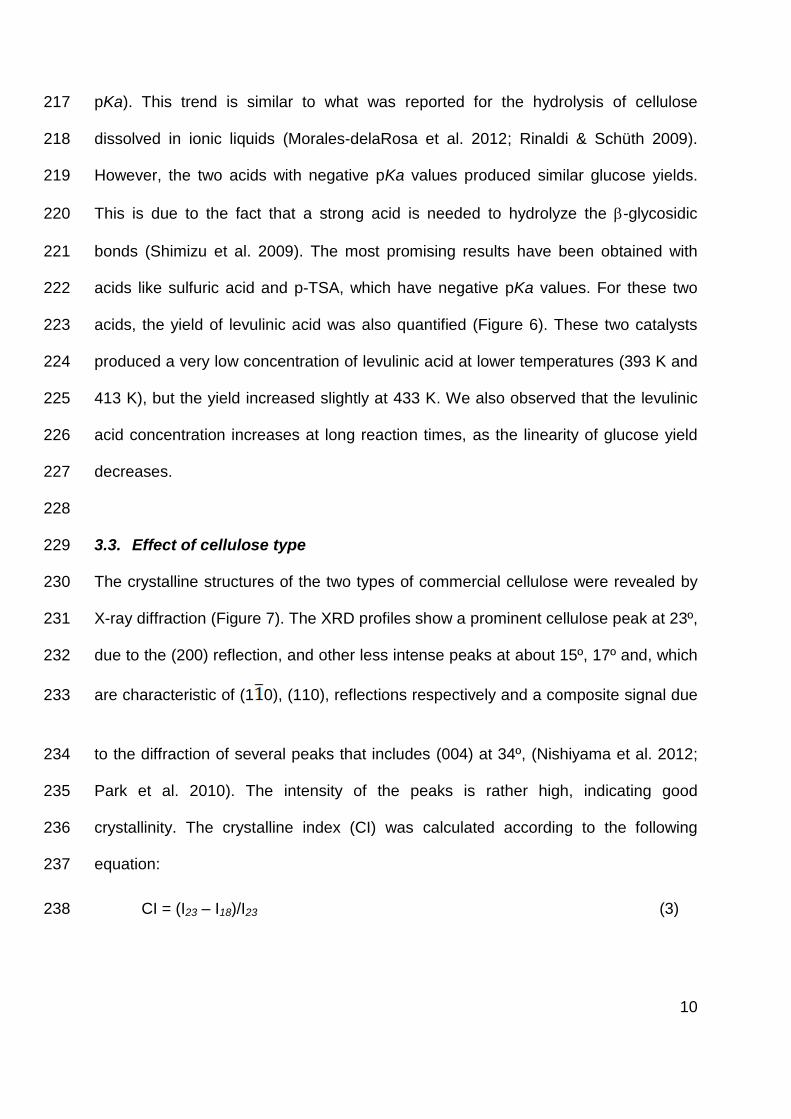
3.3. Effect of cellulose type 229
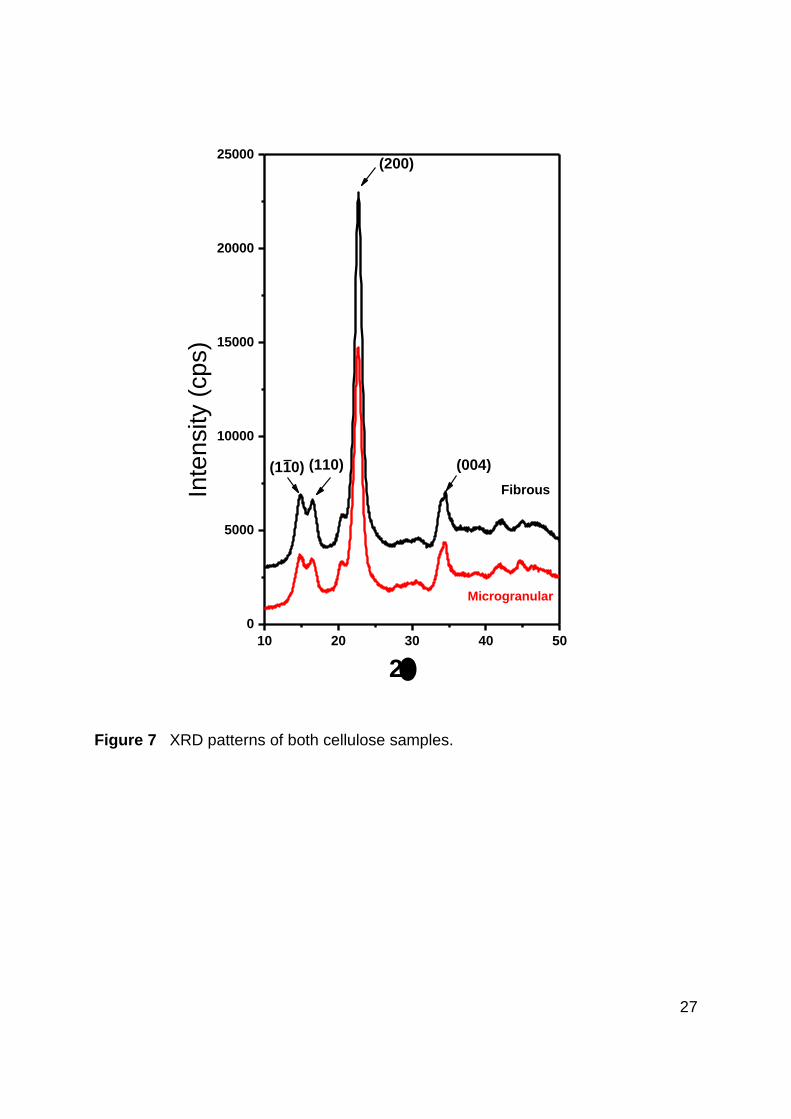
The crystalline structures of the two types of commercial cellulose were revealed by 230
X-ray diffraction (Figure 7). The XRD profiles show a prominent cellulose peak at 23º, 231
due to the (200) reflection, and other less intense peaks at about 15º, 17º and, which 232
are characteristic of (1 0), (110), reflections respectively and a composite signal due 233
to the diffraction of several peaks that includes (004) at 34º, (Nishiyama et al. 2012; 234
Park et al. 2010). The intensity of the peaks is rather high, indicating good 235
crystallinity. The crystalline index (CI) was calculated according to the following 236
equation: 237
CI = (I23 – I18)/I23 (3) 238

11
Here, I23 and I18 are the net intensities of the peak at 23º and the signal at 18º 239
respectively, (Park et al. 2010), this index is also known as Segal CI (French & 240
Santiago Cintrón 2013). Using this procedure, we found that the CI was about 85% 241
for the microgranular sample and 92% for the fibrous sample (Table 2). However, 242
recent studies showed showed a very good agreement between crystallite size and 243
CI which do not imples presence of amorphous material (French & Santiago Cintrón 244
2013), because CI can over-estimates the amount of "amorphous" material due to 245
the overlap of the neighboring diffraction peaks in the area of 18º. We have 246
calculated the peak width at half of the maximum peak intensity (PWHM) values of 247
the most intense peak for both samples (Table 2) and the crystalline size using the 248
Scherrer equation with shape factor of 1.0 (French & Santiago Cintrón 2013). PWHM 249
(Peak Width Half Maximum) of microgranular sample is larger than fibrous 250
counterpart that implies a smaller crystallite size for migrogramular cellulose (6.6 nm) 251
than 7.6 nm for fribrous one (Table 2). Based on these data and previous works we 252
can indicate that the the amount of "amorphous" material are overestimate using the 253
CI method. 254
These two types of cellulose (microgranular and fibrous) were hydrolyzed with 255
sulfuric acid and p-TSA (0.2 mol/L) at a reaction temperature of 413 K. For the 256
microgranular sample, the glucose concentration was found to increase almost 257
linearly with reaction time (Figure 8). For the fibrous sample, some deviation from 258
linearity was observed in the glucose yield, and for a given reaction time the glucose 259
yield of the fibrous sample was lower than that of the microgranular sample. 260
The yield of glucose was similar for the two acids employed, although a slightly 261
higher glucose yield was obtained when sulfuric acid was used as a catalyst. This 262

12
improvement is more evident when using fibrous cellulose. Apparently, higher acidity 263
is required for the hydrolysis of cellulose with high crystallite size (fibrous samples). 264
265
4. DISCUSSION 266
The hydrolysis of cellulose implies breaking of the β-1,4-glycosidic bonds of the 267
polymeric structure which is an essential step for the conversion of cellulose into 268
oligosaccharides. Direct hydrolysis of lignocellulose with acids has long been studied 269
and many processes were reported to be effective. In most of these studies mineral 270
acids (HCl, H2SO4) and organic acids (oxalic, maleic, fumaric) were found particularly 271
suited for the production of glucose, that can degrade first to hydroxymethyl furfural 272
(HMF) and finally to levulinic acid and formic acid (FA) (Scheme 1). Acid hydrolysis of 273
cellulose is a kinetic process which is mostly controlled by: (i) the nature of cellulose 274
precursor, (ii) the pKa of the acid, (iii), the acid concentration, and (iv) the reaction 275
temperature. 276
As most cellulose is crystalline, harsh conditions (high temperatures, high acid 277
concentrations) are required in order to liberate glucose from these tightly associated 278
chains. If hydrolysis temperature is high, occurrence of pyrolysis and other side 279
reactions become important, and the amount of tars and other difficult to handle by-280
products increases as the temperature is raised above a given temperature levels. In 281
addition, controlling reaction times for maximum glucose yields at very short 282
hydrolysis times presents severe commercial challenges. 283
The data obtained by comparing the concentration of acid hydrolysis clearly indicate 284
the possibility to control the hydrolysis to desired products. Under conditions of 285
hydrolysis with high concentrations of strong acid, a high yield to glucose is obtained 286

13
in the first minutes of reaction time but the glucose breaks down at longer reaction 287
times (Amarasekara & Wiredu 2012; Lenihan et al. 2010), under high acid 288
concentration high yield to secondary products (levulinic acid) is obtained. These 289
secondary reactions have been minimized when low acid concentration is employed, 290
especially for 0.2 mol/L concentration. 291
Another important parameter to tune the products to be obtained is the hydrolysis 292
temperature. At higher temperature, the hydrolysis of cellulose to glucose was very 293
fast but simultaneously the glucose decomposes rapidly to secondary products. So, 294
to obtain high glucose selectivity is necessary to operate at moderate temperatures 295
(393K), at this temperature the hydrolysis rate is moderate but the formation of 296
levulinic acid is very small. However, high selectivity to levulinic acid can be obtained 297
when high hydrolysis temperature is employed. 298
Despite the low glucose yields afforded in this study, there is a potential to intensify 299
cellulose hydrolysis in dilute H2SO4. As reported in Figure 8, the glucose yield was 300
found to be substantially higher with microgranular cellulose using either H2SO4 or p-301
TSA. This reactivity patterns is similar to that reported by Kupiainen et al. (Kupiainen 302
et al. 2010) who found two-fold higher glucose yield from organosolv pulp than from 303
microcrystalline cellulose. In other words, more deconstructed polymeric precursor 304
becomes more reactive to acid attack, and there is no need to increase so much 305
reaction temperature, with subsequent inhibition of the consecutive reactions leading 306
to levulinic acid. 307
With regards to the effect of the nature of the acid used (Figures 3, 4 and 5a-d) on 308
the product distribution it is clear that H2SO4 and p-TSA acids produce higher 309
amounts of hydrolysis products, although at higher reaction temperatures they are 310
14
able to drive the transformation of cellulose quite further, providing higher amounts of 311
dehydration products HMF and then levulinic acid. This behaviour is due to the 312
higher acid strength of both acids in comparison with AA, OA and H3PO3 acids. The 313
superior strength of H2SO4 (pKa = -6.6) probably boost the depolymerization of 314
cellulose into glucose, but also the transformation of the evolving monosaccharide 315
into the corresponding dehydration products, leading to an overall higher yield 316
towards solubilized products than that recorded with the other acids. 317
We have detected that for a given reaction time the glucose yield of the fibrous 318
sample was lower than that of the microgranular sample. This finding is consistent 319
with what would be expected when taking into account the higher crystallite size of 320
the fibrous sample. The hydrolysis of cellulose is slower when the cellulose crystallite 321
size is higher, because a sample with low crystallite size has more surface area per 322
gram of sample (Park et al. 2010) and lower length chain (Nishiyama et al. 2012), 323
these properties increase the reaction rate of the hydrolysis of cellulose chains 324
(Girisuta et al. 2007; Sharples 1957; Sharples 1958). 325
326
5. Conclusions 327
In the present work, we investigated the acid hydrolysis of cellulose in an aqueous 328
medium to maximize the glucose yield and minimize the formation of by-products. At 329
low concentrations of sulfuric acid, the selectivity for glucose was high, but it 330
decreased with increasing acid concentration. This effect is more evident at long 331
reaction times. High reaction temperatures increase the reaction rate, but the glucose 332
yield increases at short reaction times and then decreases at longer reaction times. 333
This effect was found to be even more evident with increasing acid concentration. It 334
15
was also revealed that the yield of levulinic acid followed an opposing trend. This is 335
due to the occurrence of secondary reactions that form levulinic acid at the expense 336
of glucose (Figure 1). A high yield of levulinic acid (60%) was recorded at 433 K for a 337
reaction time of 1 h and an acid concentration of 2.5 mol/L. In addition, the acid 338
strength of the catalyst is also a key factor in cellulose hydrolysis. A higher glucose 339
yield can be obtained if an acid of low pKa (stronger acid) is employed. A strong acid 340
(pKa < 0) is essential for high glucose yield. The crystallite size of the cellulose 341
influences its reactivity, because samples with larger crystallite size are more 342
resistant to chemical hydrolysis. The highest selectivity for glucose over levulinic acid 343
is obtained at 413 K and a sulfuric acid concentration of 0.2 to 0.5 mol/L. Under these 344
conditions, a glucose yield of 20%, with no levulinic acid, was recorded with a 345
reaction time of only 2 h. 346
347
ACKNOWLEDGEMENTS 348
We are grateful to our research sponsors, Comunidad de Madrid (Spain) 349
(S2009/ENE-1743) and CSIC (Spain) (201080E008 and 201180E038). 350
351
REFERENCES 352
Alonso DM, Bond JQ, Dumesic JA (2010) Catalytic conversion of biomass to 353
biofuels. Green Chem. 12(9): 1493 354
Alonso DM, Gallo JMR, Mellmer MA, Wettstein SG, Dumesic JA (2013) Direct 355
conversion of cellulose to levulinic acid and gamma-valerolactone using solid 356
acid catalysts. Catal. Sci. Tech. 3(4): 927 357
Amarasekara AS, Wiredu B (2012) Aryl sulfonic acid catalyzed hydrolysis of cellulose 358
in water. Appl. Catal., A 417-418: 259-262 359

16
Brandt A, Gräsvik J, Hallett JP, Welton T (2013) Deconstruction of lignocellulosic 360
biomass with ionic liquids. Green Chem. 15(3): 550 361
El-Zawawy WK, Ibrahim MM, Abdel-Fattah YR, Soliman NA, Mahmoud MM (2011) 362
Acid and enzyme hydrolysis to convert pretreated lignocellulosic materials into 363
glucose for ethanol production. Carbohydr. Polym. 84(3): 865-871 364
French A, Santiago Cintrón M (2013) Cellulose polymorphy, crystallite size, and the 365
Segal Crystallinity Index. Cellulose 20(1): 583-588 366
Geboers JA, Van de Vyver S, Ooms R, Op de Beeck B, Jacobs PA, Sels BF (2011) 367
Chemocatalytic conversion of cellulose: opportunities, advances and pitfalls. 368
Catal. Sci. Tech. 1(5): 714 369
Girisuta B, Dussan K, Haverty D, Leahy JJ, Hayes MHB (2013) A kinetic study of 370
acid catalysed hydrolysis of sugar cane bagasse to levulinic acid. Chem. Eng. 371
J. 217: 61-70 372
Girisuta B, Janssen LPBM, Heeres HJ (2007) Kinetic Study on the Acid-Catalyzed 373
Hydrolysis of Cellulose to Levulinic Acid. Industrial & Engineering Chemistry 374
Research 46(6): 1696-1708 375
Gurgel LVA, Marabezi K, Zanbom MD, Curvelo AAdS (2011) Dilute Acid Hydrolysis 376
of Sugar Cane Bagasse at High Temperatures: A Kinetic Study of Cellulose 377
Saccharification and Glucose Decomposition. Part I: Sulfuric Acid as the 378
Catalyst. Industrial & Engineering Chemistry Research 51(3): 1173-1185 379
Huang HJ, Ramaswamy S, Tschirner UW, Ramarao BV (2008) A review of 380
separation technologies in current and future biorefineries. Sep. Purif. 381
Technol. 62(1): 1-21 382

17
Kupiainen L, Ahola J, Tanskanen J (2010) Comparison of Formic and Sulfuric Acids 383
as a Glucose Decomposition Catalyst. Industrial & Engineering Chemistry 384
Research 49(18): 8444-8449 385
Lenihan P, Orozco A, O’Neill E, Ahmad MNM, Rooney DW, Walker GM (2010) Dilute 386
acid hydrolysis of lignocellulosic biomass. Chem. Eng. J. 156(2): 395-403 387
Limayem A, Ricke SC (2012) Lignocellulosic biomass for bioethanol production: 388
Current perspectives, potential issues and future prospects. Prog. Energy 389
Combust. Sci. 38(4): 449-467 390
Maki-Arvela P, Salmi T, Holmbom B, Willfor S, Murzin DY (2011) Synthesis of sugars 391
by hydrolysis of hemicelluloses--a review. Chem. Rev. 111(9): 5638-5666 392
Morales-delaRosa S, Campos-Martin JM (2014) Catalytic processes and catalyst 393
development in biorefining In: Waldron KW (ed) Advances in biorefineries. vol 394
Woodhead Publishing Series in Energy. Woodhead Publishing, Oxford, UK. p 395
152-198 396
Morales-delaRosa S, Campos-Martin JM, Fierro JLG (2012) High glucose yields from 397
the hydrolysis of cellulose dissolved in ionic liquids. Chem. Eng. J. 181-182: 398
538-541 399
Nishiyama Y, Johnson G, French A (2012) Diffraction from nonperiodic models of 400
cellulose crystals. Cellulose 19(2): 319-336 401
Park S, Baker JO, Himmel ME, Parilla PA, Johnson DK (2010) Cellulose crystallinity 402
index: measurement techniques and their impact on interpreting cellulase 403
performance. Biotechnology for biofuels 3: 10 404
Pilath HM, Nimlos MR, Mittal A, Himmel ME, Johnson DK (2010) Glucose Reversion 405
Reaction Kinetics. J. Agric. Food. Chem. 58(10): 6131-6140 406

18
Rinaldi R, Schüth F (2009) Acid Hydrolysis of Cellulose as the Entry Point into 407
Biorefinery Schemes. ChemSusChem 2(12): 1096-1107 408
Sharples A (1957) The hydrolysis of cellulose and its relation to structure. 409
Transactions of the Faraday Society 53(0): 1003-1013 410
Sharples A (1958) The hydrolysis of cellulose and its relation to structure. Part 2. 411
Transactions of the Faraday Society 54(0): 913-917 412
Shimizu K-i, Furukawa H, Kobayashi N, Itaya Y, Satsuma A (2009) Effects of 413
Brønsted and Lewis acidities on activity and selectivity of heteropolyacid-414
based catalysts for hydrolysis of cellobiose and cellulose. Green Chem. 415
11(10): 1627 416
Sun Y, Cheng J (2002) Hydrolysis of lignocellulosic materials for ethanol production: 417
a review. Bioresour. Technol. 83(1): 1-11 418
Tian J, Wang J, Zhao S, Jiang C, Zhang X, Wang X (2010) Hydrolysis of cellulose by 419
the heteropoly acid H3PW12O40. Cellulose 17(3): 587-594 420
Van de Vyver S, Geboers J, Jacobs PA, Sels BF (2011) Recent Advances in the 421
Catalytic Conversion of Cellulose. ChemCatChem 3(1): 82-94 422
423
424

19
Table 1 Acid catalysts used for the hydrolysis of cellulose.
Formula Abbreviation pKa
H2SO4 H2SO4 -6.6
p-TSA -2.5
OA 1.19
H3PO4 H3PO4 2.1
AA 4.8

20
Table 2 Peak width half maximum (PWHM), crystallite size, intensity at 18º and
23º and Segal CI of studied samples.
Sample PWHM (º) Crystallite size (nm)
Intensity at 18º (c.p.s.)
Intensity at 23º peak (c.p.s.)
CI
Microgranular 1.37 6.6 1739 11755 85 %
Fibrose 1.16 7.8 1657 20507 92 %

21
Figure 1 Successive reactions that can occur during cellulose hydrolysis.
22
0 20 40 60 80 100 120
0
5
10
15
20
25
a) 2.5 mol/L
1.1 mol/L
0.5 mol/L
0.2 mol/L
%
Yie
ld o
f G
luc
os
e
Time (min)
0 20 40 60 80 100 120
0
2
4
6
8
10
b) 2.5 mol/L
1.1 mol/L
0.5 mol/L
0.2 mol/L
% Y
ield
of
Levu
lin
ic A
cid
Time (min)
Figure 2 Hydrolysis of cellulose in different concentrations of H2SO4 at 393 K.

23
0 20 40 60 80 100 120
0
5
10
15
20
25
a)
2.5 mol/L
1.1 mol/L
0.5 mol/L
0.2 mol/L
% Y
ield
of
Glu
co
se
Time (min)
0 20 40 60 80 100 120
0
10
20
30
40
50
60
70
b) 2.5 mol/L
1.1 mol/L
0.5 mol/L
0.2 mol/L
% Y
ield
of
Le
vu
lin
ic A
cid
Time (min)
Figure 3 Hydrolysis of cellulose in different concentrations of H2SO4 at 413 K.

24
0 20 40 60 80 100 120
0
5
10
15
20
25
a) 2.5 mol/L
1.1 mol/L
0.5 mol/L
0.2 mol/L
Time (min)
% Y
ield
of
Glu
co
se
0 20 40 60 80 100 120
0
10
20
30
40
50
60
70
80
b) 2.5 mol/L
1.1 mol/L
0.5 mol/L
0.2 mol/L
% Y
ield
of
Le
vu
lin
ic A
cid
Time (min)
Figure 4 Hydrolysis of cellulose in different concentrations of H2SO4 at 433 K.
25
0 20 40 60 80 100 120
0
5
10
15
20
Time (min)
% Y
ield
of
Glu
co
se
493K
473K
453K
433K
a
0 20 40 60 80 100 120
0
5
10
15
20
Time (min)
% Y
ield
of
Glu
co
se
433K
413K
b
0 20 40 60 80 100 120
0
5
10
15
20
Time (min)
c
% Y
ield
of
Glu
co
se
453K
433K
0 20 40 60 80 100 120
0
5
10
15
20
Time (min)
% Y
ield
of
Glu
co
se
d
433k
413k
393k
Figure 5 Yield of glucose in the hydrolysis of cellulose catalyzed by different
acids (0.2 mol/L in water) a) AA, b) H3PO4, c) OA and d) p-TSA, using different
reaction temperatures.

26
0 20 40 60 80 100 1200
1
2
3
4
5
6
7
8
Time (min)
% Y
ield
of
Le
vu
lin
ic A
cid
433k
413k
393k
a
0 20 40 60 80 100 1200
1
2
3
4
5
6
7
8
433k
413k
393k
Time (min)
% Y
ield
of
Le
vu
lin
ic A
cid
b
Figure 6 Yield of levulinic acid in the hydrolysis of cellulose using 0.2 mol/L p-TSA
(a) or H2SO4 (b) in water at different temperatures.
27
10 20 30 40 50
0
5000
10000
15000
20000
25000
Microgranular
(004)
(200)
(110)
Fibrous
2
Inte
nsity (
cp
s)
(110)
Figure 7 XRD patterns of both cellulose samples.

28
0 20 40 60 80 100 1200
5
10
15
20
a
Time (min)
% Y
ield
of
Glu
co
se
Microgranular
Fibrous
0 20 40 60 80 100 1200
5
10
15
20 Microgranular
Fibrous b
Time (min)
% Y
ield
of
Glu
co
se
Figure 8 Yield of glucose in the hydrolysis of two different kinds of cellulose using
0.2 mol/L sulfuric acid (a) or p-TSA (b) in water at a reaction temperature
of 413 K.