optimization of pre-hydrolysis conditions for the
TRANSCRIPT

This thesis comprises 30 ECTS credits and is a compulsory part in the Master of Science
With a Major in Chemical Engineering – Environmental Engineering, 120 ECTS credits; No. 9/2011
With a Major in Resource Recovery – Industrial Biotechnology, 120 ECTS credits; No. 10/2011
Optimization of Pre-hydrolysis
conditions for the production of
Biogas
Ignatius Ekwe, Awasume ([email protected])
Abel Prince Jabakumar, Sathiyaraj ([email protected])

1
Master thesis
Subject Category: Sustainable Technology and Industrial Biotechnology
University of Borås
School of Engineering
SE-501 90 BORÅS
Telephone +46 033 435 4640
Examiner: Ilona Sárvári Horváth
Supervisor’s name: Ilona Sárvári Horváth
Supervisor’s address: University of Borås
School of Engineering
SE-501 90 BORÅS
Telephone +46 033 435 4640
University of Borås
School of Engineering
SE-501 90 BORÅS
Telephone +46 033 435 4640
Client: University of Borås
Date: 2011-12-19
Keywords: Biogas, Pre-hydrolysis, substrate, process indicators, anaerobic
digestion

2
Acknowledgement
The authors are heartily thankful to their supervisor Ilona Sárvári Horváth whose guidance
and support from the initial to the final level of this thesis work enabled us to gain a deeper
understanding of the project.
We equally extend our sincere gratitude to the following persons who never ceased in helping
until this work was complete.
Solmaz Aslanzadeh: For sharing her precious time and positive insight in coping with
associated challenges of the project.
Hanson Jonas: Your assistance and patience over our laboratory experiments given the limited
resources vis-a-vis students demand is quite reminding and saluted.
The support team at Sobacken Biogas plant: Your concern and timely assistance beginning from
the supply of the substrate and the opportunity granted us to use your laboratory station greatly
ensured results validation.
Above all, we thank God for his divine intervention in the realization of this academic endeavor
amidst enormous difficulties.

3
Abstract
Hydrolysis and solubilisation of organic material is known to be the rate limiting step during
anaerobic digestion. In this study, the effect of pre-hydrolysis was investigated. The substrate
had a composition of the following wastes streams: fish and slaughterhouse waste, cleaning
waste, doggy meat, doggy sludge, doggy dry food, mink (fur), Norway slurry, SOR2-
Industrial waste, and municipal solid waste (MSW) from households in Borås community.
Analyses were made on two batches of experiments performed at two different mesophilic
temperature conditions; 34 0C and 42
0C and with or without the addition of mesophilic
sludge obtained from a waste water treatment plant. One of the substrate maintained the
original carbon/nitrogen (C/N) ratio, and for the other substrate the carbon nitrogen ratio was
then slightly increased by adding 7.98g of special shredded paper which contains 82% volatile
solids (VS). The experiments were run for 7days with samples collected regularly after 0 day,
4 days, 5 days, 6 days and 7 days retention time. Chemical oxygen demand (COD), pH, total
nitrogen, and volatile fatty acids (VFAs) as process indicators were analyzed.
The results showed that at 42 0C the rate of hydrolysis was faster with a higher COD release
and removal. The optimum retention time for hydrolysis was 4 days and any longer time
caused some of the carbon to be lost to carbon dioxide. The effect of adding mesophilic
sludge had no significant effect. An increased C/N ratio resulted in a balanced system with
lower VFAs produced compared with that from the original substrate mixture.

4
Table of Contents
Acknowledgement .................................................................................................................... 2
Abstract ..................................................................................................................................... 3 List of the figures ...................................................................................................................... 5 List of the tables ........................................................................................................................ 6 1.0 Introduction ................................................................................................................ 7 1.1 Purpose of Study (Objectives and scope) ................................................................. 9
2.0 Anaerobic Digestion (AD) for Biogas production at Sobacken ........................... 10 1. Figure 1: the flow chart of biogas production process at Sobacken. ................... 10 2.1 Biochemical Reactions ............................................................................................. 11
2.1.1 Hydrolysis ................................................................................................................. 12 2.1.2 Acidification/Fermentation (Acidogenesis) ............................................................ 13 2.1.3 Acetogenesis .............................................................................................................. 13 2.1.4 Methanogenesis: ....................................................................................................... 14
3.0 Process Parameters .................................................................................................. 15 3.1 pH ............................................................................................................................... 15 3.2 Particle size ................................................................................................................ 17 3.3 Volatile Fatty acids (VFA) ........................................................................................ 17
3.4 Temperature .............................................................................................................. 20 3.5 C/N ratio .................................................................................................................... 21 3.6 Retention time ............................................................................................................ 22
3.7 Chemical oxygen demand (COD) concentration ..................................................... 25
4.0 Materials and Methods ............................................................................................ 26 4.1 Batch Experiments. ................................................................................................... 26 4.2 Analytical methods .................................................................................................... 27
5.0 Results. ...................................................................................................................... 28 6.0 Discussion ................................................................................................................ 355
7.0 Conclusions ............................................................................................................... 37 7.0 Future work ............................................................................................................ 377 References: ............................................................................................................................ 388
Appendix ................................................................................................................................. 39 Appendix I. Calculations of substrate’s TS and VS ............................................................ 39
Appendix II: Calculation of shredded paper VS ............................................................... 400
Appendix III: Operation at 34 with mesophilic sludge ................................................. 411
Appendix IV: Operation at 34 without mesophilic sludge ............................................ 411
Appendix V: Operation at 42 with mesophilic sludge .................................................. 422
Appendix VI: Operation at 42 without mesophilic sludge ............................................ 422
Appendix VII: Operation at 34 , substrate’s C/N ratio increased with the addition of
mesophilic sludge .................................................................................................................. 433
Appendix VIII: Operation at 34 , substrate’s C/N ratio increased but without
mesophilic sludge .................................................................................................................. 433
Appendix IX: Operation at 4 , substrate’s C/N ratio increased with the addition of
mesophilic sludge .................................................................................................................. 444
Appendix X: Operation at 4 , substrate’s C/N ratio increased but without mesophilic
sludge ..................................................................................................................................... 444

5
List of the figures
Figure 1: Schematic of biogas production process at Sobacken…………………….…..........10
Figure 2: Two-phase anaerobic digestion……………………………………………..….......11
Figure 3: Schematic of biochemical processes in Anaerobic Digestion…………………..….14
Figure 4: Hydrolysis of normal substrate at 34 without mesophilic sludge…………...…...29
Figure 5: Hydrolysis of normal substrate at 42 without mesophilic sludge……………..…29
Figure 6: Sample graph of pH variation during the hydrolysis of normal substrate….............30
Figure 7: Substrate hydrolysis at 34 without the addition of mesophilic sludge…...............31
Figure 8: Substrate hydrolysis at 34 with the addition of mesophilic sludge................…...31
Figure 9: Concentrations of volatile fatty acids in the normal substrate compared under
different treatment conditions…………………………….…………......................................33
Figure 10: Correlation between COD removal and amount of total volatile fatty acids
produced in anaerobic digestion……………………………………………………..…….…34
Figure 11: Concentrations of volatile fatty acids in the C/N ratio increased substrate compared
under different treatment conditions………………………………………………….............34
Figure 12: Proportions of various volatile fatty acids in the substrate during
hydrolysis…...……………………………………………………………………………..….35

6
List of the tables
Table 1: Composition of substrate by waste type and proportion…………....………….……26
Table 2: Summary of batch experiments and experimental conditions………...….…………28

7
1.0 Introduction
The consumption of natural resources by human and animals through a series of activities
generate wastes after the intended use of the resource. Most often this waste is heterogeneous
and in a solid form; referred to as solid waste. By definition it is the unwanted and useless
parts of animal and human activities which are basically solid. Waste is a consequence of life
and varies from one society to another. However solid waste generally arises from
agricultural, industrial and social activities. The part of this waste generated from the
municipality is termed municipal solid waste (MSW) and usually contains discarded material
like papers, plastic bags, glass, metal fine earth particles, ash, sewage sludge, yard trimmings,
food residues/leftovers and dead animals (Kumar et al., 2009). Pollution problems like foul
odor-attracting vermin (wild mammals and birds which are harmful to crops, farm animals, or
game, and which carry diseases), toxic gases, groundwater contamination and wasting landfill
capacity are a consequence of unattended or poorly managed waste (Komemoto et al., 2009).
Therefore an environmentally friendly way of waste disposal is a call for concern; giving rise
to anaerobic digestion process (for the organic fraction) and combustion (for the inorganic
fraction) of waste to produce sustainable energy.
Municipal solid waste (MSW) in the city of Borås is managed by the Energy Company called
“Borås Energi och Miljö AB”. The waste from the households which has been sorted into
white bags and black bags are collected and separated at Sobacken. Here, the white bags
containing inorganic waste and can be burned are crushed and sent to the Rya plant where
they are used as fuel in the combustion facility. The biodegradable waste in black bags, left
behind at Sobacken is then fermented and turned into biogas,-a renewable fuel at the biogas
facility (www.borasenergimiljo.se).
In addition to the MSW from the households, waste from slaughterhouses and other industrial
waste streams are often used in the production of biogas for the Borås community. These
waste streams are first mixed and diluted in a buffer tank prior to biogas production.
However, because the supply of waste might be limited or not regular and based on the fact
that each component of waste (starch, cellulose and protein) is degraded under different
environmental conditions; with starch degradation increasing at low pH, cellulose at high
retention time and protein at both high retention time and neutral pH (7-9), the Sobacken
biogas plant seeks to optimize some biological and physicochemical parameters (adjusting the
environmental conditions) during hydrolysis and acidification process in the buffer tank.

8
It is believed that if the degradation process is enhanced during this stage, the quantity and
quality of biogas produced would be improved. This hypothesis is supported in the GTI final
technical report on economically and environmentally friendly production of fuel and power
from hog manure using HIMETSM
(for high methane) two stage anaerobic digestion
technology (Saber, 2009).
Also, on grounds that there are differences in nutritional requirements, kinetic growth rates,
physiologies, sensitivity levels and environmental tolerances between the fermentative
bacteria operating during hydrolysis and acidification and the more sensitive microorganism
responsible for Methanogenesis, a two phase anaerobic digestion is important (Saber, 2009).
In the same line, (Komemoto et al., 2009), underscores a two phase digestion configuration as
a more rational one because it provides suitable environments for acidification and
methanisation in two separate steps. In addition, (Pavan et al., 2000) concluded that good
methanisation yields (specific gas production around 0.6 m3/kg Total volatile solids (TVS)
can be achieved in a two phase system with mesophilic temperature of the hydrolytic reactor
and a thermophilic temperature in the methanogenic reactor. The conclusions were made in
experiments using organic fraction of municipal solid waste (OFMSW) as the feed and
12days of overall hydraulic retention time (HRT). A two stage approach has previously been
successfully applied to fruits and market waste (Viturtia et al., 1989), municipal solid waste
(Pavan et al., 2000), agro-industrial residues), and solid potato waste .The question left to
ponder about is “which of the three possible two-stage systems is best applicable?”
The performance of three temperature-phase system; (I) mesophilic first stage (37 )
mesophilic second stage (37 ), (II) mesophilic first stage (37 ) thermophilic second
stage (55 ), and (III) thermophilic first stage (55 ) thermophilic second stage (55 )
were investigated. Results showed that after specific OLR were established in the second
stage of all the systems; from 2.2g to 11.0g COD/l/d in system I, from 4.5g to 22.3g COD/l/d
in system II, and from 1.3g to 36.0g COD/l/d in system III, system I and III showed signs of
overloading of the second or methanogenic reactor due to the accumulation of VFAs.
However, in system two, no overloading was observed because the solid potato (feedstock)
load was quickly degraded completely before the OLR reached a level high enough to cause
failure (Sundin, 2008). Satisfactorily enough, high methane content and biogas was achieved
in all the systems.

9
1.1 Purpose of Study (Objectives and scope)
The limitations of conventional combined digestion method of biogas production would be
overcome if the process parameters are controlled during hydrolysis and fermentation (Saber,
2009).Generally, hydrolysis is considered to be the rate limiting step of anaerobic digestion if
the substrate is in particulate form (Veeken et al., 2000).And hydrolysis is a function of the
process parameters. (Komemoto et al., 2009) has indicated that hydrolysis can be enhanced
through the use of physico-chemical and biological pretreatment methods, and that the more
direct and economical way of improving hydrolysis is to employ microorganisms with high
degrading activity.
Focus in this study is placed on the optimization of process parameters like pH, temperature,
retention time and C: N ratio during the pre-hydrolysis conditions in the buffer tank. These
parameters will be evaluated by regular measurements of process indicators such as; volatile
fatty acid (VFA) concentration, concentration of free ammonia and dissolved chemical
oxygen demand (COD). The effect of microorganisms during hydrolysis and fermentation by
added mesophilic sludge as inoculum is also investigated.
Furthermore, to achieve an optimum hydrolytic and fermentation process in the buffer tank,
these parameters must be carefully controlled since biological processes require a constancy
of living conditions (Deublein and Steinhauser, 2008).
Although hydrolysis is said to be the rate limiting step, acetogenesis or methanogenesis can
be the rate limiting step in anaerobic digestion at high organic loading rates of easily
degradable substrates due to the accumulated VFA which results from the rapidly degradable
components. Presently this assertion is still lacking substantial backing since a more complex
structured model which has not been developed has to be used (Komemoto et al., 2009).

10
2.0 Anaerobic Digestion (AD) for Biogas production at Sobacken
1. Figure 1: the flow chart of biogas production process at Sobacken.
Figure 1.0 shows substrate flow into the Sobacken biogas plant. The plant receives substrates
in two lines. Line 1 substrates (SOR1) are solid and fluid organic waste which has been
optically separated as the black plastic bags, and line 2 substrates (SOR2) are industrial waste
from grocery stores, slaughterhouses, food production and animal waste which are both in
solid and liquid form (Rousta, 2008).
Generally, all types of waste aimed at anaerobic digestion are pre-treated in order to enhance
the quality of the substrates and improve biodegradation. At Sobacken, this pre-treatment is
done in various stages. Initially, the drum sieve machine separates the black plastic bags from
the waste which is transferred to the magnetic separator to remove any available metals from
the stream. The shredder machine then reduces the size of the waste to a desired size and the
biomass which is made into fluid by the bio separator is later transferred into buffer tank one.
Any liquid waste from line one (SOR1) is directly being pumped to the buffer tank 1 where
all the waste is treated at 55 0C for 6 hours before entering the methanizer or digestion tank.
The industrial waste from line two (SOR2) usually in solid forms is shredded and sent into the
bio separator where it is blended and separated from the packaging material before being

11
transferred into the buffer tank 2. At this stage, it is sanitized for one hour at 70 0C before
transferred into the digestion tank (Rousta, 2008).
In a simpler model, the processes taking place at Sobacken and a clear illustration of the scope
of this work can be seen as illustrated in Figure 2. Our project had a focus on optimization of
the pre-hydrolysis conditions.
Figure 2. The scope of the work.
2.1 Biochemical Reactions
Anaerobic digestion (AD) is a series of chemical reactions during which organic material is
decomposed through the metabolic pathways of naturally occurring microorganisms in an
oxygen free environment. The degradation process usually occurs in some form of a tank
called the digester. The reaction is said to be complete upon the production of a colourless,
odourless gas called methane (CH4) and carbon dioxide (CO2); while humus which is
normally returned to the soil emerges as a by product (Saber, 2009). The composition of
biogas produced in terms of percentage methane depends on the composition of the waste
used.
Feed
(CH4 + CO2) Biogas
Effluent
Prehydrolysis
Anaerobic digestion
HRT= 10 -15 days
Temp= 35 or 55
HRT= 1-3 days

12
AD occurs in four stages or sub processes which include: hydrolysis, acidification or
fermentation, acetogenesis and finally methanogenesis. Each stage is being carried out by
specific microorganisms; and the intermediates of each stage are required to be in
equilibrium. This means that the rate of products formation in one step should be balanced
with the rate of those products consumed in another step. If equilibrium is not achieved, the
process will be unstable with low efficiency or the metabolic process will collapse (Saber,
2009).
2.1.1 Hydrolysis
During this stage, complex organic compounds (carbohydrates, proteins and fats) are broken
down into their respective constituent monomers (molecules which are more soluble and
transportable through the cell membrane) by hydrolytic enzymes secreted by specific groups
of bacteria.
Polysaccharides such as cellulose are hydrolysed to glucose by cellulase enzyme;
hemicellulose and Pectin are converted to monomers like xylose, glucose, galactose, pentoses,
arabinose and mannose by pectinases and hemicellulases, while starch is converted to glucose
by amylase enzyme(Saber, 2009, Ostrem et al., 2004).
Proteins are generally hydrolysed to amino acids by protease enzymes secreted by
Bacteriodes, Butyrivibrio, Selenomonas and Stretptococcus (Saber, 2009, Ostrem et al.,
2004).
Extracellularly produced lipases secreted by lipolytic bacteria (clostridia and microccoci),
convert lipids to long chain volatile fatty acids (Ostrem et al., 2004)
An approximate chemical formula suggested by (Ostrem et al., 2004)can be used to represent
a hydrolysis reaction of carbohydrates into simple sugars. In the case of glucose, the reaction
can be illustrated by the equation 1 below.
C6H12O4 + 2H2O → C6H12O6 + 2H2……………………………………………………. (1)
(Sugar polymer) + (water) → (glucose) + (hydrogen)

13
2.1.2 Acidification/Fermentation (Acidogenesis)
This is the second step in AD process. And at this stage, acid forming bacteria which are
facultative anaerobic and being able to grow in acidic environment, break down the products
of hydrolysis into acetic acid (CH3COOH), hydrogen (H2), carbon dioxide (CO2) and
alcohols. Other lower weight simple organic acids like propionic acid and butyric acids which
are in turn converted to acetic acids can also be produced at this stage. (Yadvika et al., 2004)
Below are some typical reactions that occur during acidogenesis. In equation (2), glucose is
converted into ethanol and in equation (3), propionic acid is formed from glucose (Yadvika et
al., 2004) .
C6H12O6 ↔2CH3CH2OH +2CO2…………………………………………………….. …... (2)
(Glucose) ↔ (ethanol) + (carbon dioxide)
C6H12O6 +2H2 ↔ 2CH3CH2COOH +2H2O………………………………………………. (3)
(Glucose) + (Hydrogen) ↔ (propionic acid) + (water)
2.1.3 Acetogenesis
This is the step during which obligate hydrogen producing bacteria convert fatty acids to
acetate as the main product and hydrogen gas. However, some acetate (≈20%) and hydrogen
(≈4%) are produced during acidogenesis. As well, acetogenesis is the path way through which
biological oxygen demand (BOD) and chemical oxygen demand (COD) are reduced in AD
process. Although the presence of hydrogen is of critical importance to anaerobic digestion
process, its concentration has to be kept low enough (60ppm - 200ppm) to thermodynamically
allow the conversion (Sterling, 2001). If the concentration of hydrogen as measured by the
hydrogen partial pressure is not low, the further reactions will be inhibited. But the presence
of hydrogen consuming bacteria during methanogenesis lowers the concentration of hydrogen
and ensures the feasibility of the conversion of all acids (Salminen and Rintala, 2002).

14
2.1.4 Methanogenesis:
This is the last AD step where the soluble products of acidogenesis and acetogenesis (acetic
acids, carbon dioxide and hydrogen) are converted into a mixture of methane and carbon
dioxide (Biogas). The methanogens responsible for this conversion are divided into two
groups: H2/CO2 and acetate consumers. The acetate consumers; mainly Methanosarcina and
Methanothrix produce about 70% of methane from acetic acid while 30% is produced from
carbon dioxide by reduction with hydrogen. Methanogens are very sensitive to changes and
prefer a neutral or slightly alkaline environment (Saber, 2009), (Sterling, 2001).
Figure.3 shows a conceptual diagram of the biological processes involved in anaerobic
digestion (AD) of organic matter. It indicates the percentage of various products through one
bio-process to another.
Figure. 3 Schematic of biochemical processes in Anaerobic Digestion.(Saber, 2009)
CH4, CO2
Alcohols/
Acids
Matter
H2O, H2
Organic
Matter
Organic
Molecule
s
Acetic
Acid
15
3.0 Process Parameters
In each step of biogas process, the gas production and the decomposition rates of organic
waste is influenced by environmental factors. In a conventional single-tank (i.e. combined
phase) digestion, both fermentative bacteria and methanogenic archaea coexist in the same
vessel. The operations under these conditions represent a compromise of conditions for
growth and feedstock conversion as there are differences in their nutritional, kinetic growth
and environmental tolerances. For example, whereas the optimum pH for acid forming phase
is approximately pH 6, the single digester is usually operated at pH 7 to maintain stability of
the methane forming microorganism (Saber, 2009). In order to avoid this compromise and
optimize the gas production, the parameters listed below are closely monitored in effort to
improve the anaerobic treatment of waste and methane production.
3.1 pH
pH is usually used to measure the acidic, alkaline or neutral nature of a solution. It is defined
as the negative logarithm of hydrogen ion concentration or more precisely, H+
ion
concentration in a solution (pH= -log [H+]). A pH of 7 represents neutral conditions in an
aqueous solution at 250C, for equilibrium constant for the ionization of water into H
+ and
OH-
(Kw )=1.0 x 10⁻¹⁴
, and H+= 10
-7M and OH
- = 10
-7M. At a higher H
+ concentration, the
pH will be below 7 (acidic solution) and at a higher OH- concentration, pH will be higher than
7 (alkaline solution) (Deublein and Steinhauser, 2008). The growth of microbes during
anaerobic fermentation is affected by changes in pH. Therefore, an ideal pH range is
necessary to ensure that the process is optimized. Methane forming microorganisms will
function optimally at a desired pH range of 6.7-7.5 (Deublein and Steinhauser, 2008). Some
other literature suggests that fermentation process will be optimal at a pH range of 6.8-7.2
(Yadvika et al., 2004). Fluctuations of pH out of this range would have a negative effect in
the formation of methane. The growth of methanogenic microbes will greatly reduce at a pH
below 6.6 or if the pH reduces below this value, organic acids are produced which leads to a
further decrease of the pH and eventually stops the degradation process. And on the other
hand, if the pH is excessively alkaline, microbial granules will disintegrate and the process
will subsequently fail (Deublein and Steinhauser, 2008).

16
The concentration of volatile fatty acid and the amount of carbon dioxide produced during the
anaerobic process affects the pH of the digester content. And for anaerobic fermentation to
proceed normally, the concentration of volatile fatty acids particularly acetic acid should be
below 2000mg/l (Yadvika et al., 2004). (Shanmugam and Horan, 2009) conducted a study to
evaluate the combined effect of C: N ratio with pH control; since the C: N ratio is important
in determining free ammonia concentration. The Bio-methane potential (BMP) evaluation was
carried out at a C: N ratio of 15 with controlled pH values of 4.5, 5.5, 6.5, 7.5, and 8.5 to
study the impact on NH3-N toxicity on biogas yield. Results showed that over this pH range
(4.5-8.5), the cumulative biogas production ranged from 1258mL at pH 8.5 to 6518mL at pH
6.5. The minima biogas production at pH 8.5 coincided with the highest (3473mg/L)
ammonia production while at pH 6.5 where the volume of biogas yield was 6518mL; the
ammonia produced was 817mg/L. Their results were in line with the works of (Shanmugam
and Horan, 2009) who observed that ammonia toxicity only occurred at pH values greater
than 7.6.
It is also indicated that, methane yield is not only a function of ammonia concentration as the
lowest concentration of 515mg/l was observed at a pH of 4.5. And at this pH, the VFA
concentration/toxicity is said to be the limiting factor. This is because the VFA concentration
through a chemical equilibrium influences the pH in the waste; and for specific waste
composition, the VFA concentration and the pH can be related to each other (Veeken et al.,
2000). (Sterling, 2001) concluded that when ammonia is added to the digester, the pH was
increased until a chemical equilibrium was established.
(Yadvika et al., 2004) found that the efficiency of methane production was more than 75%
when the pH was above 5.0. In the same line as stated in (Ghaly, 1996) the two phase
anaerobic reactor using cheese whey and dairy manure as substrate operated as a single phase
reactor when the pH of whey was not controlled. But when pH was controlled, it operated as a
two-phase reactor (Yadvika et al., 2004). When the anaerobic digestion process is separated
into two phase as with the HIMET process, the fast growing acidogenic bacteria prefer a low
pH range of 4.5 to 5.5. While the slow growing and the more sensitive methanogenic bacteria
prefer neutral to slightly alkaline environment of pH > 7 (Saber, 2009).

17
3.2 Particle size
The sizes of feedstock particles have an influence on the gas production though it is not as
important parameter as pH and temperature of the digester content. If the particle sizes are too
large, the digester might be clogged and also, the digestion of the particles will be difficult for
microorganisms. On the other hand, smaller particles would provide large surface area for
absorbing the microorganisms and enzymes. This will lead to increased microbial activity and
hence increased gas production (Yadvika et al., 2004).
(Sharma et al., 1988) studied the effect of particle sizes on biogas production using particles
of 0.088, 0.40, 1.0, 6.0 and 30.0mm. They found out that maximum quantity of biogas was
produced from particles with smaller size (0.088mm and 0.40mm). However, succulent
materials such as leaves with larger sizes could be used though materials such as straw and
other larger particles would decrease the production of biogas. In a nut shell, the results
suggested that a physical treatment such as grinding could significantly reduce the volume of
the digester without decreasing the biogas production (Moorhead and Nordstedt, 1993).
3.3 Volatile Fatty acids (VFA)
The concentration of volatile fatty acids and their relationships receive a great deal attention
during anaerobic digestion. This is because they are precursors of methane production and
secondly, they act as inhibitors to the process when in excess (Hill and Holmberg, 1988).In
anaerobic degradation of complex substrates, a diversity of microorganisms (facultative and
obligatorily anaerobic bacteria) is involved. In the case of slaughterhouse waste and other
waste streams, fermentative bacteria particularly proteolytic Clostridium species, hydrolyze
proteins to polypeptides and amino acids. Lipids are hydrolyzed via β-oxidation to long chain
fatty acids (LCFAs) and glycerol and polycarbohydrates hydrolyze to sugars and alcohols.
After this break down, the intermediates are converted to short chain organic acids-volatile
fatty acids (VFAs) with C1-C5 molecules, hydrogen (H2), and carbon dioxide (CO2).
Examples of these VFAs are: acetic acids, butyric acid, propionic acid, valeric acid and lactic
acid (Salminen and Rintala, 2002) , (Deublein and Steinhauser, 2008), (Komemoto et al.,
2009). Butyrate’s are reported to be produced mainly from the degradation of starch, acetic
acid from the degradation of cellulose and propionic acid, valeric acid and acetic acids from
protein degradation (Hill and Holmberg, 1988).

18
The VFAs, hydrogen and carbon dioxide are then converted to acetic acids by acetogenic
hydrogen producing bacteria. During methanogenesis, the hydrogen is consumed by the
acetogenic hydrogen consuming bacteria to establish a balance. If this balance is not
established, the degradation process of the organic material is inhibited. The degradation of
the LCFAs may be rate limiting to AD because of the slow growth of the LCFAs consuming/
hydrogen producing bacteria. As a result, there would be slow degradation of the LCFAs or
lack of degradation of the degradation products (hydrogen). This can lead to the accumulation
of organic acids and alcohols which is an indication of the process imbalance (Hill and
Holmberg, 1988).
Volatile fatty acids concentrations have quite frequently been used as performance indicators.
(Hill and Holmberg, 1988) states that the short chain propionic and acetic acids and their ratio
Propionic/Acetic (P/A) have always been used as stress/failure indices while the long chain
butyric, Iso butyric, valeric and Iso valeric have received little attention. He based his
proposition on the fact that the long chains are completely no detectable or they are in very
low concentrations. He used the concentration of acetic acid level alone to make predictions
of the digester health; stating that failure is eminent when that concentration is greater than
800mg/l.
Furthermore, he mentioned that in order to have a stable/non inhibitory operating system,
concentrations of total volatile fatty acids of less than 2000mg/l must be maintained. And that
it is likely to observe an impending failure of a digester whose propionic acid to acetic acid
ratio is more than 1.4 (Hill and Holmberg, 1988).
The inhibition of the AD process by LCFAs is due to their toxicity to the anaerobic
microorganisms particularly acetogens and methanogens or due to their tendency to form
floating scum which cause fouled gas collection pipes and scum overflow. Another
mechanism of inhibition of LCFAs is by adsorption to the microbial cells. And adsorption
together with other mechanisms of inhibition depend on the concentration of LCFAs, the type
of bacteria present, the type of reactor, type of input material (feedstock) and specific surface
area of the sludge (Hill and Holmberg, 1988). Gram-positive microorganisms (with defined
cell wall) and suspended sludge are said to be more vulnerable than the Gram-negative
microorganisms and granular sludge. The concentration of volatile acids in a reactor is
affected by the temperature, hydraulic retention time and the waste type. The higher the
temperature and/or the longer retention time the lower the concentration of volatile acids
(Ghaly, 1996). It is also noted that VFAs accumulation occurs because of the rapidly

19
degradable materials like grains; which brings about severe inhibition in the acidogenic phase
due to pH drop and product inhibition. A reduction of such material in the feedstock and
decrease in dilution rate of the substrate is a more proximate solution to this (Ghaly, 1996).
The most inhibitory LCFAs are the saturated with 12-14 carbon atoms and the unsaturated
with 18 carbon atoms. In addition, the toxicity effect of fatty acids increases in the presence of
another (Poulsen, 2003), (Salminen and Rintala, 2002). Some examples of these LCFAs are:
Oleic acid, Stearic acid, Palmitic acid, and Myristic acid (Salminen and Rintala, 2002).
Even though LCFAs might be this far inhibitory to anaerobic digestion of organic material,
there are yet other compounds that reduce their toxicity. Albumin, starch, bile acids and
cholesterol may reduce the toxicity of fatty acids by forming complexes or competing with
them on cell wall adsorption. Other substances which prevent LCFAs inhibition are bentonite
(because of its ability to flocculate-causing small lumps) and its cations such as calcium.
These cations and calcium from other sources also reduces the inhibitory effect of LCFAs due
to its ability to form precipitates and increase surface tension (Viturtia et al., 1989).
In a two phase anaerobic digestion where the hydrolytic reactor was operated firstly at
mesophilic conditions and secondly at thermophilic conditions, it was found that the
production of total volatile fatty acids (TVFAs) was less in the hydrolytic phase of the
thermophilic condition than the hydrolytic phase of mesophilic condition (Viturtia et al.,
1989).
The efficiency of acidogenic fermentation can be evaluated by degree of conversion of
volatile fatty acids from the substrate. This can be illustrated by equation 4 below.
Where VFAp is the concentration of volatile fatty acids produced, and VFAt is the
concentration of the total volatile fatty acids (Viturtia et al., 1989).
Acidification % = VFAp
VFAt ............................................................................(4)

20
3.4 Temperature
The temperature of the digester is another important and critical parameter considered during
AD of organic waste for biogas production. This is mainly due to the strong dependence of
the digestion rate. Generally, there are three temperature ranges during which AD can operate.
These categories are determined by the species of bacteria which operate in each of the three
temperature ranges: the psychropilic range (00C to 30
0C), the mesophilic range (30
0C to
42°C) and the thermophlic range (500C -60
0C). However, most AD operations are carried out
under mesophilic or thermophilic temperatures during which enzyme activity is high with
optima at 350C and 55
0C respectively (Yadvika et al., 2004). Mesophilic digesters are the
most common and they operate stably. This might be because of the variety of mesophilic
bacteria that tolerate greater changes in environmental parameters including temperature; than
the thermophilic bacteria. (Poulsen, 2003) reports that of more than 1500 European biogas
plants only 5% are psychrophilic, 8% are thermophilic and 87% are mesophilic.” The only
European country as at the year 2001; having more thermophilic than mesophilic biogas
plants is Denmark. Italy and Switzerland are the only known countries operating biogas
reactor plants under psychrophilic conditions (Poulsen, 2003).
The choice to operate a digester in either mesophilic or thermophilic temperature ranges
involves some trade-offs. Digestion at thermophilic temperatures allow high loading rates,
fastest bacterial growth, fastest degradation of substrates (volatile solids), increase in the
destruction of weeds, seeds and pathogens; ensuring efficient hygienisation and thus greater
production of biogas. In a three system two phase anaerobic digestion experiment: (I)
mesophilic first stage (37 ) mesophilic second stage (37 ), (II) mesophilic first stage
(37 ) thermophilic second stage (55 ), and (III) thermophilic first stage (55 )
thermophilic second stage (55 ), it was observed that the digestion period of potato waste
which was used as the feedstock was shorter by 24% in system II and by 34% in system III
than in system I, indicating an advantage of digestion at thermophilic conditions (Poulsen,
2003). However, they require higher energy demand to increase the temperature above
ambient conditions. And during cold seasons, the energy demand is even higher and therefore
not economical to the process. More so, thermophilic methanogens are more temperature-
sensitive than mesophilic microbes. A small change in temperature causes substantial
decrease in activity. In addition, (Pavan et al., 2000) states that when the hydrolytic reactor
temperature (230C) was raised to a thermophilic range (55
0C); with other experimental
variables kept constant, the production of total volatile fatty acids (TVFAs) was 10 times

21
lower than when a mesophilic temperature was used. The reason is associated with the
kinetics of the bio-reactions at the thermophilic range wherefore some TVFAs are consumed
at the start up of the first phase. However, the 10 times difference in the TVFA, induced only
a small difference in the biogas yield at the thermophilic-methanogenic reactor (Ostrem et al.,
2004). Thermophilic conditions are also criticized on the higher concentration of VFAs found
in the effluent than there is with the mesophilic conditions (Poulsen, 2003). In a study, it was
observed that the COD removal in laboratory experiments using a 2.8 l up flow Anaerobic
Sludge Blanket (UASB) of proteinaceous wastewater under mesophilic (370C) conditions was
about 84% while only 69-83% was removed under thermophilic (550C) conditions. And COD
is a good indicator of the completeness of the degradation process, since any undigested
material will require oxygen (in an aerobic environment) to complete degradation. Since the
optimum temperature for methanogenesis may not necessarily be the optimum for hydrolysis,
acidification nor acetogenesis, multi-stage digesters that separate processes taking place in
respective tanks like the two-phase digester could be used (Yadvika et al., 2004).
In order to keep the temperatures at desired range, it is good to coat the digesters with
insulating materials during installations. The construction of biogas plant facing the sun has
advantages as this protects them from cold winds. In this way biogas yield would be increased
when temperature drops in digesters. In (Yadvika et al., 2004) it has been mentioned that a
charcoal coating of ground around the digester results in improved biogas production in
KVIC plant by 7-15%. The use of hot water in the preparation of slurry also helps to improve
gas production and in the same light, solar assisted plants are found to produce higher gas
yields during winter months (Yadvika et al., 2004).
3.5 C/N ratio
The substrate used for AD process is the source of material for biodegradation. It contains
total solids (TS) of which 82% to 85% is volatile solids (VS) which is available for microbial
degradation in the case of manure (Poulsen, 2003). The microorganisms responsible for this
degradation process require specific nutrients as do all living organisms, with carbon (C) and
nitrogen (N2) being the most important. The gas production and smooth functioning of the
process in terms of ammonia/ammonium (NH3/NH4+) toxicity is dependent on the ratio of
carbon to nitrogen. This problem is mostly pronounced when animal manure which contains
high concentration of urea is used as the substrate (Poulsen, 2003).

22
For efficient plant operation, the C/N ratio must be properly maintained in the composition of
feedstock. During anaerobic digestion microorganisms utilize carbon 25-30 times faster than
nitrogen. This means that microbes need a 25-30: 1 ratio of C to N with and most literature
citing 25: 1 as the ideal level. If the C/N ratio is very high, nitrogen will be consumed rapidly
by the methanogens for meeting their protein requirement. In this case, there will be no more
nitrogen left to react with the left over carbon in the feedstock. As a result, gas production
will be low. On the other hand, if the C/N ratio is very low; nitrogen will be liberated and will
accumulate in the form of ammonia (NH3) which is the inhibiting component (Poulsen, 2003).
The equilibrium reaction involved during the production of NH3 is represented by equation 5.
H+
+ NH3 ↔ NH4+. ……………………………………………………………………….... (5)
At high temperatures, the equilibrium reaction will shift to the left (the dissociation of
ammonium into hydrogen ion and ammonia is faster than its formation) there by producing
more NH3 and eventually increasing the inhibition. NH3 will increase the pH value of the
digester and when it is beyond 8.5, the environment becomes toxic to methanogenic bacteria
population. In addition, the compost derived from the digestate will be of less quality because
of the high ammonium content (Poulsen, 2003).
3.6 Retention time
This is the amount of time the feedstock stays in the digester before it flows out as effluent. If
the feedstock is liquid; it is referred to as hydraulic retention time (HRT). And it is defined as
the ratio of the digester volume to the amount of digested material per day; as measured by
the COD and BOD of exiting effluent. E.g. 1m3 /day to 10m
3 tank has a HRT of 10 days
(Poulsen, 2003), (IMTE, 2007),(Ostrem et al., 2004). But if the feedstock is solid; it is known
as solid retention time (SRT). It is defined as the ratio of the mass of solids held in the
digester to the mass of solids removed per unit time. Since the amount of solids removed from
the digester is always in liquid form (effluent), there exists a relationship (ratio) of the
concentration of substrate still in the solid form in the digester (Cd) to the concentration of
solid that has been converted into waste as effluent (Cw). If the ratio (Cd)/ (Cw) is 1, SRT=
HRT. However in some digester designs, SRT>HRT if (Cd) > (Cw). Another measure of the
time scale on which the digester operates is the microbial retention time (MRT). It is defined
as the ratio of the microbial mass held in the digester to the microbial mass removed per unit

23
time. Because bacteria have a high tendency to attach to surfaces, it would be reasonable to
assume that a large fraction of microbes are attached to the surfaces of solids in the digester.
This way, MRT tends to follow the changes in the SRT. Therefore if the SRT is increased
relative to HRT, it applies the same to MRT (Saber, 2009).
The hydraulic retention time is the determining factor in the conversion efficiency of
anaerobic digestion process where the substrate in volatile solid (VS) content is converted into
biogas by bacteria. The amount of methane produced is therefore influenced by the hydraulic
retention time of the substrate.
The longer the retention time, the more bacterial growth that can occur; with corresponding
increase in the bacterial activity on the substrate and the larger the substrate is converted to
biogas within a given temperature range and/or category of bacteria (psychrophilic,
mesophilic, or thermophilic). This means that the longer a substrate is kept under proper
reaction conditions, the more there will be complete degradation. However at some point, the
rate of reaction will decrease with increasing retention time. This indicates that there is an
optimum time that will achieve the benefits of digestion in an optimum way. The appropriate
time depends on the feedstock, environmental conditions that influence: - (a) the growth of
the bacterial populations, (b) the types of the by-products of all classes of bacteria and their
competition. It also depends on availability of the food sources and the intended use of the
digestate (Saber, 2009). Typical periods of growth can span from a fraction of an hour to a
day or more.
The retention time for most dry processes ranges between 14 and 30 days and for wet
processes can be as low as 3 days; though the optimal value varies according to the specific
technology, the process temperature and the waste composition (Ostrem et al., 2004).
For mesophilic bacteria the retention times are within 15-30days and 12-14days for the
thermophilic bacteria (Saber, 2009).
Changes in feedstock and changes in temperatures might eventually cause a variation in
retention times of the substrate in the digester. For changes in feedstock, retention time may
vary from day to day while with changing temperatures, retention time changes from season
to season. The digestion of substrate (volatile solids) after 10 hours during recent research has
been observed to be between 64% and 85%. But 10 days were typically chosen for complete
digestion (Ostrem et al., 2004).

24
The size of a digester or reactor affects retention time. And it is cost saving to have a digester
with low retention time and thus high gas production rate per digester volume unit. However,
there is always an overall lower degradation of the feedstock which compromises with the
total volume of the gas produced and the quality of other digestion products. It is therefore
important that the two factors be balanced in the design of a full scale reactor (Ostrem et al.,
2004).
There are some generally accepted practices which aid in reducing retention times. A number
of them are employed without having the retention time as the fundamental reason. Two of
the famous ones are continuous mixing and using low solids (Ostrem et al., 2004).
The recirculation of water and biogas in the digester to keep material moving and minimize
settling within the tank is the most common technique of mixing. This ensures stable
environmental conditions within the digester as well as increases the accessibility of the
digestible surfaces of the feedstock to the bacteria. A well mixed digester uses the entire
volume of the tank or a greater working volume and is void of stratified layers or scum.
When the feedstock has a low solid content, bacteria can easily access the digestible portion
of liquid substrate and in addition, the fact that the reactions require water, retention time will
be reduced. Another important aspect is the complete mixing that is achieved with liquid
substrates than with solid substrate. In addition, the separation of the stages of digestion into
individual chambers optimizes the activity of specific bacteria population and hence reducing
retention time. Another option is to introduce surfaces or a combination of surfaces on which
bacteria would permanently live in order to reduce the population that is washed out (Ostrem
et al., 2004). A fifth option is to improve circulation within the chamber by alternating the
flow pattern. Furthermore, the pretreatment of waste in order to increase digestibility can be
considered as the sixth option to reduce retention time (Ostrem et al., 2004). It is worth noting
that each of these options are designed and proved to be effective with specific feedstock’s
though all could be combined for MSW. In a two stage fermentation process to produce
hydrogen and methane under thermophilic hydrolysis/fermentation (60 ) and
methanogenesis (55 ) the hydraulic retention time was optimized at 8 days (hydro genesis,
1.2d and methanogenesis; 6.8d). At this retention time, 5.4m3/m
3/d of hydrogen and
6.1m3/m
3/d of methane was produced (Ostrem et al., 2004).

25
3.7 Chemical oxygen demand (COD) concentration
This parameter measures the quantity of oxygen used in chemical oxidation of materials. .
However, the organic component predominates and it is of greater interest (IMTE, 2007).
Furthermore, COD test together with VS are the most important method to determine the
quantity of organic matter in the slurry, sludge or any feedstock for anaerobic digestion. This
is why the feeding of the digester with substrate in terms of organic loading rate (OLR) is
usually expressed per mass of COD or VS (for example 7.5g VS/l/d or 6.5g COD/l/d). In
most cases, COD test are done for water samples with low TS content and on the other hand,
VS is used to measure the organic content of sludge with higher TS (Sundin, 2008).
According to Poulsen; 2003, changes in the amount of volatile solids of the input to the output
of the digester, does not give information about the stage of the biological process of
anaerobic digestion. However, the analysis of this change can indicate process imbalance. A
failing process will be indicated by a drop in the VS reduction from inlet to outlet but can
only be seen if the process is strongly out of balance (Poulsen, 2003). Moreover, measuring
the soluble COD amount can give information about the degree of hydrolysis and
solubilisation achieved by acidogenic bacteria (Sundin, 2008).
COD measurements during hydrolysis and acidification will decrease with increasing
hydraulic retention time. This means that the COD concentrations will be higher at a shorter
retention time than a longer retention time or the COD removal efficiency will be low during
hydrolysis/fermentation. This is because, organic substances (VFAs and alcohols) remain in
the process; and methane production which results from the decomposition of these organic
substances had not occurred (Sundin, 2008). COD concentration measured in an experiment
during hydrolysis and acidification of solid potato waste initially increased and then stabilized
before declining during the process (Sundin, 2008). In the same literature, it was observed that
the COD removal by a thermophilic hydrolysis/acidification reactor was greater than in a
mesophilic hydrolysis/acidification reactor. The better performance of the thermophilic
hydrolysis/acidification reactor was attributable to the fact that thermophilic microorganisms
have higher growth rates than the mesophilic ones (Sundin, 2008).
26
4.0 Materials and Methods
A representative sample of feedstock utilized at Sobacken facility is used during this study
and it is a combination and mixture of the following ten different waste components.
Table.1. Composition of substrate by waste type and proportion
Type or source of waste Volume (l) Concentration (%)
1 Fish 0.88 4.9
2 Slaughterhouse waste 1.09 6.1
3 Cleaning waste 0.00 0.0
4 Doggy meat 0.37 2.1
5 Doggy sludge 0.28 1.6
6 Doggy dry food 0.42 2.3
7 Mink (fur) 0.07 0.4
8 Norway slurry 0.70 3.9
9 SOR2 (Industrial waste) 4.38 24.3
10 Municipal solid waste (MSW-Borås) 9.82 54.5
Total 18.0 100
4.1 Batch Experiments.
A homogeneous mixture of the above portions of these waste types was prepared and used, in
two different batch experiment series. In the first batch, two samples, each 200ml of the
substrate, were prepared in a 500ml volumetric flask. One of the samples contained even
mesophilic sludge with additional 5% volume (10ml) of the substrate. The sludge was taken
from Gässlösa municipal waste water treatment plant in Borås city.
In the second batch, 147.2 g of the substrate with 8.9% VS was mixed with 7.98g of special
shredded paper containing 82% VS in a 500ml volumetric flask to increase the C/N ratio of
the substrate. The volume of each sample was then adjusted to 200ml level with Milli-Q
water. Each batch of experiment was duplicated for statistical reasons.
The flasks were corked with cotton plugs and then placed in two separate water bath shakers
(OLS 200 Grant), operating at mesophilic temperature conditions, one at 340C and the other at
higher temperature of 420C. In both shakers the rotation was kept at 120 rpm to provide better

27
contact between the substrate and the microorganisms. The aerated condition during this pre-
hydrolysis provides that a mix culture of microorganisms presented in the samples would
work effectively.
Both experimental series were followed up by taking samples of 5ml from each flask
regularly (at the start point and then after 4days, 5days, 6days, and 7days), from which 1ml
experimental unit was used for the analysis of the process parameters.
4.2 Analytical methods
Total solid content (TS) was measured by weighing the samples before and after oven-drying
at 1050C for 24 hours to remove the moisture in the substrate. After oven-drying, the samples
were allowed to cool at room temperature in a desiccator prior to weighing. The calculation
was done by dividing the dry weight of the sample by the wet or total weight as shown in
equation 6.
The volatile solids content (VS) expressed in either g/l, g/m3or in % of TS, is also known as
loss on ignition (LOI). It is the content of organic matter in the waste and is measured by
keeping the oven-dried samples at the temperature of 5500C± 25 until a stable weight can be
obtained. It was measured by weighing the oven-dried sample before and after ignition at
5500C ± 25 for 2½ hours in an electric furnace. After this period, all of the organic matter in
the waste sample is ignited and the weight of the crucible with the mineralized residue (GR)
remains constant. In the same way as with TS measurements, a desiccator was used to cool
the samples to reach room temperature prior to weighing. The value was derived by using the
mathematical expression described by equation 7.
….................................................(6)
Weight after drying 105
TS (%) =
Wet weight 25
...................(7)
TS weight – weight after heating at 550
Wetweight
VS=
28
In continuation of the operation, VFAs concentrations, pH, soluble COD and ammonium
nitrogen (NH4-N) were measured regularly to monitor the progress of the hydrolysis. NH4-
Nwas measured by HACH LANGE DR-2800 instrument after diluting the samples with milli-
Q water at a dilution ratio of 1: 10. VFAs were monitored with a High Performance Liquid
Chromatography (Varian 9000 HPLC, Walnut Creek, CA, USA), using a Bio-Rad column
125-0115 (Biorad, Hercules, CA, USA). All samples except those for the analysis of pH were
centrifuged at 10,000 rpm for 5 minutes and stored at 50C until further analysis. Those for
VFAs were further filtered through a 0.2μm filter before the analysis by HPLC. COD was
measured using commercial reagents, COD reactor and COD analyzer (DR-2000; HACH
Co.). The samples were diluted with milli-Q water at a dilution ratio of 1:5 in order to be
within a measurable range of the reagent (0mg/l-15,000mg/l). The pH was measured using a
pH meter (Thermo Russell).
5.0 Results.
Table .2. Summary of batch experiments and experimental conditions.
Conditions
Substrate
Normal C/N ratio C/N ratio increased
Temperature 34 42 34 42
Addition of mesophilic
sludge (+)
No Mesophilic sludge (-)
+
-
+
-
+
-
+
-
The two batches of experiments performed under two different mesophilic temperature
conditions of 340C and 42
0C and with two different substrates, one with an original C/N ratio
, as it is found in the mixture and the other with an increased C/N ratio. Both series were
performed with and without the addition of mesophilic sludge to the samples as it is
summarized in Table 2. The results are presented in the figures and tables that follow. The
experiments were performed to be able to investigate the differences and similarities caused
by the effects of temperature conditions, mesophilic sludge addition, treatment time and
change in C/N ratio, on the process of hydrolysis. As it was mentioned earlier, the
concentration of dissolved COD, NH4-N and VFAs were measured and used as process
29
indicators to evaluate the suitability of the operational conditions. Detailed data from the
performed batch experiments are shown in appendix III to X at the end of the report.
5.1. Effect of Temperature
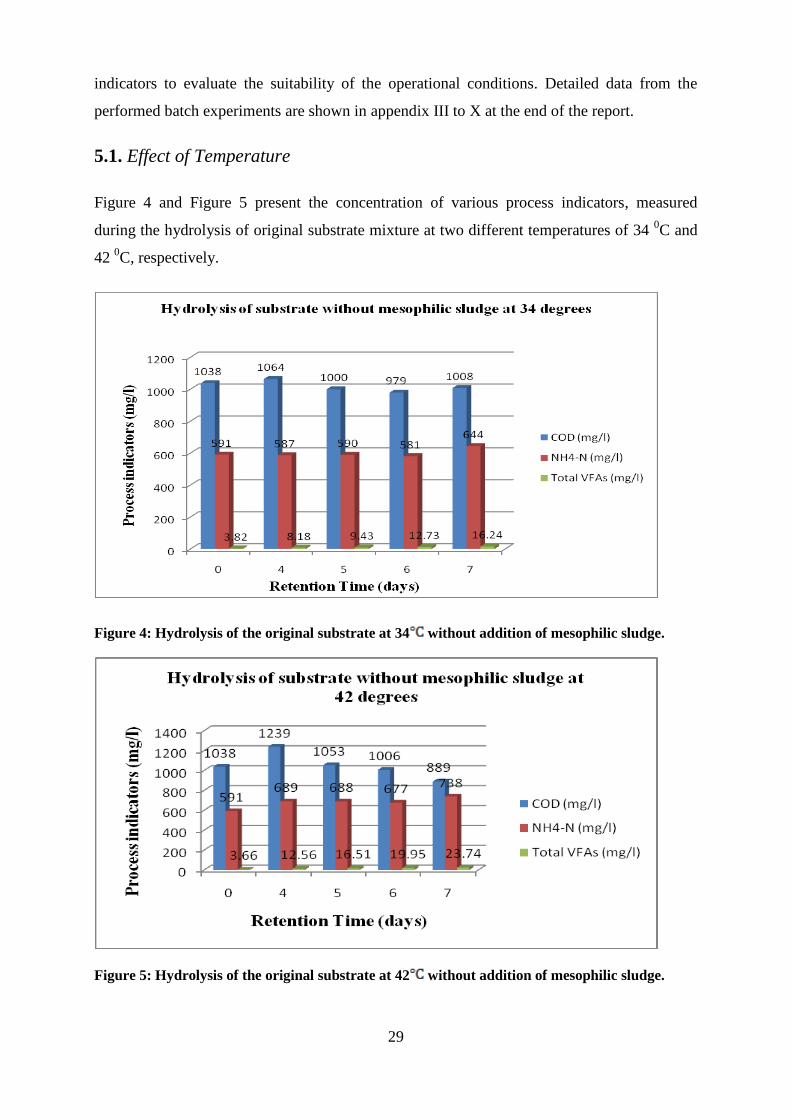
Figure 4 and Figure 5 present the concentration of various process indicators, measured
during the hydrolysis of original substrate mixture at two different temperatures of 34 0C and
42 0C, respectively.
Figure 4: Hydrolysis of the original substrate at 34 without addition of mesophilic sludge.
Figure 5: Hydrolysis of the original substrate at 42 without addition of mesophilic sludge.
30
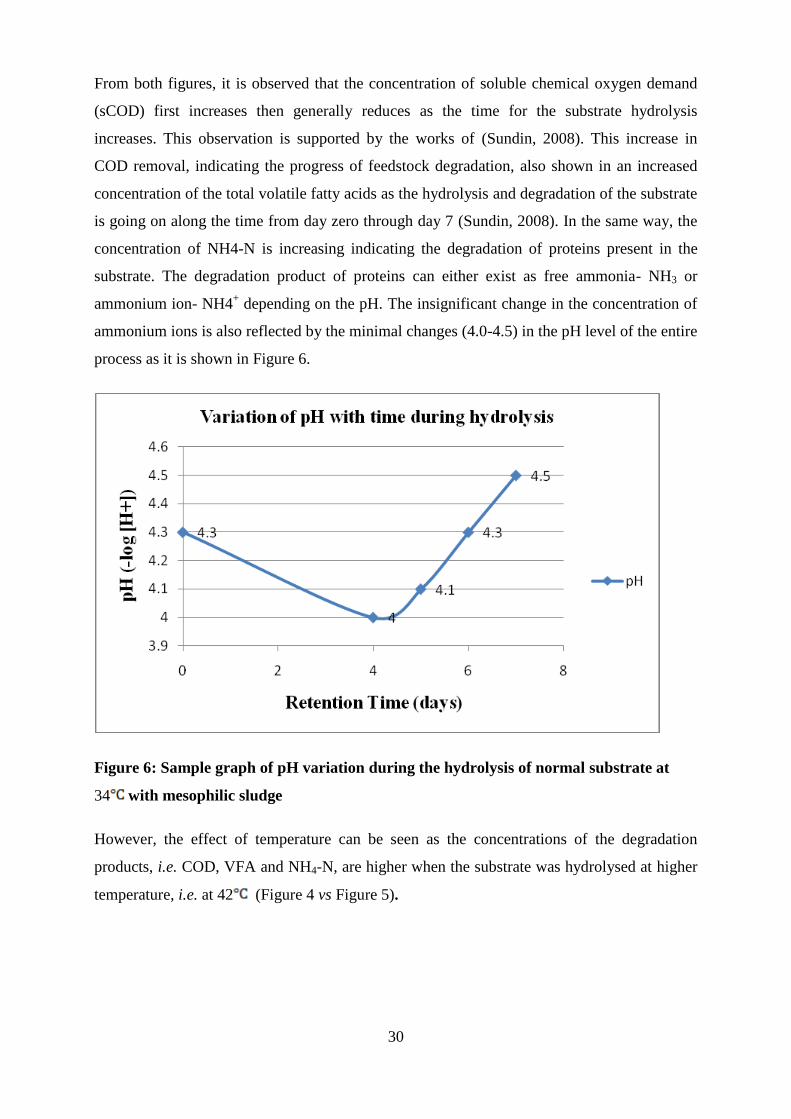
From both figures, it is observed that the concentration of soluble chemical oxygen demand
(sCOD) first increases then generally reduces as the time for the substrate hydrolysis
increases. This observation is supported by the works of (Sundin, 2008). This increase in
COD removal, indicating the progress of feedstock degradation, also shown in an increased
concentration of the total volatile fatty acids as the hydrolysis and degradation of the substrate
is going on along the time from day zero through day 7 (Sundin, 2008). In the same way, the
concentration of NH4-N is increasing indicating the degradation of proteins present in the
substrate. The degradation product of proteins can either exist as free ammonia- NH3 or
ammonium ion- NH4+ depending on the pH. The insignificant change in the concentration of
ammonium ions is also reflected by the minimal changes (4.0-4.5) in the pH level of the entire
process as it is shown in Figure 6.
Figure 6: Sample graph of pH variation during the hydrolysis of normal substrate at
34 with mesophilic sludge
However, the effect of temperature can be seen as the concentrations of the degradation
products, i.e. COD, VFA and NH4-N, are higher when the substrate was hydrolysed at higher
temperature, i.e. at 42 (Figure 4 vs Figure 5).

31
5.2. Effect of Mesophilic sludge
Sludge obtained from a waste water treatment plant was added to the substrate as inoculum to
enhance the degradation process. The effect of the inoculum is shown by comparing Figure 7
(substrate hydrolysis at 34 without the addition of mesophilic sludge) and Figure 8
(substrate hydrolysis at 34 but with the addition of mesophilic sludge).
Figure7: Substrate hydrolysis at 34 without the addition of mesophilic sludge.
Figure 8: Substrate hydrolysis at 34 with the addition of mesophilic sludge.

32
By comparing Figure 7 and Figure 8, it can be found that the rate of COD degradation from
day 5 to and through day 7, which indicates the extent of degradation of solubilized COD, is
faster when mesophilic sludge as inoculums was present in the samples (Figure 8). However,
there was a less and insignificant difference in the amount of total volatile fatty acids as well
as NH4-N produced when the operations were carried out with mesophilic sludge compared
with that without mesophilic sludge addition. The effect of the addition of mesophilic sludge
in terms of the amount of volatile acid produced was only observed when the substrate C/N
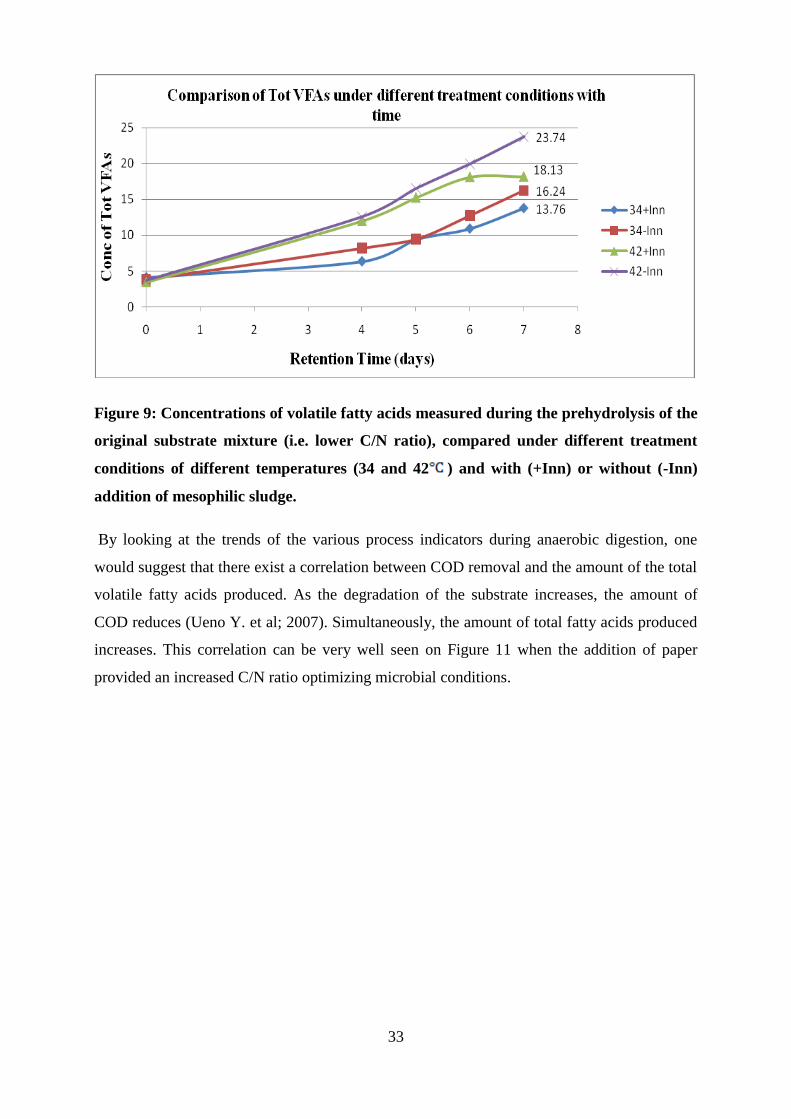
ratio was increased as it is shown on Figure 9 compared with Figure 10 below.
5.3. Effect of increasing the C/N ratio of the substrate
The C/N ratio of the substrate was increased while keeping the VS content the same by
adding special shredded paper material which is rich in carbon content. By so doing, we
provided micro organisms with more optimal conditions supporting their action of hydrolysis
on the substrate. This increase in the C/N ratio limits the likely hood of ammonia production
which would have negative consequences of inhibiting the following anaerobic digestion
process. A clear illustration of this effect is observed by comparing Figure 9 (concentrations
of volatile fatty acids measured during the pre-hydrolysis of the original substrate mixture)
and Figure 10 (concentrations of volatile fatty acids measured during the pre-hydrolysis of the
original substrate with increased C/N ratio). From Figure 9, it can be concluded that, an
imbalance was observed in the composition of substrate, and this low C/N ratio was not a
suitable environment resulting in higher amounts of VFAs during the pre-hydrolysis process.
Increasing the temperature resulted in a further increase of the concentration of VFAs.
33
Figure 9: Concentrations of volatile fatty acids measured during the prehydrolysis of the
original substrate mixture (i.e. lower C/N ratio), compared under different treatment
conditions of different temperatures (34 and 42 ) and with (+Inn) or without (-Inn)
addition of mesophilic sludge.
By looking at the trends of the various process indicators during anaerobic digestion, one
would suggest that there exist a correlation between COD removal and the amount of the total
volatile fatty acids produced. As the degradation of the substrate increases, the amount of
COD reduces (Ueno Y. et al; 2007). Simultaneously, the amount of total fatty acids produced
increases. This correlation can be very well seen on Figure 11 when the addition of paper
provided an increased C/N ratio optimizing microbial conditions.

34
Figure 10: Concentrations of volatile fatty acids measured during the prehydrolysis of substrate
with an increased C/N ratio, compared under different treatment conditions of different
temperatures (34 and 42 ) and with (+Inn) or without (-Inn) addition of mesophilic sludge.
Figure 11: Correlation between COD removal and amount of total volatile fatty acids
produced during prehydrolysis of substrate with increased C/N ratio at 34 with
addition of mesophilic sludge.

35
Figure 12: Proportions of various volatile fatty acids produced during the hydrolysis of
substrate with low C/N ratio and without mesophilic sludge at 42
Figure 12 gives example on how the concenration of different volatile fatty acids varry
during the prehydrolysis process. It is noticed that the production of various volatile fatty
acids during the pre-hydrolysis of the substrate is different. Acetic acid; precursor of methane
production and the less toxic of all is the most prominent one. While the concentrations of
propionic acid, iso- butyric acid and valeric acid were lower, the least concentration was
observed in iso-valeric acid.
6.0 Discussion
The successes of AD in terms of effective degradation of substrate, system stability and both
quality and quantity of biogas produced during the process, strongly depend on
hydrolysis/fermentation phase and its intermediary products. This study focused on evaluating
the process parameters during a prehydrolysis step by hydrolyzing two substrates with
different C/N ratios under different conditions.
When the substrate was hydrolysed at a temperature of 34 and 42 without the addition of
mesophilic sludge, it was noticed that the solubilization was faster at 42 than at 34 . The
dissolved COD removal was about four times more at 42 ; with only 3.9% COD removal at
34 compared to 14.4% at 42 . This indicates that the activity of different enzymes
produced by various microorganisms involved in the degradation process was higher at 42 .

36
At this temperature and after day 7 of the hydrolysis, the concentration of total volatile fatty
acids was 23.74mg/l compared to 16.24mg/l at 34 , among them with acetic acid being the
most predominant (17.7mg/l) one. The same temperature condition favored the digestion that
was carried out after the addition of mesophilic sludge as inoculum to the substrate. Though
most literature suggest 35 - 37 to be the most suitable temperature for mesophilic
digestion (Yadvika et al., 2004), 42 showed to improve the prehydrolysis rate in this study.
Gijzen et al., (1987) suggest that an important drawback of the degradation of solid organic
waste is its slow rate and incomplete degradation. To combat this drawback, rumen
microorganisms were accustomed to the digestion medium to increase and improve the
conversion of the substrate. In the same light and in this study, the effect of adding mesophilic
sludge as innoculum to improve the degradation process of the substrate was determined in
terms of COD removal and in the amount of total volatile fatty acids produced. Operations at
34 with mesophilic sludge had a COD removal of 4.1% with 13.76mg/l of total volatile
fatty acid compared to 3.9% COD removal with 16.24mg/l of total volatile fatty acids after
day 7 for operations at the same temperature but without mesophilic sludge. The insignificant
difference in the COD removal and the amount of total volatile fatty acids produced can make
us to conclude that the effect of mesophilic sludge was not significant. This means that the
nature of the microorganisms present in the sludge, obtained from a waste water treatment
plant was not suitable to improve the degradation of the original substrate mixture used in the
study. This also means that the degradation observed was performed by the act of
microorganisms basically presented in the waste mixture.
On the other hand, the substrate mixture was a protein-rich mixture with high nitrogen
content, which could cause energy deficient in the form of carbon for the microorganisms.
However, when the C/N ratio was increased by adding paper material, the carbon content of
the substrate was increased thereby increasing the energy supply to the microorganisms.
Moreover, treating this substrate mixture under the same conditions of temperatures at
34 and 42 , with and without the addition of mesophilic sludge, the results now showed a
pronounced effect of mesophilic sludge addition, so that the degradation of substrate
increased. There was 16% COD removal when the substrate was treated at 34 with
mesophilic sludge compared to 10% reduction during the hydrolysis of samples without
mesophilic sludge. At 42 , the substrate with mesophilic sludge had 10.2% COD reduction
compared to 7.8% reduction observed with the substrate without mesophilic sludge. The COD
removal increased simultaneously with an increase in the amount of produced total volatile

37
fatty acids, thereby satisfying the correlation between COD removal and the amount of total
volatile fatty acids produced.
7.0 Conclusions
From this work, we conclude that solubilization of the substrate (with increased C/N ratio)
occurred at 42 . A predominant quantity of acetic acid (17.7mg/l), which will further be
degraded through methanogenesis to methane, was produced. At this temperature, the
hydrolysis was faster and there was a relative high degree of COD release together with a
removal of 14.4%.
The effect of mesophilic sludge (microbial action) observed by the increase in the production
of VFAs was only noticed when the C/N ratio of the original substrate was increased. Whilst
a higher value of VFAs was observed at 42 both in the case of without or with mesophilic
sludge addition. Increasing the C/N ratio resulted in lower VFAs at all conditions. The
optimum time for the hydrolysis was 4 days and this suggest that a longer retention time for
the substrate will cause some of the carbon to be lost as carbon dioxide during the aerobic
degradation. At this optimum retention time, the proportion of propionic acid to acetic acid
was least, indicating that there was less acid accumulation which otherwise would affect the
methane production process negatively.
There was no significant effect on substrate solubilization after the addition of mesophilic
sludge.
Though our analysis did not investigate the importance of aerating the substrate during pre-
hydrolysis, recent literature suggest that aeration of substrate during hydrolysis will greatly
enhance the solubilization of the substrate and also create a mix culture of microorganisms
which favors the solubilization.
8.0 Future work
On the basis of the results of this work, we recommend that the anaerobic digestion process at
Sobacken would preferably be run in a two phase digestion scheme. In phase I, hydrolysis and
fermentation operate in one tank and in phase II, acetogenesis and methanogenesis operating
in another tank. See figure 2.

38
References
DEUBLEIN, D. & STEINHAUSER, A. 2008. Biogas from waste and renewable resources. WILEY-
VCH Verlag GmbH, Weinheim, p13, 30, 35.
GHALY, A. 1996. A comparative study of anaerobic digestion of acid cheese whey and dairy manure
in a two-stage reactor. Bioresource Technology, 58, 61-72.
GIJZEN, H. J., LUBBERDING, H. J., VERHAGEN, F. J., ZWART, K. B. & VOGELS, G. D. 1987.
Application of rumen microorganisms for an enhanced anaerobic degradation of solid organic
waste materials. Biological wastes, 22, 81-95.
HILL, D. & HOLMBERG, R. 1988. Long chain volatile fatty acid relationships in anaerobic digestion
of swine waste. Biological wastes, 23, 195-214.
IMTE, A. 2007. Switzerland Power Consulting Engineers., Biogas Technology., 2007.
KOMEMOTO, K., LIM, Y., NAGAO, N., ONOUE, Y., NIWA, C. & TODA, T. 2009. Effect of
temperature on VFA's and biogas production in anaerobic solubilization of food waste. Waste
Management, 29, 2950-2955.
KUMAR, S., BHATTACHARYYA, J., VAIDYA, A., CHAKRABARTI, T., DEVOTTA, S. &
AKOLKAR, A. 2009. Assessment of the status of municipal solid waste management in metro
cities, state capitals, class I cities, and class II towns in India: An insight. Waste Management,
29, 883-895.
MOORHEAD, K. & NORDSTEDT, R. 1993. Batch anaerobic digestion of water hyacinth: Effects of
particle size, plant nitrogen content, and inoculum volume. Bioresource Technology, 44, 71-
76.
OSTREM, K. M., MILLRATH, K. & THEMELIS, N. J. Year. Combining anaerobic digestion and
waste-to-energy. In, 2004.
PAVAN, P., BATTISTONI, P., CECCHI, F. & ALVAREZ, J. 2000. Two-phase anaerobic digestion
of source sorted OFMSW (organic fraction of municipal solid waste): performance and kinetic
study. Water science and Technology, 111-118.
POULSEN, T. G. 2003. Solid waste management. Aalborg University. Dinamarca.
ROUSTA, K. 2008. Municipality Solid Waste Management An evaluation on the Borås System.
SABER. 2009. Technology Investigation, Assessment, and Analysis. Available:
http://media.godashboard.com//gti/Pipeline_Quality_Biomethane_FINAL_TASK_1_REPOR
T2.pdf.
SALMINEN, E. & RINTALA, J. 2002. Anaerobic digestion of organic solid poultry slaughterhouse
waste-a review. Bioresource Technology, 83, 13-26.
SHANMUGAM, P. & HORAN, N. 2009. Optimising the biogas production from leather fleshing
waste by co-digestion with MSW. Bioresource Technology, 100, 4117-4120.
SHARMA, S. K., MISHRA, I., SHARMA, M. & SAINI, J. 1988. Effect of particle size on biogas
generation from biomass residues. Biomass, 17, 251-263.
STERLING, M. 2001. Effects of ammonia nitrogen on H2 and CH4 production during anaerobic
digestion of dairy cattle manure. Bioresource Technology, 77, 9-18.
SUNDIN, A. M. Year. Disintegration of sludge-a way of optimizing anaerobic digestion. In, 2008. 10-
12.
VEEKEN, A., KALYUZHNYI, S., SCHARFF, H. & HAMELERS, B. 2000. Effect of pH and VFA
on hydrolysis of organic solid waste. Journal of environmental engineering, 126, 1076-1081.
VITURTIA, A., MATA-ALVAREZ, J., CECCHI, F. & FAZZINI, G. 1989. Two-phase anaerobic
digestion of a mixture of fruit and vegetable wastes. Biological wastes, 29, 189-199.
YADVIKA, S., SREEKRISHNAN, T., KOHLI, S. & RANA, V. 2004. Enhancement of biogas
production from solid substrates using different techniques-a review. Bioresource Technology,
95, 1-10.

39
Appendix
Appendix I. Calculations of substrate’s TS and VS
The percentage of TS and VS in the substrate of the first batch of experiment was calculated
using equation 5 and 6 respectively as follows:-
The weight of three samples A, B and C was recorded using 24 hours oven dried crucibles.
These samples weighed; 37.2715, 37.3738 and 37.13 respectively. This weight was then
averaged as shown below.
3.0526 + 3.0413+3.0639 Average weight after
drying at 105 =
% TS =
= 3.0526
37.2551 100
TS= 8.195%
Average weight
of wet Slurry =
37.2715 +37.3738+37.12
= 37.2551
3
3.0526
3
Average weight after
ignition at 550 =
0.8598 +0.8734+0.8612
3
= 0.8648
VS = 0.7565 8.195
3.5523 0.8648
%GF =
% GF = 75.650
100
VS = 6.1995%
3.5523
%VS 6.2
VS= LoI (GF ) TS VS (% of TS) = 100 GR, or
=
=

40
Appendix II: Calculation of shredded paper VS
During the second batch of experiments, the carbon-nitrogen (C/N) ratio of the substrate was
increased by adding a special paper material
3.909 + 3.935+ 4.383 Average weight after
drying at 105 =
% TS =
= 4.0756
31.1090 100
TS= 13.101%
Average weight
of wet Slurry =
39.4515 +39.0882+44.3619
= 31.1090g 3
4.0756
3
0.3967+0.4307+0.5929 Average weight after
ignition at 550 =
3
= 0.4734g
VS = 0.883845 13.101
4.0756 0.4734
%GF =
% GF = 88.3845,
100
VS = 11.57%
4.0756
VS= LoI (GF ) TS
GF = 0. 883845
Amount of VS for further calculations is
average of the two measurements. Given by:- =8.885
11.57+6.2
2
0.089%
Weight of 200ml of sample = 220.62g
= 1 3
0.089
= 19.635g
Amount of VS in sample = 0.089%
Amount of VS in 220.62g of sample
Amount of paper added to the sample =1 of sample weight
0.089% Amount of paper added to the sample = 6.545g
0.089% Amount of sample (Gram VS) added = 19. 635g 6.545g
0.089% 13.1g
Calculating the amount of paper added to the sample with respect to its VS content
0.089%
Therefore 200ml of substrate contained: 147g sample, 7.98g paper.
0.089%
Amount of paper added to the sample to yield 82% VS =
0.089%
6.545g
0.82
= 7.98g 7.98g of paper should be added to the sample
0.089%
Calculating the amount of sample which contains 13.1g VS
0.089%
13.1g
0.089 = 147.19g
But paper has 82% of VS content which corresponds to 6.545g
0.089%

41
Batch one-experiments: Operation of samples with only substrate’s carbon-nitrogen (C/N)
ratio at 34 and 42 ; with and without mesophilic sludge.
Appendix III: Operation at 34 with mesophilic sludge
Appendix IV: Operation at 34 without mesophilic sludge
HR
T (
day
s)
pH
CO
D (
mg/l
)
NH
4-N
(mg/l
)
VOLATILE FATTY ACIDS (mg/l)
Ace
tic
Pro
p
ionic
Iso-
buty
ric
Buty
ric
Iso-
val
eric
Val
eric
Tota
l
VF
As
0 4.3 1002 671 1,84 1,31 0,12 0,73 0,05 0,06 4,11
4 4.0 1062 681 4,31 0,80 0,72 0,46 0,02 0,02 6,33
5 4.1 1028 713 5,71 1,90 1,06 0,45 0,04 0,22 9,38
6 4.3 935 665 7,53 1,52 0,90 0,46 0,04 0,45 10,9
7 4.5 961 762 10,33 1,62 0,82 0,42 0,04 0,53 13,76
HR
T(d
ays)
pH
CO
D (
mg/l
)
NH
4-N
(mg/l
)
VOLATILE FATTY ACIDS (mg/l)
A
ceti
c
Pro
pio
nic
Iso-
buty
ric
Buty
ric
Iso-
val
eric
Val
eric
Tota
l
VF
As
0 4.3 1038 591 1,87 0,98 0,11 0,80 0,03 0,03 3,82
4 4.0 1064 587 5,50 1,33 0,71 0,53 0,05 0,06 8,18
5 4.1 1000 590 6,71 1,10 0,87 0,56 0,06 0,13 9,43
6 4.3 979 581 9,13 1,65 0,97 0,51 0,05 0,42 12,73
7 4.3 1008 644 12,15 2,14 0,96 0,46 0,05 0,48 16,24

42
Appendix V: Operation at 42 with mesophilic sludge
Appendix VI: Operation at 42 without mesophilic sludge
HR
T(d
ays)
pH
CO
D (
mg/l
)
NH
4-N
(m
g/l
)
VOLATILE FATTY ACIDS (mg/l)
A
ceti
c
Pro
p i
onic
Iso-b
uty
ric
Buty
ric
Iso-v
aler
ic
Val
eric
Tota
l
VF
As
0 4.7 1002 671 1,81 0,86 0,11 0,56 0,04 0,05 3,43
4 4.1 1099 725 7,15 1,33 2,81 0,51 0,04 0,16 12
5 4.2 1084 742 10,50 1,34 2,45 0,56 0,04 0,36 15,25
6 4.3 1085 754 13,11 1,62 2,35 0,60 0,04 0,41 18,13
7 4.5 1090 750 15,90 1,75 2,45 0,57 0,04 0,48 21,19
HR
T(d
ays)
pH
CO
D (
mg/l
)
NH
4-N
(m
g/l
) VOLATILE FATTY ACIDS (mg/l)
A
ceti
c
Pro
p
ionic
Iso-
buty
ric
Buty
ric
Iso-
val
eric
Val
eric
Tota
l
VF
As
0 4.7 1038 591 1,86 1,01 0,10 0,62 0,03 0,04 3,66
4 4.1 1239 689 7,90 1,46 2,57 0,51 0,05 0,07 12,56
5 4.2 1053 688 11,18 1,55 2,66 0,57 0,05 0,50 16,51
6 4.3 1006 677 14,32 2,00 2,49 0,60 0,04 0,50 19,95
7 4.6 889 738 17,17 2,68 2,67 0,41 0,04 0,77 23,74

43
Batch two-experiments: Operation of samples with substrate’s carbon-nitrogen (C/N) ratio
increased (paper added), at 34 and 42 with and without mesophilic sludge.
Appendix VII: Operation at 34 , substrate’s C/N ratio increased with the addition of
mesophilic sludge
Appendix VIII: Operation at 34 , substrate’s C/N ratio increased but without
mesophilic sludge
HR
T (
day
s)
pH
CO
D (
mg/l
)
NH
4-N
(m
g/l
) VOLATILE FATTY ACIDS
A
ceti
c
Pro
pio
nic
Iso
-
buty
ric
Buty
ric
Iso
-
val
eric
Val
eric
Tota
l
VF
As
0 4.9 840 479 1,21 0,67 0,10 0,40 0,04 0,04 2,46
4 4.3 782 627 5,40 1,10 0,22 0,43 0,06 0,14 7,35
5 4.4 760 586 5,80 1,06 0,13 0,33 0,03 0,26 7,61
6 4.4 770 600 6,07 1,48 0,56 0,41 0,04 0,23 8,79
7 4.6 705 597 10,57 1,17 0,22 0,37 0,03 0,37 12,73
HR
T (
day
s)
pH
CO
D (
mg/l
)
NH
4-N
(mg/l
)
VOLATILE FATTY ACIDS
A
ceti
c
Pro
pio
nic
Iso
-
buty
ric
Buty
ric
Iso
-
val
eric
Val
eric
Tota
l
VF
As
0 4.9 802 423 0,69 0,55 0,08 0,47 0,02 0,02 1,83
4 4.2 897 604 5,25 1,06 0,35 0,39 0,05 0,07 7,17
5 4.3 730 596 5,31 1,32 0,30 0,34 0,06 0,17 7,5
6 4.4 838 592 6,20 1,40 0,33 0,22 0,04 0,24 8,43
7 4.6 801 603 7,42 1,34 0,34 0,24 0,04 0,32 9,7

44
Appendix IX: Operation at 4 , substrate’s C/N ratio increased with the addition of
mesophilic sludge
Appendix X: Operation at 4 , substrate’s C/N ratio increased but without mesophilic
sludge
HR
T (
day
s)
pH
CO
D (
mg/l
)
NH
4-N
(m
g/l
) VOLATILE FATTY ACIDS
A
ceti
c
Pro
p
ionic
Iso-
buty
ric
Buty
ric
Iso-
val
eric
Val
eric
Tota
l
VF
As
0 4.9 841 479 1,21 0,68 0,10 0,40 0,04 0,04 2,47
4 4.3 809 560 7,95 1,16 0,27 0,27 0,03 0,17 9,85
5 4.4 769 580 8,86 1,01 0,20 0,29 0,02 0,19 10,57
6 4.4 769 586 8,92 1,16 0,28 0,36 0,03 0,24 10,99
7 4.4 755 841 12,10 1,36 0,34 0,28 0,023 0,16 14,26
HR
T (
day
s)
pH
CO
D (
mg/l
)
NH
4-N
(m
g/l
)
VOLATILE FATTY ACIDS
A
ceti
c
Pro
p i
onic
Iso-b
uty
ric
Buty
ric
Iso-v
aler
ic
Val
eric
Tota
l
VF
As
0 4.9 802 423 0,69 0,55 0,08 0,47 0,02 0,02 1,83
4 4.2 898 600 7,81 1,11 0,26 0,38 0,02 0,18 9,76
5 4.3 899 606 8,75 1,09 0,22 0,33 0,04 0,20 10,63
6 4.4 868 584 9,80 1,23 0,35 0,31 0,04 0,21 11,94
7 4.5 828 719 5,50 1,41 0,40 0,30 0,03 0,23 7,87