optimization of electricity consumption for a galvanising
TRANSCRIPT

Optimization of Electricity Consumption for a Galvanising Plant through Comparative Analysis of Regression Analysis
and Genetic Algorithm
Mendon Dewa Department of Industrial Engineering
Durban University of Technology Durban, South Africa [email protected]
Bloodless Dzwairo
Civil Engineering, Midlands Durban University of Technology
Imbali, Pietermaritzburg, South Africa [email protected]
Abstract Galvanising processes consume excessive amount of energy, and hence energy demand forecasting is a vital economic index for these plants. This paper discusses the relevant electricity consumption drivers for a galvanising plant for a prescribed baseline period. With electricity as the energy source, boundaries conditions were defined over a one year baseline period. The galvanised product tonnage, amount of zinc used, number dips per month, and the ambient temperature conditions were identified as the relevant consumption drivers. Two approaches that include regression analysis and genetic algorithm were used to predict future energy demand for a galvanising plant. The genetic algorithm model was found to be less prone to estimation errors when compared to regression method. Keywords Electricity Consumption, Regression Analysis, Genetic Algorithm.
1. Introduction Several industrial facilities are facing challenges in implementing methodologies used to establish and document energy baselines for improving their energy performance (Kanneganti et al. 2017). It is imperative that industrial facilities deploy appropriate energy performance indicators, which underpin energy-related performance monitoring and measurement. Galvanising processes are characterised by excessive consumption of energy, be it electricity, natural gas or solid fuels, and this driven by several relevant variables such as ambient temperature, production rate, and wind speed on the molten zinc surface (Maaß and Peißker 2011). Galvanising processes consume excessive amount of energy, and hence energy demand forecasting is a vital economic index for these plants. The focus of this paper is to conduct a comparative analysis of regression analysis and Genetic Algorithm and select the best approach for predicting the demand for electricity consumption in a galvanising plant.
2. Related Work
2.1 Hot dip galvanising process The hot dip galvanizing process is a multifarious metallurgical process whereby a steel material is immersed into a molten zinc or zinc alloy bath that is typically between 450ºC and 480ºC of temperature (Dewa et al. 2016). Figure 1 illustrates a typical flow diagram for the hot dip galvanising process.
Proceedings of the 2nd African International Conference on Industrial Engineering and Operations Management Harare, Zimbabwe, December 7-10, 2020
© IEOM Society International 96
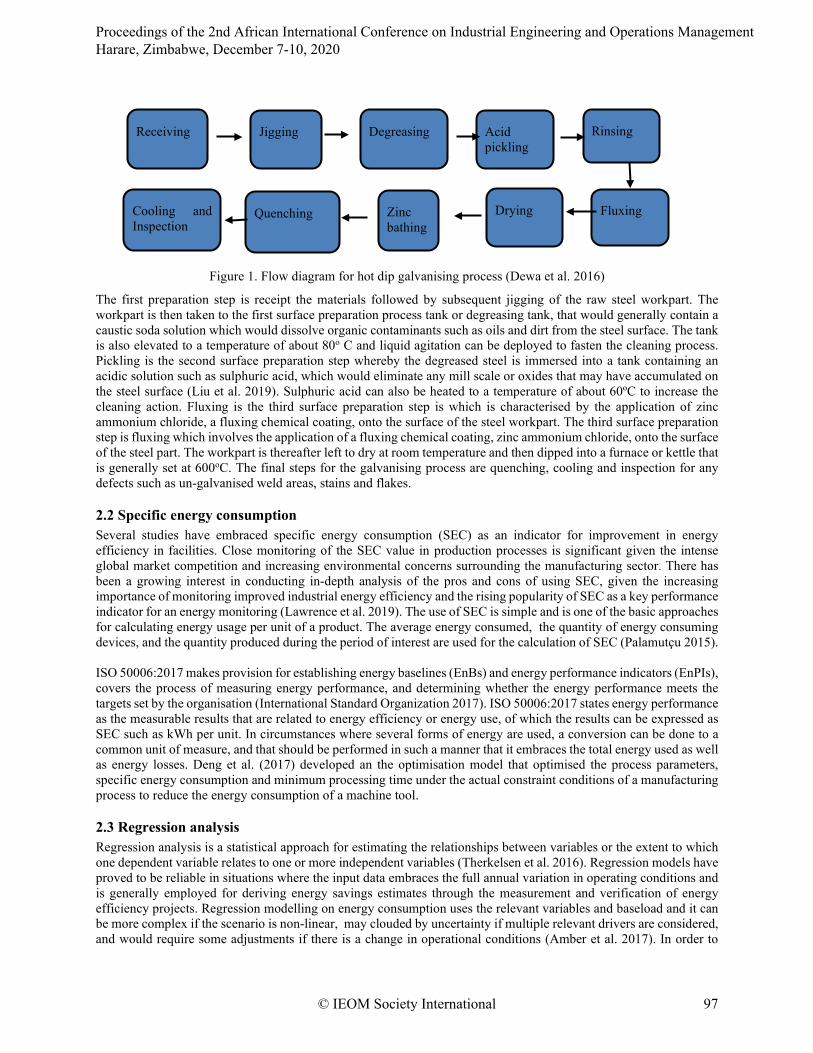
Figure 1. Flow diagram for hot dip galvanising process (Dewa et al. 2016)
The first preparation step is receipt the materials followed by subsequent jigging of the raw steel workpart. The workpart is then taken to the first surface preparation process tank or degreasing tank, that would generally contain a caustic soda solution which would dissolve organic contaminants such as oils and dirt from the steel surface. The tank is also elevated to a temperature of about 80o C and liquid agitation can be deployed to fasten the cleaning process. Pickling is the second surface preparation step whereby the degreased steel is immersed into a tank containing an acidic solution such as sulphuric acid, which would eliminate any mill scale or oxides that may have accumulated on the steel surface (Liu et al. 2019). Sulphuric acid can also be heated to a temperature of about 60ºC to increase the cleaning action. Fluxing is the third surface preparation step is which is characterised by the application of zinc ammonium chloride, a fluxing chemical coating, onto the surface of the steel workpart. The third surface preparation step is fluxing which involves the application of a fluxing chemical coating, zinc ammonium chloride, onto the surface of the steel part. The workpart is thereafter left to dry at room temperature and then dipped into a furnace or kettle that is generally set at 600oC. The final steps for the galvanising process are quenching, cooling and inspection for any defects such as un-galvanised weld areas, stains and flakes.
2.2 Specific energy consumption Several studies have embraced specific energy consumption (SEC) as an indicator for improvement in energy efficiency in facilities. Close monitoring of the SEC value in production processes is significant given the intense global market competition and increasing environmental concerns surrounding the manufacturing sector. There has been a growing interest in conducting in-depth analysis of the pros and cons of using SEC, given the increasing importance of monitoring improved industrial energy efficiency and the rising popularity of SEC as a key performance indicator for an energy monitoring (Lawrence et al. 2019). The use of SEC is simple and is one of the basic approaches for calculating energy usage per unit of a product. The average energy consumed, the quantity of energy consuming devices, and the quantity produced during the period of interest are used for the calculation of SEC (Palamutçu 2015). ISO 50006:2017 makes provision for establishing energy baselines (EnBs) and energy performance indicators (EnPIs), covers the process of measuring energy performance, and determining whether the energy performance meets the targets set by the organisation (International Standard Organization 2017). ISO 50006:2017 states energy performance as the measurable results that are related to energy efficiency or energy use, of which the results can be expressed as SEC such as kWh per unit. In circumstances where several forms of energy are used, a conversion can be done to a common unit of measure, and that should be performed in such a manner that it embraces the total energy used as well as energy losses. Deng et al. (2017) developed an the optimisation model that optimised the process parameters, specific energy consumption and minimum processing time under the actual constraint conditions of a manufacturing process to reduce the energy consumption of a machine tool.
2.3 Regression analysis Regression analysis is a statistical approach for estimating the relationships between variables or the extent to which one dependent variable relates to one or more independent variables (Therkelsen et al. 2016). Regression models have proved to be reliable in situations where the input data embraces the full annual variation in operating conditions and is generally employed for deriving energy savings estimates through the measurement and verification of energy efficiency projects. Regression modelling on energy consumption uses the relevant variables and baseload and it can be more complex if the scenario is non-linear, may clouded by uncertainty if multiple relevant drivers are considered, and would require some adjustments if there is a change in operational conditions (Amber et al. 2017). In order to
Jigging Receiving Degreasing Acid pickling
Rinsing
Fluxing Drying Zinc bathing
Quenching Cooling and Inspection
Proceedings of the 2nd African International Conference on Industrial Engineering and Operations Management Harare, Zimbabwe, December 7-10, 2020
© IEOM Society International 97
estimate a single regression model with more than one outcome variable, multivariate regression technique can be used. An R2 of 0.75 indicates a reasonable correlation between energy consumption and dependent variable, 0.9 or above is very good, while an R2 much below 0.7 or so is likely an indication of poor control, or room for improvement of the analysis methodology (Moletsane et al. 2018).
2.4 Genetic Algorithm A Genetic Algorithm (GA) is comparable to a natural evolution process whereby a population of a specific species acclimatises to the natural surroundings under consideration, where a population is created and then left to evolve in order to adapt to its surroundings or environment (Nzanywayingoma and Yang 2017). Genetic algorithms emulate the evolutionary process of species that replicate in their habitat and focus on a set of current solutions called population. Through a mechanism called crossover that combines part of the genetic features of each parent, new candidates for the solution are generated, unto which random mutation is applied. If the new offspring inherits desirable traits from the parents it will have a higher chance of surviving (Mirjalili et al. 2020). A crucial advantage of a GA lies in its ability to ultilise accumulative information from initial unknown search space to conduct subsequent searches in the global space. The chromosome is a key feature of GAs that is coded as a string of characters and linked to the problem at hand through a fitness function (Guha et al. 2019). Given the complexity of the NP-hard problem, using a genetic algorithm, Cohen et al. (2019) developed a decision support flexible scheduling system for continuous galvanising lines. The scheduling solution predicted a continuous galvanization line sequences to reduce costs and improve productivity.
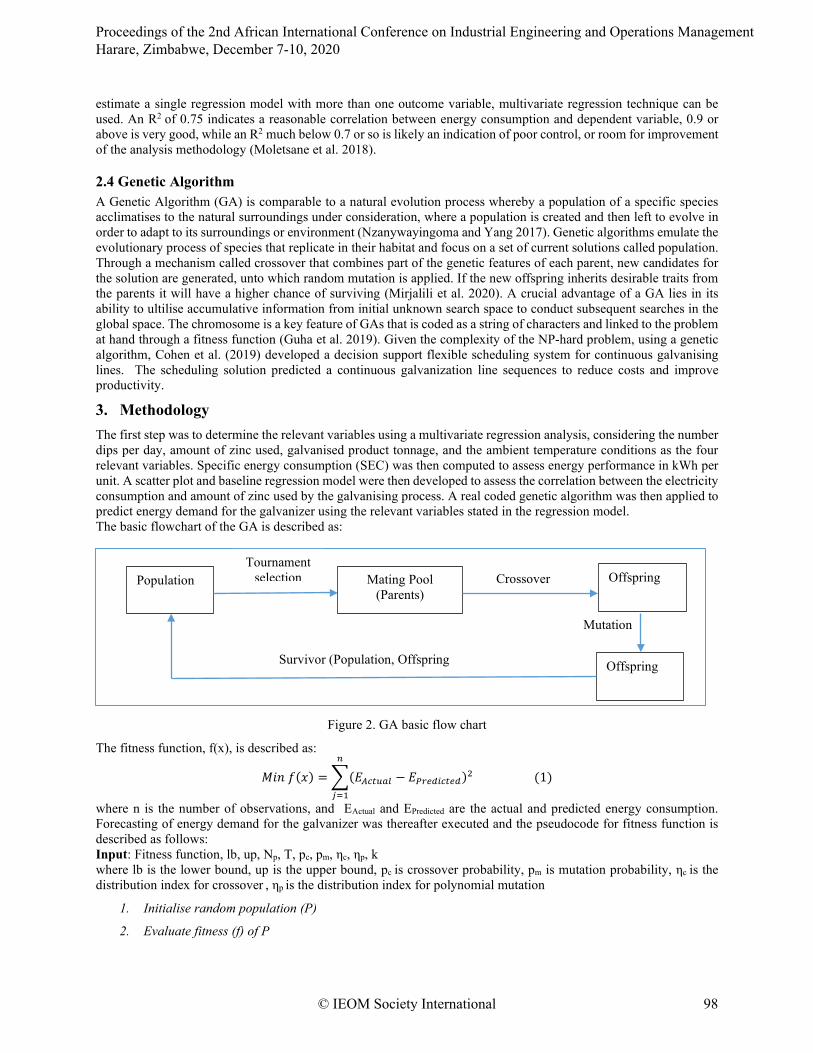
3. Methodology The first step was to determine the relevant variables using a multivariate regression analysis, considering the number dips per day, amount of zinc used, galvanised product tonnage, and the ambient temperature conditions as the four relevant variables. Specific energy consumption (SEC) was then computed to assess energy performance in kWh per unit. A scatter plot and baseline regression model were then developed to assess the correlation between the electricity consumption and amount of zinc used by the galvanising process. A real coded genetic algorithm was then applied to predict energy demand for the galvanizer using the relevant variables stated in the regression model. The basic flowchart of the GA is described as:
Figure 2. GA basic flow chart
The fitness function, f(x), is described as:
𝑀𝑀𝑀𝑀𝑀𝑀 𝑓𝑓(𝑥𝑥) = �(𝐸𝐸𝐴𝐴𝐴𝐴𝐴𝐴𝐴𝐴𝐴𝐴𝐴𝐴 − 𝐸𝐸𝑃𝑃𝑃𝑃𝑃𝑃𝑃𝑃𝑃𝑃𝐴𝐴𝐴𝐴𝑃𝑃𝑃𝑃)2𝑛𝑛
𝑗𝑗=1
(1)
where n is the number of observations, and EActual and EPredicted are the actual and predicted energy consumption. Forecasting of energy demand for the galvanizer was thereafter executed and the pseudocode for fitness function is described as follows: Input: Fitness function, lb, up, Np, T, pc, pm, ηc, ηp, k where lb is the lower bound, up is the upper bound, pc is crossover probability, pm is mutation probability, ηc is the distribution index for crossover , ηp is the distribution index for polynomial mutation
1. Initialise random population (P)
2. Evaluate fitness (f) of P
Mutation
Population Mating Pool (Parents)
Offspring
Offspring
Tournament selection Crossover
Survivor (Population, Offspring
Proceedings of the 2nd African International Conference on Industrial Engineering and Operations Management Harare, Zimbabwe, December 7-10, 2020
© IEOM Society International 98

for t = 1 to T Perform tournament selection of tournament size, k for i = 1 to Np/2 Randomly choose two parents if r < pc Generate two offspring using SBX-crossover Bound the offspring else Copy the selected parents as offspring end end for i =1 to Np if r < pm
Perform polynomial mutation of ith offspring Bound the mutated offspring else No change in ith offspring end end
Evaluate the fitness Combine population (µ) and offspring (λ ) to perform (µ + λ) End where Np is population size, r is random number, Simulated Binary Crossover (SBX) simulates the single point crossover on binary strings, requiring two parents to generate two offsprings. The offsprings, Oa and Ob have a spread that is proportional to that of the parents, P'a and P'b derived through the equation:
𝑂𝑂𝐴𝐴 − 𝑂𝑂𝑏𝑏 = 𝛽𝛽(𝑃𝑃𝐴𝐴′ − 𝑃𝑃𝑏𝑏′) (2) where 𝛽𝛽 is computed through
𝛽𝛽 = �(2u)
1ηc+1 if u = ≤ 0.5
� 12[1−𝐴𝐴]
�1
ηc+1 otherwise (3)
Where u is a random number and ηc is the distribution index for crossover. The offsprings are generated through:
𝑂𝑂𝐴𝐴 = 0.5[(1 + 𝛽𝛽)𝑃𝑃𝐴𝐴′ + (1 − 𝛽𝛽)𝑃𝑃𝑏𝑏′ ] (4)
𝑂𝑂𝑏𝑏 = 0.5[(1 − 𝛽𝛽)𝑃𝑃𝐴𝐴′ + (1 + 𝛽𝛽)𝑃𝑃𝑏𝑏′] (5)
For polynomial mutation, δ was computed as:
𝛿𝛿 = � (2r)1
ηm−1 if r = < 0.5
1 − [2(1 − r)]1
ηm+1 if r = ≥ 0.5 (6)
Where 𝜂𝜂𝑚𝑚 is the probability distribution mean
The offspring that is generated is described as: 𝑦𝑦 = 𝑂𝑂 + (𝑢𝑢𝑢𝑢 − 𝑙𝑙𝑢𝑢)𝛿𝛿 (7)
Where O is the offspring solution, y is the offspring solution after mutation, ub is the upper bound and lb is the lower bound.
Proceedings of the 2nd African International Conference on Industrial Engineering and Operations Management Harare, Zimbabwe, December 7-10, 2020
© IEOM Society International 99
4. Results and Discussion
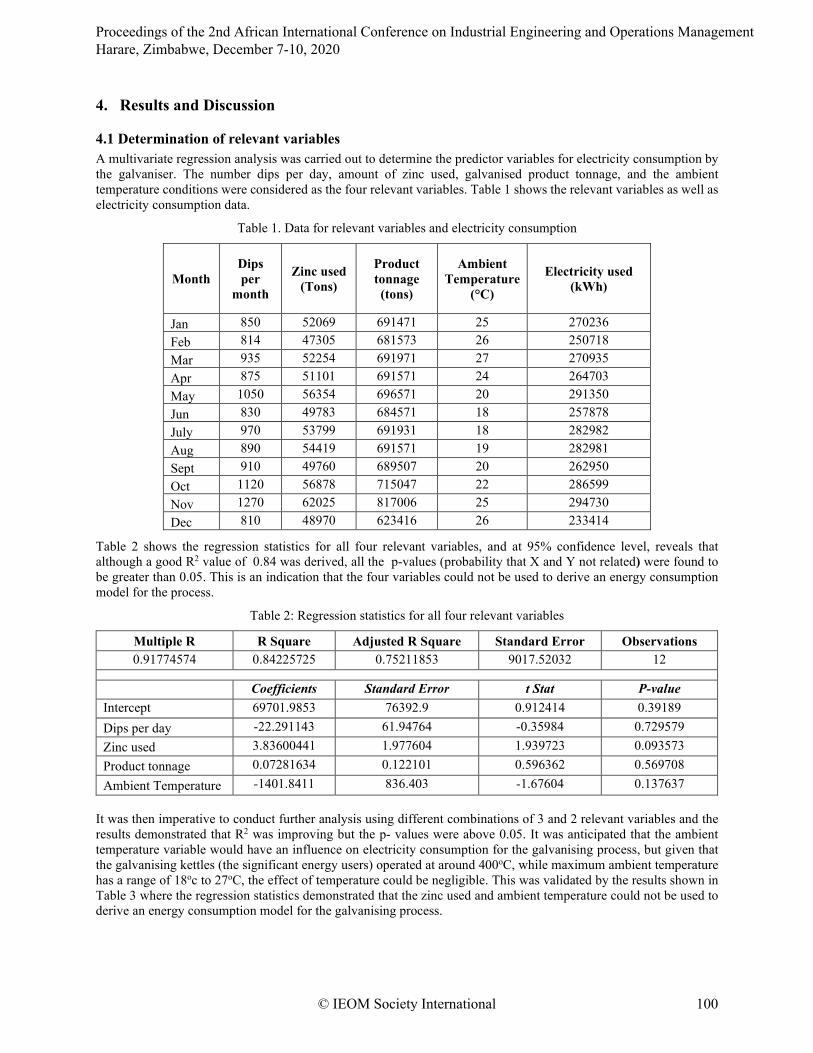
4.1 Determination of relevant variables A multivariate regression analysis was carried out to determine the predictor variables for electricity consumption by the galvaniser. The number dips per day, amount of zinc used, galvanised product tonnage, and the ambient temperature conditions were considered as the four relevant variables. Table 1 shows the relevant variables as well as electricity consumption data.
Table 1. Data for relevant variables and electricity consumption
Month Dips per
month
Zinc used (Tons)
Product tonnage (tons)
Ambient Temperature
(°C)
Electricity used (kWh)
Jan 850 52069 691471 25 270236 Feb 814 47305 681573 26 250718 Mar 935 52254 691971 27 270935 Apr 875 51101 691571 24 264703 May 1050 56354 696571 20 291350 Jun 830 49783 684571 18 257878 July 970 53799 691931 18 282982 Aug 890 54419 691571 19 282981 Sept 910 49760 689507 20 262950 Oct 1120 56878 715047 22 286599 Nov 1270 62025 817006 25 294730 Dec 810 48970 623416 26 233414
Table 2 shows the regression statistics for all four relevant variables, and at 95% confidence level, reveals that although a good R2 value of 0.84 was derived, all the p-values (probability that X and Y not related) were found to be greater than 0.05. This is an indication that the four variables could not be used to derive an energy consumption model for the process.
Table 2: Regression statistics for all four relevant variables
Multiple R R Square Adjusted R Square Standard Error Observations 0.91774574 0.84225725 0.75211853 9017.52032 12
Coefficients Standard Error t Stat P-value Intercept 69701.9853 76392.9 0.912414 0.39189 Dips per day -22.291143 61.94764 -0.35984 0.729579 Zinc used 3.83600441 1.977604 1.939723 0.093573 Product tonnage 0.07281634 0.122101 0.596362 0.569708 Ambient Temperature -1401.8411 836.403 -1.67604 0.137637
It was then imperative to conduct further analysis using different combinations of 3 and 2 relevant variables and the results demonstrated that R2 was improving but the p- values were above 0.05. It was anticipated that the ambient temperature variable would have an influence on electricity consumption for the galvanising process, but given that the galvanising kettles (the significant energy users) operated at around 400oC, while maximum ambient temperature has a range of 18oc to 27oC, the effect of temperature could be negligible. This was validated by the results shown in Table 3 where the regression statistics demonstrated that the zinc used and ambient temperature could not be used to derive an energy consumption model for the galvanising process.
Proceedings of the 2nd African International Conference on Industrial Engineering and Operations Management Harare, Zimbabwe, December 7-10, 2020
© IEOM Society International 100
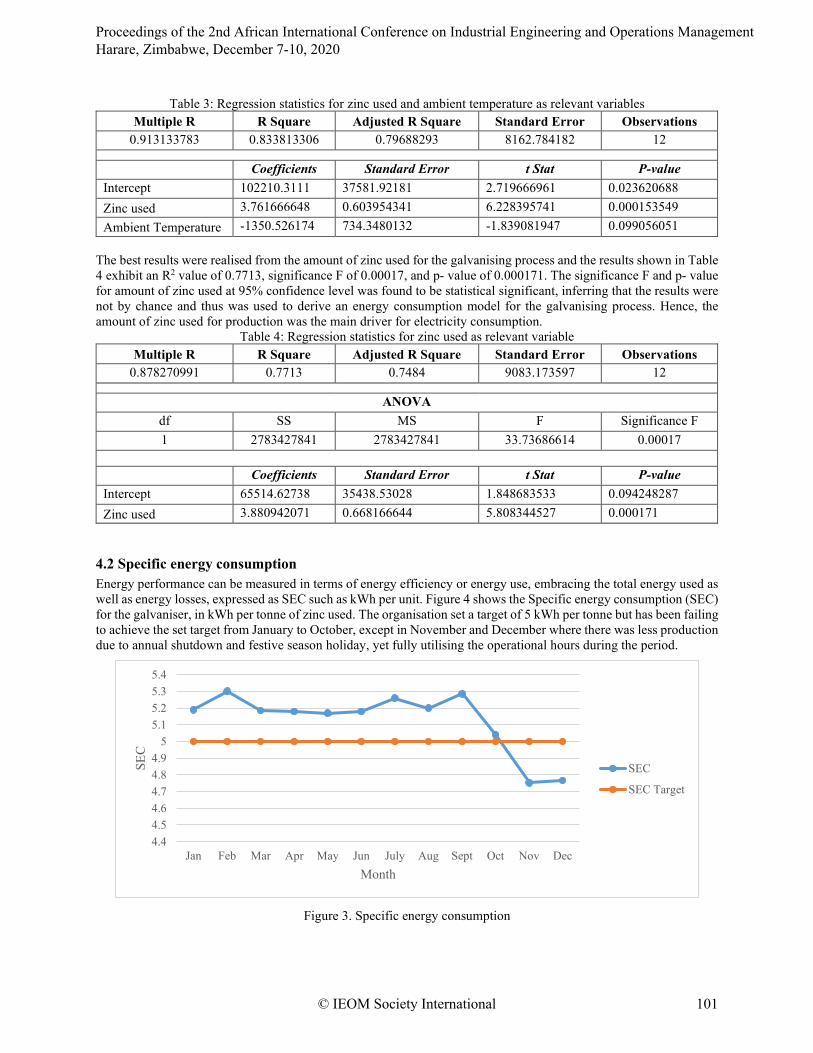
Table 3: Regression statistics for zinc used and ambient temperature as relevant variables Multiple R R Square Adjusted R Square Standard Error Observations
0.913133783 0.833813306 0.79688293 8162.784182 12
Coefficients Standard Error t Stat P-value Intercept 102210.3111 37581.92181 2.719666961 0.023620688 Zinc used 3.761666648 0.603954341 6.228395741 0.000153549 Ambient Temperature -1350.526174 734.3480132 -1.839081947 0.099056051
The best results were realised from the amount of zinc used for the galvanising process and the results shown in Table 4 exhibit an R2 value of 0.7713, significance F of 0.00017, and p- value of 0.000171. The significance F and p- value for amount of zinc used at 95% confidence level was found to be statistical significant, inferring that the results were not by chance and thus was used to derive an energy consumption model for the galvanising process. Hence, the amount of zinc used for production was the main driver for electricity consumption.
Table 4: Regression statistics for zinc used as relevant variable Multiple R R Square Adjusted R Square Standard Error Observations
0.878270991 0.7713 0.7484 9083.173597 12
ANOVA df SS MS F Significance F 1 2783427841 2783427841 33.73686614 0.00017
Coefficients Standard Error t Stat P-value Intercept 65514.62738 35438.53028 1.848683533 0.094248287 Zinc used 3.880942071 0.668166644 5.808344527 0.000171
4.2 Specific energy consumption Energy performance can be measured in terms of energy efficiency or energy use, embracing the total energy used as well as energy losses, expressed as SEC such as kWh per unit. Figure 4 shows the Specific energy consumption (SEC) for the galvaniser, in kWh per tonne of zinc used. The organisation set a target of 5 kWh per tonne but has been failing to achieve the set target from January to October, except in November and December where there was less production due to annual shutdown and festive season holiday, yet fully utilising the operational hours during the period.
Figure 3. Specific energy consumption
4.44.54.64.74.84.9
55.15.25.35.4
Jan Feb Mar Apr May Jun July Aug Sept Oct Nov Dec
SEC
Month
SEC
SEC Target
Proceedings of the 2nd African International Conference on Industrial Engineering and Operations Management Harare, Zimbabwe, December 7-10, 2020
© IEOM Society International 101
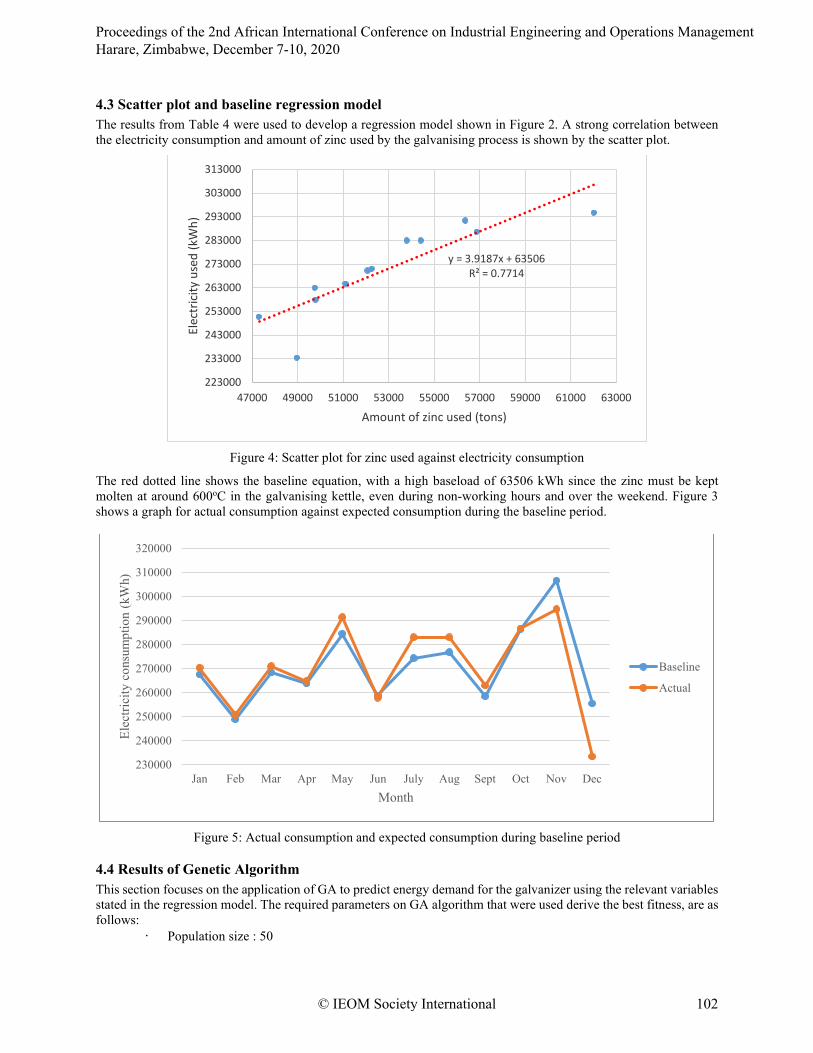
4.3 Scatter plot and baseline regression model The results from Table 4 were used to develop a regression model shown in Figure 2. A strong correlation between the electricity consumption and amount of zinc used by the galvanising process is shown by the scatter plot.
Figure 4: Scatter plot for zinc used against electricity consumption
The red dotted line shows the baseline equation, with a high baseload of 63506 kWh since the zinc must be kept molten at around 600oC in the galvanising kettle, even during non-working hours and over the weekend. Figure 3 shows a graph for actual consumption against expected consumption during the baseline period.
Figure 5: Actual consumption and expected consumption during baseline period
4.4 Results of Genetic Algorithm This section focuses on the application of GA to predict energy demand for the galvanizer using the relevant variables stated in the regression model. The required parameters on GA algorithm that were used derive the best fitness, are as follows:
• Population size : 50
y = 3.9187x + 63506R² = 0.7714
223000
233000
243000
253000
263000
273000
283000
293000
303000
313000
47000 49000 51000 53000 55000 57000 59000 61000 63000
Elec
tric
ity u
sed
(kW
h)
Amount of zinc used (tons)
230000
240000
250000
260000
270000
280000
290000
300000
310000
320000
Jan Feb Mar Apr May Jun July Aug Sept Oct Nov Dec
Elec
trici
ty c
onsu
mpt
ion
(kW
h)
Month
Baseline
Actual
Proceedings of the 2nd African International Conference on Industrial Engineering and Operations Management Harare, Zimbabwe, December 7-10, 2020
© IEOM Society International 102
• Number of the generation (Iterations): 100 • Distribution index for crossover: 20 • Distribution index for polynomial mutation: 20 • Crossover rate: 0.8 • Mutation rate: 0.2
The fitness function, f(x), is described as:
𝑀𝑀𝑀𝑀𝑀𝑀 𝑓𝑓(𝑥𝑥) = �(𝐸𝐸𝐴𝐴𝐴𝐴𝐴𝐴𝐴𝐴𝐴𝐴𝐴𝐴 − 𝐸𝐸𝑃𝑃𝑃𝑃𝑃𝑃𝑃𝑃𝑃𝑃𝐴𝐴𝐴𝐴𝑃𝑃𝑃𝑃)2 (8)𝑛𝑛
𝑗𝑗=1
where n is the number of observations, and EActual and EPredicted are the actual and predicted energy consumption. Forecasting of energy demand for the galvanizer was executed by using the regression model in the form:
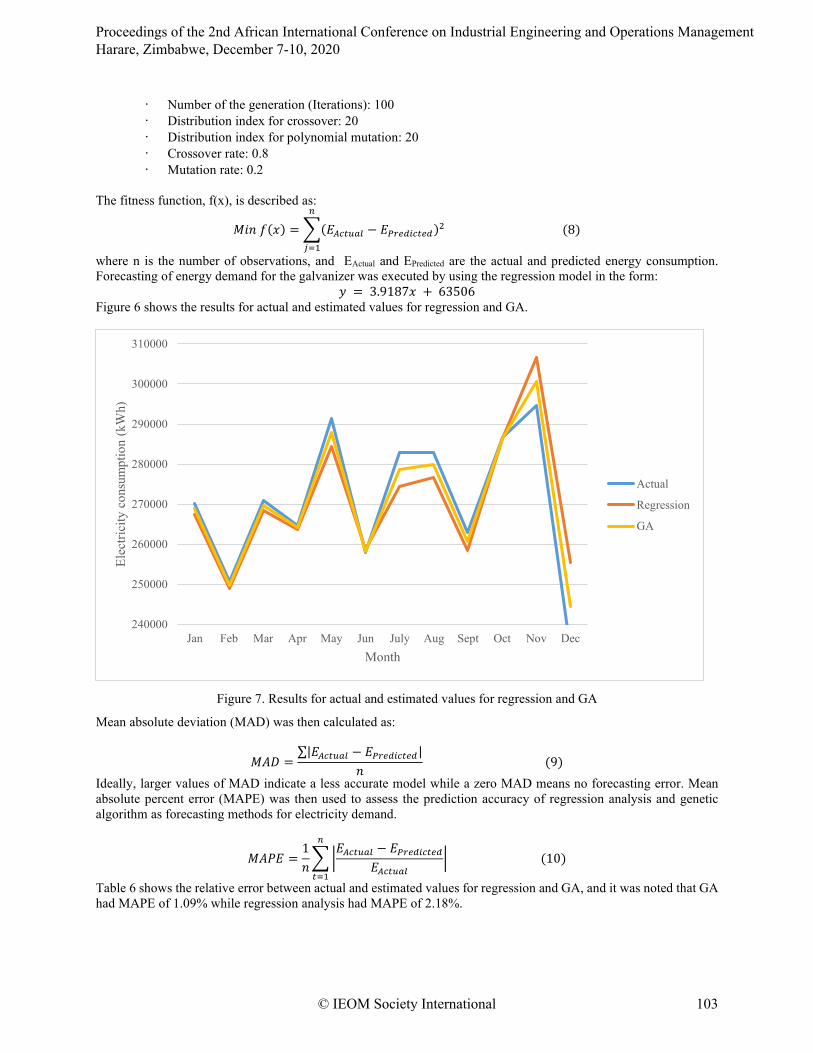
𝑦𝑦 = 3.9187𝑥𝑥 + 63506 Figure 6 shows the results for actual and estimated values for regression and GA.
Figure 7. Results for actual and estimated values for regression and GA
Mean absolute deviation (MAD) was then calculated as:
𝑀𝑀𝑀𝑀𝑀𝑀 =∑|𝐸𝐸𝐴𝐴𝐴𝐴𝐴𝐴𝐴𝐴𝐴𝐴𝐴𝐴 − 𝐸𝐸𝑃𝑃𝑃𝑃𝑃𝑃𝑃𝑃𝑃𝑃𝐴𝐴𝐴𝐴𝑃𝑃𝑃𝑃|
𝑀𝑀 (9)
Ideally, larger values of MAD indicate a less accurate model while a zero MAD means no forecasting error. Mean absolute percent error (MAPE) was then used to assess the prediction accuracy of regression analysis and genetic algorithm as forecasting methods for electricity demand.
𝑀𝑀𝑀𝑀𝑃𝑃𝐸𝐸 =1𝑀𝑀��
𝐸𝐸𝐴𝐴𝐴𝐴𝐴𝐴𝐴𝐴𝐴𝐴𝐴𝐴 − 𝐸𝐸𝑃𝑃𝑃𝑃𝑃𝑃𝑃𝑃𝑃𝑃𝐴𝐴𝐴𝐴𝑃𝑃𝑃𝑃𝐸𝐸𝐴𝐴𝐴𝐴𝐴𝐴𝐴𝐴𝐴𝐴𝐴𝐴
�𝑛𝑛
𝐴𝐴=1
(10)
Table 6 shows the relative error between actual and estimated values for regression and GA, and it was noted that GA had MAPE of 1.09% while regression analysis had MAPE of 2.18%.
240000
250000
260000
270000
280000
290000
300000
310000
Jan Feb Mar Apr May Jun July Aug Sept Oct Nov Dec
Elec
trici
ty c
onsu
mpt
ion
(kW
h)
Month
Actual
Regression
GA
Proceedings of the 2nd African International Conference on Industrial Engineering and Operations Management Harare, Zimbabwe, December 7-10, 2020
© IEOM Society International 103
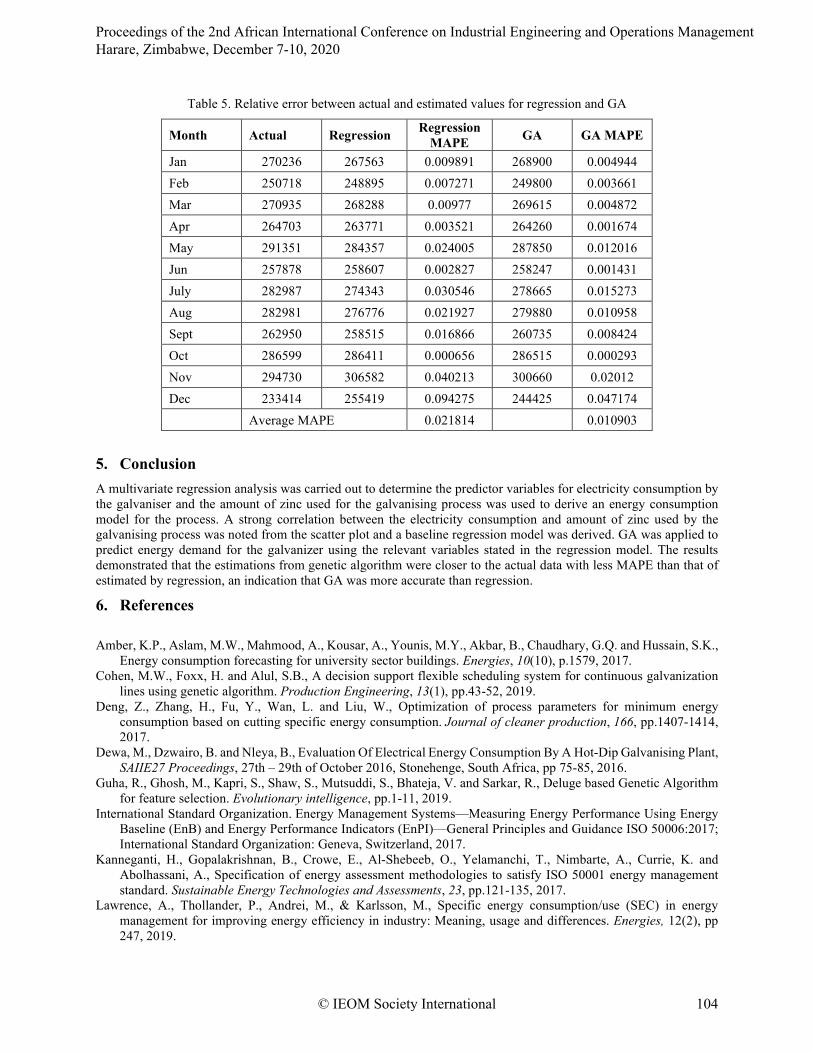
Table 5. Relative error between actual and estimated values for regression and GA
5. Conclusion A multivariate regression analysis was carried out to determine the predictor variables for electricity consumption by the galvaniser and the amount of zinc used for the galvanising process was used to derive an energy consumption model for the process. A strong correlation between the electricity consumption and amount of zinc used by the galvanising process was noted from the scatter plot and a baseline regression model was derived. GA was applied to predict energy demand for the galvanizer using the relevant variables stated in the regression model. The results demonstrated that the estimations from genetic algorithm were closer to the actual data with less MAPE than that of estimated by regression, an indication that GA was more accurate than regression.
6. References Amber, K.P., Aslam, M.W., Mahmood, A., Kousar, A., Younis, M.Y., Akbar, B., Chaudhary, G.Q. and Hussain, S.K.,
Energy consumption forecasting for university sector buildings. Energies, 10(10), p.1579, 2017. Cohen, M.W., Foxx, H. and Alul, S.B., A decision support flexible scheduling system for continuous galvanization
lines using genetic algorithm. Production Engineering, 13(1), pp.43-52, 2019. Deng, Z., Zhang, H., Fu, Y., Wan, L. and Liu, W., Optimization of process parameters for minimum energy
consumption based on cutting specific energy consumption. Journal of cleaner production, 166, pp.1407-1414, 2017.
Dewa, M., Dzwairo, B. and Nleya, B., Evaluation Of Electrical Energy Consumption By A Hot-Dip Galvanising Plant, SAIIE27 Proceedings, 27th – 29th of October 2016, Stonehenge, South Africa, pp 75-85, 2016.
Guha, R., Ghosh, M., Kapri, S., Shaw, S., Mutsuddi, S., Bhateja, V. and Sarkar, R., Deluge based Genetic Algorithm for feature selection. Evolutionary intelligence, pp.1-11, 2019.
International Standard Organization. Energy Management Systems—Measuring Energy Performance Using Energy Baseline (EnB) and Energy Performance Indicators (EnPI)—General Principles and Guidance ISO 50006:2017; International Standard Organization: Geneva, Switzerland, 2017.
Kanneganti, H., Gopalakrishnan, B., Crowe, E., Al-Shebeeb, O., Yelamanchi, T., Nimbarte, A., Currie, K. and Abolhassani, A., Specification of energy assessment methodologies to satisfy ISO 50001 energy management standard. Sustainable Energy Technologies and Assessments, 23, pp.121-135, 2017.
Lawrence, A., Thollander, P., Andrei, M., & Karlsson, M., Specific energy consumption/use (SEC) in energy management for improving energy efficiency in industry: Meaning, usage and differences. Energies, 12(2), pp 247, 2019.
Month Actual Regression Regression MAPE GA GA MAPE
Jan 270236 267563 0.009891 268900 0.004944 Feb 250718 248895 0.007271 249800 0.003661 Mar 270935 268288 0.00977 269615 0.004872 Apr 264703 263771 0.003521 264260 0.001674 May 291351 284357 0.024005 287850 0.012016 Jun 257878 258607 0.002827 258247 0.001431 July 282987 274343 0.030546 278665 0.015273 Aug 282981 276776 0.021927 279880 0.010958 Sept 262950 258515 0.016866 260735 0.008424 Oct 286599 286411 0.000656 286515 0.000293 Nov 294730 306582 0.040213 300660 0.02012 Dec 233414 255419 0.094275 244425 0.047174 Average MAPE 0.021814 0.010903
Proceedings of the 2nd African International Conference on Industrial Engineering and Operations Management Harare, Zimbabwe, December 7-10, 2020
© IEOM Society International 104

Liu, Q., Ma, R., Du, A., Zhang, X., Yang, H., Fan, Y., Zhao, X. and Cao, X. Investigation of the anticorrosion properties of graphene oxide doped thin organic anticorrosion films for hot-dip galvanized steel, Applied Surface Science 480 (2019): 646-654.
Maaß, P. and Peißker, P. eds., Handbook of hot-dip galvanization. John Wiley & Sons, 2011. Mirjalili, S., Dong, J.S., Sadiq, A.S. and Faris, H., Genetic algorithm: Theory, literature review, and application in
image reconstruction. In Nature-Inspired Optimizers, pp. 69-85, Springer, Cham, 2020. Moletsane, P.P., Motlhamme, T.J., Malekian, R. and Bogatmoska, D.C., Linear regression analysis of energy
consumption data for smart homes. In 2018 41st International Convention on Information and Communication Technology, Electronics and Microelectronics (MIPRO), pp. 0395-0399. IEEE, 2018.
Nzanywayingoma, F. and Yang, Y., Analysis of particle swarm optimization and genetic algorithm based on task scheduling in cloud computing environment. Int J Adv Comput Sci Appl, 8(1), pp.19-25, 2017.
Palamutçu, S., Energy footprints in the textile industry. In Handbook of Life Cycle Assessment (LCA) of Textiles and Clothing, pp. 31-61. Woodhead Publishing, 2015.
Therkelsen P, Rao P, Sholes D, Meffert B, Green R, Nimbalkar SU, Mckane A., The Value of Regression Models in Determining Industrial Energy Savings. Oak Ridge National Lab.(ORNL), Oak Ridge, TN (United States), 2016.
Proceedings of the 2nd African International Conference on Industrial Engineering and Operations Management Harare, Zimbabwe, December 7-10, 2020
© IEOM Society International 105