optical long baseline interferometry: examples from … · optical long baseline interferometry:...
TRANSCRIPT

New Concepts in Imaging: Optical and Statistical ModelsD. Mary, C. Theys and C. Aime (eds)EAS Publications Series, 59 (2013) 25–36
OPTICAL LONG BASELINE INTERFEROMETRY: EXAMPLESFROM VEGA/CHARA
D. Mourard1
Abstract. In this paper I review some of the fundamental aspects ofoptical long baseline interferometry. I present the principles of imageformation, the main difficulties and the ways that have been openedfor high angular resolution imaging. I also review some of the re-cent aspects of the science program developed on the VEGA/CHARAinterferometer.
1 Introduction
Astrophysics is based on observations and physical analysis. From the point of viewof observations, this science has mainly been developed through the progresses inthe techniques of imaging, astrometry, photometry, spectroscopy and polarimetry.However, through these techniques, objects are almost always considered as point-like source and no information is obtained on their brightness distribution. Thisis of course due to the diffraction principle, the limited size of the collecting opticsused in telescopes and the very small apparent angular sizes of these objects.
In 1974, A. Labeyrie succeeded for the first time to obtain interference fringeson a stellar source with two separate telescopes. This achievement opened the roadfor the modern development of optical interferometry and allowed to give access toastrophysics at very high angular resolution. Today, the situation is dominated bya few facilities: mainly the VLTI (Glindemann et al. 2004), KECK (Colavita et al.2006) and the CHARA array (Ten Brummelaar et al. 2005), allowing combinationof 4 to 6 telescopes from the visible to the thermal infrared domain. With almost50 scientific papers per year, the progression of the astrophysical impact of longbaseline optical interferometry is almost following, with a time shift of 30 years,the development of radio interferometry.
The main scientific domains of modern optical long baseline interferometry arethe study of brightness distribution of compact objects such as stellar surfaces,
1 Laboratoire Lagrange, UMR 7293, UNS-CNRS-OCA, Boulevard de l’Observatoire, BP. 4229,06304 Nice Cedex 4, France
c© EAS, EDP Sciences 2013DOI: 10.1051/eas/1359002

26 New Concepts in Imaging: Optical and Statistical Models
Fig. 1. Recent examples of stellar surface images obtained by optical long baseline in-
terferometers. Left: Monnier et al. (2007). Middle: Lacour et al. (2008). Right: Haubois
et al. (2008).
cores of young stellar object environments or central regions of active galactic nu-clei. These studies require high resolution in the space, time and spectral domainsfor a correct understanding of the physical processes in action in these objects. Asan imaging technique, optical long baseline interferometry performance is highlyrelated to the properties of the field of view and of the transfer function. Recentadvances by different groups in the world have lead to the first images of stellarsurfaces (see Fig. 1).
Although these first images show remarkable progresses in that field, it is clearhowever that more technical work is needed to improve the impact of long baselineinterferometry. The main issue is certainly the need for angular resolution thatrequires long baseline (B > 100 m) and short wavelengths (λ < 1 μm) to reachresolution lower than the millisecond of degree needed to resolve details on thesurface of stars. Also a much higher dynamic range in the images will be nec-essary which corresponds in fact to a better sensitivity and an improved signalto noise ratio in the raw measurements. This last point is of course related tothe improvement of the limiting magnitude of the technique which is absolutelymandatory for large programs in the extragalactic domain.
In Section 2, I review some of the general principles of optical long baselineinterferometry. In Section 3, I will show that optical interferometry is mainly animaging technique and will detail the most important aspects of this point of view.I present in Section 4, the main limitations encountered and the way optical longbaseline interferometry is currently implemented as an observing technique. Aftera rapid presentation of the CHARA Array and the VEGA instrument in Section 5,I will present recent results obtained by the VEGA group in Section 6.
2 Principles of optical interferometry
This section does not intend to present a complete and rigorous demonstration ofthe principles of optical interferometry. This is of course out of the scope of thispaper and the reader could refer to the excellent book of Goodman (2000) as well
D. Mourard: Optical Interferometry with VEGA/CHARA 27
as to many other reviews. The idea is to present by different point of views theprinciple of the physical properties of long baseline interferometry.
2.1 Coherence of the stellar wave
If we consider a star located at infinity and presenting an angular diameter θ, thisobject defines a solid angle Ω defined by:
Ω = π
(θ
2
)2
. (2.1)
We consider a screen of radius r receiving the stellar wave. This screen has asurface S = πr2. This defines a beam etendue ε that can be written as:
ε = SΩ = π2r2
(θ
2
)2
. (2.2)
The principle of coherence, as defined by Goodman in his book, indicates that wecan consider the wave as coherent if ε < λ2. This defines a so-called radius ofcoherence rc:
rc =λ
π( θ2 )· (2.3)
One can note that in the case of a star with an angular diameter θ = 10 masand at a wavelength λ = 1 μm, this leads to a value of rc � 13 m. We thusunderstand that it exists a relation between the coherence of the wave and theangular diameter of the star. The coherence of the electromagnetic wave ψ couldbe determined by the computation of the complex degree of mutual coherence(Γ12) between two points of the collecting screen separated by a distance B.
Γ12 =|ψ1ψ2
∗|√|ψ1|2|ψ2|2
· (2.4)
By using the Van-Cittert Zernike theorem and the notation O for the FourierTransform of the star brightness distribution, we can write the following relation:
Γ12 =O(B
λ )
O(0)· (2.5)
Considering the star as a uniform disk, we finally obtain:
Γ12 =∣∣∣∣2J1(πBθ/λ)
πBθ/λ)
∣∣∣∣ · (2.6)
The definition of coherence by Goodman corresponds to the case where Γ12 = 0.5which corresponds to πBθ/λ = 2 and thus to B = rc = λ
π( θ2 )
, which is an other
way of defining the coherence (ε < λ2).
28 New Concepts in Imaging: Optical and Statistical Models
This simple calculation shows that the coherence of the electromagnetic waveof stellar sources could be measured through a spatial sampling if one can access tovery long baselines (B larger than 100 m typically). In this paper we only considerthe case of direct interferometry in the optical domain, which means that we usedetectors sensitive to the intensity of the electromagnetic wave and that we recordthe intensity resulting from the coherent addition of the complex waves. Comingback to the simple case of an instrumental setup dedicated to the measurementof the complex degree of mutual coherence, a practical implementation of thisexperiment is thus to consider the coherent addition of the two complex wavescollected at point 1 and 2 with a phase shift on the second one dedicated to thenecessary adjustment of the optical path between the two wave collectors. Thuswe obtain the total intensity I as:
I = |ψ1 + ψ2eiφ|, (2.7)
I = ψ12 + ψ2
2 + 2ψ1ψ2∗cos(φ). (2.8)
Denoting Ii the intensity of the wave at point i, we finally obtain:
I = (I1 + I2)
⎛⎝1 +2√
I1I2
I1 + I2∗ ψ1ψ2
∗√|ψ1|2|ψ2|2
∗ cos(φ)
⎞⎠ . (2.9)
The term with the cosinus function represents, if one introduces variations of φeither by temporal or spatial sampling, a modulation in the measured intensity,which is also called interference fringes. The amplitude of the modulation is definedby the factor in front of the cosinus. It contains two parts: the photometric
one(
2√
I1I2I1+I2
)and the coherence one
(ψ1ψ2
∗√|ψ1|2|ψ2|2
)where we recognizes Γ12 the
complex degree of mutual coherence of the two collected waves.As a conclusion of this section, we see that we have indeed a way to measure
complex degrees of mutual coherence of stellar waves allowing us to sample theFourier transform of brightness distributions at very high spatial frequencies. Wewill see in Section 4 how this method is now implemented in reality but beforecoming into the instrumental part of this technique an other point of view is alsovery important for a correct understanding of this observing technique.
3 Interferometry and images
Astronomers have developed optical interferometry in order to improve the resolv-ing power of the telescopes. Indeed image formation in a telescope is a standarddiffraction problem and it is known for a long time that an image is obtained asthe convolution of the brightness distribution of the source by the point spreadfunction of the optical device. When this convolution relation is translated intothe Fourier domain, it shows that the spatial frequency spectrum of an image is thespatial frequency spectrum of the object filtered by the optical transfer function
D. Mourard: Optical Interferometry with VEGA/CHARA 29
(OTF) of the optical device. Thanks to the diffraction principle, it could be easilyshown that the modulus of the optical transfer function, called the modulationtransfer function (MTF), is obtained as the autocorrelation of the pupil function,defining the entrance plane of the optical device.
In the case of a monolithic telescope of diameter D, the OTF acts as a low passfilter transmitting the spatial frequencies of the object brightness distribution upto D/λ. This corresponds to what is usually called the diffraction limit λ/D of thetelescope. We do not consider here the perturbations induced by the atmosphereand we just consider the ideal case of a perfect optical instrument.
In the case of an interferometer with two telescopes of diameter D and separatedby a vector
−→B , the support of the OTF (also called the (u,v) plane), is made of a
low frequency peak of extent ±D/λ and two high frequency peaks of extent ±D/λ
and located at ±−→B/λ. The interferometer acts thus as a high frequency band passfilter, allowing to reach information at a resolution of λ/|−→B |.
In the general case, the (u,v) plane (support of the OTF) is a function ofthe input baselines, of the latitude of the observatory, of the target coordinates,of the wavelength and of the time (because of the earth rotation). The (u,v)plane coverage defines the sampling of Fourier transform of the object brightnessdistribution.
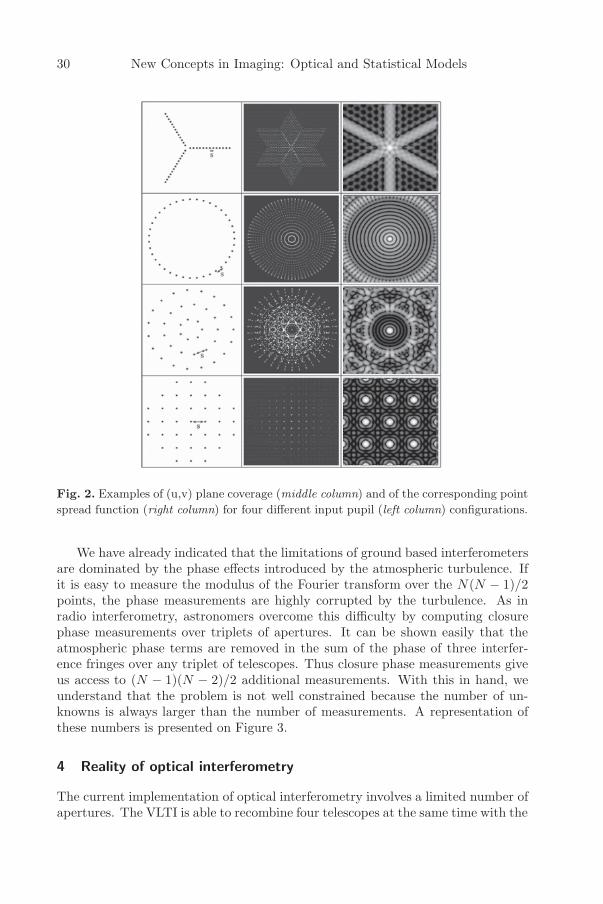
The properties of the image obtained directly at the focus of an interferometerclearly depend on the (u,v) plane coverage but it can also be shown (Labeyrie1996) that the beam combination scheme plays also an important role in thatdomain. I refer the reader to the important papers published in that domain (seeLabeyrie et al., these proceedings). As an illustration we present in Figure 2, someexamples of (u,v) plane coverage and point spread function for different kind ofoptical interferometers.
Currently, no interferometer is working in a direct imaging scheme exceptmaybe the Large Binocular Telescope. The limitations of coherence for groundbased projects in the optical domain are clearly difficult to overcome. Progressesare being made in that direction but for the moment, imaging at high angularresolution, is not working directly at the focus of the interferometer. Instead,astronomers are using the (u,v) plane coverage to sample the Fourier transformof the brightness distribution and then to reconstruct images. This method hasmade great progresses in the recent years as shown in Figure 1. The quality ofthe reconstructed images highly depends of the (u,v) plane coverage and of thea priori information (regularization constraints) introduced in the reconstructionalgorithm. I do not intend to describe this method in the present paper and I referthe reader to the chapters written in these proceedings by E. Thiebaut, D. Mary,C. Aime.
I will conclude this section by giving some general considerations about imagereconstruction with an interferometer. First of all, an interferometer made of Ntelescopes produces N(N−1)/2 baselines and thus samples N(N−1)/2 frequenciesin the Fourier transform of the brightness distribution of the object. We thus havea problem with N(N − 1) unknowns.
30 New Concepts in Imaging: Optical and Statistical Models
Fig. 2. Examples of (u,v) plane coverage (middle column) and of the corresponding point
spread function (right column) for four different input pupil (left column) configurations.
We have already indicated that the limitations of ground based interferometersare dominated by the phase effects introduced by the atmospheric turbulence. Ifit is easy to measure the modulus of the Fourier transform over the N(N − 1)/2points, the phase measurements are highly corrupted by the turbulence. As inradio interferometry, astronomers overcome this difficulty by computing closurephase measurements over triplets of apertures. It can be shown easily that theatmospheric phase terms are removed in the sum of the phase of three interfer-ence fringes over any triplet of telescopes. Thus closure phase measurements giveus access to (N − 1)(N − 2)/2 additional measurements. With this in hand, weunderstand that the problem is not well constrained because the number of un-knowns is always larger than the number of measurements. A representation ofthese numbers is presented on Figure 3.
4 Reality of optical interferometry
The current implementation of optical interferometry involves a limited number ofapertures. The VLTI is able to recombine four telescopes at the same time with the

D. Mourard: Optical Interferometry with VEGA/CHARA 31
Fig. 3. Number of unknowns, of modulus and closure phase measurements as a function
of the number of telescopes. The dark curve represents the percentage of information
measured as a function of the number of telescopes.
PIONIER instrument (Le Bouquin et al. 2011) whereas CHARA can recombine upto 6 telescopes simultaneously with the MIRC instrument (Monnier et al. 2008).While this clearly corresponds to a great advance, it appears that imaging withoptical interferometry is still very limited for the moment. Thus astronomers aremainly using the interferometric raw measurements (visibility, closure phase, com-plex differential visibility) to constrain the geometrical distribution of the emittingsources. An important effort has been devoted in the last years in the developmentof model fitting tools or of image reconstruction algorithms.
But before dealing with the calibrated products of the interferometer, manyactions have to been done for a correct operation of the interferometer. One ofthe main difficulty concerns the overall reliability of the array. Indeed, an array ismade of an important number of subsystems and the observing efficiency highlydepends on the reliability of each element. This concerns the telescope (pointing,tracking, tip/tilt corrections, adaptive optics efficiency), the beam transportationand the optical path length equalization (vacuum pipes, optical fibers, opticalquality, delay line, laser metrology, dumping of vibrations) and finally the beamcombination and the signal sampling (spatial or temporal modulation, detection).
But on the ground and at optical wavelengths, the main difficulties for opticalinterferometry are in the domain of the perturbations induced by the atmosphericturbulence. The signal to noise ratio of a coherence measurement as described

32 New Concepts in Imaging: Optical and Statistical Models
before depends of course on the coherence volume. This volume has in fact manydimensions. Spatial firstly and here the atmospheric turbulence highly reduces thisdimension to the so-called Fried parameter (r0). Depending on the atmosphericconditions, the value of r0 is in the range from 5 to 15–20 cm, well below thediameter of the individual collectors. Temporal secondly and the reduction ishere drastic with coherence time t0 between 2 and 15 ms typically. Finally thespectral dimension should also be considered because the atmospheric turbulencehas a spectral coherence characteristic that limit the useful spectral bandwidth toabout 20 to 30 nm at visible wavelengths (Berio et al. 1997). Important effortsare devoted to improve this volume of coherence through the implementation ofdilute adaptive optics systems: first adaptive optics to correct each aperture andthen cophasing systems allowing to control the phase between the different subapertures. With these conditions, long exposures will be possible and thus faintermagnitude and/or higher quality will be reached.
5 The CHARA array and the VEGA spectro-interferometer
The Center for High Angular resolution (CHARA) of the Georgia State Universityoperates an optical interferometric array located at the Mount Wilson Observatorythat consists of six one meter telescopes placed in pairs along the arms of aY-shaped array. It yields 15 baselines ranging from 34 to 331 m. Operating inthe near-infrared with the instruments CLASSIC (Ten Brummelaar et al. 2005),CLIMB (Sturmann et al. 2010), FLUOR (Coude du Foresto et al. 2003), andMIRC (Monnier et al. 2008), and in the visible with PAVO (Ireland et al. 2008)and VEGA (Mourard et al. 2009, 2011), the CHARA array allows a maximum an-gular resolution of 1.3 and 0.3 millisecond of arc in the K and V band, respectively.
The VEGA spectrograph is designed to sample the visible band from 0.45to 0.85 μm. It is equipped with two photon counting detectors looking at twodifferent spectral bands. The main characteristics are summarized in Table 1.The optical design allows simultaneous recording of data, in medium spectralresolution, of the spectral region around Hα with the red detector and aroundHβ with the blue detector. Observing in the blue requires good seeing conditionsbut increases by 30% the limit of spatial resolution of the instrument with respectto its operation around 700 nm.
Table 1. Spectral resolution (R) and bandwidth (Δλ) of the VEGA spectrograph, as
well as the spectral separation between the two detectors.
Grating R Δλ (Blue) Δλ (Red) λR − λB
R1: 1800gr/mm 30 000 5 nm 8 nm 25 nmR2: 300gr/mm 5000 30 nm 45 nm 170 nm
The limiting magnitudes of VEGA/CHARA are presented in Table 2. They ofcourse highly depend on the actual seeing conditions and on the intrinsic targetvisibility.

D. Mourard: Optical Interferometry with VEGA/CHARA 33
Table 2. Estimation of typical limiting magnitude as a function of the different spectral
resolution modes. These values are presented for the median value of the Fried parameter
r0 at Mount Wilson i.e. 8 cm. We also indicate the best performances assuming an r0
of 15 cm.
Resolution R Typical Lim. Magnitude Best perf.Medium 6000 6.5 7.5
High 30 000 4.2 5.5
VEGA is in routine operation at Mount Wilson and benefits from about60 nights per year. Many observations are now done remotely from NiceObservatory. Our group has recently improved the photon counting detectors.A new image intensifier has been installed with better quantum efficiency (ap-proximately a factor 1.5 better) in the red part of the spectrum and the Dalsasensor (Blazit et al. 2008) behind the two image intensifiers has been replaced bya Gazelle sensor from the Point Grey company. This new sensor allows a fasterframe rate (10 ms) and a much lower dead time during two frames (1 ms insteadof 2 ms). The duty cycle of the sensor is now of the order of 90% instead of 60%with the old camera. An improvement of 1.5 magnitude has thus been recentlydemonstrated as well as a much better detector cosmetics important for spectrummeasurements.
We are also considering a future evolution of VEGA in order to correctly benefitfrom the future installation of adaptive optics on the CHARA telescopes. Thehigh Strehl ratio that will be allowed thanks to these new devices will highlyincrease the signal to noise of our measurements. However it will also concentratethe flux in a small part of the detector and thus will lead to an increase of thesaturation effect with the current generation of photon counting detector. We arethus considering using analogical detector such as EMCCD or OCAM2 (Feautrieret al. 2011) that allows a very high frame rate (up to 1500 fps) and a very lowreadout noise (0.13e−/pix/frame). Coupling this kind of detector with a beamcombiner using spatial filtering and high efficiency optical devices (P. Berio, inpreparation) will permit to enhance the scientific domain of VEGA/CHARA inthe future.
6 Recent results from VEGA/CHARA
The most remarkable properties of VEGA/CHARA are first the access to un-precedented angular resolution thanks to the 300 meters baseline and the shortwavelengths and second the access to high angular resolution measurements atvery high spectral resolution (up to 30 000).
The medium (6000) and high (30 000) spectral resolutions are well suited toperform kinematic analysis of the interferometric signal, providing resolution of 60and 10 km s−1 respectively. These spectral resolutions are best dedicated to theextraction of differential spectral information. Radiative winds and fast rotating

34 New Concepts in Imaging: Optical and Statistical Models
photospheres of hot stars can be probed efficiently with the medium spectral reso-lution. Some recent examples of such studies could be found for the Be stars 48 Perand φ Per (Delaa et al. 2011) where the authors characterize the rotating disks interm of extension, ellipticity and kinematical field. In Meilland et al. (2011), theauthors use the combination of VEGA and VLTI/AMBER (Petrov et al. 2007)data to constrain both the orbital elements of the famous Be binary δ Sco andthe disk’s parameters. The interactive binaries β Lyrae and υ Sagitarri (Bonneauet al. 2011) have also been studied in the same way. Perraut et al. (2010) suc-ceeded also for the first time to spectrally and spatially resolve the Hα emittingregion of the prototype of the young stellar objects AB Aurigae. High spectral andangular resolutions bring also complementary views on old and famous problemssuch as the mysterious eclipsing system ε Aurigae (Mourard et al. 2012) or on thechromosphere of K giants (Berio et al. 2011).
The medium resolution is also well suited to absolute visibility studies andare also well adapted for the study of binaries or multiple systems. In that fieldthe main goal is the study of fundamental stellar parameters through angulardiameters measurements and analysis through classical stellar modeling and/orconfrontation with other observing techniques such as spectroscopy and astero-seismology. Recent results of such programs concern the study of the ro Ap star γEquulei (Perraut et al. 2011) or the famous CoRoT targets HD49933 (Bigot et al.2011) and more recently the study of four exoplanet hosts stars (Ligi et al. 2012).These exploratory programs are now coordinated as large programs where manytens of objects are being studied in order to have a good analysis of the stellarproperties in different part of the Herztsprung-Russel diagram.
Another interesting possibility is the presence of a polarimeter that could beinserted into the beam. This gives new insight into many physical processes. Manyscience sources are linearly polarized, in particular at a small angular scale, andthe interferometric polarized signal is a powerful probe of circumstellar scatteringenvironments that contain ionized gas or dust (Chesneau et al. 2003; Elias et al.2008; Ireland et al. 2005) and of magnetic properties (Rousselet-Perraut et al. 2000,2004). This possibility has not yet been really exploited on the VEGA/CHARAinterferometer but it could bring interesting new programs.
7 Conclusion
With this lecture and this paper, my intention has been first to describe theway optical interferometry should be understood from a physical point of viewand second to show the recent advances in that field in terms of astrophysicalprograms and in terms of observing possibilities. The dream of the groups workingin optical interferometry is clearly to push towards a large facility with remarkablecapabilities highly complementary to what will bring, in the future, the ExtremelyLarge Telescopes or the large radio arrays.
In complement to the science addressed by the large radio arrays and theExtremely Large telescopes, we consider that optical interferometry can bring im-portant answers, firstly on the possibility of fighting off the expected confusion

D. Mourard: Optical Interferometry with VEGA/CHARA 35
limit of ELT and secondly for the direct imaging with spatial, temporal and spec-tral resolution of compact sources such as the inner part of young stellar objectswhere planets are formed or the inner parsec around active galactic nuclei. In allcases, the quality of the synthetic point spread function will be fundamental bothfor the sensitivity and for the resolving power. The control of such imaging ma-chines for nulling or phase-controlled coronagraphy is also of utmost importancefor the detection and characterization of planets in the habitable zone. In thislatter case, the effort is more in the control of the dynamic in the image than inthe angular resolution. Debates around the future concepts have almost concludedaround three main classes of future optical arrays: 1) a VLTI-like interferometerwith a very small number of ELT-like telescopes on a compact array, 2) kilomet-ric baselines with a small number of 8-m class telescopes and 3) a dense arrayof a large number of small telescopes over possibly kilometric baselines. If theconceptual design of the two first classes of array could certainly rest on the cur-rent concepts of classical telescopes + delay lines, it is clear that expanding thenumber of apertures to 50, 100 or even more individual apertures encounters areal limitation for the implementation. This represents a major difference to thesituation of radio interferometry and many conceptual and prototyping efforts arenow engaged in that direction.
References
Berio, P., Mourard, D., Vakili, F., et al., 1997, JOSA-A, 14
Berio, P., Merle, T., Thevenin, F., et al., 2011, A&A, 535
Bigot, L., Mourard, D., Berio, P., et al., 2011, A&A, 534
Blazit, A., Rondeau, X., Thiebaut, E., et al., 2008, Appl. Opt., 47
Bonneau, D., Chesneau, O., Mourard, D., et al., 2011, A&A, 532
Chesneau, O., Wolf, S., & Domiciano de Souza, A., 2003, A&A, 410
Colavita, M., Serabyn, G., Wizinowich, P., & Akeson, R., 2006, Proc. SPIE, 6268
Coude du Foresto, V., Borde, P., Merand, A., et al., 2003, SPIE Conf. Proc., 4838
Delaa, O., Stee, P., Meilland, A., et al., 2011, A&A, 529
Elias, N., Schmitt, H., Jorgensen, A., et al., 2008 [arXiv:0811.3139]
Feautrier, P., Gach, J.L., Balard, P., et al., 2011, PASP, 123
Glindemann, A., et al., 2004, Spie Proc., 5491
Goodman, J.W., 2000, “Statistical Optics” (Wiley)
Haubois, et al., 2008, A&A
Ireland, M., Tuthill, P., Davis, J., & Tango, W., 2005, MNRAS, 361
Ireland, M., ten Brummelaar, T., Tuthill, P.G., et al., 2008, SPIE Conf. Proc., 7013
Labeyrie, A., 1975, ApJ, 196
Labeyrie, A., 1996, A&AS, 118
Lacour, et al., 2008, A&A
Le Bouquin, J.B., Berger, J.P., Lazareff, B., et al., 2011, A&A, 535
Ligi, R., Mourard, D., Lagrange, A.M., et al., 2012, A&A, 545
36 New Concepts in Imaging: Optical and Statistical Models
Meilland, A., Delaa, O., Stee, P., et al., 2011, A&A, 532
Monnier, et al., 2007, Science
Monnier, J., Zhao, M., Pedretti, E., et al., 2008, SPIE Conf. Proc., 7013
Mourard, D., Clausse, J.M., Marcotto, A., et al., 2009, A&A, 508
Mourard, D., Berio, P., Perraut, K., et al., 2011, A&A, 531
Mourard, D., Harmanec, P., Stencel, R., et al., 2012, A&A, 544
Perraut, K, Benisty, M., Mourard, D., et al., 2010, A&A, 516
Perraut, K., Brandao, I., Mourard, D., et al., 2011, A&A, 526
Petrov, R., Malbet, F., Weigelt, G., et al., 2007, A&A, 464
Rousselet-Perraut, K., Chesneau, O., Berio, P., & Vakili, F., 2000, A&A, 354
Rousselet-Perraut, K., Stehle, C., Lanz, T., et al., 2004, A&A, 422
Sturmann, J., ten Brummelaar, T., Sturmann, L., & Mc Alister, H.A., 2010, SPIE Conf.Proc., 7734
ten Brummelaar, T., McAlister, H.A., Ridgway, S., et al., 2005, ApJ, 628