operations for jit interview preparation
TRANSCRIPT

Abhishek Singh
IIM Kashipur

What do Companies look for?
Resourcefulness: Ability to apply theoretical
knowledge
Command over subject
Knowledge of buzzing concepts. Eg: RFID
Knowledge of the concerned industry
Problem solving attitude

A framework of problem solving
Identify the problem
Specify the criteria based on which the
solutions will be evaluated
Find out the possible solutions
Choose the best one based on the criteria (If
multiple criteria are involved use linear
programming)
Implement the solution
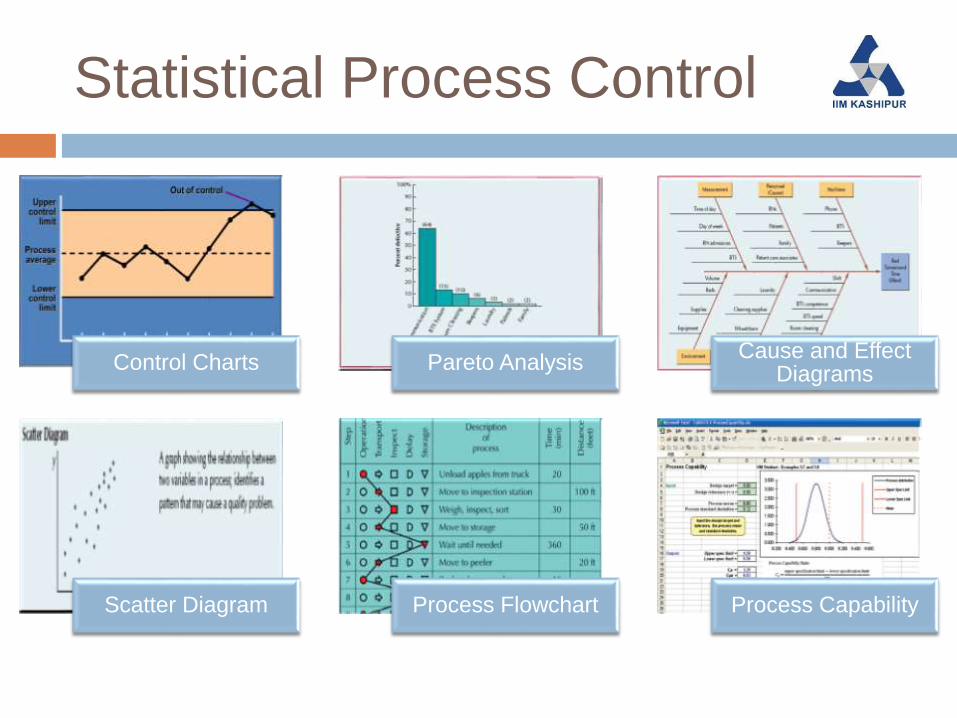
Statistical Process Control
Control Charts Pareto AnalysisCause and Effect
Diagrams
Scatter Diagram Process Flowchart Process Capability

Quality Function
Deployment(QFD)

House of Quality

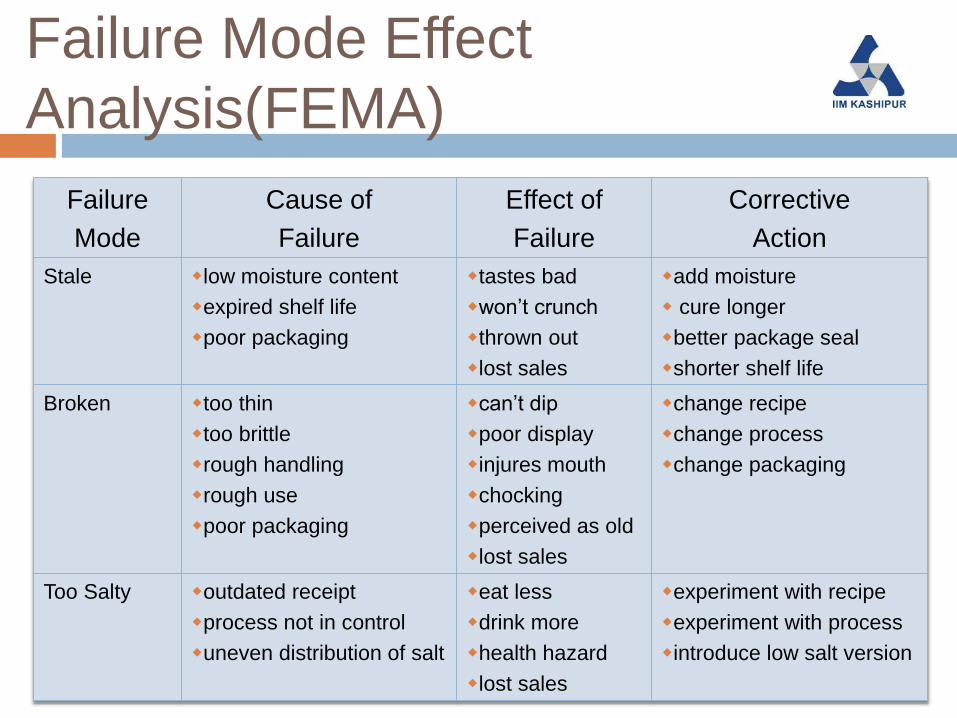
Failure Mode Effect
Analysis(FEMA)
Failure
Mode
Cause of
Failure
Effect of
Failure
Corrective
Action
Stale low moisture content
expired shelf life
poor packaging
tastes bad
won’t crunch
thrown out
lost sales
add moisture
cure longer
better package seal
shorter shelf life
Broken too thin
too brittle
rough handling
rough use
poor packaging
can’t dip
poor display
injures mouth
chocking
perceived as old
lost sales
change recipe
change process
change packaging
Too Salty outdated receipt
process not in control
uneven distribution of salt
eat less
drink more
health hazard
lost sales
experiment with recipe
experiment with process
introduce low salt version

Project Management
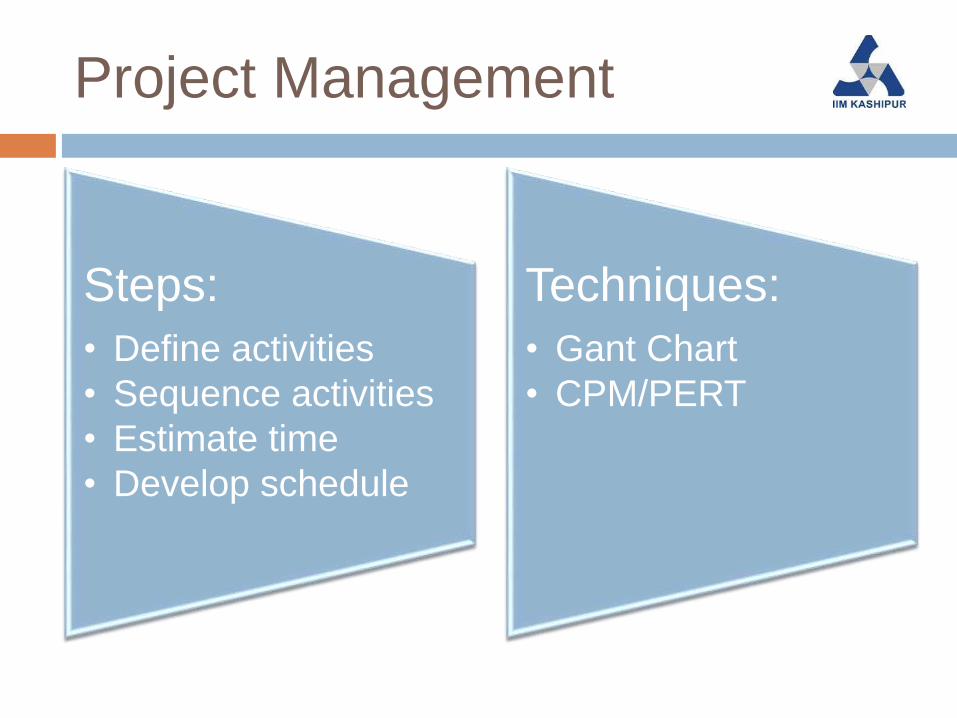
Project Management
Steps:
• Define activities
• Sequence activities
• Estimate time
• Develop schedule
Techniques:
• Gant Chart
• CPM/PERT

Project Management
Gant Chart CPM/PERT

Service Blueprinting

Facility Layout

Process Layout

Product Layout

Fixed Position Layout

Forecasting
Time Series
Moving Average
Naïve Forecast
Simple moving average
Weighted moving average
Exponential Smoothing
Regression

Supply Chain
Procurement &
Outsourcing Strategies
Aggregate Planning
Supply Contracts

Kaizen

Inventory Management
Elements of Inventory
Management
Inventory Control
Systems
Continuous system (fixed
order-quantity)
Periodic system (fixed-
timeperiod)
Economic Order
Quantity(EOQ) Models
Re-order Point
Order Quantity for Periodic Inventory System
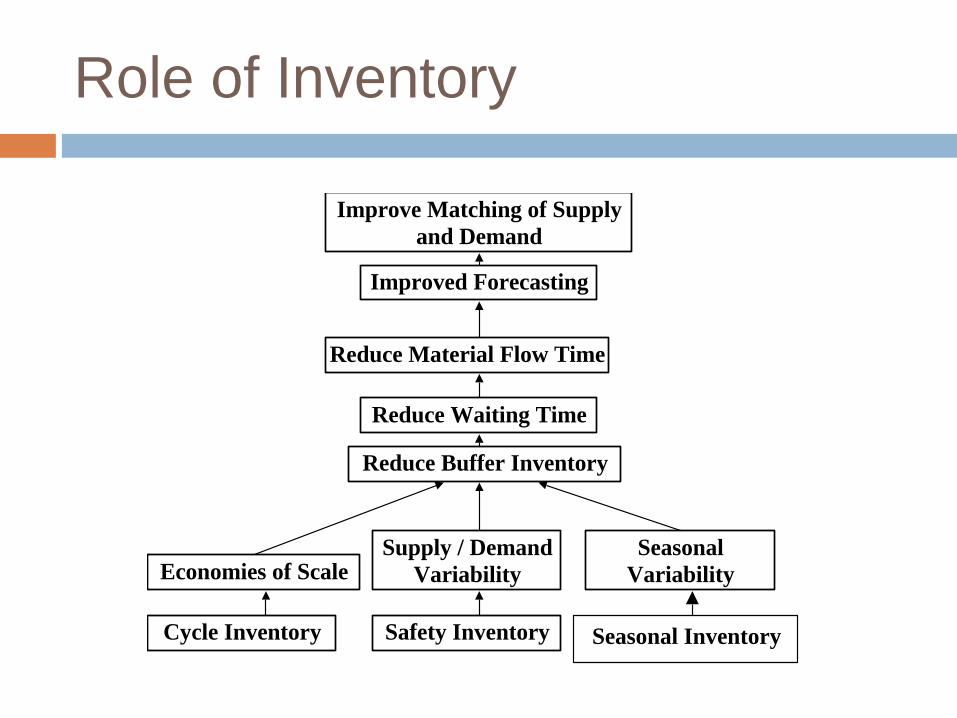
Role of Inventory
Improve Matching of Supply
and Demand
Improved Forecasting
Reduce Material Flow Time
Reduce Waiting Time
Reduce Buffer Inventory
Economies of ScaleSupply / Demand
Variability
Seasonal
Variability
Cycle Inventory Safety Inventory
Figure Error! No text of
Seasonal Inventory

Inventory Management
Types of Inventory
Inventory Control System
Continuous system (fixed order-quantity)
Periodic system (fixed-time period)
EOQ
Reorder Point
Safety Stock
Two bin system
Lot Size
Kanban

Sales and Operations Planning
Process
Copyright 2011 John Wiley & Sons, Inc.

Data Envelopment Analysis
(DEA)

Value Stream Mapping (VSM)

Customer Satisfaction Strategies
Actual Performance
Providing satisfiers
(performance needs) can keep
you in a market
Providing delighters (unknown exciting
characteristics) can get you market leadership.
Cu
sto
me
r S
ati
sfa
cti
on
Very Satisfied
Very Unsatisfied
Perf
orm
s V
ery
Po
orl
y
You are “OK if
you don’t
provide them.
Perf
orm
s V
ery
Well
redial button on telephone receiver; spare change holders/
soft drink holders in automobiles; one-touch recording
button on some VCRs;
Customer Satisfaction
Strategies – Kano Model

Supply Chain: Manufacturing Example
Cereal
Manufacturer
Flour
Processor
Polyethylene
Bag
Manufacturer
Chemical
Processor
Farmer
Oil
Company
ForestLumber
Provider
Corrugated
Manufacturer
Grocery
Distributor
Retail
GrocerConsumer
1st Tier
Supplier
2nd Tier
Supplier2nd Tier
Customer
1st Tier
Customer
3rd Tier
Supplier3rd Tier
Customer
(Material) Products and Services
Finance
Information
Demand
Supply
Upstream
Internal
Downstream
Focal Company
A Sample Supply Chain

BENCHMARKING SUPPLYCHAIN USING
FINANCIAL DATA
Total Length of the Chain Days of Raw Material (DRM)+ Days in
Work In Process + Days in Finished
Goods
Supply Chain Inefficiency
Ratio:
Supply Chain Management Cost (SCC) /
Net Sales (NS)
SCC = DC + INV * ICC
Supply Chain Working
Capital Productivity:
Net Sales (NS) / Supply chain Working
Capital (SWC)
SWC = INV +AR–AP
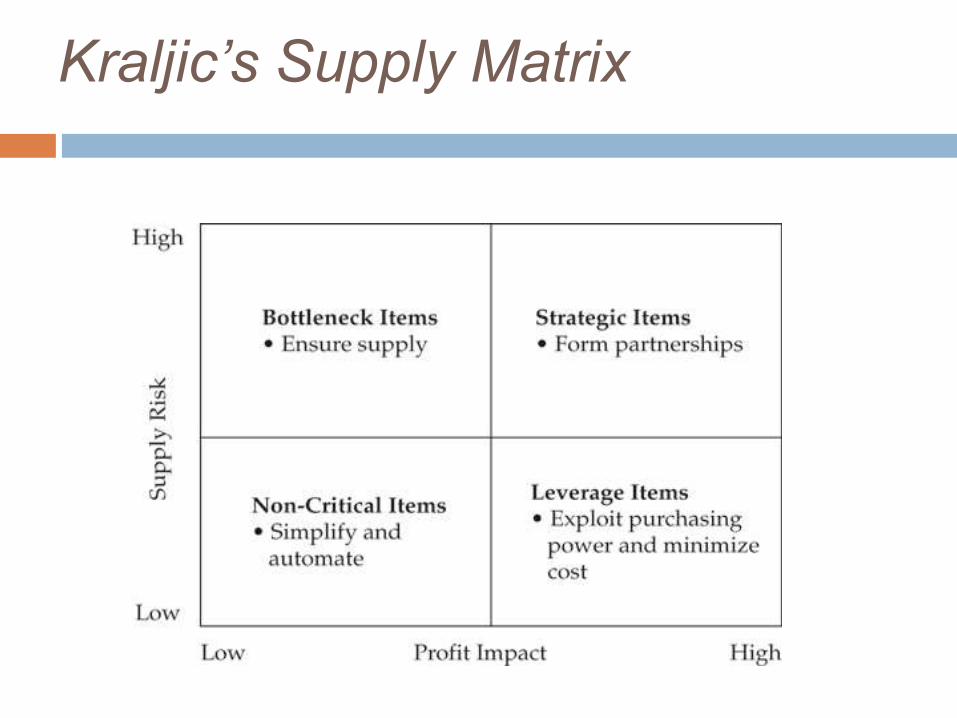
Kraljic’s Supply Matrix
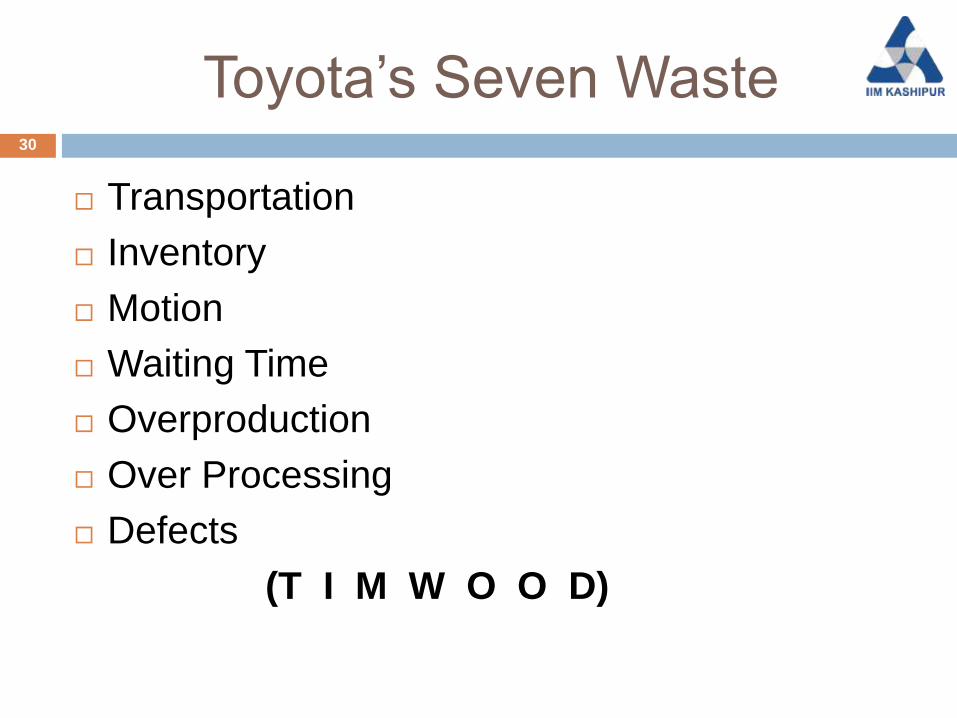
Toyota’s Seven Waste30
Transportation
Inventory
Motion
Waiting Time
Overproduction
Over Processing
Defects
(T I M W O O D)

TYPES OF ACTIVITIES
Value-added Anything that directly adds value to the product
or services as seen or experienced by the customer
Non-value added Waste (should be eliminated)
Necessary non-value added Non-value added, but necessary and hard to
eliminate (e.g., planning, scheduling, purchasing, quality control, etc.)
31

Necessary, nonvalue-added
activities
Planning
Scheduling
Purchasing
Quality Inspection
Process/equipment changeover
Equipment preventive maintenance/repair
Others?
Can these be eliminated?
32
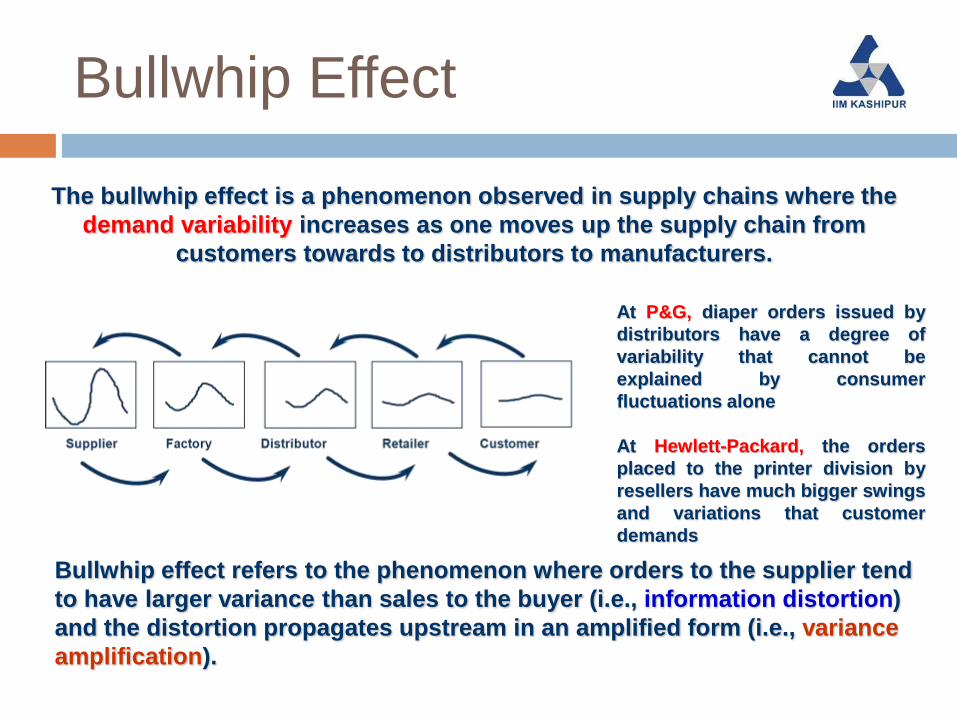
Bullwhip Effect
The bullwhip effect is a phenomenon observed in supply chains where the
demand variability increases as one moves up the supply chain from
customers towards to distributors to manufacturers.
At P&G, diaper orders issued by
distributors have a degree of
variability that cannot be
explained by consumer
fluctuations alone
At Hewlett-Packard, the orders
placed to the printer division by
resellers have much bigger swings
and variations that customer
demands
Bullwhip effect refers to the phenomenon where orders to the supplier tend
to have larger variance than sales to the buyer (i.e., information distortion)
and the distortion propagates upstream in an amplified form (i.e., variance
amplification).

Reasons for Bullwhip

Measuring Supply Chain
Performance
Assets committed to inventory
Inventory turnover
Average aggregate value of inventory

Performance Measurement
Systems
Balanced Scorecard (Kaplan/Norton,1992)
The Performance Prism (Neely et al., 2002)
Skandia’s Navigator Edvinsson / Marlone, 1997)

Sourcing Strategies

Regression
The technique is used to find the equation that
represents the relationship between the
dependent and independent variables and
what proportion due to independent variables.
Can be used to find out the cause of some
problems when the underlying relationship
among different variables is not known

Useful Websites
madehow.comhow products are made
repository of how things are made in short
Referenceforbusiness.comEncyclopedia of company history
For fundas of management
http://www.ibef.org/industryFor snapshot of an industry including the key
figures
A readymade ppt of the industry

Food for Thought…
Some amount of dexterity in marketing and HR is also required
Hence a visiting company will expect a complete solution from your side not just in operations.
Show them that you have a command over theory
Show them that you can work with unstructured problems
Concepts is your home turf. You cannot not compromise on that
You are also expected to know the industry in and out. Knowledge of recent issues is a must.
Know key terms in an industry. For eg API in a pharmaceutical industry
