operations and safety considerations in high-speed
TRANSCRIPT

TRANSPORTATION RESEARCH RECORD 1489 37
Operations and Safety Considerations in High-Speed Passenger/Freight Train Corridors
KENNETH B. ULLMAN AND ALAN J. BING
A research project that recommends operations- and safety-related improvements to mixed traffic (freight and passenger) rail lines when passenger train speeds are increased to above 130 km/hr (80 mph) is described. Three cases representing different physical plant configurations are simulated, and train delays are compared. The means of achieving the required levels of safety are presented.
Interest in the incremental improvement of existing railroad lines has been high since the passage in 1991 of the Intermodal Surface Transportation Efficiency Act (ISTEA) ( 1) Section 1010 of IS TEA created a program whereby states could apply to the Secretary of Transportation for designation of high-speed corridors. In 1992 the U.S. Department of Transportation selected five corridors that were eligible for this funding. Table 1 summarizes pertinent physical and operations details of the Section 1010 corridors, as well as those of the Empire Corridor and the Northeast Corridor (NEC).
This paper summarizes a research project (2) on the operations arid safety implications of increasing passenger train speeds on existing freight railroad lines having the characteristics of the Section 1010 corridors.
OPERATIONS CONSIDERATIONS
Braking
Safe train operation is based. on the concept of adequate train separation, and this in turn requires positive control of train velocity, which is the function of the braking system. Braking rates may be increased through higher braking forces, but they are limited by considerations of passenger comfort and wheel-rail adhesion. Furthermore, the energy dissipation capacity of the braking components must be matched to the intended application. As speeds are increased, for a given braking rate, the distance required tQ stop and the energy dissipated rise as the square of the velocity.
The historical railway braking system has been the pneumatic or air brake system, consisting of friction braking between wheel treads and brake shoes, with braking effort supplied pneumatically. As passenger train speeds increase both the necessity of increasing the number of elements dissipating braking energy and the desire to remove large thermal energy loadings from the wheels have led to disk friction brakes, alone or in combination with tread brakes.
Control of the braking system is ordinarily effected manually by the engineman, but automatic (penalty) applications of the brakes
K. B. Ullman, Parsons Brinckerhoff Quade & Douglas, Inc., 700 11th Street, NW, Suite 710, Washington, D.C. 20001. A. J. Bing, Arthur D. Little, Inc., Acorn Park, Cambridge, Mass. 02139.
may also be initiated if a train stop or train control safety device is installed.
Safe Braking Distances
A train can stop in the minimum distance when a number· of favorable conditions are met: the train operator uses the highest braking rate, the emergency braking rate; the wheel-rail adhesion is high, implying clean, dry rails; and res~rictions on passenger comfort are disregarded. In practice, these conditions are seldom all present, and it would be highly inappropriate to design a railway signal system around such best-case stop distances. The term saff! braking distance refers to an idealized distance. derived from conservatiye assumptions concerning the variables mentioned earlier. Safe braking distances generally include allowances for the following,-conditions:
• Rather than the emergency rate; full-service braking is generally used because this is the rate provided in a penalty application from train stop or train control systems.
• The train is assumed to be fully loaded (passengers _plus bag-gage in the case ()fa passenger train). _ ·
e A certain percentage of the train's brake units are presumed to be inoperative; a derating of 20 to 25 percent is typically used.
• Allowances are made for the reaction times of the automatic safety systems, the braking system, and the en.gineman in applying the brakes.
As a result of these allowances the safe braking distance for a train may be significantly greater than the best-case stop distance, thereby providing a significant ~argin of safety. Saf~ braking distance at higher speeds becomes substantial, and this affects rail line capacity. For example, the safe braking distance for Amtrak AEM-7 and Amfteet NEC equipment at 200 km/hr (125 mph), assuming a 25 percent derating and an 8-sec total reaction time, is 3447 m (11,300 ft).
Figure 1 shows safe braking distances for a variety of passenger and freight equipment used on typical U.S. mixed traffic corridors. Note that the safe braking distances for freight trains are. compatible with the safe braking distances for passenger trains for the slower speeds at which the freight trains run.
Types of Block Signal Systems
Although timetable/train order operation is still common on U.S. and foreign railroads, mq~t passenger lines are equipped with auto-

TABLE 1 Corridor Data
Number of
Route End Points Tracks
Virginia
N. Carolina
.. ,,.... ... ..,_~---
Florida
WashingtonRichmond
Raleigh-Charlotte
y_. __ .,...,_,,,,.,.,.,,_,...,.,_,...,..
Miami-W. Palm Beach
Califomia San DiegoBay Area/ Sacramento
Oregon/ Eugene-Washington Vancouver,
BC
Illinois ChicagoSl Louis
Wisconsin Chicago-
Michigan
Empire
.,........,_,,,...,,....,.,,,,.,,'W.W-W•V..,,,..,,,.
NEC
Milwaukee
Chicago-Detroit
New York-Hoffmans
"\.-.w,<wM-•A.;,.,.,,,.,,,..........,_RYfMW,.,,...H'"'
Washington/ New York
2
_._._,,.,,.....,_....,_,w_. ... w_...,.,..,,....,
1-2
1-2
2-3
1-2
2-4
2-4
Max Pagr. Proposed
Route Maximum Commuter Train Pagr. Train ·Daytime Length, Pagr. Service Speed, Speed, Freight Miles Trne/day (trains/day) mph mph Traina
108 18
173 4
y,w,.,,,,..,.,..,. .. ,.,.,~,~·- .................... .,,.,., ... .,,.,.,,.,....,...,......,., ... , ......
71 8
487 0-16
464 2-8
282 4-8
86 16
280 8-16
170 1S
....... ,.,. ... ,.,.,,,..,,,,..Y,...,,.,...,,.,,.,.,,,,,
22S 102
yes (8/day)
no
yes (24/day)
yes
no
yes
yes
no
yes (up to 140/day)
•vww .. .,,,,..,,,,..,,.,w·,.,..,,,--.•,.,......,.,.,..,_,...,,.,,,
yes (up to 240/day)
70 90-95 12
59-79 90 2-10
, .... , .. ,.,.w,..,...,_.,,,...,,.,,,._,,.,,.,
79 90 0
60-90 100 2-12
40-79 90 8-1S
79 90 0-1
70-79 90 7-8
79 100 0-20
70-110 125 0
•v.·;v.-. .-,,,.,,,...,,,w,,.,,Aww•e.w
125 150 0-4
Freight Train Speed, mph
40-60
50
60
40-65
40-60
60
50-60
60
50
300 SON
Siding Length, miles
NA
1-10
Siding Total Grade Spacing, Grade Crossings/ Typical miles Crossings Route Mile Curvature
NA 64 .59
10-19 260 1.5
[35% double track) 73 1.03
.9-1.6 5-9 428 .88
1-5 1.5-13 404 .87
2 12-23 327 1.15
NA NA 111 1.31
2-5 1S-20 388 1.39
NA NA 37 .22
NA NA 0 0 0.5° __ .,_,,·--·•- •--·----··---"~"- v-N.W""-"--w·w--.w- ~·--·--- ""--"·w,,_.,, __ , __ ,,,__'""'"'""""'"""'""'-'-·'" ""'"~'''""'·'-"''""" '"'""'"""""'-"'"·M~---·~"'""[-••·''"""·""·'"'""''"'"-:'"-""·""" ___ '""'"""""'"""""l""'"''""""'"·'""'"•''°"'""""""'l""""""""""·""···•·"""""'""-':·"""'"'""""'"''""'"""'""'""'"""";·-"""""'·'"""""""'""""""""·"""'""''""l""''"""''""•·"'""""'"""··""""""""""""'I
NEC New YorkBoston
2-4 231 30
yes (up to 200/day) 110 150 0-2 300 SON NA NA 17 .07

Ullman and Bing 39
150
140
130
---·----- . -I v ..-T
/ ·- ·---- ~--·--·- i------ : I / i \ ./ r l /~ I
0 I I NJT Jersey Arrow, Amtrak F40PH I·- I
/ and AEM·7 I
120 ! / :~ .A Conrail Trallvan
110
100
lv • Conrail Standard Freight
~ 'Y Conrail Heavy Freight V"'
90
.c: c. 80 E -0 <l> 70 Cl> c. (/')
60
50
40
30
20
10
0
# • ICE/DB Friction Braking
J ~
! I
i
/ I I
~ I -
=-r L I i -- -I ~-- ------
... .. _~ -----------_,--- --- -
~ -------1 . ~ ~ /'--~ - T
!~ ~ ---
I ~ ~1 .~ ~ i ·-- - .... -------
I l --
i ~ ~ T
I ~ ! ~
~ I I - --
i I I
0 2 3 4 5 6 7 8 9 10 11 12 13 14 15 Distance, feet (x1000)
FIGURE 1 Safe braking distance, passenger trains versus fre~ght trains.
matic block signals (ABSs). In the ABS system much shorter blocks are established, with fixed signals installed at each block location. The ABS system automatically detects the presence of a train (an occupied block) through the use of a track circuit and protects the train against following movements by causing the signals at entry to any occupied block to be at "stop." Furthermore, the ABS system provides advance warning of the stop signal ahead by displaying one or more restrictive signals. between the clear and stop signals.
The simplest form of an ABS is the three-aspect system, with one caution aspect between the clear and stop aspects: In this simple layout a train must be able to stop from its timetable-designated maximum authorized speed (MAS) within a single block. This means that these blocks must be no less than the safe braking distance in length. More elaborate ABS systems provide multiple aspects, allowing the safe braking distance to be divided into multiple, shorter segments of increasingly reduced operating speeds. As the number of aspects increases the block length decreases (other things being equal), and the system has the ability to operate trains spaced more closely together, thereby increasing effective capacity.
Reverse Traffic
If a track is signaled for movements in only one direction, that direction is the established current of traffic. A common arrangement is double tracks with one track signaled in each direction.
If atrack is signaled so that reverse movements can also be made on signal indications, the track is said to have reverse traffic capability, and the operation is defined under traffic control system (TCS) rules rather than ABS and interlocking rules. A traffic control system in which all interlockings and other manually controlled points are remotely controlled from one central location is referred to as centralized traffic control (CTC).
Figure 2(a) shows the types of signal systems in use on U.S. railroads as of January 1993 (3).
Moving Block Concept
The systems described earlier make use of fixed block limits and signal locations. The signal equipment is located entirely along the

40
ACS/ATS 1%
FIGURE 2 Method of operation of (a) and types of train control systems on (b) U.S. railroads, January 1993.
wayside and not on-board the train. The moving block concept does not have fixed block locations but instead requires interactive communication between on-board and wayside equipment to function.
The moving blocksystem has the principal advantage of improving the headway attainable over that provided by a fixed block signal system. The headway distance or separation between trains in a fixed block system can be shown to be equal to the sum of safe braking distance, the length of one additional block, and train length (2). A moving block system will allow a headway distance equal to the safe braking distance and train length alone.
Moving block systems are not commonly used in U.S. railroad applications at present, although their use could be beneficial in high-traffic-density locations.
Regulatory Requirements
The following provision of FRA signal regulations is pertinent to incremental improvement programs for U.S, passenger trains: Where passenger trains are to operate at 60 mph or greater, a block
TRANSPORTATION RESEARCH RECORD 1489
signal system (or a qualifying manual block system) must be in effect providing absolute block protection. This requirement is met on most U.S. railroad main line miles and will seldom be a concern for an incremental corridor project.
Train Control Systems
Origin
In 1906 the U.S. Congress directed the Interstate Commerce Commission (ICC) to investigate and report on the use of and necessity for block signal systems and appliances for the automatic control of trains in the United States. Between 1909 and 1920 a great number of train-train collisions occurred, resulting in
• 16,565 head-on and rear-end collisions, • 3,089 deaths, • 43,964 injuries, and • $26 million in property damage.
Since the passage of the Signal Inspection Act in 1920, FRA (formerly ICC) has the authority to require any carrier subject to the Interstate Commerce Act to install train control devices subject to its regulations and specifications. FRA regulations now address three types of train control devices, each defined and broadly specified in the regulations:_ automatic cab signals (ACS) automatic train stop. (A TS), and automatic train control (A TC). Present FRA regulations ( 4) require the installation of at least one of these systems on any territory wht:re any train is to operate at 130 km/hr (80 mph) or more.
Warning Versus Enforcement
A key differentiator between different train control systems is the overall philosophy behind the system: some act as warning systems to alert the train engineer to a change in route conditions, whereas others enforce a lower train speed when a restrictive change occurs. The first type of system provides an increased level of information to the engineer but leaves the engineer in complete control. The second type of system provides this increased level of information and permits the engineer to remain in control but takes over control should the engineer fail to do so.
Intermittent Versus Continuous Systems
Train control systems may be either intermittent or continuous in nature, depending on how information is transmitted from wayside to train. Intermittent systems provide information on block conditions only when the train enters the block. Continuous systems receive information at all times and can therefore provide information to the engineer about changing block conditions after entering a block.
Three Types of Train Control Systems
ACS, A TS, and A TC are systems are discussed fully elsewhere (2). The following provides highlights of these systems:

Ullman and Bing
• ACS Systems: ACS systems generally have from two to four aspects. If the train enters a restricted block the cab indicator displays a restrictive indication and a whistle sounds. The engineer must depress an acknowledging lever or other device to silence the whistle, confirming his awareness of the condition. Note that the ACS system is open loop and does not interact with the train braking system. ·
• A TS Systems: ATS systems operate with the same wayside-totrain signals .(intermittent or continuous) as the ACS system, but A TS systems also have an interface with the train braking system. Entering a restricted block, a whistle sounds as for the ACS system and the engineer must again depress an acknowledging lever both to silence the audible indicator and to prevent an automatic application of the brakes. If the train receives a restrictive indication from the A TS system and the engineer does not take any action, a full-service brake application will occur after a delay not exceeding 8 sec.
• ATC (Speed Control) Systems: Full ATC systems are enforcement systems in that train speed is reduced directly by the system unless the train' s speed is similarly reduced under the control of the engineman. These systems operate with continuous coded track circuits and also include an on-board speed generator. Train speed is continuously compared with the speed permitted by the relevant signal indication. Even operating under a·. nonrestrictive signal indication, the MAS for the train is enforced; that is, an overspeed condition will result in an audible indication and an automatic service brake application until the train speed is reduced to MAS (as determined by the setting of the on-board governor).
A TC speed enforcement ·applies to both passenger and freight vehicles equipped with A TC systems, and some freight lines operate in this manner. Other freight carriers have petitioned for relief of the automatic full-service penalty applications from the A TC system, citing problems in train handling, particularly in undulating terrain. In response to these petitions FRA has permitted the removal of ATC systems from freight locomotives in some instances.
Present Application of Train Control Systems in the United States
Figure 2(b) summarizes the present application of train control systems in the United States as of January 1993 (3). A total of 15 750 track-km (9,843 track-mi), or 6.0 percent of the total U.S. rail network, is equipped with one or more train control systems.
ATC Systems
A number of systems of train control are being developed worldwide. These systems are based on advanced digital communications technology, but they are still in experimental stages and have not been approved for use as basic signal/train control systems in U.S. passenger corridors (2).
U.S. Incremental Corridor Track and Signal Configurations
Development of Hypothetical Corridors
The project described here analyzed hypothetical corridors representing the Section 1010 corridors in the aggregate. From an exam-
41
ination of the corridors three typical cases seemed particularly appropriate for further analysis.
Case A: Single Track and Passing Sidings Many of the Section 1010 corridors have this structure, at least i.n part. Typical values evaluated were sidings of 2.4 km (1.5 mi) in length spaced every 32 km (20 mi), with operation under CTC rules. Hourly passenger trains [at a MAS of 145 km/hr (90 mph)] were projected to operate in each direction across the territory, in competition with light to moderate freight traffic of three daylight freight trains in each direction during the 14-hr daylight period. The freight trains were assumed to have MAS of 80 km/hr (50 mph).
Case B: Double-Track ABS System This fairly common arrangement consists of a full double track, with each track signaled for movements with the current of traffic. Interlockings are present every 24 km (15 mi), and these are configured so that trains may meet and pass at these points. Between interlockings, however, trains normally follow one another on the designated track. Passenger traffic was as for Case A, except at a MAS. of 175 km/hr (110 mph); base freight traffic was as for Case A.
Case C: Double-Track CTC This arrangement is not uncommon in highly used corridors, particularly if passenger service has always been a strong factor. Under the CTC scenario there is no current of traffic. Interlockings (simple universal crossovers) were assumed to be spaced every 16 km (10 mi); trains may pass on the links between interlockings. Passenger service is as outlined for Case A; however, MASs of 145, 175, 200, and 240 km/hr (90, 110, 125, and 150 mph) were considered. Base freight service was as for Case A.
Efficient Corridor Use
Corridor efficiency refers to the ability of a rail line to handle traffic smoothly, without undue delay. Efficiency depends on the way in which the rail line is constructed (infrastructure), the way in which it is used (operations), and the traffic requirements placed on it (demand). Dispatching controls railway operations; the present study assumed that it is done efficiently and equitably.
Headway and Capacity
Headway refers to the minimum interval, either in time or in distance, between trains traveling in the same direction on a track. Safe braking distance assumes the worst-case location of trains in blocks, that is, closest together. Headway calculations must assume the opposite. This has the effect of adding an additional block length and the train length into the headway distance.
By using braking rates from the NEC example cited earlier, the addition of an additional block length, train length, and sight distance to the 3447-m (11,300-ft) safe braking distance results in a headway distance of approximately 5490 m (18,000 ft). At 200 km/hr (125 mph) this means that 36 trains could pass a given point in a · 1-hr period; equivalently, a single track with unidirectional traffic has a theoretical capacity of 36 trains/hr and a theoretical

42
minimum headway of 99 sec with a perfectly uniform and optimized block layout. The use of more typical actual NEC block distances (which accommodate freight operations as well) reduces this to a theoretical capacity of 28 trains/hr and 125-sec headways, but this still represents an idealized railroad.
Headway and capacity are reduced from the idealized theoretical values by uneven block spacing and grade effects, trains of different maximum speeds and lengths, civil speed restrictions (those not traffic or route dependent) present on the route, differences in train handling between enginemen, trains operating off schedule, and other random events. Capacity in the vicinity of even 20 trains/hr nevertheless provides for movement of a very large amount of traffic.
The presence of different train speeds greatly affects the practical capacity of the line. In the example cited earlier, inserting a short express freight train operating at 95 km/hr (60 mph) into the traffic stream would reduce the throughput of the system from 28 trains/hr to 13 trains/hr, on a theoretical basis. If the freight train was 1525 m (5,000 ft) long rather than short, the capacity would drop to 11 trains/hr. The solution to these problems lies in scheduling slower freight trains out of passenger train hours or away from passenger trains where possible and in adding infrastructure to permit faster trains to overtake and pass slower trains.
Stringline Model
To demonstrate the impacts of freight train-passenger train interaction and to provide a tool for use during corridor development, a simplified, personal computer-based, manually dispatched rail operations model was developed and tested on the three hypothetical corridofs. The simplified model is a link-and-node representation of a raliway over which trains operate at assumed average speeds. The model output consists of stringline (time-distance) charts and delay statistics.
In the present study the average speed of the passenger train was taken as 80 percent of the stated MAS and the average speed of the freight train was taken as 70 percent of a 50-mph MAS, or 35 mph. The relatively low average speed chosen for freight trains is a conservative assumption.
Passenger trains were assumed to operate hourly in each direction across the approximately 500-km (310-mi) corridors. This level was chosen to illustrate peak service conditions on a typical corridor, but it may be insufficient if demand is heavy.
Three daylight freight trains scheduled in an irregular quasirandom manner were assumed to operate in each direction on the corridor. All freight trains were assumed to be no longer than 1.5 mi.
Operating without interference, the freight trains would require 8 hr 49 min (8:49) to complete their run, and the passenger trains would require the following times: at a 90-mph MAS, 4:22; at a 110-mph MAS, 3:35; at a 125-mph MAS, 3:10; and at a 150-mph MAS, 2:39.
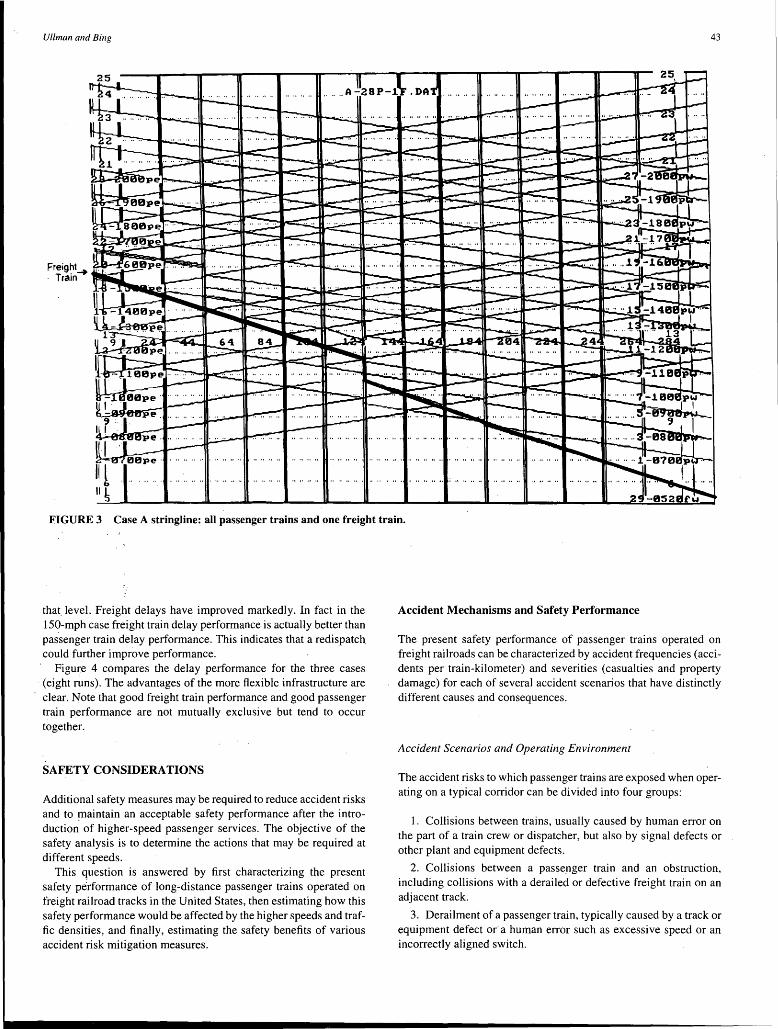
Train Interference-Case A: Single Track and Passing Sidings When all passenger trains (but no freights trains) are used in the simulation the resulting average passenger train delay was 21 min/train and ranged from 3 to 44 min. Such a large delay range is hard to handle. A schedule pad can be inserted to account for a relatively narrow band of delays, but a range this· wide indicates erratic performance at best. Under Case A conditions passenger train traf-
TRANSPORTATION RESEARCH RECORD 1489
fie alone produces significant interference, even with no freight train service being operated.
Figure 3 shows a stringline chart of the same passenger ti-afo traffic with only one freight train. The impacts are pronounced, as can be seen in Figure 3. Average passenger train delay increased by 85 percent, to 39 min, with a range of 3 to 143 min; five passenger trains were delayed in excess of 1 hr. The freight train was delayed 96 min. It is likely that different dispatching could improve the results for the train passenger at the expense of a delay for the freight train, but holding the freight train in one of the passing sidings means that a passing maneuver between opposing passenger trains now takes place over a 40-mi segment rather than a 20-mi segment, and. the transit time alone for such a link is 34 min. Other solutions are clearing the freight train off to an intermediate yard or switching siding, the use of more frequent sidirigs, the use of segments of double track to allow running meets, or expanding the complexity of the passing siding to allow for three~ train meets (additional tracks or crossovers to provide several pockets).
Train Interference-Case B: Double-Track ABS System Good train performance with all 28 passenger trains and 6 freight trains was achieved. The delay statistics are interesting:
Freight train delay Passenger train delay Total delay Freight train delay/train Passenger train delay/train Passenger train delay range Average delay/train
Minutes of Delay
90 mph 110 mph
463 177 640 77 6 6-15 19
491 145 636 82 5 3-16 19
Total train delay did not increase in going from the 90-mph case io the 110-mph case, showing the benefit of reduced transit time. Freight train delay has dropped from that in Case A, and passenger train delay is low and relatively uniform. Slight schedule adjust;.. ments to freight train departure times could reduce delays further. T~is is certainly an acceptable passenger train operation, and freight train performance may well be found to be acceptable in many instances. Freight train operations more intense than those tested are possible with this configuration.
Train Interference-Case C: Double-Track CTC System The same schedule of trains operated in Case B is operated in _Case C, with passenger train MASs of 90, 110, 125, and 150 mph, with the following results:
Minutes of Delay
90mph 110 mph 125 mph 150mph
Freight train delay 247 71 83 41 Passenger train delay 157 139 199 188 Total delay 404 210 282 229 Freight train delay/train 41 12 14 7 Freight train delay range 21-53 1-23 4-32 1-14 Passenger train delay/train 6 5 7 7 Passenger train delay range 5-17 3-17 6-13 5-17 Average delay/train 12 6 8 7
These results are much improved over those for Case B, with average total delay falling from 19 mins/train to as low as one-third
Ullman and Bing 43
FIGURE 3 Case A stringline: all passenger trains and one freight train.
that. level. Freight delays have improved markedly. In fact in the 150-mph case freight train delay performance is actually better than passenger train delay performance. This indicates that a redispatch could further improve performance.
Figure 4 compares the delay performance for the three cases (eight runs). The advantages of the more flexible infrastructure are clear. Note that good freight train performance and good passenger train performance are not mutually exclusive but tend to occur together.
SAFETY CONSIDERATIONS
Additional safety measures may be required to reduce accident risks and to !Uaintain an acceptable safety performance after the introduction of higher-speed passenger services. The objective of the safety analysis is to determine the actions that may be required at different speeds.
This question is answered by first characterizing the present safety performance of long-distance passenger trains operated on freight railroad tracks in the United States, then estimating how this safety performance would be affected by the higher speeds and traffic densities, and finally, estimating the safety benefits of various accident risk mitigation measures.
Accident Mechanisms and Safety Performance
The present safety performance of passenger trains operated on freight railroads can be characterized by accident frequencies (accidents per train-kilometer) and severities (casualties and property damage) for each of several accident scenarios that have distinctly different causes and consequences.
Accident Scenarios and Operating Environment
The accident risks to which passenger trains are exposed when operating on a typical corridor can be divided into four groups:
1. Collisions between trains, usually caused by human error on the part of a train crew or dispatcher, but also by signal defects or other plant and equipment defects.
2. Collisions between a passe.nger train and an obstruction, including collisions with a derailed or defective freight train on an adjacent track.
3. Derailment of a passenger train, typically caused by a track or equipment defect or· a human error such as excessive speed or an incorrectly aligned switch.

44 TRANSPORTATION RESEARCH RECORD 1489
CASE --·---·------··-··-----
A B c ---------·----;--------~----=------11
V max(mph) -
Passenger Trains (per day) Freight Trains (per day) Freight Train Delay (mlns.)
Passenger Train Delay
Max.
Average
0 Min.
90 90
28 28
0 i
96
200
1000
.800
600
. 400
200
0
143
90 10 90 110 125 150
28 28 28 28 28 28
6 6 6 6 6 ·5
77 82 41 12 14 7
I
Total Delay I All Trains (mins.) I
I I I I ·I·
I
FIGURE 4 Comparison of delay performance, eight test runs.
4. Collisions between a passenger train and a road user at a rail-highway grade crossing.
Each of these ;iccident scenarios has different causes and will be affected in different ways by risk mitigation measures.·
Currently, passenger trains operating on a typical freight railroad corridor face the following operating environment:
• MAS = 127 km/hr (79 mph); • CTC or ABS signaling, no train control; • Wood tie track, mixture of bolted and welded rail; • FRA Class 4 standards (some Classes 3 and 5); and • One grade crossing every 2 km (l.25 mil).
Accident Incidence and Severity
Data on accident incidence and severity for this operating environment were obtained by analysis of data in the FRA Railroad Accident/Incident Reporting System (RAIRS) (5). Data for the years 1986 to mid-1993 were used to ·calculate the frequency and severity of accidents in each scenario. With the exception of trainto-train collisions, only accidents occurring to Amtrak passenger
trains while operating on track owned by a freight railroad were included in the analysis to ensure that the results were representative of mixed freight train and passenger train operations. There were insufficient train-to-train collisions involving passenger trains in the period analyzed to yield a meaningful accident frequency, so the collision rate for freight trains on FRA Class 4 track was used. Passenger train accidents on the NEC and commuter railroad tracks were excluded as being unrepresentative of operating conditions on freight railroads. The total train-kilometers operated on freight railroads were obtained from Amtrak operating statistics.
The results.of the analysis are given in Table 2. The accident rate for grade crossing accidents has been presented in two ways: from the total number of crossing collisions involving passenger trains and for the subset of these accidents reportable as train accidents under the FRA reporting criteria. Table 3 gives the projected accident performance for a hypothetical corridor service by using the accident rates and severities listed in Table 2.
To put the fatality estimate into context, the rate of approximately 0.5 per billion passenger-km in train accidents can be compared with approximate fatality rates for other modes of 6 per billion passenger-km for motor vehicle occupants, 1 per billion passenger-

Ullman and Bing
km for commuter air carriers, and 0.2 per billion passenger-km for large air carriers. European railroad fatality rates vary between 0.2 and 1.2 per billion passenger-km ( 6, 7).
Effects of Higher Speed and Density
Accident frequencies could increase as a result of such factors as higher vehicle-track forces leading to more frequent track failures and derailments or higher traffic densities causing increases in meets and passes relative to the train-kilometers operated and thus opportunities for collisions, for example, with a defective train on an adjacent track. However, at their maximum speeds higher-speed trains are typically designed not to exert higher forces on the track than existing trains, and higher-speed trains have improved braking and other design features to ensure compatibility with the infrastructure over which they will operate. Therefore, it is assumed that there is no increase in accident frequency with increasing speed. The density effect is highly corridor specific, being a function of track layout and traffic mix, and was not examined in this analysis, However, it is suggested that density effects should be examined when analyzing the safety improvements needed in specific corridors.
There is no question that increasing speed will increase the severity of any accident, and this increase in severity is the most important issue to be considered when planning risk mitigation measures. Unfortunately, accident severity data in RAIRS are not very helpful in establishing a speed-severity relationship. There are very few observations for each accident type in each speed range, and the mix of accident causes changes as speed increases, leading to inconclu-
45
sive results from the analysis.· An alternative approach is to assume that casualties and damage are proportional to the energy dissipated in an accident, which is roughly proportional to the square of speed. By using this hypothesis it is possible to estimate the needed reduction in the number of accidents to offset the increase in severity because of higher-speed operation, assuming the base case of operation at 127 km/hr (79 mph), as follows:
Speed, km/hr (mph)
145 (90) 175(110) 200 (125) 240 (150)
Percent Reduction in Accidents
23 48 60 72
In practice, some offsetting factors may reduce accident severity, and thus the need to reduce the number of accidents. It is rarely possible to increase maximum speed throughout an existing corridor because of curvature and other restrictions. Also, improved train crashworthiness, which is likely to be a feature of future high-speed train designs, will reduce the number and severity of casualties in an accident. Overall, a reduction in accident frequency of the order of 30 to 40 percent may be de.sirable for speeds of 175 km/hr, and a reduction of 60 to 80 percent may be desirable for speeds exceeding 200 km/hr.
It is emphasized that these estimates of needed reductions in accident frequency are very approximate and are presented to indicate the rough magnitude of improvements needed from accident prevention and mitigation measures, assuming that the goal is that projected saf~ty performance shall at least equal that of present intercity passenger train operations. Further research involving both
TABLE 2 Estimated Passenger Train Accident Frequencies and Severities on Freight Railroad Track
Accident/Incident Train/Person Type Type Frequency Average Severity
Passenger Scenario 1: Train-to-Train *0.043 trains in collisions per million $300,000* per train in collision Train Accidents train-km
Accidents Scenario 2: Collisions with 0.14~ collisions per million train-km $80,000 per accident· Obstructions
Scenario 3: Derailments 0.168 derailments per million train-km $455,000 per derailment ·
Scenario 4: Rail-Highway Grade Crossing Collisions
All Collisions 6.3 per million crossing passes 0.49 casualties per accident ... _. ___ -·--·- --- ----------·------·-....----Collisions Reportable as
0.91 per million crossing passes $86,000 per accident Train Accidents
Train-movement personal casualties, except at ra.il- Injuries Fatalities highway grade 'crossings
{ Passengers, including in train 3.61 0.129 accidents Not
Per million Applicable train-km Employees/contractors/non- 0.23 0.064
trespassers . · ·
Trespassers 0.43 1.00
0.7 Passenger casualties per billion passenger-km 19.6 . [0.5 in train
accidents]
*Estimated from data for freight train collisions on FRA Class 4 track. Passenger train collisions too few to yield meaningful data.

46 TRANSPORTATION RESEARCH RECORD 1489
TABLE 3. Estimated Accidents in 1 yr on Hypothetical 500-km (310-mi) Freight Railroad Corridor
A Accidents and Property Damage (reportable to FRA)
Accidents per Total Damage Accident Scenario Vear $1000s
Trains in Train-to-train co11isions 0.18 53
Other collision.~ 0.61 49
Derailments 0.70 314
Grade crossing collisions - All collisions 13.0 ----- Reportable as train accidents 1.9 162
Total, All Reportable Train Accidents 3.4 580
B Personal Casualties (passenger train operations only)
Type of Person
Passengers (in both train and other types of accident)
Employees, contractors, non-trespassers
Trespassers
Highway users at grade crossing
Total, All Casualties
more detailed study of accident descriptions and data and analysis of collision and derailment dynamics is highly desirable, because good information on speed effects is limited.
Accident Prevention and Mitigation
Mitigation Measures
Based on a review of domestic and international practice, 17 accident prevention and mitigation measures were selected for analysis (Table 4). Some of the improvements are required under present FRA safety regulations for speeds exceeding 127 km/hr (79 mph), and many have been either applied to or proposed for the NEC.
Effectiveness of Mitigation Measures
The effectiveness of each mitigation measure in reducing the incidence of accidents in each accident scenario was estimated by first combining the individual accident causes defined in RAIRS into groups that are affected in the same way by the different accident mitigation measures. For example, all causes of rail defects are combined because they are affected in a similar way by improved rail
Injuries Fatalities
15 0.5
1.0 0.3
1.8 4.2
5.0 1.3
22.8 6.3
inspection practices. A total of 40 such cause groups were defined. Then for each cause group and accident scenario, estimates were made of the fraction of accidents under present operating conditions attributable to the cause group and the percentage reduction in accidents that would be achieved by applying each mitigation measure. The results of this analysis can be used to estimate the benefit of applying any combination of accident risk mitigation measures.
The distribution of accidents among cause groups was based on an analysis of the RAIRS data base by using freight train accident data to guide estimates when the sample of passenger train data was too small to yield meaningful results. The estimates of the effectiveness of the accident mitigation measures in reducing accident incidence were derived in part from a comparison of passenger train accidents in the NEC with accidents on freight train trackage, in part from the extensive literature on railroad track and equipment failure and inspection techniques, and from expert judgment. It should be emphasized that the estimates obtained through this process are necessarily approximate.
Summary of Results
The results of the analyses are summarized in Table 5. It can be seen that most of the mitigation measures analyzed should be imple-

TABLE 4 Accident Mitigation Measures
Ref Category No. Name Description
Train Train control or cab signal system just meeting minimum FRA requirements in CFR49, Control 1 Minimum FRA ATC Part 236 Systems
2 Northeast Corridor A TC ATC system providing positive speed control in response to restricting signals, as presently installed (1994) on the Northeast Corridor
Advanced ATC ATC system providing positive speed control; enforcement of civil speed limits and
3 positive stop at interlockings
Defective Detectors located at approximately 15 km (9 mile) spacing -- which is half industry Equipment 4 Hot Bearing Detectors average
Detectors Detectors located at approximately 15 km (9 mile) spacing -- which is half industry
5 Dragging Equipment Detectors average
6 Shifted Load Detectors Detectors at junctions, yard exits and other points where hazard may be expected
Hazard Detectors at high-risk locations, e.g., overbridges, parallel rights-of-way, etc., capable of Detectors 7 Intrusion Detectors detecting large objects such as an automobile and Barriers At high risk locations, capable of preventing intrusion of a large object such as an
8 Intrusion Barriers automobile
9 Security Fencing At high risk locations, to discourage trespass on right of way
10 Weather Detectors Detectors for high wind, snowfall, earthquakes, etc., where warranted by expected risks
Track Track Upgrade to Class 6+ Will typically include welded rail throughout, concrete ties and elastic fasteners Quality 11
and Reducing inspection intervals to one month. as present practice on the Northeast Inspection 12 . Track Geometry Inspection Corridor Improvements
. Rail Flaw Inspection Reducing inspection intervals to six months from present annual inspection required by
13 FRA reoulations
Inspection over entire route by hi-rail vehicle or equivalent, instead of twice weekly 14 Daily Inspection required by FRA
On Train Monitoring On train sensors such as acce.lerometers and bearing temperature transducers, to detect
.15 selected vehicle and track defects
Grade Obstacle Detectors Crossing 16 Installation of a stalled-vehicle detector at all crossinos in corridor
Improvements Four.Quadrant Gates Installation of fo~r-quadrant crossing gates at all crossings in corridor 17

48
mented in parallel to achieve the level of improvement needed at the highest speeds, approaching 240 km/hr (150 mph).
CONCLUSIONS
Changes Mandated by U.S. Regulatory Requirements
• Most existing corridor signal systems are ABS or TCS and will fulfill the FRA block signaling regulations for operation at speeds of 60 mph or greater.
• Where trains are to operate at 80 mph or greater, FRA regulations require an ACS, ATS, or A TC system, which most Section 1010 corridors do not have.
• At present speeds up to 17 5 km/hr ( 110 mph) may be achieved within the FRA track regulations (8.) Speed higher than these require a waiver or special approval on an applicationby-application basis. FRA may soon revise these standards to encompass operating speeds above 110 mph. It is possible that operations above 110 mph would require a full ATC (universal
TABLE 5. _Accident Mitigation Measure Effectiveness
TRANSPORTATION RESEARCH RECORD 1489
speed control) system in place, with positive speed control of all trains in effect, that is, no relief from the provisions of 49 C.F.R. 236.566, and with all trains being equipped at the highest train control level. At some point in the speed spectrum positive speed control of civil restrictions may also become an FRA requirement.
Changes Suggested from Standpoint of Corridor Capacity
Commercially available brakjng systems will permit increased passenger train speeds within the limits of many existing block layouts. With existing Amtrak equipment and 2135-m (7,000 ft) block lengths operation at up to 175 km/hr (110 mph) may be possible, [whereas 145 km/hr (90 mph) may be achievable with 1525-m (5,000-ft) block spacing].
Moving block technologies are not needed for incremental cor. ridors where train densities are not extremely high and very short
Percent Reduction in Accidents
Accident Train-to- Grade Mitiga~ion Train Other Crossing Measure Collisions Collisions Derailments Collisions
1 Minimum FAA ATC 24 8 5
2 Northeast Corridor A TC 68 28 12
3 Advanced A TC 81 32 15
4 Hot Bearing Detectors 4
5 Dragging Equipment Detectors 2
6 Shifted Load Detectors 14 2
7 Intrusion Detectors 14
8 Intrusion Barriers 19
9 Security Fencing 8 4
10 Weather Detectors 11 3
11 Track Upgrade to Class 6+ 40
12 Track Geometry Inspection 15
.13 Rail Flaw Inspection 8
14 Daily Inspection 8 17
15 On Train Monitoring 12
16 Grade Crossing Obstacle Detectors 19
17 Four-Quadrant Crossing Gates 57
All Measures 81 67 72 65

Ullman and Bing
headways are not required. Currently available A TC systems are not yet capable enough for stand-alone use in incremental corridors.
Single-track corridors will face difficulties if passenger train and significant freight train operations must both operate during the same time periods. Although some service is obviously possible, there are limits to what can be achieved with such an infrastructure. There is also the potential for significant schedule unreliability, which could adversely affect the marketability of the service provided.
Detailed, site-specific studies must be performed to match the traffic requirements and the infrastructure proposed, with acceptable delays to freight and passenger train services as a constraint.
Additional· parallel running tracks, increased siding lengths, decreased siding spacings, more complex interlockings, and reverse running capability are key infrastructure components to be considered.
Adjusting passenger and freight train schedules and establishing priority passenger (freight blackout) periods are key operating considerations to be considered.
Changes Suggested from Standpoint of Safety
The overall conclusion from the present study is that a large number of accident risk mitigation measures may need to be implemented in parallel if present intercity rail safety performance is to be maintained with higher-speed operation on a freight railroad corridor.· Key measures that deserve consideration, some of which would be required under present FRA regulations, are
• An A TC system having functional performance similar to that used or proposed in the NEC.
49
• Track improvement to FRA Class 6 or better, with enhanced inspection.
• Improved rail-highway grade crossing warning systems, new protection systems, and/crossing elimination where practical.
• Improved defect and hazard warning systems.
ACKNOWLEDGMENTS
The authors gratefully acknowledge the financial support and encouragement provided by the Volpe National Transportation Systems Center and FRA, which are sponsors of this study.
REFERENCES
1. Pub. L. 102-240 (Dec. 18, 1991), Intermodal Surface Transportation Efficiency Act of 1991 (ISTEA). 105 stat. 1914.
2. Ullman, K. B., and A. J. Bing. High Speed Passenger Trains in Freight Railroad Corridors: Operations and Safety Considerations. Report DOTVNTSC-FRA-94-11. U.S. Department of Transportation, Nov. 1994.
3. Annual Report-Method of Train Operation as of January 1, 1993. FRA, U.S. Department of Transportation.
4. Rules, Standards, and Instructions Governing the Installation, Inspection, Maintenance, and Repair of Signal and Train Control Systems, Devices, and Appliances. 49 C.F.R. 236.
5. Railroad Accident/Incident Reporting System (RA/RS) Database of Railroad Accidents, Incidents, and Grade Crossing Accidents, Jan. 1986-June 1993 inclusive. FRA, U.S. Department of Transportation.
6. National Safety Council. Accident Facts, 1992. 7. Bing, A. J., J. A. Harrison, et al. Safety of HSGGT Systems: Collision
Avoidance and Accident Survivability. Report DOT-FRA-ORD-93/04 (four volumes). FRA, U.S. Department of Transportation, March 1993.
8. Federal Track Safety Standards. 49 C.F.R. 213.57 et seq.
Publication of this paper sponsored by Committee on Guided Intercity Passenger Transportation.