open access research quantifying the prevalence of … · quantifying the prevalence of frailty in...
TRANSCRIPT

Quantifying the prevalence of frailtyin English hospitals
J Soong,1,2 AJ Poots,1 S Scott,3 K Donald,3 T Woodcock,1 D Lovett,1 D Bell1
To cite: Soong J, Poots AJ,Scott S, et al. Quantifying theprevalence of frailtyin English hospitals. BMJOpen 2015;5:e008456.doi:10.1136/bmjopen-2015-008456
▸ Prepublication history andadditional material isavailable. To view please visitthe journal (http://dx.doi.org/10.1136/bmjopen-2015-008456).
Received 15 April 2015Revised 31 July 2015Accepted 21 August 2015
▸ http://dx.doi.org/10.1136/bmjopen-2015-008457
1NIHR CLAHRC NorthwestLondon, Imperial CollegeLondon, London, UK2Royal College of Physicians,London, UK3Oliver Wyman, London, UK
Correspondence toDr J Soong;[email protected]
ABSTRACTObjectives: Population ageing has been associatedwith an increase in comorbid chronic disease,functional dependence, disability and associated higherhealth care costs. Frailty Syndromes have beenproposed as a way to define this group within olderpersons. We explore whether frailty syndromes are areliable methodology to quantify clinically significantfrailty within hospital settings, and measure trends andgeospatial variation using English secondary care dataset Hospital Episode Statistics (HES).Setting: National English Secondary CareAdministrative Data HES.Participants: All 50 540 141 patient spells for patientsover 65 years admitted to acute provider hospitals inEngland ( January 2005—March 2013) within HES.Primary and secondary outcome measures: Weexplore the prevalence of Frailty Syndromes as coded byInternational Statistical Classification of Diseases,Injuries and Causes of Death (ICD-10) over time, andtheir geographic distribution across England. Weexamine national trends for admission spells, inpatientmortality and 30-day readmission.Results: A rising trend of admission spells was notedfrom January 2005 to March 2013(daily averageadmissions for month rising from over 2000 to over4000). The overall prevalence of coded frailty isincreasing (64 559 spells in January 2005 to 150 085spells by Jan 2013). The majority of patients had asingle frailty syndrome coded (10.2% vs total burden of13.9%). Cognitive impairment and falls (includingsignificant fracture) are the most common frailtysyndromes coded within HES. Geographic variation infrailty burden was in keeping with known distribution ofprevalence of the English elderly population andlocation of National Health Service (NHS) acute providersites. Overtime, in-hospital mortality has decreased(>65 years) whereas readmission rates have increased(esp.>85 years).Conclusions: This study provides a novelmethodology to reliably quantify clinically significantfrailty. Applications include evaluation of health serviceimprovement over time, risk stratification andoptimisation of services.
INTRODUCTIONPeople are living longer. At present, it is esti-mated that 16.1% of the European popula-tion is over the age of 65 years (>65 years),
and this number is expected to rise to 22%by 2031.1 In the developed world, theincrease is greatest in those over 80 years,and this equates to approximately 3 millionpeople in the UK.2 In health terms patients>65 years now constitute two-thirds of thegeneral hospital population, account for40% of all hospital bed days and 65% ofNational Health Service (NHS) spend.3
Recent analysis suggests population ageingcontributes directly to the increase in emer-gency admissions to hospitals.4
Associated with this demographic shiftthere has been an increase in comorbidchronic disease, functional dependence, dis-ability, poorer quality of life and higherhealth care costs.5 6 Patients in this categoryare often considered frail. Currently, there isno universally agreed operational definitionfor frailty.7 Frailty has been described as aclinical phenotype or a biophysical syndromeof accumulated deficit (frailty index).Phenotypic models describe frailty as specificclinical syndrome encompassing a cluster ofcharacteristics, namely unintentional weightloss, exhaustion, weakness, slowness and lowphysical activity.8 The frailty index is charac-terised by decreased resistance to stressorsresulting from the accumulation of deficitacross multiple physiological systems, culmin-ating in an increased risk of adverse out-comes.9 10 Methodologies to reliably identifythe ‘frail’ at-risk cohort within secondarycare, both at patient and population level,are a current research priority.11–13
Strengths and limitations of this study
▪ This study is the first to attempt to use frailtysyndromes as an operational definition within anEnglish secondary care data set.
▪ The methodology uses whole population rou-tinely collected data, with robust trend analysisexamining coding reliability.
▪ This study is a retrospective analysis reliant onthe accuracy, reliability and retrospective natureof coding within Hospital Episode Statistics.
Soong J, et al. BMJ Open 2015;5:e008456. doi:10.1136/bmjopen-2015-008456 1
Open Access Research
on 6 Septem
ber 2018 by guest. Protected by copyright.
http://bmjopen.bm
j.com/
BM
J Open: first published as 10.1136/bm
jopen-2015-008456 on 21 October 2015. D
ownloaded from

In clinical practice the terms Geriatric Giants,14
Geriatric Syndromes15 16 or Frailty Syndromes17 are oftenused to describe clinically vulnerable group within theelderly. They likely represent high order clinical manifes-tations of multifactorial processes resultant from theaccumulation and interaction of deficits and environ-mental factors. They include cognitive impairment, falls,mobility problems, pressure ulcers and incontinence.These syndromes, more prevalent in the elderly, confer ahigher risk of death,8 institutionalisation,18 disability andpoor quality of life.15 They are arguably the consequencesof frailty, or the manifestation of clinically significantfrailty.19 Current National guidelines for the care of theolder person in acute care recommend using frailty syn-dromes as a possible methodology to assess for frailty.17 20
In this study, we measure the trends for all hospitaladmissions, in-hospital death and readmissions for thoseover 65 years. We describe Frailty Syndromes17 20 as anoperational definition within the English secondary caredata set Hospital Episode Statistics (HES) in order toexamine the frailty burden between 2005 and 2012. Inaddition we describe the geospatial variation of frailty inEnglish secondary healthcare settings. We compare ourresults with the existing literature on frailty prevalenceand discuss possible applications of this methodology.
METHODSData sourcesHES is a national administrative database containingpatient-level records of all admissions to NHS hospitalsin England.21 It has high levels of data completenessand rigorous data cleaning processes to ensure dataquality. Each record in HES corresponds to a finishedconsultant episode, during which a patient is under thecare of an individual consultant. These episodes wereaggregated into hospital spells covering a patient’s totallength of stay in a hospital (ie, a hospital admission)using established methodology.22
HES contains 20 fields per record for diagnoses codesthat are defined using the tenth revision of theInternational Statistical Classification of Diseases,Injuries and Causes of Death (ICD-10). The first ofthese is the primary diagnosis, with the rest available forcoding of comorbidities or complications. HES does notcontain present-on-admission flags. We reviewed HES forICD-10 diagnostic codes that could be grouped forfrailty syndromes (see online supplementary appendix1) in all 20 fields. We included only inpatients at acutenon specialist hospital trusts, with elective andnon-elective admissions for those 65 years and over>65 years. We excluded hyper-specialist hospitals andmental health units as they have a very differentcase-mix and data quality.23 Thus, we defined frailty asthe presence of at least one frailty syndrome and withinthe cohort of patients greater than 65 years old.Annual trend profiles were created for the grouped
ICD-10 diagnostic codes from January 2005 to March
2013 to determine coding reliability and shifts (seeonline supplementary appendix 2). The spells wereaggregated both by age-band (65–74; 75–84; >85 years)and monthly. Monthly data are visualised as simple lineplots in the first instance. Office of National Statistics(ONS) databases were queried for population size esti-mates or census data where available.
Study populationAll hospital admissions for >65 years to English acutetrusts between January 2005 and March 2013(N=50 540 141 patient spells) were available for analysis.
Temporal analysisTo analyse the variation present in these time-seriesdata, statistical process control is used to separate specialcause variation (signal) from common cause variation,an inherent property of all systems. The XmR chart isused as it is a method that is not dependent on data dis-tributions or underlying assumptions.24 When analysingcount data, daily averages for months were calculated tocorrect for unequal ‘areas of opportunity’; for example,a count of February admissions will be lower by virtue offewer days in February, and daily averages account forthe difference in available days. For percentage data,such a correction is attained through division by thedenominator—all spells and all spells with frailty.Adjustments for seasonal variation are made, and seaso-nalised reference lines are plotted, for more naturalinterpretation of the charts. In this work, a standard ruleset for detection of signal is adopted, using MicrosoftExcel to construct the charts.24
Geospatial analysisGeo-location is the identification of real-world geo-graphic location of an object. Postcodes of provider siteswere used to geo-locate sites, and map elements werederived from open source data provided by Office forNational Statistics. Geo-locations aggregated to PrimaryCare Trust (PCT) level were attached to counts of frailtysyndromes for patients >65 years admitted to NHS acuteproviders in 2012 as this is the applicable unit for thesedata. Choropleths are thematic maps that shade orcolour areas to represent classified values of specificphenomena. ESRI ArcMap V.10.2 software was used tocreate a choropleth map. Annual trend profiles forinpatient mortality and non-elective readmission within30 days were plotted. This temporal range of April 2006to December 2012 was selected due to changes in struc-ture of health geographies within England in 2006,26
and to allow a sufficient follow up period to more accur-ately reflect the clinical outcomes listed above.
RESULTSBetween January 2005 and March 2013, there was arising trend with daily average admissions for monthincreasing from over 2000 to over 4000 (figure 1A).
2 Soong J, et al. BMJ Open 2015;5:e008456. doi:10.1136/bmjopen-2015-008456
Open Access
on 6 Septem
ber 2018 by guest. Protected by copyright.
http://bmjopen.bm
j.com/
BM
J Open: first published as 10.1136/bm
jopen-2015-008456 on 21 October 2015. D
ownloaded from
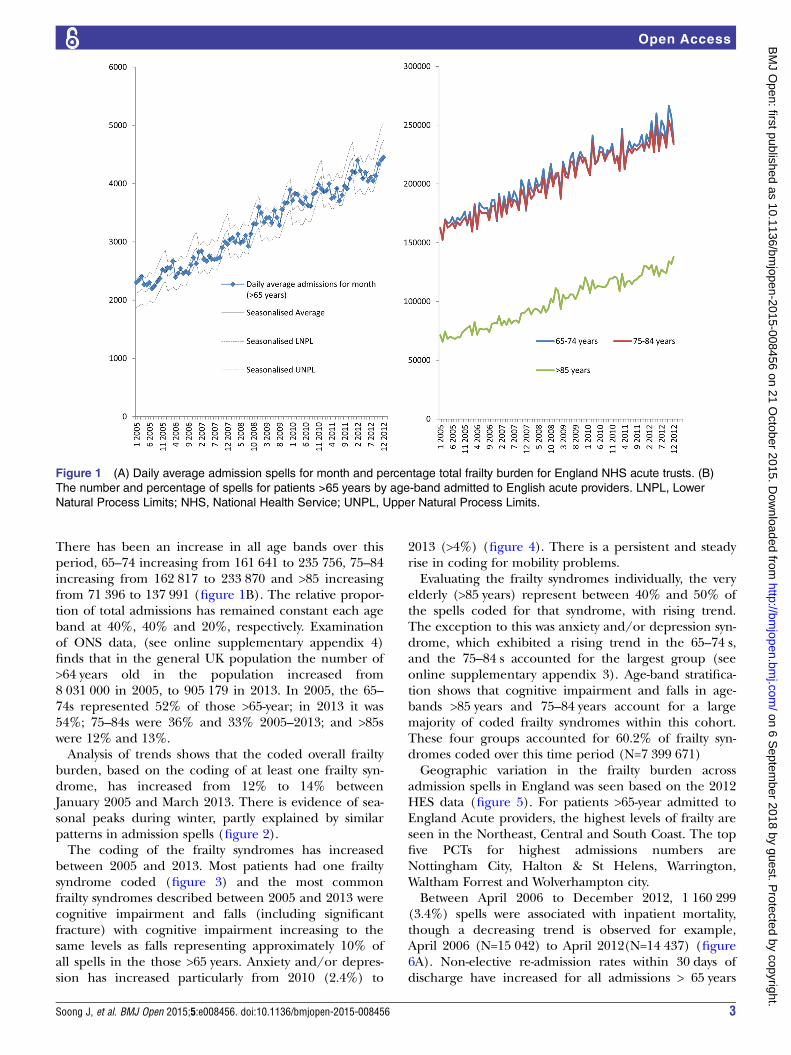
There has been an increase in all age bands over thisperiod, 65–74 increasing from 161 641 to 235 756, 75–84increasing from 162 817 to 233 870 and >85 increasingfrom 71 396 to 137 991 (figure 1B). The relative propor-tion of total admissions has remained constant each ageband at 40%, 40% and 20%, respectively. Examinationof ONS data, (see online supplementary appendix 4)finds that in the general UK population the number of>64 years old in the population increased from8 031 000 in 2005, to 905 179 in 2013. In 2005, the 65–74s represented 52% of those >65-year; in 2013 it was54%; 75–84s were 36% and 33% 2005–2013; and >85swere 12% and 13%.Analysis of trends shows that the coded overall frailty
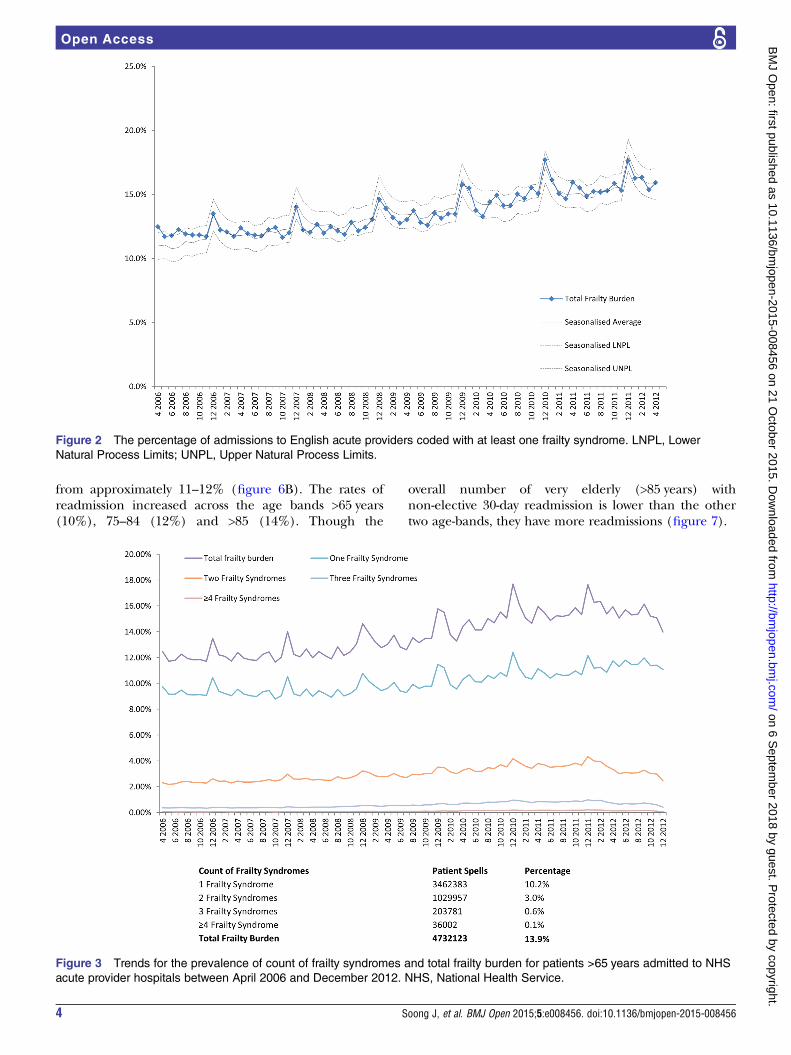
burden, based on the coding of at least one frailty syn-drome, has increased from 12% to 14% betweenJanuary 2005 and March 2013. There is evidence of sea-sonal peaks during winter, partly explained by similarpatterns in admission spells (figure 2).The coding of the frailty syndromes has increased
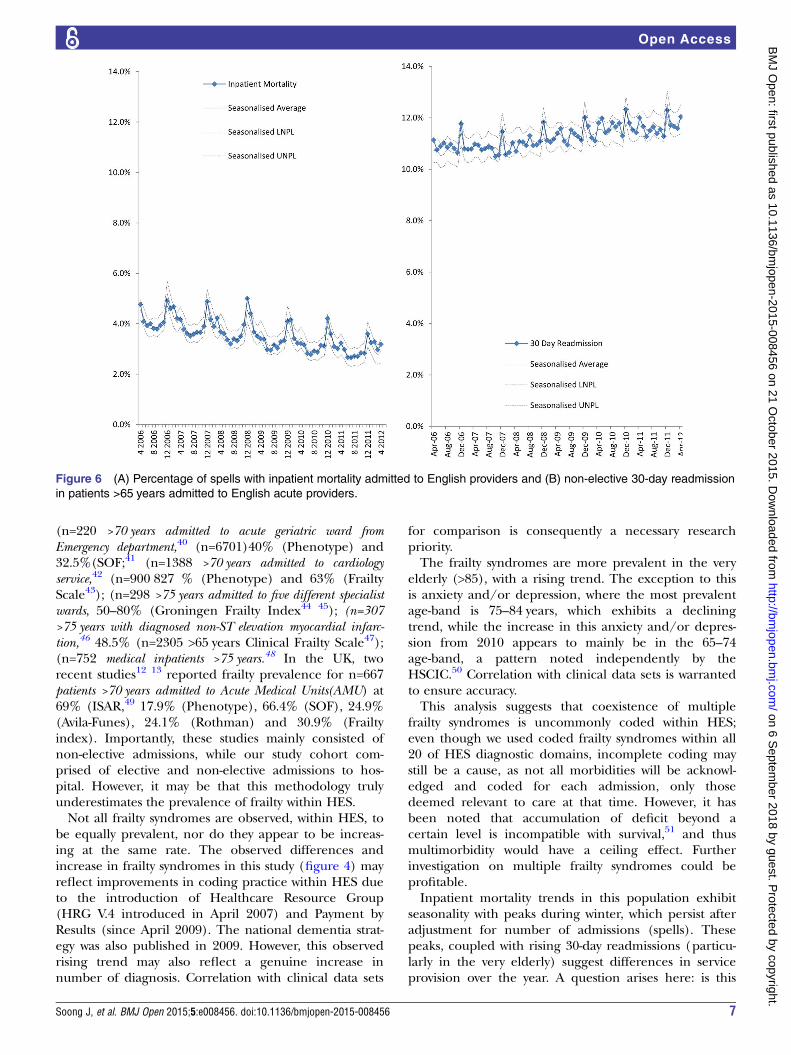
between 2005 and 2013. Most patients had one frailtysyndrome coded (figure 3) and the most commonfrailty syndromes described between 2005 and 2013 werecognitive impairment and falls (including significantfracture) with cognitive impairment increasing to thesame levels as falls representing approximately 10% ofall spells in the those >65 years. Anxiety and/or depres-sion has increased particularly from 2010 (2.4%) to
2013 (>4%) (figure 4). There is a persistent and steadyrise in coding for mobility problems.Evaluating the frailty syndromes individually, the very
elderly (>85 years) represent between 40% and 50% ofthe spells coded for that syndrome, with rising trend.The exception to this was anxiety and/or depression syn-drome, which exhibited a rising trend in the 65–74 s,and the 75–84 s accounted for the largest group (seeonline supplementary appendix 3). Age-band stratifica-tion shows that cognitive impairment and falls in age-bands >85 years and 75–84 years account for a largemajority of coded frailty syndromes within this cohort.These four groups accounted for 60.2% of frailty syn-dromes coded over this time period (N=7 399 671)Geographic variation in the frailty burden across
admission spells in England was seen based on the 2012HES data (figure 5). For patients >65-year admitted toEngland Acute providers, the highest levels of frailty areseen in the Northeast, Central and South Coast. The topfive PCTs for highest admissions numbers areNottingham City, Halton & St Helens, Warrington,Waltham Forrest and Wolverhampton city.Between April 2006 to December 2012, 1 160 299
(3.4%) spells were associated with inpatient mortality,though a decreasing trend is observed for example,April 2006 (N=15 042) to April 2012(N=14 437) (figure6A). Non-elective re-admission rates within 30 days ofdischarge have increased for all admissions > 65 years
Figure 1 (A) Daily average admission spells for month and percentage total frailty burden for England NHS acute trusts. (B)
The number and percentage of spells for patients >65 years by age-band admitted to English acute providers. LNPL, Lower
Natural Process Limits; NHS, National Health Service; UNPL, Upper Natural Process Limits.
Soong J, et al. BMJ Open 2015;5:e008456. doi:10.1136/bmjopen-2015-008456 3
Open Access
on 6 Septem
ber 2018 by guest. Protected by copyright.
http://bmjopen.bm
j.com/
BM
J Open: first published as 10.1136/bm
jopen-2015-008456 on 21 October 2015. D
ownloaded from
from approximately 11–12% (figure 6B). The rates ofreadmission increased across the age bands >65 years(10%), 75–84 (12%) and >85 (14%). Though the
overall number of very elderly (>85 years) withnon-elective 30-day readmission is lower than the othertwo age-bands, they have more readmissions (figure 7).
Figure 2 The percentage of admissions to English acute providers coded with at least one frailty syndrome. LNPL, Lower
Natural Process Limits; UNPL, Upper Natural Process Limits.
Figure 3 Trends for the prevalence of count of frailty syndromes and total frailty burden for patients >65 years admitted to NHS
acute provider hospitals between April 2006 and December 2012. NHS, National Health Service.
4 Soong J, et al. BMJ Open 2015;5:e008456. doi:10.1136/bmjopen-2015-008456
Open Access
on 6 Septem
ber 2018 by guest. Protected by copyright.
http://bmjopen.bm
j.com/
BM
J Open: first published as 10.1136/bm
jopen-2015-008456 on 21 October 2015. D
ownloaded from

DISCUSSIONFrailty is often defined as a clinical state in which thereis an increase in an individual’s vulnerability for adverseevents and harm when exposed to a stressor.25 It is dis-tinct but related to disability and comorbidity.26 27 Someapproaches to the measurement of frailty have beencharacteristically biophysical with emphasis on detectionof the consequences of sarcopaenia and chronicinflammation-malnutrition.8 Another approach is tomeasure frailty in relation to the clinical consequencesof accumulated loss and insufficiency in ageing indivi-duals(ie, the relationship to mortality and adverse out-comes).28 Both approaches appear complementary29
and overlap, though not completely.30 Frailty measure-ment is problematic in the acute care setting. Highlevels of disease acuity on top of chronic multimorbidity,multidimensional complexity and diagnostic uncertaintyare challenging for healthcare systems, with increasingevidence and concern for compromised patient safety,quality of care and experience.31–34
We have examined the prevalence of frailty syndromeswithin English HES data from both a temporal and geo-spatial point of view. Temporal analysis, it allows us toobserve shifts in diagnostic coding, and observe trend insignal changes over time. Spatial analysis allows us toexplore geographic heterogeneity of frailty syndrome
prevalence, with consequent implications for service pro-vision and equity of care.Comparison with ONS data, the corresponding admis-
sions to English acute providers for patients with frailtysyndromes is larger than might be expected by demo-graphic shift associated with ageing. Additionally, 75–84 s make up approximately one-third of the populationof those over 65 years, but have 40% of the admissions,and >85s are approximately 13% of the population ofthose over 65 years but have 20% of the admissions.This study has focused on patients admitted to hos-
pital >65 years in England to better understand theimpact of frailty syndromes. To the authors knowledge,this is the first study to examine the prevalence of frailtysyndromes for patients >65 years across England. Thisstudy confirms increasing number of >65 years admittedto hospital (elective and non-elective). The relativeburden of coded frailty syndromes has increased overthis period with cognitive impairment increasing tosimilar levels to falls. Anxiety and/or depression is alsoincreasing in this group.When complex systems fail (biological or otherwise),
high-order functions can be first disrupted.35 Frailty syn-dromes represent the clinical manifestation of high-order disruption, providing a useful clinical marker ofmultidimensional deficit accumulation. The overall
Figure 4 Trends for the prevalence of frailty syndromes for patients >65 years admitted to NHS acute provider hospitals
between January 2005 and March 2013. NHS, National Health Service.
Soong J, et al. BMJ Open 2015;5:e008456. doi:10.1136/bmjopen-2015-008456 5
Open Access
on 6 Septem
ber 2018 by guest. Protected by copyright.
http://bmjopen.bm
j.com/
BM
J Open: first published as 10.1136/bm
jopen-2015-008456 on 21 October 2015. D
ownloaded from

prevalence rate of frailty syndromes found in this studyis 13.9%. Between 2005 and 2013, though there hasbeen an increase in the numbers of patients admitted>65 years, the percentage by age band has remainedstable, thus not suggesting major drift towards older agegroups within the older population. However, within the>65 years group, frailty syndromes are more prevalentwith the older age bands.Prevalence rates of frailty vary depending on popula-
tion and operational definition used in reported studies.Reported prevalence in community dwelling adultsvaries tremendously (from 4.0% to 59.1%).36 A recentsystematic review reported pooled frailty prevalenceacross 21 community dwelling study cohorts as 10.7%
(N=61 500).36 The recent Survey of Health, Ageing andRetirement in Europe (SHARE) study reported frailtyprevalence as 4.1% in community dwelling adults >50 years(N=16 584) in 10 European countries (prevalence of17% in those over 65 years).37 In the UK, theHertfordshire Cohort Study38 reported an overall preva-lence of 6.3% for 638 community dwelling 64–74-year-olds,while the English Longitudinal study of ageing39
reported a prevalence of 8% and 13% for 3055 commu-nity dwelling over 65-year-olds (using the Phenotype8 andFrailty Index10 definitions, respectively).The prevalence of inpatient frailty in our study was
lower than expected from smaller reported clinicalstudies within secondary care (range 24.7%—80%):
Figure 5 Percentage of spells for patients >65 years with admission to NHS acute trusts with at least one frailty syndrome by
PCT by quintiles (numerator=admission spells with at least one frailty syndrome; denominator=total admission spells to NHS
acute trusts within English PCT). NHS, National Health Service; PCT, Primary Care Trust.
6 Soong J, et al. BMJ Open 2015;5:e008456. doi:10.1136/bmjopen-2015-008456
Open Access
on 6 Septem
ber 2018 by guest. Protected by copyright.
http://bmjopen.bm
j.com/
BM
J Open: first published as 10.1136/bm
jopen-2015-008456 on 21 October 2015. D
ownloaded from
(n=220 >70 years admitted to acute geriatric ward fromEmergency department,40 (n=6701)40% (Phenotype) and32.5%(SOF;41 (n=1388 >70 years admitted to cardiologyservice,42 (n=900 827 % (Phenotype) and 63% (FrailtyScale43); (n=298 >75 years admitted to five different specialistwards, 50–80% (Groningen Frailty Index44 45); (n=307>75 years with diagnosed non-ST elevation myocardial infarc-tion,46 48.5% (n=2305 >65 years Clinical Frailty Scale47);(n=752 medical inpatients >75 years.48 In the UK, tworecent studies12 13 reported frailty prevalence for n=667patients >70 years admitted to Acute Medical Units(AMU) at69% (ISAR,49 17.9% (Phenotype), 66.4% (SOF), 24.9%(Avila-Funes), 24.1% (Rothman) and 30.9% (Frailtyindex). Importantly, these studies mainly consisted ofnon-elective admissions, while our study cohort com-prised of elective and non-elective admissions to hos-pital. However, it may be that this methodology trulyunderestimates the prevalence of frailty within HES.Not all frailty syndromes are observed, within HES, to
be equally prevalent, nor do they appear to be increas-ing at the same rate. The observed differences andincrease in frailty syndromes in this study (figure 4) mayreflect improvements in coding practice within HES dueto the introduction of Healthcare Resource Group(HRG V.4 introduced in April 2007) and Payment byResults (since April 2009). The national dementia strat-egy was also published in 2009. However, this observedrising trend may also reflect a genuine increase innumber of diagnosis. Correlation with clinical data sets
for comparison is consequently a necessary researchpriority.The frailty syndromes are more prevalent in the very
elderly (>85), with a rising trend. The exception to thisis anxiety and/or depression, where the most prevalentage-band is 75–84 years, which exhibits a decliningtrend, while the increase in this anxiety and/or depres-sion from 2010 appears to mainly be in the 65–74age-band, a pattern noted independently by theHSCIC.50 Correlation with clinical data sets is warrantedto ensure accuracy.This analysis suggests that coexistence of multiple
frailty syndromes is uncommonly coded within HES;even though we used coded frailty syndromes within all20 of HES diagnostic domains, incomplete coding maystill be a cause, as not all morbidities will be acknowl-edged and coded for each admission, only thosedeemed relevant to care at that time. However, it hasbeen noted that accumulation of deficit beyond acertain level is incompatible with survival,51 and thusmultimorbidity would have a ceiling effect. Furtherinvestigation on multiple frailty syndromes could beprofitable.Inpatient mortality trends in this population exhibit
seasonality with peaks during winter, which persist afteradjustment for number of admissions (spells). Thesepeaks, coupled with rising 30-day readmissions (particu-larly in the very elderly) suggest differences in serviceprovision over the year. A question arises here: is this
Figure 6 (A) Percentage of spells with inpatient mortality admitted to English providers and (B) non-elective 30-day readmission
in patients >65 years admitted to English acute providers.
Soong J, et al. BMJ Open 2015;5:e008456. doi:10.1136/bmjopen-2015-008456 7
Open Access
on 6 Septem
ber 2018 by guest. Protected by copyright.
http://bmjopen.bm
j.com/
BM
J Open: first published as 10.1136/bm
jopen-2015-008456 on 21 October 2015. D
ownloaded from

seasonality appropriate for the UK population and theprovision of care?Geographic variation in frailty burden appears to be
in keeping with known distribution of prevalence of theEnglish elderly population and location of NHS acuteprovider sites, particularly within urban areas.Healthcare providers and commissioners should con-sider their local populations when planning services,where frailty may be a larger consideration than otherlocations. Further study into environmental factors inrelation to frailty is a necessary next step.
LimitationsThis study is a retrospective analysis reliant on datacoded from hospital data warehouses, and subsequentlycleaned into HES. As such, its validity is dependent onaccuracy of data coding. Including all 20 diagnosticcoding fields may help to mitigate this, but correlationwith clinical data sets may be warranted for local investi-gations. Resultant prevalence rates described may under-estimate frailty syndromes in this population.Anxiety and/or depression was only recently recog-
nised as a geriatric syndrome by the EducationCommittee Writing Group of the American GeriatricsSociety.16 It appears to fulfil several criteria that makes itan attractive putative candidate for a frailty syndrome:51
poor mental health is often associated with chronic phys-ical deficits,52 it appears to increase with age (figure 4),
it is associated with adverse outcome,53 it is neither torare or too common (figure 4) Recent study has linkedit to frailty52 54 in older persons, though comprehensivestudy of its relationship to adverse outcomes with rela-tion to frailty is still lacking. Further study, including cor-relation with clinical data sets, is warranted.
ConclusionTo our knowledge this study is the first to attempt to usefrailty syndromes as an operational definition within anEnglish secondary care data set. While the study isdependent on the accuracy, reliability and retrospectivenature of coding within HES, its strengths include beinga whole population analysis, with robust trend analysisexamining coding reliability. It utilises routinely col-lected data and is comprehensive in its coding of frailtywithin all of the diagnostic coding positions in the HESdata set. Future studies to correlate with clinical data setsare needed to further investigate the phenomena discov-ered in this study.This study provides a methodology to reliably quantify
frailty. Applications include the ability to evaluate theeffect of interventions over time allowing for healthservice quality improvement. Geographic analysis allowsproviders and payers to highlight areas of need, unmetor otherwise for more intelligent targeting of resources,from a public health or clinical perspective. A reliableand quantifiable metric for frailty enables the
Figure 7 Number and percentage non-elective readmissions in patient >65 years admitted to NHS acute providers by
age-band. NHS, National Health Service.
8 Soong J, et al. BMJ Open 2015;5:e008456. doi:10.1136/bmjopen-2015-008456
Open Access
on 6 Septem
ber 2018 by guest. Protected by copyright.
http://bmjopen.bm
j.com/
BM
J Open: first published as 10.1136/bm
jopen-2015-008456 on 21 October 2015. D
ownloaded from

development of risk-prediction models and clinicalscoring systems that will aid targeted interventions to vul-nerable populations that will benefit most.
Contributors JS conceived study, designed analysis, interpreted results andwrote first draft. AJP designed analysis, interpreted results, contributed toongoing writing. SS and KD designed analysis. TW designed SPC analysis.DL designed GIS analysis. DB conceived study, designed analysis, interpretedresults and contributed to ongoing writing.
Funding This research received no specific grant from any funding agency inthe public, commercial or not-for-profit sectors.
Disclaimer This article presents independent research commissioned by theNational Institute for Health Research (NIHR) under the Collaborations forLeadership in Applied Health Research and Care (CLAHRC) programme forNorth West London. The views expressed in this publication are those of theauthor(s) and not necessarily those of the NHS, the NIHR or the Departmentof Health. JS received a Research Fellowship award from Chelsea andWestminster Health Charity. SS and KD seconded from Oliver Wyman tosupport this project. The lead author affirms that the manuscript is an honest,accurate, and transparent account of the study being reported; that noimportant aspects of the study have been omitted; and that any discrepanciesfrom the study as planned (and, if relevant, registered) have been explained.
Competing interests None declared.
Ethics approval As per Governance Arrangements for Research EthicsCommittees (GAfREC), Research limited to secondary use of informationpreviously collected in the course of normal care (without an intention to useit for research at the time of collection), provided that the patients or serviceusers are not identifiable to the research team in carrying out the research.
Provenance and peer review Not commissioned; externally peer reviewed.
Data sharing statement No additional data are available.
Open Access This is an Open Access article distributed in accordance withthe terms of the Creative Commons Attribution (CC BY 4.0) license, whichpermits others to distribute, remix, adapt and build upon this work, forcommercial use, provided the original work is properly cited. See: http://creativecommons.org/licenses/by/4.0/
REFERENCES1. United Nations Department of Economics and Social Affairs.
Demographic Yearbook 64th issue. 2013;64:1–912.2. Cornwell J. The Care of Frail Older People with Complex Needs:
Time for a revolution. The Sir Roger Bannister Health Summit,LeedsCastle: The King’s Fund, 2012.
3. Department of Health. Improving care and saving money: learningthe lessons on prevention and early intervention for older people.2010.
4. Blunt I, Bardsley M, Dixon J. Trends in emergency admissions inEngland 2004–2009: is greater efficiency breeding inefficiency.London: The Nuffield Trust, 2010.
5. Marengoni A, Angleman S, Melis R, et al. Aging with multimorbidity:a systematic review of the literature. Ageing Res Rev2011;10:430–9.
6. Barnett K, Mercer SW, Norbury M, et al. Epidemiology ofmultimorbidity and implications for health care, research, andmedical education: a cross-sectional study. Lancet 2012;380:37–43.
7. Rodriguez-Manas L, Feart C, Mann G, et al. Searching for anoperational definition of frailty: a Delphi method based consensusstatement: the frailty operative definition-consensus conferenceproject. J Gerontol A Biol Sci Med Sci 2013;68:62–7.
8. Fried LP, Tangen CM, Walston J, et al. Frailty in older adults:evidence for a phenotype. J Gerontol A Biol Sci Med Sci 2001;56:M146–56.
9. Ferrucci L, Guralnik JM, Studenski S, et al. Designing randomized,controlled trials aimed at preventing or delaying functional declineand disability in frail, older persons: a consensus report. J AmGeriatr Soc 2004;52:625–34.
10. Rockwood K, Howlett SE, MacKnight C, et al. Prevalence, attributes,and outcomes of fitness and frailty in community-dwelling olderadults: report from the Canadian study of health and aging.J Gerontol A Biol Sci Med Sci 2004;59:1310–17.
11. Ellis G, Whitehead MA, O’Neill D, et al. Comprehensive geriatricassessment for older adults admitted to hospital. CochraneDatabase of Systematic Reviews 2011;(7):CD006211.
12. Edmans J, Bradshaw L, Gladman JRF, et al. The Identification ofSeniors at Risk (ISAR) score to predict clinical outcomes and healthservice costs in older people discharged from UK acute medicalunits. Age Ageing 2013;42:747–53.
13. Wou F, Gladman JR, Bradshaw L, et al. The predictive properties offrailty-rating scales in the acute medical unit. Age Ageing2013;42:776–81.
14. Isaacs B. The challenge of geriatric medicine. USA: OxfordUniversity Press, 1992.
15. Inouye SK, Studenski S, Tinetti ME, et al. Geriatric syndromes:clinical, research, and policy implications of a core geriatric concept.J Am Geriatr Soc 2007;55:780–91.
16. [No authors listed]. Core competencies for the care of older patients:recommendations of the American Geriatrics Society. The EducationCommittee Writing Group of the American Geriatrics Society. AcadMed 2000;75:252–5.
17. Acute Care Toolkit 3. Acute medical care for frail older people.London: Royal College of Physicians, 2012.
18. Anpalahan M, Gibson SJ. Geriatric syndromes as predictors ofadverse outcomes of hospitalization. Intern Med J 2008;38:16–23.
19. Clegg A, Young J, Iliffe S, et al. Frailty in elderly people. Lancet2013;381:752–62.
20. Banerjee J, Conroy S, Cooke MW. Quality care for older people withurgent and emergency care needs in UK emergency departments.Emerg Med J 2013;30:699–700.
21. HES Online: Hospital Episode Statistics. 2013. http://www.hscic.gov.uk/hes (accessed Nov 2014).
22. Health and social care information centre. Methodology to createprovider and CIP spells from HES APC data: 1–9, 2014. http://www.hscic.gov.uk/media/11859/Provider-Spells-Methodology/pdf/Spells_Methodology.pdf (accessed Nov 2014).
23. Bottle A, Aylin P. Comorbidity scores for administrative databenefited from adaptation to local coding and diagnostic practices.J Clin Epidemiol 2011;64:1426–33.
24. Lloyd P, Provost SM. The Health Care Data Guide: Learning fromData for Improvement. John Wiley & Sons October 2011:1–480.
25. Morley JE, Vellas B, van Kan GA, et al. Frailty consensus: a call toaction. J Am Med Dir Assoc 2013;14:392–7.
26. Fried LP, Ferrucci L, Darer J, et al. Untangling the concepts ofdisability, frailty, and comorbidity: implications for improved targetingand care. J Gerontol A Biol Sci Med Sci 2004;59:M255–63.
27. Theou O, Rockwood MR, Mitnitski A, et al. Disability andco-morbidity in relation to frailty: how much do they overlap? ArchGerontol Geriatr 2012;55:e1–8.
28. Rockwood K. What would make a definition of frailty successful?Age Ageing 2005;34:432–4.
29. Cesari M, Gambassi G, van Kan GA, et al. The frailty phenotypeand the frailty index: different instruments for different purposes. AgeAgeing 2014;43:10–12.
30. Blodgett J, Theou O, Kirkland S, et al. Frailty in NHANES:Comparing the frailty index and phenotype. Arch Gerontol Geriatr2015;60:464–70.
31. Young J, Hood C, Woolley R, et al. Report of the National Audit ofDementia Care in General Hospitals 2011. Royal College ofPsychiatrists, 2011.
32. Arora VM, McGory ML, Fung CH. Quality indicators forhospitalization and surgery in vulnerable elders. J Am Geriatr Soc2007;55(Suppl 2):S347–58.
33. Treml J, Husk J, Lowe D, et al. Falling Standards, Broken Promises.Report of the national audit of falls and bone health in older people2010. London: Royal College of Physicians, 2011.
34. Wagg A, Harari D, Husk J, et al. National Audit of Continence Care—Combined Organisational and Clinical Report. London: RoyalCollege of Physicians, 2010.
35. Rockwood K, Mitnitski A, Song X, et al. Long-term risks of death andinstitutionalization of elderly people in relation to deficit accumulationat age 70. J Am Geriatr Soc 2006;54:975–9.
36. Collard RM, Boter H, Schoevers RA, et al. Prevalence of frailty incommunity-dwelling older persons: a systematic review. J AmGeriatr Soc 2012;60:1487–92.
37. Santos-Eggimann B, Cuenoud P, Spagnoli J, et al. Prevalence offrailty in middle-aged and older community-dwelling Europeansliving in 10 countries. J Gerontol A Biol Sci Med Sci 2009;64:675–81.
38. Syddall H, Roberts HC, Evandrou M, et al. Prevalence andcorrelates of frailty among community-dwelling older men andwomen: findings from the Hertfordshire Cohort Study. Age Ageing2010;39:197–203.
Soong J, et al. BMJ Open 2015;5:e008456. doi:10.1136/bmjopen-2015-008456 9
Open Access
on 6 Septem
ber 2018 by guest. Protected by copyright.
http://bmjopen.bm
j.com/
BM
J Open: first published as 10.1136/bm
jopen-2015-008456 on 21 October 2015. D
ownloaded from

39. Hubbard RE, Lang IA, Llewellyn DJ, et al. Frailty, body mass index,and abdominal obesity in older people. J Gerontol A Biol Sci MedSci 2010;65:377–81.
40. Joosten E, Demuynck M, Detroyer E, et al. Prevalence of frailty andits ability to predict in hospital delirium, falls, and 6-month mortalityin hospitalized older patients. BMC Geriatr 2014;14:1.
41. Ensrud KE, Ewing SK, Taylor BC, et al. Comparison of 2 frailtyindexes for prediction of falls, disability, fractures, and death in olderwomen. Arch Intern Med 2008;168:382–9.
42. Purser JL, Kuchibhatla MN, Fillenbaum GG, et al. Identifying frailtyin hospitalized older adults with significant coronary artery disease.J Am Geriatr Soc 2006;54:1674–81.
43. Rockwood K, Stadnyk K, MacKnight C, et al. A brief clinicalinstrument to classify frailty in elderly people. Lancet1999;353:205–6.
44. Andela RM, Dijkstra A, Slaets JP, et al. Prevalence of frailty onclinical wards: description and implications. Int J Nurs Pract2010;16:14–19.
45. Steverink N, Slaets J, Schuurmans H, et al. Measuring frailty:developing and testing of the Groningen Frailty Indicator (GFI).Gerontologist 2001;41:236–7.
46. Ekerstad N, Swahn E, Janzon M, et al. Frailty is independentlyassociated with short-term outcomes for elderly patients withnon-ST-segment elevation myocardial infarction. Circulation2011;124:2397–404.
47. Rockwood K, Song X, MacKnight C, et al. A global clinical measureof fitness and frailty in elderly people. CMAJ 2005;173:489.
48. Evans SJ, Sayers M, Mitnitski A, et al. The risk of adverseoutcomes in hospitalized older patients in relation to a frailty indexbased on a comprehensive geriatric assessment. Age Ageing2014;43:127–32.
49. McCusker J, Bellavance F, Cardin S, et al. Detection of olderpeople at increased risk of adverse health outcomes after anemergency visit: the ISAR screening tool. J Am Geriatr Soc1999;47:1229–37.
50. Health and Social Care Information Centre. Anxiety: hospitaladmissions highest in women in their late 60s. URL: http://www.hscic.gov.uk/article/3916/Anxiety-hospital-admissions-highest-in-women-in-their-late-60s (accessed Nov 2014).
51. Searle SD, Mitnitski A, Gahbauer EA, et al. A standard procedure forcreating a frailty index. BMC Geriatr 2008;8:24.
52. Ni Mhaolain AM, Fan CW, Romero-Ortuno R, et al. Frailty,depression, and anxiety in later life. Int Psychogeriatr2012;24:1265–74.
53. Dent E, Hoogendijk EO. Psychosocial factors modify the associationof frailty with adverse outcomes: a prospective study of hospitalisedolder people. BMC Geriatr 2014;14:108.
54. Mezuk B, Edwards L, Lohman M, et al. Depression and frailtyin later life: a synthetic review. Int J Geriatr Psychiatry2012;27:879–92.
10 Soong J, et al. BMJ Open 2015;5:e008456. doi:10.1136/bmjopen-2015-008456
Open Access
on 6 Septem
ber 2018 by guest. Protected by copyright.
http://bmjopen.bm
j.com/
BM
J Open: first published as 10.1136/bm
jopen-2015-008456 on 21 October 2015. D
ownloaded from