one planet goals and guidance for communities and …...ultimate goal: everyone, everywhere leading...
TRANSCRIPT

1
One Planet Goals and Guidance for Communities and Destinations September 2016

2
Front cover image: Elmsbrook, North West Bicester ©A2Dominion Elmsbook is the exemplar phase of NW Bicester, the UKs first eco-town, led by developer A2Dominion
Contents
Section One: One Planet Living 3
What is One Planet Living and who is it for? 3Writing your One Planet Action Plan 6The four sections of your One Planet Action Plan 7Your One Planet Action Plan 8
Section Two: Goals and Guidance 9
Health and Happiness 10Equity and local economy 12Culture and community 14Land and nature 16Sustainable water 18Local and sustainable food 20Travel and transport 22Materials and products 24Zero waste 26Zero carbon energy 28
Appendix One: Notes on indicators 30
3
Section One: One Planet Living
4
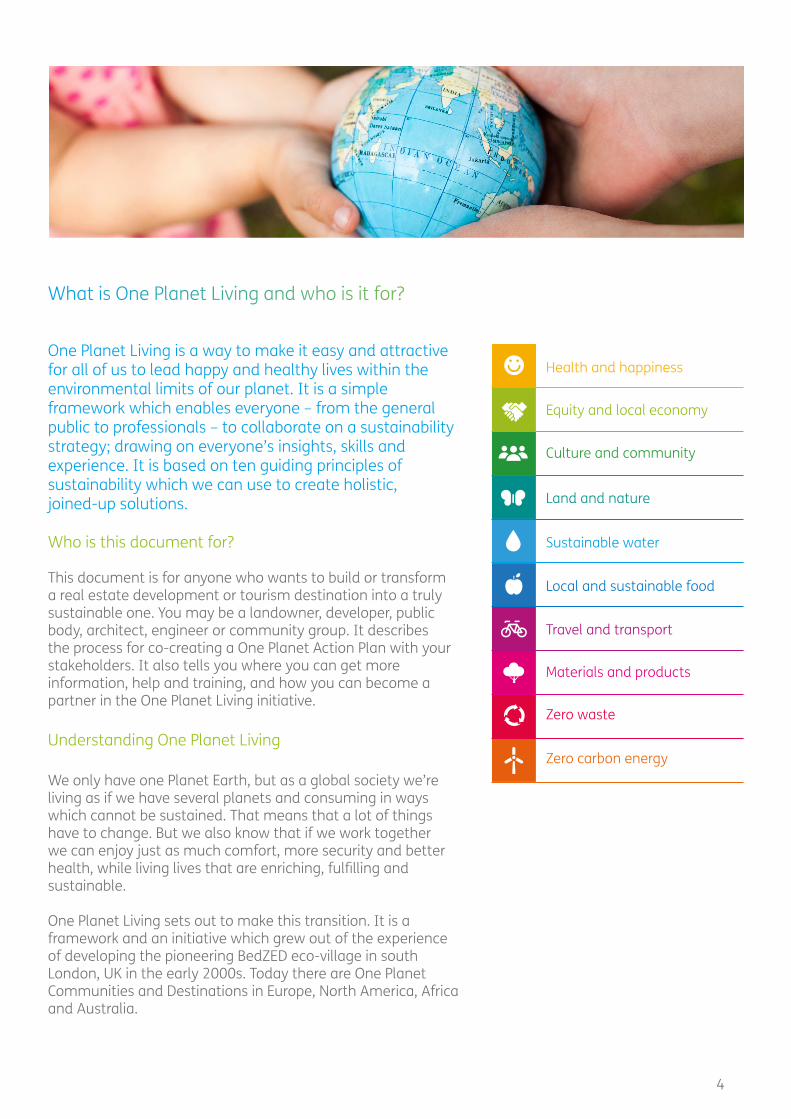
One Planet Living is a way to make it easy and attractive for all of us to lead happy and healthy lives within the environmental limits of our planet. It is a simple framework which enables everyone – from the general public to professionals – to collaborate on a sustainability strategy; drawing on everyone’s insights, skills and experience. It is based on ten guiding principles of sustainability which we can use to create holistic, joined-up solutions.
Who is this document for?
This document is for anyone who wants to build or transform a real estate development or tourism destination into a truly sustainable one. You may be a landowner, developer, public body, architect, engineer or community group. It describes the process for co-creating a One Planet Action Plan with your stakeholders. It also tells you where you can get more information, help and training, and how you can become a partner in the One Planet Living initiative.
Understanding One Planet Living
We only have one Planet Earth, but as a global society we’re living as if we have several planets and consuming in ways which cannot be sustained. That means that a lot of things have to change. But we also know that if we work together we can enjoy just as much comfort, more security and better health, while living lives that are enriching, fulfilling and sustainable.
One Planet Living sets out to make this transition. It is a framework and an initiative which grew out of the experience of developing the pioneering BedZED eco-village in south London, UK in the early 2000s. Today there are One Planet Communities and Destinations in Europe, North America, Africa and Australia.
What is One Planet Living and who is it for?
Health and happiness
Equity and local economy
Culture and community
Land and nature
Sustainable water
Local and sustainable food
Materials and products
Zero carbon energy
Travel and transport
Zero waste
5
One Planet Living uses two headline indicators of living sustainably on Planet Earth:
Ecological footprinting, which is a way of accounting for a wide range of our demands on the Earth’s productive land and sea. Carbon footprinting, which is derived from climate science. This measures C02 and other greenhouse gases emitted from human activity such as burning fossil fuels and agricultural practices.
Other social, financial and environmental factors are also important such as access to clean water, education, wealth distribution, economic activity and pollution. These are included in the ten One Planet Principles.
Ultimately, our impacts on the planet are the result of how we build communities, the types of products and services on offer, government policy and the choices we make as individuals. A One Planet Community or Destination recognises it has control over some of these impacts (eg through energy efficient design of the buildings or provision of a car-sharing scheme) and can influence others (eg personal choices by offering a good selection of healthy food).
Ecological footprinting
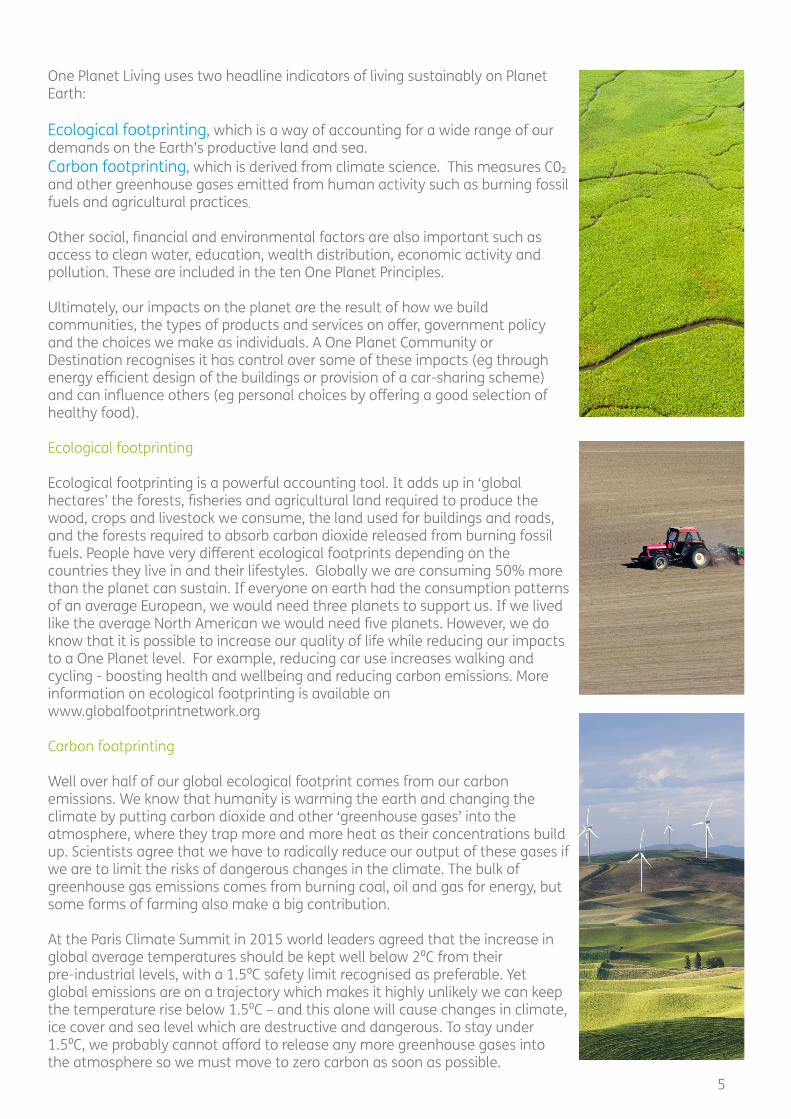
Ecological footprinting is a powerful accounting tool. It adds up in ‘global hectares’ the forests, fisheries and agricultural land required to produce the wood, crops and livestock we consume, the land used for buildings and roads, and the forests required to absorb carbon dioxide released from burning fossil fuels. People have very different ecological footprints depending on the countries they live in and their lifestyles. Globally we are consuming 50% more than the planet can sustain. If everyone on earth had the consumption patterns of an average European, we would need three planets to support us. If we lived like the average North American we would need five planets. However, we do know that it is possible to increase our quality of life while reducing our impacts to a One Planet level. For example, reducing car use increases walking and cycling - boosting health and wellbeing and reducing carbon emissions. More information on ecological footprinting is available on www.globalfootprintnetwork.org Carbon footprinting
Well over half of our global ecological footprint comes from our carbon emissions. We know that humanity is warming the earth and changing the climate by putting carbon dioxide and other ‘greenhouse gases’ into the atmosphere, where they trap more and more heat as their concentrations build up. Scientists agree that we have to radically reduce our output of these gases if we are to limit the risks of dangerous changes in the climate. The bulk of greenhouse gas emissions comes from burning coal, oil and gas for energy, but some forms of farming also make a big contribution.
At the Paris Climate Summit in 2015 world leaders agreed that the increase in global average temperatures should be kept well below 20C from their pre-industrial levels, with a 1.50C safety limit recognised as preferable. Yet global emissions are on a trajectory which makes it highly unlikely we can keep the temperature rise below 1.50C – and this alone will cause changes in climate, ice cover and sea level which are destructive and dangerous. To stay under 1.50C, we probably cannot afford to release any more greenhouse gases into the atmosphere so we must move to zero carbon as soon as possible.

6
Writing your One Planet Action Plan
At the core of One Planet Living is the One Planet Action Plan. This document is co-created by you and your stakeholders. It represents a response to the opportunities and challenges of One Planet Living, specific to the time and place of your project. The Action Plan is a dynamic document that can be modified and built on as the world and our knowledge change. It can be monitored, reported and reviewed periodically.
We encourage you to make your Action Plan public by publishing it on our collaborative platform when it goes live (www.oneplanet.net) so that we can share experience, learn from each other and crowdsource solutions. Our aim is to unlock our collective potential to tackle humanity’s greatest challenge – how to live happily and sustainably on our one planet.
One Planet Living is a commitment to a journey rather than a certification system. However, One Planet Communities and Destinations can work alongside, build on, or learn from standards and certification systems such as LEED, BREEAM, Green Star, Living Building Challenge and Well Building.
One Planet Communities and One Planet Destinations have a One Planet Action Plan covering:
1. Context: Future trends, opportunities and challenges 2. Visioning: One Planet lifestyles3. Assessing: Benchmarking analysis4. Planning and Implementing: Principle actions
The Action Plan is best created through one or more workshops involving the key stakeholders and contributors. It is an iterative process – for example where envisioning a One Planet lifestyle informs the Principle actions and vice versa. At the outset think about how people will live in or visit your development and how it will be operated. This may affect how you design and construct it.
Your One Planet Action Plan is just part of a process. Once you have written your One Planet Action Plan you need to implement it! We can help if you need. You can update it periodically, monitor implementation and report on progress. Share your Action Plan so you can learn with and from your peers.
ContextFuture Trends
VisioningOne Planet Lifestyles
AssessingBenchmarking
Analysis
Planning Principle Actions
Implementing
Monitoring
Reporting

7
The four sections of your One Planet Action Plan
1. Context Setting: Opportunities, challenges and future trends. This sets the context. It identifies the key local and global opportunities, challenges and future trends which will affect your development. These can include economic opportunities, impacts of climate change, an ageing population, the need for family housing or changes in income levels.
2. Visioning: One Planet lifestyles. This envisions how your development will make it easy and attractive for people to lead happy, healthy, sustainable lives – and how it will respond to the opportunities, challenges and future trends you identified.
Components include:
• ‘Day in the life’ of a cross-section of residents, workers or visitors, envisioning how they experience the development and how it has been designed to enable them to lead a happy and healthy One Planet lifestyle.
• A simple assessment of the ecological and carbon footprint of these lifestyles.• Key partners who you need to enrol to make your One Planet development a success, whether it be
your local government planning department or suppliers.
3. Assessing: Benchmarking analysis. If you have current plans or actions, or an existing process for developing a project, you may want to carry out a benchmark or gap analysis to identify which aspects of One Planet Living and its ten principles you are doing well on, and how much further you may need to go in your commitments.
4. Planning and Implementing: Principle actions. This section runs through in detail how you can apply all ten One Planet Principles comprehensively and coherently through your development at the design, construction and operational phases of its lifecycle.
For each principle consider:
• Goals – the key outcomes your development needs to achieve• Actions - addressing each principle at design, construction and operational phases• Monitoring – information which you will track to help you monitor implementation. This information
can be quantitative (metrics such as Key Performance Indicators measuring progress towards Targets) or qualitative (stories and images)
• Opportunities and barriers which you can take advantage of, or which you need to address
For each One Planet Principle, we have set Goals so that everyone engaging with One Planet Living can be headed in the same direction. These enable us all to see how we are contributing to the common and ultimate goal: everyone, everywhere leading happy and healthy lives within the environmental limits of our one planet.
Using the Goals as your guide, you have the complete freedom to create your own set of actions to rise to the challenge of One Planet Living. The Actions section in your Action Plan is the most important part. This is what you will actually do.
The One Planet Principles are all interconnected; many actions can be placed under more than one principle. For example, an action to reduce food waste could go under the Local and Sustainable FoodPrinciple or under ‘Zero Waste’. This is a good sign. The more connected your actions, the more joined-up your proposed solutions. We recommend placing each action under only one principle, but cross- referencing it to other principles where this is useful.

8
We have suggested some Indicators, Key Performance Indicators (KPIs) and Targets. Indicators enable you to collect useful information to track how you might be doing. KPIs are indicators which can be particularly significant and we have suggested some for each principle. You may set yourself targets associated with these indicators, but even without a target, an indicator can be extremely useful because it will indicate whether you are headed in the right direction. For example, you might want to track how much physical activity your residents or guests engage in but it might not be particularly useful to set a rigid target for this. Targets are specific measures of performance to be achieved by a specific time (eg obtain 100% of all energy supplies from renewable sources by June 2017).
You may want to use some of our suggested Indicators, KPIs or Targets or use your own which are particularly useful and meaningful for your Community or Destination. But bear in mind, sustainability isn’t just about measurement (Indicators, KPIs and Targets); it is as much about engaging people’s hearts as their minds. The human element is just as important. So gather stories, anecdotes and other qualitative data that arise throughout your development, to help understand and communicate your progress or learning, and to inspire others.
Remember – this is your One Planet Action Plan. You can set your own targets. However, if you want your Action Plan to be recognised for demonstrating leadership by Bioregional, it will need to contain a comprehensive and exemplary set of actions to promote the goals of each of the principles. You will need to set a Zero Carbon Energy target (100% renewable energy) by a reasonable date (depending on the context of your development).
Your One Planet Action Plan
The next section lays out the ten One Planet Principles and provides detail on the One Planet Goals and Guidance, Indicators, KPIs and Targets. We describe what these mean in practice and include some tips we have picked up from our experience and that of others who have been using the One Planet Living framework.
Your Action Plan needs to respond to each of the principles and describe what you want to achieve, how you will implement the actions and how you will monitor them. Good luck with creating your plan!

9Image Credit: Villages Nature Paris™
Section Two: Goals and Guidance

10
Health and HappinessEncouraging active, social, meaningful lives to promote good health and wellbeing.
One Planet Goals
Guidance
• To increase or support high levels of physical, social, mental and emotional health • To increase or support high levels of happiness and wellbeing
One Planet Communities and Destinations make it easy for all residents, workers or guests to keep healthy and active at all ages. They are places where residents feel part of a safe, inclusive, neighbourly and supportive community. Key determinants of health and happiness include diet, exercise, interpersonal relationships, meaningful work and involvement in community and civic life. They also include a safe environment, interaction with nature, greater equity, opportunities for spiritual and artistic practice, and shared values.
All these considerations can be used to inform the design, construction and operation of One Planet Communities and Destinations to improve health and happiness. Communities and destinations are designed for neighbourliness and social interaction. Buildings are designed for comfort in daylighting, temperature and ventilation and constructed using healthy materials, for example avoiding volatile organic compounds (VOCs). Public spaces are designed to be safe, neighbourly and free of cars, where people can meet, children can play and where greenery and nature are encouraged. There are pedestrian and cycle routes through the site as well as community and civic space. Space for physical activity is provided and made easily available. Community facilities and activities are selected to offer multiple benefits to physical and emotional health; for example, growing food can increase contentment as well as supporting a healthy diet. Happiness is support-ed by providing opportunities, for example, for sport, spiritual practice, mindfulness, meditation and yoga.
Top tip
Consider creating an Action Plan where there is at least one activity under each of the other principles which will positively increase health and happiness. Are there any actions in your plan which might decrease health and happiness, and if how can you reduce or eliminate the negative impact?

11
Indicators
• Percentage of physically active residents or employees• Percentage of residents free from obesity or malnutrition• Percentage of residents, workers or guests who engage in activities, such as
meditation or mindfulness, in order to improve their state of mind or mental health• Average extent to which people feel the things in their life are worthwhile• Proportion of residents with depression or anxiety• Daylight factors or similar metric for buildings• Percentage of residents who are satisfied with the (a) summer indoor air
temperature, (b) winter indoor air temperature, (c) ventilation and air quality, (d) noise, (e) natural daylight and (f) artificial daylight in their building
• Percentage of people who are satisfied with the local area as a place to live or visit; and/or percentage of employees satisfied with their place of work
• Percentage of products used which are VOC-free• Average local levels of air pollutants
KPIs
• Average satisfaction levels of residents, employees or guests• Percentage of residents or employees satisfied with their health
Possible targets
• Annually increasing or sustained high levels of reported average satisfaction levels of residents, employees or guests
Stories and images
Have people lost weight and become healthier, given up smoking or set up a new club or activities in the community facilities?
Do you have pictures of people enjoying themselves at great community event or street party?
Are there stories or images of things that are not going well but which you can improve upon?
Health and Happiness at Singita Serengeti
“Our biggest success has been training our team in One Planet Living. When we started about a year ago, we had no clue what it was all about. I remember the first training session - I could see my team members glaring at me as I painstakingly tried to explain! Fortunately I am eloquent in Kiswahili language so managed to explain in a language they could understand and give real examples from day to day life.
For instance after understanding what “health and happiness” meant, we have members of the team exercising every evening and even formed a soccer team!”
Wilson Owino, Lodge Manager Singita Sabora Tented Camp

12
Equity and local economyCreating safe, equitable places to live and work which support local prosperity and international fair trade.
One Planet Goals
Guidance
• To promote diversity and equality of opportunity across all abilities, gender, race, age and sexual orientation
• To create a vibrant and resilient economy where a significant proportion of money is spent locally
• To promote international trade that is conducted fairly and without exploitation
One Planet Communities and Destinations celebrate diversity and foster a sense of inclusion. They recognise the needs of local people, inlcuding elderly people, young people, people with disabilities, single people and families. The needs of low-income groups are considered whether it be through providing affordable housing or employment opportunities in the green economy. Consideration is given to reducing or avoiding very high levels of income and wealth inequalities, eg by providing affordable housing where required. A balanced economy is promoted with a range of income groups supported.
Employment created will be as accessible as possible to a wide cross-section of local people including disadvantaged groups. Where commercial or office space is available onsite, consideration is given to offering space for community groups, social enterprises, not-for-profits and local start-ups, for example through the provision of co-working space or hot-desking.
One Planet Communities and Destinations contribute to the local economy by considering local suppliers and contractors during construction and operations, and supporting them to offer apprenticeships, training and work experience opportunities.
International trade is promoted where this does not involve exploitation of people or the environment, for example by selecting certified Fairtrade or responsibly sourced products and working with suppliers that demonstrate concern about the social and environmental impacts of their supply chains.
Top Tip
Using your purchasing power to engage supply chains as these represent a huge opportunity to promote environmental and social progress. Consider encouraging your suppliers to adopt the ten One Planet Principles and start creating their own One Planet Action Plan. This will enable you to create your own ‘One Planet Economy’ or ‘One Planet Ecosystem’ to help improve your own performance.

13
Indicators
• Proportion of displaced existing residents in affordable housing that are allocated similar affordable housing within a 1 km radius
• Proportion of employers on site paying a living wage, or status as a living wage employer compared to a local benchmark
• Income and/or wealth range for top to bottom for residents, workers and/or guests• Multiplied local economic impact of direct economic value distributed (see notes); or
percentage of products and services used in construction which are sourced within locality (e.g. 10 km or 50km radius)
• Proportion of employees that are local (e.g. within a 10km radius)• Percentage of commercial or office space available to not-for-profits, social enterprises
and start-ups on a flexible or reduced rent basis• Number of new businesses created or attracted to the locality• Percentage of businesses on-site which are independently owned
KPIs
• Direct economic value generated and distributed during construction phase• Percentage of affordable housing provided or supported• Number of a) temporary and b) permanent full time jobs created as a direct result of
project• Percentage of products used, consumed or sold annually which are certified as fairly
traded
Possible targets • At least 25% of purchases by value to be made from local suppliers• Affordable housing target above typical local level, agreed in consultation with
stakeholders
Stories and images
Are there any personal stories to share about new jobs or training opportunities having been created with local people? Have any new businesses or social enterprises started – is there an image of an opening ceremony? Are more people shopping locally or purchasing fairly traded goods? Is there an image of a great new local product? Do you have a story about a previously disadvantaged person who has taken an opportunity provided and benefited themselves and the community?
North West Bicester - keeping money in the local economy
North West Bicester (NW Bicester), the UK’s first eco-town and a One Planet Community, has demonstrated strong engagement with ‘equity and local economy’. In April 2012 a Business Portal was launched on the NW Bicester website, giving businesses within a 50 mile radius the opportunity to register an interest to become involved in first-phase delivery. Lead developer A2Dominion prioritised local companies that were able to provide a ‘green’ service in the procurement process, with 79% of work packages let to local companies.

14
Culture and communityNurturing local identity and heritage, empowering communities and promoting a culture of sustainable living.
One Planet Goals
Guidance
• To foster a sense of place and belonging • To encourage active citizenship • To enhance local culture, heritage and sense of place • To nurture a new culture of sustainability
One Planet Communities and Destinations support a vibrant and active community and add value to existing and surrounding communities. They involve local people at an early stage through consultation and co-creation of the One Planet Action Plan. The development should be responsive to their needs, for example in housing, employment, education or training.
Community-focused design balances private space with public access. One Planet Communities and Destinations provide welcoming outdoor and indoor public space for people to come together and socialise, reducing crime and the fear of crime, supporting community cohesion, mental and emotional health. Spaces for the community to gather be-come focus points for neighbourly living. Models for collaborative living such as co-housing are considered.
To provide a sense of place, One Planet Communities and Destinations connect to the local cultural and natural heritage, for example by using traditional construction materials, public art, vernacular design or native planting.
In operation, One Planet Communities and Destinations actively nurture a sense of community. The community-focused design and construction provides the backdrop on which community-focused activities can be played out. Clear governance structure and property management systems are put in place, both incorporating One Planet Principles. The strength of the physical community is enhanced by creating a virtual community for the development, for example through social media groups.
Local heritage, culture and distinctiveness are celebrated through traditional arts and crafts markets, farmers’ markets or exhibitions. A sharing economy (or ‘collaborative consumption’) is facilitated via car-sharing, car clubs, tool libraries or promotion of sharing apps.
A new culture of sustainability is nurtured where people take responsibility and participate. One Planet Communities and Destinations include a training or education centre to support the culture of sustainability and understanding of environmental challenges and opportunities.

15
Possible indicators
• Percentage of people who borrow things and exchange favours with their neighbours• Percentage of people who have participated in community decision-making in the
past twelve months• Percentage of people who have volunteered in the last 12 months• Percentage of people who strongly feel they belong to their immediate neighbour-
hood• Percentage of people who feel safe walking alone in their local area after dark• Percentage of people who have attended or participated in the arts at least three
times in the past 12 months, or number of guests visiting a local cultural site• Number of community activities or events in the past twelve months• Number of people participating in community activities or events in the past twelve
months• Number and type of local cultural and heritage features adopted
Top tips
Think about giving residents or guests the opportunity to create their own balance between private and community life. Search for opportunities to reach out, learn from, influence and co-create solutions with surrounding communities.
Look for inidcators on accessibility of amenities under the travel and transport section.
KPIs
• Average number of neighbours known by name• Percentage of inhabitants agreeing that people from different backgrounds get on
well in local area• Percentages of residents or guests, and local business / organisation managers, and
employees familiar with, or inducted in, the concept and principles One Planet Living
Possible targets
• Four community events to be held each year• All residents, employees or guests introduced to concept of One Planet Living
Stories and images
Have any community-led groups or activities started and what was the story behind them? Have there been any intergenerational activities or events where young people have been learning from older people, and vice versa? Can you run a mini-competition to find the best image which conveys that the place is becoming special? Has anyone suddenly unearthed a creative talent which had previously remained hidden? Are there any examples of an emerging culture of sustainability?

16
Land and natureProtecting and restoring land and marine systems for the benefit of people and wildlife.
One Planet Goals
Guidance
• To ensure a positive contribution to local biodiversity• To maximise carbon sequestration in the soil and biomass• To maximise the synergies between agriculture, forestry, biodiversity and carbon storage• To enhance ‘ecosystem services’ such as providing clean water and clean air• To engage people in recognising the value of nature including its value to human health
The built environment often has a negative impact on natural systems and wildlife. Particularly with the rapid expansion of cities, land which is providing essential services to people – such as food, water and protection from flooding or drought – is being lost, as well contributing to the loss of biodiversity.
One Planet Communities and Destinations protect and restore natural systems for the benefit of people, local wildlife and the biosphere (the living part of our planet). How land is managed can greatly influence how much carbon it can store, or sequester, as biomass (eg growing trees) or as organic matter in the soil. The link between agriculture or forestry, biodiversity and carbon storage is a very important one. There are many opportunities to ensure that how we manage land for our needs for food or timber can also benefit wildlife and increase the potential for carbon dioxide to be absorbed from the atmosphere.
One Planet Communities and Destinations are not built directly on protected or ecologically sensitive sites. Wherever possible they are built on previously developed land (brownfield sites) or degraded land (eg former quarry sites). Key species of plants and animals which are locally, nationally or internationally significant are identified and plans put in place to enable them to thrive. Onsite ‘ecosystems services’ – services which nature provides us – such as soil building, clean water, clean air, preventing flooding or overheating in cities (heat island effect), provision of food and natural materials, and cultural and recreational services are identified and maintained or enhanced.
When building on green sites, One Planet Communities and Destinations aim to create as little damage as possible to existing natural value. They are also designed to increase the natural value after development, for example by providing a net benefit to wildlife, coastal ecosystems and freshwater management. Planting schemes benefit local wildlife and avoid invasive species.

17
Indicators
• Numbers of key species found in the local area (such as plant or bird species)• Percentage of new construction built on previously developed land• Percentage of previously developed land returned to agriculture or natural habitat• Scores from biodiversity impact assessment• Measure of capacity of land to absorb carbon, or other ‘ecosystem’ service such as
water management
Top tips
Evidence suggests that contact with nature is good for mental health and will ultimately increase the economic productivity and resilience of your development.
Further indicators on food growing are under ‘local and sustainable food’ and a further indicator on flood risk management is under ‘sustainable water’
KPIs
• Percentage of land area that has functional green surfaces (performing at least two functions such as water management, recreation, biodiversity, food growing, carbon storage, or cooling)
Possible targets
• Aim for the number of natural species recorded onsite to increase after development compared to before
• Aim for the carbon-storing ability of land to be higher after development than before
Stories and images
Has anyone joined a local conservation group or started a conservation volunteering group onsite? Can residents and guests collect a photo library of wildlife seen onsite? Are people more aware of wider conservation issues and their impacts – have any residents/visitors switched to buying peat-free compost?
Opportunities for education on the value of land and nature are integrated in operations, eg via activities such as talks, tree planting and making nest boxes for birds. One Planet Communities and Destinations also support biodiversity offsite by identifying nature reserves nearby and promoting them to residents or guests.
Products and materials that are detrimental to natural habitats are avoided, such as avoiding timber which is not certified as sustainable, or using compost for new planting which includes peat extracted from threatened and high-value peat bogs.

18
Sustainable waterUsing water efficiently, protecting local water resources and reducing flooding and drought
One Planet Goals
Guidance
• For everyone to have access to clean drinking water• To use water efficiently and return it clean to the environment• To contribute to sustainable water management and flood risk mitigation in the surrounding
area
Water is a very local issue and so demands solutions specific to the particular location. In many parts of the world, clean water is not an abundant resource available to everyone. As climate change occurs and the earth’s population increases, it is likely that even more areas will become ‘water-stressed’ or prone to flooding. The process of storing, treating and transporting water has a wide range of environmental impacts and a carbon footprint, even in water-rich areas, so it should always be used efficiently. There may be a case for recycling greywater onsite, but only provided there is a clear net environmental benefit, such as reducing water consumption in an area of water stress.
Fittings and appliances such as taps, toilets, showers and washing machines should be water-efficient. In water-poor or water-stressed areas or during dry seasons, consider collecting and using rainwater – especially for flushing toilets and/or irrigation. Design the landscape to support water management in the wider area, whether by mitigating flooding (eg through ‘sustainable urban drainage’ or green roofs) or avoiding drought (eg through swales and retention ponds).
Consider how you can help people use water wisely during operations through information, education, encouraging behaviour change and creating a culture of sustainable living. Set water consumption targets based on good local practice and alert people to their consumption – eg via messaging with utility bills or feeding back site-wide figures.
Top tip
Water management is a very local issue so examine local challenges and opportunities in order to understand how to get the best solutions and results.
19
Indicators
• Ratio of impermeable to permeable area that accommodates stormwater infiltration• Percentage of site area used for rainwater harvesting• Percentage of site that is conserved as wetland or aquatic habitat (e.g. ponds,
streams)• Percentage of waste water that is recycled onsite• Percentage of land planted with drought resistant species
KPIs
• Average per capita potable water consumption for residents (litres / year) or guests (litres / night)
Possible targets
• Selected on very local basis, e.g. water use of no more than 100 litres/person/day
Stories and images
Has anyone changed their planting and irrigation system, or installed their own rainwater harvesting equipment? Are residents engaged in maintaining and enhancing the site’s water features, like retention ponds, and enjoying them?
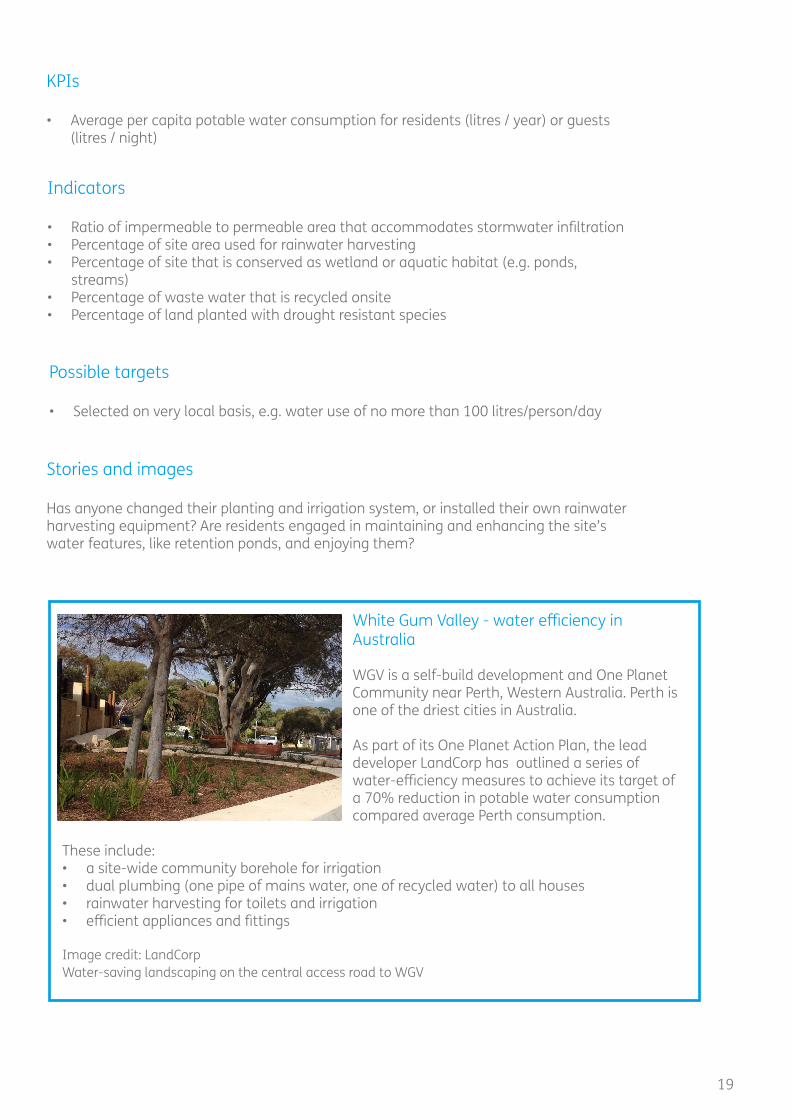
White Gum Valley - water efficiency in Australia
WGV is a self-build development and One Planet Community near Perth, Western Australia. Perth is one of the driest cities in Australia.
As part of its One Planet Action Plan, the lead developer LandCorp has outlined a series of water-efficiency measures to achieve its target of a 70% reduction in potable water consumption compared average Perth consumption.
These include:• a site-wide community borehole for irrigation• dual plumbing (one pipe of mains water, one of recycled water) to all houses• rainwater harvesting for toilets and irrigation• efficient appliances and fittings
Image credit: LandCorpWater-saving landscaping on the central access road to WGV

20
Local and sustainable foodPromoting sustainable, humane farming and healthy diets which are high in local, seasonal, organic food and vegetable protein.
One Planet Goals
Guidance
• To make it easy and attractive for people to enjoy fresh, local, seasonal, healthy produce• To promote diets high in vegetable protein• To promote sustainable farming which supports biodiversity and builds soil • To promote humane farming • To reduce or eliminate food waste
Food and food growing has a huge impact on a range of issues including physical and mental health, culture, heritage, climate change, biodiversity and the local economy. It represents about one quarter of our ecological footprint.
Obesity levels in developed and emerging countries are rising and high levels of meat consumption, in particular, red meat, are associated with a range of poor health outcomes including cancer. The greenhouse gas emissions from global meat and dairy production are as large as emissions from transport. Natural habitats are being lost as cropland and grazing land expand, with increased meat and dairy production mostly to blame.
One Planet Communities and Destinations support a food culture which is healthy and sustains wildlife-friendly agriculture; conserving and building soils to absorb carbon dioxide.
When designing a One Planet Community or Destination, consider space for farmers’ markets and for people to grow food, edible landscaping and community orchards. Engaging in horticulture promotes mental health, so even in dense urban areas consider providing mini-allotments and window-boxes.
During operations, encourage or require shops, restaurants and cafes to offer local, sustainable, healthy food and vegetarian or low-meat options – or to create their own One Planet Action Plans. Where meat, poultry and fish are served, encourage smaller quantities which are high-quality, humanely raised and sustainably produced or harvested. Consider banning the sale of sugary drinks. Celebrate a culture of healthy and sustainable eating through events, information and education.
Food can be a major source of food waste and packaging waste. Think about ways to reduce food waste, perhaps by finding ways to sell at low cost or donate perishable food at the end of the day, and reduce food packaging, for example by selling bulk grains and cereals.
Top tip
Food can be a great way to support local prosperity. Local food mapping can enable you to identify and link with local producers.

21
Indicators
• Percentage of local catering establishments or shops on-site that offer (a) vegetarian or vegan food (b) sustainable fish, (c) local and/or seasonal and/or organic fruit and vegetables, (d) ethical meat, eggs and dairy and (e) fairtrade-certified products
• Percentage of residents who check packaging for (a) vegetarian or vegan food (b) sustainable fish, (c) local and/or seasonal and/or organic fruit and vegetables, (d) ethical meat, eggs and dairy and (e) fairtrade-certified products
• Percentages of people who are (a) mostly vegan, (b) mostly vegetarian or (c) meat-eaters. For meat-eaters: average number of meals per week which include meat
• Estimated emissions from diets (kgCO2e/person/yr or global hectares/person/year)• Number of edible fruit-bearing trees and shrubs planted onsite• Food waste per person (per resident per annum or per guest per night), and
percentage being composted• Survey catering facilities for proportions of vegan, vegetarian and meat-based main
meal options• Catering facilities report on any policies relating to (a) vegetarian or vegan food, (b)
sustainable fish, (c) local and/or seasonal and/or organic fruit and vegetables, (d) ethical meat, eggs and dairy and (e) fairtrade-certified products
• Percentage of sales of sugary foods and drinks compared to healthier products
Stories and images
Has anyone lost weight by changing their diet to a more healthy one? Is anyone buying more organic or free-range food, and if so why? Do you have any great pictures of people enjoying themselves at your farmers’ market?
KPIs
• Food growing space (m2/person)• Percentage of residents gardening at least once per month (a) for food and (b) in
general• Percentage of residents who regularly choose (a) vegetarian or vegan food, (b)
sustainable fish, (c) local and/or seasonal and/or organic fruit and vegetables, (d) ethical meat, eggs and dairy and (e) fairtrade-certified products
Possible targets
• Annual increase in proportion of people checking packaging for ethical and sustainable food
• Establishment of ethical and sustainable procurement policies covering all food and beverage categories
• 50% of food used, consumed or sold by value or weight to be from local sources (eg 50km radius)

22
Travel and transportReducing the need to travel, encouraging walking, cycling and low-carbon transport.
One Planet Goals
Guidance
• To reduce car dependence and the need for daily travel• To make it easy and attractive for people to walk and cycle • To promote car-sharing (including car clubs) and public transport• To promote low/zero-carbon vehicles including electric cars• To raise awareness of the impacts of, and promote alternatives to, air travel
An overly car-dependent society contributes to carbon emissions and air pollution, takes up valuable land for roads, reduces the attractiveness and safety of the public realm and promotes obesity and respiratory illness. In many cities, commuting is one of the main contributors to reported unhappiness. Communities and destinations which avoid car domination are generally healthier and more neighbourly and attractive.
Envision your One Planet Community or Destination as a place where people can walk and cycle easily and where it is easier to live without a car. Consider the proximity or provision of local services such as schools, healthcare, business districts, shops and leisure facilities. Onsite facilities will complement existing local facilities as appropriate and are likely to include home and community workspaces. Neighbourhoods will be attractive and accessible, making walking and cycling the most convenient mode of transport.
Having reduced the need to travel, create a green transport plan including access to wider pedestrian and cycle networks, public transport nodes, car clubs and car-sharing. Make bicycle storage easy and safe. Promote low/zero-carbon vehicles such as electric vehicles, for example by installing electric charging points. Consider ways to make information on public transport and travel options easily available to people, as well as providing alternatives to air travel.
The largest environmental impact of Destinations is often the carbon footprint of people travelling to and from the site. Incentivise travelling by low-carbon modes of transport such as taking the train or car-sharing. Consider getting visitors and guests to offset their aviation carbon emissions, or to favour airlines which have set themselves goals for reducing greenhouse gas emissions or are committed to greener fuels such as sustainable biofuels.
Top tip
Cars connect people over long distances but disconnect us from our neighbours and reduce neighbourliness. Provide mobility while reducing car ownership and use.

23
Indicators
• Percentage of commuters using alternatives to single occupant vehicles• Percentage of people within 0.5km of public transit running at least every 20 minutes• Annual per capita transport CO2 emission (kg CO2e/person/year (or per bed night for
destinations)• Percentage of users within a 15 minute journey from key amenities via (a) walking or
public transport journey and (b) bike• Number of cars per person or per household• Percentage of vehicles which are electric or low/zero carbon (eg hybrid or biogas
powered)• Percentage of development land which is car-free – ie not linked by roads for cars and
without parking next to homes
Stories and images
What is the personal story behind someone who is walking or cycling more?Has anyone got rid of a car; how do they feel about it? Are there images of children playing in the car-free streets?
KPIs
• Number of cars per person or per household• Carbon emissions from travel (kgCO2e/person/yr)• Percentage of local journeys travelled by different modes of transport (walking,
cycling, car, bus, train, metro)
Possible targets
• 50% electric vehicles by 2020• 90% of journeys less than one mile completed by walking or cycling• All users within a fifteen minute walk or public transport journey from key amenities,
including a primary and secondary school, a food store and a GP surgery• Car ownership no more than 0.5 cars per household
BedZED - designed for people, not cars
BedZED was designed to encourage its residents to use greener forms of transport, with just 0.6 car parking spaces per home, a car club, excellent public transport links and plenty of bike storage. One estimate suggests the transport carbon footprint of BedZED’s residents is half the UK average. The community benefits of this are apparent - children play happily in the pedestrianised streets and traffic-free outdoor space encourages neigbourliness. A survey in 2007 found that the sense of community was the most-liked aspect of the development.

24
Materials and productsUsing materials from sustainable sources and promoting products which helppeople reduce consumption.
One Planet Goals
Guidance
• To promote sustainable living by making it easy to share and reduce consumption of natural materials
• To carefully consider every material and product and select them for their positive social and environmental benefit or for reducing negative impact
• To promote materials and products that are not toxic to humans or wildlife at any stage in their lifecycle, from raw material through to manufacturing, use and end-of-life
One Planet Communities and Destinations make it easy for people to improve their quality of life while reducing their environmental impact. They support a circular economy and a collaborative, sharing economy. They prioritise materials and products with a low environmental impact across their lifecycle, and promote those which have positive social and environmental impacts, such as sustainable timber which stores carbon.
Materials and products are considered over the whole lifecycle. Consider length of life, sustainability of harvesting or production, local and reclaimed content. Consider the pros and cons of composite materials with extensive manufacturing requirements which may also be hard to recycle compared to simple natural materials.
In construction, embodied carbon is a key indicator and the opportunity to lock up carbon through use of sustainably harvested timber and other bio-materials such as straw bales should be considered. High-impact or polluting materials, such as PVC and high VOC paints are avoided. Materials can also be conserved by creatively designing out conventional features such as suspended ceilings and reducing the areas of roads, parking and paved areas.
In operations, strategies are put in place to enable residents to reduce wasteful consumption and consume responsibly. A culture of sharing and swapping is nurtured through community facilities and services (such as tool and toy libraries), as well as via apps, online tools and social media, such as a Facebook page for the site. All retailers and service providers with premises onsite are engaged in sustainability and encouraged or required to put in place their own sustainable procurement or One Planet Action Plan.
Top tip
Use your purchasing power to transform your local economy. Create a sustainable procurement policy to drive demand for low impact products and materials.

25
Indicators
• Percentage (by volume or weight) of the road construction material that is locally reclaimed or constituted from recycled material
• Percentage (by volume or weight) of the construction materials for buildings achieving an A+ or A rating in BREEAM’s Green Guide to Specification, or which are local reclaimed materials (from within 100km)
• Proportion of timber or wood products reclaimed, reused or from a certified sustainable source
• Measure of success of community initiatives for sharing, selling, gifting or refurbishment of used durable goods, such as share shops, freecycle sites or intranets, and local charities (e.g. adverts listed, items donated)
• Percentage of products used, consumed or sold by weight or value duing operation which are either re-used or recycled
• Percentage of products used, consumed or sold by weight or value duing operation which are locally sourced (eg 50km radius)
Possible targets
• 100% of timber or wood products reclaimed, reused or from a certified sustainable source
Stories and images
Are there any community-sharing initiatives – of tools, books, toys? Are there any new local repair initiatives? Has anyone become more aware of the impact of their resource consumption? Has a reclaimed material been used creatively in construction?
KPIs
• Estimated embodied carbon of buildings (Kg CO2e/m2) annualised over the anticipated lifespan of the buildings (eg. 60 years)
Villages Nature Paris - responsible sourcing and reducing carbon
Villages Nature Paris is being developed by Euro Disney and Groupe Pierre & Vacances Center Parcs. Its first phase comprises 914 holiday homes and is expected to attract 1 million visitors a year upon opening in early 2017.
It is is taking a very proactive approach to reducing and reporting on embodied energy and is on track to meet its 20% reduction in embodied carbon. Low-carbon concrete was used in the construction of the Aqualagoon and residential units.
All excavation material has been reused onsite and the low-impact tourism project has also met its target of 100% certified timber use. Felled trees have been repurposed for exterior furniture.

26
Zero wasteReducing consumption, re-using and recycling to achieve zero waste and zero pollution.
One Planet Goals
Guidance
• To reduce wasteful consumption • To maximise upcycling, reuse and recycling• To aim for zero waste to landfill
Waste can be considered a resource and can be part of the circular economy, so a One Planet Community or Destination is designed around the waste hierarchy (with the highest priority at the base of the triangle):
Design, construct and operate for a healthy and happy life where wasteful consumption is reduced and there is no waste.
Think about reducing waste through careful design such as using modular forms or waste-reducing construction methods (eg offsite manufacture and methods that allow easy deconstruction at end-of-life). If there are existing buildings onsite which need to demolished, undertake an audit to identify what can be maintained, reused or recycled onsite.
Plan for zero waste construction with an effective construction Site Waste Management Plan. In operation, property management promotes the avoidance of wasteful consumption and high levels of resource effi-ciency.

27
Top tip
Think about waste as a resource.
Indicators
• Waste generated per person per year (tonnes/person/year) or per guest (kg/guest/night)
• Annual total waste generated by the community or destination (tonnes)• Estimated total waste generated during construction (tonnes)• Total quantity and percentage of construction waste sent for reuse, recycling, com-
posting or energy-from-waste recovery (tonnes)• Percentage of food waste generated• Percentage of food waste donated or composted
Stories and images
Are there any local composting initiatives? Are there any images of residents or guests having fun with craft activities using recycled materials?
KPIs
• Percentage of waste diverted (sent for reuse, recycling or composting) in a given year (with and without energy-from-waste recovery)
Possible targets
• Zero construction waste sent to landfill• At least 70% recycling or composting rates in operation• No more than 2% waste to landfill in operation
One Planet Communities and Destinations foster a culture of sharing, upcycling, reuse and enable closed-loop recycling of products.
An energy-from-waste plant must not reduce recycling rates to below 70% and must be operated to the highest standards to avoid air pollution. Wherever possible, heat is recovered, for example for industrial processes, horticulture or district heating.

28
Zero carbon energyMaking buildings energy efficient and supplying all energy with renewables.
One Planet Goals
Guidance
• Buildings are energy efficient compared to a stated local or national benchmark or a recognised standard
• 100% of energy consumed is supplied by non-polluting renewable energy generated onsite or offsite.
All buildings in a One Planet Community are designed to be energy efficient to stated local sector-specific best practice standards, preferentially using passive methods. They are benchmarked or certified against a specified green building standard such as LEED, BREEAM or Green Star, or a local benchmark. One Planet Communities score highly against these standards. The One Planet Principles are used to apply the standards flexibly to find the best solution for each individual project.
Having made the buildings energy efficient, all the buildings in a One Planet Community run on renewable energy (‘net zero carbon’) from a combination of onsite and offsite sources. Where this is not possible from day one, explain why, and put in place a strategy and set a date for achieving Zero Carbon.
One Planet Communities support a long-term strategy to create a locally resilient grid, decarbonise the electricity grid and avoid transmission losses. Therefore One Planet Communities and Destinations first look to generate renewable energy onsite or near site, taking into account a range of factors including payback periods, competing uses (such as rooftop gardens competing with photovoltaics), local air pollution (such as emissions from biomass in urban areas), and the opportunity to educate or reinforce a culture of sustainability (eg through clearly visible solar panels). Onsite devices and equipment which directly consume fossil fuels, such as gas boilers and diesel generators, are installed only as a back-up or as a short-term transitional strategy.
Energy not generated onsite is supplied by renewable energy gener-ated offsite. This can be via various means such as a power purchase agreement, or ownership or investment in renewable energy generation offsite. Power purchase agreements need to be robust and ensure 100% renewable energy guarantee, eg via Renewable Energy Guarantee of Origin. Energy supply companies supplying 100% renewables, or a high percentage of renewables, are preferred to support an overall increase in renewable generation. Energy-from-waste may form part of the zero waste strategy provided it does not drive recycling rates below 70% and employs international best practice on operations and emissions.
Nuclear power is a low-carbon energy source, but it is not renewable, so does not count towards the Zero Carbon target for One Planet Living.Mechanisms such as a Community Energy Services Company (ESCo) or
29
Indicators
• Percentage of annual energy consumed which comes from renewable sources, on and off site, by energy type
• Annual energy consumption, by energy type, for residential buildings (kWh/ person/year and kWh/m2/year), or per guest (kWh/guest/night)
• Annual energy consumption by area for non-residential buildings (kWh/m2/year)• An indicator on the embodied energy of buildings is under ‘materials and products’
KPIs
• Greenhouse gas emissions from residential buildings compared to baseline (kgCO2e/person/year and kgCO2e/m2/year), or per guest (kgCO2e/guest/night)
• Greenhouse gas emissions from non-residential buildings compared to baseline (kgCO2e/m2/year)
Possible targets
• 100% renewable energy from day one of operation of a new community or destination100% renewable energy for an existing building by 2018
• 50% of annual demand in operation generated from on-site renewable energy• 100% of energy consumed in construction to be from renewable energy
Stories and images
Have people noticed lower energy bills? Is anyone showing pride in having net-zero emissions? Is there a greater awareness of energy use? Are there images of people visiting the site to learn more?
Energy Cooperative are considered to enhance local ownership and support a resilient and prosperous local economy.
Energy management, monitoring and feedback systems are used to support residents, workers and visi-tors and to encourage behaviour change.
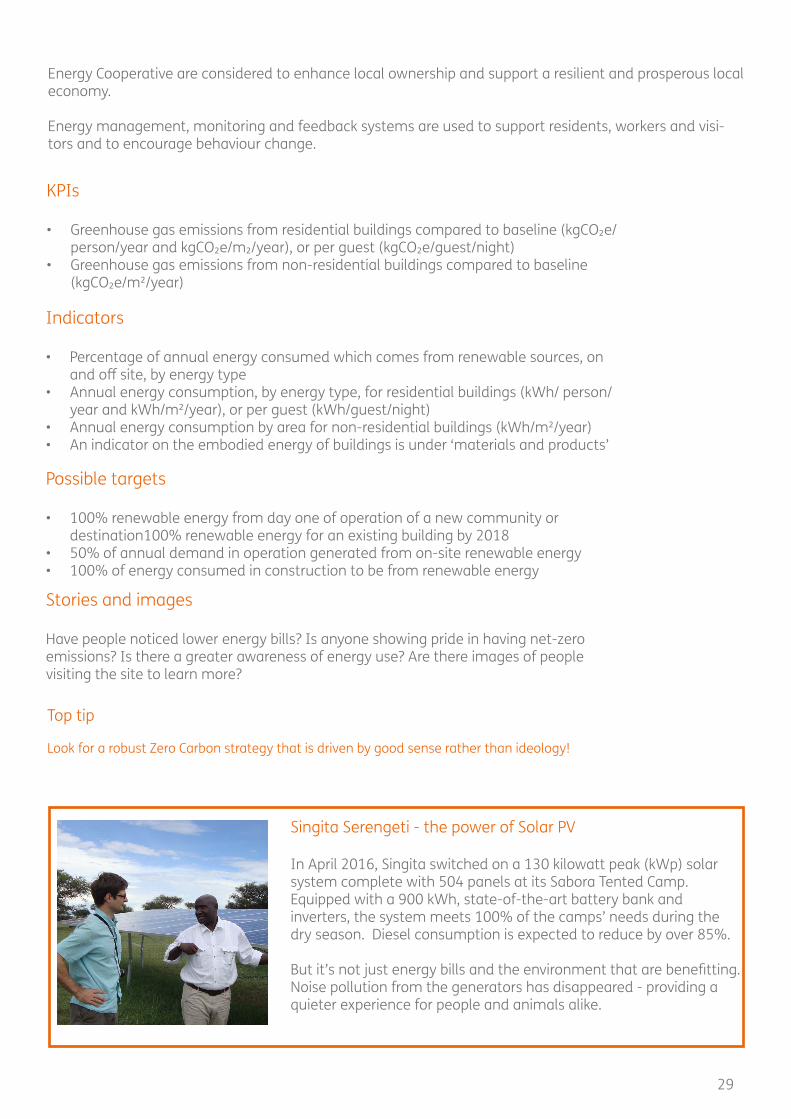
Singita Serengeti - the power of Solar PV
In April 2016, Singita switched on a 130 kilowatt peak (kWp) solar system complete with 504 panels at its Sabora Tented Camp. Equipped with a 900 kWh, state-of-the-art battery bank and inverters, the system meets 100% of the camps’ needs during the dry season. Diesel consumption is expected to reduce by over 85%.
But it’s not just energy bills and the environment that are benefitting. Noise pollution from the generators has disappeared - providing a quieter experience for people and animals alike.
Top tip
Look for a robust Zero Carbon strategy that is driven by good sense rather than ideology!

30
Health and happiness
• Average satisfaction levels of residents, employees or guests. Notes: Data from surveys. Possible survey question: how satisfied are you with your life nowadays? (Scale: where 0 is “not at all” and 10 is “completely ”.) To establish a baseline, find a similar national statistic available at the local level (this one is taken from the UK Annual Popula-tion Survey).
• Percentage of residents or employees satisfied with their health. Notes. Data from surveys. Possible survey ques-tion: how satisfied are you with your health? (Scale: 1, very dissatisfied / 2, dissatisfied / 3, neither satisfied nor dissatisfied / 4, satisfied / 5, very satisfied.) Based on the World Health Organisation (WHO) Quality of Life survey.
• Percentage of physically active residents or employees. Notes: Data from surveys. For the UK, local authority baselines available from Public Health Profiles. Based on UK Chief Medical Officer guidelines of at least 150 min-utes of moderate intensity activity, or 75 minutes of vigorous activity, per week.
• Percentage of residents free from obesity or malnutrition. Notes: Data may be collected from local government statistics as this may be too sensitive to include in a general survey. This measure is more appropriate for larger scales, where availabile public health data is closely matched to the area under consideration.
• Percentage of residents, workers or guests who engage in activities in order to improve their state of mind or mental health. Notes: data can be collected via a survey. Activities are self-defined, but examples include medita-tion, mindfulness, therapies or other practices aimed at personal development and mental wellbeing.
• Average extent to which people feel the things in their life are worthwhile. Notes: Data can be collected via surveys. Possible survey question: to what extent do you feel the things you do in your life are worthwhile? (Scale: where 0 is “not at all” and 10 is “completely”; or 0 is “not at all” and 5 is “completely”). To establish a baseline, find a similar national statistic available at the local level (this one is taken from the UK Annual Population Survey).
• Proportion of residents with depression or anxiety. Notes: Data may be available from local government statistics (this may be too sensitive to include in a survey). This measure is more appropriate for larger scales, where availa-bile data is closely matched to the area under sconsideration.
• Percentage of residents who are satisfied with the (a) summer indoor air temperature, etc. Notes: data can be collected via survey. Possible survey question: how would you describe the summer indoor air temperature, etc. (Scale: from 1 to 5, with 1 being very unsatisfactory to 5 being very satisfactory).
• Percentage of people who are satisfied with the local area as a place to live or visit; and/or percentage of employ-ees satisfied with their place of work. Notes: Data from survey. Possible survey question: Overall, how satisfied or dissatisfied are you with your local area as a place to live / organisation as a place to work? (Scale: Very satisfied / fairly satisfied / neither satisfied nor dissatisfied / fairly dissatisfied / very dissatisfied. “Satisfied” = very satisfied / fairly satisfied). To establish a baseline, find a similar national statistic available at the local level (this one is taken from the UK Community Life Survey).
• Percentage of products used which are VOC-free. Data from project accounts.Percentage of all products by num-ber or value which are VOC free. Alternatively, list or number of products which contain VOCs.
• Average local levels of air pollutants. Notes: Data obtained through monitoring. Monitor relevant pollutants from NOx, SOx, particulate matter (PM10 and PM2.5) and ozone. Check against WHO-recommended levels compared to baseline in surrounding areas.
Equity and local economy
• Number of a) temporary and b) permanent full time jobs created as a direct result of project. Notes: Data from plans and management teams.
• Percentage of affordable housing provided. Notes: Data from plans. Adapt according to local definition of afforda-ble housing. Possible cateogories include: social rented (publicly owned), affordable rented (with rents capped at a proportion of the local market rent) or intermediate housing (houses for sale and rent at rents capped as a propor-tion of local market rent, e.g. under shared equity).
• Proportion of displaced existing residents in affordable housing that are allocated similar affordable housing with-in a 1 km radius. Notes: Gauge information from local government.
• Proportion of employers on site paying a living wage. Notes: Data can be collected via surveys. More information available from the Living Wage Foundation.
• Direct economic value generated and distributed ((EVG&D) during construction phase. Notes: Data from project accounts. One approach is the EVG&D from the Global Reporting Initiative, reported on an accruals basis. Report direct economic value generated (revenues); economic value distributed (operating costs / employee wages and benefits / payments to providers of capital / payments to government / community investments); and economic
Appendix OneNotes on indicators

31
value retained (calculated as ‘Direct economic value generated’ less ‘Economic value distributed’). Guidance notes available in the ‘GRI G4 Implementation Manual’, pp. 69-70.
• Multiplied local economic impact of direct economic value distributed. Notes: Possible approach is to use the LM3 local multiplier tool. For a brief overview see see www.proveandimprove.org. For detailed guidance see the NEF’s ‘The Money Trail’
• Percentage of products and services used in construction which are sourced within locality (e.g. 10 km, 50kn, 100 km radius). Notes: Estimate from accounts on accruals basis.
• Proportion of employees that are local (e.g. within a 10km radius). Notes: Data from management teams. • Percentage of commercial or office space available to not-for-profits, social enterprises and start-ups on a flexible
or reduced rent basis. Notes: Data from plans and management teams. • Number of new businesses created or attracted to the locality. Notes: Data from surveys. Survey as to whether
the new development was a material or deciding factor in the decision to establish / locate there. • Percentage of businesses on-site which are independently owned. Notes: Data can be collected via surveys or
management team.
Culture and Community • Average number of neighbours known by name. Notes: Data from surveys. Possible survey question: how many
neighbours in the local area can you name? Local area defined as whichever is bigger: “the new development, or the street you live in and the streets nearby”. An alternative is the ‘percentage of people who regularly stop and talk with people in neighbourhood’. Possible survey question: To what extent do you agree or disagree with the following statement? I regularly stop and talk with people in my neighbourhood. (Scale: Strongly agree / agree / neither agree nor disagree / disagree / strongly disagree. “Regularly” = strongly agree / agree.) To establish a baseline, find a similar national statistic available at the local level (this one is taken from the UK Understanding Society Survey, wave 3 questionnaire).
• Percentage of inhabitants agreeing that people from different backgrounds get on well in local area. Notes: Data from surveys. This indicator looks at bridging between social groups. Possible survey question: To what extent do you agree or disagree that this local area (e.g. 15-20 min walk) is a place where people from different backgrounds get on well together? (Scale: Definitely agree / tend to agree / tend to disagree / definitely disagree. SPONTANEOUS ONLY: Too few people in the local area / all same backgrounds / don’t know. “Agreeing” = definitely agree / tend to agree.) Local area defined as “the street you live in and the streets nearby”. Adapt for other countries as appropri-ate. To establish a baseline, find a similar national statistic available at the local level (this one is taken from the UK Community Life Survey).
• Percentage of people who borrow things and exchange favours with their neighbours. Notes: Data from survey. Possible survey question: To what extent do you agree or disagree with the following statement? I borrow things and exchange favours with my neighbours. (Scale: Strongly agree / agree / neither agree nor disagree / disagree / strongly disagree. Positive: strongly agree / agree). Adapt for other countries as appropriate. To establish a base-line, find a similar national statistic available at the local level (this one is taken from the UK Understanding Society Survey, wave 3 questionnaire).
• Percentage of people who have participated in community decision-making in the past twelve months. Notes: Data from surveys.
• Percentage of people who have volunteered in the last 12 months. Notes: Data from surveys. Possible survey question: In the last 12 months, have you given any unpaid help or worked as a volunteer for any type of local, national or international organisation or charity? (Yes / no). To establish a baseline, find a similar national statistic available at the local level (this one is taken from the UK Understanding Society Survey).
• Percentage of people who strongly feel they belong to their immediate neighbourhood. Notes: Data from surveys. Possible survey question. How strongly do you feel you belong to your immediate neighbourhood? (Very strongly / fairly strongly / not very strongly / not at all strongly / don’t know. “Strongly” = very strongly or fairly strongly.) Adapt for other countries as appropriate. To establish a baseline, find a similar national statistic available at the local level (this one is taken from the UK Community Life Survey).
• Percentage of people who feel safe walking alone in their local area after dark. Notes: Data from surveys. Possible survey question: How safe do you feel walking alone in your local area after dark? (Scale: very safe / fairly safe / a bit unsafe / or very unsafe. “Feel safe” = very safe / fairly safe.) Local area defined as “the street you live in and the streets nearby”. Adapt for other countries as appropriate. To establish a baseline, find a similar national statistic available at the local level (this one is taken from the Crime Survey of England and Wales).
• Percentages of residents, and local business / organisation managers, or employees and guests, familiar with One Planet Living. Notes: Data from surveys. “Familiar” = can name three principles.
• Percentage of people who have attended or participated in the arts at least three times in the past 12 months. Notes: Data from residents survey. To establish a baseline, find a similar national statistic available at the local level (this one is taken from theUK DCMS Taking Part survey).
• Number of community activities or events in the past twelve months. Notes: Data from management in opera-tion. “Community activities or events” include any events located on new development not related to manage-

32
ment or decision-making, such as community parties, local wildlife surveys or communal gardening. • Number of community activities or events in the past twelve months. Notes: Data from surveys. “Community
activities or events” include any events located on new development not related to management or decision-mak-ing, such as community parties, local wildlife surveys or communal gardening.
• Number and type of local cultural and heritage features adopted. Notes: Data from plans and designs. Measures agreed through consultation between local authority, developer, community representatives and other stakehold-ers. Examples include: use of local materials and colours / use of local building forms, heights and architectural features / inclusion or retention of historic features or associations (e.g. retaining archaeological foundations, etc.) / use of local or regional plant species throughout the development / use of public art / involving the community in the design of community focal points and open space. Adapted from BREEAM Communities Technical Manual 2012 (© BRE).
Land and nature
• Percentage of land area that has functional green surfaces. Notes: Data from plans. Adapted from STAR Com-munities (2015). Definition of functional green surfaces – performing at least two of the following functions: (a) cooling through tree canopy cover, green roofs, or green walls, (b) water management through wetlands, stream buffers, and permeable surfaces, (c) recreation through parks and/or greenways, and (d) food growing.
• Numbers of key species found local area (such as plant or bird species). Notes: Examples of key species may be plant, bird or invasive species. Data can be collected as a community activity, e.g. bird and plant identification ac-tivities. Based on Singapore City Biodiversity Index. Baselines based on initial survey of site (before development).
• Percentage of new construction (eg new residential addresses) built on previously developed land. Notes: Data can be collected from site plans. To establish a baseline, find a similar national statistic available at the local level (this one is taken from the UK Department of Communities and Local Government).
• Scores from biodiversity impact assessment. Notes: Data from plans. Use nationally appropriate tools. One possible approach based on the UK DEFRA’s biodiversity impact assessment and offset guidance; calculators are available for this.
• Measure of capacity of land to absorb carbon. Estimate on the basis of land use and timeframes for establishing carbon sinks. For example, the number of trees of a particular species planted, or the area of wetland or dense, vegetated area created. Must account for losses due to land use change. Tools such as i-Tree, are available: https://www.itreetools.org/.
Sustainable water
• Average per capita potable water consumption for residents (litres / year) or guests (litres / night). Notes: Data from meters (survey where necessary).
• Ratio of impermeable to permeable area that accommodates stormwater infiltration. Notes: Data from plans. Source: Ecodistricts Toolkit - Assessment.
• Percentage of site area used for rain water harvesting. Notes: Use data from plans. Includes roofs and SUDs. • Percentage of waste water that is recycled onsite. Notes: data from plans. Estimate from water consumption and
extent of waste water recycling technology used.
Local and sustainable food
• Food growing space (m2/person). Notes: Data from plans. • Percentage of adult residents gardening at least once per month (a) for food and (b) in general. Notes: Data from
surveys. • Percentage of local catering establishments or shops on-site that offer (a) vegetarian or vegan food (b) sus-
tainable fish, (c) local and/or seasonal and/or organic fruit and vegetables, (d) ethical meat, eggs and dairy and (e) fairtrade-certified products Notes: Data from surveys. For catering businesses, look at procurement policies (whether the majority of eligible products meet criteria, by volume), for shops, look at whether ethical and sus-tainable options are available for the majority of products in each potential category. Definitions: sustainable fish – MSC, other proven, recognised certification or well documented local supplier, eg artisanl fishermen; fruit, vegetables – seasonal and locally-grown (within region), organic or other certification (such as LEAF for integrated farm management) (c) ethical meat and dairy – animal charity certified (e.g. RSPCA or other recognised charity), organic, free-range or outdoor-reared (may choose to define ethical eggs as ‘cage free’ rather than ‘free range’). Based on Compassion in World Farming (CIWF) animal welfare recommendations.
• Percentage of residents who check packaging for (a) vegetarian or vegan food, (b) sustainable fish, (c) local and/or seasonal and/or organic fruit and vegetables, (d) ethical meat, eggs and dairy and (e) fairtrade-certified prod-ucts. Notes: Data from surveys. See above for definitions.
• Percentage of residents who regularly choose (a) vegetarian or vegan food, (b) sustainable fish, (c) local and/or seasonal and/or organic fruit and vegetables, (d) ethical meat, eggs and dairy and (e) fairtrade-certified products

33
Notes: Data from surveys. See above for definitions. • Percentages of people who are (a) mostly vegan, (b) mostly vegetarian or (c) meat-eaters. For meat-eaters: aver-
age number of meals per week which include meat. Notes: Data from surveys. • Estimated emissions from diets. Notes: Estimated using data about meat and dairy consumption. • Number of edible fruit-bearing trees and shrubs planted onsite. Notes: Data from plans and management in oper-
ation. Travel and transport
• Modes of transport taken by commuters (residents or employees), as a percentage of total transportation. Notes: Data from surveys or travel diaries. Modes include: rail, tram or tube, bus, bike, walking, car (single occupant and multi-occupant), work from home.
• Percentage of residents taking long-haul flights in a given year / percentage of guests arriving by plane. Data from surveys or, in the case of guests, some assumptions about long-haul flights can be made on the basis of guest origin. For guidance on guests, see the G4 Event Organisers Sector Disclosure.
• Percentage of commuters using alternatives to single occupant vehicles. Notes: Data from surveys. See question about modes of transport above.
• Percentage of people within 0.5km of public transit running at least every 20 minutes. Notes: Data from plans and survey of area. Source: suggested UN SDG indicators.
• Number of cars per person or per household. Notes: Data from surveys. • Annual per capita transport CO2 emission (kg CO2e/person/year). Notes: Estimate from following data: average
distance travelled per week by each mode of transport (bus or coach, tram or undeground, train, car driver, car passenger), estimated from (1) the number of journeys per week, and (2) the average length of time of each jour-ney. Estimate distances from times and use emission factors for each mode of transport. Number and destinations of flights taken per yearly. Data from surveys. Local baselines may be available.
• Percentage of residents taking long-haul flights in a given year. Notes: Data from surveys. • Percentage of users within a 15 minute journey from key amenities via (a) walking or public transport journey
and (b) bike. Notes: Data from plans and survey of area. Key amenities: (1) employment (2) a primary school (3) a secondary school (3) further education (4) a GP (5) a hospital (6) a food store (7) a town centre. To establish a baseline, find a similar national statistic available at the local level (this one is taken from the UK Department for Transport).
• Number of cars per person or per household. Notes: Data from surveys. • Percentage of vehicles which are electric. Notes: Data from surveys. • Percentage of development land which is car-free – ie not linked by roads for cars and without parking next to
homes. Notes: Data from plans. Materials and products
• Estimated embodied carbon of buildings (Kg CO2e/m2) annualised over lifespan of buidings or over 60 years. Notes: Data from plans. Embodied carbon data from the BRE Green Guide.
• Percentage (by volume or weight) of the road construction material that is locally reclaimed or constituted from recycled material. Notes: Data from plans. (BREEAM Communities benchmark for comparison: 1 credit for 15+%, 2 credits for 25-30%, 3 credits for 30+% credits. Based on BREEAM Communities Technical Manual 2012 © BRE.)
• Percentage (by volume or weight) of the construction materials for buildings achieving an A+ or A rating in BREEAM’s Green Guide to Specification, or which are local reclaimed materials (from within 100km). Notes: Data from plans. Source: BRE Green Guide.
• Proportion of timber or wood products reclaimed, reused or certified from a sustainable source. Notes: Data from plans.
• Measure of success of community initiatives for sharing, selling, gifting or refurbishment of used durable goods, such as share shops, freecycle sites or intranets, and local charities (e.g. adverts listed, items donated). Notes: Data from management team.
Zero waste • Percentage of waste sent for reuse, recycling or composting in a given year. Notes: Data can be obtained from
weighting technology or via a waste audit (see ‘BedZED seven years on’ report). Local baselines are often available. Use data on local energy-from-waste recovery rates.
• Waste generated per person per year (tonnes/person/year) or per guest (kg/guest/night), and annual total for community or destination (tonnes). Notes: Data obtained from weighting technology or via a waste audit (see ‘BedZED seven years on’ report).
• Total quantity and percentage of construction waste sent for reuse, recycling, composting or energy-from-waste recovery. Notes: Data estimated from plans and operations, if possible.

34
• Estimated total waste generated during construction. Notes: Data collected or estimated from plans and opera-tions.
Zero carbon energy
• Greenhouse gas emissions from residential buildings compared to baseline (kgCO2e/person/year and kgCO2e/m2/year), or per guest (kgCO2e/guest/night). Notes: Calculated from energy supply and demand data, using emissions factors.
• Greenhouse gas emissions from non-residential buildings compared to baseline (kgCO2e/m2/year). Notes: Calcu-lated from energy supply and demand data, using emissions factors.
• Percentage of annual energy consumed which comes from renewable sources, on and off site, by energy type. Notes: Data obtained from management in operation.
• Annual energy consumption, by energy type, for residential buildings (kWh/ person/year and kWh/m2/year), or per guest (kWh/guest/night). Notes: Data obtained from meters or energy surveys.
• Annual energy consumption by area for non-residential buildings (kWh/m2/year). Notes: Data obtained from ener-gy surveys.

35
Bioregional Development Group BedZED Centre 24 Helios Road WallingtonLondon SM6 7BZ United Kingdom
+44 (0)20 8404 4880
[email protected] @Bioregional
Written and published by Bioregional
September 2016
Bioregional champions a better, more sustainable way to live. We work with partners to create places which enable people to live, work and do business within the natural limits of the planet. We call this One Planet Living.