one-dimensional compression behaviour of non …
TRANSCRIPT

i
ONE-DIMENSIONAL COMPRESSION BEHAVIOUR OF NON-PLASTIC
SOILS
Abideen Toba Owolabi
A dissertation submitted to the Faculty of Engineering and the Built Environment,
University of the Witwatersrand, Johannesburg, in fulfilment of the requirements
for the degree of Master of Science in Engineering.
Supervisor: Dr Luis Alberto Torres Cruz
Co-supervisor: Dr Nico Vermeulen
Examiners: Dr Irvin Luker and Prof Peter Day
Johannesburg, 2018

ii
Candidate Declaration
I declare that this dissertation is my own unaided work. It is being submitted to the
Degree of Master of science to the University of the Witwatersrand,
Johannesburg. It has not been submitted before for any degree or examination to
any other University.
…………………………………………..
(Signature of the Candidate)
………………day of ……………………………… year …………………………

iii
Abstract
The one-dimensional (1-D) compression behaviour of sands at stress levels
that are high enough to induce significant particle breakage can be represented by
a limiting compression curve (LCC) in the compression plane, i.e. void ratio (e)
versus vertical effective stress (σ'v). Results from previous studies have shown that
the LCC reflects the combined effects of particle size distribution (PSD), particle
shape, and mineralogy. Additionally, previous studies have reported that the mean
particle size (D50) also has an effect on the LCC. The current study focused on the
effect that the broadness of the PSD and particle shape have on the LCC. To
achieve this, variations in mineralogy were reduced by considering only quartzitic
sands, and the PSDs had varying broadness but a constant D50. Eleven soil types
were tested, with particle shapes that varied from commercially manufactured
spherical beads to angular filter sand. The results confirm the findings from
previous studies regarding the way in which PSD and particle shape affect the
LCC. Correlations are presented which allow for initial assessments of the LCC of
quartzitic sands based on particle shape, PSD, and limit void ratios. The results
also show that, when the LCC is modelled in a doubly logarithmic compression
plane, there is a well-defined direct and linear correlation between its slope (ρc)
and the reference vertical effective stress at a unit void ratio (σˈr). Further testing
is recommended to determine whether this correlation is affected by variations in
D50.

iv
Dedication
To the geotechnical engineering community

v
Acknowledgements
All adoration and glorification is due to Almighty God, the Lord of the
universe. I thank Him for keeping me healthy and giving me sound mind
throughout the course of this program.
I am grateful to my supervisors in respect of Dr Luis Alberto Torres-Cruz and
Dr Nico Vermeulen for their patient guidance at every stage of this study, from
beginning to the end. I am also grateful for the assistance of Dr Mike Otieno, Dr
Charles Macrobert, Mrs Tumelo Lamola, Mr Edward Pretorius, Mr Samuel
Mabote, Mr Jason Mader and Miss Mamonaheng Rapapa.
Finally, my earnest appreciation goes to my family and friends for their
unending support in every capacity. To them, I am highly indebted and words
alone cannot describe my gratitude. May God continue to be with you in all your
endeavours.

vi
Table of Contents
List of Figures ........................................................................................................ ix
List of Tables ........................................................................................................ xiv
List of Symbols ..................................................................................................... xv
1 GENERAL INTRODUCTION ....................................................................... 1
1.1 Background and Motivation ..................................................................... 1
1.2 Research Objective and Dissertation Outline ........................................... 4
1.3 Figure ........................................................................................................ 5
2 LITERATURE REVIEW ................................................................................ 6
2.1 Introduction .............................................................................................. 6
2.2 The Limiting Compression Curve (LCC) Concept .................................. 6
2.3 1-D Confined Compression Test Loading Methods and Equipment ....... 8
2.4 Representation of the LCC ..................................................................... 10
2.5 Factors Affecting the LCC ..................................................................... 11
2.5.1 Effect of PSD on the LCC ............................................................... 11
2.5.2 Effect of particle shape on the LCC ................................................ 12
2.5.3 Effect of mineralogy on the LCC .................................................... 13
2.6 Concluding remarks ................................................................................ 13
2.7 Figures and Tables .................................................................................. 15
3 METHODS AND MATERIALS .................................................................. 21

vii
3.1 Introduction ............................................................................................ 21
3.2 1-D Confined Compression Testing Equipment .................................... 21
3.3 Justification for the Selected Loading Method ....................................... 23
3.4 Selected Soil Types ................................................................................ 24
3.5 Correlations amongst Index Properties .................................................. 25
3.6 Sample Preparation and Experimental Procedure .................................. 26
3.7 Experimental Data Presentation, Processing and Calculations .............. 29
3.7.1 Void ratio calculation ...................................................................... 29
3.7.2 1-D confined compression data processing and presentation ......... 30
3.7.3 Particle crushing measurement........................................................ 32
3.8 Summary ................................................................................................. 32
3.9 Figures and Tables .................................................................................. 33
4 EXPERIMENTAL RESULTS ...................................................................... 45
4.1 Introduction ............................................................................................ 45
4.2 1-D Confined Compression Curves ........................................................ 45
4.3 The Limiting Compression Curves......................................................... 47
4.3.1 Relationship between the LCC and compressibility ....................... 49
4.4 Particle Crushing .................................................................................... 50
4.5 Compression Mould Lateral Deformations ............................................ 51
4.6 Figures and Tables .................................................................................. 51

viii
5 CORRELATION BETWEEN THE LCC PARAMETERS AND PSD,
PARTICLE SHAPE AND LIMIT VOID RATIOS .............................................. 74
5.1 Introduction ............................................................................................ 74
5.2 Correlation between the LCC parameters and PSD ............................... 74
5.3 Correlation between the LCC parameters and Particle shape ................ 75
5.4 Correlation between the LCC parameters and the emax and emin ............. 76
5.5 Figures .................................................................................................... 76
6 CONCLUSION AND RECOMMENDATIONS .......................................... 80
6.1 Conclusion .............................................................................................. 80
6.2 Recommendations for Future studies ..................................................... 81
7 REFERENCES .............................................................................................. 83
8 APPENDICES ............................................................................................... 88
8.1 Appendix A 1-D Compression Curves ................................................... 88
8.2 Appendix B LCC Determination Plots ................................................... 92
8.3 Appendix C Post-compression Sieve Analysis Results .......................... 96
ix
List of Figures
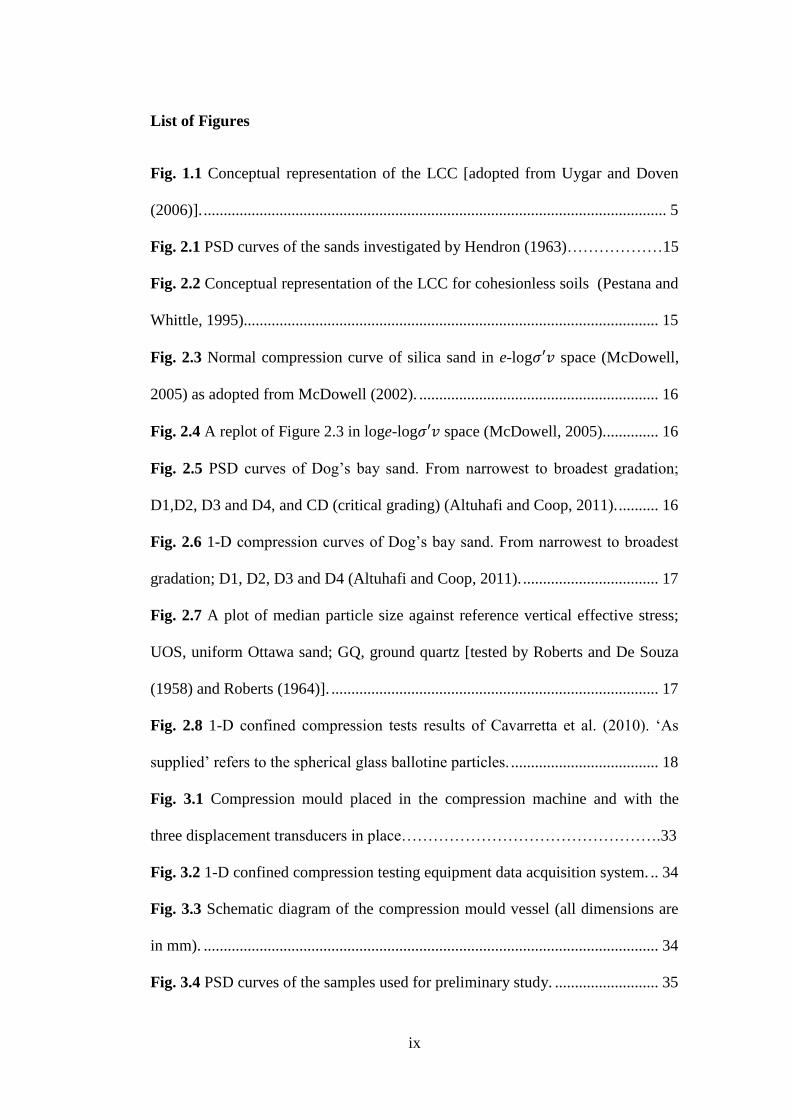
Fig. 1.1 Conceptual representation of the LCC [adopted from Uygar and Doven
(2006)]. .................................................................................................................... 5
Fig. 2.1 PSD curves of the sands investigated by Hendron (1963)………………15
Fig. 2.2 Conceptual representation of the LCC for cohesionless soils (Pestana and
Whittle, 1995)........................................................................................................ 15
Fig. 2.3 Normal compression curve of silica sand in e-log𝜎′𝑣 space (McDowell,
2005) as adopted from McDowell (2002). ............................................................ 16
Fig. 2.4 A replot of Figure 2.3 in loge-log𝜎′𝑣 space (McDowell, 2005).............. 16
Fig. 2.5 PSD curves of Dog’s bay sand. From narrowest to broadest gradation;
D1,D2, D3 and D4, and CD (critical grading) (Altuhafi and Coop, 2011). .......... 16
Fig. 2.6 1-D compression curves of Dog’s bay sand. From narrowest to broadest
gradation; D1, D2, D3 and D4 (Altuhafi and Coop, 2011). .................................. 17
Fig. 2.7 A plot of median particle size against reference vertical effective stress;
UOS, uniform Ottawa sand; GQ, ground quartz [tested by Roberts and De Souza
(1958) and Roberts (1964)]. .................................................................................. 17
Fig. 2.8 1-D confined compression tests results of Cavarretta et al. (2010). ‘As
supplied’ refers to the spherical glass ballotine particles. ..................................... 18
Fig. 3.1 Compression mould placed in the compression machine and with the
three displacement transducers in place………………………………………….33
Fig. 3.2 1-D confined compression testing equipment data acquisition system. .. 34
Fig. 3.3 Schematic diagram of the compression mould vessel (all dimensions are
in mm). .................................................................................................................. 34
Fig. 3.4 PSD curves of the samples used for preliminary study. .......................... 35

x
Fig. 3.5 Compression curves of the samples used for preliminary study; DL;
discrete loading compression machine; CL; continuous loading compression
machine; UG, uniformly graded PSD; WG, widely graded PSD. ........................ 35
Fig. 3.6 Continuous rate of stress loading compression machine. ........................ 36
Fig. 3.7 Discrete loading compression machine. .................................................. 37
Fig. 3.8 PSD curves of the soil types tested. ......................................................... 37
Fig. 3.9 Microscope images showing the particle shape of the four different
sources of granular materials tested. ..................................................................... 38
Fig. 3.10 Krumbein and Sloss (1963) Particle shape determination chart. ........... 38
Fig. 3.11 Relation between emax and emin of the selected soil types. ..................... 39
Fig. 3.12 Relationship between emax and PSD. ..................................................... 39
Fig. 3.13 Relationship between emin and PSD. ...................................................... 39
Fig. 3.14 Relationship between emax and particle roundness. ............................... 40
Fig. 3.15 Relationship between emin and particle roundness. ................................ 40
Fig. 3.16 Compression mould lateral expansion measured from two horizontal
LVDTs. .................................................................................................................. 40
Fig. 3.17 Telescopic gauge used to measure the final height of the specimens, Hf.
............................................................................................................................... 41
Fig. 3.18 Illustration of the approach used in defining the 1-D compression curve
obtained herein; (a) initial data points (b) refined 35 data points. ........................ 42
Fig. 3.19 LCC determination for the angular, broad PSD soil type. ..................... 43
Fig. 3.20 Hardin (1985) particle breakage measurement parameters. .................. 43
Fig. 4.1 Typical 1-D confined compression curves of the tested soil types in: (a)
semi-logarithmic space; (b) double-logarithmic space; (c) natural space………..52

xi
Fig. 4.2 AI soil type 1-D compression curves. ..................................................... 53
Fig. 4.3 SI soil type 1-D compression curves. ...................................................... 53
Fig. 4.4 RI soil type 1-D compression curves. ...................................................... 54
Fig. 4.5 BI soil type 1-D compression curves. ...................................................... 54
Fig. 4.6 Effect of initial relative density on compressibility for the AI soil type. 55
Fig. 4.7 Effect of initial relative density on compressibility for the SI soil type. . 55
Fig. 4.8 Effect of initial relative density on compressibility for the RI soil type. 56
Fig. 4.9 Effect of initial relative density on compressibility for the BI soil type. 56
Fig. 4.10 Effect of PSD on compressibility for the angular soil types. ................ 57
Fig. 4.11 Effect of PSD on compressibility for the sub-angular soil types........... 58
Fig. 4.12 Effect of PSD on compressibility for the rounded soil types. ............... 59
Fig. 4.13 Effect of PSD on compressibility for the beads soil types. ................... 60
Fig. 4.14 Effect of particle shapes on compressibility. ......................................... 61
Fig. 4.15 LCC determination for the AI soil type. ................................................ 62
Fig. 4.16 LCC determination for the SI soil type.................................................. 62
Fig. 4.17 LCC determination for the RI soil type. ................................................ 63
Fig. 4.18 LCC determination for the BI soil type. ................................................ 63
Fig. 4.19 Limiting compression curves of the angular soil types. ........................ 64
Fig. 4.20 Limiting compression curves of the sub-angular soil types. ................. 64
Fig. 4.21 Limiting compression curves of the rounded soil types. ....................... 65
Fig. 4.22 Limiting compression curves of the beads soil types. ........................... 65
Fig. 4.23 Relationship between the LCC parameters............................................ 66
Fig. 4.24 Relationship between the LCC and compressibility. ............................. 66
Fig. 4.25 Pre and post-compression PSD curves of the AI soil type. ................... 67

xii
Fig. 4.26 Pre and post-compression PSD curves of the SI soil type. .................... 67
Fig. 4.27 Pre and post-compression PSD curves of the RI soil type. ................... 68
Fig. 4.28 Pre and post-compression PSD curves of the BI soil type. ................... 68
Fig. 4.29 Effect of PSD on particle breakage. ...................................................... 69
Fig. 4.30 Effect of particles roundness on particle breakage. ............................... 69
Fig. 5.1 Relationship between ρc and Cu………………………………………...76
Fig. 5.2 Relationship between σ′r and Cu. ............................................................ 77
Fig. 5.3 Relationship between ρc and particle roundness. .................................... 77
Fig. 5.4 Relationship between σ′r and particle roundness. ................................... 77
Fig. 5.5 Relationship between ρc and emax. ........................................................ 78
Fig. 5.6 Relationship between ρc and emin. ......................................................... 78
Fig. 5.7 Relationship between σ′r and emax. ....................................................... 78
Fig. 5.8 Relationship between σ′r and emin. ........................................................ 79
Fig. A.1 Angular broad soil type 1-D compression curves………………………88
Fig. A.2 Angular narrow soil type 1-D compression curves. ............................... 88
Fig. A.3 Sub-angular broad soil type 1-D compression curves. ........................... 89
Fig. A.4 Sub-angular narrow soil type 1-D compression curves. ......................... 89
Fig. A.5 Rounded narrow soil type 1-D compression curves. .............................. 90
Fig. A.6 Beads broad soil type 1-D compression curves. ..................................... 90
Fig. A.7 Beads narrow soil type 1-D compression curves. ................................... 91
Fig. B.1 LCC determination for the AB soil type………………………………..92
Fig. B.2 LCC determination for the AN soil type. ................................................ 92
Fig. B.3 LCC determination for the SB soil type. ................................................ 93
Fig. B.4 LCC determination for the SN soil type. ................................................ 93

xiii
Fig. B.5 LCC determination for the RN soil type. ................................................ 94
Fig. B.6 LCC determination for the BB soil type. ................................................ 94
Fig. B.7 LCC determination for the BN soil type. ................................................ 95
Fig. C.1 Pre and post-compression PSD curves of the AB soil type.……………96
Fig. C.2 Pre and post-compression PSD curves of the AN soil type. ................... 96
Fig. C.3 Pre and post-compression PSD curves of the SB soil type..................... 97
Fig. C.4 Pre and post-compression PSD curves of the SN soil type. ................... 97
Fig. C.5 Pre and post-compression PSD curves of the RN soil type. ................... 98
Fig. C.6 Pre and post-compression PSD curves of the BB soil type. ................... 98
Fig. C.7 Pre and post-compression PSD curves of the BN soil type. ................... 99

xiv
List of Tables
Table 2.1 Moulds description and methods of load application. .......................... 19
Table 2.2 Summary of the results of 1-DCC tests performed by Roberts and De
Souza (1958) and Roberts (1964) [adopted from Pestana and Whittle (1995)]. ... 20
Table 3.1 Fundamental index properties of the selected soil types……………...44
Table 3.2 XRF major chemical composition analysis results. ............................. 44
Table 4.1 1-D confined compression testing program summary………………...70
Table 4.2 The LCC and particle breakage characteristics of the tested soil types.
............................................................................................................................... 73

xv
List of Symbols
av coefficient of compressibility
Bp potential breakage
Br relative breakage
Bt total breakage
Cu uniformity coefficient
Dr relative density
D50 median particle size (mm)
E modulus of elasticity
e void ratio
eo void ratio of the LCC at σ'o
emax maximum void ratio
emin minimum void ratio
Gs specific gravity
Hf final height of specimen
Hs equivalent height of specimen
Ko coefficient of earth pressure
Ms mass of specimen
NCL normal compression line
𝑃′ mean normal effective stress
R particles roundness
S particles sphericity
v specific volume
Vs volume of solids
VT total volume
Vv volume of void
λ LCC slope in e – logσ'v space
ρc LCC slope in loge – logσ'v
space
ρw water density
σ'o arbitrary chosen effective
stress
σ'r reference vertical effective
stress at a void ratio of 1.0
σ'v vertical effective stress
σ'v@LCC vertical effective stress at
which LCC is attained
∆H change in height of specimen

1
1 GENERAL INTRODUCTION
1.1 Background and Motivation
Compressibility measures the degree to which a soil mass decreases in volume
in response to an applied external load. It is widely considered during design of
geotechnical engineering structures to estimate the settlement of soils under
structural load. (Tiwari and Ajmera, 2012, Mohammadzadeh et al., 2014, Singh
and Noor, 2012).
Owing to the particulate nature of soils, the usual assumption is that the
compressibility of the individual grains is negligible when compared to the
compressibility of the mineral skeleton as a whole. Thus, in general for soils,
volumetric compression is achieved through particle rearrangement into a tighter
packing arrangement or fabric. In granular soils, particle rearrangement into a
more compact configuration is achieved through particle reorientation, sliding,
rolling and particle breakage if the applied stresses are sufficiently high (Mesri
and Vardhanabhuti, 2009, Shipton and Coop, 2012, Uygar and Doven, 2006).
At high stress levels, sands, as non-cohesive granular soils, may be more
compressible than cohesive soils, such as clays and silts (Roberts and De Souza,
1958). Even if the compressibility of sands is lower compared with that of clays
and silts, the fact that it occurs suddenly as a result of particle crushing may cause
catastrophic damage to structures in the early stages of construction (Uygar and
Doven, 2006). For this reason, several studies over the past decades (e.g. Terzaghi
and Peck, 1948, Vesic and Clough, 1968, Hagerty et al., 1993, Leung et al., 1997,
Minh and Cheng, 2013, Roberts and De Souza, 1958) have examined the

2
compressibility of sands at high pressures with the sole aim of having a better
understanding of their mechanical behaviour.
The term high pressure varies from one engineering field to another. In soil
mechanics and geotechnical engineering, any pressure exceeding the capacity of a
conventional oedometric or triaxial apparatus (about 1-2 MPa) is often referred to
as high pressure (e.g. Vesic and Clough, 1968).
The knowledge of mechanical behaviour of soils under high pressure is
important for effective design and performance monitoring of large geotechnical
engineering structures such as large dams, high waste-rock fills, deep foundations
and tunnels which may subject the supporting soils to high stresses beyond those
frequently encounter in day-to-day geotechnical engineering problems (e.g.
Yamamuro et al., 1996, Vesic and Clough, 1968).
Laboratory information on the compressibility of soils is usually obtained
from either oedometer tests or isotropic compression tests. In the oedometer test,
also known as one-dimensional (1-D) confined compression test, the soil
specimen is subjected to pressure along its vertical axis, while strain in the
horizontal direction is reduced to a negligible magnitude. During isotropic
compression, the soil specimen is subjected to an equal all-around hydrostatic
pressure and is free to strain vertically and laterally (Lambe and Whitman, 1969,
Mesri and Vardhanabhuti, 2009).
The results of 1-D confined compression (1-DCC) tests, and isotropic tests are
usually presented in plots of void ratio (e) against the logarithm of vertical
effective stress (σ′v) and mean normal effective stress (𝑝′), respectively. These
plots are known as a compression curve in the compression plane. For sands, there

3
is a certain stress level at which the compression curve exhibits maximum
curvature. This stress level is referred to as the ‘breakdown stress’ or ‘critical
pressure’ (Vesic and Clough, 1968, Roberts and De Souza, 1958). It is generally
accepted that the breakdown stress signifies the onset of major particle crushing
and beyond this stress level, the effect of the initial void ratio of the specimen
disappears. (Vesic and Clough, 1968, Roberts, 1969). Thus, at sufficiently high
stress levels particle crushing becomes the main factor responsible for sand
compression. Furthermore, the compression curves of specimens of the same sand
compressed from different initial densities tend to converge into a single curve at
high stress levels (Fig. 1.1). This unique compression curve is known as the
limiting compression curve (LCC) (Ko-LCC when obtained from 1-DCC tests or
H-LCC when obtained from isotropic compression tests) (e.g. Pestana and
Whittle, 1995).
The stress level that corresponds to the breakdown stress (Fig. 1.1), and
consequently where the LCC is attained, is not unique to all sands. Instead it
varies from one sand to another and mainly depends on the initial density, particle
size (as represented by median particle size, D50), particle size distribution (PSD),
particle shape, and particle hardness (mineralogy) (e.g. Coop and Lee, 1993,
Roberts, 1964, Yamamuro et al., 1996). Normally, clean quartz sands reach their
LCC at stress levels between 10-100 MPa, while other sands with weak particles
such as carbonate sands may reach the LCC at much lower stresses between 1-3
MPa (Shipton and Coop, 2012).
Previous studies on high pressure 1-D compression behaviour of non-plastic
sands have shown that the LCC reflects the combined effects of PSD and particle
4
shape (e.g. Altuhafi and Coop, 2011, Cavarretta et al., 2010, Pestana and Whittle,
1995). They have also given an indication of the exclusive effect of particle shape
on the LCC, while such effect has not been clearly defined for the PSD. Attempts
made by previous investigators to examine the effect of PSD on the LCC,
although insightful, did not successfully isolate the effect of D50 which in turn
makes it impossible to determine whether the resulting changes in LCC are due to
changes in shape of the PSD curve or due to changes in D50. Conversely, in this
work different PSDs are considered but care is taken to keep the D50 constant.
1.2 Research Objective and Dissertation Outline
The general objective of this study is to investigate how particle shape and
PSD affect the LCC of quartzitic sands for a constant D50. The progression
towards this objective is described in the remainder of the dissertation as follows.
In chapter 2, a review of existing literature on 1-D mechanical response of
clean sands is presented. This review covers the two most commonly used
mathematical models for representing the LCC and the experimental methods for
conducting 1-DCC tests. The effects of PSD, particle shape and mineralogy on the
LCC are also presented.
In chapter 3, the materials and methods used in this study are described. This
description includes: the 1-DCC testing equipment and loading method, the
selected soil types, sample preparation, testing procedure and calculations.
In chapter 4, the results of 1-DCC tests and post-compression sieve analyses
are presented, whereas Chapter 5 explores how variations in PSD and particle
shape affect the LCC. Correlations between the LCC and the limit void ratios

5
(emax and emin) are also explored in this chapter, while the final chapter of this
dissertation presents a summary of this study, its conclusions and
recommendations for future studies.
1.3 Figure
Fig. 1.1 Conceptual representation of the LCC [adopted from Uygar and Doven
(2006)].

6
2 LITERATURE REVIEW
2.1 Introduction
This chapter reviews previous studies on high pressure 1-D compression
behaviour of sand which are pertinent to this study; presents the two mathematical
models commonly used for representation of the LCC; and examines the effects of
PSD, particle shape and mineralogy on the LCC that have been reported on the
literature.
2.2 The Limiting Compression Curve (LCC) Concept
In modern soil mechanics and geotechnical engineering, the first study on high
pressure 1-D compression behaviour of sands was reported by Terzaghi and Peck
(1948). The 1-DCC tests were conducted on sands, sand-mica mixtures and soft
Detroit clay to pressures up to 196 MPa. Within the pressure range of about 10 –
100 MPa they observed that the compressibility of the sands is as high as that of
the soft clay and attributed this to particle crushing.
Roberts and De Souza (1958), presented comprehensive reports of a series of
high pressure 1-DCC tests conducted on Boston blue clay, Venezuelan clay, and
well-rounded and very angular quartz sands. The samples were subjected to
pressures up to 137 MPa. In agreement with Terzaghi and Peck (1948), they
reported that, under high pressure, sand may be more compressible than clay due
to particle breakage. The pressure at which the particle crushing becomes apparent
was referred to by Roberts and De Souza (1958) as the ‘critical pressure’ or the
‘break-point’. They also found that the critical pressure depends on the PSD,

7
particle shape and initial density of the sample. Namely, they found that the
critical pressure was negatively correlated to D50 and particle angularity, but
positively correlated to the initial density.
Hendron (1963), performed a series of 1-DCC tests on four different quartz
sands (Minnesota sand, Pennsylvania sand, Sangamon river sand and Wabash
river sand) up to a maximum pressure of approximately 23 MPa. The four sands
were selected because of their dissimilarity with respect to PSD and particle shape
characteristics. The PSD curves of the sands are shown in Fig. 2.1. In terms of
their particle shape, Minnesota sand is rounded, Pennsylvania sand is angular,
Sangamon river sand is sub-angular, and Wabash river sand is sub-angular to sub-
rounded. The sands were tested at different initial relative densities and it was
found that the initial relative density is the most important factor that affects the
compressibility of sand at low stress levels where particle crushing is
insignificant. However, as the pressure increases to the high pressure range, the
effect of initial relative density on the compressibility gradually diminishes.
Consequentially, for the Pennsylvania sand, the compression curves of the
samples merged into a single curve, i.e. the limiting compression curve (LCC), at
a stress level above 14 MPa. Although the other three sands did not reach the
LCC, Hendron commented: “All sands will eventually manifest the same type of
behaviour as Pennsylvania sand if high enough pressures are reached”.
After the Hendron (1963) study, many authors in the literature who have
studied the compression behaviour of sands (e.g. Vesic and Clough, 1968,
Hagerty et al., 1993, Coop and Lee, 1993, Pestana and Whittle, 1995, Yamamuro
et al., 1996) have also reported that, when specimens are compressed to a

8
sufficiently high stress level, the compression curves converge into a single curve
that is independent of the initial formation densities. This unique compression
curve (Fig. 1.1) has been termed the LCC.
2.3 1-D Confined Compression Test Loading Methods and Equipment
Generally, there are two types of loading methods: stress-controlled and
strain-controlled. Both loading methods are used in 1-DCC tests. For instance,
ASTM D2435 and ASTM D4186 describe procedures for stress-controlled and
strain-controlled 1-DCC tests, respectively. According to the standard, in the
stress-controlled 1-DCC test, the sample is subjected to constant discrete load
changes (increments and decrements) for a time period of 24 hours (or multiples
thereof), or until the completion of primary consolidation of the sample.
Conversely, in a strain-controlled 1-DCC test, the sample is compressed axially at
a specific rate of strain or deformation which is generally kept constant throughout
the test.
It is important to mention that both stress-controlled and strain-controlled 1-
DCC tests described in the ASTM standard are primarily devised for estimating
the consolidation properties of saturated cohesive soils. However, because of the
ever increasing demand for determining the 1-D compression behaviour of
cohesionless soils, in both dry and saturated states, and under both low stress
levels (where particle breakage is insignificant) and high stress levels (where
particle breakage is significant) for theoretical and practical purposes,
investigators over the years (e.g. Hendron, 1963, Hagerty et al., 1993, Salazar,
2013) have been using either of these tests for estimating compression properties
9
of sands with or without modification. For instance, Hagerty et al. (1993) and
(Liesker, 2014) among other investigators used a loading method that may be
referred to as a modified stress-controlled loading method. In this modified 1-
DCC test, the specimen is subjected to an axial compression stress that increases
at a constant rate.
Given the lack of standards applicable to 1-DCC tests on sands, significant
variability amongst the procedures and testing equipment reported in the literature
is evident. Nonetheless, any 1-DCC testing equipment must contain essentially
two parts: a loading frame for applying the desirable loadings either stress-
controlled or strain-controlled, and a consolidometer or compression mould for
confining (housing) the specimen which must be strong enough to withstand the
high pressures without any significant lateral expansion.
A brief description of moulds and methods of load application used in a
number of previous studies on high pressure 1-DCC conducted on sands are
presented in Table 2.1, together with the standards specified in ASTM D2435 and
ASTM D4186. It can be seen from the table that both types of loading methods
have been used; that the maximum applied stress and dimensions of the moulds
vary; and that all the moulds are made of steel (or its alloy) which is inert with
sands. Furthermore, given the relatively high elasticity modulus of steel (E ≈ 200
GPa) its use is likely to also contribute to limiting lateral deformations of the
moulds, as opposed to other metals such as copper (E ≈ 117 GPa) and brass (E ≈
125 GPa).

10
2.4 Representation of the LCC
In characterising the LCC of a soil, it is imperative that one decides on a
mathematical model to be adopted for its idealization. There are two widely used
models for representing the LCC and the choice of which to use depends largely
on the preference of the investigator.
The first model, proposed by Schofield and Wroth (1968), assumes that the
LCC of any soil, cohesive or cohesionless, can be approximated by a straight line
when the void ratio (or its proxy, the specific volume (v)) is plotted against the
logarithm of the effective stress. This model can be written as:
𝑒 = 𝑒𝑜 − 𝜆 ∙ log (𝜎′/𝜎′𝑜) (2.1)
where eo is the void ratio corresponding to an arbitrary chosen effective stress
(σ′o), λ is the slope of the LCC and 𝜎′ is the applied effective stress which could
be a vertical effective stress (𝜎′𝑣) for 1-DCC tests or a mean normal effective
stress (𝑃′) for isotropic compression tests.
The second widely used model, suggested by Pestana and Whittle (1995),
assumes that the LCC of cohesionless soils, exclusively, can be approximated by a
straight line when the logarithm of the void ratio (or its proxy, the specific volume
(v)) is plotted against the logarithm of the effective stress (Fig. 2.2). This model
can be written as:
log(𝑒) = −𝜌𝑐 ∙ log (𝜎′ 𝜎′𝑟)⁄ (2.2)
where ρc is the slope of the LCC and σ'r a reference effective stress at a unit void
ratio. See Equation 2.1 for the definition of 𝜎′.

11
McDowell (2005), provided a physical justification for the Pestana and
Whittle (1995) model. He shows that the linearity of the LCC of sands in the loge-
logσ'v space is consistent with the theory of fractal crushing. The theory assumes
that the reduction in the volume of sand sample subjected to 1-DCC when a
particle breaks is proportional to the volume of that particle. He also presented a
result of a 1-DCC test conducted on a sample of silica sand in semi and double
logarithmic void ratio-effective stress spaces (Fig. 2.3 and Fig. 2.4) from which it
is apparent that the LCC is best linearized in loge-logσ'v space.
2.5 Factors Affecting the LCC
2.5.1 Effect of PSD on the LCC
In order to examine the effect of initial PSD and density on the compression
behaviour of non-plastic soils, Altuhafi and Coop (2011) carried out a series of 1-
DCC tests on three sands (Dog’s Bay sand, Leighton Buzzard sand and Glacial
basalt sand) of different mineralogies and PSDs. The PSD curves and the LCCs,
termed the normal compression lines (NCLs) by Altuhafi and Coop (2011), of
Dog’s Bay sand mixtures are shown in Fig. 2.5 and Fig. 2.6, respectively. It can
be seen from these figures that the LCC became less steep as the PSD went from
uniformly graded to well graded. Additionally, for the most broadly graded (D4),
the LCC did not emerge. In view of this, they concluded that the convergence of
the compression curves to a unique LCC is a result of particle crushing which is
more pronounced in uniformly graded specimens. Conversely, they suggested that
the insignificant amount of particle crushing, and consequently non-convergent

12
compression behaviour, observed in the well-graded specimens may be because
the PSD is broader than the terminal grading of the sample, which is labelled (CD)
in Fig. 2.5. Terminal grading generally refers to the grading at which the PSD of a
given granular material (under compression) can no longer evolve due to particle
crushing (e.g. Altuhafi and Coop, 2011).
It is worth noting that particle crushing, and terminal grading depend on
applied stress (e.g. McDowell, 2002, Coop et al., 2004). Therefore it is possible
that the well-graded samples could still reach a unique LCC at much higher stress
levels. However, the trend observed in the Dog’s bay sand (steep LCC for narrow
gradation) was also observed in the other sands tested by Altuhafi and Coop
(2011).
Additionally, the results of 1-DCC tests conducted by Roberts and De Souza
(1958) and Roberts (1964), summarized by Pestana and Whittle (1995), indicate
that variation in D50 has significant effect on the LCC (Table 2.2 and Fig. 2.7).
This effect is evident on the reference vertical effective stress (σ'r) as shown in
Fig. 2.7. In the figure, D50 is plotted against σ'r for the samples of uniform Ottawa
sand and ground quartz having the same Cu (Cu = 1.5). It can be seen from the
figure that σ'r decreases with increase in D50 for each of the sands.
2.5.2 Effect of particle shape on the LCC
The influence of particle shape on the LCC can be seen from the results of 1-
DCC tests conducted by Cavarretta et al. (2010). The tests were performed on
spherical (smooth and etched), and crushed glass ballotini of the same particle
sizes range (1.0 – 1.4 mm). Their results (Fig. 2.8) show that soils with rounded

13
particles (smooth or etched) attain the LCC with a steeper gradient, and at a higher
stress level than soils with angular particles. This observed trend is consistent with
the results of 1-DCC tests conducted by Roberts and De Souza (1958) and Roberts
(1964), as earlier presented in Table 2.2 and Fig. 2.7, where rounded quartz sand
having higher values of ρc and σ'r than the angular one of the same PSD (D50 =
0.6 mm and Cu = 1.5). The results of Cavarretta et al. (2010) also show that
surface roughness does not have significant effect on high pressure 1-D
compression behaviour of sands, as the compression curves of the spherical
(smooth) and etched soil types merged into a unique LCC.
2.5.3 Effect of mineralogy on the LCC
Mineralogy affects the stress level at which the LCC is attained (Shipton and
Coop, 2012) as well as the parameters that define the LCC in Equation 2.1 and
2.2. The effect of mineralogy on LCC parameters can be seen in Table 2.2 where
sands of different mineralogies (quartz, feldspar and dolomite) with the same
particle shape (angular) and PSD (D50 = 0.6 mm and Cu = 1.5) have significantly
different LCC parameters; the values of ρc and σ'r for the quartz sand are 0.37 and
3.0 MPa, respectively; 0.425 and 2.7 MPa for the dolomite and; 0.39 and 3.6 MPa
for the feldspar.
2.6 Concluding remarks
The literature review shows that the intrinsic properties of sand: particle shape,
PSD, and mineralogy, all affect the LCC. Importantly, with regards to PSD, the

14
review shows that the LCC is affected by both the shape of the PSD curve
(Altuhafi and Coop, 2011), and the median particle size (D50) (Pestana and
Whittle, 1995). In previous studies that have explored the effect of PSD on the
LCC, D50 has almost always varied. Accordingly, it becomes difficult, if not
impossible, to determine whether the resulting changes in LCC are due to
variations in the shape of the PSD curve or due to changes in D50.
The current work aims at contributing to our understanding of how the shape
of the particles and the shape of the PSD affect the LCC. Achieving this requires
removing the effect of D50 and mineralogy by keeping them constant for all the
tested sands. The following chapter describes the extent to which constant D50s
and mineralogies were achieved. Additionally, the experimental procedures are
described in detail.

15
2.7 Figures and Tables
Fig. 2.1 PSD curves of the sands investigated by Hendron (1963).
Fig. 2.2 Conceptual representation of the LCC for cohesionless soils (Pestana and
Whittle, 1995).

16
Fig. 2.3 Normal compression curve of silica sand in e-log𝜎′𝑣 space (McDowell,
2005) as adopted from McDowell (2002).
Fig. 2.4 A replot of Figure 2.3 in loge-log𝜎′𝑣 space (McDowell, 2005).
Fig. 2.5 PSD curves of Dog’s bay sand. From narrowest to broadest gradation;
D1,D2, D3 and D4, and CD (critical grading) (Altuhafi and Coop, 2011).

17
Fig. 2.6 1-D compression curves of Dog’s bay sand. From narrowest to broadest
gradation; D1, D2, D3 and D4 (Altuhafi and Coop, 2011).
Fig. 2.7 A plot of median particle size against reference vertical effective stress;
UOS, uniform Ottawa sand; GQ, ground quartz [tested by Roberts and De Souza
(1958) and Roberts (1964)].

18
Fig. 2.8 1-D confined compression tests results of Cavarretta et al. (2010). ‘As
supplied’ refers to the spherical glass ballotine particles.

19
Table 2.1 Moulds description and methods of load application.
References Height (H) of mould
cavity (mm)
Diameter (D) of mould
(mm)
D/H ratio
Wall thickness
(mm)
Max stress Applied (MPa)
Loading rate
Lateral deformations
Method of Load
Application Mould materials
ASTM D2435-04
12mm min 50mm min 2.5 min n/s n/s As
described 0.03% under max. load
Stress-controlled
non-corrosive in relation to the soil
tested
ASTM D4186-06
20mm min 50mm min 2.0 min 6.4* n/s ҂ Should be
insignificant Strain-
controlled As for ASTM
D2435-04
Roberts (1964)
4.3-19.1 28.7-69.9 6.67 - 3.66
n/a 138 - - Stress-
controlled Hardened steel
Hendron (1963)
50.8 173 3.41 2.4 23 - Special** Strain-
controlled Steel
Hagerty et al. (1993)
25 47.8 1.91 66.3 689 44500
kN/min n/a
Modified Stress-
controlled
High yield strength (717 MPa) steel-
Alloy
Yamamuro et al.
(1996)
76.2 38.1 0.5 32 850 - 0.33% Strain-
controlled 300M VAR steel
bar
Nakata et al. (2001)
10 50 5 - 100 0.01
mm/min n/a
Strain-controlled
-
Shipton and Coop
(2012)
20 38 - 50 1.9 - 2.5 - 30 - - Stress-
controlled -
Salazar (2013)
31.7 63.6 2.01 12.6 140 0.18 -0.64 mm/min
n/a Strain-
controlled High-grade 4140
stainless steel alloy
Liesker (2014)
- - - - 67.9 1 kN/sec - Modified
stress-controlled
-

20
n/s – not specified
n/a – not available
*not less than 6.4 mm for applied stresses up to 6 MPa.
҂ by specification of the pore-water pressure ratio
**the ring was specially made to adjust itself to maintain approximately zero
lateral strain throughout the test.
Table 2.2 Summary of the results of 1-DCC tests performed by Roberts and De
Souza (1958) and Roberts (1964) [adopted from Pestana and Whittle (1995)].
Soil type Shape D50 Cu ρc σ'r (MPa)
Uniform
Ottawa sand
Rounded
0.60
0.28
0.14
1.5
0.450 ± 0.015
8.5 ± 1.0
10.5 ± 1.0
15.0 ± 1.0
Graded
Ottawa sand
Rounded
0.40
0.28
0.30
2.1
2.6
3.2
0.450 ± 0.015
7.5 ± 0.5
8.5 ± 0.5
8.0 ± 0.5
Ground
quartz
Angular
0.60
0.28
0.14
1.5
0.370 ± 0.010
3.0 ± 0.5
4.8 ± 0.5
6.0 ± 0.5
Ground
dolomite
Angular 0.60 1.5 0.425 ± 0.015 2.7 ± 0.4
Ground
feldspar
Angular 0.60 1.5 0.390 ± 0.010 3.6 ± 0.4

21
3 METHODS AND MATERIALS
3.1 Introduction
This chapter describes the equipment, methods and materials which include:
1-D confined compression testing equipment and loading method; tested soil
types; sample preparation; experimental procedures and calculations.
3.2 1-D Confined Compression Testing Equipment
A 1-DCC testing setup was devised to load sand specimens with compressive
stresses of up to 190 MPa. This setup is shown in Fig. 3.1 and Fig. 3.2. It consists
of a hydraulic loading frame capable of applying constant load, through its
bottom ram and a free-to-rotate upper test plate, at a rate which can vary from 10
– 1000 kN/min. The loading frame has an in-built 2000 kN capacity Emery-load
cell which was connected to a data-logger in order to have simultaneous readings
of load and displacement.
The specimens were confined in a compression mould fabricated from a
round steel bar with a yield stress of 494 MPa. The mould is cylindrical and has a
height of 80 mm and a diameter of 140 mm. One end of the mould contains a
cavity which houses the specimens and which has a depth of 24 mm and a
diameter of 65 mm (Fig. 3.3). These dimensions imply that the diameter to height
ratio (D/H) of the mould cavity is 2.71, and that the sand specimen is surrounded
by ‘wall’ that is 37.5 mm thick. The mould also has two plates with circular
openings attached on its diametric opposite sides (Fig. 3.1 and Fig. 3.3). These

22
plates enable the positioning of two displacement transducers (LVDTs) to
measure vertical displacement, and also serve as handles for the mould.
In summary, the compression mould was built to comply with the D/H ratio
and materials criteria of a standard consolidometer specified in ASTM D2425–04
and ASTM D4186-06. It may also be likened to the ones described in the
literature by a number of previous investigators, who have conducted high-
pressure 1-DCC tests (Table 2.1). Furthermore, the wall of the mould vessel is
made slightly thicker than the one used by Yamamuro et al. (1996), despite the
fact that the specimens would not be subjected to stresses as high as the 850 MPa
they applied. Thus the compression mould used herein is not expected to expand
laterally up to 0.33% which they reported (Table 2.1) under the maximum stress
under consideration (190 MPa).
The load from the compression machine is transferred to the sand specimen
by means of a cap. The cap is a solid piece, made from the same material as the
mould. It has a cylindrical shape, with a thickness of 24 mm and a diameter of
64.3 mm. Consequently, a clearance of approximately 0.35 mm was created
between the specimen containment cavity of the mould and the top cap. The
clearance was deemed adequate to allow unobstructed sliding of the top cap into
the cavity during compression. The adequacy of this clearance is evident in the
repeatability of the compression curves and well defined LCCs obtained in the
preliminary tests described in Section 3.3, and in the results that will be presented
in Chapter 4.

23
3.3 Justification for the Selected Loading Method
The modified stress-controlled loading method (Section 2.3) was used in this
study. As shown in Table 2.1, this loading method has previously been used by
Hagerty et al. (1993) and Liesker (2014). To investigate the effect of loading
methods on compression behaviour of sands, preliminary 1-DCC tests were
performed on samples of an angular quartz sand using the standard stress-
controlled loading method (discrete increments) and the modified method
(constant rate of increment). Two samples were tested (Fig. 3.4); one was widely
graded and the other was uniformly graded. For both sets of tests the same
compression mould (described in preceding Section) and LVDTs were used in
order to isolate the loading method as the only variable.
In the modified stress-controlled 1-DCC test, the loadings were applied with
the compression machine described earlier (Section 3.2) at a rate of 50 kN/min. In
the standard stress-controlled 1-DCC test, the loadings were applied with a
universal compression machine capable of maintaining a constant load with an
accuracy of 1 kN variation in 10 minutes when high loads (above 50 kN) were
applied. The sequence of load application was 2 kN (seating load), 9 kN, 20 kN,
50 kN, 100 kN, 200 kN, and 485 kN. Each load increment was allowed to act on
the specimen for 5 mins, since this time was observed to be enough for the
completion of primary compression of the specimens. This quick compression
time is in agreement with typical behaviour of sands as reported in previous
studies (e.g. Donald, 1948, Roberts and De Souza, 1958).
The results (Fig. 3.5) show that the two loading methods yield virtually
identical compression curves. This observation justifies the loading method

24
(modified stress-controlled) used in this study, which was preferred because the
continuous rate of stress loading machine is newer with greater loading capacity
and easier to use compared to the discrete loading machine (see Fig. 3.6 and Fig.
3.7).
3.4 Selected Soil Types
Eleven quartzitic sands, obtained from four different sources, were selected
for this study. Particle shape varied distinctly from one source to the other. All 11
sands had one of the three PSDs shown in Fig. 3.8, which are artificial gradations
created in the laboratory. The main characteristic and codes of the 11 sands are
summarised in Table 3.1 and their particle shapes are illustrated in Fig. 3.9. It can
be seen from the table that the material from the Lowveld River could only be
prepared into the narrow and intermediate gradations. This was due to the
characteristics of the natural gradation of the material. From Fig. 3.8 it can also be
seen that the three gradations investigated have the same D50 of 0.6 mm. This was
done in attention to the results obtained by Pestana and Whittle (1995) which
showed that variations in D50 affect the location of the LCC. Accordingly, with
the selected PSD curves, the effect of D50 is eliminated thus isolating the effect of
the shape on the LCC for sands from the same source.
The specific gravity (Gs) was 2.65 for the three natural sands and 2.52 for the
glass beads (ASTM D854, water pycnometer method). The minimum index
density tests were performed in accordance with ASTM D4254, while the
maximum index density tests were conducted in accordance with the method
suggested by MacRobert and Torres-Cruz (2016) for sand-silt soils. Using the

25
specific gravities and the index densities, the corresponding emin and emax of the
samples were determined. The values of the emin and emax are given in Table 3.1.
The mineralogy of the particles was determined by X-ray diffraction and is
summarised in Table 3.2. It is evident that for sands from different sources, the
effect of particle shape has not been entirely isolated because, although all the
sands are quartzitic, there are some variations in mineralogy that could have
effects on the LCC (Shipton and Coop, 2012, Pestana and Whittle, 1995).
The particle shapes of the four different sources were characterised based on
their sphericity (S) and roundness (R). This was done by observing a group of
well-scattered grains that are similar in size to the D50 (710 – 600 µm) under an
optical microscope and comparing their shape against the Krumbein and Sloss
(1963) particle shape chart (see Fig. 3.9 and Fig. 3.10). This procedure was
repeated three times, where 15 – 20 individual particles were carefully examined
for each of the selected granular materials, and the average values are given in
Table 3.1. It is important to mention that particle roughness (surface texture),
which is the third parameter commonly used for particle shape description (e.g.
Barrett, 1980, Sukumaran and Ashmawy, 2001, Clayton et al., 2009, Cho et al.,
2006), is not considered herein because it has no effect on 1-D compression
behaviour of granular soils at the LCC state as pointed out in Section 2.5.2.
3.5 Correlations amongst Index Properties
As a means of ensuring self-consistency of the set of index parameters
calculated for each soil type, the correlations among the different index properties
(Table 3.1) were explored. The relationship between emax and emin was

26
investigated by plotting their obtained values against each other in Fig. 3.11. It
can be seen from the figure that there is a direct correlation between them; higher
emax translates into higher emin and vice versa. This observed trend is in agreement
with those reported by Cubrinovski and Ishihara (2002) for a wide variety of soil
types. The effects of PSD and particle shape on the emax and emin are also
examined in Fig. 3.12 through Fig. 3.15.
The obtained emax and emin are plotted against Cu in Fig. 3.12 and Fig. 3.13,
and against particles roundness in Fig. 3.14 and Fig. 3.15. As expected (e.g. Cho
et al., 2006, Biarez and Hicher, 1994, Cubrinovski and Ishihara, 2002), it can be
seen from the figures that emax and emin are clearly a function of PSD shape and
particle shapes in such a way that they increase with uniformity of the PSD and
decrease with increase in the roundness of the particles.
3.6 Sample Preparation and Experimental Procedure
At least four 1-D confined compression tests were performed on each of the
eleven soil types tested. All specimens were tested dry and prepared at initially
loose and dense states. The specimens were prepared directly in the compression
mould cavity which was in turn placed on two overlapping sheets of A3 paper laid
on a horizontal surface. A known mass of the sample, usually 20 % greater than
the mass anticipated to fill the mould was weighed out to prepare the specimen.
For the loose state specimens, the known mass of the sample was poured in a
small handheld funnel whose 6 mm diameter outlet rested on the bottom of the
compression mould cavity. The funnel was then gradually lifted in spiral manner,
allowing the sample to be deposited with minimum disturbance until the mould

27
was full. For the dense state specimens, the mould was filled in five layers.
Following the pouring of each layer, the mould was tapped horizontally with a
rubber mallet until there was no further noticeable settlement. In both instances,
excess material above the top surface of the specimen was carefully trimmed with
a straightedge and the mould was gently cleaned with a brush. Afterwards, the
mould top cap was centrally placed on the prepared specimen and the mould was
then positioned in the compression machine. The sand particles that fell on the A3
paper were retrieved and weighed. The mass of the specimen, MS, was then
obtained by subtracting the mass of the remaining sample and the mass of
retrieved material from the initial mass of the sample.
Upon placing the prepared specimen in the compression machine, two LVDTs
were positioned to measure the vertical displacements of the specimen during
compression. For at least two tests made on each of the eleven soil types, a third
LVDT was introduced to measure the horizontal expansion of the mould under
compression. The horizontal LVDT was held by a magnetic stand with its tip
placed close to the upper edge of the compression mould (Fig. 3.1) where largest
lateral expansion is expected.
It is important to point out that only one horizontal LVDT was used because
of space limitation of the compression machine (Fig. 3.6) and, because ideally
owing to the geometry of the mould the readings taking at a point on its
circumference would be the same throughout the circumference. The proof of this
claim can be seen from Fig. 3.16. In the figure, the percentage lateral expansion
of the mould, taken by two horizontal LVDTs used in one of the preliminary tests
conducted using the discrete increments compression machine, is plotted against

28
the vertical effective stress. The maximum lateral strain measured was 0.26 %.
This value is greater than 0.03 % specified in ASTM D2435 (Table 2.1), but
compares favourably with the radial strain of 0.33% reported by Yamamuro et al.
(1996). It is noted that the radial strain measured at the circumferential edge of
the mould may differ from the lateral strain experienced by the specimen within
the cavity in which it is housed. However, given the experimental difficulties in
measuring lateral strain inside the cavity, the radial strain computed from the
LVDT readings were used herein as a proxy for the radial strain of the specimen.
This approach was deemed preferable to not reporting any radial strains as often
occurs in the literature (Table 2.1).
Following the positioning of the LVDTs, the testing was commenced with the
load and displacement readings logged at two seconds intervals. All specimens
were loaded at selected rate of 50 kN/min until the load reached about 630 kN
which corresponds to a vertical compressive stress of 190 MPa on the specimens.
Results from preliminary tests indicated that this stress level was sufficient for the
attainment of the LCC for all the selected soil types. The loading was then
stopped so as to keep the position of the loading platform constant and the final
height of the specimen, Hf, was taken using a telescopic measuring gauge (Fig.
3.17) used in tandem with a digital caliper. The precision of Hf readings taken at
diametric opposite points around the perimeter of the mould is 0.15 mm on
average for all tested specimens.
The loading platform was then lowered without any further reading of load or
displacement, the mould was removed and the compressed specimen was

29
retrieved for post-compression PSD analysis to determine the extent of particle
crushing.
3.7 Experimental Data Presentation, Processing and Calculations
3.7.1 Void ratio calculation
The readings taken by the two vertically positioned LVDTs were averaged to
calculate the void ratio, 𝑒, under any particular pressure during the test. The void
ratio was calculated as follows;
e = VV
VS=
VT− VS
VS (3.1)
where VV is the volume of voids, VS is the volume of solids and VT is the total
volume of the specimen. VS was calculated as:
VS = Ms
Gs × ρw (3.2)
Ms = mass of the specimen,
Gs = specific gravity of the specimen
ρw = density of water (taken as 1 g/cm3).
Since VS was constant throughout the test, the void ratio was determined by
changes in VT only. VT was calculated as:
VT = A × Hs (3.3)
A = cross sectional area of the specimen
Hs = equivalent height of specimen
Hs = Hf + ∆H (3.4)
Hf = final height of the specimen measured when the maximum load was reached.

30
∆H = change in height of the specimen measured by LVDTs
3.7.2 1-D confined compression data processing and presentation
The compression data from the tests were plotted from 10 MPa to the
maximum stress level attained (190 MPa). Limitations in the minimum load that
can be applied with the compression machine did not allow the calculation of the
compression curve of some of the specimens at stress levels below 10 MPa (i.e.
sometimes the initial stress was lower than 10 MPa). Each test is defined by a
code whose first two letters indicate the soil type (see Table 3.1), followed by the
relative density expressed as a percentage under a compressive stress of 10 MPa.
For example, AB_123 represents angular, broad PSD, 123 % relative density at
10 MPa.
For each test, the resulting compression curve was defined by over 250 data
points. However, for ease of data analysis and presentation each compression
curve was reduced to 35 points that corresponded to σ'v values that were equally
spaced on a logarithmic scale between 10 MPa to 190 MPa. For every reduced
compression curve, the void ratio that corresponded to each of the 35 σ'v values
was linearly interpolated from the measured compression curve defined by over
250 data points. This approach is illustrated in Fig. 3.18.
Pestana and Whittle (1995), defined the LCC as the portion of the
compression curve for which the effect of initial density disappears. In this study,
the LCC was determined as follows. If the number of compression curves
measured on a given soil type is termed n, this implies that there are n values of
void ratio measured at each of the 35 stress levels used to define each curve. The

31
difference between the n void ratios measured at a particular level of stress is a
function of the stress level. That is, the difference is large when the stress level is
low which means the influence of the initial density of the samples is significant.
However, the difference becomes smaller as the compression curves approach the
LCC state and tend to merge into a unique curve. This is illustrated in Fig. 1.1,
where three compression curves are presented (n = 3). As suggested by the
vertical lines, the difference between the three void ratios (n = 3) is significant at
a stress of 1000 kPa. This difference reduces progressively as the stress increases
to 10,000 kPa and 100,000 kPa where the LCC is reached and the difference is
relatively small. As suggested by the figure, the differences in void ratio remain
small and approximately constant once the LCC is reached. Accordingly, in this
study, the standard deviation of the void ratios measured at a particular stress
level was computed by considering the n compression curves corresponding to a
soil type. This standard deviation was a means of quantifying the difference
between void ratios which is expected to reduce and stabilise as the compression
curves reach the LCC. The standard deviation was then plotted against stress
level, and it was assumed that the LCC was defined over the stress range where
the standard deviation was small and stable. For instance, Fig. 3.19 shows the plot
of standard deviation of void ratio versus effective stress for the angular broad
PSD (AB) soil type. In this case the standard deviation of the void ratio is seen to
largely stabilise at a minimum value of 0.00025 when σ'v reaches 40 MPa.
Accordingly, the σ'v domain of the LCC was taken as σ'v greater than 40 MPa.
Furthermore, in order to define a unique LCC for each of the tested soil types, the
n void ratios that corresponded to a unique stress level within the LCC range were

32
averaged. The LCC was then characterized with the compression model suggested
by Pestana and Whittle (1995) (Equation 2.2).
3.7.3 Particle crushing measurement
The amount of particle crushing induced by the compression on each of the
soil types was quantified using the breakage parameters proposed by Hardin
(1985) (Fig. 3.20). Hardin suggested that the amount of breakage could be
measured by the area between the pre and post-compression PSD curves,
considering only the part above 74 µm sieve size. He devised two different
quantities: the breakage potential (Bp), and the total breakage (Bt). Bp is defined
as the area between the pre-compression PSD curve of the sample and a vertical
at 74 µm; while Bt is defined as the area between the pre and post-compression
PSD curves. He then defined the relative breakage of the sample, Br, as the ratio
of Bt to Bp. Br has a lower limit of zero, which means no particle breakage, and a
theoretical upper limit of unity which represents complete breakage of the
particles to the extent that no particle remains larger than 74 µm.
3.8 Summary
In this chapter, the 1-DCC testing equipment used in this study was described.
The adopted method of load application was justified. Also, the selected soil types
were described and summarised in Table 3.1. Finally, the conceptual framework
used for sample preparation, experimental procedure, and experimental data

33
presentation, processing and calculations are laid out. The following chapter will
present the experimental results.
3.9 Figures and Tables
Fig. 3.1 Compression mould placed in the compression machine and with the
three displacement transducers in place.

34
Fig. 3.2 1-D confined compression testing equipment data acquisition system.
TOP VIEW
CROSS SECTION
Fig. 3.3 Schematic diagram of the compression mould vessel (all dimensions are
in mm).
65 37.5 37.5
10
4
6 2
4 3
0 40
140
65
z

35
Fig. 3.4 PSD curves of the samples used for preliminary study.
Fig. 3.5 Compression curves of the samples used for preliminary study; DL;
discrete loading compression machine; CL; continuous loading compression
machine; UG, uniformly graded PSD; WG, widely graded PSD.

36
Fig. 3.6 Continuous rate of stress loading compression machine.

37
Fig. 3.7 Discrete loading compression machine.
Fig. 3.8 PSD curves of the soil types tested.

38
Filter sand Delta river sand
Lowveld River sand Glass beads
Fig. 3.9 Microscope images showing the particle shape of the four different
sources of granular materials tested.
Fig. 3.10 Krumbein and Sloss (1963) Particle shape determination chart.

39
Fig. 3.11 Relation between emax and emin of the selected soil types.
Fig. 3.12 Relationship between emax and PSD.
Fig. 3.13 Relationship between emin and PSD.

40
Fig. 3.14 Relationship between emax and particle roundness.
Fig. 3.15 Relationship between emin and particle roundness.
Fig. 3.16 Compression mould lateral expansion measured from two horizontal
LVDTs.

41
Fig. 3.17 Telescopic gauge used to measure the final height of the specimens, Hf.

42
(a)
(b)
Fig. 3.18 Illustration of the approach used in defining the 1-D compression curve
obtained herein; (a) initial data points (b) refined 35 data points.

43
Fig. 3.19 LCC determination for the angular, broad PSD soil type.
Fig. 3.20 Hardin (1985) particle breakage measurement parameters.

44
Table 3.1 Fundamental index properties of the selected soil types.
Soil
type
D50
(mm)
D10
(mm)
D60
(mm)
Cu R S Shape
term
emax emin
AB 0.6 0.265 0.73 2.8 0.24 0.58 A 0.75 0.61
AI 0.6 0.345 0.685 2.0 0.24 0.58 0.86 0.68
AN 0.6 0.465 0.65 1.4 0.24 0.58 0.89 0.73
SB 0.6 0.265 0.73 2.8 0.42 0.61 SA 0.76 0.59
SI 0.6 0.345 0.685 2.0 0.42 0.61 0.84 0.64
SN 0.6 0.465 0.65 1.4 0.42 0.61 0.91 0.70
RI 0.6 0.345 0.685 2.0 0.78 0.81 R 0.65 0.51
RN 0.6 0.465 0.65 1.4 0.78 0.81 0.67 0.53
BB 0.6 0.265 0.73 2.8 1 1 B 0.53 0.44
BI 0.6 0.345 0.685 2.0 1 1 0.62 0.51
BN 0.6 0.465 0.65 1.4 1 1 0.68 0.57
Soil type: AB, AI and AN represent angular broad, intermediate and narrow PSD;
SB, SI and SN represent sub-angular broad, intermediate and narrow PSD; RI and
RN represent rounded intermediate and narrow PSD; while BB, BI and BN
represent beads broad, intermediate and narrow PSD, respectively.
Particles shape term: A – Angular; SA – Sub-angular; R – Rounded; B – Beads.
Table 3.2 XRF major chemical composition analysis results.
Sample Chemical composition (%)
Filter sand SiO2 (97.52 %) Al2O3 (0.60 %) LOI (0.57 %)
Delta river sand SiO2 (82.00 %) Al2O3 (8.46 %) K2O (3.73 %)
Lowveld river sand SiO2 (95.99 %) Al2O3 (1.29 %) LOI (0.58 %)
Glass beads SiO2 (71.46 %) Na2O (13.74 %) CaO (9.00 %)

45
4 EXPERIMENTAL RESULTS
4.1 Introduction
Fifty 1-DCC tests were performed. The main features of the tests are
presented in Table 4.1 and discussed in this chapter.
4.2 1-D Confined Compression Curves
A typical result of 1-DCC tests performed on the soil types tested in this study
is presented in e-logσ'v and loge-logσ'v spaces in Fig. 4.1(a) and Fig. 4.1(b),
respectively. Both of these spaces are used in the technical literature as pointed
out in Section 2.4. It is evident from the figure that the last part of the
compression curves, where the LCC is expected to develop, is better linearized in
the loge-logσ'v space than it is in the conventional e-logσ'v space. It is interesting
to point out that the anticipated LCC portion of the compression curve of the
beads soil type is not as linear as that of the natural sand, indicating that not all
granular soils linearize equally well, even, in the loge-logσ'v space.
However, in this current work the compression behaviour of the tested soil
types will be characterised with the coefficient of compressibility, which has been
termed 𝑎𝑣 by precious researchers (e.g. Donald, 1948, Lambe and Whitman,
1969). The parameter 𝑎𝑣 is numerically equal to the slope of compression curve
plotted on natural space of e versus σ'v (Fig. 4.1(c), Equation 4.1). The usual
practice of multiplying 𝑎𝑣 by 1000 has also been adopted herein to avoid
inconveniently small values.

46
𝑎𝑣 = −(𝛿𝑒 𝛿𝜎′𝑣⁄ ) × 1000 (4.1)
The compression curves of all the intermediate PSD soil types tested are
presented in Fig. 4.2 to Fig. 4.5 (see Appendix A for the corresponding plots of
the remaining soil types). In order to investigate the effect of initial density, PSD
and particle shape on the compression behaviour of the samples, the coefficients
of compressibility (𝑎𝑣) of representative samples of the tested soil types are
plotted against the vertical effective stress in Fig. 4.6 through Fig. 4.14. It can be
seen from Fig. 4.6 to Fig. 4.9 that for samples of a soil type, compressibility
increases with decrease in the initial density (relative density @ 10 MPa as here
used) at the early stage of the compression curves, and they later merge into a
single compression curve, which signifies the emergence of the LCC state. Fig.
4.10 to Fig. 4.13 show that compressibility increases with PSD’s uniformity, for
samples of a given particle roundness having approximately the same initial
density. These observed trends are in agreement with the typical well-known
behaviour of sands (e.g. Hendron, 1963, Altuhafi et al., 2012, Nakata et al.,
2001). However it can be seen from Figs 4.11 – 4.14 that above a stress level of
about 110 MPa for the angular and sub-angular samples, and 135 MPa for the
rounded and beads samples, the compressibility of the samples appears to be
independent of PSD.
With regard to the effect of particle shape on compressibility, it can be seen
from Fig. 4.14(a) that particle does not have a simple influence on compressibility
of non-plastic soils, but instead the influence varies with the applied stress. The
figure shows that compressibility decreases with increased particle roundness at
stress region below 47 MPa with the AN soil type having the highest

47
compressibility. Between 47 MPa to 58 MPa the RN soil type takes the lead. The
BN soil type overtakes the RN between 58 MPa to about 140 MPa. And
afterwards, the effect of particle shape on compressibility diminishes as the
compressibility curves of all the soil types merge into a single line. It is
interesting to note that, since compressibility increases with decrease in initial
density (Fig. 4.6 - Fig. 4.9), one would expect the AN and SN samples with
relative density (RD) @ 10 MPa of 119 % and 100 %, respectively, to be more
compressible than the RN and BN samples with RD @ 10 MPa of 121 % and 127
%, respectively. It can be seen in Fig. 4.14(a) that at σ'v < 47 MPa, the AN and
SN samples exhibit greater compressibility than the RN and BN samples. Given
the greater angularity and lower RD of the AN and SN samples, this behaviour is
in agreement with previously reported results (e.g. Hagerty et al., 1993, Lade et
al., 1996). However, at σ'v > 140 MPa, the compressibility of the different soil
types is very similar. It is hypothesised that this similarity in compressibility is
due to the extensive crushing that all samples underwent (see breakage results in
Table 4.2) which results in all particles acquiring more angular shapes as the test
progresses.
4.3 The Limiting Compression Curves
Fig. 4.15 to Fig. 4.18 show the plots of standard deviation of the void ratios
against vertical effective stress for the intermediate PSD soil types (see Appendix
B for the corresponding plots of the remaining soil types). The rationale behind
this plot was given in Section 3.7.2. The stress level at which the LCC begins was
defined as the stress level that corresponds to the point at which the standard

48
deviation of the void ratio stabilise at a relatively low value. The stress level at
which each of the tested soil types reaches the LCC is given in Table 4.2.
Interestingly, all the tested soil types regardless of their PSD and particle shape
attained the LCC within the stress range of 10 – 100 MPa suggested by Shipton
and Coop (2012) for clean quartz sands.
Having determined the stress level that marks the commencement of the LCC
for each of the tested soil types, the LCC was obtained by averaging the
compression curves of each soil type that fell in the LCC domain, and modelled
with Equation 2.2. The resulting LCCs are presented in Fig. 4.19 - Fig. 4.22 for
the angular, sub-angular, rounded and beads soil types respectively, and the
obtained LCC parameters (ρc and σ'r) are given in Table 4.2.
As in the case of the emax and emin, it would be helpful to know the relationship
between the two LCC parameters. Although, unlike the emax and emin, ρc and σ'r are
obtained from the same test. To examine this, the two parameters are plotted
against each other for all the soil types tested in Fig. 4.23. The figure shows that
there is a strong (R2 = 0.995) positive linear correlation between ρc and σ'r. The
equation of the relation is given in Equation (4.2). However, it is unclear whether
the observed strong correlation is affected by variation in D50 and particle
hardness (mineralogy) since these parameters were kept constant in the present
study. This needs future investigation.
𝜎′𝑟 = 35.82 (MPa)𝜌𝑐 − 10.74 (MPa) (4.2)

49
4.3.1 Relationship between the LCC and compressibility
Given the strong correlation between ρc and σ'r, and in order to quantify the
compressibility of the soil types at the LCC state, the relationship between the
LCC and the coefficient of compressibility (𝑎𝑣) is expressed as follows:
Recall that;
log(𝑒) = −𝜌𝑐 ∙ log (𝜎′ 𝜎′𝑟)⁄ (Equation 2.2)
This can be rewritten as;
log(𝑒) = 𝜌𝑐 ∙ log (𝜎′𝑟 𝜎′)⁄ (4.3)
𝑒 = (𝜎′𝑟 𝜎′)⁄𝜌𝑐 = 𝜎′𝑟
𝜌𝑐 . 𝜎′−𝜌𝑐 (4.4)
Differentiate Equation 4.4 with respect to 𝜎′
𝑑𝑒 𝑑𝜎′⁄ = − 𝜌𝑐. 𝜎′𝑟
𝜌𝑐 . 𝜎′−𝜌𝑐−1 (4.5)
Substitute 35.82 (MPa)𝜌𝑐 − 10.74(MPa) for 𝜎′𝑟 (Equation 4.2) in Equation 4.5
𝑑𝑒 𝑑𝜎′⁄ = − 𝜌𝑐(35.82 𝜌𝑐 − 10.74)𝜌𝑐 . 𝜎′−𝜌𝑐−1 (4.6)
Therefore;
−𝑑𝑒 𝑑𝜎′⁄ = 𝜌𝑐(35.82 𝜌𝑐 − 10.74)𝜌𝑐 . 𝜎′−𝜌𝑐−1 = 𝑎𝑣 (Equation 4.1) (4.7)
Equation 4.7 is plotted against the logarithm of vertical effective stress for
four values of ρc that span the range of measured values reported in Table 4.2.
That is from 0.4 to about 0.7. As it is for the av, it is evident from the figure that,
considering the correlation between ρc and σ'r of the soil types (Fig. 4.23 and

50
Equation 4.2), higher ρc (i.e. steeper LCC) translates into a higher compressibility
at the LCC state. This result indicates that there is a direct correlation between ρc
and the coefficient of compressibility av at the LCC state.
4.4 Particle Crushing
Fig. 4.25 - Fig. 4.28 show the post-compression sieve analysis results for one
loose and one dense specimen for each of the intermediate PSD soil types tested
(see appendix C for the corresponding plots for the other soil types). The average
value of amount of particle crushing induced by compression on the specimens of
each of the soil types, as quantified using Hardin (1985) breakage parameters
(Fig. 3.20), are presented in Table 4.2. It can be seen from the table and from Fig.
4.29 and Fig. 4.30 that, in agreement with the typical behaviour of sand,
generally, particle breakage increases with PSD uniformity and angularity of the
samples’ particle shape. The reason for this behaviour, according to Lade et al.
(1996) is that, in uniformly graded samples, contact stress between the particles is
higher due to the small number of particles surrounding each particle (low
coordinate number) compared to the well-graded samples. In the well-graded
samples, larger particles are cushioned by large numbers of neighbouring finer
particles, thereby reducing the contact stress acting on the particle, which in turn
reduces breakage. Also in the angular particle samples, contact stress tends to
concentrate along the narrow dimension of the particles, thus crushing them more
easily compared to the less angular particles.

51
4.5 Compression Mould Lateral Deformations
The maximum lateral expansion of the mould under the maximum applied
pressure (190 MPa), as it can be seen from Table 4.1, is 0.022 mm. This is equal
to 0.07 % when expressed as a percentage of the original diameter of the mould.
This expansion is greater than the limit of 0.03 % specified in ASTM D2435, but
it is less than 0.33 % reported by Yamamuro et al. (1996) in their study. The fact
that the measured lateral strains are of the same order of magnitude than those
specified by ASTM D2435 for lower stress levels, and that they compare
favourably to the lateral strains reported by Yamamuro et al. (1996), suggests that
the compression mould performed adequately.
4.6 Figures and Tables
(a)

52
(b)
(c)
Fig. 4.1 Typical 1-D confined compression curves of the tested soil types in: (a)
semi-logarithmic space; (b) double-logarithmic space; (c) natural space.

53
Fig. 4.2 AI soil type 1-D compression curves.
Fig. 4.3 SI soil type 1-D compression curves.

54
Fig. 4.4 RI soil type 1-D compression curves.
Fig. 4.5 BI soil type 1-D compression curves.

55
Fig. 4.6 Effect of initial relative density on compressibility for the AI soil type.
Fig. 4.7 Effect of initial relative density on compressibility for the SI soil type.

56
Fig. 4.8 Effect of initial relative density on compressibility for the RI soil type.
Fig. 4.9 Effect of initial relative density on compressibility for the BI soil type.

57
(a)
(b)
Fig. 4.10 Effect of PSD on compressibility for the angular soil types.

58
(a)
(b)
Fig. 4.11 Effect of PSD on compressibility for the sub-angular soil types.

59
(a)
(b)
Fig. 4.12 Effect of PSD on compressibility for the rounded soil types.

60
(a)
(b)
Fig. 4.13 Effect of PSD on compressibility for the beads soil types.

61
(a)
(b)
Fig. 4.14 Effect of particle shapes on compressibility.
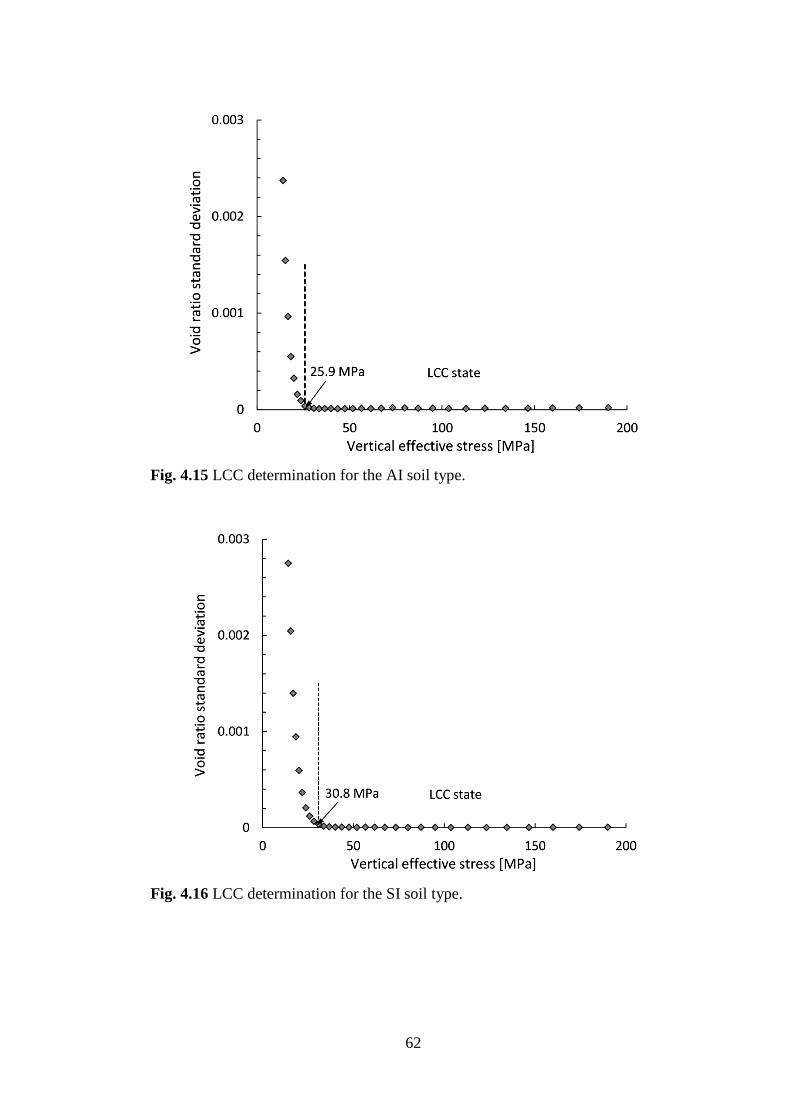
62
Fig. 4.15 LCC determination for the AI soil type.
Fig. 4.16 LCC determination for the SI soil type.

63
Fig. 4.17 LCC determination for the RI soil type.
Fig. 4.18 LCC determination for the BI soil type.

64
Fig. 4.19 Limiting compression curves of the angular soil types.
Fig. 4.20 Limiting compression curves of the sub-angular soil types.

65
Fig. 4.21 Limiting compression curves of the rounded soil types.
Fig. 4.22 Limiting compression curves of the beads soil types.

66
Fig. 4.23 Relationship between the LCC parameters.
Fig. 4.24 Relationship between the LCC and compressibility.

67
Fig. 4.25 Pre and post-compression PSD curves of the AI soil type.
Fig. 4.26 Pre and post-compression PSD curves of the SI soil type.

68
Fig. 4.27 Pre and post-compression PSD curves of the RI soil type.
Fig. 4.28 Pre and post-compression PSD curves of the BI soil type.

69
Fig. 4.29 Effect of PSD on particle breakage.
Fig. 4.30 Effect of particles roundness on particle breakage.

70
Table 4.1 1-D confined compression testing program summary.
S/N Specimen
identifier
Particle
shape
PSD
type
Set-up
void
ratio (e
before
loading)
e @10
MPa
Relative
density, Dr
(%) @10
MPa
Final e
@190
MPa
Lateral
expansion
(mm) @190
MPa
Max. lateral
expansion of
mould (%)
1 AB_164
Angular
Broad
0.64 0.52 164 0.19 unreliable not available
2 AB_150 0.66 0.54 150 0.20 0.007 0.02
3 AB_121 0.88 0.58 121 0.19 not measured not available
4 AB_114 0.88 0.59 114 0.20 not measured not available
5 AB_114 0.85 0.59 114 0.21 not measured not available
6 AI_156
Inter
0.73 0.58 156 0.20 0.004 0.01
7 AI_161 0.70 0.57 161 0.20 0.002 0.01
8 AI_111 0.95 0.66 111 0.20 not measured not available
9 AI_111 0.95 0.66 111 0.20 not measured not available
10 AI_111 0.96 0.66 111 0.20 not measured not available
11 AN_156
Narrow
0.80 0.64 156 0.20 0.005 0.02
12 AN_163 0.77 0.63 163 0.20 0.008 0.03
13 AN_113 1.01 0.71 113 0.20 not measured not available
14 AN_106 1.02 0.72 106 0.21 not measured not available
15 AN_119 1.01 0.7 119 0.20 not measured not available
16 SB_141
Sub
Broad
0.64 0.52 141 0.20 unreliable not available
17 SB_147 0.62 0.51 147 0.20 0.003 0.01

71
S/N Specimen
identifier
Particle
shape
PSD
type
Set-up
void
ratio (e
before
loading)
e @10
MPa
Relative
density, Dr
(%) @10
MPa
Final e
@190
MPa
Lateral
expansion
(mm) @190
MPa
Max. lateral
expansion of
mould (%)
18 SB_94
Sub
Broad
0.86 0.6 94 0.21 0.004 0.01
19 SB_106 0.84 0.58 106 0.19 unreliable not available
20 SI_135
Inter
0.69 0.57 135 0.20 0.01 0.03
21 SI_140 0.67 0.56 140 0.20 0.003 0.01
22 SI_95 0.95 0.65 95 0.20 0.003 0.01
23 SI_100 0.94 0.64 100 0.20 0.008 0.03
24 SN_143
Narrow
0.75 0.61 143 0.20 0.011 0.03
25 SN_138 0.76 0.62 138 0.21 unreliable not available
26 SN_100 1.01 0.7 100 0.21 unreliable not available
27 SN_95 1.02 0.71 95 0.22 unreliable not available
28 RI_129
Round
Inter
0.55 0.47 129 0.20 0.007 0.02
29 RI_129 0.55 0.47 129 0.20 0.005 0.02
30 RI_64 0.72 0.56 64 0.20 0.014 0.04
31 RI_57 0.72 0.57 57 0.19 0.022 0.07
32 RN_121
Narrow
0.59 0.5 121 0.21 0.005 0.02
33 RN_121 0.58 0.5 121 0.21 unreliable not available
34 RN_36 0.77 0.62 36 0.20 0.015 0.05
35 RN_29 0.77 0.63 29 0.20 unreliable not available
36 BB_122 0.56 0.42 122 0.16 unreliable not available

72
S/N Specimen
identifier
Particle
shape
PSD
type
Set-up
void
ratio (e
before
loading)
e @10
MPa
Relative
density, Dr
(%) @10
MPa
Final e
@190
MPa
Lateral
expansion
(mm) @190
MPa
Max. lateral
expansion of
mould (%)
37 BB_122
Beads
Broad
Broad
0.57 0.42 122 0.17 0.004 0.01
38 BB_56 0.64 0.48 56 0.17 not measured not available
39 BB_44 0.64 0.49 44 0.18 not measured not available
40 BB_44 0.64 0.49 44 0.18 not measured not available
41 BI_109
Inter
0.65 0.5 109 0.18 0.005 0.02
42 BI_118 0.64 0.49 118 0.17 unreliable not available
43 BI_45 0.73 0.57 45 0.17 not measured not available
44 BI_64 0.73 0.55 64 0.17 not measured not available
45 BI_55 0.73 0.56 55 0.17 not measured not available
46 BN_127
Narrow
0.70 0.54 127 0.18 0.018 0.06
47 BN_127 0.69 0.54 127 0.18 0.011 0.03
48 BN_45 0.80 0.63 45 0.18 not measured not available
49 BN_36 0.79 0.64 36 0.19 not measured not available
50 BN_45 0.79 0.63 45 0.18 not measured not available

73
Table 4.2 The LCC and particle breakage characteristics of the tested soil types.
Soil type 𝛒𝐜 𝛔′𝐫 [𝐌𝐏𝐚] 𝛔′𝐯@𝐋𝐂𝐂 [𝐌𝐏𝐚] Relative
breakage, Br
Cu R 𝐞𝐦𝐚𝐱 𝐞𝐦𝐢𝐧
AB 0.40 3.4 40.0 0.32 2.8 0.24 0.75 0.61
AI 0.423 4.2 25.9 0.35 2.0 0.24 0.86 0.68
AN 0.437 4.9 23.8 0.53 1.4 0.24 0.89 0.73
SB 0.412 3.9 33.6 0.33 2.8 0.42 0.76 0.59
SI 0.432 4.7 30.8 0.31 2.0 0.42 0.84 0.64
SN 0.435 5.2 30.8 0.51 1.4 0.42 0.91 0.70
RI 0.456 5.5 43.6 0.23 2.0 0.78 0.65 0.51
RN 0.480 6.9 43.6 0.41 1.4 0.78 0.67 0.53
BB 0.683 13.5 95.0 0.09 2.8 1 0.53 0.44
BI 0.639 12.5 95.0 0.1 2.0 1 0.62 0.51
BN 0.593 10.2 87.1 0.32 1.4 1 0.68 0.57

74
5 CORRELATION BETWEEN THE LCC PARAMETERS AND PSD,
PARTICLE SHAPE AND LIMIT VOID RATIOS
5.1 Introduction
The experimental results presented in previous chapters (as summarized in
Table 4.2) are discussed in this chapter. This is done to investigate the
correlations between the LCC parameters and PSD, particle shape and limit void
ratios (emax and emin).
5.2 Correlation between the LCC parameters and PSD
In order to investigate the relationship between the LCC and PSD, Cu is
plotted against ρc and σ′r (Table 4.2) in Fig. 5.1 and Fig. 5.2 respectively. It can
be seen from the figures that the values of both ρc and σ′r decrease approximately
linearly with increase in Cu for all the granular materials tested except for the
beads samples where the opposite is the case. The reason for the atypical
behaviour of the beads samples might be because of the idealized geometry of
their particles, which permits easy sliding and rolling of the particles under
compression. As a result of less friction generated among the particles (as they
rearrange their orientation), they were able to form a tighter packing fabric.
Consequently, the effect of initial formation densities was eliminated, which
results in the emergence of the LCCs with a lesser particle breakage (Table 4.2)
when compared with the samples of the natural sands of the same PSD. For
instance, the Br value of the BI soil type is 0.1 which is lower than 0.23, 0.31 and
0.35 for the RI, SI and AI soil types, respectively. Although one would expect the

75
beads to have the highest Br because they have the lowest particle hardness (Table
3.2) of the four different sources of granular materials tested.
However, Figs. 5.1 and 5.2 show (for the natural sands) that the more uniform
the PSD, the steeper the LCC, which means the more compressible is the sample
(Fig. 4.24). This observation is in agreement with the results of previous
investigators such as Altuhafi and Coop (2011), Roberts and De Souza (1958) and
Roberts (1964). It is also consistent with the result presented in Fig. 4.10 - Fig.
4.13 which showed that compressibility increases with PSD’s uniformity, for soil
types of a given particle shape. This observed trend implies that, at the LCC state,
compressibility of non-plastic sands increases with PSD’s uniformity.
5.3 Correlation between the LCC parameters and Particle shape
Fig. 5.3 and Fig. 5.4 depict the influence of particle shape on the LCC. In the
figures particle roundness are plotted against ρc (Fig. 5.3) and σ′r (Fig. 5.4) for all
the tested soil types. It can be seen from the figures that there is a systematic non-
linear relationship between the LCC parameters and particle shape. Both ρ′c and
σ′r increase with particle roundness for a given PSD of the tested granular
materials. This observation signifies that the LCC becomes steeper (ρ′c increases)
with increase in particle roundness, which is in agreement with the result of
Cavarretta et al. (2010). Accordingly, although the compressibility of the angular
soils is greater than the compressibility of rounded soils at σ′v ˂ 47 MPa (e.g. Fig.
4.14a), this trend is reversed when the soils reach the LCC (Fig. 5.3).

76
5.4 Correlation between the LCC parameters and the emax and emin
The correlation between the LCC and the reference void ratios is explored in
Fig. 5.5 through Fig. 5.8. In Fig. 5.5 and Fig. 5.6, ρc is plotted against emax and
emin respectively, while Fig. 5.7 and Fig. 5.8 present the same plots for σ′r. The
figures show that, there is a relative weak positive correlation between the LCC
parameters and emax and emin for each of the natural sands, while the beads on the
other hand suggest the opposite. Nonetheless, the result is insightful; it may be
interpreted in terms of compressibility at the LCC state that, for samples of a
given natural sand, the higher the emax and emin of a sample, the more
compressible it is.
5.5 Figures
Fig. 5.1 Relationship between ρc and Cu.

77
Fig. 5.2 Relationship between σ′r and Cu.
Fig. 5.3 Relationship between ρc and particle roundness.
Fig. 5.4 Relationship between σ′r and particle roundness.

78
Fig. 5.5 Relationship between ρc and emax.
Fig. 5.6 Relationship between ρc and emin.
Fig. 5.7 Relationship between σ′r and emax.

79
Fig. 5.8 Relationship between σ′r and emin.

80
6 CONCLUSION AND RECOMMENDATIONS
6.1 Conclusion
With the aim of better understanding of how PSD and particle shape affect the
LCC, a series of high pressure 1-DCC tests was conducted on eleven non-plastic
soil types. Three different PSDs, with Cu equal to 1.4, 2.0 and 2.8 were
considered. In order to eliminate the effect of variation in D50, the three PSDs had
a common D50 of 0.6 mm (Fig. 3.8). Four different particle shapes were
considered, ranging from angular to spherical beads (Fig. 3.9). The predominant
mineralogy of all the tested soils was quartz (Table 3.2). Specimens of different
initial formation densities (presented by void ratio) were tested for each of the
eleven soil types. The range of vertical effective stresses considered was from 10
MPa to 190 MPa.
The following conclusions can be drawn:
1. When the LCC is modelled in a doubly logarithmic compression plane,
there is a strong linear positive correlation between its slope (ρc) and the
reference vertical effective stress at a unit void ratio (σˈr) (Fig. 4.23,
Equation 4.2).
2. Given the direct correlation between ρc and σˈr identified herein (Fig.
4.23, Equation 4.2), there is a direct correlation between ρc and the
coefficient of compressibility av at the LCC state (Section 4.3.1, Fig.
4.24).
3. At the LCC, the compressibility of natural sands is positively correlated to
the initial uniformity of the PSD, whereas for spherical glass beads the

81
compressibility was negatively correlated to the initial uniformity of the
PSD (Fig. 5.1).
4. Compressibility of non-plastic soils increases with particle roundness at
the LCC state (Fig. 5.3).
5. There is a weak positive correlation between the LCC parameters
(ρc and σˈr) and the limit void ratios (emax and emin) of natural sands (Fig.
5.5 - Fig. 5.8).
6.2 Recommendations for Future studies
Based on the limitations of the foregoing study and to build on, or validate its
findings, the following are the recommendations for future studies on non-plastic
soils to better understand their LCC.
1. Because only quarzitic sands are investigated herein, future studies should
test sands of different mineralogy such as carbonate and gypsum sands.
2. Because only one D50 is considered, future investigations should test PSDs
of different D50s to check whether the correlation between ρc and σˈr
identified herein depends on D50.
3. Because only poorly graded soil types are tested (Cu ˂ 6, Unified soil
classification system), future investigations should test more broadly
graded sands.
4. Future studies should investigate the reason for the atypical behaviour of
the beads soil type observed herein, since it is commonly used to model
natural sands for research purposes.

82
5. Future study should also consider the use of elastic finite element analysis
to estimate the lateral strains of soil samples during compression from the
radial strains measured at the outside edge of the compression mould.

83
7 REFERENCES
ALTUHAFI, F., O’SULLIVAN, C. & CAVARRETTA, I. 2012. Analysis of an image-
based method to quantify the size and shape of sand particles. Journal of
Geotechnical and Geoenvironmental Engineering, 139, 1290-1307.
ALTUHAFI, F. N. & COOP, M. R. 2011. Changes to particle characteristics
associated with the compression of sands. Géotechnique, 61, 459-471.
ASTM D854-04 Standard test methods for specific gravity of soil solids by water
pycnometer. ASTM International, West Conshohocken, PA.
ASTM D2435-04. Standard test method for one-dimensional consolidation
properties of soils using incremental loading. ASTM International, West
Conshohocken, PA.
ASTM D4186–06. Standard test method for one-dimensional consolidation
properties of saturated cohesive soils using controlled-strain loading.
ASTM International, West Conshohocken, PA.
ASTM D4254-00. Standard test methods for mimimum index density and unit
weight of soils and calculation of relative density. ASTM International,
West Conshohocken, PA.
BARRETT, P. J. 1980. The shape of rock particles, a critical review. Sedimentology,
27, 291-303.
BIAREZ, J. & HICHER, P.-Y. 1994. Elementary mechanics of soil behaviour:
saturated remoulded soils, AA Balkema.
CAVARRETTA, I., COOP, M. & O'SULLIVAN, C. 2010. The influence of particle
characteristics on the behaviour of coarse grained soils.

84
CHO, G.-C., DODDS, J. & SANTAMARINA, J. C. 2006. Particle Shape Effects on
Packing Density, Stiffness, and Strength: Natural and Crushed Sands.
Journal of geotechnical and geoenvironmental engineering, 132, 591-602.
CLAYTON, C. R. I., ABBIREDDY, C. O. R. & SCHIEBEL, R. 2009. A method of
estimating the form of coarse particulates. Geotechnique, 59, 493-501.
COOP, M. R. & LEE, I. K. 1993. The behaviour of granular soils at elevated
stresses, Thomas Telford London, UK.
COOP, M. R., SORENSEN, K. K., BODAS FREITAS, T. & GEORGOUTSOS, G. 2004.
Particle breakage during shearing of a carbonate sand. Géotechnique, 54,
157-163.
CUBRINOVSKI, M. & ISHIHARA, K. 2002. Maximum and minimum void ratio
characteristics of sands. Soils and foundations, 42, 65-78.
DONALD, W. T. 1948. Fundamentals of soil mechanics. Wiley, New
York/Chapman & Hall, London.
HAGERTY, M. M., HITE, D. R., ULLRICH, C. R. & HAGERTY, D. J. 1993. One-
dimensional high-pressure compression of granular media. Journal of
Geotechnical Engineering, 119, 1-18.
HARDIN, B. O. 1985. Crushing of soil particles. Journal of Geotechnical
Engineering, 111, 1177-1192.
HENDRON, J., ALFRED J. 1963. The Behavior of Sand in One-Dimensional
Compression. PhD, University of Illinois.
KRUMBEIN, W. C. & SLOSS, L. L. 1963. Stratigraphy and sedimentation, San
Francisco, Freeman and Company.

85
LADE, P. V., YAMAMURO, J. A. & BOPP, P. A. 1996. Significance of particle
crushing in granular materials. Journal of Geotechnical Engineering, 122,
309-316.
LAMBE, T. W. & WHITMAN, R. V. 1969. Soil mechanics. Massachusetts institute
of technology. John Wiley and Sons, New York.
LEUNG, C. F., LEE, F. H. & YET, N. S. 1997. The role of particle breakage in pile
creep in sand. Canadian Geotechnical Journal, 33, 888-898.
LIESKER, K. R. The relationship between the grading of a silica sand and the
applied stress. 8th South Africa Young Getechnical Engineers Conference,
2014 Stellenbosch, Western Cape, South Africa. 85-95.
MACROBERT, C. J. & TORRES-CRUZ, L. A. Evaluation of methods to determine
reference void ratios. First Southern African Geotechnical Conference,
2016 Sun City, South Africa. Taylor & Francis Group, London, 255-260.
MCDOWELL, G. R. 2002. On the yielding and plastic compression of sand. Soils
and foundations, 42, 139-145.
MCDOWELL, G. R. 2005. A physical justification for log e–log σ based on fractal
crushing and particle kinematics. Géotechnique, 55, 697-698.
MESRI, G. & VARDHANABHUTI, B. 2009. Compression of granular materials.
Canadian Geotechnical Journal, 46, 369-392.
MINH, N. H. & CHENG, Y. P. 2013. A DEM investigation of the effect of particle-
size distribution on one-dimensional compression. Géotechnique, 63, 44.

86
MOHAMMADZADEH, D., BAZAZ, J. B. & ALAVI, A. H. 2014. An evolutionary
computational approach for formulation of compression index of fine-
grained soils. Engineering Applications of Artificial Intelligence, 33, 58-68.
NAKATA, Y., KATO, Y., HYODO, M., HYDE, A. F. & MURATA, H. 2001. One-
dimensional compression behaviour of uniformly graded sand related to
single particle crushing strength. Soils and Foundations, 41, 39-51.
PESTANA, J. M. & WHITTLE, A. J. 1995. Compression model for cohesionless soils.
Géotechnique, 45, 611-632.
ROBERTS, J. E. 1964. Sand compression as a factor in oil field subsidence. PhD
thesis, Massachusetts Institute of Technology.
ROBERTS, J. E. 1969. Sand compression as a factor in oil field subsidence. Proc.
Tokyo Symp. on Land Subsidence, 368-376.
ROBERTS, J. E. & DE SOUZA, J. M. 1958. The compressibility of sands,
Massachusetts Institute of Technology.
SALAZAR, S. E. 2013. One-dimensional compressibility of intermediate non-plastic
soil mixtures. Honors Thesis, The University of Arkansas.
SCHOFIELD, A. & WROTH, P. 1968. Critical state soil mechanics, McGraw-Hill
London.
SHIPTON, B. & COOP, M. R. 2012. On the compression behaviour of
reconstituted soils. Soils and Foundations, 52, 668-681.
SINGH, A. & NOOR, S. 2012. Soil compression index prediction model for fine
grained soils. Int. J. Innov. Eng. Technol.(IJIET), 1, 34-37.

87
SUKUMARAN, B. & ASHMAWY, A. K. 2001. Quantitative characterisation of the
geometry of discret particles. Geotechnique, 51, 619-627.
TERZAGHI, K. & PECK, R. B. 1948. Soil Mechanics in Engineering Practice. New
York, N.Y.: John Wiley & Sons, INC.
TIWARI, B. & AJMERA, B. 2012. New correlation equations for compression index
of remolded clays. Journal of Geotechnical and Geoenvironmental
Engineering, 138, 757-762.
UYGAR, E. & DOVEN, A. G. 2006. Monotonic and cyclic oedometer tests on sand
at high stress levels. Granular Matter, 8, 19-26.
VESIC, A. S. & CLOUGH, G. W. 1968. Behavior of granular materials under high
stresses. Journal of Soil Mechanics & Foundations Div.
YAMAMURO, J. A., BOPP, P. A. & LADE, P. V. 1996. One-dimensional compression
of sands at high pressures. Journal of geotechnical engineering, 122, 147-
154.

88
8 APPENDICES
8.1 Appendix A 1-D Compression Curves
Fig. A.1 Angular broad soil type 1-D compression curves.
Fig. A.2 Angular narrow soil type 1-D compression curves.

89
Fig. A.3 Sub-angular broad soil type 1-D compression curves.
Fig. A.4 Sub-angular narrow soil type 1-D compression curves.

90
Fig. A.5 Rounded narrow soil type 1-D compression curves.
Fig. A.6 Beads broad soil type 1-D compression curves.

91
Fig. A.7 Beads narrow soil type 1-D compression curves.

92
8.2 Appendix B LCC Determination Plots
Fig. B.1 LCC determination for the AB soil type.
Fig. B.2 LCC determination for the AN soil type.

93
Fig. B.3 LCC determination for the SB soil type.
Fig. B.4 LCC determination for the SN soil type.

94
Fig. B.5 LCC determination for the RN soil type.
Fig. B.6 LCC determination for the BB soil type.

95
Fig. B.7 LCC determination for the BN soil type.
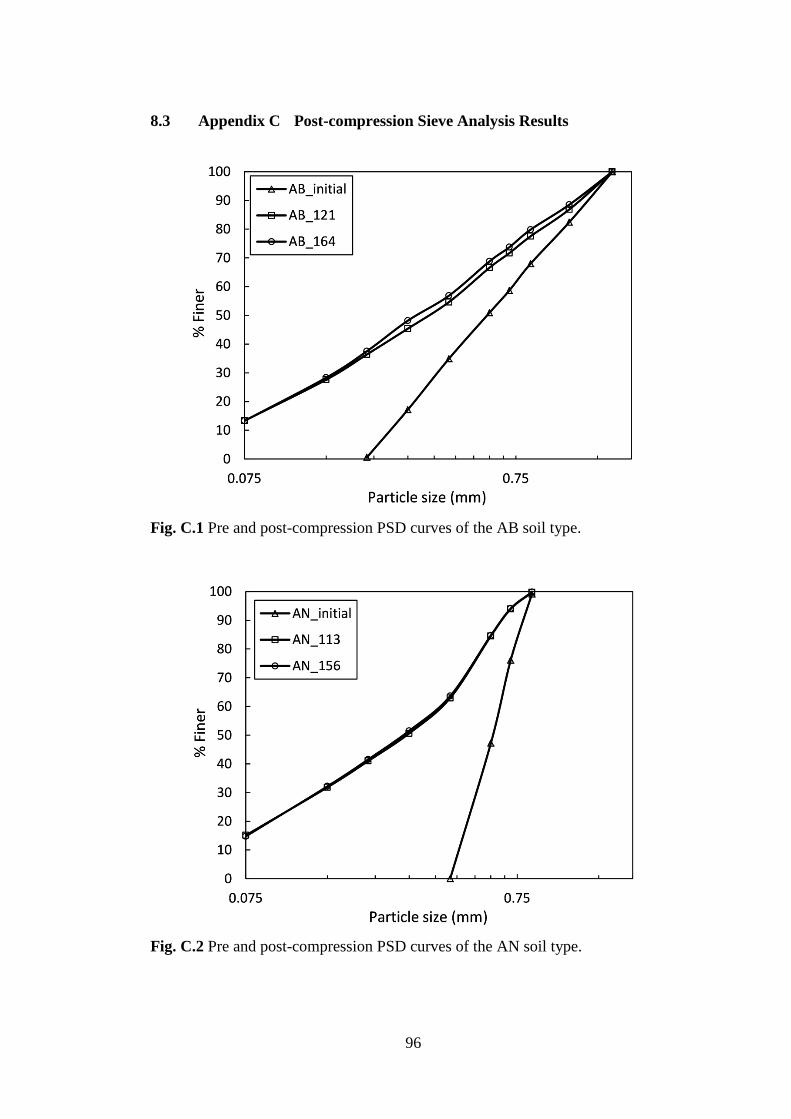
96
8.3 Appendix C Post-compression Sieve Analysis Results
Fig. C.1 Pre and post-compression PSD curves of the AB soil type.
Fig. C.2 Pre and post-compression PSD curves of the AN soil type.

97
Fig. C.3 Pre and post-compression PSD curves of the SB soil type.
Fig. C.4 Pre and post-compression PSD curves of the SN soil type.

98
Fig. C.5 Pre and post-compression PSD curves of the RN soil type.
Fig. C.6 Pre and post-compression PSD curves of the BB soil type.

99
Fig. C.7 Pre and post-compression PSD curves of the BN soil type.