cyclic compression behaviour of polymer concrete
TRANSCRIPT

CYCLIC COMPRESSION BEHAVIOUR OF POLYMER CONCRETE
C. Chastre Rodrigues1 and Manuel A. G. Silva2
UNIC-Centro de Investigação em Estruturas e Construção Departamento de Engenharia Civil
Faculdade de Ciências e Tecnologia da Universidade Nova de Lisboa Quinta da Torre, 2829-516 Caparica, Portugal
1e-mail: [email protected] 2e-mail: [email protected]
ABSTRACT Polymeric mortars or concrete are special building materials which can be used to repair or strengthen localized areas of structural elements. Following research on the behaviour of retrofitting reinforced concrete circular columns with FRP composite materials and bearing in mind the high strength of polymer concretes, it was decided to develop a solution to seismic retrofit of reinforced concrete columns with polymer concrete. The mechanical characteristics of different polymer concretes and especially their performance when subjected to cyclic axial compression, several bending tests, and monotonic and cyclic axial compression tests were studied, namely the compressive strength, the tensile strength on bending and the Young’s modulus. Columns were also tested under axial compression and cyclic horizontal loads. The results of these tests are shown and interpreted. It is concluded that the improved behaviour in monotonic compression of polymer concrete is essentially associated with better strength characteristics of resin, whereas its superior behaviour under cyclic loading is linked to a smoother aggregate grading curve. Keywords: Polymeric Mortars, Polymer Concretes, Cyclic Compression, Retrofitting Reinforced Concrete Columns
Cyclic Compression Behaviour of Polymer Concrete
2
1. INTRODUCTION A polymer concrete results from the mixture of a mineral aggregate with a polymer, the polymer resin replacing the hydrated Portland cement paste of conventional concrete. When comparing both concretes, polymer concrete shows superior mechanical and chemical resistances and presents lower permeability /1/. Polymer concrete was first introduced in the 1950s and 1960s, when several polymers of different compositions were used /2/. Their first applications were in the production of synthetic marbles. Since then, there has been a rapid development of polymer concretes, especially in the field of precast components due to their workability, low curing temperature and quick development of high strength /1/. The relatively expensive costs of polymeric mortars or concretes have limited their use, which is thus limited to repair or strengthening localized areas of structural elements, but it is foreseeable that it will be used in new structural solutions based in composite materials /3/. The epoxy and polyesters are most used; the former are more expensive but normally have better mechanical characteristics. At the University of California polymer concretes of epoxy resins were used in anchorage zones, whereas polyester resins were used in the connection of the guard rail to the deck of a bridge which is being built almost entirely with composite materials /3/. Studies of these construction materials are available /4-11/, but information is still scarce, though a considerable amount of information can be found in a review of technical literature prepared by Kardon /12/. The Civil Engineering Department of Universidade Nova de Lisboa (UNL) has been developing research in collaboration with INEGI (Institute of Mechanical and Industrial Engineering), specially on the durability of polymer concretes /1, 13/. Following research on the behaviour of retrofitting reinforced concrete circular columns with FRP composite materials /14/ and bearing in mind the high strength of polymer concretes, the authors decided to develop a retrofitting solution with this material for damaged columns. Additionally, the repair of the foundation was also analysed. The specimens repaired had been submitted to a cyclic test that damaged the column foundation. Two lateral parts of the foundation, with 10 cm thickness, were replaced and filled with polymer concrete made of a commercial resin (Icosit KC220/60). In this paper a description of the resins, the aggregates, as well as their

C.C. Rodrigues and M.A.G. Silva Journal of Polymer Engineering
3
composition and mechanical features, is given with reference to the polymer concrete applied in the retrofitting of column P2R and P10 column foundation. Specimens named A and B result from mixing of polymer concrete using Eposil 551 epoxy resin with the same composition as chosen by INEGI /15/ and in accordance with RILEM PC2 - “Method of making polymer concrete and mortar specimens” /17/. Specimens named C are from epoxy resin Icosit KC220/60 and specimens named D are from polymer concrete prepared using Icosit KC220/60 epoxy resin /16/.
2. FORMULATION AND PREPARATION OF POLYMER CONCRETES
The composition of polymer concretes A and B /15/ has 20% of Eposil 551 epoxy resin and 80% of foundry sand (SP 55), the resin and hardener being mixed in the proportion 2:1. The epoxy resin (Eposil 551) is chemically based on a diglicidyl ether of bisphenol A and the hardener on an amine aliphatic. The foundry sand used is siliceous of rather uniform particles size, with an average diameter of 0.342 mm. The polymer concrete D had the following composition by weight /16/: 33,3% of Icosit epoxy resin KC220/60 and 66,6% of aggregates. The aggregates used are of siliceous nature and graded between 0.1 and 4 mm Their sizes were #2, #123, #128 and #148 and they were mixed in an equal weight proportion. The resin and the hardener were added in a weight proportion of 45:55. Tables 1, 2 and 3 show the data on the resins and aggregates provided by the manufacturers. Figure 1 shows a detail of the area of the column P2R to be repaired, before, during and after the retrofitting with polymer concrete.

Cyclic Compression Behaviour of Polymer Concrete
4
Table 1 Eposil 551 and Icosit KC220/60 resins characteristics provided by the
manufacturers
Resins Characteristics Units EPOSIL 551 Icosit KC 220/60
Hardness Shore D 85 -- Specific weight kg/l 1.18 1.36 Tg (TMA) ºC 54 -- HDT ºC 34 -- Gel time Min 27 60 Compression Strength MPa -- 120 Tension Strength MPa 35-45 -- Bending Strength MPa 65-75 35 Young Modulus in Bending GPa 2.0-2.4 4.0
Table 2 Foundry sand characteristics (SP 55) used in series A (provided by the
manufacturers) Foundry sand (siliceous) characteristics (SP 55)
Units Inferior Value
Average Value
Maximum Value
Fineness - 49 51.5 54 Average diameter D50 mm - 0.342 - Real specific area cm2/g 100 125 150 Clay (AFS) < 2 μm (%) - - 0.2 Organic matter ppm - - 10 Carbonate (%) - - 10 pH - 6.5 7 7.5
Table 3
Aggregates characteristics used in series D (provided by the manufacturers)
Aggregates Characteristics
Nature Grading (mm) Apparent volumetric mass (kg/l)
Aggregates # 2 0.1 a 0.3 mm 1.6 Aggregates # 123 0.3 a 0.8 mm 1.6 Aggregates # 128 0.8 a 1.2 mm 1.6 Aggregates # 148
Siliceous sands calibrated and dried 2.0 a 4.0 mm 1.6

C.C. Rodrigues and M.A.G. Silva Journal of Polymer Engineering
5
Fig. 1: Details of the intervention area on the P2R column, before, during and after the retrofitting with polymer concrete.
3. POLYMER CONCRETE TESTS IN TENSION AND COMPRESSION FOR MONOTONIC AND CYCLIC LOADS
Standard samples of 160x40x40 mm3 were prepared in order to evaluate their mechanical characteristics. Tests were carried out with the purpose of determining the compression and bending tensile strength and also the Young modulus according to RILEM standards /18, 19, 20/. Besides the monotonic tests, other cyclic tests were also carried out. Series A (3 samples) and B (2 samples) correspond to two different formulations of the polymer concrete – A. Series C is made of six samples of pure epoxy resin (Icosit KC220/60), series D of six samples of polymer concrete – D and series E of three samples of pure epoxy resin (Eposil 551). Altogether, seventeen samples were tested in bending. As the rupture in this type of test occurs at midspan of the sample, it is possible to use the two resulting parts for compression tests. In this way twenty monotonic axial compression tests were performed (three in series A and E, two in series B and six in each one of series C and D) and complementarily fourteen tests of cyclic axial compression (two in series B and three in each of the series A, C, D and E). The compression tests were performed in a FORMTEST press with a load cell of 600kN and the three-point bending tests with a Zwick universal testing machine, with a load cell of 50kN. The rupture modes of the polymer concrete can be observed in Figure 2 for different test types (A, B, C and D).

Cyclic Compression Behaviour of Polymer Concrete
6
Fig. 2: Details of the samples’ rupture after the tests
3.1 Tension Tests In Bending
Tensile bending stress versus strain curves, drawn from bending tests are presented in Figure 3. In Table 4 the values of the maximum tensile strength (fpct) and strain (εpct), as well as the corresponding average values are indicated for each test. Tensile bending strength (fpct) is calculated according to the elementary analysis from strength of materials that lead to:
2
32
×=
×pct
F Lfb h
(1)
and, likewise, the strain at the extreme fiber of cross section:
2
6 ×=pct
hL
δε (2)
where F is the maximum force (N) for each specimen, L is the span in the

C.C. Rodrigues and M.A.G. Silva Journal of Polymer Engineering
7
three-point bending test (100 mm), b is the width (40 mm), h is the height (40 mm) of the specimen and δ is the deflection.
f pct (MPa)
0
10
20
30
40
50
0 2 4 6 8 10 12εpct (%)
c e
a bd
Fig. 3: Resin and polymer concrete diagrams tension stress – strain in bending
The analysis of Figure 3 and Table 4 shows that, in terms of tensile strength, the tests of the series A, B and D present approximate average values (26.3; 27.2 and 26.8 MPa), whereas series C (36.2 MPa) and series E (43.3MPa) correspond to pure resins samples and present higher average values. This means that the tests of polymer concrete show an average loss of strength of 26% (series D) and 38% (series A and B) compared with the resin samples. However, it must be emphasised that the samples of polymer concrete lost in strength but gained in stiffness, as can be observed in Figure 3.
3.2 Axial Monotonic Compression Tests
Stress-strain curves of axial monotonic compression tests are presented in Figures 4 and 5. In Table 5 the maximum and corresponding mean test values of stresses (fpc), strains εpc (%), as well as the respective values for 85% of the maximum compression and the Young modulus (E) are reported.

Cyclic Compression Behaviour of Polymer Concrete
8
Table 4 Polymer concrete tests values of tension in bending and corresponding mean values
Type Samples fpct (MPa) εpct (%)
A1 26.0 1.71 A2 27.4 2.00 A3 25.6
26.3 1.66
1.79
B1 27.8 1.75
INEGI Polymer Concrete
B2 26.5 27.2
1.67 1.71
C1 33.3 3.41 C2 34.9 3.44 C3 31.3 3.06 C4 40.1 3.96 C5 43.8 4.26
Icosit Resin
C6 33.8
36.2
3.28
3.57
D1 27.2 1.71 D2 28.7 1.78 D3 27.0 1.60 D4 26.4 1.96 D5 25.3 1.46
Icosit Polymer concrete
D6 26.1
26.8
1.56
1.68
E1 42.4 9.83 E2 42.6 9.56
Eposil Resin
E3 44.8 43.3
9.47 9.62
It is observed from the stress-strain curves that the series A and B follow the same trend, with series B registering a higher rupture stress. Rupture stress values for series C are higher than those of series A, B and E, but lower than the values found for series D. Series C and E are the most deformable. Series C has a compression strength capacity above 90 MPa and series E above 45MPa, for values of the deformation sometimes higher than 20%.

C.C. Rodrigues and M.A.G. Silva Journal of Polymer Engineering
9
Table 5 Monotonic compression tests and corresponding mean values of polymer concrete
Type Samples fpc (MPa) εpc (%) fpc;0:85 (MPa) εpc;0:85 (%) E (GPa) A1-m 119.3 1.46 101.6 2.30 9.3 A2-m 116.4 1.40 98.8 2.21 9.3 A3-m 113.4
116.4 1.41
1.42 96.6
99.0 2.18
2.23 9.2
9.2
B1-m 121.6 1.43 103.3 2.26 9.2
INEGI Polymer Concrete
B2-m 123.8 122.7
1.44 1.44
105.3 104.3
2.27 2.26
9.4 9.3
C1-m 145.0 4.01 123.6 7.38 5.5 C2-m 156.1 3.95 132.7 5.94 5.5 C3-m 153.2 3.92 130.5 4.78 5.6 C4-m 152.0 3.90 129.9 6.28 5.4 C5-m 153.3 4.01 130.6 4.53 5.3
Icosit Resin
C6-m 148.2
151.3
3.34
3.86
126.2
128.9
6.51
5.90
5.5
5.5
D1-m 169.3 2.01 144.3 2.85 9.2 D2-m 167.9 1.99 143.0 2.92 9.8 D3-m 164.8 1.93 140.1 2.87 9.8 D4-m 166.3 1.81 140.1 2.55 9.9 D5-m 165.7 1.82 140.1 2.65 10.4
Icosit Polymer concrete
D6-m 167.3
166.9
1.87
1.91
141.7
141.5
2.56
2.73
10.0
9.8
E1-m 66.5 4.04 56.8 6.23 2.0 E2-m 60.9 4.16 52.0 6.21 1.9
Eposil Resin
E3-m 64.3 63.9
4.21 4.14
54.9 54.6
6.07 6.17
2.0 2.0
Cyclic Compression Behaviour of Polymer Concrete
10
f pc (MPa)
020406080
100120140160180200
0 10 20 30εpc (%)
E
f pc (MPa)
020406080
100120140160180200
0 10 20 30εpc (%)
c1
c2
c3
c4
c5
c6
C
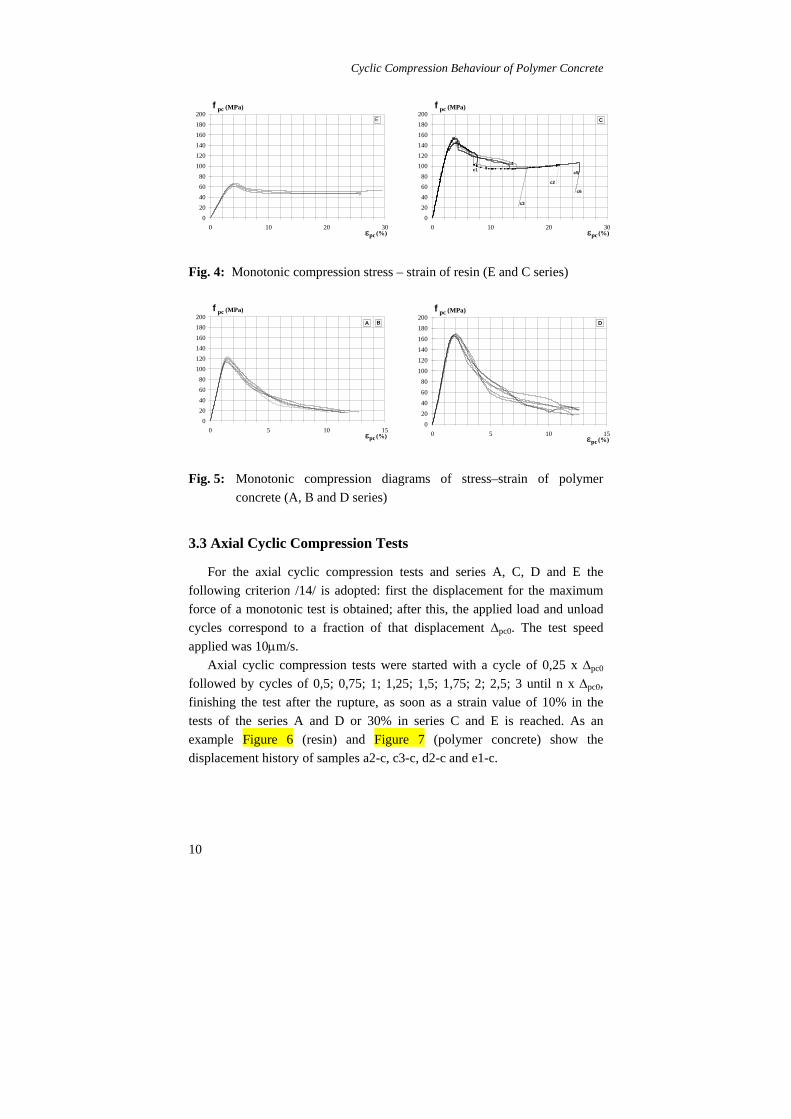
Fig. 4: Monotonic compression stress – strain of resin (E and C series)
f pc (MPa)
020406080
100120140160180200
0 5 10 15εpc (%)
A B
f pc (MPa)
020406080
100120140160180200
0 5 10 15εpc (%)
D
Fig. 5: Monotonic compression diagrams of stress–strain of polymer
concrete (A, B and D series)
3.3 Axial Cyclic Compression Tests
For the axial cyclic compression tests and series A, C, D and E the following criterion /14/ is adopted: first the displacement for the maximum force of a monotonic test is obtained; after this, the applied load and unload cycles correspond to a fraction of that displacement Δpc0. The test speed applied was 10μm/s. Axial cyclic compression tests were started with a cycle of 0,25 x Δpc0 followed by cycles of 0,5; 0,75; 1; 1,25; 1,5; 1,75; 2; 2,5; 3 until n x Δpc0, finishing the test after the rupture, as soon as a strain value of 10% in the tests of the series A and D or 30% in series C and E is reached. As an example Figure 6 (resin) and Figure 7 (polymer concrete) show the displacement history of samples a2-c, c3-c, d2-c and e1-c.

C.C. Rodrigues and M.A.G. Silva Journal of Polymer Engineering
11
time (s)
0
5
10
15
20
25
30
0 2000 4000 6000
εpc (%)
e1-c
f pc (MPa)
020406080
100120140160180200
0 2000 4000 6000time (s)
e1-c
time (s)
0
5
10
15
20
25
30
0 2000 4000 6000
εpc (%)
c3-c
f pc (MPa)
020406080
100120140160180200
0 2000 4000 6000time (s)
c3-c
Strain time Stress time
Fig. 6: Strains and stress time history (resin samples e1 and c3)
time (s)
0
2
4
6
8
10
12
14
0 2000 4000 6000
εpc (%)
a2-c
f pc (MPa)
020406080
100120140160180200
0 2000 4000 6000time (s)
a2-c
time (s)
0
2
4
6
8
10
12
14
0 2000 4000 6000
εpc (%)
d2-c
f pc (MPa)
020406080
100120140160180200
0 2000 4000 6000time (s)
d2-c
Strain time Stress time
Fig. 7: Strains and stress time history (polymer concrete samples a2 and d2)

Cyclic Compression Behaviour of Polymer Concrete
12
In series B, a different displacement history was applied in each of the tests. Thus, the b1-c test started with the application of displacement 0,60 x Δpc0, followed by sets of ten cycles varying initially 0,10 x Δpc0, later 0,20 x Δpc0, then 0,30 x Δpc0 and finally 0,40x Δpc0. The test finished as soon as the rupture occurred and a strain value of 10% was observed. In Figure 8 it is possible to observe a strength reduction for cycles with constant displacements and that, despite the different load history until the rupture, the sample tested under cyclic loads presented, in the descending branch of the stress-strain curve, a behaviour similar to the one tested under monotonic loads.
time (s)
0
2
4
6
8
10
12
14
0 2000 4000 6000 8000
εpc (%)
b1-c
f pc (MPa)
020406080
100120140160180200
0 2000 4000 6000 8000time (s)
b1-c
time (s)
0
2
4
6
8
10
12
14
0 2000 4000 6000 8000
εpc (%)
b2-c
f pc (MPa)
0
20
40
60
80
100
120
140
160
180
200
0 2000 4000 6000 8000time (s)
b2-c
Fig. 8: Strains and stress time history (resin samples b1 and b2)

C.C. Rodrigues and M.A.G. Silva Journal of Polymer Engineering
13
In the b2-c test, the sample was initially subjected to a 0.50 x Δpc0 displacement, followed by one hundred cycles with 0.15 x Δpc0. In Figure 8 a strength reduction can be observed for cycles of constant displacements. Starting with a value of 50% of the rupture load, one hundred load cycles of 15% of the rupture load were later applied to the same sample. An increase of the ultimate displacement was observed for constant load cycles. The sample monotonically led to the rupture and the test finished rupture, sample b2-c under cyclic load behaved identically to the sample tested under monotonic loads in the descending branch of the stress-strain curve. This is also similar to the b1-c test. Figures 9 to 13 present the stress-strain curves of the cyclic tests of series A, B, C, D and E together with their corresponding monotonic tests. Table 6 shows the maximum and corresponding mean test values of stresses (fpc), strains εpc (%), as well as the respective values for 85% of the maximum compression and also the Young’s modulus (E).
f pc (MPa)
020406080
100120140160180200
0 5 10 15εpc (%)
Fig. 9: Compression diagram stress – strain of sample a2
Cyclic Compression Behaviour of Polymer Concrete
14
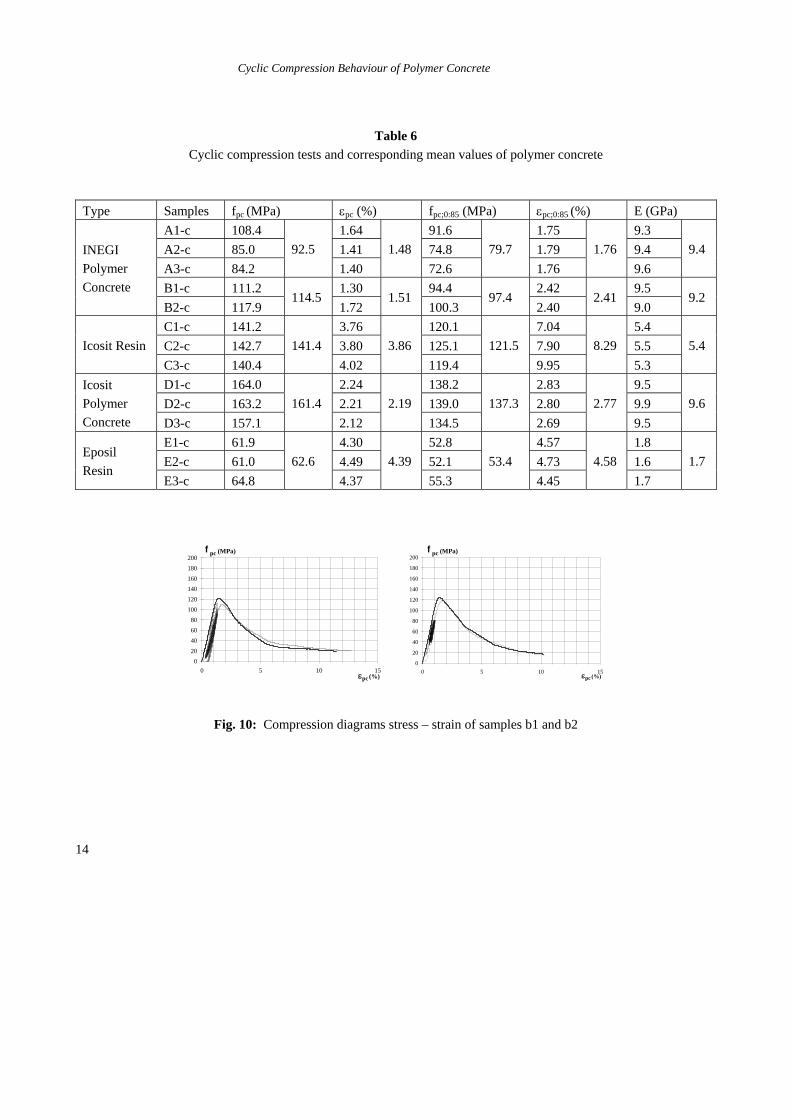
Table 6
Cyclic compression tests and corresponding mean values of polymer concrete
Type Samples fpc (MPa) εpc (%) fpc;0:85 (MPa) εpc;0:85 (%) E (GPa) A1-c 108.4 1.64 91.6 1.75 9.3 A2-c 85.0 1.41 74.8 1.79 9.4 A3-c 84.2
92.5 1.40
1.48 72.6
79.7 1.76
1.76 9.6
9.4
B1-c 111.2 1.30 94.4 2.42 9.5
INEGI Polymer Concrete
B2-c 117.9 114.5
1.72 1.51
100.3 97.4
2.40 2.41
9.0 9.2
C1-c 141.2 3.76 120.1 7.04 5.4 C2-c 142.7 3.80 125.1 7.90 5.5 Icosit Resin C3-c 140.4
141.4 4.02
3.86 119.4
121.5 9.95
8.29 5.3
5.4
D1-c 164.0 2.24 138.2 2.83 9.5 D2-c 163.2 2.21 139.0 2.80 9.9
Icosit Polymer Concrete D3-c 157.1
161.4 2.12
2.19 134.5
137.3 2.69
2.77 9.5
9.6
E1-c 61.9 4.30 52.8 4.57 1.8 E2-c 61.0 4.49 52.1 4.73 1.6
Eposil Resin
E3-c 64.8 62.6
4.37 4.39
55.3 53.4
4.45 4.58
1.7 1.7
Fig. 10: Compression diagrams stress – strain of samples b1 and b2
f pc (MPa)
020406080
100120140160180200
0 5 10 15εpc (%)
f pc (MPa)
0
20
40
60
80
100
120
140
160
180
200
0 5 10 15εpc (%)

C.C. Rodrigues and M.A.G. Silva Journal of Polymer Engineering
15
f pc (MPa)
020406080
100120140160180200
0 10 20 30εpc (%)
Fig. 11: Compression diagram stress – strain of sample c3
f pc (MPa)
020406080
100120140160180200
0 5 10 15εpc (%)
Fig. 12: Compression diagram stress – strain of sample d1

Cyclic Compression Behaviour of Polymer Concrete
16
f pc (MPa)
020406080
100120140160180200
0 10 20 30εpc (%)
Fig. 13: Compression diagram stress – strain of sample e1
4. RESULTS AND DISCUSSION Figures 9 and 12 show better behaviour of series D under cyclical actions, whereas the involving curve of cyclic tests and the curve of monotonic tests exhibit a similar behaviour. This behaviour contrasts with that for series A, where cyclic tests provoked the degradation. The explanation for this can be found in the grading curve of each polymer concrete instead of the resins’ behaviour. This behaviour of series A contrasts with the one of series E (pure resin of series A and B), where the degradation provoked by cyclic practically does not occur (Figure 13). In series A only a sand with an average diameter of 0.342 mm is used whereas in series D four different aggregates are combined, their diameters varying from 0.1 mm to 4.0 mm. This corresponds to a lesser index of voids and, therefore, to a better behaviour, admitting an identical viscosity in both resins. However, further tests of polymer concretes with the same grading curve should be made in order to obtain more definite conclusions. Figure 14 displays the tests results obtained on compression and compares these curves with the same type of curves for a normal Portland

C.C. Rodrigues and M.A.G. Silva Journal of Polymer Engineering
17
cement concrete (C20/25). Table 7 presents the average values of each series for the maximum stresses (fpc), as well as the corresponding strains εpc (%), for values of 85% of the maximum compression, and the Young modulus (Em) values.
Table 7 Monotonic and cyclic tests mean values of polymer concrete
Samples fpc (MPa) εpc (%) fpc;0:85 (MPa)
εpc;0:85
(%) Em (GPa)
fpctm (Mpa)
A-m 116.4 1.42 99.0 2.23 9.2 26.3 B-m 122.7 1.44 104.3 2.26 9.3 27.2 C-m 151.3 3.86 128.9 5.90 5.5 36.2 D-m 166.9 1.91 141.5 2.73 9.8 26.8 E-m 63.9 4.14 54.6 6.17 2.0 43.3 A-c 92.5 1.48 79.7 1.76 9.4 26.3 B-c 114.5 1.51 97.4 2.41 9.2 27.2 C-c 141.4 3.86 121.5 8.29 5.4 36.2 D-c 161.4 2.19 137.3 2.77 9.6 26.8 E-c 62.6 4.39 53.4 4.58 1.7 43.3
f pc (MPa)
020406080
100120140160180200
0 5 10 15εpc (%)
INEGI polymer concrete (A, B)
Icosit polymer concrete (D)
Icosit resin (C)
Plain concrete
Eposil resin (E)
Fig. 14: Compression tests of polymer concrete and their comparison with
correspondent curves of plain concrete

Cyclic Compression Behaviour of Polymer Concrete
18
Series D presents the best characteristics, revealing higher values than in series A. It presents 43% for compressive strength, 35% deformation for the maximum force and 43% for 85% of the maximum force and 7% in terms of Young’s modulus. Only the bending tensile strength is similar. The polymer concrete, series D, reveals a compression strength 10% higher than series C, a reduction of 50% in the deformation, an increase in Young’s modulus of 78% and a reduction of 26% of the bending tensile strength compared to that of the pure resin, series C. Regarding the polymer concrete, series A reveals a compression strength 82% higher, a reduction of 66% in the deformation, an increase in Young’s modulus of 360% and a reduction of 39% in the bending tensile strength compared to the pure resin, series E. In Table 8 a relation between the average values of monotonic and cyclic tests for each series is presented. In series A the cycle tests provoke a strength degradation of 20% and an ultimate strain increase of 4%, while series E presents only a small strength reduction of 2% and a increment of 26% in the deformation for 85% of the maximum force. In series B the load history was substantially different, but despite the data presented, the results do not make much sense compared to the remaining series. Series C evidences a strength degradation of 7% and a substantial increment of 40% in the deformation for 85% of the maximum force, while series D presents only a small strength reduction of 3% and a strain increase of 15% in the rupture.
Table 8
Relationship between the mean values of monotonic and cyclic tests Samples fpc (MPa) εpc (%) fpc;0:85 (MPa) εpc;0:85 (%)
A -20% +4% -20% -21% B -7% +5% -7% +7% C -7% 0% -6% +40% D -3% +15% -3% +2% E -2% 6% -2% -26%
It can be concluded that the improved behaviour in monotonic compression of series D is due to a resin with better resistant characteristics whereas its superior behaviour under the cyclical loads derives from its grading curve with different aggregates.

C.C. Rodrigues and M.A.G. Silva Journal of Polymer Engineering
19
5. CONCLUSIONS Several bending, monotonic and cyclic axial compression tests were performed and the mechanical characteristics of different polymer concretes were evaluated, especially their curve performances when subjected to cyclic axial compression. The data analysed shows that series D presents a better behaviour under cyclical actions, while the involving curve of cyclic tests and the curve of monotonic tests exhibit a similar behaviour. This behaviour contrasts with findings in series A, where the degradation provoked by cyclic tests is a fact. The explanation for this can be found in the grading curve of each polymer concrete and not on the behaviour of the resins. In series A only a sand with an average diameter of 0.342 mm is used whereas in series D four different aggregates are combined, their diameters varying from 0.1 mm to 4.0 mm. It is concluded that the improved behaviour in monotonic compression of series D is due to a resin with better resistant characteristics whereas the superior behaviour exhibited under the cyclical loads derives from its non- homogeneous grading curve for different aggregates and sizes.
REFERENCES 1. Ribeiro MCS et al (2001) “Mechanical Behaviour of Polymer
Concrete”, In CCC2001 Composites in Construction Porto October 2001 FEUP, AA.Balkema.
2. Santiago MO et al (2001) “Historical Record and Building Applications of Polymeric Mortars”In CCC2001 Composites in Construction Porto October 2001 FEUP A.A.Balkema.
3. Zhao L et al (2001) “Design and Evaluation of Modular Bridge Systems using FRP Composite Materials” In FRPRCS-5 Fibre-reinforced plastics for Reinforced Concrete Structures, Cambridge, July 2001, Thomas Telford.
4. Mebarkia S, Vipulanandan C (1995) “Mechanical properties and water diffusion in polyester polymer concrete.” J Eng Mech. 121(12):1359–1365.
5. Abdel-Fattah Hand, El-Hawary MM (1998) “Flexure behaviour of polymer concrete” Construction and Building Materials 13:253-262.

Cyclic Compression Behaviour of Polymer Concrete
20
6. Chawalwala AF (1999) “Material characteristics of polymer concrete.” Technical Rep. University of Delaware, Center of Composite Materials.
7. Oyawa WO, Sugiurab Kand, Watanabe E (2001) “Polymer concrete-filled steel tubes under axial compression” Construction and Building Materials 15:187-197.
8. Ferreira AJM, Tavares CM, Ribeiro MC (2002) “Flexural properties of polyester resin concretes.” J Polymer Engineering 20(6):459–468.
9. Ribeiro MC et al (2003) “Bending Characteristics of Resin Concretes” Materials Research 16(2):2 247-254
10. Oyawa WO, Sugiurab K, Watanabe E (2004) “Flexural response of polymer concrete filled steel beams” Construction and Building Materials 18:367–376.
11. Reis JML (2005) “Mechanical characterization of fiber reinforced polymer concrete” Materials Research 8(3):357-360.
12. Kardon JB (1997) “Polymer-modified concrete: Review.” Journal of Materials in Civil Engineering 9(2):85–92.
13. Silva MG (2004) .“Influence of environmental ageing on properties of polymeric mortars”, Journal of Materials in Civil Engineering 16(5): 461-468.
14. Rodrigues CC (2005) “Comportamento às Acções Cíclicas de Pilares de BetãoArmado Reforçados com Materiais Compósitos”, PhD Thesis, Universidade Nova de Lisboa Faculdade de Ciências e Tecnologia, January 2005.
15. Ribeiro MCS, Tavares CML, Ferreira AJM (2002) “Chemical resistance of epoxy and polyester polymer concrete to acids and salts” Journal of Polymer Engineering ,Freund Publishing House 24 (1):27–44.
16. SIKAProntuário (2002) Catálogo de Fichas Técnicas 5a ed. 17. Rilem Technical Committee TC-113 (1995) PC-2 – Method of making
polymer concrete and mortar specimensProcSymposium on Properties and Test Methods for Concrete-Polymer Composites; Oostende Belgium.
18. Rilem Technical Committee TC-113 (1995) PC-8 – Method of test for compressive strength of polymer concrete and mortar, Proc Symposium on Properties and Test Methods for Concrete-Polymer Composites; Oostende Belgium.
19. Rilem Technical Committee TC-113 (1995) PMC-8 – Method of test flexural strength and deflection of polymer-modified mortar, Proc

C.C. Rodrigues and M.A.G. Silva Journal of Polymer Engineering
21
Symposium on Properties and Test Methods for Concrete-Polymer Composites; Oostende Belgium.
20. Rilem Technical Committee TC-113 (1995) PC-5 – Method of test for static elastic modulus of polymer concrete and mortar, Proc Symposium on Properties and Test Methods for Concrete-Polymer Composites; Oostende Belgium.
Cyclic Compression Behaviour of Polymer Concrete
22
Fig. 1: Details of the intervention area on the p2r column, before, during and after the retrofitting with polymer concrete.
Fig. 2: Details of the samples’ rupture after the tests Fig. 3: Resin and polymer concrete diagrams tension stress – strain in
bending Fig. 4: Monotonic compression stress – strain of resin (E and C series) Fig. 5: Monotonic compression diagrams of stress–strain of polymer
concrete (A, B and D series) Fig. 6: Strains and stress time history (resin samples e1 and c3) Fig. 7: Strains and stress time history (polymer concrete samples a2 and d2) Fig. 8: Strains and stress time history (resin samples b1 and b2) Fig. 9: Compression diagram stress – strain of sample a2 Fig. 10: Compression diagrams stress – strain of samples b1 and b2 Fig. 11: Compression diagram stress – strain of sample c3 Fig. 12: Compression diagram stress – strain of sample d1 Fig. 13: Compression diagram stress – strain of sample e1 Fig. 14: Compression tests of polymer concrete and their comparison with
correspondent curves of plain concrete

C.C. Rodrigues and M.A.G. Silva Journal of Polymer Engineering
23
Table 1
Eposil 551 and Icosit KC220/60 resins characteristics provided by the manufacturers
Table 2
Foundry sand Characteristics (SP 55) used in series A (provided by the manufacturers).
Table 3
Aggregates characteristics used in series D (provided by the manufacturers).
Table 4 Polymer concrete tests values of tension in bending and corresponding
mean values
Table 5 Monotonic compression tests and corresponding mean values of
polymer concrete
Table 6 Cyclic compression tests and corresponding mean values of polymer concrete
Table 7
Monotonic and cyclic tests mean values of polymer concrete
Table 8 Relationship between the mean values of monotonic and cyclic tests