olympia school district school board study session september 29 2014 adequate yearly progress (ayp)...
TRANSCRIPT

Olympia School DistrictSchool Board Study Session
September 29 2014
• Adequate Yearly Progress (AYP)• Steps of School Improvement• 2014 Results MSP-HSPE-EOC • By subgroup• Showing SBA field test effect• Compare neighbor districts• Score suppression if >=95%• DATA DASHBOARD UPDATES

A refresher on AYP…….
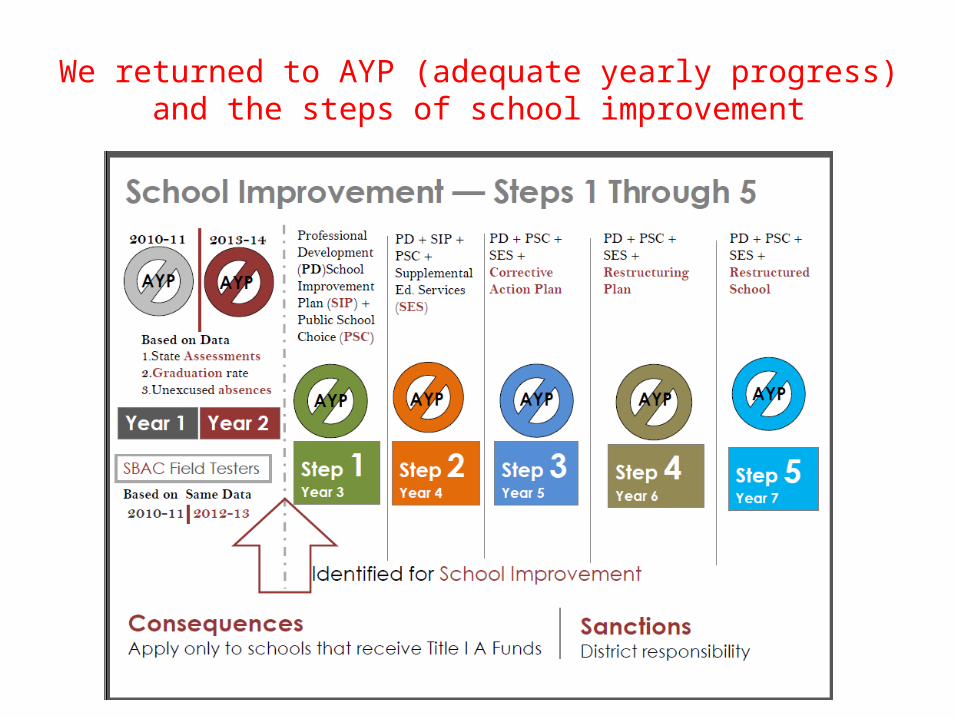
We returned to AYP (adequate yearly progress) and the steps of school improvement

Schools needed 100% at
standard to Meet AYP. Only Title 1 schools
had consequences (letter home, school choice, supplemental
services)

2014 Scores by grade and subgroup
• State scores• Olympia scores• Scores for Special Education and Low Income
students• Adjusting scores to show effect of Centennial
and Jefferson taking the SBA (Smarter Balanced Assessment) field test.

2014 results – Grade 3
'06 '07 '08 '09 '10 '11 '12 '13 '14 '06 '07 '08 '09 '10 '11 '12 '13 '14
0
10
20
30
40
50
60
70
80
90
100
78.580.7
78.782.282.6
85.082.0
84.0
77.2 76.6
81.2
76.776.9
69.172.774.1
71.1
66.365.4
53.1
37.032.8
GRADE 3 WASL-MSP STATE - all students
OLYMPIA SCHOOL DISTRICT
OSD LOW INCOME
OSD Special Ed
Pe
rce
nt
me
etin
g s
tan
da
rd
READING MATHWRITING SCIENCE
2013 scores with all schools 2014 scores without Centennial *click for 2013 scores removing Centennial

2014 results – Grade 4
'06 '07 '08 '09 '10 '11 '12 '13 '14 '06 '07 '08 '09 '10 '11 '12 '13 '06 '07 '08 '09 '10 '11 '12 '13
0
10
20
30
40
50
60
70
80
90
10091.3
84.483.583.8
79.280.882.681.3
79.1
69.267.5
70.368.4
66.1
74.174.8
66.9
72.5 74.3
69.668.169.2
63.4
69.570.568.1 70.3
66.3
58.555.7
39.8
47.743.9
GRADE 4 WASL-MSP
STATE - all students
OLYMPIA SCHOOL DISTRICT
OSD LOW INCOME
OSD Special Ed
Pe
rce
nt
me
etin
g s
tan
da
rd
READING MATHWRITING SCIENCE
2013 scores with all schools 2014 scores without Centennial *click for 2013 scores removing Centennial

2014 results – Grade 5
'04 '06 '07 '08 '09 '10 '11 '12 '13 '14 '04 '05 '06 '07 '08 '09 '10 '11 '12 '13 '04 '06 '07 '08 '09 '10 '11 '12 '13 '14 '06 '07 '08 '09 '10 '11 '12 '13 '14
0
10
20
30
40
50
60
70
80
90
100
87.7
83.184.384.683.5
78.2
82.584.5
82.3
70.771.273.573.4
57.6
68.4
74.0
68.664.9
48.5
53.2
57.856.3
43.7
67.9
80.980.875.7
73.1
52.3
64.1
46.1
31.7
40.8
GRADE 5 WASL-MSP
STATE - all studentsOLYMPIA SCHOOL DISTRICTOSD LOW INCOMEOSD Special Ed
Pe
rce
nt
me
etin
g s
tan
da
rd
READING MATHWRITING SCIENCE
2013 scores with all schools 2014 scores without Centennial *click for 2013 scores removing Centennial
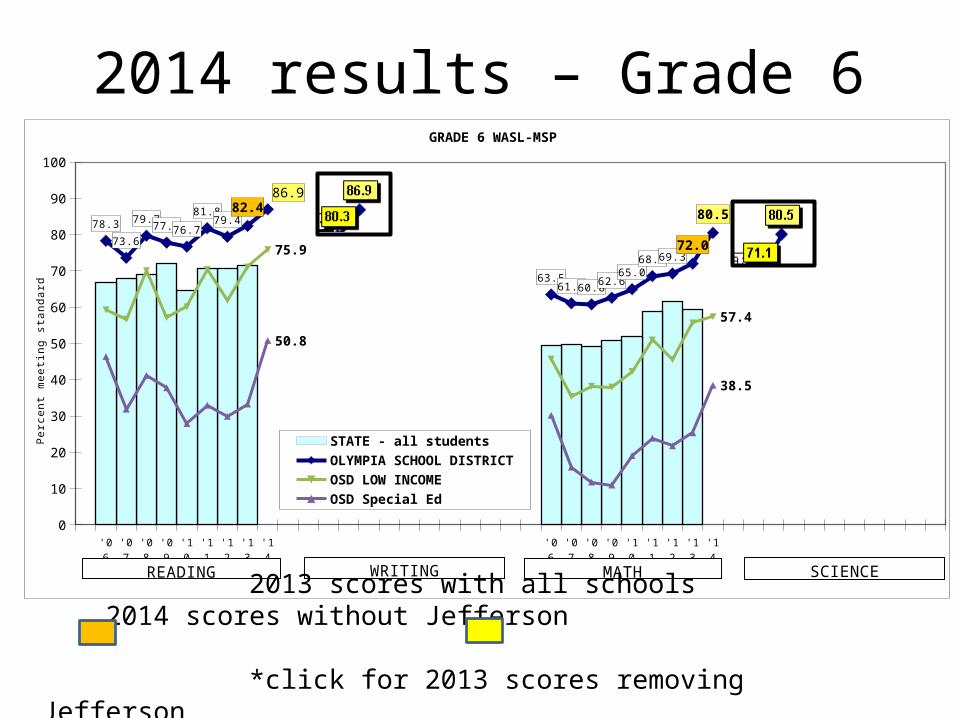
2014 results – Grade 6
'06 '07 '08 '09 '10 '11 '12 '13 '14 '06 '07 '08 '09 '10 '11 '12 '13 '14
0
10
20
30
40
50
60
70
80
90
100
78.3
73.6
79.777.876.7
81.879.4
82.486.9
63.561.160.8
62.665.0
68.669.372.0
80.5
75.9
57.4
50.8
38.5
GRADE 6 WASL-MSP
STATE - all students
OLYMPIA SCHOOL DISTRICT
OSD LOW INCOME
OSD Special Ed
Pe
rce
nt
me
etin
g s
tan
da
rd
READING MATHWRITING SCIENCE
2013 scores with all schools 2014 scores without Jefferson *click for 2013 scores removing Jefferson

2014 results – Grade 7
'06 '07 '08 '09 '10 '11 '12 '13 '14 '06 '07 '08 '09 '10 '11 '12 '13 '14 '06 '07 '08 '09 '10 '11 '12 '13 '14
0
10
20
30
40
50
60
70
80
90
100
77.980.2
76.0
69.3
76.473.5
82.681.1 79.5
74.077.376.475.8
79.478.381.081.7
78.7
64.7
69.4
61.9
67.2
75.474.774.374.9 74.7
63.1 63.158.7
34.638.5
35.8
GRADE 7 WASL-MSP
STATE - all students
OLYMPIA SCHOOL DISTRICT
OSD LOW INCOME
OSD Special Ed
Pe
rce
nt
me
etin
g s
tan
da
rd
READING MATHWRITING SCIENCE
2013 scores with all schools 2014 scores without Jefferson *click for 2013 scores removing Jefferson

2014 results – Grade 8
'04 '06 '07 '08 '09 '10 '11 '12 '13 '14 '04 '05 '06 '07 '08 '09 '10 '11 '12 '13 '04 '06 '07 '08 '09 '10 '11 '12 '13 '14 '06 '07 '08 '09 '10 '11 '12 '13 '14
0
10
20
30
40
50
60
70
80
90
100
84.180.079.978.4
80.182.0
79.779.5 81.6
64.867.4
70.6
60.1
67.366.166.664.768.5
60.859.3
64.162.3
64.9
78.5
84.0
59.1
80.3
73.2
55.8
68.2
48.1
37.735.4
GRADE 8 WASL-MSP
STATE - all studentsOLYMPIA SCHOOL DISTRICTOSD LOW INCOMEOSD Special Ed
Pe
rce
nt
me
etin
g s
tan
da
rd
READING MATHWRITING SCIENCE
2013 scores with all schools 2014 scores without Jefferson *click for 2013 scores removing Jefferson

2014 results – Grade 10
'06 '07 '08 '09 '10 '11 '12 '13 '14 '06 '07 '08 '09 '10 '11 '12 '13 '14 '06 '07 '08 '09 '10 '11 '12 '13 '14 '06 '07 '08 '09 '10 '11 '12 '13 '14
0
10
20
30
40
50
60
70
80
90
100 93.9
88.988.187.888.791.592.1
94.193.590.291.792.393.593.694.092.694.192.9
68.965.3
67.5
62.960.2
74.2
78.9
85.885.7
55.654.8
61.6
56.5
64.166.6
80.683.9
88.3
8378
69 67
62
76
46
52
GRADE 10 WASL-HSPE-EOC STATE - all studentsOLYMPIA SCHOOL DISTRICTOSD LOW INCOMEOSD SPECIAL ED
Pe
rce
nt
me
etin
g s
tan
da
rd
READING MATH - EOC Algebra and Ge-ometry combined-
WRITING SCIENCE - EOC Biology as of 2012

Grade 3 by district
Note: many of our previous comparison districts had all schools test on the SBA field test, making it impossible to compare scores. For 2014 district comparison we used the state scores, and our neighbor district scores to show if our trends were typical.

Grade 4 by district

Grade 5 by district
Example on next slide: when our scores appear low, it can be informative to use the OSPI report card to analyze strand data

5th grade MSP Math
strands (compared
to state average as a
baseline)
Why did Procedures
and Concepts go below state average in 2013-14?
5th Grade Number Sense and Algebraic Sense 5th Grade Measurement, Geometric Sense, and Statistics
5th Grade Problem Solving and Reasoning5th Grade Procedures and Concepts

6th grade by district
Example on next slide: when our scores appear HIGH, it can be informative to use the OSPI report card to analyze strand data

6th Grade Number Sense and Algebraic Sense 6th Grade Measurement, Geometric Sense, Probability and Statistics
6th Grade Problem Solving and Reasoning6th Grade Procedures and Concepts

7th grade by district

8th grade by district

New for 2014Score suppression if >=95% passing
B. Harbor N=27 83.3 73.3
B. Harbor N=30 96.7 100 93.3
B. Harbor N=25 100 76.0 96.0
OPSI Report
Card
OSD Score Sheet

With or without SBA Field test?3rd grade
Middle 3 columns are 2013 and 2014 WITHOUT CentennialGrey columns on either side represent 2013 WITH Centennial,
and 2014 IF WE ADD Centennial back.Sept.10.2014
.
3rd Grade 3rd 3rd 3rd + or - 3rd 3rd 3rd + or -
'13 '13 '14 no SBA '13 '13 '14 no SBA
15% B. Harbor N=27 100 100 83.3 81.8 81.8 73.3
13% Centennial N=82 88.1 84.5
55% Garfield N=42 83.8 83.8 80.4 83.8 83.8 76.1
37% Hansen N=67 80.7 80.7 75.3 63.4 63.4 57.5
39% L P Brown N=33 85.0 85.0 78.8 78.0 78.0 66.7
30% Lincoln N=58 82.2 82.2 62.7 65.1 65.1 45.8
45% Madison N=30 87.1 87.1 71.4 74.2 74.2 65.7
30% McKenny N=65 85.1 85.1 74.6 63.2 63.2 69.8
33% McLane N=46 75.6 75.6 74.5 71.7 71.7 57.4
17% Pioneer N=79 94.3 94.3 90.1 82.9 82.9 87.7
39% Roosevelt N=66 83.8 83.8 76.5 70.0 70.0 72.1
30% Orla N=14 53.8 53.8 50.0 30.8 30.8 16.7
17% Orla B N=19 80.0 80.0 89.5 45.0 45.0 57.9
31% District - 3rd 84.0 83.3 77.2 (6.1) 71.1 68.9 66.3 (2.6)
2013 scores WITH Centennial and Jefferson, compared to "if count 2013 SBA field test schoolschool % low income 2014
79 69
Reading Math
Olympia School District WASL-MSP-HSPE scores
2014 Score Release - comparing OSD to 2013 without Centennial or Jefferson SBAC
if count 2013 SBA field test
school
if count 2013 SBA field test
school
-5.0 -2.1

With or without SBA Field test?4th grade
Middle 3 columns are 2013 and 2014 WITHOUT CentennialGrey columns on either side represent 2013 WITH Centennial,
and 2014 IF WE ADD Centennial back.
4th Grade 4th 4th 4th + or - 4th 4th 4th + or - 4th 4th 4th + or -
Test Year '13 '13 '14 no SBA '13 '13 '14 no SBA '13 '13 '14 no SBA
15% B. Harbor N=30 100 100 96.7 68.0 68.0 93.3 76.0 76.0 100
13% Centennial N=81 78.6 83.3 84.5
55% Garfield N=36 84.6 84.6 94.7 64.6 64.6 71.1 84.6 84.6 97.3
37% Hansen N=71 85.3 85.3 68.9 56.8 56.8 62.2 67.4 67.4 54.1
39% L P Brown N=43 75.0 75.0 63.0 61.1 61.1 71.7 50.0 50.0 63.0
30% Lincoln N=46 82.1 82.1 66.0 30.8 30.8 51.1 35.9 35.9 53.2
45% Madison N=27 63.6 63.6 83.9 48.5 48.5 80.6 54.5 54.5 74.2
30% McKenny N=70 90.3 90.3 82.6 85.5 85.5 81.1 69.4 69.4 72.4
33% McLane N=43 82.7 82.7 78.3 71.2 71.2 73.9 69.8 69.8 69.6
17% Pioneer N=74 76.0 76.0 85.7 81.3 81.3 88.3 70.7 70.7 83.1
39% Roosevelt N=71 78.7 78.7 83.8 65.6 65.6 67.6 67.2 67.2 74.3
30% Orla N= 9 60.0 60.0 60.0 20.0 20.0 40.0 25.0 25.0 40.0
17% Orla B N=15 95.7 95.7 80.0 87.0 87.0 60.0 82.6 82.6 20.0
31% District - 4th 81.3 82.6 79.1 (3.5) 79 66.8 62.0 72.5 10.5 75 68.1 65.0 70.3 5.3 73
school % low income 2014
MathReading Writing
-2.3 4.9
if count 2013 SBA field test
school
if count 2013 SBA field test
school
8.2
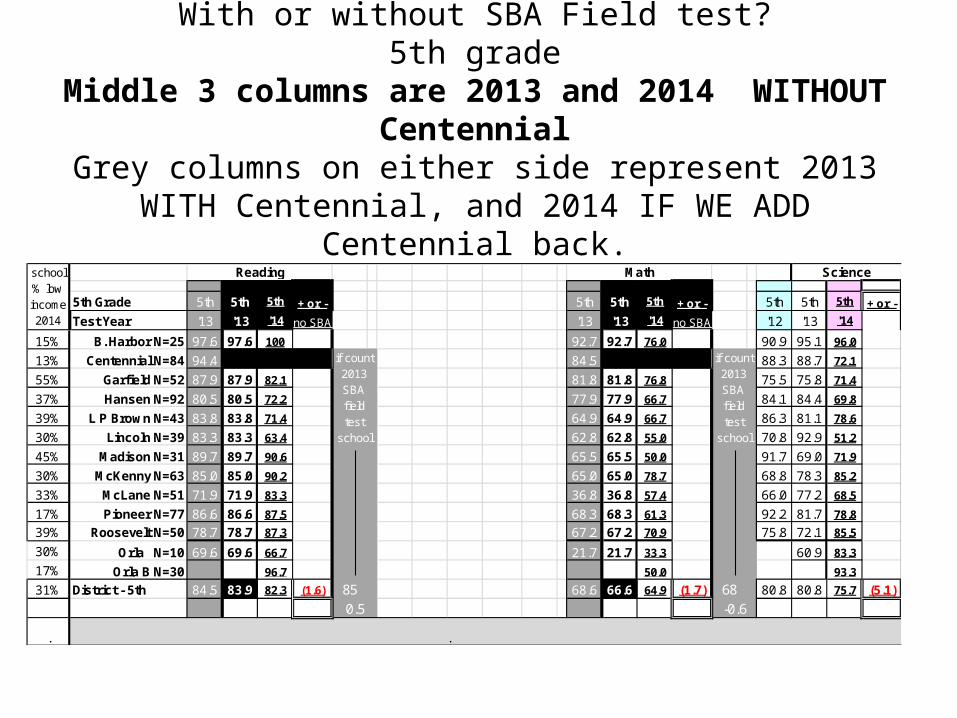
With or without SBA Field test?5th grade
Middle 3 columns are 2013 and 2014 WITHOUT CentennialGrey columns on either side represent 2013 WITH Centennial,
and 2014 IF WE ADD Centennial back.
5th Grade 5th 5th 5th + or - 5th 5th 5th + or - 5th 5th 5th + or -
Test Year '13 '13 '14 no SBA '13 '13 '14 no SBA '12 '13 '14
15% B. Harbor N=25 97.6 97.6 100 92.7 92.7 76.0 90.9 95.1 96.0
13% Centennial N=84 94.4 84.5 88.3 88.7 72.1
55% Garfield N=52 87.9 87.9 82.1 81.8 81.8 76.8 75.5 75.8 71.4
37% Hansen N=92 80.5 80.5 72.2 77.9 77.9 66.7 84.1 84.4 69.8
39% L P Brown N=43 83.8 83.8 71.4 64.9 64.9 66.7 86.3 81.1 78.6
30% Lincoln N=39 83.3 83.3 63.4 62.8 62.8 55.0 70.8 92.9 51.2
45% Madison N=31 89.7 89.7 90.6 65.5 65.5 50.0 91.7 69.0 71.9
30% McKenny N=63 85.0 85.0 90.2 65.0 65.0 78.7 68.8 78.3 85.2
33% McLane N=51 71.9 71.9 83.3 36.8 36.8 57.4 66.0 77.2 68.5
17% Pioneer N=77 86.6 86.6 87.5 68.3 68.3 61.3 92.2 81.7 78.8
39% Roosevelt N=50 78.7 78.7 87.3 67.2 67.2 70.9 75.8 72.1 85.5
30% Orla N=10 69.6 69.6 66.7 21.7 21.7 33.3 60.9 83.3
17% Orla B N=30 96.7 50.0 93.3
31% District - 5th 84.5 83.9 82.3 (1.6) 85 68.6 66.6 64.9 (1.7) 68 80.8 80.8 75.7 (5.1)
. .
school % low income 2014
Reading Math Science
if count 2013 SBA field test
school
if count 2013 SBA field test
school
0.5 -0.6

With or without SBA Field test?6th grade
Middle 3 columns are 2013 and 2014 WITHOUT JeffersonGrey columns on either side represent 2013 WITH Jefferson, and
2014 IF WE ADD Jefferson back.
6th Grade 6th 6th 6th + or - 6th 6th 6th + or -
Test Year '13 '13 '14 no SBA '13 '13 '14 no SBA
41% Jefferson N=117 91.7 75.8
34% Marshall N=117 58.5 58.5 77.7 41.5 41.5 68.2
32% Reeves N=130 89.8 89.8 90.0 78.8 78.8 75.5
16% Washington N=206 86.1 86.1 90.9 84.9 84.9 92.4
37% Orla N=14 67.6 67.6 80.0 29.4 29.4 60.0
28% District - 6th 82.4 80.3 86.9 6.6 71.9 71.1 80.5 9.4
.
if count 2013 SBA field test
school
88
if count 2013 SBA field test
school
81
.
5.6 9.1
school % low income 2014
Reading Math

With or without SBA Field test?7th grade
Middle 3 columns are 2013 and 2014 WITHOUT JeffersonGrey columns on either side represent 2013 WITH Jefferson, and
2014 IF WE ADD Jefferson back.
7th Grade 7th 7th 7th + or - 7th 7th 7th + or - 7th 7th 7th + or -
Test Year '13 '13 '14 no SBA '13 '13 '14 no SBA '13 '13 '14 no SBA
41% Jefferson N=108 83.6 86.4 81.1
34% Marshall N=100 79.1 79.1 58.8 70.5 70.5 52.3 61.4 61.4 53.3
32% Reeves N=150 78.6 78.6 80.5 85.7 85.7 79.8 76.4 76.4 76.7
16% Washington N=261 85.2 85.2 87.9 87.6 87.6 90.1 84.1 84.1 83.3
37% Orla N=11 59.4 59.4 61.5 50.0 50.0 38.5 34.4 34.4 38.5
28% District - 7th 81.0 80.6 79.5 (1.1) 81 81.6 80.7 78.7 (2.0) 81 74.9 73.7 74.7 1.0 77
.
0.0 2.1
MathWriting
.
Reading
if count 2013 SBA field test
school
if count 2013 SBA field test
school
if count 2013 SBA field test
school
-0.6
school % low income 2014

With or without SBA Field test?8th grade
Middle 3 columns are 2013 and 2014 WITHOUT JeffersonGrey columns on either side represent 2013 WITH Jefferson, and
2014 IF WE ADD Jefferson back.
8th Grade 8th 8th 8th + or - 8th 8th 8th + or - 8th 8th 8th + or -
Test Year '13 '13 '14 no SBA '13 '13 '14 no SBA '12 '13 '14
41% Jefferson N=115 89.1 74.8 81.6 81.6 87.5
34% Marshall N=129 74.5 74.5 74.2 48.2 48.2 56.4 83.3 65.4 72.8
32% Reeves N=139 78.9 78.9 84.2 62.0 62.0 67.1 79.5 80.3 78.7
16% Washington N=247 82.5 82.5 86.0 74.5 74.5 78.9 88.0 36.3 83.6
37% Orla N= 13 41.4 41.4 47.4 31.0 31.0 26.3 34.5 52.6
28% District - 8th 79.4 77.5 81.6 4.1 84 64.7 62.6 68.5 5.9 71 84.0 59.0 80.3 21.3
ScienceReading Math
4.6 6.3
if count 2013 SBA field test
school
if count 2013 SBA field test
school
school % low income 2014