· pdf fileconflicts of interest quick reference guide. under the nz public health and...
TRANSCRIPT

Auckland District Health Board
Hospital Advisory Committee Meeting
Wednesday 9 May 2012
9.30am
A+ Trust Room
Level 5, Clinical Education Centre
Auckland City Hospital
Hei Oranga Tika Mo Te Iti Me Te Rahi Healthy Communities, Quality Healthcare


1
ATTENDANCE AND APOLOGIES
1

2

2
CONFLICTS OF INTEREST
3

4

Conf l ic ts o f In terest Quick Reference Guide
Under the NZ Public Health and Disability Act Board members must disclose all interests, and the full nature of the interest, as soon as practicable after the relevant facts come to his or her knowledge. An “interest” can include, but is not limited to:
• Being a party to, or deriving a financial benefit from, a transaction. • Having a financial interest in another party to a transaction. • Being a director, member, official, partner or trustee of another party to a transaction or a
person who will or may derive a financial benefit from it. • Being the parent, child, spouse or partner of another person or party who will or may derive a
financial benefit from the transaction. • Being otherwise directly or indirectly interested in the transaction.
If the interest is so remote or insignificant that it cannot reasonably be regarded as likely to influence the Board member in carrying out duties under the Act then he or she may not be “interested in the transaction”. The Board should generally make this decision, not the individual concerned. Gifts and offers of hospitality or sponsorship could be perceived as influencing your activities as a Board member and are unlikely to be appropriate in any circumstances.
• When a disclosure is made the Board member concerned must not take part in any deliberation or decision of the Board relating to the transaction, or be included in any quorum or decision, or sign any documents related to the transaction.
• The disclosure must be recorded in the minutes of the next meeting and entered into the interests register.
• The member can take part in deliberations (but not any decision) of the Board in relation to the transaction if the majority of other members of the Board permit the member to do so.
• If this occurs, the minutes of the meeting must record the permission given and the majority’s reasons for doing so, along with what the member said during any deliberation of the Board relating to the transaction concerned.
IMPORTANT If in doubt – declare. Ensure the full nature
of the interest is disclosed, not just the existence of the interest.
This sheet provides summary information only - refer to clause 36, schedule 3 of the New Zealand Public Health and Disability Act 2000 and the Crown Entities Act 2004 for further information (available at www.legisaltion.govt.nz) and “Managing Conflicts of Interest – Guidance for Public Entities” (www.oag.govt.nz ).
5

6

ADHB BOARD AND COMMITTEE (HAC) INTERESTS REGISTER
NAME OF
BOARD
MEMBER
ORGANISATION ROLE FINANCIAL
INTEREST NATURE OF
INTEREST DATE OF
LATEST
DISCLOSURE
Lester LEVY (Chair)
University of Auckland Business School New Zealand Leadership Institute Health Benefits Limited Tonkin & Taylor Waitemata District Health Board
Professor of Leadership Chief Executive Deputy Chair Independent Chairman Chairman
28 March 2012
Jo AGNEW Professional Teaching Fellow, School of Nursing, Auckland University Casual Staff Nurse ADHB
Salary Salary
9 September 2011
Peter AITKEN
Pharmacist Pharmacy Care Systems Ltd Pharmacy New Lynn Medical Centre
Pharmacy Locum Shareholder/ Director, Consultant Owner
Hourly Fee
Medical Centre development and pharmacy lease
18 January 2012
Judith BASSETT
Nil 9 December 2010
2.0 Board and Committee Interests Schedule HAC 2012.doc
7

NAME OF
BOARD
MEMBER
ORGANISATION ROLE FINANCIAL
INTEREST NATURE OF
INTEREST DATE OF
LATEST
DISCLOSURE Susan BUCKLAND
Writing, editing and public relations services Medical Council of NZ Occupational Therapy Board Northern Regional Ethics Committee
Self-employed Professional Conduct Committee member Professional Conduct Committee member Member
Fees Hourly fee Hourly fee Fee
Writer, editor and public relations services Lay member of PCC set up to hear complaints brought to Medical Council and to determine outcomes Lay member of PCC to assess complaints and determine outcomes
7 August 2009
Dr Chris CHAMBERS
Employee, Auckland District Health Board Wife employed by Starship Trauma Service Clinical Senior Lecturer in Anaesthesia Auckland Clinical School Associate, Epsom Anaesthetic Group Member, ASMS Shareholder, Ormiston Surgical
20 April 2011
2.0 Board and Committee Interests Schedule HAC 2012.doc
8

NAME OF
BOARD
MEMBER
ORGANISATION ROLE FINANCIAL
INTEREST NATURE OF
INTEREST DATE OF
LATEST
DISCLOSURE
Rob COOPER
Ngati Hine Health Trust James Henare Research Centre, University of Auckland Whanau Ora Governance Group National Health Board Waitemata District Health Board
Chief Executive Board Member Chair Member Member
Salary No fee Fee (to Ngati Hine Health Trust Fee (to Ngati Hine Health Trust Fee (to Ngati Hine Health Trust
Management of a Health, Disabilities, Social & Education Services Trust Advisory Assists in the development of Government’s Whanau Ora policy
25 February 2011
Lee MATHIAS
Lee Mathias Limited Midwifery and Maternity Providers Organisation Limited Pictor Limited John Seabrook Holdings Limited AuPairlink Limited
Managing Director Director Shareholder, Director Director Governance Advisor
Fee Fee paid to Lee Mathias Limited Fee No fee Fee
Shareholder, director, independent directorships and healthcare services consulting Provider of business and professional services to midwives and other maternity services providers Biotech start-up focussing on diagnostic products Estate of late husband Provider of early childhood education
1 November 2011
2.0 Board and Committee Interests Schedule HAC 2012.doc
9

NZ Council of Midwifes Tamaki Transformation Transitional Board Health Promotion Establishment Board
Council member Chair Chair
Fee Fee
services contracted to the MoE. Statutory Authority
Robyn NORTHEY
Self employed Contractor Hope Foundation University of Auckland, Human Participants Research Ethics Committee
Project management, service review, planning etc. Board member Member
Fee Nil Fee
Some clients are contractors to ADHB Research and Education into Aging in NZ, Deliver Seminars and awards scholarships
7 December 2011
Gwen TEPANIA-PALMER
Waitemata District Health Board Manaia PHO Ngati Hine Health Trust Te Taitokerau Whanau Ora
Board member Board member Chair Committee member
Fee Fee
18 May 2011
Ian WARD C -4 Consulting Limited NZ Blood Service Francis Group Consultants
Principal/ Director Board Member Advisor
Fee Fee
19 January 2012
2.0 Board and Committee Interests Schedule HAC 2012.doc
10

2.0 Board and Committee Interests Schedule HAC 2012.doc
NAME OF
BOARD
MEMBER
ORGANISATION ROLE FINANCIAL
INTEREST NATURE OF
INTEREST DATE OF
LATEST
DISCLOSURE
Anne KOLBE
Private Paediatric Surgical Practice Employee Communio NZ Siggins Miller, Australia Head, Auckland Clinical School, School of Medicine, University of Auckland Husband: Employee University of Auckland Risk and Audit Committee Whanganui District Health Board Pharmac Board National Health Committee
Director Senior Consultant Senior Consultant Employee Member Member Chair
Joint Owner Contractor Contractor Fee Fee Fee
28 March 2012
11

12

3
CONFIRMATION OF MINUTES
WEDNESDAY 28 MARCH 2012
13

14

Hospital Advisory Committee
M i n u t e s
Minutes of the Hospital Advisory Committee meeting held on Wednesday, 28 March 2012 in the A+ Trust Room, Clinical Education Centre, Level 5, Auckland City Hospital, Grafton commencing at 9:30am.
1 ATTENDANCE AND APOLOGIES
The Chair declared the meeting open at 9:32am.
Committee Members
Judith Bassett (Chair) Jo Agnew Peter Aitken Susan Buckland Dr Chris Chambers Dr Lester Levy Dr Lee Mathias Robyn Northey Gwen Tepania-Palmer Ian Ward Associate Professor Anne Kolbe Management in Attendance Garry Smith - Chief Executive Brent Wiseman – Chief Financial Officer Greg Balla – Director Performance and Innovation Ngaire Buchanan – General Manager Operations Taima Campbell – Executive Director of Nursing Margaret Dotchin – Nurse Director Adult Health Services Janice Mueller – Executive Director of Allied Health, Scientific and Technical Linda Wakeling – General Manager Information Management Services Ian Bell - Board Administrator
Apologies
Apologies had been received from Rob Cooper and Dr Margaret Wilsher. An apology for lateness had been tendered by Gwen Tepania-Palmer.
Moved Judith Bassett, seconded Jo Agnew
That the apologies be sustained.
Carried
2 CONFLICTS OF INTEREST
There were no declarations of conflicts of interest for any item on the agenda. Anne Kolbe advised of a change to her status with the University of Auckland.
3 CONFIRMATION OF MINUTES 15 FEBRUARY 2012
Cardiac
The Chief Executive advised that there had been an independent review of the cardiac unit with the report being more favourable than other units in New Zealand including favourable comments on productivity. The review included looking at scoring and triage of patients. This lead to considerable further discussion by the committee.
Waiting list variations include variations due to clinicians’ behaviour i.e., referring patients to clear space around statutory holidays and school holidays which can create surges in demand. Any patterns should be apparent and these should be able to be protected against by using gaps in lists at other times to get ahead of the waiting list. The service had been assisted by improvement specialists and the results were clinically supported. Communication and sponsorship was provided by the CMO Margaret Wilsher; Director of Surgery Ian Civil and Clinical Director Cardiology Peter Ruygrok. A further surgeon will commence in April and there will be an
15

additional bed in the High Dependency Unit (HDU).
Delivery is ahead of contract. While surges caused increases in the waiting lists, ability to predict flows through the system, together with increasing capacity, should enable the variations to be managed, as would managing the front door and improving how patients are managed in the community.
The committee wished to see results improving against targets. It was noted that the guideline for the waiting list of 94 was 10% of the 940 volume contracted. It was suggested that a small increase in the base outsourcing contracted could assist. However as much as possible had been contracted already within the private sector’s capacity. Another factor limiting outsourcing was restrictions on patients’ ability to travel, although some had been outsourced to Waikato and Dunedin.
Minutes
Moved Judith Bassett; seconded Jo Agnew
That the minutes of the Hospital Advisory Committee meeting held on 15 February 2012 be confirmed as a true and correct record.
Carried
4 ACTION POINTS 15 FEBRUARY 2012
St John’s Data
A team was working with St John’s who were piloting a model of treating older patients in the residential facility or transporting them to A&M rather than ED. There was a team from Older Peoples’ Services designing the package of care which could include, for example, district nurses.
Report on Maori and Pacific Nurses
This report scheduled for June would be provided by Margaret Dotchin and Carolyn Simmons Carlsson.
Inventory Management Report
Work was being undertaken with healthAlliance, with measures agreed. While there would be benefits from management improvements, measures were partly manual as ADHB did not have a full bar-coding system and items of stock, despite variations in value, were treated the same. It was suggested that there needed to be a notional billing system. The Oracle 12 system upgrade would provide some ability to manage stock. It was important to understand Health Benefits Limited’s (HBL) direction i.e. bar-coding products to patients and recording high risk products so that they could be traced. Financials should be able to be connected to these types of systems.
The Committee asked for an update, outlining options, including costs etc., in three months.
5.1 Operational Performance Report
The result for the month was a loss of $4.8m against a budgeted surplus of $1m. The position to year end was being reviewed.
The decline in acute patient numbers was significant and included drops in paediatric patients compared with last year. Presentations by Maori and Pacific followed the same pattern as the main population.
Electives for ADHB were behind target so services have a number of initiatives to recover the position underway, including outsourcing, swapping sessions and Saturday lists. The Committee requested daily reports on cancellations of lists, what the gaps are filled with, if they are filled, as well as lists finished early.
Patients on waiting lists at five and a half months were known and two-thirds of these had had an appointment booked with the other third being contacted to book an appointment. The Board could not afford a penalty for non compliance with Elective Services Performance (ESP) as it had a large financial impact. The ‘gap’ must be corrected by 31 May and any problems should be escalated early. There was dialogue with Counties Manukau and Waitemata.
Elective performance was in total delivering over contract, with an example being 13% more
16

referred by Waitemata with all electives being treated on clinical need rather than to contract. There was a need for debate on whether clinical need should have an overwhelming and invariable priority when economic penalties could compromise services to all patients. .
Each service was doing a review of the Zero Patients Waiting over Six Months target for electives and getting patients booked. There is a regional process as well. Ophthalmology reported that it had drawn up a ‘work-out plan’.
OR utilisation included clean up time. The Committee asked that the definition of utilisation be explicitly stated and clearly communicated to staff. It was suggested that the anonymised performance of individual surgeons be published so that they could compare with a benchmark.
ADHB had committed to 133 improvement activities in the Annual Plan and most are tracking well. Six projects were running behind including the primary care initiative however the structures and governance for this project had finally been agreed.
9.1 Resolution to exclude the public from a meeting of the Hospital Advisory Meeting
Moved Anne Kolbe; seconded Robyn Northey
That the exclusion of the public from the relevant part of the meeting is necessary to enable the Board to deliberate in private on a decision or recommendation as to whether any of the grounds in paragraphs (a) to (d) of clause 32 of Schedule 3 of the Act are established in relation to all or any part of the meeting.
1. THAT the public be excluded from the following part of the proceedings of this meeting, namely consideration of items 9 to of the Agenda.
The general subject of the matters to be considered while the public is excluded, the reason for passing this resolution in relation to each matter, and the specific grounds under the above clause for the passing of this resolution are as follows:
Carried
Items discussed in public exclusion were the confidential HAC minutes 15 February 2012, Nursing Bureau and Casual Management in ADHB, Risk and Quality reports.
Moved Chris Chambers; seconded Susan Buckland
That the meeting resume in public.
Carried
5.3 General Medicine Service Excellence
Barry Snow, Medical Director; Robyn Toomath, Clinical Director and Jane Lees, Nurse Advisor presented to the Committee.
Barry Snow acknowledged the work of the improvement specialists. The initial presentation to the Committee in September 2011 with a new plan was by Art Nahill on his final day as Clinical
General subject of each matter to be considered: 9.1 Confidential HAC Minutes
15 February 2012 9.2 Nursing Bureau and Casual
Management in ADHB 9.3 Risk Report 9.4 Quality
That the public conduct of the relevant part of the meeting would be likely to result in the disclosure of information for which good reason for withholding would exist under s 9 of the Official Information Act 1982.
To enable the Board to carry on without prejudice or disadvantage commercial activities and negotiations: Official Information Act 1982
s.9(2)(i) and s.9(2)(j)
Greenlane Surgical Unit 9.5
Ground(s) under clause 34 for the passing of this
: resolution
Reason for passing this resolution in relation to each matter:
17

Director when General Medicine was struggling and in crisis. The new Clinical Director, Robyn Toomath presented to the Committee on the situation at September 2011 and then showed the improvements that had been proposed at that time, with the first of these being a change in the weekend model from two teams to four teams. Implemented in December were three teams; and there would be four teams for winter beginning in June 2012. The results of the change had been 60 plus weekend discharges per month, and more effective and timely review of patients.
There had been a decline in patients decanted to other services due to high workload, with those now only being those that needed to be referred for clinical reasons to those services.
While RMO shifts would not be totally realigned, a call back registrar had been implemented from 4pm to 10pm who will become the third registrar. The next step will be an additional registrar in winter, beginning June. The Shorter Stay in ED project had the barriers in General Medicine analysed which showed most of the breaches occurred on the nightshift when only one registrar was on duty. There had been no SMO cover in the afternoons and this had been rectified by including one evening acute round. A SMO now held the GP phone rather than junior staff.
A further improvement was to split the medical team into 4 for AED/APU and 8 for the wards with early ward rounds and a balanced workload and for the first time no medical teams had 20 plus patients in a given day. These changes had meant that more patients were discharged from AED and APU with fewer admitted to in-patient wards where the average length of stay has been significantly reduced to the goal of 3.2 days from 3.7 days. This is as a result of senior decisions being made earlier with a 30% drop in median length of stay in the first three months. All clinics are now supervised by a consultant and all new patients reviewed by a consultant and there had been improved teaching of RMOs in clinics.
Challenges to the improvements were patients admitted not going to the correct general medical ward which required medical handover and there was mixed support for the new model among SMOs. Four new SMOs had been appointed to fill vacancies with further CVs being received from those wishing to work at ADHB. The nurse initiatives were being sustained with direct care time increasing from 32% to 38% and there had been an 85% reduction in waiting time from bed request to ward admission. Patients’ feedback had been sought with the improvements reflected in these although there was still some frustration in waiting for ward rounds and discharge information.
The reduction in length of stay by 30% was due to outstanding leadership led by data driven information that had defined where the issues were.
The work of Art Nahill and the support of the improvement specialists was acknowledged.
5.2 Health Target Updates
The Board Chair requested that the Health Target reports include the quarterly results. The Adult Acute Patient Flows were expected to meet the target. He noted that Waitemata had instituted daily reports to services. Orthopaedics were making some progress but not at as great a rate as General Medicine. Work was being done to reduce patients’ length of stay by 2 days.
The improvement in the Better Help for Smokers was due to clarification of counting and additional leadership at the service level.
18

NEXT MEETING
The meeting closed at 12:20pm.
The next meeting is scheduled for 9:30am, Wednesday, 9 May 2012 A+ Trust Room, Clinical Education Centre Level 5, Auckland City Hospital Grafton.
Signed as a true and correct record of the Hospital Advisory Committee meeting held on Wednesday, 28 March 2012.
CHAIR: DATE:
19

20

4
ACTION POINTS
WEDNESDAY 28 MARCH 2012
21

22

Hospital Advisory Committee Action Points from the meeting on Wednesday 28 March 2012
Item Detail Designated Action Carried forward
Report from St John’s data on where 80+ patients go
Ngaire Buchanan June 2012
Carried forward
A report in six months was requested on programmes for recruiting Maori and Pacific nurses and midwives and also on Maori and Pacific participation in the allied workforce.
Margaret Dotchin Carolyn Simmons Carlsson
June 2012
4. A further paper to come in June 2012 on inventory management. It will include showing the supply chain, a view of national inventory and the purchasing model.
Greg Balla Brent Wiseman
June 2012 Attached
5.1 The Committee requested daily reports on cancellations of surgical lists, what they are filled with as well as lists finished early.
Ngaire Buchanan Actioned
5.1 The Committee asked that the definition of OR utilisation be stated
Margaret Wilsher Actioned
5.2 Health Target reports to include quarterly results. Greg Balla Noted
23

24

5
PROVIDER OPERATIONAL PERFORMANCE REPORT
5.1 Operational Performance Report
5.2 Health Target Updates
25

26

5 .1 Opera t iona l Per formance Repor t
27

28

Contents (with lead HAC attendee)
5.1.1. Overview – N Buchanan
5.2.1. Acute services performance – Dr M Wilsher
5.1.3 Elective services performance – Dr M Wilsher
5.1.4 Productivity – N Buchanan
5.1.4.1 Improvement projects – N Buchanan
5.1.4.2 Savings schedule progress – N Buchanan
5.1.5 Financial performance – B Wiseman
5.1.6 HAC Exception Report – N Buchanan
Appendix 1 Operating Statement February 2012
29

1. Overview – Ngaire Buchanan
Overall Assessment
Overall The provider overall had a good result for the health targets in March. We achieved the target for the month and the quarter for the ED6hr (acute flow) target and Radiation Therapy waiting time target. For the electives discharges target we are just below the target at 99% YTD and smoking cessation we achieved our best result of 95% for the month. Waiting list reduction for both first specialist assessment (ESPI 2) and surgical event (ESPI 5) were above plan for the month. These results were achieved while managing very high acute demand for the month of March (105% to plan). Against a budget surplus of $2.6m for the month of March the provider arm reported a loss of $2.5m and hence was unfavourable to budget by $5.1m for the month. Provider revenue was $1m favourable for the month. The main unfavourable cost variances for the most are employee cost $3.5m and DTC cost $0.8m. These variances are explained on section 5.3 and 5.5 respectively. An action plan has been created to drive to zero deficit.
Interpretation Note
The ADHB Provider for which results are presented here comprises the “operational” areas such as Adult Health, Cancer & Blood and Cardiac as well as “functional” services such as Finance, HR and IS which support the operational areas and finally “complementary” services such as Public Health, A+ Trust, Research and the retail businesses.
WIES – weighted inlier equivalent separations – a weighting assigned to patients indicating the level of resources employed in treating the patient’s condition – used as a proxy for complexity:-
Average WIES for coronary bypass ≈ 6 – 10 wies per case
Average WIES for hernia procedures without complication ≈ 1 wies per case
Average WIES for paediatric tonsillectomy ≈ 0.5 – 0.6 wies per case
30

2. Acute services performance – Margaret Wilsher
Table 1 below shows the acute discharges delivered by ADHB over time. This includes the inter- district flows ie services delivered for other DHB’s. March was the highest month during this period and 105% to plan.
ACUTE PATIENT NUMBERS Financial Year Jul Aug Sep Oct Nov Dec Jan Feb Mar YTD
2011
8,182
8,121
8,076
8,070
7,974
8,109
7,259
7,136
7,982
70,909
2012
8,007
8,124
8,250
8,013
7,718
7,792
7,314
7,382
8,370
70,970
Table 1: Acute Discharges by month
Interpretation Note
The ADHB Provider for which results are presented here comprises the “operational” areas such as Adult Health, Cancer & Blood and Cardiac as well as “functional” services such as Finance, HR and IS which support the operational areas and finally “complementary” services such as Public Health, A+ Trust, Research and the retail businesses.
WIES – weighted inlier equivalent separations – a weighting assigned to patients indicating the level of resources employed in treating the patient’s condition – used as a proxy for complexity:-
Average WIES for coronary bypass ≈ 6 – 10 wies per case
Average WIES for hernia procedures without complication ≈ 1 wies per case
Average WIES for paediatric tonsillectomy ≈ 0.5 – 0.6 wies per case
Table 2 below represents WIES performance to plan (WIES represents patient numbers with a weighting for complexity.)
31

Acute (WIES) 9 months to March
DHB Actual YTD Variance to Plan % of completion
ADHB 37,404 -137 100%
CMDHB 9,490 26 100%
NLDHB 4,032 600 117%
WDHB 12,752 -1,457 90%
Other 5,167 -35 99%
Total 68,845 -1,002 99%
Overall YTD performance for acute WIES is 99% to plan.
Table 2: Acute WIES variance to plan by DHB of domicile
ADHB Population Acute WIES Per Month
3000
3200
3400
3600
3800
4000
4200
4400
4600
4800
Jul 0
9
Aug 09
Sep 09
Oct 09
Nov 09
Dec 09
Jan 1
0
Feb 10
Mar 10
Apr 10
May 10
Jun 1
0
Jul 1
0
Aug 10
Sep 10
Oct 10
Nov 10
Dec 10
Jan 1
1
Feb 11
Mar 11
Apr 11
May 11
Jun 1
1
Jul 1
1
Aug 11
Sep 11
Oct 11
Nov 11
Dec 11
Jan 1
2
Feb 12
Mar 12
Acute contract Acute actual
ADHB acute wies are 137 behind plan year to date, each wies is ‘worth’ approximately $4,500. Because the revenue for the ADHB population is fixed via the population based
32

funding mechanism, the DHB does not receive less revenue for this production (or more revenue if over-production occurs).
Interpretation Note
We have been asked previously to provide additional ethnicity based data in the HAC report. The following charts were provided last month. They show total acute wies for Maori and Pacific people – absolute numbers of wies and as a share of all acute wies. We acknowledge that the information they contain can be ambiguous – if the share of acute wies for Maori or Pacific People is higher than their population share this can indicate unmet need in the community, conversely if the share of acute wies for Maori or Pacific People is lower than their population share this can indicate access issues. Hospital management have commenced discussions with He Kamaka Oranga and Pacific Health to gain more insight into these issues. Issues which will be explored in the future include : comparison to national data, comparison of intervention levels for specific procedures or groups of procedures. Stages agreed in enhancing this data are:-
• Continue with existing dataset.
• Add specific indicators suggested for Maori and Pacific People.
• Consider additional data especially those related to the interface between hospital services and primary care.
• Critical to the approach will be the identification of a key contact to provide comment and context on the data to the authors of Committee reports.
33

Acute Data - Maori
0
50
100
150
200
250
300
350
400
450
500
Jul-0
9
Aug-09
Sep-09Oct-
09
Nov-09
Dec-09
Jan-1
0
Feb-1
0
Mar-10
Apr-10
May-10
Jun-1
0Ju
l-10
Aug-10
Sep-10Oct-
10
Nov-10
Dec-10
Jan-1
1
Feb-1
1
Mar-11
Apr-11
May-11
Jun-1
1Ju
l-11
Aug-11
Sep-11Oct-
11
Nov-11
Dec-11
Jan-1
2
Feb-1
2
Mar-12
0.0%
2.0%
4.0%
6.0%
8.0%
10.0%
12.0%
Acute WIES for Maori (actual) Acute WIES for Maori as % of all Acute WIES
Acute Data - Pacific
0
100
200
300
400
500
600
700
800
Jul-0
9
Aug-0
9
Sep-0
9
Oct-09
Nov-0
9
Dec-0
9
Jan-1
0
Feb-10
Mar-10
Apr-10
May-10
Jun-1
0Ju
l-10
Aug-1
0
Sep-1
0
Oct-10
Nov-1
0
Dec-1
0
Jan-1
1
Feb-11
Mar-11
Apr-11
May-11
Jun-1
1Ju
l-11
Aug-1
1
Sep-1
1
Oct-11
Nov-1
1
Dec-1
1
Jan-1
2
Feb-12
Mar-12
0.0%2.0%4.0%6.0%8.0%10.0%12.0%14.0%16.0%18.0%20.0%
Acute WIES for Pacific People (actual) Pacific People WIES as % of all Acute WIES
Interpretation Note:- The charts above represent a view of ADHB population treated at ACH, not a comprehensive population view which would incorporate the ADHB population treated at other hospitals. The 8% for Maori and 16%for Pacific represent the approximate relative proportions of ADHB populations.
34

3. Elective services performance – Margaret Wilsher
Overall – Elective WIES for nine months to March 2012
DHB Actual YTD Variance to Plan % of completion
ADHB 10,974 -717 94% CMDHB 3,981 -47 99% NLDHB 1,594 -90 95% WDHB 5,527 624 113% Other 3,084 404 115% Total 25,160 174 101%
Cases are not selected in order to meet plan as the decision to treat is necessarily based on clinical need, not DHB of domicile. This can result in fluctuation against targeted volumes.
Interpretation Note: Health Target
Some elective services are not counted against the Health Target. The following services are excluded: dermatology, oral health, paediatric cardiac, adult congenital heart and cardiology. The Health Target for elective outputs is also different from the wies production data which follows in that:
• The Health Target is measured in discharges (patient numbers) not wies; for Health Target purposes a cardiac bypass case of 7 wies is the same as an eye procedure of 0.5 wies.
• Some of the discharges counted against the Health Target are not included in the wies system and accordingly do not appear at all in the charts which follow – the main example being surgical treatment of skin lesions.
• The Health Target excludes the services listed above.
• The Health Target is for ADHB’s own population only.
The charts and tables below provide a graphical presentation of the volumes for ADHB’s population and the work completed for other DHBs.
35

Auckland DHB - WIES
Jul-11 Aug-11 Sep-11 Oct-11 Nov-11 Dec-11 Jan-12 Feb-12 Mar-12 Apr-12 May-12 Jun-12
Cumulative Original Plan 1,366.8 2,863.8 4,295.6 5,597.4 7,029.2 8,005.5 9,242.2 10,543.9 11,975.8 13,147.3 14,644.3 15,946.0
Cumulative Current Plan 1,244.3 2,677.9 4,065.9 5,339.2 6,788.8 7,896.3 8,746.1 10,116.8 11,691.1 12,920.3 14,515.0 15,946.0
Cumulative Actual WIES 1,168.3 2,421.8 3,831.9 5,016.4 6,383.5 7,656.7 8,321.1 9,590.3 10,974.4
Cumulative Actual WIES Variance -75.9 -256.0 -234.1 -322.8 -405.3 -239.6 -425.0 -526.5 -716.7
% Plan Achieved 94% 90% 94% 94% 94% 97% 95% 95% 94%
% Coded 100% 100% 100% 100% 100% 100% 100% 100% 100%
Elective Cumulative Inpatient WIES VolumesFor Auckland DHB
For 01 July 2011 to 30 June 2012
0
2000
4000
6000
8000
10000
12000
14000
16000
18000
Jul-11 Aug-11 Sep-11 Oct-11 Nov-11 Dec-11 Jan-12 Feb-12 Mar-12 Apr-12 May-12 Jun-12
Original Plan VolumeCurrent Plan VolumeActual WIES
36

Because funding for ADHB’s population is on the basis of a population based funding formula, an underperformance on ADHB elective WIES is not a revenue risk, except if it is matched by an underperformance on the Health Targets which have revenue attached (and for which the revenue is calculated on the basis of WIES production).
As noted above, the ethnicity based data for elective wies is being reviewed for relevance and appropriateness and will be refined over time.
37

Counties Manukau – planned and actual WIES
Jul-11 Aug-11 Sep-11 Oct-11 Nov-11 Dec-11 Jan-12 Feb-12 Mar-12 Apr-12 May-12 Jun-12
Cumulative Original Plan 470.9 986.6 1,479.9 1,928.3 2,421.6 2,757.9 3,184.0 3,632.4 4,125.7 4,529.3 5,045.0 5,493.4
Cumulative Current Plan 428.7 922.5 1,400.7 1,839.4 2,338.8 2,720.3 3,013.1 3,485.3 4,027.6 4,451.1 5,000.5 5,493.4
Cumulative Actual WIES 375.8 860.5 1,306.1 1,771.5 2,253.1 2,614.1 2,948.3 3,386.8 3,980.8
Cumulative Actual WIES Variance -52.8 -62.0 -94.6 -67.9 -85.6 -106.2 -64.7 -98.4 -46.8
% Plan Achieved 88% 93% 93% 96% 96% 96% 98% 97% 99%
% Coded 100% 100% 100% 100% 100% 100% 100% 100% 100%
Elective Cumulative Inpatient WIES VolumesFor Counties Manukau DHB
For 01 July 2011 to 30 June 2012
0
1000
2000
3000
4000
5000
6000
Jul-11 Aug-11 Sep-11 Oct-11 Nov-11 Dec-11 Jan-12 Feb-12 Mar-12 Apr-12 May-12 Jun-12
Original Plan VolumeCurrent Plan VolumeActual WIES
38

Northland – planned and actual WIES
Jul-11 Aug-11 Sep-11 Oct-11 Nov-11 Dec-11 Jan-12 Feb-12 Mar-12 Apr-12 May-12 Jun-12
Cumulative Original Plan 196.8 412.4 618.5 806.0 1,012.2 1,152.7 1,330.8 1,518.3 1,724.4 1,893.1 2,108.7 2,296.1
Cumulative Current Plan 179.2 385.6 585.5 768.8 977.5 1,137.0 1,259.4 1,456.8 1,683.4 1,860.4 2,090.1 2,296.1
Cumulative Actual WIES 110.5 266.3 514.4 690.6 974.9 1,178.4 1,253.3 1,426.5 1,593.6
Cumulative Actual WIES Variance -68.6 -119.3 -71.1 -78.2 -2.7 41.4 -6.1 -30.2 -89.8
% Plan Achieved 62% 69% 88% 90% 100% 104% 100% 98% 95%
% Coded 100% 100% 100% 100% 100% 100% 100% 100% 100%
Elective Cumulative Inpatient WIES VolumesFor Northland DHB
For 01 July 2011 to 30 June 2012
0
500
1000
1500
2000
2500
Jul-11 Aug-11 Sep-11 Oct-11 Nov-11 Dec-11 Jan-12 Feb-12 Mar-12 Apr-12 May-12 Jun-12
Original Plan VolumeCurrent Plan VolumeActual WIES
39

Waitemata – planned and actual WIES
Jul-11 Aug-11 Sep-11 Oct-11 Nov-11 Dec-11 Jan-12 Feb-12 Mar-12 Apr-12 May-12 Jun-12
Cumulative Original Plan 580.3 1,215.9 1,823.9 2,376.6 2,984.6 3,399.1 3,924.2 4,476.9 5,084.9 5,582.3 6,217.9 6,770.6
Cumulative Current Plan 521.8 1,123.0 1,705.1 2,239.0 2,846.9 3,311.4 3,667.7 4,242.5 4,902.8 5,418.2 6,087.0 6,687.1
Cumulative Actual WIES 631.8 1,263.2 1,895.0 2,505.1 3,212.4 3,824.4 4,191.9 4,793.7 5,526.7
Cumulative Actual WIES Variance 110.0 140.2 189.9 266.1 365.4 513.0 524.1 551.2 623.9
% Plan Achieved 121% 112% 111% 112% 113% 115% 114% 113% 113%
% Coded 100% 100% 100% 100% 100% 100% 100% 100% 100%
Elective Cumulative Inpatient WIES VolumesFor Waitemata DHB
For 01 July 2011 to 30 June 2012
0
1000
2000
3000
4000
5000
6000
7000
8000
Jul-11 Aug-11 Sep-11 Oct-11 Nov-11 Dec-11 Jan-12 Feb-12 Mar-12 Apr-12 May-12 Jun-12
Original Plan VolumeCurrent Plan VolumeActual WIES
40

Top and Bottom Three Elective Services for Auckland Population
The following table is a presentation of the top and bottom 3 elective services for ADHB’s own population (by variance in WIES). The variance from plan is shown in wies and this is converted to approximate patient numbers in the final column.
Plan Actual Variance Variance Average wies
per Variance Top 3 wies wies wies % Patient Patients ORL 641 756 115 18% 1.1 102 Cardiology 526 604 78 15% 1.3 58 Vascular Surgery 345 400 55 16% 2.2 25 Bottom 3 General Surgery 2,440 2,205 -235 -10% 1.5 -158 Orthopaedics 2,559 2,380 -179 -7% 2.8 -64 Cardiothoracic 921 743 -178 -19% 6.4 -28
41

First specialist assessment performance for Northern Region DHBs (ESPI 2)
First specialist assessments (FSA) are an important component of the elective flow. Patients having an FSA may be referred to a surgical wait-list, but they may also be managed medically and in some cases a decision may be made that no treatment is required. This has implication for production planning in that an increase of 100 in a target for surgical discharges may require an additional 200 – 300 FSAs to provide 100 additional surgical cases on the wait-list. For production planning purposes an assessment has been made service by service of the conversion rate of surgical service FSAs to the surgical waitlist. For General Surgery, for example, we estimate that some 70% of FSAs result in a referral to the surgical waitlist. Medical service FSAs do not typically result in referrals to a wait list but may do for example in respect of medical services closely associated with a surgical service e.g. Cardiology.
The table which follows illustrates the FSA volumes through: actual numbers compared to planned numbers for Northern Region DHBs. The period covered is the nine months to March 2012.
DHB Year to Date March
Actual Variance %
Complete ADHB 37,386 1,170 103% CMDHB 8,485 -535 94% NLDHB 722 -190 79% WDHB 14,192 -164 99% Other 1,225 -34 97% 62,010 247 100%
The chart below shows are performance against our plan for delivering zero patients waiting longer than 6 six months for a first specialist assessment. Since the 16 of March to the 26 of April we have reduced this list by 2144 FSA’s versus a plan of 1499.
For the plan going forward we have brought forward all patients from the last two weeks of June to provide a buffer.
While these results are positive to date this requires considerable daily focus.
42

Chart: First specialist assessments vs plan for zero waiting > 6 mths target by June 30.
43

Elective Performance: Zero Patients Waiting Over 6 Months (ESPI 5)
An ADHB Annual Plan objective is that no patients are waiting over 6 months for clinic or surgery by 30 June 2012.
Individual services have targeted the timeframes as set out below. These are more challenging than advised to NHB to allow for increased understanding of referrals flows and to allow for data anomalies and classification issues to be worked through the system.
Clearly as 30 June 2012 approaches some services still have challenges in meeting the commitment made. All services have been asked to develop plans to achieve compliance by 31st May.
Some of these services have significant IDF components within their waitlists (e.g. Ophthalmology and Gynaecology) which may require ADHB to deliver above planned levels in order to deliver services within the 6 months or the appropriate waiting time for the assigned patient priority.
The chart below shows are performance against our plan for delivering zero patients waiting longer than 6 six months for surgery. Since the 16 of March to the 26 of April we have reduced this list by 820 surgical procedures versus a plan of 792.
Chart: Elective Services target vs plan to achieve target of zero people waiting> 6 months by June 30.
44

ZERO WAITERS > 6 MONTHSGreen as compliant with zero or on target to meet timeframe for achieving targetAmber for service not achieving zero or timeline target at risk in a minor wayRed for services that are at high risk of not achieving zero by required timeline
Traffic Light
Clinic at date of report
Surgery at date of report
31-Mar 31-MarJul Aug Sep Oct Nov Dec Jan Feb Mar Apr May Jun No. Pts No. Pts No. Pts
Gastroenterology Clinic 66 - General Medicine Clinic - -
General SurgeryClinic Surgery 50 29 21
Infectious Diseases Clinic - - Haematology Clinic - - Liver Transplant Clinic - - Neurology Clinic - -
Neurosurgery Adult Clinic Surgery 42 18 24
Medical Oncology Clinic - -
Ophthalmology Clinic Surgery 306 186 120
ORL Adult Surgery Clinic 33 24 9 Oral Health Surgery - 1
Orthopaedics AdultClinic Surgery 44 23
Renal Clinic - -
Urology Clinic Surgery - 32
Cardiology 3 25
CardiothoracicClinic Surgery 19 - 19
Respiratory Clinic 5 - Vascular Service Clinic Surgery 11 4 7
Dermatology Clinic - -
Endocrinology Clinic 1 - Immunology Clinic 11 11 -
Rheumatology Clinic 2 -
Tarps Clinic 1 -
Gynaecology Clinic Surgery 36 19 17
Paed ENTClinic Surgery 9 9 -
Paed Endocrinology Clinic - - Gen Paeds Clinic - -
Paed Gastroenterology Clinic - - Paed Immunology Clinic 7 7 -
Paed Infectious Diseases Clinic - - Paed Neurology Clinic 10 9 1 Paed Neuro services Clinic Surgery - - Paed Orthopaedics Clinic Surgery 32 9 23
Paed CTSU Surgery 7 7 -
Renal-Paed Clinic - - Paed Respiratory Clinic 4 3 1 Paed Rheumatology Clinic - - Paed Surgery Clinic Surgery 48 14 34
625 471 357
> 6 months
Service Timelines for Zero Patients
Waiting > 6 Months
Services Plan 2011/12
45

Interpretation Note – Wait time penalties
NHB has written to ADHB advising that from 1 July 2012 all patients are to be seen within 6 months and that the following estimated buffers will apply from 1 July 2012, clinics 40 patients and surgery 50 patients
The NHB current policy is that where a DHB is non-compliant (ie patients waiting > 6 months) on 3 consecutive months (or any 5 months in a year) the DHB will be penalised 1/12th of its additional elective revenue for each month of non-compliance with a minimum of 2 months.
ADHB’s annual additional elective revenue is approximately $24m per annum therefore a penalty of over $2m per month or minimum of $4m is at risk.
46

Surgical Wait List Distribution for the ADHB Population
< 1 1 2 3 4 5 6 7 8 9 10 11 12 > 12 Total
Total Waiting 1,123 655 274 225 216 110 97 74 32 28 20 20 12 67 2,953
Surgical Waiting Time DistributionFor Auckland DHB
As at 31 March 2012
0.0
200.0
400.0
600.0
800.0
1,000.0
1,200.0
< 1 1 2 3 4 5 6 7 8 9 10 11 12 > 12
Months Waiting
Total Waiting
A number of the cases waiting more than 12 months are for staged/planned surgery i.e. cases where surgery cannot be undertaken within 12 months because for example clearance from another medical specialty is required. Such cases are legitimate exclusions from Ministry reporting.
% of waiters by ethnic group (ADHB population)
% of waiters by ethnic group (ADHB population)
1 Month 2 Month 3 Month 4 Month 5 Month 6 Month > 6 Month
Maori 10% 9% 10% 8% 11% 10% 15% Pacific 12% 13% 11% 15% 11% 17% 16%
A number of those waiting > six months are for staged/planned procedures.
47

Outpatient Wait List Distribution for the ADHB Population
< 1 1 2 3 4 5 6 7 8 9 10 11 12 > 12 Total
FSAs Waiting 2057 1207 772 661 526 259 128 43 25 17 9 0 1 1 5706
Other Referrals 3565 1955 1246 817 672 464 323 213 112 113 64 28 31 168 9771
Total Waiting 5622 3162 2018 1478 1198 723 451 256 137 130 73 28 32 169 15477
Outpatient Waiting Time DistributionFor Auckland DHB
As at 31 March 2012
0
1000
2000
3000
4000
5000
6000
< 1 1 2 3 4 5 6 7 8 9 10 11 12 > 12
Months Waiting
Other ReferralsFSAs
% of waiters by ethnic group (ADHB population)
1 Month
2 Month
3 Month
4 Month
5 Month
6 Month
> 6 Month
Maori 7% 7% 7% 7% 8% 8% 8%
Pacific 12% 11% 12% 12% 12% 14% 16%
48

OR Performance Statistics
OR management maintain and report on a wide range of operational KPIs. Included among these is elective theatre utilisation. The benchmark figure for OR utilisation is 85%.
March 2012 utilisation:-
Mar Feb Jan Dec Nov
Level 4 (cardiac, ORL) 82% 82 % 84% 84% 82%
Level 8 (other adult) 87% 84% 82% 86% 87%
Level 9 (Women’s health) 75% 81% 79% 81% 83%
Starship 80% 80% 77% 77% 78%
Greenlane (day stay) 82% 84% 81% 83% 81%
The ongoing replacement of cancelled cases with other cases waiting surgery is evidenced by these utilisation rates
ADHB Elective Discharges
The table on the following page shows ADHB elective discharge versus the revised plan YTD April 27. Note: We expect this position to improve by up to 50 discharges as recoding is complete and the actual number of outflow (discharges done by other DHB’s for ADHB) are confirmed.
49

YTD Rev Plan
YTD YTD
Revised Rev Var
Cardiothoracic 120 5 Vascular Surgery 182 18 General Surgery 2,140 (55) Ophthalmology 1,678 (112) Orthopaedics 915 1 Paediatric Neurosurgery 24 4 Paediatric ORL 839 20 Paediatric Orthopaedics 146 24 Paediatric Surgery 271 16 Neurosurgery 88 (4) ORL 746 6 Urology 458 2
Gynaecology 1,192 39
8,799 (39) POP Flex 0 0 Discharges and outsource to
come - 0
Recodes 130 (119)
8,929 (158)
0 0
Outflows non-CMDHB 64 9
Outflows CMDHB
576 53
0 0
9,569 (95)
99%
Greenlane Surgical Unit Production
GSU elective discharge outputs (expressed as discharges per working day) were at a relatively low level in January but have ‘rebounded’ in March and are at the levels forecast in earlier HAC updates. This partly reflects very high ophthalmology volumes utilising out of hours time slots.
50

Elective Surgical Discharges per Working Day at Greenlane (All populations)
25
27
29
31
33
35
37
39
41
43
Jul-1
0
Aug-10
Sep-10
Oct-10
Nov-10
Dec-10
Jan-11
Feb-11
Mar-11
Apr-11
May-11
Jun-11
Jul-1
1
Aug-11
Sep-11
Oct-11
Nov-11
Dec-11
Jan-12
Feb-12
Mar-12
Apr-12
May-12
Jun-12
actual forecast
51

4. Productivity – Greg Balla
4.1 Improvement projects
In the Annual Plan ADHB has committed to 133 improvement activities.
54 of these are listed in Goal 2 “Performance Improvement”.
Overall progress for these 54 projects is good with 32 projects implementing solutions or monitoring the implemented solutions. This is what you should expect at this time of the year. A further 8 have finished and are delivering the anticipated benefits.
6 projects are running behind plan, including the Oracle FMIS system upgrade and the primary care initiative to reduce acute hospital admission.
See table next page for a summary of status (phase), on time, on budget and expected outcome performance.
52

The table below tracks the 2011/12 District annual plan improvement commitments. The table collates these commitments against the organisations three goals. Goal 2 is the focus for this report.
Group Pack Report Group/Committee: Board
Goal Level Summary DAP Projects - total projects: 133
Goal
Number Started Current Phase On Time On Budget
Expected Outcome
Finished
Post Implementation Benefits
Plan Do/
Check Act Cancelled Green Orange Red Green Orange Red Green Orange Red Green Orange Red Define Measure Analyse Improve Control
1 Lift the Health of the people in Auckland City
53 53 8 0 8 20 11 0 41 5 1 47 0 0 46 1 0 6 6 0 0
2 Performance improvement
54 54 6 3 5 22 10 0 40 6 0 44 2 0 42 4 0 8 8 0 0
3 Live within our means
26 26 2 1 4 6 8 0 19 2 0 16 4 1 18 3 0 5 4 1 0
Total # 133 133 16 4 17 48 29 0 100 13 1 107 6 1 106 8 0 19 18 1 0
Total % 100% 100% 12% 3% 13% 36% 22% 0% 75% 10% 1% 80% 5% 1% 80% 6% 0% 14% 14% 1% 0%
53

4.2 Savings schedule progress
Category Gains February Gains Year to date $000 $000 Direct treatment costs 368 4,890 FTE Productivity 2,854 14,566 Indirect treatment costs 721 5,342 Total gains achieved 3,943 24,798 Direct Treatment Costs ($ 4,890 Year to Date) The main contributors to Direct Treatment Savings YTD are Procurement savings locked in by ADHB Materials Management effective this financial year of $1,899 and reduction in blood usage through a reduction in unnecessary usage of blood of $1,964. FTE Productivity ($14,566 Year to Date) The major contributor to this is the Releasing Time to Care Programme which was operating in 35 wards to December increasing to 37 in January and is achieving an additional 5% direct patient contact time for on average 33 nurses a ward $3,193. Reducing length of stay has contributed to a better patient experience and saved bed days valued at $2,785. Daily Rapid Rounds in Orthopaedics and improved patient flow in Starship also contributed $1,426 and $1,177 from improved management of patients. Indirect Treatment Costs ($5,342 Year to Date) Improved contract pricing from the ex ADHB Materials Management is now reported as savings attributed to Health Benefits but the benefit is a saving to ADHB. Year to date this amounts to $4,755
54

5. Financial Performance – Brent Wiseman
5.1 Overview
The provider arm was unfavourable to the revised budget for the month by $(5.1) M. YTD is $(17.4) M unfavourable.
Actual Month
Variance Month
Actual YTD
Variance YTD
$k $k $k $k
Income 107,724 1,073 F 897,248 (7,006) U
Operating Expenditure 102,335 (6,168) U 849,693 (11,480) U
Operating Surplus/(Deficit) 5,389 (5,095) U 47,555 (18,487) U
Non-Operating Expenditure 7,871 (31) U 68,769 1,042 F
Total Surplus / (Deficit) (2,481) (5,126) U (21,214) (17,445) U
5.2 Revenue
Category Variance Month
Variance YTD
Explanation of major Items (YTD)
$M $M MOH - Base Funding 2.0 (3.0) Unfavourable IDF revenue $(3.6)m and
favourable population-based revenue $0.6m
Funding Subcontract Revenue
0.1 (0.5) Lower than expected Public Health side-contract revenue $(0.6)m
Other Patient Care Revenue
(.2) (2.1) Unfavourable non-NZ resident revenue $(2.8)m and lower ACC revenue $(1.3)m. Higher Inter-provider Revenue $1.4mil and Other Government Revenue $0.6m
Sales of Service and Product
(0.1) (0.2) ADHB Trust receipts, research income and accommodation rental all reported favourable income which is offset by lower Lab and Blood revenue
55

Clinical Education & Training
0.3 0.6 Higher than expected number of clinical trainees
Financial Income (0.7) (0.5) Loss on mark to market valuation of interest rate swaps
Trust & Donation Income
0.0 (0.6) Arises from lower receipts of Starship Foundation donations.
Other Income (0.4) (0.7) Lower than expected clinical and non-clinical miscellaneous revenue
1.1 (7.0)
56

5.3 Workforce
The tables below analyses the FTE numbers and variance both in numbers and value for the month and year to date.
Employee Group
Actual FTE
Month
Variance FTE
Month Variance
Month
Actual FTE YTD
Variance FTE YTD
Variance YTD
# # $k # # $k
Medical 1,233 (12) U (4,026) U 1,200 13 F (3,832) U
Nursing 3,363 (58) U (191) U 3,332 7 F (1,947) U
Technical 1,828 5 F (245) U 1,797 48 F 1,366 F
Hotel Services 226 1 F (26) U 229 (3) U (452) U
Administration 1,165 52 F (2) U 1,157 54 F 1,343 F
Other 1 1 F 2 F 1 0 F 9 F
Total (excl Outsourced Staff) 7,816 (12) U (4,487) U 7,717 120 F (3,514) U
Outsourced staff 97 (57) U (365) U 87 (47) U (2,838) U
Total (incl Outsourced Staff) 7,912 (69) U (4,852) U 7,804 73 F (6,352) U
Other Staff Related Costs (819) U (1,770) U
Total Employee Costs 7,912 (69) U (5,671) U 7,804 73 F (8,122) U
Employee Group
Actual FTE
Month
Variance FTE
Month Variance
Month
Actual FTE YTD
Variance FTE YTD
Variance YTD
# # $k # # $k
Operational 6,375 (74) U (5,255) U 6,298 30 F (10,664) U
Mental Health 741 (10) U (361) U 724 12 F 219 F
Ancillary Services 797 15 F (54) U 781 31 F 2,322 F
Total Employee Costs 7,912 (69) U (5,671) U 7,804 73 F (8,122) U
57

FTE
March FTEs are 69 above budget and 5 higher than February. This is primarily due to the increase in Nursing FTE explained below.
By category, Medical and Nursing FTE are above budget, with these variances partially offset by Technical, Hotel Services and Administration FTE which are below budget.
Employee Costs
The financial variance for the month of March $5.7m U is explained below:
Medical $4,026 k U - Medical FTE are 12 U to budget. The unfavourable variance is primarily driven by the increase in the provision for SMO job sizing back pay $4,124 k U. Nursing $191 k U - Nursing FTE are 58 U to budget. The unfavourable variance is mainly in the Child Health HSG $228 k U and 53 FTE U. This is primarily due to the unachieved FTE savings target of 46 FTE as well as additional nursing FTE required in ICUs – PICU and NICU Technical $245 k U - Technical FTE are 5 FTE F to budget.
Administration $ on budget - FTE are 52 under budget with the use of temporary staff.
Outsourced Staff $365 k U - The key variances for the month are Medical contractors $158k U and Management & Admin contractors $164k U, primarily due to temporary staff across all HSGs Other Staff Related Costs $819 k U - The key variances for the month is due to an increase in CME $218 k U, RMO expenses $167 k U, timing of training costs $160k U and budget phasing of retirement grants & long service leave $144k U.
58

5.4 Clinical Services Outsourcing Costs
Outsourcing costs were $56k U for the month. YTD is $1,886 k U.
Outsourcing activity continues in order to achieve ADHB population elective discharge targets. The key areas of higher expenditure for the year to date against budget are in Cardiothoracic, Orthopaedics, General Surgery and Paediatric Surgery. The higher level of activity has enabled us to meet the Q1 and Q2 targets. The Q3 result was 94%, (176) short of the target, 99% year to date. The April month result has started strongly (111% at the time of writing).GMs have agreed a Provider wide plan with a number of initiatives to ensure we meet balance of year targets with a lower level of outsourcing than YTD. This is being worked through at a detailed level within the POP production plans
Specific commentary regarding the year to date areas of expenditure:
Cardiac HSG $ 1,215k F - outsourcing is driven by the requirement to reduce the waiting list to below 94. The service is also maximising the use of internal capacity by completing additional weekend work. The favourable variance relates to the lower than budgeted non resident income from Cardiac CPS and lower than anticipated outsourcing in January. Future months are expected to be closer to budget to help reduce the waiting list for cardiac bypasses.
Children’s HSG $1,950k U - this relates to procedures which were budgeted to be performed at GSU but because GSU is not ready these have had to be outsourced - partially offset by favourable variances in Perioperative services.
Adult HSG $414 k U - the variance primarily relates to Orthopaedics and General Surgery, and reflects the decision to bring forward elective surgery outsourcing to achieve Q1 and Q2 targets. Balance of year targets are being addressed through the Provider wide plan.
Biochemical Genetics $723 k U – greater volumes for Maternal Serum Screening contract - offset by additional MOH funding, bottom line neutral. Research $252 k U – the unfavourable variance is fully funded and is bottom line neutral.
59

5.5 Direct Treatment Costs
Direct treatment costs are unfavourable to budget at $766 k U for the month and $2,318k U YTD
Within this there are three key variances YTD, as follows:
Category Variance
YTD
($k) Explanation of major items YTD
Drugs 2,133 F Cancer & Blood HSG $1,675 k F - lower demand for Haemophilia blood products $1,088k F together with savings in Oncology and Haematology driven by lower chemotherapy volumes and lower cost of chemo production.
Perioperative Services $860k F - the favourable variances are across all major drug lines. Actual costs are 10% higher than last YTD reflecting increased activity. With GSU still to deliver in full, costs have not reached budget
Adult HSG - $447k F - key variance is for Renal Fluids $369k F reflecting lower peritoneal dialysis volumes – this is offset by higher clinical supplies costs as more patients are managed on haemodialysis.
Operations - $543 U - the unfavourable variance is due to budgeted savings in Pharmacy from the implementation of the in-house chemotherapy production unit – this is offset by favourable variances in Cancer & Blood and Children’s HSG.
Clinical Supplies
(4,733) U ORA $1951k U– Actual costs are 12% higher than last year reflecting increased activity and unachieved budget savings of $649k.
Cardiac $1301k U - Clinical supplies vary considerably with the type of patient treated in the service. The recent trend is for an increase in high cost patients. In March, this included a heart transplant, lung transplant and an increase in ECMO patients. In March clinical supplies were consequently $381k over budget. Operations & Clinical Support $584k U – predominantly in Radiology reflecting costs for complex interventional radiology patients – volumes are above budgeted level.
Complementary Services $584k U – Research and LabPlus national services – both fully funded
60

Category Variance
YTD
($k) Explanation of major items YTD
Patient Appliances
(232) U Key unfavourable variances as follows:
Children’s HSG $451k U – mainly due to Implants $435k U. Paediatric Surgical $191k U relates to elective surgery volumes. Paediatric Cardiac $207k U relates to change in accounting treatment for Melody valves from 1 July (cost now not on billed – collected via Wies) and increased activity with ICDs, Pacemakers and valves.
Adult $ 258 F - variance equates to 2.7% of total Patient Appliance costs for YTD and is predominantly due to elective surgical WIES slightly below plan YTD.
61

Appendix 1 Provider Operating Statement March 2012 and YTD
$k March YTD
Actual Budget Variance Actual Budget Variance
Income
ADHB Funder Sourced 93,973 91,955 2,018 F 778,781 781,805 (3,024) U
MoH Sourced (Incl CTA) 4,960 4,532 428 F 38,073 37,958 115 F
Other Income 7,603 8,275 (672) U 70,918 73,919 (3,001) U
Trust & Donation Income 342 319 23 F 2,412 3,051 (639) U
Financial Income 847 1,571 (724) U 7,064 7,521 (457) U
107,724 106,652 1,073 F 897,248 904,254 (7,006) U
Expenditure
Employee Costs 68,542 63,236 (5,306) U 552,678 547,395 (5,284) U
Outsourced Staff 4,065 3,700 (365) U 36,289 33,451 (2,838) U
Outsourced Clinical Services 3,285 3,229 (56) U 28,308 26,422 (1,886) U
Treatment Costs - Direct 17,659 16,892 (766) U 151,231 148,912 (2,318) U
Treatment Costs - Indirect 3,840 3,467 (373) U 31,839 31,393 (446) U
Other Costs 4,945 5,643 698 F 49,348 50,641 1,292 F
Total Operating Expenditure 102,335 96,167 (6,168) U 849,693 838,212 (11,480) U
Operating Contribution 5,389 10,485 (5,095) U 47,555 66,042 (18,487) U
Depreciation, Interest & Capital Charge 7,871 7,840 (31) U 68,769 69,810 1,042 F
Net Surplus / (Deficit) (2,481) 2,645 (5,126) U (21,214) (3,769) (17,445) U
62

HAC Exception Report March 2012
A22. Raw Average Length of Stay (days)
Services with significant length of stay reductions over the past three months are: Cardiology (0.6), Neurosurgery (2.3), Cardiothoracic (4.4), Urology (0.6) and Paediatric Cardiac (3.1).
Numbers in brackets are the length of stay reduction (in days) between January and March.
Significant means the length of stay reduction has produced beds day savings of 200 bed days or more.
B42. Mental Health Community New Referrals
The has been a slight increase in numbers as a result of the start up of the Assertive Community Outreach Service (ACOS) but even excluding those numbers (approx 60+) this has been the busiest referral month based on all community mental health services we have ever had. There is no specifically identifiable reason for this.
A22. Raw Average Length of Stay (days)
2.80
2.90
3.00
3.10
3.20
3.30
3.40
Mar
-10
May
-10
Jul-1
0
Sep-
10
Nov-
10
Jan-
11
Mar
-11
May
-11
Jul-1
1
Sep-
11
Nov-
11
Jan-
12
Mar
-12
B42. Mental Health Community New Referrals
700
800
900
1000
1100
1200
Mar
-10
May
-10
Jul-1
0
Sep-
10
Nov-
10
Jan-
11
Mar
-11
May
-11
Jul-1
1
Sep-
11
Nov-
11
Jan-
12
Mar
-12
63

64

5 .2 Hea l th Target Updates
65

66

5 .2 Hospi ta l Ad visor y Commit tee Heal th Target Updates The summary of our performance against the Health targets is set out below.
3 of the targets have been met for March.
Acute flow (6hr ED target) continues to perform well although we still experience too much variation in the daily results especially in Children’s. We continue to implement improvements however this requires daily discipline to continue to perform at or above target.
Better help for smokers to quit is now on track to deliver with increased focus and resolution of data collection issues.
Status Comment
Adult and Child acute patient flow
95% achieved for March. Adults 95% and Children’s 92%. Qtr Overall 95%
Improved access to elective surgery
99%YTD end March.
Shorter waits for radiation therapy
100% for March. 100% for Qtr.
Better help for smokers to quit
March 95%. Qtr 89%.Target 95%.
Cardiac bypass surgery
108 patients were waiting at the end of February against a target of 94 reflecting a reduction from the 112 last month.
Key to symbols
Proceeding to plan
Issues being addressed
Target unlikely to be met
67

Project: Primary Objective: That at least 95% of patients will be admitted, discharged or transferred from Auckland Emergency Departments within 6 hours
Date of Delivery: 30 June 2012
Project Risks / Comments:ADHB achieved 95% of patients admitted, discharged or transferred within six hours for the quarter ending 31 March 2012. March and quarter result impacted by refurbishment in wards in Starship limiting some access to inpatient beds and higher admissions from CED. Team work between CED and AED lifted quarter performance in last weeks of March.
Acute Patient Flow, Actual vs Target, July 2010 - June 2012
0%
20%
40%
60%
80%
100%Ju
l-201
0Au
g-20
10
Sep-
2010
Oct
-201
0N
ov-2
010
Dec
-201
0
Jan-
2011
Feb-
2011
Mar
-201
1Ap
r-20
11
May
-201
1Ju
n-20
11Ju
l-201
1Au
g-20
11
Sep-
2011
Oct
-201
1N
ov-2
011
Dec
-201
1
Jan-
2012
Feb-
2012
Mar
-201
2Ap
r-20
12
May
-201
2Ju
n-20
12
Actual Goal MOH Target
68

Project: Adult Acute Patient FlowPrimary Objective: That at least 95% of patients will be admitted, discharged or transferred from Auckland Adult Emergency Department within 6 hoursDate of Delivery: 30 June 2012Clinical Leads: Nurse Director Margaret Dotchin , Dr Tim ParkeProject Sponsor: Nurse Director Margaret DotchinSteering Group: Nurse Director Margaret Dotchin, General Manager Ngaire Buchanan,Dr Tim Parke, Dr Art Nahill, Dr Wayne Jones, Dr Andrew Old
Improvements to date:Streamlined AED processes and measurement and manage the challenge of growing demandReviewed Medical / Nursing requirements for AED and approved business case for resource increase to match increased workload.Charge nurse patient flow coordinator introducedImproved access to Radiology Streamlined documentation required for safe transfer Improved triage processes.Managing bed block with additional resources58 Additional beds opened 2009-2010 Winter Ward 31 General Medicine 10 additional beds August – October 2010Managing bed block & reducing the time patients wait through improved processes and teamworkDaily Rapid Rounds introduced in General Medicine (Feb 2010) and Orthopaedics (July 2010)Nurse Facilitated Discharging in General Medicine (April 2010)Improved Bed Management Communication via Estimated Discharge Dates, CMS upgrades, improved visual management, more efficient bed management meetings, earlier time of day discharging.Daily breech review meetings to understand root causes and implement short term solutions.Immediate actions to improve performance:1. Increased engagement of Senior Leadership Team to support improvement
activities and reduce road blocks to improvement.Increase communication and engagement of Clinical Directors, SMO’s, RMO’s Increase communication and engagement of Charge Nurses and RN’s after hours to further reduce wait times for patient transfer from Emergency DepartmentEngage with SMO’s, RMO’s and nurses one to one, by CD, Nurse Advisor or Level 2 clinical leader where resistance to required behaviour is demonstrated.Valuing patient time poster campaign
2. Establish ED short stay unitImplement APU flex beds Improve measurement of Ready to Go patients in EDComplete recruitment of remaining ED resource to improve weekend coverageSupport General Medicine by diversion of patients to subspecialtiesImplement general surgery acute flow team initiatives to improve response timeCMO to attend Orthopaedic SMO meeting to increase engagement.Relocate bed manager to ED after hours Implement ED discharge nurse on weekendHands on support of ED flow Charge Nurse to reduce roadblocks to timely review and transfer of patientsCommence physiotherapy facilitated discharge in Orthopaedics.Establish discharge co-ordination responsibility in Gen Med ward nursing team.Further increase timely overnight transfers from ED to inpatient wards once bed allocated.
3. Five day rapid improvement event planned for April to focus on improvement of process from decision to admit to patient transfer complete.Improve elective scheduling.
Project Risks / Comments:95% of patients admitted, discharged or transferred from Adult Emergency Department within six hours in March
Variation in daily performance continues to be of concern.
Measures underway to address this include:Whole hospital escalation plan and triggers finalised. Discussing with ED team how this can be incorporated into real time management and how visual electronic status updates to department and Bed / Duty Managers can be used to respond to constraints.Embedding Gen med redesign with new rosters and ways of working.Daily capacity report including next 24 hours expected discharges and admissions automated.Bed capacity forecasting near completion to inform seasonal planning and further improve daily acute and elective flow management.Auditing of improved processes e.g. daily breach review, daily rapid rounds, bed management processes to ensure we have sustained new ways of working.
Adult Acute Patient Flow, Actual vs Target, July 2010 - June 2012
0%
20%
40%
60%
80%
100%
Jul-2
010
Aug-
2010
Sep-
2010
Oct
-201
0N
ov-2
010
Dec
-201
0Ja
n-20
11Fe
b-20
11M
ar-2
011
Apr-
2011
May
-201
1Ju
n-20
11Ju
l-201
1Au
g-20
11Se
p-20
11
Oct
-201
1N
ov-2
011
Dec
-201
1Ja
n-20
12Fe
b-20
12M
ar-2
012
Apr-
2012
May
-201
2Ju
n-20
12Actual Goal MOH Target
1
23
69

Project: Children’s Acute Patient FlowPrimary Objective: That at least 95% of patients will be admitted, discharged or transferred from Auckland Children’s EmergencyDepartment within 6 hoursDate of Delivery: 30 June 2012Clinical Lead: Richard AickinProject Sponsor: Ngaire BuchananSteering Group: Ngaire Buchanan, Richard Aickin, Michael Shepherd, Janet Campbell, Stuart Dalziel
Improvements to date:Estimate Discharge Date (EDD’s) for current inpatientImprovement in the forecasting of occupancyChanges to the call back registrar guidelinesImprovements to capacity planning Bed turnaround time Moved ward reviews to outpatient area to free bed spacesCohorted patients with low complexity and reduced staffing
for this group, freeing staff for other areasRostered more senior staff onto periods of high admissions,
to improve decision-making speed
Immediate Actions to Lift Performance
Continue to progress the specific project we are operating on the 2 hour component
Raise visibility of performance by providing reports by specialty
Chief Resident to attend the Children’s daily review meeting.
Planning a rapid improvement event focusing on further improving the 1 hour transfer from CED to ward time –May 22-24 2012
Longer term projectsStarship Capacity Planning Project
Project Risks /Comments:
92% of children who presented to Children’s Emergency were discharged or transferred to a ward within the 6 hour period. This is decrease of 1% on February’s results and a slightly worse performance than March last year. Compared with the same period last year, CED presentations were a little lower but admissions from CED were 10% higher. Some beds continued to be unavailable during refurbishment in early March, although side rooms on Level 5 were re-opened ahead of schedule.
The performance for the quarter was 93.4%, which was 3% higher than last year. Some short term fixes were applied at the end of March but were too late to lift overall quarter performance. By the end of February, Starship could only have achieved the target if it achieved 97% every single day of March. Going forward, any day with more than 3 breeches of the six hour target puts Starship at risk of failing to meet the 95% target for the coming quarter.
Reduced staffing of the project may slow progress on new initiatives but progress to date will be maintained.
Children's Acute Patient Flow, Actual vs Target, July 2010 - June 2012
0%
20%
40%
60%
80%
100%
Jul-2
010
Aug-
2010
Sep-
2010
Oct
-201
0N
ov-2
010
Dec
-201
0
Jan-
2011
Feb-
2011
Mar
-201
1Ap
r-20
11M
ay-2
011
Jun-
2011
Jul-2
011
Aug-
2011
Sep-
2011
Oct
-201
1N
ov-2
011
Dec
-201
1
Jan-
2012
Feb-
2012
Mar
-201
2Ap
r-20
12M
ay-2
012
Jun-
2012
Actual Goal MOH Target
70

Project: Improved access to elective surgeryPrimary Objective: Increase ADHB Elective Surgical Discharges from 11,149 to 11,950Date of Delivery: 30 June 2012Clinical Lead: Vanessa Beavis, Ian CivilProject Sponsor: Peter LowrySteering Group: Ngaire Buchanan, Dr Vanessa Beavis, Margaret Dotchin, Fionnagh Dougan, Ian Civil.
Risks / Comments: (Amber)
Year to March is 99% of target.The recover plan actions are on track and delivering to plan. This includes additional outsourcing and weekend lists.
Planned activities:
1. Maintaining the increased level of in-house and outsource activity including new GSC capacity
2. Continuing to review the production plan at a daily and weekly level.
3. Resource and execute recovery plan.
ADHB Elective Discharges
97%96%
102%101%
100% 100%99% 99%
98%
-
2,000
4,000
6,000
8,000
10,000
12,000
14,000
July August September October November December January February March April May June
Dis
char
ges
80%
85%
90%
95%
100%
105%
110%
% o
f Hea
lth ta
rget
YTD
cum actual cum % cum plan
second highest number of outsource ADHB discharges ever in a single month
71
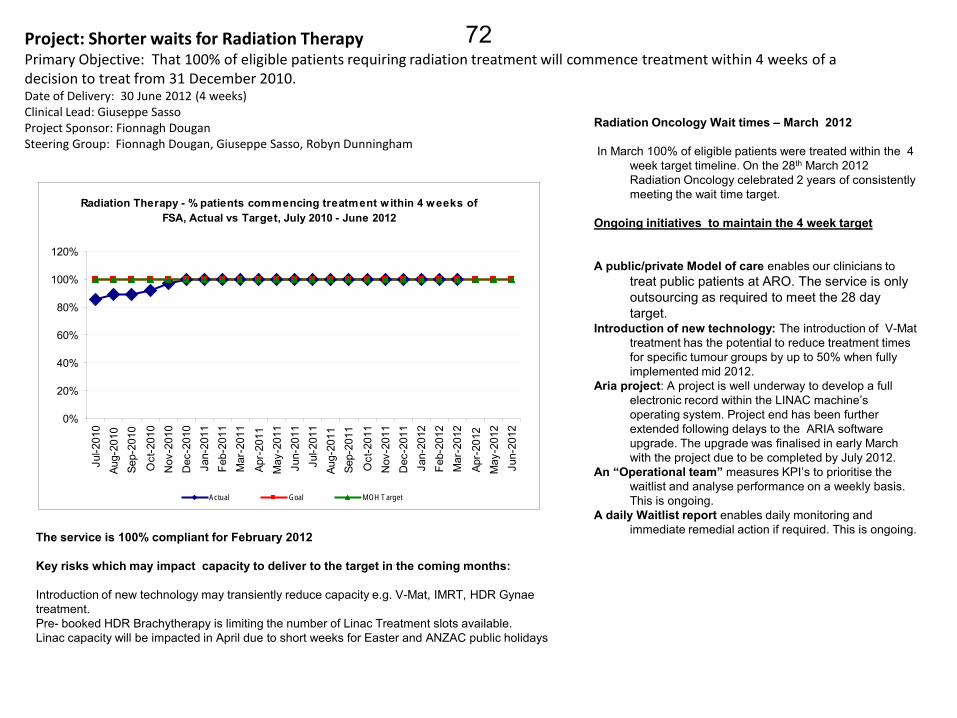
Project: Shorter waits for Radiation TherapyPrimary Objective: That 100% of eligible patients requiring radiation treatment will commence treatment within 4 weeks of a decision to treat from 31 December 2010. Date of Delivery: 30 June 2012 (4 weeks)Clinical Lead: Giuseppe SassoProject Sponsor: Fionnagh DouganSteering Group: Fionnagh Dougan, Giuseppe Sasso, Robyn Dunningham
Radiation Oncology Wait times – March 2012
In March 100% of eligible patients were treated within the 4 week target timeline. On the 28th March 2012 Radiation Oncology celebrated 2 years of consistently meeting the wait time target.
Ongoing initiatives to maintain the 4 week target
A public/private Model of care enables our clinicians to treat public patients at ARO. The service is only outsourcing as required to meet the 28 day target.
Introduction of new technology: The introduction of V-Mat treatment has the potential to reduce treatment times for specific tumour groups by up to 50% when fullyimplemented mid 2012.
Aria project: A project is well underway to develop a full electronic record within the LINAC machine’s operating system. Project end has been further extended following delays to the ARIA software upgrade. The upgrade was finalised in early March with the project due to be completed by July 2012.
An “Operational team” measures KPI’s to prioritise the waitlist and analyse performance on a weekly basis. This is ongoing.
A daily Waitlist report enables daily monitoring and immediate remedial action if required. This is ongoing.The service is 100% compliant for February 2012
Key risks which may impact capacity to deliver to the target in the coming months:
Introduction of new technology may transiently reduce capacity e.g. V-Mat, IMRT, HDR Gynae treatment.Pre- booked HDR Brachytherapy is limiting the number of Linac Treatment slots available.Linac capacity will be impacted in April due to short weeks for Easter and ANZAC public holidays
Radiation Therapy - % patients commencing treatment w ithin 4 weeks of FSA, Actual vs Target, July 2010 - June 2012
0%
20%
40%
60%
80%
100%
120%
Jul-2
010
Aug-
2010
Sep-
2010
Oct
-201
0N
ov-2
010
Dec
-201
0Ja
n-20
11Fe
b-20
11M
ar-2
011
Apr-
2011
May
-201
1Ju
n-20
11Ju
l-201
1Au
g-20
11Se
p-20
11
Oct
-201
1N
ov-2
011
Dec
-201
1Ja
n-20
12Fe
b-20
12M
ar-2
012
Apr-
2012
May
-201
2Ju
n-20
12Actual Goal MOH Target
72

Achievements in October:• Greenlane Surgical Centre recording of ABC on day of surgery
implemented and being monitored weekly• To remove the" not asked/ documented” option from the the
Electronic Discharge Summary• Quit Banner set up at Level four entranceImmediate Actions to improve performance A. Focus on short stay/high volume areas to achieve • AED and APU continue to monitor and maintain performance B. Improve engagement of clinical workforce to achieve • Reports on events discharged and coded in the month to be
available for services and reported weekly to OMM and Board• To work with Registrars to determine barriers and support
mechanisms to assist junior doctors complete the ABC in clinical documents and EDS
C. Data collection systems and processes to achieve• Smoking and Brief advice column to be added to Ward electronic
whiteboards to monitor the ABC completion• Investigation of generation of a Brief Advice Brochure with the EDS
for AED• Research – ADHB joining 6 other DHBs is participating in a ABC
Outcomes survey funded by the MOH to measure the outcomes of Brief Advice given in hospitals- Final results out in June
• Final coding decision in contradictory cases to be based on Discharge Letter smoking status and brief advice
D. Communications – planned activities• An NRT working Group as been established to develop an NRT
promotion campaign to all clinical staff
CommentsResult: Of the 8949 events coded in March 1253 were identified as smokers 1166 or 93% of all smokers were given brief advice to stop smoking. Results in the 90% by APU and AED which have contributed to the overall ADHB rate rising.This result includes recoded events however we will have the ability to exclude these events after April. A new set of reports has been produced based on events that are discharged in a month and coded in the month to date. These go to the board each Monday. For events discharged and coded in March the result was 95%. The coding team continues daily data quality audits to check coding of smokers with no brief advice. The small number of underperforming wards are reviewing their processes and reporting back to the Smokefree Services team with their strategies to meet the target.An improvement specialist has been engaged to analyse the recording and reporting process.
Project: Better help for smokers to quitObjective : 95% of hospitalised smokers provided advice and help to quit by 1/07/2012Clinical Lead: Stephen Child Programme Sponsor: Margaret Dotchin Programme Manager: Jan Marshall Steering Group: Di Roud, Anna Schofield, Maggie O’Brien, Stephen Child, George Laking, Jim Kriechbaum, Paul Bohmer, Arun Kulkarni, Michelle Stevens, Kristine Nicol, Bernadette Rehman, Paul Birch, Anne-Marie Pickering, Michael Haw, Jan Marshall, Kara Hamilton, Steven Stewart
Better help for smokers -% of hospitalised smokers provided advice and help to quit, Actual vs Target, Jan 2011-Jun 2012 and % of Maori
hospitalized smokers offered advice and support to quit
0%10%20%30%40%50%60%70%80%90%
100%
Jan-
2011
Feb-
2011
Mar
-201
1
Apr-
2011
May
-201
1
Jun-
2011
Jul-2
011
Aug-
2011
Sep-
2011
Oct
-201
1
Nov
-201
1
Dec
-201
1
Jan-
2012
Feb-
2012
Mar
-201
2
Apr-
2012
May
-201
2
Jun-
2012
Actual Goal MOH Target Actual - Maori
73

Project: Cardiac Bypass SurgeryPrimary Objectives: To enable timely access to cardiac bypass surgery the waiting list should be no greater than 94.
To support the national cardiac bypass intervention target, 940 bypasses should be completed in 2011/2012Date of Delivery: 30 June 2012Clinical Lead: Peter RuygrokProject Sponsor: Peter LowrySteering Group: Paget Milsom, Andrew McKee, Peter Ruygrok, Elizabeth Shaw, Pam Freeman
Completed Improvement Activities: Developed and implemented electronic scheduling system Initiated pre-admit process Developed detailed operational reporting Set up development production process Approved business case for CVICU bed capacity Built capacity planning model for CVICU and Ward 42 Developed patient load planning tool Initiated daily bed management meeting Enhanced recovery pathway in ICU Scheduling workshop for productive theatres Releasing time to care foundation modules CVICU\HDU merger ICU Nursing FTE business case approved Rapid Rounds ward 42
Further improvements in progress:. 3 in a row bypass (productive list)
Optimise the theatre schedule by planning a “productive list” ECMO – Resource planning process
To improve resource planning and day to day processes to reduce the impact of high ECMO demand on bypass cases
The Productive Operating Room (NHS Programme)To increase productivity and improve safety in theatre through
better co-ordination and removal of waste and frustrations
Delay to discharge – ward 42To reduce LOS for patients who are delayed during the discharge
process, reducing theatre cancellations Delay to discharge CVICU
To reduce LOS for patients who are delayed during the discharge process, reducing theatre cancellations
• Elective patient focused team projectTo maintain elective throughput in the service during periods of
constrained production• Weekend contract case certainty• Increasing capacity\delivery project
Monthly Performance
During March the eligible bypass group on the wait list decreased by 4 patients. The referral rate has increased in March with 101 referrals received against a planned inflow of 90. March contained the highest volume of elective referrals we have seen since August last year and it will be interesting to see what happens in April in terms of this trend. The service delivered 95 eligible procedures against a plan of 105 during March. ICU capacity block caused 10 eligible cases to be cancelled within the month. Another 4 cases were lost to transplant procedures . Mercy was able to complete 17 eligible cases across the 4 weeks in March. A further 5 cases were completed in Dunedin and although these have not been counted in our volumes at this stage, have assisted in limiting wait list growth and reducing wait times for the patients who remain on the list. The service is now 14 patients behind our 940 patient contract with the MoH (excluding the Dunedin volumes). We are aiming for a lift in production and increased use of external facilities to meet our contract target.
Our plan to open the 4th theatre for an average of 3 extra cases a week has been impacted by staff resignations and recruitment delays. We have finalised a contract with an additional cardiac surgeon but they are unable to start until December. We plan to appoint a surgical Locum in the interim. Whilst we try to resolve the FTE gaps the service is scheduling the 4th theatre whenever that is possible and is making use of bureau nursing and ORL theatre staff to deliver to plan
Reduce Cardiac Waiting List, Actual vs Target, Jan 2010 - Jun 2012
0
20
40
60
80
100
120
140
160
Jan-
2010
Feb-
2010
Mar
-201
0Ap
r-20
10M
ay-2
010
Jun-
2010
Jul-2
010
Aug-
2010
Sep-
2010
Oct
-201
0N
ov-2
010
Dec
-201
0Ja
n-20
11Fe
b-20
11M
ar-2
011
Apr-
2011
May
-201
1Ju
n-20
11Ju
l-201
1Au
g-20
11Se
p-20
11O
ct-2
011
Nov
-201
1D
ec-2
011
Jan-
2012
Feb-
2012
Mar
-201
2Ap
r-20
12M
ay-2
012
Jun-
2012
Actual Goal MOH Target
74

6
GENERAL BUSINESS
75

76

7
RESOLUTION TO EXCLUDE THE PUBLIC FROM A MEETING OF THE HOSPITAL
ADVISOR MEETING
7.1 Resolution to exclude the public
77

78

7 .1 Resolut ion to exc lude the publ ic
79

80

AUCKLAND DISTRICT HEALTH BOARD
RESOLUTION TO EXCLUDE THE PUBLIC
FROM A MEETING OF THE HOSPITAL ADVISORY MEETING
Clauses 32 and 33, Schedule 3, New Zealand Public Health and Disability Act 2000 (“Act”)
That the exclusion of the public from the relevant part of the meeting is necessary to enable the Board to deliberate in private on a decision or recommendation as to whether any of the grounds in paragraphs (a) to (d) of clause 32 of Schedule 3 of the Act are established in relation to all or any part of the meeting.
7. THAT the public be excluded from the following part of the proceedings of this meeting, namely consideration of items 7 to of the Agenda.
The general subject of the matters to be considered while the public is excluded, the reason for passing this resolution in relation to each matter, and the specific grounds under the above clause for the passing of this resolution are as follows: General subject of each matter to be considered:
Reason for passing this resolution in relation to each matter:
Ground(s) under clause 34 for the passing of this resolution:
7.1 Confidential HAC Minutes
28 March 2012 7.2 Risk 7.3 Quality
To enable the Board to carry on without prejudice or disadvantage commercial activities and negotiations: Official Information Act 1982 s.9(2)(i) and s.9(2)(j)
That the public conduct of the relevant part of the meeting would be likely to result in the disclosure of information for which good reason for withholding would exist under s 9 of the Official Information Act 1982.

Hospital Advisory Committee
A g e n d aMEETING DETAILS
Time and Date 9:30am – 12:30pm. Wednesday 9 May 2012
Venue A+ Trust Room, Level 5, Clinical Education Centre, Auckland City Hospital
Members Judith Bassett (Chair), Jo Agnew, Peter Aitken, Susan Buckland, Rob Cooper, Dr Chris Chambers, Dr Lester Levy, Dr Lee Mathias, Robyn Northey, Gwen Tepania-Palmer, Ian Ward, Assoc Prof Anne Kolbe.
Apologies
In Attendance Ngaire Buchanan, Dr Margaret Wilsher, Brent Wiseman, Greg Balla, Ian Bell.
COMMITTEE FUNCTIONS
To monitor the financial and operational performance of the hospitals and related services of the DHB, assess strategic issues relating to the provision of hospital services by or through the DHB and give the Board advice and recommendations on that monitoring and that assessment.
Item Page No
1
2m to 9:32am
Attendance and Apologies 001
2
3m to 9:35am
Conflicts of Interest 003
3
5m to 9:40am
Confirmation of Minutes Wednesday 28 March 2012 013
4
5m to 9:45am
Action Points Wednesday 28 March 2012 021
5
40m 15m to 10:40am
Provider Operational Performance Report
5.1 Operational Performance Report 5.2 Health Target Updates
025
027 065
6
5m to 10:45am
General Business 075
7
20m to 11:05am
Resolution to exclude the public from a meeting of the Hospital Advisory Meeting
7.1 Resolution to exclude the public
077
NEXT MEETING
Time and Date: 9.30am, Wednesday, 20 June 2012
Venue: Marion Davis Library, Building 43, Auckland City Hospital
Hospital Advisory Committee Agenda – Wednesday 9 May 2012
Healthy Communities, Quality Healthcare
Page 1