nz food nz children - ministry of health nz · iv nz food nz children it is clear that while the...
TRANSCRIPT
NZ Food NZ Children Key results of the 2002 National
Children’s Nutrition Survey
Winsome Parnell Robert Scragg Noela Wilson David Schaaf
Eljon Fitzgerald
Cover artwork by: Jessica Kerr, aged 11 years Hamish Ford aged 12 years
Ngawai Edwards, aged 11 years All from Room 2, Raroa Normal Intermediate School, Wellington
Suggested citation: Ministry of Health. 2003. of the 2002 National Children’s Nutrition Survey. Wellington: Ministry of Health.
Published in November 2003 by the Ministry of Health PO Box 5013, Wellington, New Zealand
ISBN 0-478-25842-9 (Book) ISBN 0-478-25843-7 (Internet)
HP 3648
This document is available on the Ministry of Health’s website: http://www.moh.govt.nz
NZ Food NZ Children: Key results
NZ Food NZ Children iii
Foreword The findings of the first national survey of the nutritional status of New Zealand children aged 5–14 years have been eagerly awaited. The results presented in this report provide both reassurances as well as challenges for parents, healthcare professionals, teachers, school boards of trustees, and those responsible for health, education and social policy planning. There is good news. Intakes of most nutrients are adequate and iron deficiency and iron deficiency anaemia are relatively infrequent among New Zealand children except for girls aged 11–14 years, notably among Mäori and Pacific. Of particular interest is the fact that nutritional status of the youngest children (5–6-year-olds) is appreciably better than that of the older children. Their nutrient intakes are better as the result of healthier food choices, and they are more likely to have appropriate body size. They are also the most active group of children. The data suggest that while their food intake is controlled by parents (more is home sourced) the situation is appreciably more satisfactory than when exposed to an environment often characterised by a wider range of food choices, peer pressure and advertising. Clearly the challenge is to find ways of continuing the more appropriate earlier practices. The results relating to overweight and obesity will not come as a surprise. We all know that overweight and obesity and their consequences constitute a constellation of epidemic diseases of the 21st century. There are no directly comparable data from other countries but the fact that about one-fifth and one-tenth of 5–14-year-olds are overweight and obese respectively is of concern. A particular worry is the disparity here with regard to Mäori and Pacific children who have appreciably higher rates than New Zealand European and Other children. It is clearly an urgent public health requirement to find ways to increase physical activity and to decrease intake of energy dense foods (particularly those containing saturated fats and sugars such as hot chips and sweet drinks) without compromising intake of essential nutrients. There has recently been a suggestion that iodine intakes among some New Zealand children may be inadequate. This survey provides firm confirmation that this is indeed the case. Once again public health measures will be required to ensure adequate intakes since a wide range of health consequences may result from low intakes in childhood. For the present, while noting that high intakes of salt are undesirable, it is important to ensure that salt when used should be iodised. Another research question that arises relates to the potential consequences of the apparently low calcium intake among Pacific children. Is there any evidence that such intakes lead to reduced bone density in later life?
iv NZ Food NZ Children
It is clear that while the report raises some issues requiring immediate action and further research, there is a host of further questions to be asked of the data in terms of explaining some of the findings. The calibre of the research underpinning the report is outstanding. It is not an easy task to undertake a nationwide survey of this kind. The research team is to be congratulated and thanked for generating results that will help to shape public policy and confirm the ability of New Zealand to undertake world-class research of its kind.
Hon Annette King Jim Mann Minister of Health Chairman CNSTAC
NZ Food NZ Children v
Acknowledgements The 2002 National Children’s Nutrition Survey was funded by the Ministry of Health and conducted by the University of Auckland, Massey University (Palmerston North) and the University of Otago. James Chal with support from Persees Antia of Auckland UniServices Limited managed the contract on behalf of the three institutions. The key researchers involved in this work were Noela Wilson, Robert Scragg, Eljon Fitzgerald, David Schaaf and Winsome Parnell. The valuable assistance of the Kaitiaki and Pacific Nutrition Groups is gratefully acknowledged, as is the input from the Ministry of Health and the Ministry’s Children’s Nutrition Survey Technical Advisory Committee (CNSTAC). This survey would not have been completed without the dedication of numerous individuals. These individuals included members of the Advisory Board, responsible for the governance of the survey, the regional supervisors and field staff who collected the data and the project office staff who checked and analysed data. On technical matters, acknowledgement is due the Departments of Human Nutrition and Biochemistry (University of Otago) for advice and technical expertise; to Crop & Food Research Ltd, Palmerston North for assistance with nutrient matching; and to Mary-Louise Hannah, Ministry of Health for her expert advice. The contribution of the individuals who worked on the pilot study for this survey is also acknowledged with thanks. The Manufactured Food Database of Auckland District Health Board is thanked for their assistance. Special thanks are due to Dr Peter Gootjes, Southern Community Laboratories and Dr Patrick Parsons, Wadsworth Institute, New York for their assistance with blood analyses; and Emeritus Professor David Russell for editing this report. The CNS was managed in the Ministry of Health by Anne Duncan. This report was managed through the publication process by Kerris Paterson and Anne Masoe of the Compass Group. The support of Principals, Boards of Trustees and the staff of the 172 schools who participated in this survey is acknowledged with grateful appreciation. However, our most important acknowledgement is reserved for the 3275 New Zealand children and families who permitted their children to participate and allowed us into their homes thus making the 2002 Children’s Nutrition Survey possible.
Authors The authors of this report were Winsome Parnell, University of Otago; Associate Professor Robert Scragg, University of Auckland; Dr Noela Wilson, University of Otago; David Schaaf, University of Auckland; Eljon Fitzgerald, Massey University, Palmerston North.
vi NZ Food NZ Children
Authorship of individual sections was as follows:
• Section A: Winsome Parnell; Claire Smith, University of Otago; Christine Cleghorn, University of Otago.
• Section B: Winsome Parnell; Claire Smith; Christine Cleghorn.
• Section C: Robert Scragg; Sue Sharpe, University of Auckland; David Schaaf.
• Section D: Noela Wilson; Winsome Parnell.
• Section E: Noela Wilson, Robert Scragg; Eljon Fitzgerald; Cameron Grant, University of Auckland; Elaine Ferguson, University of Otago; Sheila Skeaff, University of Otago; Christine Thomson, University of Otago; Rosalind Gibson, University of Otago.
• Section F: Eljon Fitzgerald; Mason Durie, Massey University; Winsome Parnell.
• Section G: David Schaaf; Robert Scragg; Winsome Parnell.
• Section H: Winsome Parnell; Noela Wilson.
NZ Food NZ Children vii
Contents
Foreword iii
Acknowledgements v Authors v
Abbreviations xv
Participating Schools xvii
Executive Summary xx Introduction xx Main findings xx Energy and nutrients xxi Eating patterns and food choices xxii Activity patterns and health xxii
Introduction 1 Background 1 This report 1 Further information 2
A. Nutrients and Dietary Sources 3 Introduction 3 Key points 4 A1 Energy 8 A2 Protein 10 A3 Total fat 13 A4 Types of fat and cholesterol 16 A5 Total carbohydrate and starch 22 A6 Total sugars 25 A7 Dietary fibre 29 A8 Vitamin A 32 A9 Vitamin C 35 A10 Vitamin E 37 A11 B-vitamins 39 A12 Folate 42 A13 Calcium 45 A14 Phosphorus and magnesium 48 A15 Iron 50 A16 Zinc 53 A17 Potassium, manganese and copper 56 A18 Selenium 58 Tables for Section A 61
viii NZ Food NZ Children
B. Eating Patterns 96 Introduction 96 Key points 96 B1 Dietary choices 98 B2 Dietary supplement use 100 B3 School day food consumption patterns 102 B4 Food consumed at school 104 B5 Salt additions 107 B6 Household food security 109
C. Frequently Eaten Foods 122 Introduction 122 Key points 122 C1 Fruit 125 C2 Vegetables 127 C3 Meat, fish, poultry and eggs 129 C4 Mixed dishes and convenience meals/snacks 131 C5 Bread 133 C6 Breakfast cereal and rice 135 C7 Spreads, sauces 137 C8 Biscuits/cakes 138 C9 Snacks and sweets, and dairy (excluding milk) 140 C10 Milks 142 C11 Other drinks 144 C12 Fats put on cooked vegetables and fats used to cook meat, poultry or fish 146
D. Physical Activity 162 Introduction 162 Key points 162 D1 Physical inactivity 164 D2 Physical activity participation 166 D3 Physical activity time profile 168
E. Health 173 Introduction 173 Key points 173 E1 Dental health 175 E2 Body size 176 E3 Iron status 179 E4 Serum zinc, serum cholesterol and urinary iodine 180 E5 Menstruation 183
F. Mäori Issues 188
G. Pacific Issues 190
H. New Zealand European and Others Issues 191
NZ Food NZ Children ix
Appendix A: Survey Objectives 192Personnel 193
Appendix B: Methodology 197Sampling strategy 197
Sample size 197
Response rate 198
Ethical approval 198
Mäori 198
Pacific 199
Interviewing 200
Interviewing process 201
24-hour diet recall 202
Food security 211
Physical activity 214
Dental 215
Eating patterns 215
Food frequency questionnaire 215
Anthropometry 216
Blood 217
Definition of iron deficiency 217
Urine 219
Explanatory notes for tables 219
Appendix C: Additional Dietary Source Tables 224
Appendix D: Computer-based Questions 242
Appendix E: Food Frequency Questionnaire 258
References 259
x NZ Food NZ Children
List of Tables Table A1: Energy and protein 61 Table A2.1: Total fat and cholesterol 62 Table A2.2: Fatty acids I 63 Table A2.3: Fatty acids II 64 Table A3.1: Total carbohydrate and starch 65 Table A3.2: Total sugars I 66 Table A3.3: Total sugars II 67 Table A4: Dietary fibre 68 Table A5.1: Vitamin A 69 Table A5.2: Vitamins C and E 70 Table A6.1: B Vitamins I 71 Table A6.2: B Vitamins II 72 Table A7.1: Minerals I 73 Table A7.2: Minerals II 74 Table A7.3: Minerals III 75 Table A8: Energy sources1 76 Table A9: Protein sources1 77 Table A10: Total fat sources1 78 Table A11: Saturated fat sources1 79 Table A12: Polyunsaturated fat sources1 80 Table A13: Monounsaturated fat sources1 81 Table A14: Cholesterol sources1 82 Table A15: Total carbohydrate sources1 83 Table A16: Sucrose sources1 84 Table A17: Fructose sources1 85 Table A18: Dietary fibre sources1 86 Table A19: Retinol sources1 87 Table A20: β-carotene sources1 88
Table A21: Vitamin C sources1 89
Table A22: Vitamin E sources1 90
Table A23: Folate sources1 91
Table A24: Calcium sources1 92
Table A25: Iron sources1 93
Table A26: Zinc sources1 94
Table A27: Selenium sources1 95
Table B1: Dietary choices 116
Table B2: Dietary supplement use 117
Table B3: School day food consumption patterns 118
Table B4: Food consumed at school1 119
Table B5: Salt additions 120
Table B6: Household food security over the last year 121
Table C1: Fruit* 148
Table C2.1: Vegetables I* 149
Table C2.2: Vegetables II* 150
Table C3.1: Meat, fish, poultry and eggs I* 151
Table C3.2: Meat, fish, poultry and eggs II* 152
Table C4: Mixed dishes and convenience meals/snacks* 153
NZ Food NZ Children xi
Table C5: Breads* 154
Table C6: Breakfast cereal and rice* 155
Table C7: Spreads, sauces* 156
Table C8: Biscuits/cakes* 157
Table C9: Snacks and sweets, and dairy items (excluding milk)* 158
Table C10: Milk drinks* 159
Table C11: Other drinks* 160
Table C12: Type of fat added or used for cooking* 161
Table D1: Inactivity1 170
Table D2: Physical activity participation 171
Table D3: Physical activity time profile 172
Table E5.1: Age at onset of menstruation 183
Table E1: Dental 184
Table E2: Body size 185
Table E3: Blood measures of iron deficiency and anaemia 186
Table E4: Zinc, cholesterol and iodine 187
Table I: Proportion of interviews conducted each month (percent) 200
Table II: Proportion of interviews conducted on each day (percent) 201
Table III: Food groups 206
Table IV: Analytical techniques for nutrients* 207
Table V: Estimated average requirements (EAR) per day used in the probability analysis 213
Table VI: Number of children 222
Table VII: Effect of sample size on accuracy of estimated proportions1,4 223
Table I: Starch sources1 224
Table II: Total sugars sources1 225
Table III: Glucose sources1 226
Table IV: Lactose sources1 227
Table V: Maltose sources1 228
Table VI: Insoluble non-starch polysaccharides sources1 229
Table VII: Soluble non-starch polysaccharides sources1 230
Table VIII: Vitamin A sources1 231
Table IX: Thiamin sources1 232
Table X: Riboflavin sources1 233
Table Xl: Niacin equivalents sources1 234
Table XII: Vitamin B6 sources1 235
Table XIII: Vitamin B12 sources1 236
Table XIV: Phosphorus sources1 237
Table XV: Magnesium sources1 238
Table XVI: Potassium sources1 239
Table XVII: Manganese sources1 240
Table XVIII: Copper sources1 241
List of Figures Figure A-1: Median energy intake (age) 9 Figure A-2: Major sources of energy (males) 9 Figure A-3: Median protein intake 11 Figure A-4: Percent energy from protein 11 Figure A-5: Major sources of protein (females) 12
xii NZ Food NZ Children
Figure A-6: Protein from fish and seafood 12 Figure A-7: Percent energy from fat 14 Figure A-8: Meeting guidelines for fat intake 14 Figure A-9: Major sources of total fat (males) 15 Figure A-10: Proportion of total fat from milk 15 Figure A-11: Percent energy from SAFA 17 Figure A-12: Percent energy from SAFA, MUFA and PUFA (females) 17 Figure A-13: Major sources of MUFA 18 Figure A-14: PUFA from butter 18 Figure A-15: Percent energy from carbohydrate 23 Figure A-16: Major sources of carbohydrate (females) 23 Figure A-17: Median sucrose intake 26 Figure A-18: Median lactose intake 26 Figure A-19: Major sources of sucrose 27 Figure A-20: Sucrose from beverages 27 Figure A-21: Major sources of fructose (females) 28 Figure A-22: Major sources of fructose (males) 28 Figure A-23: Median non-starch polysaccharide intake 30 Figure A-24: Median dietary fibre intake 30 Figure A-25: Dietary fibre from vegetables 31 Figure A-26: Dietary fibre from breakfast cereals 31 Figure A-27: Median β-carotene intake 33 Figure A-28: Major sources of β-carotene (males) 33 Figure A-29: Median vitamin C intake 36 Figure A-30: Major sources of vitamin C 36 Figure A-31: Median vitamin E intake 38 Figure A-32: Major sources of vitamin E 38 Figure A-33: Median thiamin intake 39 Figure A-34: Median riboflavin intake 39 Figure A-35: Median folate intake 43 Figure A-36: Prevalence of inadequate folate intake (females) 43 Figure A-37: Major sources of folate (females) 44 Figure A-38: Folate from potatoes, kumara and taro 44 Figure A-39: Median calcium intake 46 Figure A-40: Prevalence of inadequate calcium intake 46 Figure A-41: Major sources of calcium (females) 47 Figure A-42: Calcium from milk 47 Figure A-43: Median phosphorous intake 49 Figure A-44: Median magnesium intake 49 Figure A-45: Median iron intake 51 Figure A-46: Prevalence of inadequate iron intake (females 11–14 years) 51 Figure A-47: Major sources of iron (females) 52 Figure A-48: Iron from breakfast cereals 52 Figure A-49: Median zinc intake 54 Figure A-50: Prevalence of inadequate zinc intake 54 Figure A-51: Major sources of zinc 55 Figure A-52: Zinc from beef and veal 55 Figure A-53: Median selenium intake 59 Figure A-54: Recommended selenium intake 59
NZ Food NZ Children xiii
Figure A-55: Major sources of selenium (females) and milk (males) 60 Figure A-56: Selenium from fish and seafood 60 Figure B-1: Eating omnivorous diet 99
Figure B-2: Avoiding eggs 99
Figure B-3: Type of dietary supplements used 101
Figure B-4: Dietary supplement use 101
Figure B-5: Usually ate or drank before school 103
Figure B-6: Usually ate or drank on way to school 103
Figure B-7: Most of food consumed at school brought from home 105
Figure B-8: Some of food consumed at school bought from canteen/tuckshop 105
Figure B-9: Usually consumed food (females) 106
Figure B-10: Usually consumed food (males) 106
Figure B-11: Salt Usually added during meal preparation 108
Figure B-12: Addition of salt at the table 108
Figure B-13: Can Always afford to eat properly 110
Figure B-14: Can Always and Sometimes afford to eat properly 110
Figure B-15: Food runs out Sometimes (number of children) 111
Figure B-16: Food runs out Sometimes (NZDep01 quintile) 111
Figure B-17: Variety of foods limited Often or Sometimes 113
Figure B-18: Use of food grants/banks Often or Sometimes 113
Figure B-19: Stressed about lack of money for food Often or Sometimes 115
Figure B-20: Stressed when no food for social occasions Often 115
Figure C-1: Fruit serves ≥ two serves/day 126
Figure C-2: Bananas eaten ≥ once/week 126
Figure C-3: Silverbeet, spinach, puha, or watercress eaten ≥ once/week 128
Figure C-4: Taro eaten ≥ once/week 128
Figure C-5: Meat, fish, poultry or eggs eaten ≥ twice/day (NZDep01) 130
Figure C-6: Meat, fish, poultry or eggs eaten ≥ twice/day (ethnic) 130
Figure C-7: Canned spaghetti with tomato sauce eaten ≥ once/week 132
Figure C-8: Meat and vegetable boil-up eaten ≥ once/week 132
Figure C-9: Type of bread (males) 134
Figure C-10: Butter on bread most of the time 134
Figure C-11: Breakfast cereal eaten ≥ once/day 136
Figure C-12: Add sugar, honey or syrup to cereal 136
Figure C-13: Spreads eaten ≥ once/week 137
Figure C-14: Sauces eaten ≥ once/week 137
Figure C-15: Crackers or crispbreads ≥ once/week 139
Figure C-16: Doughnuts or croissants ≥ once/week 139
Figure C-17: Chocolate eaten ≥ once/week 141
Figure C-18: Cheese eaten ≥ once/week 141
Figure C-19: Milk consumed ≥ once/day 143
Figure C-20: Type of milk consumed ≥ once/week (females) 143
Figure C-21: Powdered fruit drink consumed ≥ once/week 145
Figure C-22: Tea consumed ≥ once/week 145
Figure C-23: Fat added to vegetables ≥ once/week 147
Figure C-24: Fat used for cooking meat, poultry or fish (males) 147
Figure D-1: Television or video > 20 hours during school days 165
Figure D-2: No weekend computer or video games (males) 165
xiv NZ Food NZ Children
Figure D-3: Highest activity quartile 167
Figure D-4: Active travel to/from school 167
Figure D-5: Active during lunch 169
Figure D-6: Weekend activity (4+ occasions) (females) 169
Figure E-1: Brushed teeth on previous day 175
Figure E-2: Had tooth filled or dressed 175
Figure E-3: Overweight using international cut-off values 177
Figure E-4: Obesity using international cut-off values 177
Figure E-5: Prevalence of iron deficiency (age) 179
Figure E-6: Prevalence of iron deficiency (females) 179
Figure E-7: Low serum zinc 181
Figure E-8: Total cholesterol 181
Figure E-9: Median urinary iodine concentration (age) 182
Figure E-10: Median urinary iodine concentration (ethnic) 182
NZ Food NZ Children xv
Abbreviations BMI Body mass index. An indicator of body fatness calculated from the formula
weight/height2 (or kg/m2).
CBC complete blood cell count
CNS02 2002 National Children’s Nutrition Survey
CNSTAC Children’s Nutrition Survey Technical Advisory Committee, chaired by Professor Jim Mann, advised the Ministry of Health on technical issues. The list of members is in Appendix A.
EAR estimated average requirement
EDTA ethylene diamine tetra-acetic acid
ESR Institute of Environmental Science and Research
FFQ Food frequency questionnaire. A self-administered questionnaire asking about the frequency of consumption of foods and preparation/cooking practices.
HDL high density lipoprotein
IANZ International Accreditation New Zealand
ICCIDD International Council for Control of Iodine Deficiency Disorders
LINZ® Life in New Zealand Activity & Health Research Unit (University of Otago)
LINZ24 Life in New Zealand 24-hour diet recall programme
LRNI Lower reference nutrient intake for protein or a vitamin or mineral. An amount of the nutrient that is enough for only the few people in a group who have low needs. This definition and its values were sourced from the United Kingdom dietary reference values (UK DRVs).
MFD Manufactured Foods Database
MUFA monounsaturated fatty acids
NHANES United States National Health and Nutrition Examination Survey
NNS97 1997 New Zealand National Nutrition Survey
NZDep01 The New Zealand Index of Deprivation is based on individual’s residential address (Salmond and Crampton 2002). The index is based on eight dimensions of deprivation: income, access to a car, living space, home ownership, employment, qualifications, support and access to a telephone. The usual NZDep01 consists of a principal components score, scaled to a mean of 1000 with a standard deviation of 100, out of which is broken 10 equal categories. For the purpose of this report these categories have been collapsed into quintiles. Quintile I is defined as children living in the least deprived areas and quintile V as children living in the most deprived areas.
NZEO New Zealand European and Others
NZFCD New Zealand Food Composition Database
PAQ-C Physical Activity Questionnaire for Children
xvi NZ Food NZ Children
PC-SIDE The abbreviation for the computer software for intake distribution estimation developed by Iowa State University. This software estimates a population’s distribution of usual intakes of nutrients when daily intake observations are repeated at least twice on a subsample of individuals in the population.
PE physical education
PUFA polyunsaturated fatty acids
RE retinol equivalents
RNI Reference nutrient intake for protein or a vitamin or mineral. An amount of nutrient that is enough, or more than enough, for about 97 percent of people in a group. If the average intake of the group is the same as the RNI, the risk of deficiency in that group is very small. This definition and its values were sourced from the United Kingdom dietary reference values (UK DRVs).
SAFA saturated fatty acids
SCL Southern Community Laboratories
SEM standard error of mean
TIBC total iron-binding capacity
UK DRVs United Kingdom dietary reference values resulting from the report of the 1991 Panel on Dietary Reference Values of the Committee on Medical Aspects of Food Policy. These include estimated average requirements (EARs), reference nutrient intakes (RNIs), lower reference nutrient intakes (LRNIs) and ‘safe intakes’.
USDA United States Department of Agriculture
USDRI United States Dietary Reference Intakes
NZ Food NZ Children xvii
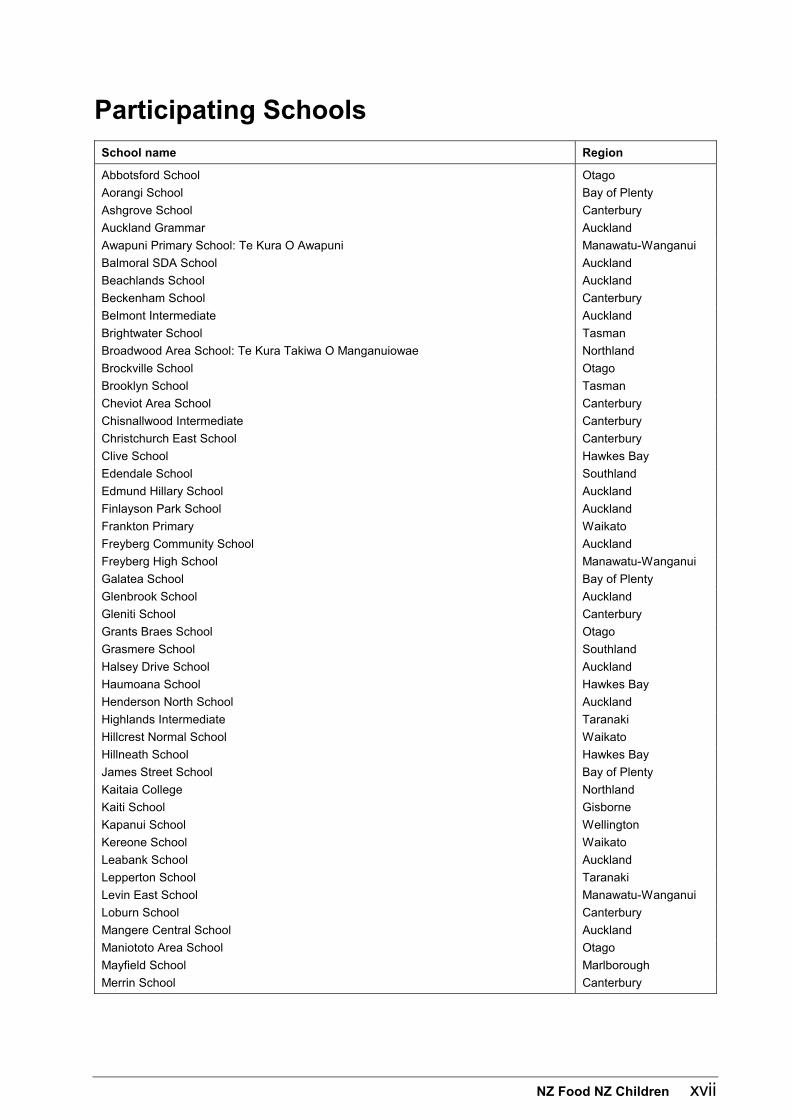
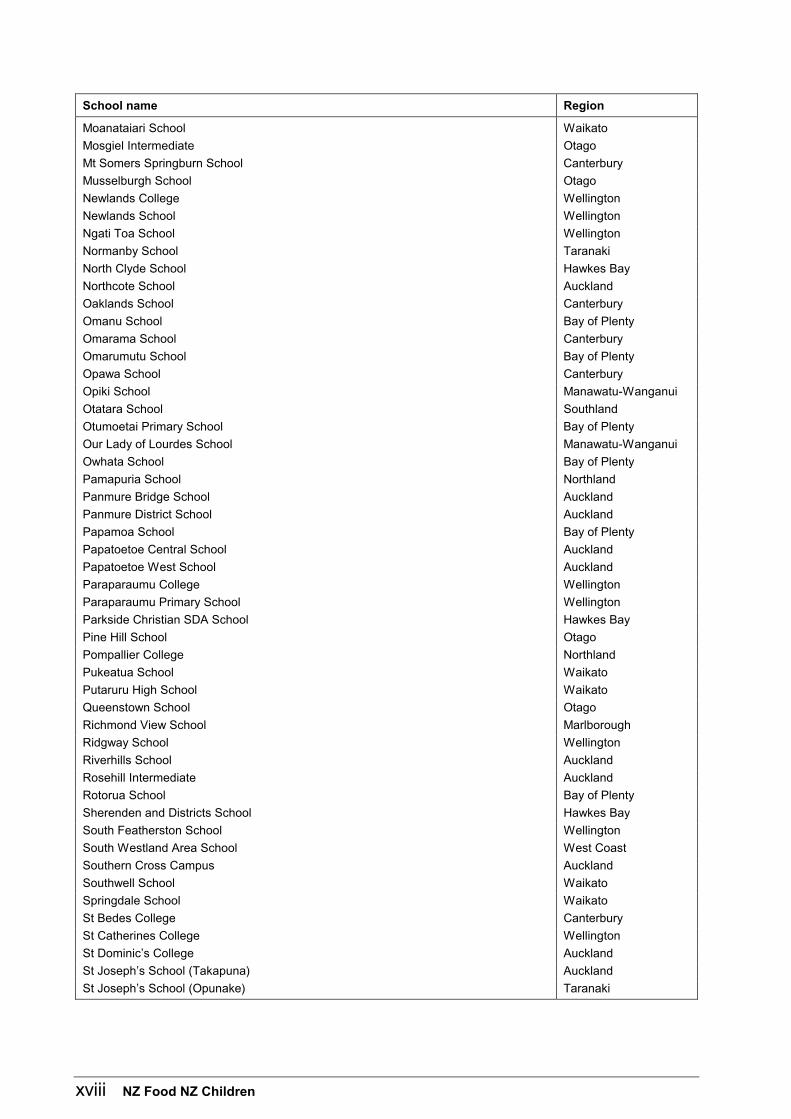
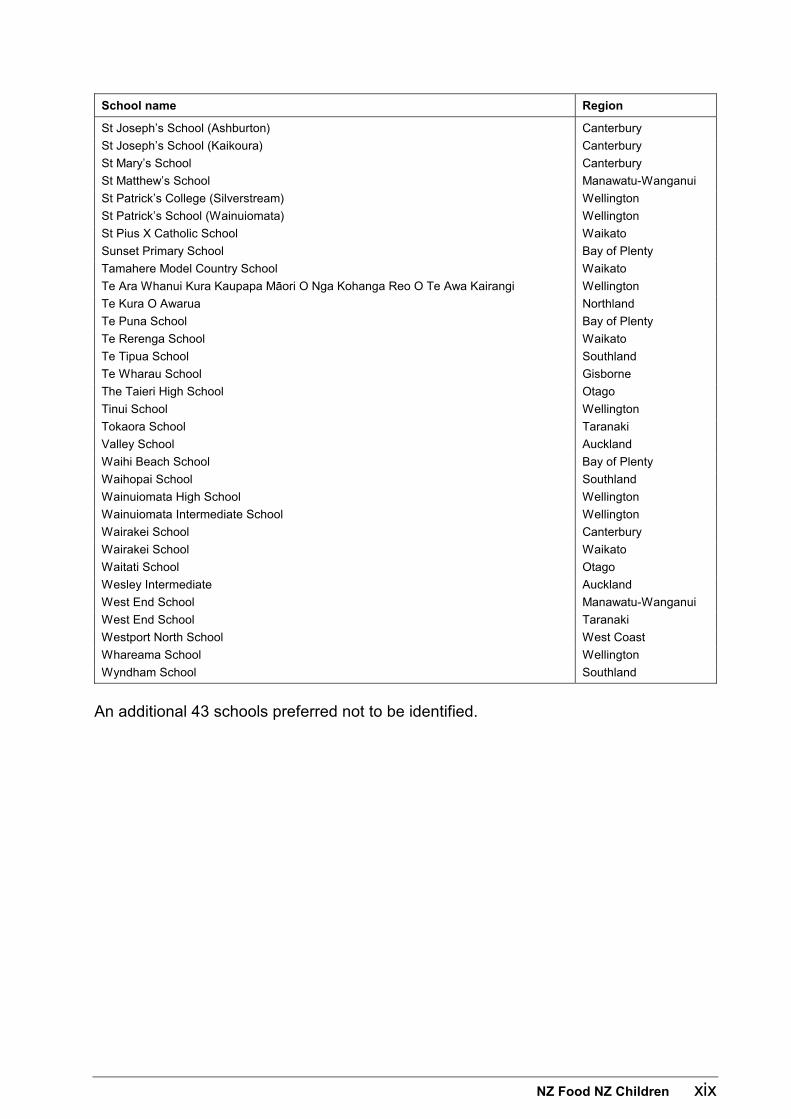
Participating Schools
School name Region
Abbotsford School Otago
Aorangi School Bay of Plenty
Ashgrove School Canterbury
Auckland Grammar Auckland
Awapuni Primary School: Te Kura O Awapuni Manawatu-Wanganui
Balmoral SDA School Auckland
Beachlands School Auckland
Beckenham School Canterbury
Belmont Intermediate Auckland
Brightwater School Tasman
Broadwood Area School: Te Kura Takiwa O Manganuiowae Northland
Brockville School Otago
Brooklyn School Tasman
Cheviot Area School Canterbury
Chisnallwood Intermediate Canterbury
Christchurch East School Canterbury
Clive School Hawkes Bay
Edendale School Southland
Edmund Hillary School Auckland
Finlayson Park School Auckland
Frankton Primary Waikato
Freyberg Community School Auckland
Freyberg High School Manawatu-Wanganui
Galatea School Bay of Plenty
Glenbrook School Auckland
Gleniti School Canterbury
Grants Braes School Otago
Grasmere School Southland
Halsey Drive School Auckland
Haumoana School Hawkes Bay
Henderson North School Auckland
Highlands Intermediate Taranaki
Hillcrest Normal School Waikato
Hillneath School Hawkes Bay
James Street School Bay of Plenty
Kaitaia College Northland
Kaiti School Gisborne
Kapanui School Wellington
Kereone School Waikato
Leabank School Auckland
Lepperton School Taranaki
Levin East School Manawatu-Wanganui
Loburn School Canterbury
Mangere Central School Auckland
Maniototo Area School Otago
Mayfield School Marlborough
Merrin School Canterbury
xviii NZ Food NZ Children
School name Region
Moanataiari School Waikato
Mosgiel Intermediate Otago
Mt Somers Springburn School Canterbury
Musselburgh School Otago
Newlands College Wellington
Newlands School Wellington
Ngati Toa School Wellington
Normanby School Taranaki
North Clyde School Hawkes Bay
Northcote School Auckland
Oaklands School Canterbury
Omanu School Bay of Plenty
Omarama School Canterbury
Omarumutu School Bay of Plenty
Opawa School Canterbury
Opiki School Manawatu-Wanganui
Otatara School Southland
Otumoetai Primary School Bay of Plenty
Our Lady of Lourdes School Manawatu-Wanganui
Owhata School Bay of Plenty
Pamapuria School Northland
Panmure Bridge School Auckland
Panmure District School Auckland
Papamoa School Bay of Plenty
Papatoetoe Central School Auckland
Papatoetoe West School Auckland
Paraparaumu College Wellington
Paraparaumu Primary School Wellington
Parkside Christian SDA School Hawkes Bay
Pine Hill School Otago
Pompallier College Northland
Pukeatua School Waikato
Putaruru High School Waikato
Queenstown School Otago
Richmond View School Marlborough
Ridgway School Wellington
Riverhills School Auckland
Rosehill Intermediate Auckland
Rotorua School Bay of Plenty
Sherenden and Districts School Hawkes Bay
South Featherston School Wellington
South Westland Area School West Coast
Southern Cross Campus Auckland
Southwell School Waikato
Springdale School Waikato
St Bedes College Canterbury
St Catherines College Wellington
St Dominic’s College Auckland
St Joseph’s School (Takapuna) Auckland
St Joseph’s School (Opunake) Taranaki
NZ Food NZ Children xix
School name Region
St Joseph’s School (Ashburton) Canterbury
St Joseph’s School (Kaikoura) Canterbury
St Mary’s School Canterbury
St Matthew’s School Manawatu-Wanganui
St Patrick’s College (Silverstream) Wellington
St Patrick’s School (Wainuiomata) Wellington
St Pius X Catholic School Waikato
Sunset Primary School Bay of Plenty
Tamahere Model Country School Waikato
Te Ara Whanui Kura Kaupapa Mäori O Nga Kohanga Reo O Te Awa Kairangi Wellington
Te Kura O Awarua Northland
Te Puna School Bay of Plenty
Te Rerenga School Waikato
Te Tipua School Southland
Te Wharau School Gisborne
The Taieri High School Otago
Tinui School Wellington
Tokaora School Taranaki
Valley School Auckland
Waihi Beach School Bay of Plenty
Waihopai School Southland
Wainuiomata High School Wellington
Wainuiomata Intermediate School Wellington
Wairakei School Canterbury
Wairakei School Waikato
Waitati School Otago
Wesley Intermediate Auckland
West End School Manawatu-Wanganui
West End School Taranaki
Westport North School West Coast
Whareama School Wellington
Wyndham School Southland
An additional 43 schools preferred not to be identified.
xx NZ Food NZ Children
Executive Summary
Introduction This report overviews the 2002 National Children’s Nutrition Survey (CNS02). It describes the methodologies and the data on nutrient intakes and their sources; food security; eating patterns; frequently eaten foods; physical activity patterns; dental health; anthropometric measures and selected nutrition related clinical measures of New Zealand schoolchildren 5–14 years of age. A nationally representative sample of children was recruited by first, selecting a random sample of schools, and then randomly selecting children for participation within these schools. Sufficient Mäori and Pacific children were included so that ethnic-specific analyses could be undertaken. Three thousand two hundred and seventy-five children participated with parental and personal consent. Anthropometric measurements and collection of blood and urine samples occurred at school, while the main interview was normally carried out in the child’s home in the presence of a parent/caregiver to optimise the collection of the dietary data and ensure quality responses to all interview questions. The dietary data are unique among national surveys of children in that the 24-hour diet recall included dietary supplements as well as foods and beverages. supplements. The collection of a repeat 24-hour diet recall on a subsample enabled the statistical adjustment of the data to present the ‘usual’ intake distribution for nutrients by subgroup. The usual frequency of intake of commonly eaten foods was assessed by a qualitative food frequency questionnaire. This important study provides the first opportunity to examine all aspects of the nutritional status of New Zealand children.
Main findings In general among New Zealand children, younger children had better food and nutrient intakes than older children and were less likely to be overweight or obese. Among the three ethnic groups, NZEO children had the lowest levels of prevalence of inadequate intakes compared with Mäori and Pacific children. They were also less likely to be overweight or obese than Mäori or Pacific children. The data confirm the need to augment the iodine intake of New Zealand children as a matter of priority. Further analyses of this data will form the basis of appropriate nutrition education and guide interventions to improve aspects of nutritional status for all New Zealand children and children of specific genders, ages and ethnicities.
NZ Food NZ Children xxi
Energy and nutrients While the energy intakes of males ranged from 7573 kJ (5–6 years) to 10,303 kJ (11–14 years), above the range observed for females [(6703 kJ (5–6 years) to 8323 kJ (11–14 years)], the contributions from different food sources were the same and did not vary across age groups. Bread was the single largest contributor to energy intake. Protein intake was in excess of requirements for all groups. Carbohydrate contributed 53.7 percent of energy and total fat 33.1 percent. The mean contribution to daily energy from total fat was lower for the New Zealand European and Others (NZEO) group of children than Mäori and Pacific children. The single greatest contributor to total fat in the diet was Potatoes, kumara & taro, which included potato chips and crisps. The largest contributor of saturated fat (comprising 14 percent of energy) was Milk, which provided 11 percent, followed by Potatoes, kumara & taro and Pies & pasties. This latter group was a more significant contributor to the diets of Pacific children than NZEO children. Over one-quarter of the sucrose (the major contributor to total sugars) came from Beverages and one-fifth from Sugar & sweets. Pacific children obtained a greater proportion (over one-third) of their sucrose from Beverages than NZEO children. While for many children, particularly younger children (5–6 years) and NZEO children, intakes of vitamins and minerals were satisfactory, some subgroups had intakes that were less than satisfactory. This was contributed to by proportionately lower intakes of food sources providing both β-carotene (Vegetables) and retinol (Milk). Iron status was satisfactory for most children as assessed by both dietary intake and biochemical indices, with the exception of menstruating females. Older children (11–14 years) were at a greater risk of having inadequate selenium intakes than younger children. The iodine status of New Zealand children, as assessed by urinary iodine excretion was deemed to be low and indicative of mild iodine deficiency. The intakes of the B vitamins (thiamin, riboflavin and niacin) and vitamin C were adequate for most New Zealand children; the estimated prevalence of inadequate intake of folate was less than 10 percent for New Zealand children and highest among Pacific children.
xxii NZ Food NZ Children
Eating patterns and food choices Only about 5 percent of children reported using a dietary supplement in the previous 24 hours, and the majority of children (95.3 percent) consumed an omnivorous diet. During the school day, younger children were more likely to eat food at home before school and bring most of the food they consumed at school from home than older children. Parents/caregivers in households with NZEO children reported that they were the most ‘food secure’, followed by households with Mäori and Pacific children. Households with the most children were the least food secure. About two out of five New Zealand children ate fruit at least twice a day and about three out of five ate vegetables three or more times a day. About 80 percent of children most frequently chose White bread. Noodles were the most commonly eaten convenience meal/snack, eaten by about one-half of New Zealand children. The most commonly eaten meat was Chicken (eaten at least weekly by 80 percent of children). Forty percent ate Breakfast cereal at least daily and about 80 percent ate Biscuits and Potato crisps, corn snacks or chips at least weekly. Three-quarters most frequently drank Standard milk, and Powdered fruit drink was the most popular non-milk drink.
Activity patterns and health On a weekly basis, 73 percent of New Zealand children watched less than two hours of television or videos per day and 60 percent did not play computer or video games either during the week or at weekends. Walking at least 15 minutes per day was the most frequently reported activity by about 60 percent of children; and about one-half were transported to and from school. Males were more likely than females to fall in the highest activity quartile. About one in five children 7–10 years and one in 10 children 11–14 years reported no physical education class in the previous week. No weekend physical activity was reported by 12.5 percent of children and this was highest among females 11–14 years. Ninety-three percent of New Zealand children reported attending a school dental clinic or dentist, and 88 percent brushed their teeth at least once in the previous day. For the majority of New Zealand children (68.9 percent) weight in relation to their height fell within an acceptable range. Using international cut-offs, 21.3 percent were overweight and 9.8 percent obese. Overweight and obesity levels were highest for Pacific children, followed by Mäori and NZEO children.
NZ Food NZ Children 1
Introduction
Background The 2002 National Children’s Nutrition Survey (CNS02) was a cross-sectional population survey providing information on food and nutrient intakes; eating patterns; food security and frequently eaten foods; physical activity patterns; dental health; anthropometric measures and nutrition-related clinical measures. The sample consisted of 3275 New Zealand children aged 5–14 years. The primary purpose of the survey was to provide information that could be used to improve, promote and protect the health status of New Zealand children. The CNS02 was a voluntary, school-based survey conducted by three universities (Auckland, Massey (Palmerston North) and Otago) for the Ministry of Health. Auckland UniServices Ltd managed the contract on behalf of the three institutions. Children were selected for participation to ensure a nationally representative sample with sufficient Mäori and Pacific children so ethnic-specific analyses could be undertaken. Three thousand two hundred and seventy-five children participated with parental and personal consent. The anthropometric measurements and collection of blood and urine samples occurred at school, while the main interview was normally carried out in the home in the presence of a parent/caregiver to optimise the collection of the dietary data and ensure quality responses to all interview questions. Data from children were collected during the school year, February to December 2002.
This report This report provides a ‘snapshot’ of the nutritional status of New Zealand children in 2002. The purpose is to show the range of data available from the CNS02 and to highlight the most significant findings. Only a limited number of independent variables have been selected for analysis, for example age group, sex and ethnicity. No account has been taken of the possible association between these variables, for example, the relationship between ethnicity and New Zealand Index of Deprivation (NZDep01) quintile. It is acknowledged that these associations may exist and may be important for definitive interpretation of the data. This report provides only preliminary results and further analyses may explore these and other more complex issues. The five sections covered by this report are divided into topics. Each topic is presented as a brief description of major findings for: New Zealand children, including sex and age group comparisons; NZDep01 quintile comparisons; urban-rural comparisons; ethnic group comparisons. All differences reported in the text are statistically significant. A discussion of the subsections NZDep01, urban-rural or ethnic group are not included if no significant differences occurred between groups. Each topic is highlighted by figures that encapsulate the tabulated data on the topic that appear at the end of each section.
2 NZ Food NZ Children
The five sections are: A Nutrients and Dietary Sources B Eating Patterns C Frequently Eaten Foods D Physical Activity E Health
These sections are followed by three sections summarising the key issues for each of the three ethnic groups – Mäori, Pacific, and New Zealand European and Others (NZEO). A brief description of the methodology is in Appendix B, including information to assist the reader to interpret the tabulated data.
Further information The objectives of this report are to provide an introduction and a systematic overview to the data, answer basic questions and illustrate the potential for exploring more complex questions. Further analyses will be published in professional and scholarly journals in the fields of dietetics, epidemiology, medicine, human nutrition, physical eduction and public health. The full dataset will be made available to bona fide researchers after 1 July 2004. Enquiries about the data’s availability should be made to Anne Duncan, Ministry of Health, PO Box 5013, Wellington or email [email protected].
NZ Food NZ Children 3
A. Nutrients and Dietary Sources
Introduction This is the first National Children’s Nutrition Survey (CNS02) in New Zealand to include a 24-hour diet recall, and also the first to include dietary intake from both foods (including beverages) and dietary supplements. Relatively few New Zealand children consumed dietary supplements but their intakes increased or skewed the variance of some nutrients in particular age/ethnic subgroups. Using repeat 24-hour diet recalls on a subsample, nutrient intakes for each subgroup of children were adjusted for intra-individual variability to obtain usual intake distributions. Energy yielding intakes (protein, carbohydrate and fat) have been compared to the New Zealand Dietary Guidelines (Department of Health 1991). Intakes of vitamins and minerals have been compared to the United Kingdom dietary reference values (UK DRVs) except for selenium. Selenium has been compared with the proposed New Zealand specific recommendation (Thomson and Paterson 2001). For each nutrient the appropriate evaluation of level of intake is made under the heading ‘Nutrient Adequacy’. This is the first national survey in an environment in which many foods are fortified, in particular breakfast cereals and some beverages. Thus comparisons of these CNS02 data with the 1997 New Zealand National Nutrition Survey (NNS97) data may show differences with respect to dietary sources of some nutrients. For example, the main source of folate was bread and breakfast cereals for children, but vegetables for adults (Ministry of Health 1999). For 20 selected nutrients, detailed information is presented in the text on the proportion of these nutrients obtained from different food groups. In this way, the adequacy of intake of these nutrients can be understood in the context of the foods from which each is sourced. For the other nutrients only a general statement is made on main sources. The tables from which these general statements have been derived are in Appendix C. While the proportion consuming the group Dietary supplements was low, the contribution of this group appears disproportionately high because dietary supplements provide levels of intake in excess of the levels found in foods. For this reason differences between subgroups for proportion of nutrients obtained from Dietary supplements is not discussed. Repeat recalls were not completed on sufficient rural children to allow a reliable estimate of usual intake. Urban-rural data are presented only for sources of nutrients. For explanations on the functions of the nutrients discussed in this study, see Whitney and Rolfes (2002).
4 NZ Food NZ Children
Key points
Energy
• Daily median energy intakes for males ranged from 7573 kJ (5–6 years) to 10,303 kJ (11–14 years) and for females from 6703 kJ (5–6 years) to 8323 kJ (11–14 years).
• Bread was the largest contributor to New Zealand children’s energy intake.
• Contributions to energy intake from different food sources were the same for males and females and were similar for all age groups.
Protein
• The mean contribution of protein to usual daily energy intake was higher for males (14 percent) than for females (13.5 percent).
• Bread, Milk and Poultry together provided a third of children’s protein intake.
• Fish & seafood and Poultry were higher contributors to protein intake in Pacific children than in Mäori and New Zealand European and Other (NZEO) children.
Total fat
• The mean contribution to daily energy intake from total fat was lower for NZEO children (males 32.6 percent; females 32.3 percent) than Mäori (34.2 percent; 34 percent) and Pacific children (35 percent; 34.3 percent).
• The main source of total fat in the diets of New Zealand children came from Potatoes, kumara & taro, which provided 9 percent (almost one half of this came from potato chips and wedges).
• Pacific children obtained a higher proportion of fat from Pies & pasties (males 10 percent; females 9 percent) than NZEO children (5 percent).
Types of fat
• Saturated fat was the main type of dietary fat, contributing 14.5 percent of energy, followed by monounsaturated fat (10.9 percent) and polyunsaturated fat (3.8 percent).
Total carbohydrate
• The mean contribution of carbohydrate to the daily energy intake of New Zealand children was 53.7 percent.
• Bread was the greatest source of carbohydrate (20 percent) followed by Beverages (11 percent).
• There were few differences across age groups in sources of carbohydrate, and none by New Zealand Index of Deprivation (NZDep01) quintile.
NZ Food NZ Children 5
Total sugars
• Sucrose was the major contributor to total sugars intake and the highest intake of sucrose was among Mäori children.
• The main sources of sucrose for New Zealand children were Beverages (26 percent) and Sugar & sweets (21 percent).
• Fruit contributed a higher proportion of sucrose to younger males (5–6 years, 13 percent; 7–10 years, 11 percent) than to older males 11–14 years (7 percent).
Dietary fibre
• The median usual daily intake of dietary fibre of 17.9 g for New Zealand children appeared adequate.
• Pacific children had a lower median usual daily intake of dietary fibre than NZEO and Mäori children.
• Bread, Potatoes, kumara & taro, Fruit, Breakfast cereals and Vegetables provided 70 percent of children’s dietary fibre intake.
• NZDep01-I males obtained more dietary fibre from Vegetables than males in NZDep01-V.
Vitamin A
• Pacific children were estimated to have the highest prevalence of inadequate intakes of vitamin A (males 19.7 percent; females 37.4 percent).
Vitamin C
• The prevalence of inadequate intake of vitamin C was estimated to be very low in New Zealand children (0.1 percent).
Vitamin E
• The median usual daily intake of vitamin E for males ranged from 6.7 mg (5–6 years) to 8.7 mg (11–14 years), and for females from 5.9 mg (5–6 years) to 9.0 mg (11–14 years).
B vitamins
• Pacific children were more at risk of inadequate intake of riboflavin than NZEO and Mäori children.
• There was a negligible risk of deficiency of niacin, thiamin, vitamin B6 and B12 among New Zealand children.
6 NZ Food NZ Children
Folate
• Pacific children were more at risk of inadequate intakes of folate than NZEO and Mäori children.
• Bread (22 percent) and Breakfast cereals (21 percent) were the main sources of folate for New Zealand children.
• Potatoes, kumara & taro contributed more folate to the diets of Mäori children than NZEO children.
Calcium
• The prevalence of inadequate intake of calcium in New Zealand children was 12.2 percent for males and 18.2 percent for females.
• New Zealand children obtained one third of their calcium from Milk.
• Younger females (5–6 years) obtained more calcium from Milk than older females (7–14 years).
Phosphorus and magnesium
• The phosphorus and magnesium intakes of New Zealand children appeared to be adequate.
Iron
• The prevalence of inadequate intake of iron was highest among menstruating females. There were no differences in prevalence of inadequate intake for menstruating females between the three ethnic groups.
• Breakfast cereals and Bread were the main sources of iron for New Zealand children (males 18 percent; females 12 percent).
• Males obtained more iron from Breakfast cereals (20 percent) than females (15 percent).
Zinc
• The estimated prevalence of inadequate zinc intake among males ranged from 0.0 percent (5–6 years) to 5.4 percent (11–14 years), and among females from 9.2 percent (5–6 years) to 16.4 percent (11–14 years).
Potassium, manganese and copper
• Potassium, manganese and copper intakes were adequate among New Zealand children.
NZ Food NZ Children 7
Selenium
• The median selenium intake of older children (11–14 years) was below the New Zealand Reference Nutrient Intake (RNI) for children 9–13 years, suggesting that this age group may be at risk of inadequate selenium intake.
• Fish & seafood was the most significant source of selenium for New Zealand children.
• Pacific children obtained more selenium from Fish & seafood than Mäori or NZEO children.
8 NZ Food NZ Children
A1 Energy Tables A1, A8
Nutrient intakes
Males tend to have higher energy intakes than females due to their larger body size and need to consume more to maintain their body mass and meet the requirements for exercise. Similarly, body size increases with age, so older children will tend to have higher energy intakes and nutrient demands than younger children. It follows that males (and older children) will not only have higher energy intakes, but higher intakes of most macronutrients and micronutrients than females (and younger children).
New Zealand children
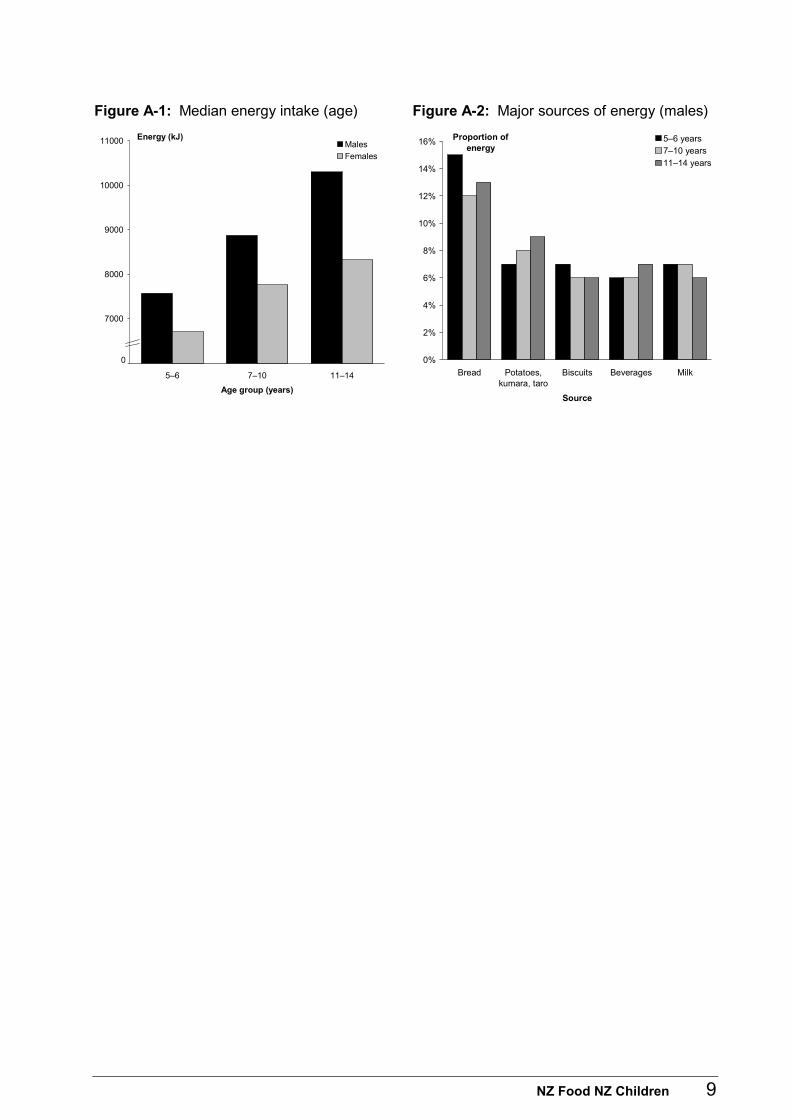
The median usual daily energy intake for males (9123 kJ) was higher than for females (7781 kJ). Among males energy intake ranged from 7573 kJ (5–6 years) to 10,303 kJ (11–14 years), and in females from 6703 kJ (5–6 years) to 8323 kJ (11–14 years) (Figure A-1).
Ethnic
Mäori children had higher median daily usual energy intakes (males 9609 kJ; females 8590 kJ) than NZEO (8974 kJ; 7518 kJ) and Pacific children (8863 kJ; 7871 kJ).
Dietary sources
New Zealand children
Bread was the principal source of energy for New Zealand children contributing 13 percent, with a further 4 percent from Bread based dishes. Potatoes, kumara & taro contributed 8 percent of energy. Biscuits, Beverages and Milk each contributed 6 percent; Fruit, Sugar & sweets and Grains & pasta each contributed 5 percent (Figure A-2).
NZDep01
Females in NZDep01-I and II obtained a higher proportion of energy from Cakes & muffins (7 percent) than those in NZDep01-IV (2 percent).
Ethnic
NZEO males consumed a higher proportion of energy from Milk (7 percent) than Pacific males (4 percent).
NZ Food NZ Children 9
Figure A-1: Median energy intake (age) Figure A-2: Major sources of energy (males)
6000
7000
8000
9000
10000
11000
5–6 7–10 11–14
Age group (years)
Energy (kJ)Males
Females
0
0%
2%
4%
6%
8%
10%
12%
14%
16%
Bread Potatoes,kumara, taro
Biscuits Beverages Milk
Source
Proportion ofenergy
5–6 years7–10 years
11–14 years
10 NZ Food NZ Children
A2 Protein Tables A1, A9
Nutrient intake
New Zealand children
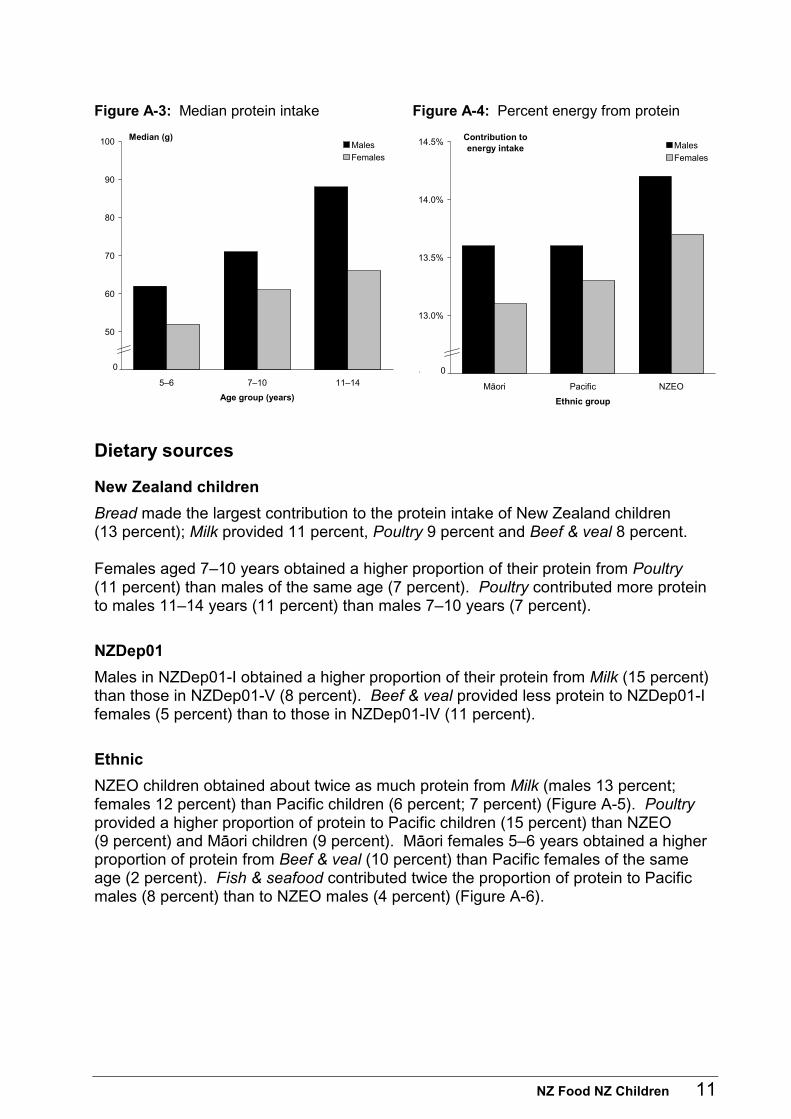
The median usual daily intake of protein in males ranged from 62 g (5–6 years) to 88 g (11–14 years), and in females from 52 g (5–6 years) to 66 g (11–14 years) (Figure A-3). The mean contribution to daily energy intake from protein was higher for males (14.0 percent) than females (13.5 percent).
NZDep01
Females in NZDep01-I had a lower median usual daily intake of protein (57 g) than those in NZDep01-V (65 g). The mean percent energy from protein did not vary across NZDep01 quintiles.
Ethnic
NZEO children had the highest mean percent energy from protein (males 14.2 percent; females 13.7 percent), compared with Mäori children (13.6 percent; 13.1 percent) (Figure A-4). The lowest mean percent energy from protein was for Mäori females 11–14 years (12.7 percent) and the highest was for NZEO males 11–14 years (14.8 percent).
Nutrient adequacy
The RNI in grams per day (g/day) ranged from 19.7 g for the youngest age group (4–6 years) to 42.1 g/day for males 11–14 years. New Zealand children were consuming at least double their age specific RNIs.
NZ Food NZ Children 11
Figure A-3: Median protein intake Figure A-4: Percent energy from protein
40
50
60
70
80
90
100
5–6 7–10 11–14
Age group (years)
Median (g)Males
Females
012.5%
13.0%
13.5%
14.0%
14.5%
Mäori Pacific NZEO
Ethnic group
Contribution to energy intake Males
Females
0
Dietary sources
New Zealand children
Bread made the largest contribution to the protein intake of New Zealand children (13 percent); Milk provided 11 percent, Poultry 9 percent and Beef & veal 8 percent. Females aged 7–10 years obtained a higher proportion of their protein from Poultry (11 percent) than males of the same age (7 percent). Poultry contributed more protein to males 11–14 years (11 percent) than males 7–10 years (7 percent).
NZDep01
Males in NZDep01-I obtained a higher proportion of their protein from Milk (15 percent) than those in NZDep01-V (8 percent). Beef & veal provided less protein to NZDep01-I females (5 percent) than to those in NZDep01-IV (11 percent).
Ethnic
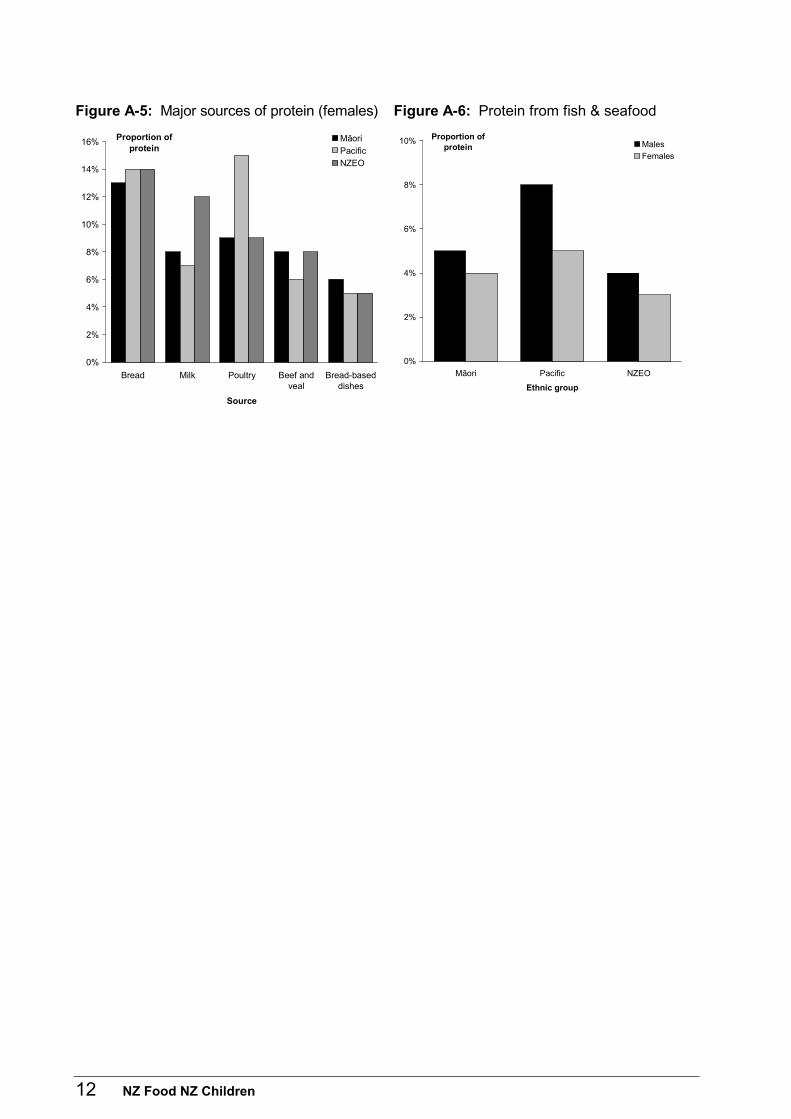
NZEO children obtained about twice as much protein from Milk (males 13 percent; females 12 percent) than Pacific children (6 percent; 7 percent) (Figure A-5). Poultry provided a higher proportion of protein to Pacific children (15 percent) than NZEO (9 percent) and Mäori children (9 percent). Mäori females 5–6 years obtained a higher proportion of protein from Beef & veal (10 percent) than Pacific females of the same age (2 percent). Fish & seafood contributed twice the proportion of protein to Pacific males (8 percent) than to NZEO males (4 percent) (Figure A-6).
12 NZ Food NZ Children
Figure A-5: Major sources of protein (females) Figure A-6: Protein from fish & seafood
0%
2%
4%
6%
8%
10%
12%
14%
16%
Bread Milk Poultry Beef andveal
Bread-baseddishes
Source
Proportion ofprotein
Mäori
Pacific
NZEO
0%
2%
4%
6%
8%
10%
Māori Pacific NZEO
Ethnic group
Proportion ofprotein Males
Females
NZ Food NZ Children 13
A3 Total fat Tables A2.1, A10
Nutrient intake
New Zealand children
The usual median daily intake of total fat for males ranged from 65 g (5–6 years) to 93 g (11–14 years), and for females from 56 g (5–6 years) to 74 g (11–14 years). The mean percent contribution to daily energy intake from total fat was similar for males and females (33.2 percent; 32.9 percent). Younger females (5–6 years) had a lower percent energy from total fat (30.9 percent) than older females 7–10 and 11–14 years (33.1 percent; 33.6 percent). Pacific and Mäori males 5–6 years had a lower mean percent energy from total fat (32.5 percent; 33.1 percent) than males 7–10 years (35.2 percent; 34.6 percent).
NZDep01
Females in NZDep01-I consumed a lower proportion of energy from total fat (31.1 percent) than those in NZDep01-IV and V (33.5 percent; 34 percent).
Ethnic
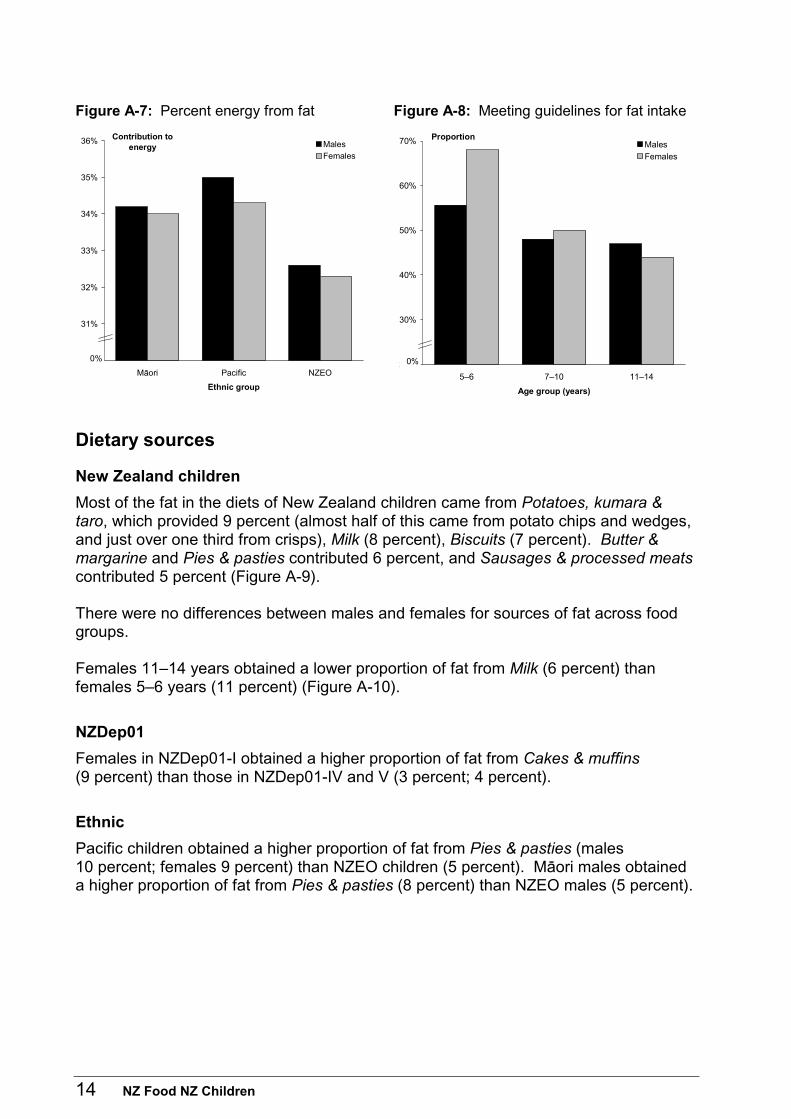
The mean contribution to daily energy from total fat was lower for NZEO children (males 32.6 percent; females 32.3 percent) than for Mäori (34.2 percent; 34 percent) and Pacific children (35 percent; 34.3 percent) (Figure A-7).
Nutrient adequacy
More females 5–6 years (68 percent) than males of the same age (56 percent) met the Nutrition Taskforce guideline for contribution of total fat to energy (Department of Health, 1991) (Figure A-8). Younger children (5–6 years) were more likely to meet the guideline (males 56 percent; females 68 percent) than those 7–10 years (48 percent; 50 percent) and 11–14 years (47 percent; 44 percent). A higher proportion of NZEO children met the Nutrition Taskforce guideline for contribution of total fat to energy (males 52 percent; females 54 percent) than Pacific children (37 percent; 42 percent). Mäori males were more likely to meet the guideline (45 percent) than Pacific males (37 percent).
14 NZ Food NZ Children
Figure A-7: Percent energy from fat Figure A-8: Meeting guidelines for fat intake
30%
31%
32%
33%
34%
35%
36%
Māori Pacific NZEO
Ethnic group
Contribution to energy Males
Females
0%20%
30%
40%
50%
60%
70%
5–6 7–10 11–14
Age group (years)
ProportionMales
Females
0%
Dietary sources
New Zealand children
Most of the fat in the diets of New Zealand children came from Potatoes, kumara & taro, which provided 9 percent (almost half of this came from potato chips and wedges, and just over one third from crisps), Milk (8 percent), Biscuits (7 percent). Butter & margarine and Pies & pasties contributed 6 percent, and Sausages & processed meats contributed 5 percent (Figure A-9). There were no differences between males and females for sources of fat across food groups. Females 11–14 years obtained a lower proportion of fat from Milk (6 percent) than females 5–6 years (11 percent) (Figure A-10).
NZDep01
Females in NZDep01-I obtained a higher proportion of fat from Cakes & muffins (9 percent) than those in NZDep01-IV and V (3 percent; 4 percent).
Ethnic
Pacific children obtained a higher proportion of fat from Pies & pasties (males 10 percent; females 9 percent) than NZEO children (5 percent). Mäori males obtained a higher proportion of fat from Pies & pasties (8 percent) than NZEO males (5 percent).
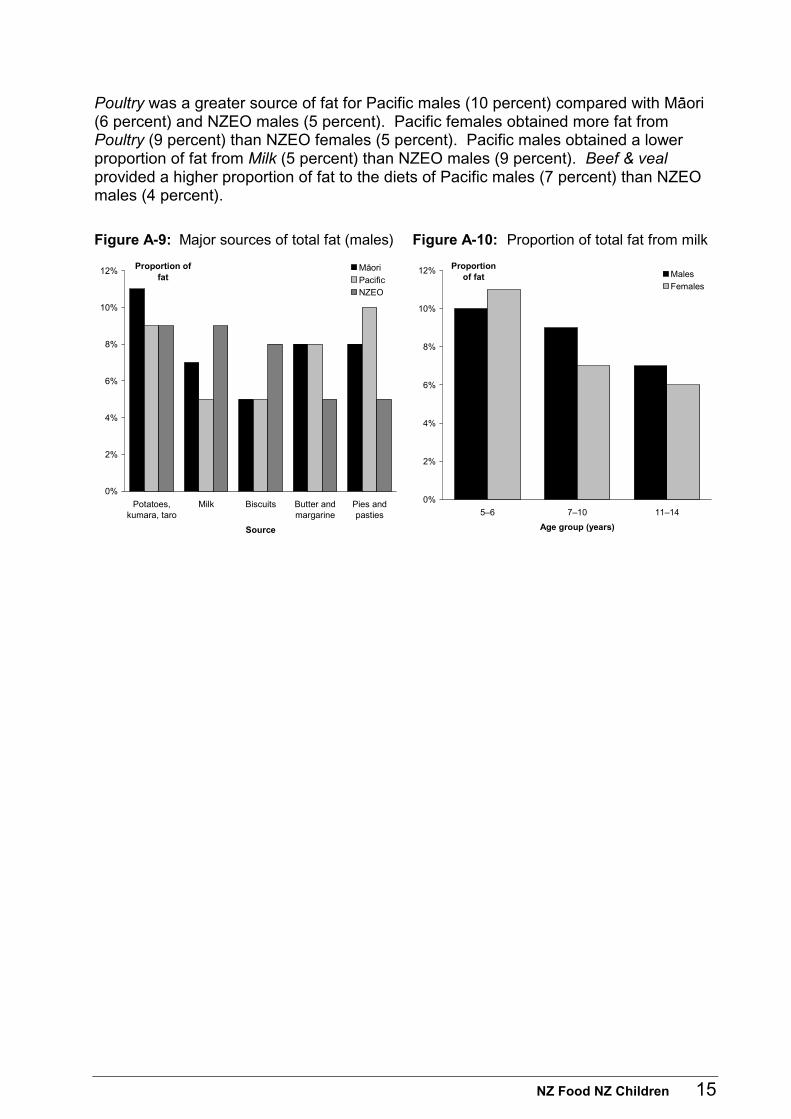
NZ Food NZ Children 15
Poultry was a greater source of fat for Pacific males (10 percent) compared with Mäori (6 percent) and NZEO males (5 percent). Pacific females obtained more fat from Poultry (9 percent) than NZEO females (5 percent). Pacific males obtained a lower proportion of fat from Milk (5 percent) than NZEO males (9 percent). Beef & veal provided a higher proportion of fat to the diets of Pacific males (7 percent) than NZEO males (4 percent).
Figure A-9: Major sources of total fat (males) Figure A-10: Proportion of total fat from milk
0%
2%
4%
6%
8%
10%
12%
Potatoes,kumara, taro
Milk Biscuits Butter andmargarine
Pies andpasties
Source
Proportion offat
Mäori
Pacific
NZEO
0%
2%
4%
6%
8%
10%
12%
5–6 7–10 11–14
Age group (years)
Proportionof fat Males
Females
16 NZ Food NZ Children
A4 Types of fat and cholesterol Tables A2.1, A2.2, A2.3, A11, A12, A13, A14
Among the types of fat examined saturated fat (SAFA) was the major contributor to intake with a median usual daily intake of 32.8 g, followed by monounsaturated fat (MUFA) (24.4 g) and polyunsaturated fat (PUFA) (8.4 g).
Saturated fat (SAFA)
New Zealand children
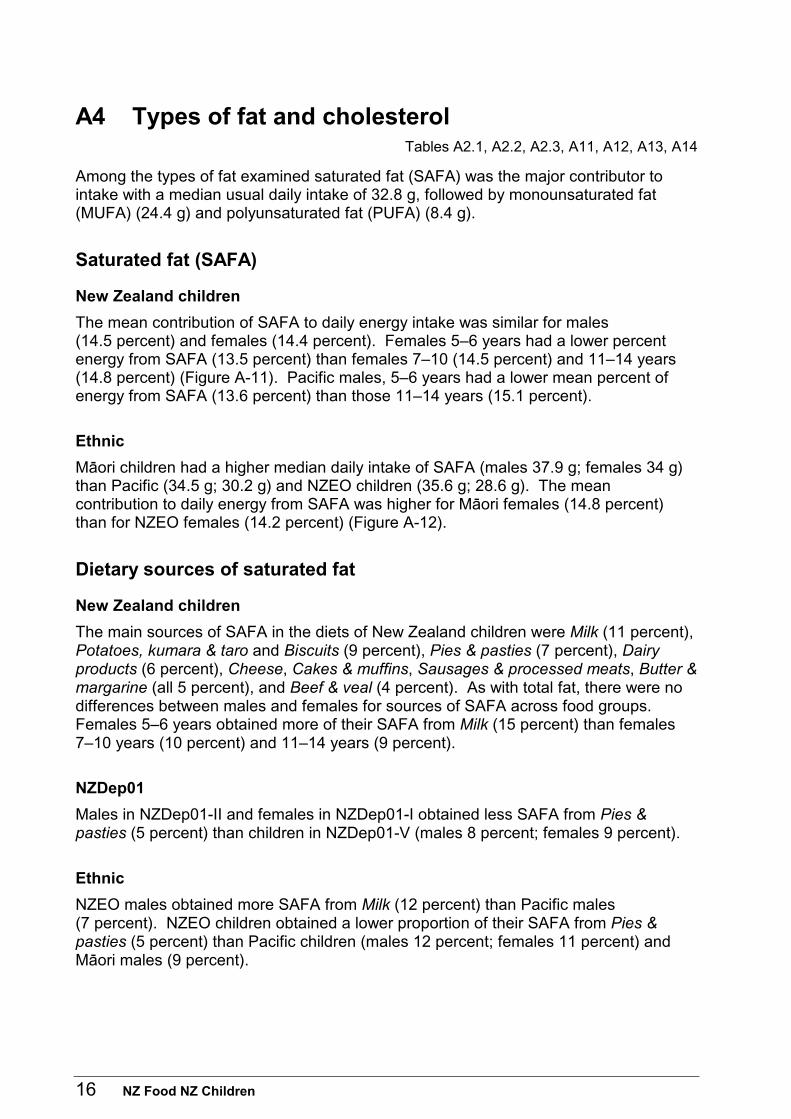
The mean contribution of SAFA to daily energy intake was similar for males (14.5 percent) and females (14.4 percent). Females 5–6 years had a lower percent energy from SAFA (13.5 percent) than females 7–10 (14.5 percent) and 11–14 years (14.8 percent) (Figure A-11). Pacific males, 5–6 years had a lower mean percent of energy from SAFA (13.6 percent) than those 11–14 years (15.1 percent).
Ethnic
Mäori children had a higher median daily intake of SAFA (males 37.9 g; females 34 g) than Pacific (34.5 g; 30.2 g) and NZEO children (35.6 g; 28.6 g). The mean contribution to daily energy from SAFA was higher for Mäori females (14.8 percent) than for NZEO females (14.2 percent) (Figure A-12).
Dietary sources of saturated fat
New Zealand children
The main sources of SAFA in the diets of New Zealand children were Milk (11 percent), Potatoes, kumara & taro and Biscuits (9 percent), Pies & pasties (7 percent), Dairy products (6 percent), Cheese, Cakes & muffins, Sausages & processed meats, Butter & margarine (all 5 percent), and Beef & veal (4 percent). As with total fat, there were no differences between males and females for sources of SAFA across food groups. Females 5–6 years obtained more of their SAFA from Milk (15 percent) than females 7–10 years (10 percent) and 11–14 years (9 percent).
NZDep01
Males in NZDep01-II and females in NZDep01-I obtained less SAFA from Pies & pasties (5 percent) than children in NZDep01-V (males 8 percent; females 9 percent).
Ethnic
NZEO males obtained more SAFA from Milk (12 percent) than Pacific males (7 percent). NZEO children obtained a lower proportion of their SAFA from Pies & pasties (5 percent) than Pacific children (males 12 percent; females 11 percent) and Mäori males (9 percent).
NZ Food NZ Children 17
Figure A-11: Percent energy from SAFA Figure A-12: Percent energy from SAFA, MUFA and PUFA (females)
13.5%
14.0%
14.5%
15.0%
15.5%
5–6 7–10 11–14
Age group (years)
Contribution to energy Males
Females
0% 0%
2%
4%
6%
8%
10%
12%
14%
16%
SAFA MUFA PUFA
Type of fat
Contribution to energy
Mäori
Pacific
NZEO
Monounsaturated fat (MUFA)
New Zealand children
Monounsaturated fat provided a similar mean percent of energy across age groups (males 10.5 percent to 11.2 percent; females 10 percent to 11 percent). The mean contribution to daily energy from MUFA was lower in males and females 5–6 years (10.5 percent; 10 percent) than those 11–14 years (11.2 percent; 11 percent).
NZDep01
The mean contribution to daily energy from MUFA for males and females increased from NZDep01-I (10.2 percent; 10 percent) to NZDep01-V (11.2 percent; 11.3 percent).
Ethnic
NZEO children had a lower daily mean percent energy from MUFA (males 10.6 percent; females 10.5 percent) than Mäori (11.5 percent; 11.3 percent) and Pacific children (12.1 percent; 11.7 percent).
Dietary sources of monounsaturated fat
New Zealand children
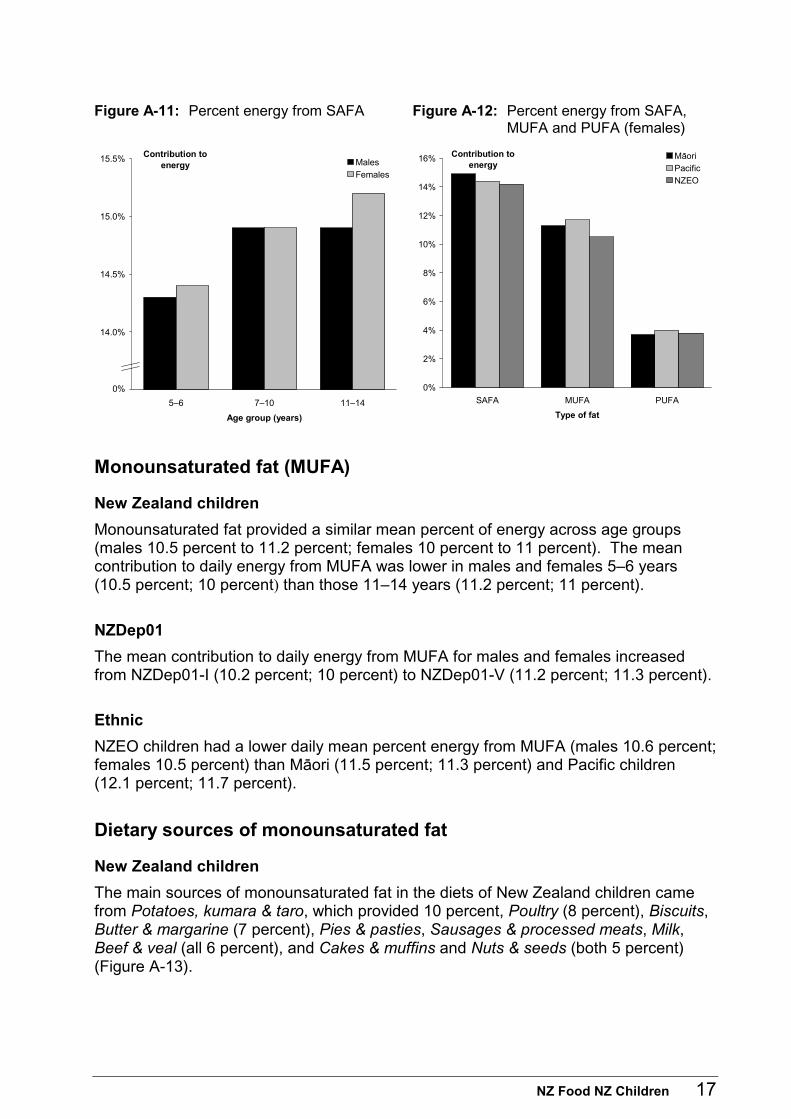
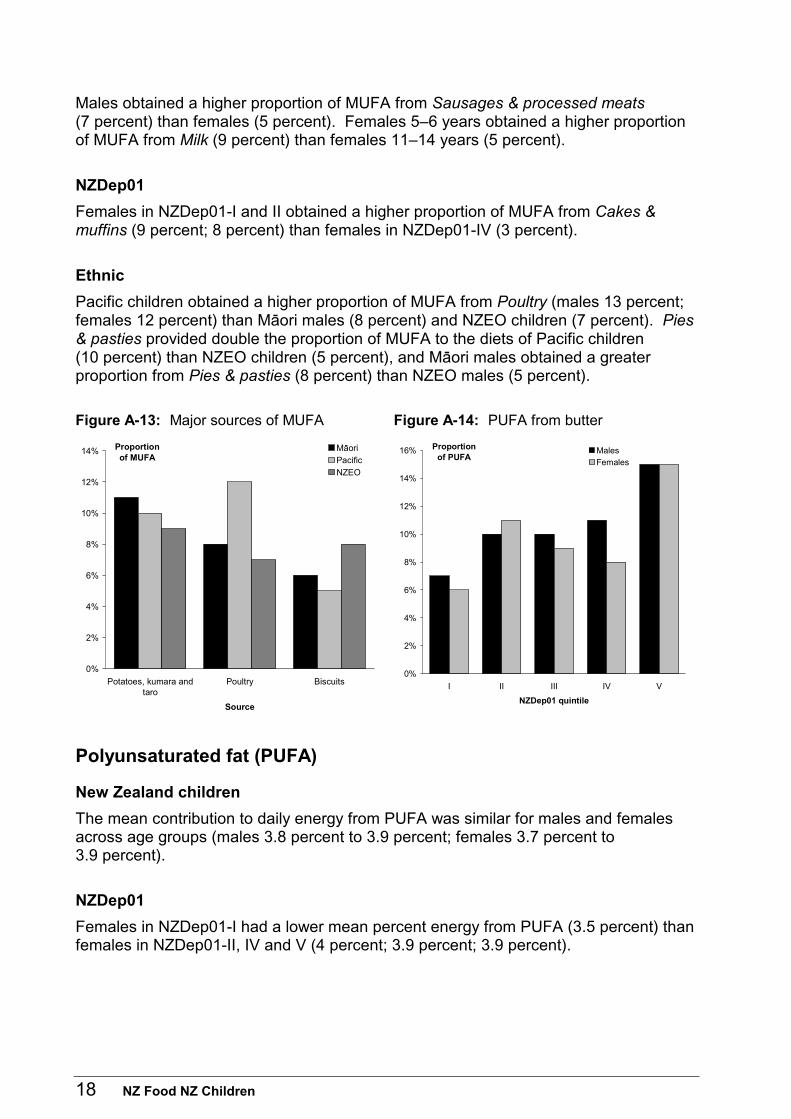
The main sources of monounsaturated fat in the diets of New Zealand children came from Potatoes, kumara & taro, which provided 10 percent, Poultry (8 percent), Biscuits, Butter & margarine (7 percent), Pies & pasties, Sausages & processed meats, Milk, Beef & veal (all 6 percent), and Cakes & muffins and Nuts & seeds (both 5 percent) (Figure A-13).
18 NZ Food NZ Children
Males obtained a higher proportion of MUFA from Sausages & processed meats (7 percent) than females (5 percent). Females 5–6 years obtained a higher proportion of MUFA from Milk (9 percent) than females 11–14 years (5 percent).
NZDep01
Females in NZDep01-I and II obtained a higher proportion of MUFA from Cakes & muffins (9 percent; 8 percent) than females in NZDep01-IV (3 percent).
Ethnic
Pacific children obtained a higher proportion of MUFA from Poultry (males 13 percent; females 12 percent) than Mäori males (8 percent) and NZEO children (7 percent). Pies & pasties provided double the proportion of MUFA to the diets of Pacific children (10 percent) than NZEO children (5 percent), and Mäori males obtained a greater proportion from Pies & pasties (8 percent) than NZEO males (5 percent).
Figure A-13: Major sources of MUFA Figure A-14: PUFA from butter
0%
2%
4%
6%
8%
10%
12%
14%
Potatoes, kumara andtaro
Poultry Biscuits
Source
Proportionof MUFA
MäoriPacific
NZEO
0%
2%
4%
6%
8%
10%
12%
14%
16%
I II III IV V
NZDep01 quintile
Proportionof PUFA
MalesFemales
Polyunsaturated fat (PUFA)
New Zealand children
The mean contribution to daily energy from PUFA was similar for males and females across age groups (males 3.8 percent to 3.9 percent; females 3.7 percent to 3.9 percent).
NZDep01
Females in NZDep01-I had a lower mean percent energy from PUFA (3.5 percent) than females in NZDep01-II, IV and V (4 percent; 3.9 percent; 3.9 percent).
NZ Food NZ Children 19
Ethnic
Pacific males had a higher mean percent energy from PUFA (4.2 percent) than Mäori and NZEO males (both 3.8 percent). The mean contribution to daily energy from PUFA was higher in Pacific females (4 percent) than Mäori females (3.7 percent).
Dietary sources of polyunsaturated fat
New Zealand children
The main sources of PUFA in the diets of New Zealand children were Butter & margarine which provided 11 percent, Potatoes, kumara & taro (8 percent), Bread and Nuts & seeds (7 percent), Poultry (6 percent) and Bread based dishes, Biscuits and Cakes & muffins (5 percent). There were no differences between males and females for sources of PUFA across food groups. Older children (11–14 years) obtained a higher proportion of their PUFA from Bread based dishes (males 7 percent; females 6 percent) than children 7–10 years (5 percent; 4 percent) and males 5–6 years (2 percent).
NZDep01
Children in NZDep01-V obtained a higher proportion of their PUFA from Butter & margarine (15 percent) than children in NZDep01-I (males 7 percent; females 6 percent), and females in NZDep01-III (9 percent) and NZDep01-IV (8 percent) (Figure A-14).
Urban-rural
Rural males obtained a greater proportion of their PUFA from Butter & margarine (16 percent) than urban males (10 percent). Rural females obtained a higher proportion of their PUFA from Nuts & seeds (11 percent) than urban females (6 percent).
Ethnic
Pacific children obtained a greater proportion of their PUFA from Butter & margarine (males 14 percent; females 15 percent) than NZEO children (9 percent; 10 percent) and Mäori males (15 percent). NZEO children obtained double the proportion of PUFA (8 percent) from Nuts & seeds than Pacific children (4 percent) and Mäori males (5 percent).
Cholesterol
New Zealand children
The usual median daily intake of cholesterol ranged from 170 mg (5–6 years) to 263 mg (11–14 years) for males and from 147 mg (5–6 years) to 198 mg (11–14 years) for females.
20 NZ Food NZ Children
NZDep01
The median daily cholesterol intake of females was lower in NZDep01-I (152 mg) than females in NZDep01-II (200 mg), III (178 mg), IV (180 mg) and V (203 mg).
Ethnic
Mäori children had a higher median daily intake of cholesterol (males 244 mg; females 208 mg) than NZEO children (213 mg; 172 mg). Pacific females had a higher intake (207 mg) than NZEO females (172 mg). Pacific males 7–10 years had a higher median intake (229 mg) than NZEO males of the same age (198 mg).
Dietary sources of cholesterol
New Zealand children
The main sources of cholesterol in the diets of New Zealand children were Eggs & egg dishes (17 percent), Poultry (14 percent), Milk (9 percent) and Beef & veal (8 percent). Males obtained a greater proportion of their cholesterol from Sausages & processed meats (7 percent) than females (4 percent). Eggs & egg dishes were a greater source of cholesterol for males 5–6 years (20 percent) than males 11–14 years (15 percent). Younger females (5–6 years) obtained a greater proportion of their cholesterol from Milk (13 percent) than older females (7–10 years, 8 percent; 11–14 years, 7 percent).
NZDep01
Males in NZDep01-I and II (13 percent; 14 percent) and females in NZDep01-I (13 percent) obtained a lower proportion of their cholesterol from Eggs & egg dishes than males and females in NZDep01-V (22 percent; 21 percent). Beef & veal was a greater source of cholesterol for females in NZDep01-IV (11 percent) than females in NZDep01-I (5 percent). Females in NZDep01-I and II (12 percent) obtained a greater proportion of their cholesterol from Cakes & muffins than females in NZDep01-III to V (4 percent).
Urban-rural
Urban children obtained more cholesterol from Eggs & egg dishes (18 percent) than rural children (11 percent). Rural females obtained more cholesterol from Beef & veal (11 percent) than urban females (7 percent). Rural males obtained more cholesterol from Cakes & muffins (9 percent) than urban males (5 percent).
Ethnic
NZEO children obtained a lower proportion of their cholesterol from Eggs & egg dishes (males 13 percent; females 15 percent) than Pacific children (23 percent; 25 percent) and Mäori males (23 percent).
NZ Food NZ Children 21
Poultry provided more cholesterol to Pacific children (males 21 percent; females 20 percent) than Mäori (12 percent; 14 percent) and NZEO children (13 percent). Twice the proportion of cholesterol was obtained from Milk by NZEO males (10 percent) compared with Pacific males (5 percent).

22 NZ Food NZ Children
A5 Total carbohydrate and starch Tables A3.1, A15
Total carbohydrate
New Zealand children
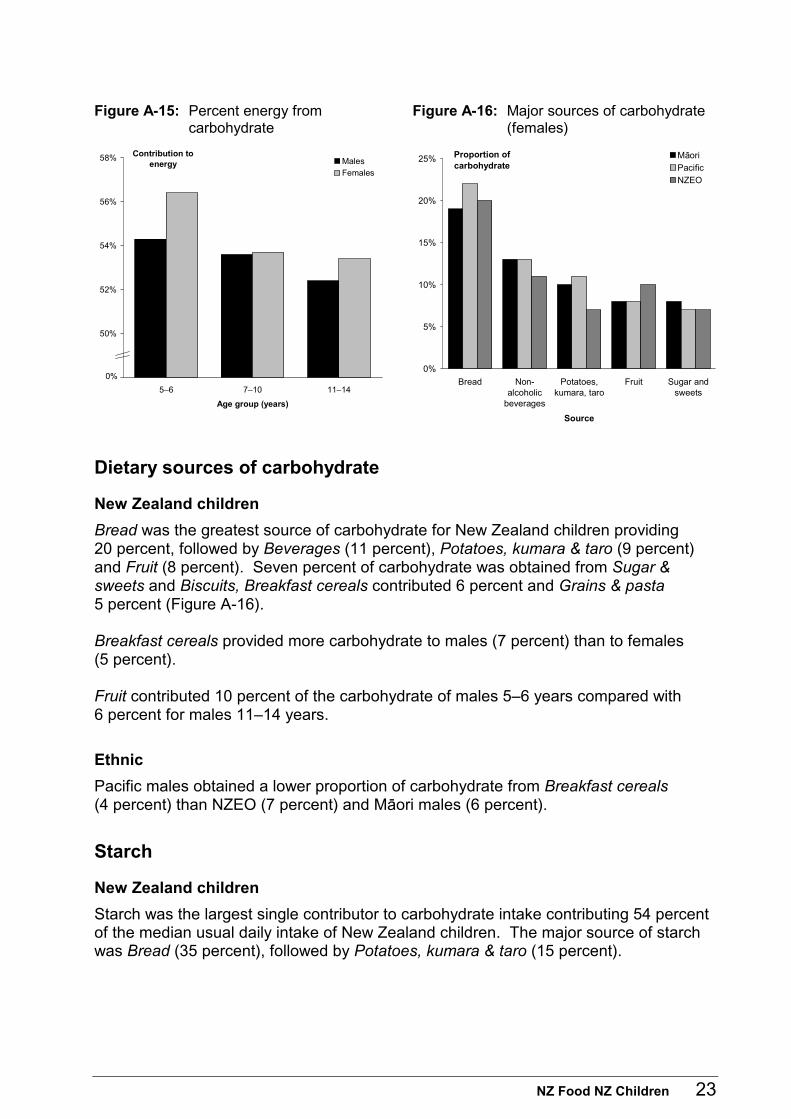
The median usual daily intake of carbohydrate for New Zealand children ranged from 244 g (5–6 years) to 322 g (11–14 years) for males, and from 225 g (5–6 years) to 265 g (11–14 years) for females. The mean contribution to daily energy intake from carbohydrate was similar for males (53.3 percent) and females (54.1 percent). New Zealand children 11–14 years had a lower mean contribution to daily energy from carbohydrate (males 52.4 percent; females 53.4 percent) than children aged 5–6 (54.3 percent; 56.4 percent) (Figure A-15). This trend was seen among NZEO females and Pacific children, but not Mäori children.
NZDep01
Among females the mean percent contribution to energy from carbohydrate decreased from NZDep01-I (56 percent) to NZDep01-V (53.1 percent).
Ethnic
Mäori males had higher median usual intakes of carbohydrate (305 g) than NZEO (285 g) and Pacific males (272 g). NZEO children (males 53.7 percent; females 54.5 percent) had a higher mean contribution to daily energy intake from carbohydrate than Pacific children (51.9 percent; 52.9 percent).
Nutrient adequacy
Overall, 66 percent of New Zealand children met the New Zealand Nutrition Taskforce guideline (Department of Health, 1991) for carbohydrate intake (males 65 percent; females 68 percent). Younger children (5–6 years) were more likely to meet the guideline (males 73 percent; females 80 percent) than children 11–14 years (60 percent; 63 percent). This reflected the decrease in mean contribution to daily energy from carbohydrate with increasing age. The group most likely to meet the guideline was NZEO females 5–6 years (87 percent).
NZ Food NZ Children 23
Figure A-15: Percent energy from carbohydrate
Figure A-16: Major sources of carbohydrate (females)
48%
50%
52%
54%
56%
58%
5–6 7–10 11–14
Age group (years)
Contribution to energy Males
Females
0%0%
5%
10%
15%
20%
25%
Bread Non-alcoholic
beverages
Potatoes,kumara, taro
Fruit Sugar andsweets
Source
Proportion of carbohydrate
Mäori
Pacific
NZEO
Dietary sources of carbohydrate
New Zealand children
Bread was the greatest source of carbohydrate for New Zealand children providing 20 percent, followed by Beverages (11 percent), Potatoes, kumara & taro (9 percent) and Fruit (8 percent). Seven percent of carbohydrate was obtained from Sugar & sweets and Biscuits, Breakfast cereals contributed 6 percent and Grains & pasta 5 percent (Figure A-16). Breakfast cereals provided more carbohydrate to males (7 percent) than to females (5 percent). Fruit contributed 10 percent of the carbohydrate of males 5–6 years compared with 6 percent for males 11–14 years.
Ethnic
Pacific males obtained a lower proportion of carbohydrate from Breakfast cereals (4 percent) than NZEO (7 percent) and Mäori males (6 percent).
Starch
New Zealand children
Starch was the largest single contributor to carbohydrate intake contributing 54 percent of the median usual daily intake of New Zealand children. The major source of starch was Bread (35 percent), followed by Potatoes, kumara & taro (15 percent).
24 NZ Food NZ Children
NZDep01
The median usual daily intake of starch was higher for females in NZDep01-V (146 g) than females in NZDep01-I (119 g).
Ethnic
Mäori children (males 168 g; females 147 g) had higher median usual daily intakes of starch than NZEO children (155 g; 128 g). Mäori males (168 g) had higher intakes of starch than Pacific males (160 g).
NZ Food NZ Children 25
A6 Total sugars Tables A3.2, A3.3, A16, A17
Nutrient intakes
New Zealand children
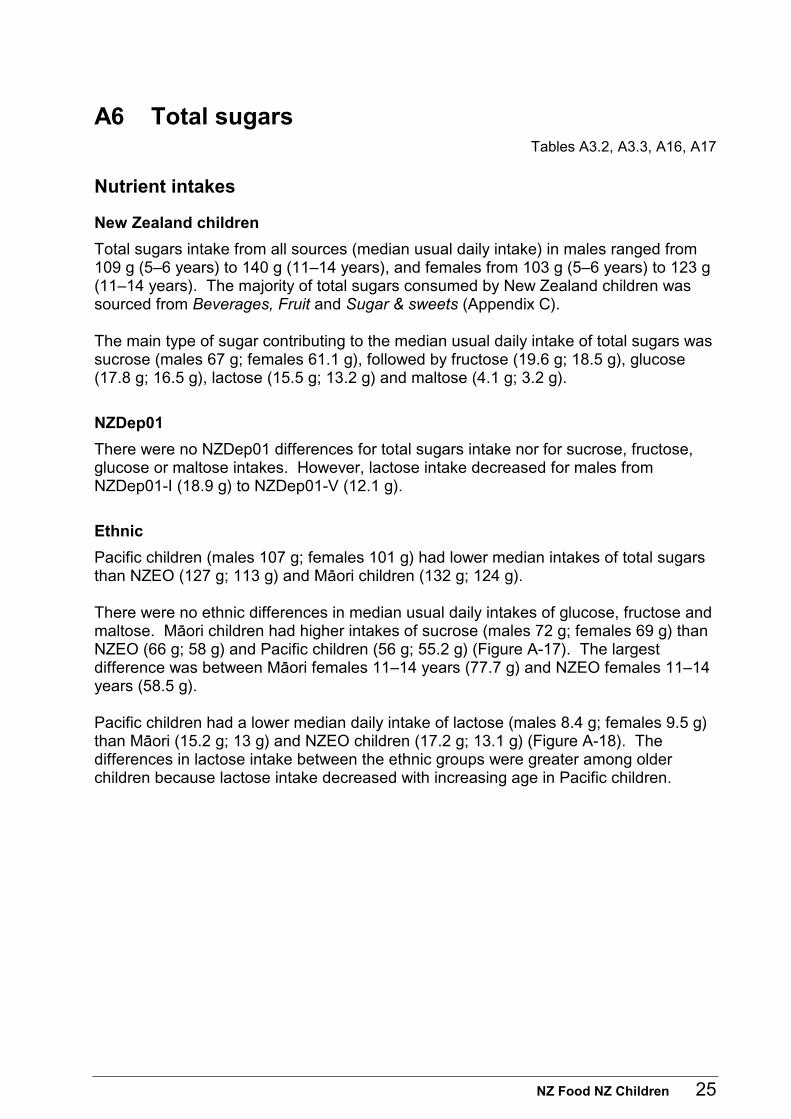
Total sugars intake from all sources (median usual daily intake) in males ranged from 109 g (5–6 years) to 140 g (11–14 years), and females from 103 g (5–6 years) to 123 g (11–14 years). The majority of total sugars consumed by New Zealand children was sourced from Beverages, Fruit and Sugar & sweets (Appendix C). The main type of sugar contributing to the median usual daily intake of total sugars was sucrose (males 67 g; females 61.1 g), followed by fructose (19.6 g; 18.5 g), glucose (17.8 g; 16.5 g), lactose (15.5 g; 13.2 g) and maltose (4.1 g; 3.2 g).
NZDep01
There were no NZDep01 differences for total sugars intake nor for sucrose, fructose, glucose or maltose intakes. However, lactose intake decreased for males from NZDep01-I (18.9 g) to NZDep01-V (12.1 g).
Ethnic
Pacific children (males 107 g; females 101 g) had lower median intakes of total sugars than NZEO (127 g; 113 g) and Mäori children (132 g; 124 g). There were no ethnic differences in median usual daily intakes of glucose, fructose and maltose. Mäori children had higher intakes of sucrose (males 72 g; females 69 g) than NZEO (66 g; 58 g) and Pacific children (56 g; 55.2 g) (Figure A-17). The largest difference was between Mäori females 11–14 years (77.7 g) and NZEO females 11–14 years (58.5 g). Pacific children had a lower median daily intake of lactose (males 8.4 g; females 9.5 g) than Mäori (15.2 g; 13 g) and NZEO children (17.2 g; 13.1 g) (Figure A-18). The differences in lactose intake between the ethnic groups were greater among older children because lactose intake decreased with increasing age in Pacific children.
26 NZ Food NZ Children
Figure A-17: Median sucrose intake Figure A-18: Median lactose intake
50
55
60
65
70
75
80
Mäori Pacific NZEO
Ethnic group
Median (g)Males
Females
00
5
10
15
20
Mäori Pacific NZEO
Ethnic group
Median (g)Males
Females
Dietary sources of sucrose
New Zealand children
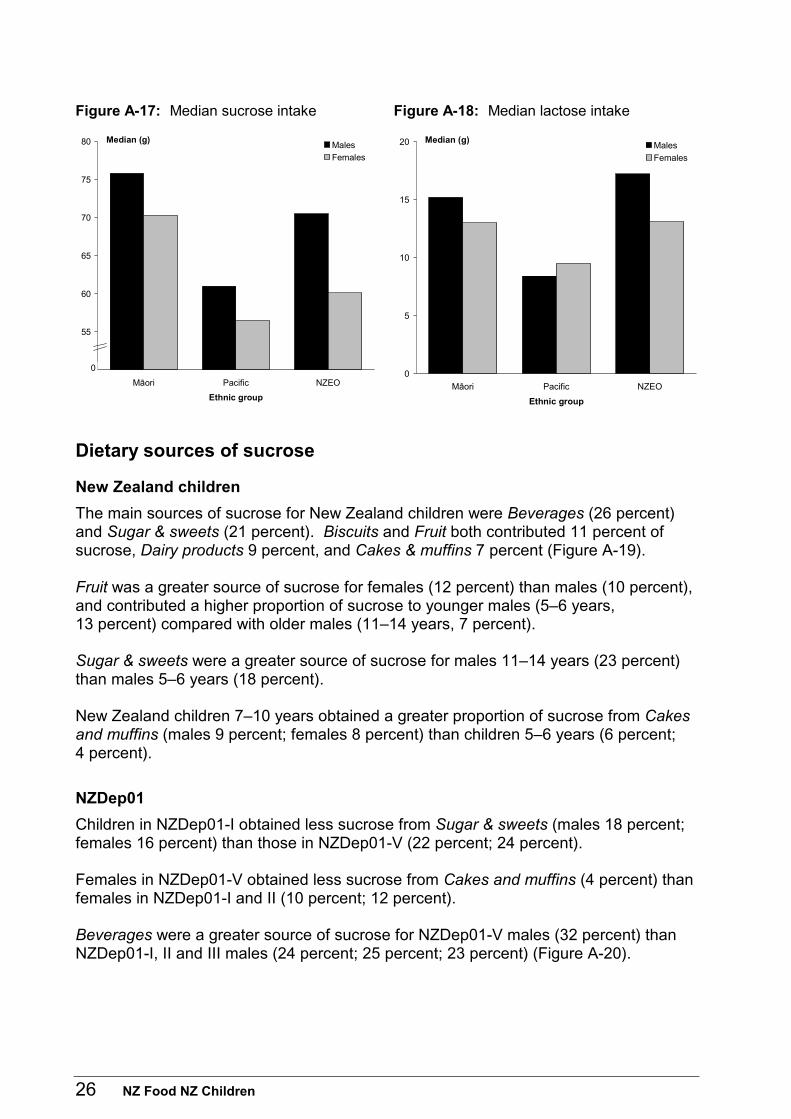
The main sources of sucrose for New Zealand children were Beverages (26 percent) and Sugar & sweets (21 percent). Biscuits and Fruit both contributed 11 percent of sucrose, Dairy products 9 percent, and Cakes & muffins 7 percent (Figure A-19). Fruit was a greater source of sucrose for females (12 percent) than males (10 percent), and contributed a higher proportion of sucrose to younger males (5–6 years, 13 percent) compared with older males (11–14 years, 7 percent). Sugar & sweets were a greater source of sucrose for males 11–14 years (23 percent) than males 5–6 years (18 percent). New Zealand children 7–10 years obtained a greater proportion of sucrose from Cakes and muffins (males 9 percent; females 8 percent) than children 5–6 years (6 percent; 4 percent).
NZDep01
Children in NZDep01-I obtained less sucrose from Sugar & sweets (males 18 percent; females 16 percent) than those in NZDep01-V (22 percent; 24 percent). Females in NZDep01-V obtained less sucrose from Cakes and muffins (4 percent) than females in NZDep01-I and II (10 percent; 12 percent). Beverages were a greater source of sucrose for NZDep01-V males (32 percent) than NZDep01-I, II and III males (24 percent; 25 percent; 23 percent) (Figure A-20).
NZ Food NZ Children 27
Ethnic
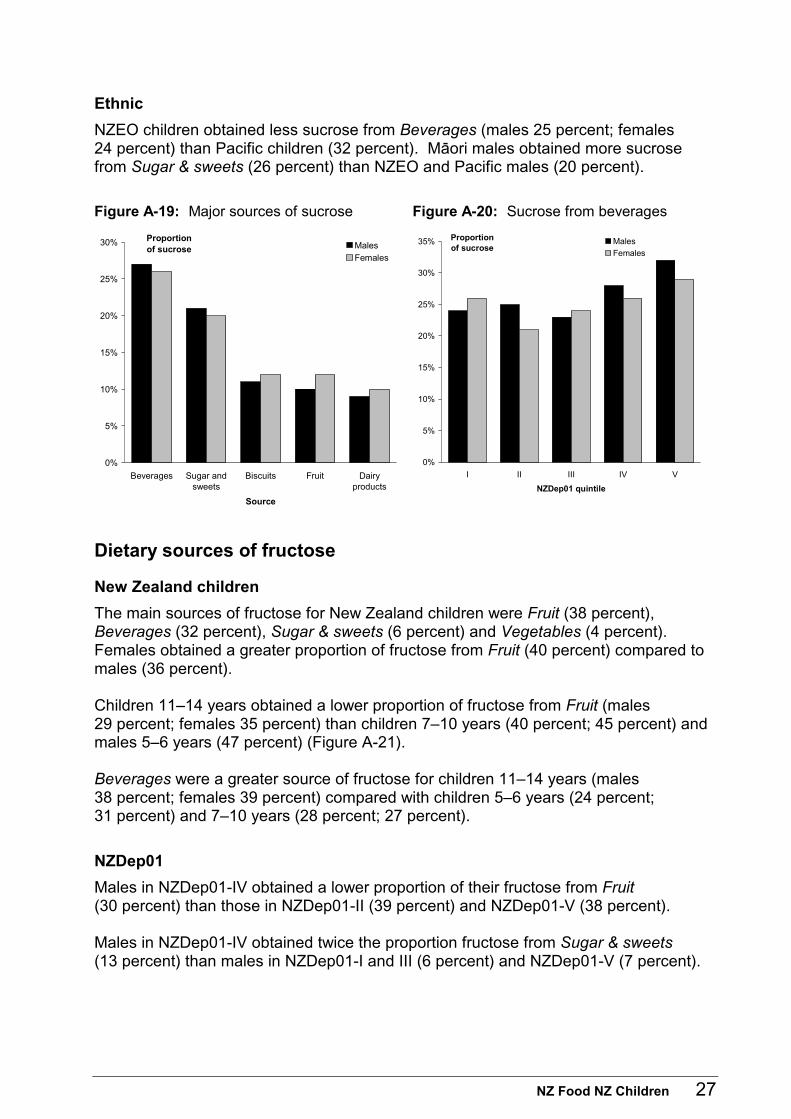
NZEO children obtained less sucrose from Beverages (males 25 percent; females 24 percent) than Pacific children (32 percent). Mäori males obtained more sucrose from Sugar & sweets (26 percent) than NZEO and Pacific males (20 percent).
Figure A-19: Major sources of sucrose Figure A-20: Sucrose from beverages
0%
5%
10%
15%
20%
25%
30%
Beverages Sugar andsweets
Biscuits Fruit Dairyproducts
Source
Proportionof sucrose Males
Females
0%
5%
10%
15%
20%
25%
30%
35%
I II III IV V
NZDep01 quintile
Proportionof sucrose
Males
Females
Dietary sources of fructose
New Zealand children
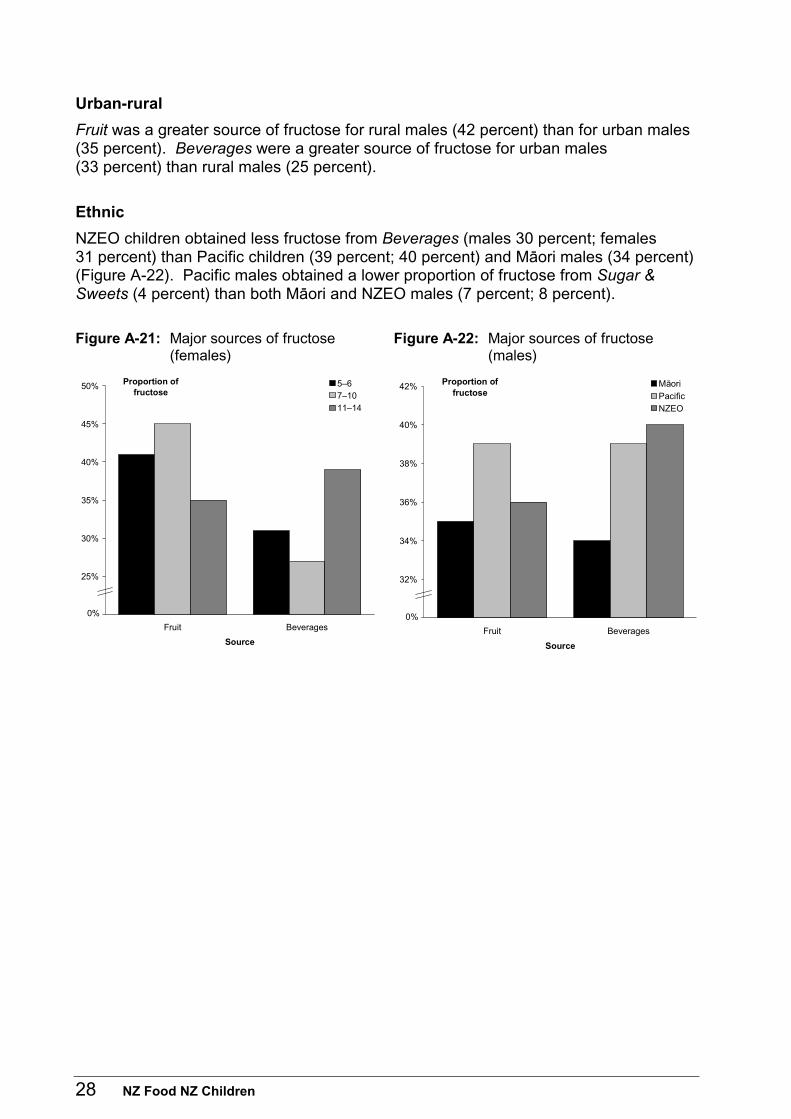
The main sources of fructose for New Zealand children were Fruit (38 percent), Beverages (32 percent), Sugar & sweets (6 percent) and Vegetables (4 percent). Females obtained a greater proportion of fructose from Fruit (40 percent) compared to males (36 percent). Children 11–14 years obtained a lower proportion of fructose from Fruit (males 29 percent; females 35 percent) than children 7–10 years (40 percent; 45 percent) and males 5–6 years (47 percent) (Figure A-21). Beverages were a greater source of fructose for children 11–14 years (males 38 percent; females 39 percent) compared with children 5–6 years (24 percent; 31 percent) and 7–10 years (28 percent; 27 percent).
NZDep01
Males in NZDep01-IV obtained a lower proportion of their fructose from Fruit (30 percent) than those in NZDep01-II (39 percent) and NZDep01-V (38 percent). Males in NZDep01-IV obtained twice the proportion fructose from Sugar & sweets (13 percent) than males in NZDep01-I and III (6 percent) and NZDep01-V (7 percent).
28 NZ Food NZ Children
Urban-rural
Fruit was a greater source of fructose for rural males (42 percent) than for urban males (35 percent). Beverages were a greater source of fructose for urban males (33 percent) than rural males (25 percent).
Ethnic
NZEO children obtained less fructose from Beverages (males 30 percent; females 31 percent) than Pacific children (39 percent; 40 percent) and Mäori males (34 percent) (Figure A-22). Pacific males obtained a lower proportion of fructose from Sugar & Sweets (4 percent) than both Mäori and NZEO males (7 percent; 8 percent).
Figure A-21: Major sources of fructose (females)
Figure A-22: Major sources of fructose (males)
20%
25%
30%
35%
40%
45%
50%
Fruit Beverages
Source
Proportion of fructose
5–67–10
11–14
0%30%
32%
34%
36%
38%
40%
42%
Fruit Beverages
Source
Proportion of fructose
Māori
Pacific
NZEO
0%
NZ Food NZ Children 29
A7 Dietary fibre Tables A4, A18
Nutrient intake
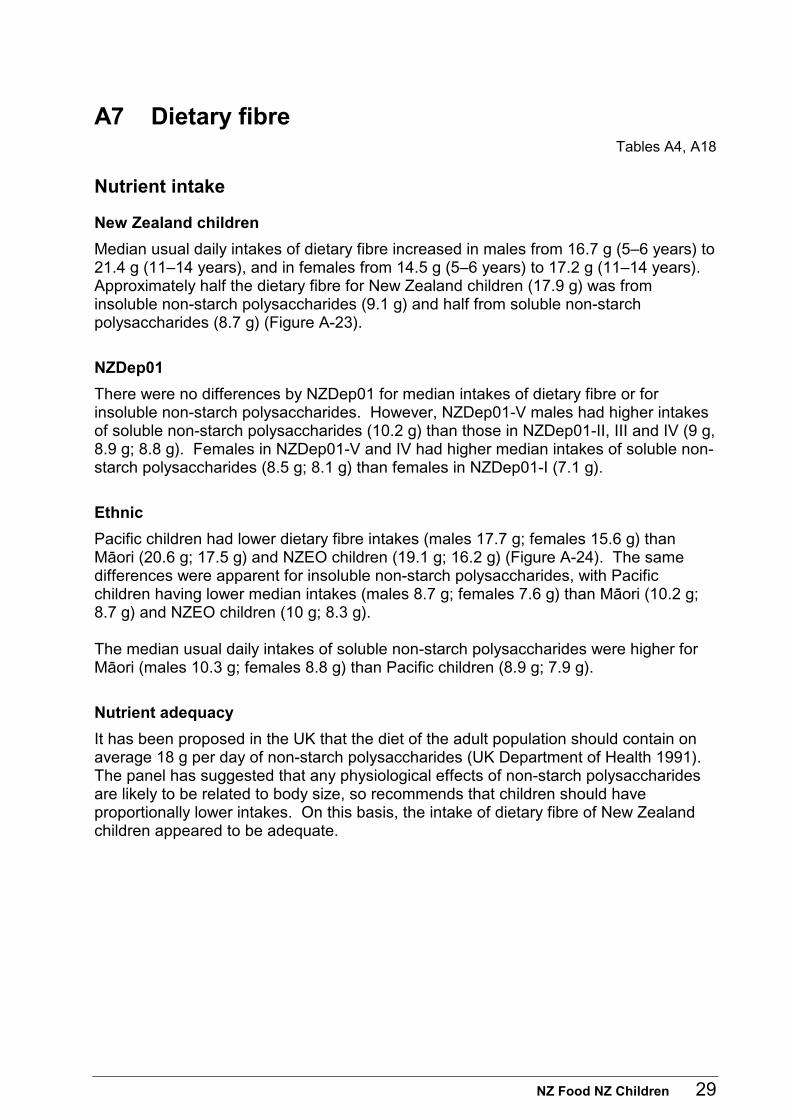
New Zealand children
Median usual daily intakes of dietary fibre increased in males from 16.7 g (5–6 years) to 21.4 g (11–14 years), and in females from 14.5 g (5–6 years) to 17.2 g (11–14 years). Approximately half the dietary fibre for New Zealand children (17.9 g) was from insoluble non-starch polysaccharides (9.1 g) and half from soluble non-starch polysaccharides (8.7 g) (Figure A-23).
NZDep01
There were no differences by NZDep01 for median intakes of dietary fibre or for insoluble non-starch polysaccharides. However, NZDep01-V males had higher intakes of soluble non-starch polysaccharides (10.2 g) than those in NZDep01-II, III and IV (9 g, 8.9 g; 8.8 g). Females in NZDep01-V and IV had higher median intakes of soluble non-starch polysaccharides (8.5 g; 8.1 g) than females in NZDep01-I (7.1 g).
Ethnic
Pacific children had lower dietary fibre intakes (males 17.7 g; females 15.6 g) than Mäori (20.6 g; 17.5 g) and NZEO children (19.1 g; 16.2 g) (Figure A-24). The same differences were apparent for insoluble non-starch polysaccharides, with Pacific children having lower median intakes (males 8.7 g; females 7.6 g) than Mäori (10.2 g; 8.7 g) and NZEO children (10 g; 8.3 g). The median usual daily intakes of soluble non-starch polysaccharides were higher for Mäori (males 10.3 g; females 8.8 g) than Pacific children (8.9 g; 7.9 g).
Nutrient adequacy
It has been proposed in the UK that the diet of the adult population should contain on average 18 g per day of non-starch polysaccharides (UK Department of Health 1991). The panel has suggested that any physiological effects of non-starch polysaccharides are likely to be related to body size, so recommends that children should have proportionally lower intakes. On this basis, the intake of dietary fibre of New Zealand children appeared to be adequate.
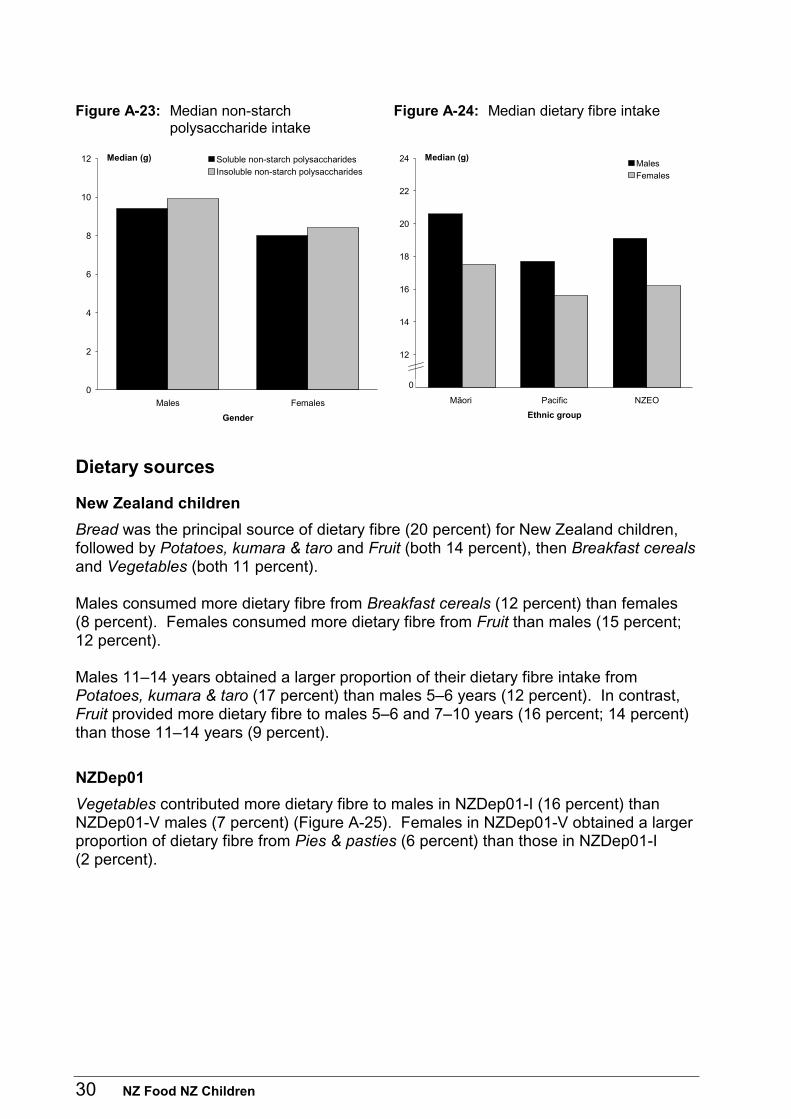
30 NZ Food NZ Children
Figure A-23: Median non-starch polysaccharide intake
Figure A-24: Median dietary fibre intake
0
2
4
6
8
10
12
Males Females
Gender
Median (g) Soluble non-starch polysaccharides
Insoluble non-starch polysaccharides
10
12
14
16
18
20
22
24
Māori Pacific NZEO
Ethnic group
Median (g)MalesFemales
0
Dietary sources
New Zealand children
Bread was the principal source of dietary fibre (20 percent) for New Zealand children, followed by Potatoes, kumara & taro and Fruit (both 14 percent), then Breakfast cereals and Vegetables (both 11 percent). Males consumed more dietary fibre from Breakfast cereals (12 percent) than females (8 percent). Females consumed more dietary fibre from Fruit than males (15 percent; 12 percent). Males 11–14 years obtained a larger proportion of their dietary fibre intake from Potatoes, kumara & taro (17 percent) than males 5–6 years (12 percent). In contrast, Fruit provided more dietary fibre to males 5–6 and 7–10 years (16 percent; 14 percent) than those 11–14 years (9 percent).
NZDep01
Vegetables contributed more dietary fibre to males in NZDep01-I (16 percent) than NZDep01-V males (7 percent) (Figure A-25). Females in NZDep01-V obtained a larger proportion of dietary fibre from Pies & pasties (6 percent) than those in NZDep01-I (2 percent).
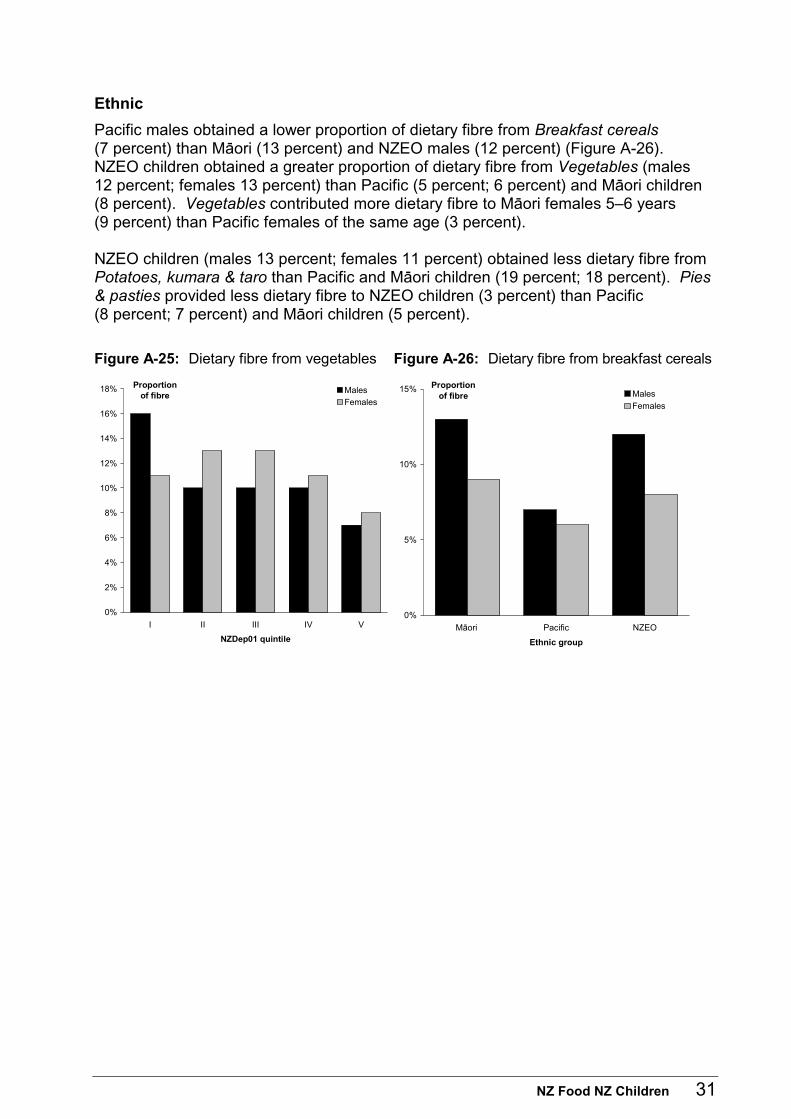
NZ Food NZ Children 31
Ethnic
Pacific males obtained a lower proportion of dietary fibre from Breakfast cereals (7 percent) than Mäori (13 percent) and NZEO males (12 percent) (Figure A-26). NZEO children obtained a greater proportion of dietary fibre from Vegetables (males 12 percent; females 13 percent) than Pacific (5 percent; 6 percent) and Mäori children (8 percent). Vegetables contributed more dietary fibre to Mäori females 5–6 years (9 percent) than Pacific females of the same age (3 percent). NZEO children (males 13 percent; females 11 percent) obtained less dietary fibre from Potatoes, kumara & taro than Pacific and Mäori children (19 percent; 18 percent). Pies & pasties provided less dietary fibre to NZEO children (3 percent) than Pacific (8 percent; 7 percent) and Mäori children (5 percent).
Figure A-25: Dietary fibre from vegetables Figure A-26: Dietary fibre from breakfast cereals
0%
2%
4%
6%
8%
10%
12%
14%
16%
18%
I II III IV V
NZDep01 quintile
Proportionof fibre
Males
Females
0%
5%
10%
15%
Māori Pacific NZEO
Ethnic group
Proportionof fibre Males
Females
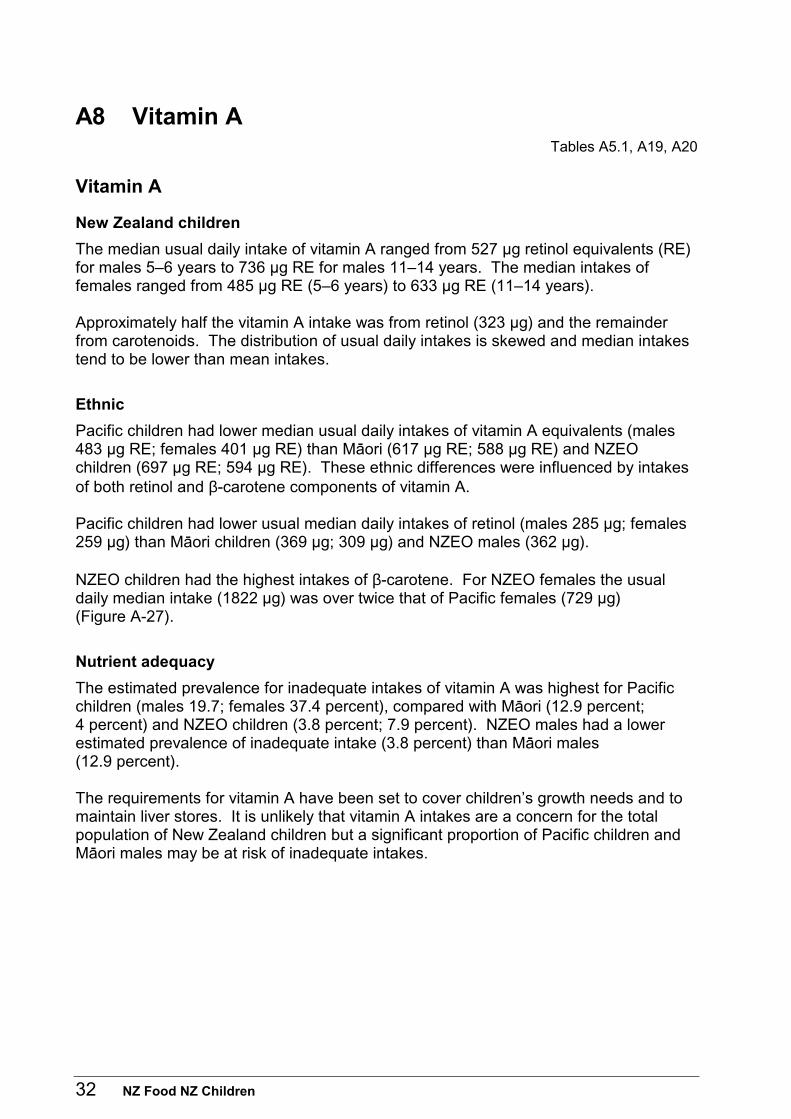
32 NZ Food NZ Children
A8 Vitamin A Tables A5.1, A19, A20
Vitamin A
New Zealand children
The median usual daily intake of vitamin A ranged from 527 µg retinol equivalents (RE) for males 5–6 years to 736 µg RE for males 11–14 years. The median intakes of females ranged from 485 µg RE (5–6 years) to 633 µg RE (11–14 years). Approximately half the vitamin A intake was from retinol (323 µg) and the remainder from carotenoids. The distribution of usual daily intakes is skewed and median intakes tend to be lower than mean intakes.
Ethnic
Pacific children had lower median usual daily intakes of vitamin A equivalents (males 483 µg RE; females 401 µg RE) than Mäori (617 µg RE; 588 µg RE) and NZEO children (697 µg RE; 594 µg RE). These ethnic differences were influenced by intakes of both retinol and β-carotene components of vitamin A. Pacific children had lower usual median daily intakes of retinol (males 285 µg; females 259 µg) than Mäori children (369 µg; 309 µg) and NZEO males (362 µg). NZEO children had the highest intakes of β-carotene. For NZEO females the usual daily median intake (1822 µg) was over twice that of Pacific females (729 µg) (Figure A-27).
Nutrient adequacy
The estimated prevalence for inadequate intakes of vitamin A was highest for Pacific children (males 19.7; females 37.4 percent), compared with Mäori (12.9 percent; 4 percent) and NZEO children (3.8 percent; 7.9 percent). NZEO males had a lower estimated prevalence of inadequate intake (3.8 percent) than Mäori males (12.9 percent). The requirements for vitamin A have been set to cover children’s growth needs and to maintain liver stores. It is unlikely that vitamin A intakes are a concern for the total population of New Zealand children but a significant proportion of Pacific children and Mäori males may be at risk of inadequate intakes.
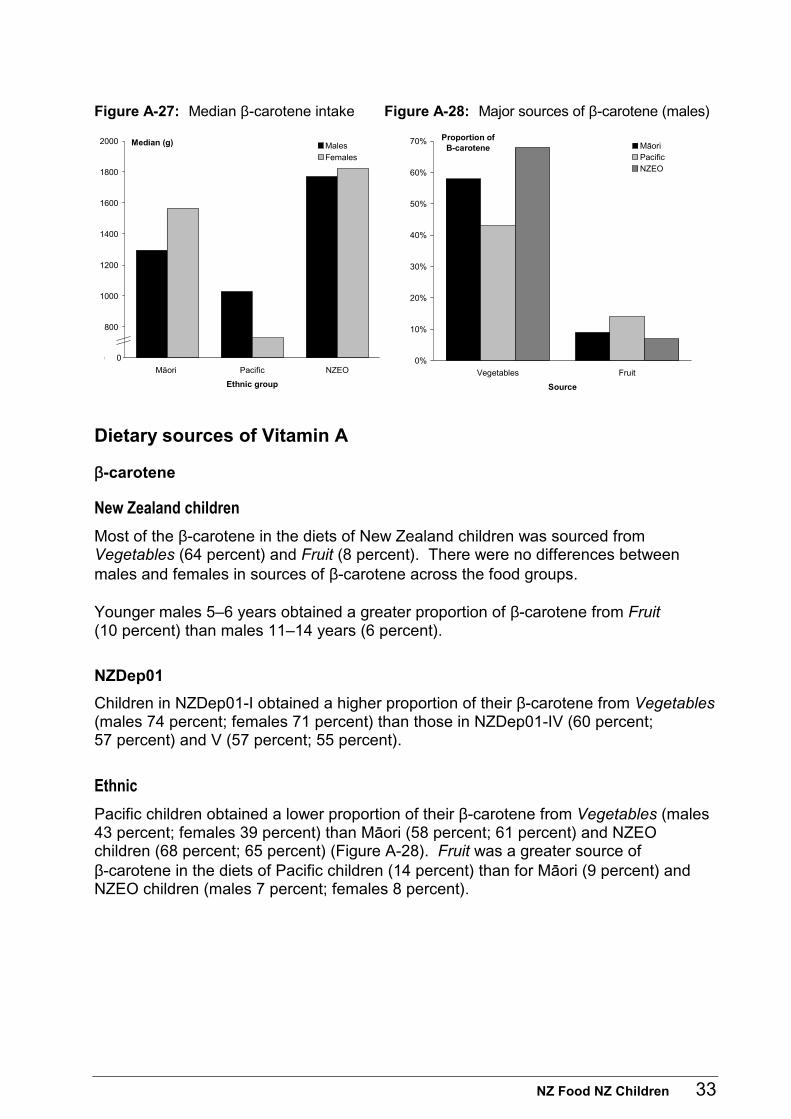
NZ Food NZ Children 33
Figure A-27: Median β-carotene intake Figure A-28: Major sources of β-carotene (males)
600
800
1000
1200
1400
1600
1800
2000
Māori Pacific NZEO
Ethnic group
Median (g) Males
Females
0 0%
10%
20%
30%
40%
50%
60%
70%
Vegetables Fruit
Source
Proportion ofB-carotene Māori
PacificNZEO
Dietary sources of Vitamin A
β-carotene
New Zealand children Most of the β-carotene in the diets of New Zealand children was sourced from Vegetables (64 percent) and Fruit (8 percent). There were no differences between males and females in sources of β-carotene across the food groups. Younger males 5–6 years obtained a greater proportion of β-carotene from Fruit (10 percent) than males 11–14 years (6 percent).
NZDep01
Children in NZDep01-I obtained a higher proportion of their β-carotene from Vegetables (males 74 percent; females 71 percent) than those in NZDep01-IV (60 percent; 57 percent) and V (57 percent; 55 percent).
Ethnic Pacific children obtained a lower proportion of their β-carotene from Vegetables (males 43 percent; females 39 percent) than Mäori (58 percent; 61 percent) and NZEO children (68 percent; 65 percent) (Figure A-28). Fruit was a greater source of β-carotene in the diets of Pacific children (14 percent) than for Mäori (9 percent) and NZEO children (males 7 percent; females 8 percent).
34 NZ Food NZ Children
Retinol
New Zealand children Milk (23 percent), Butter & margarine (12 percent) and Dairy products (9 percent) were the main sources of retinol in the diets of New Zealand children. Sources of retinol were similar for males and females. Females 5–6 years obtained a greater proportion of their retinol from Milk (30 percent) than females 7–10 years (22 percent) and 11–14 years (18 percent). Younger males (5–6 years and 7–10 years) also obtained a higher proportion of their retinol from Milk (26 percent) than males 11–14 years (20 percent).
NZDep01 Males in NZDep01-I to IV and females in NZDep01-I, III and IV obtained a lower proportion of their retinol from Butter & margarine than those in NZDep01-V. Cakes & muffins were a greater source of retinol for females in NZDep01-1 and II (9 percent) than females in NZDep01-IV and V (4 percent; 3 percent).
Ethnic The proportion of retinol obtained from Milk was higher for NZEO males (25 percent) than Pacific males (18 percent). NZEO children obtained a lower proportion of their retinol intake from Butter & margarine (10 percent) than Mäori (males 17 percent; females 14 percent) and Pacific children (17 percent). Eggs & egg dishes provided a lower proportion of retinol for NZEO males (4 percent) than Mäori (9 percent) and Pacific males (12 percent). Mäori and NZEO females (6 percent; 5 percent) obtained a lower proportion of their retinol intake from Eggs & egg dishes than Pacific females (11 percent).
NZ Food NZ Children 35
A9 Vitamin C Tables A5.2, A21
New Zealand children
The median usual daily intake for males ranged from 98 mg (5–6 years) to 116 mg (7–10 years), and for females from 96 mg (5–6 years) to 108 mg (11–14 years).
Ethnic
Pacific males had a lower median usual daily intake (75 mg) than NZEO and Mäori males (111 mg; 106 mg). Pacific females had a lower intake (81 mg) than NZEO females (112 mg) (Figure A-29).
Nutrient adequacy
The prevalence of inadequate intake was very low in New Zealand children (0.1 percent). Pacific males had a higher prevalence of inadequate intake (3.7 percent) than Mäori and NZEO males (0.3 percent; 0.4 percent). No appreciable risk of inadequate intake was evident in any group assessed.
Dietary sources of Vitamin C
New Zealand children
The main sources of vitamin C in the diets of New Zealand children were Beverages (37 percent), Fruit (25 percent) and Vegetables (11 percent) (Figure A-30). Males obtained a lower proportion of vitamin C from Beverages (35 percent) and Fruit (22 percent) than females (Beverages 39 percent; Fruit 27 percent). Fruit was a greater source of vitamin C for males 5–6 years and 7–10 years (28 percent; 25 percent) than males 11–14 years (16 percent). Males 11–14 years obtained a greater proportion of their vitamin C from Vegetables (14 percent) than males 5–6 years and 7–10 years (10 percent).
NZDep01
Males in NZDep01-I and IV obtained a lower proportion of vitamin C from Fruit (18 percent) than those in NZDep01-V (28 percent). Vegetables were a greater source of vitamin C for males in NZDep01-III (14 percent) than males in NZDep01-V (9 percent). Females in NZDep01-IV (14 percent) obtained more vitamin C from Vegetables than those in NZDep01-I (7 percent). Potatoes, kumara & taro were a greater source of vitamin C for females in NZDep01-IV (11 percent) than females in NZDep01-I (6 percent).
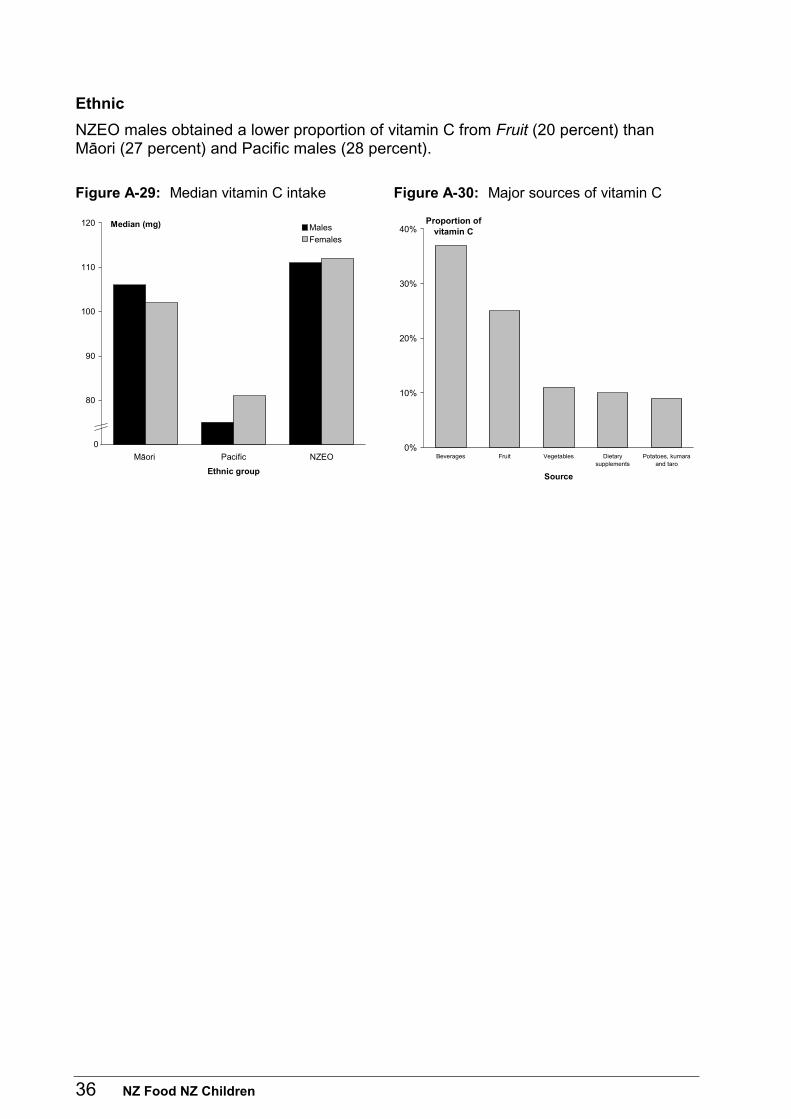
36 NZ Food NZ Children
Ethnic
NZEO males obtained a lower proportion of vitamin C from Fruit (20 percent) than Mäori (27 percent) and Pacific males (28 percent).
Figure A-29: Median vitamin C intake Figure A-30: Major sources of vitamin C
70
80
90
100
110
120
Māori Pacific NZEO
Ethnic group
Median (mg) Males
Females
0
0%
10%
20%
30%
40%
Beverages Fruit Vegetables Dietarysupplements
Potatoes, kumaraand taro
Source
Proportion ofvitamin C
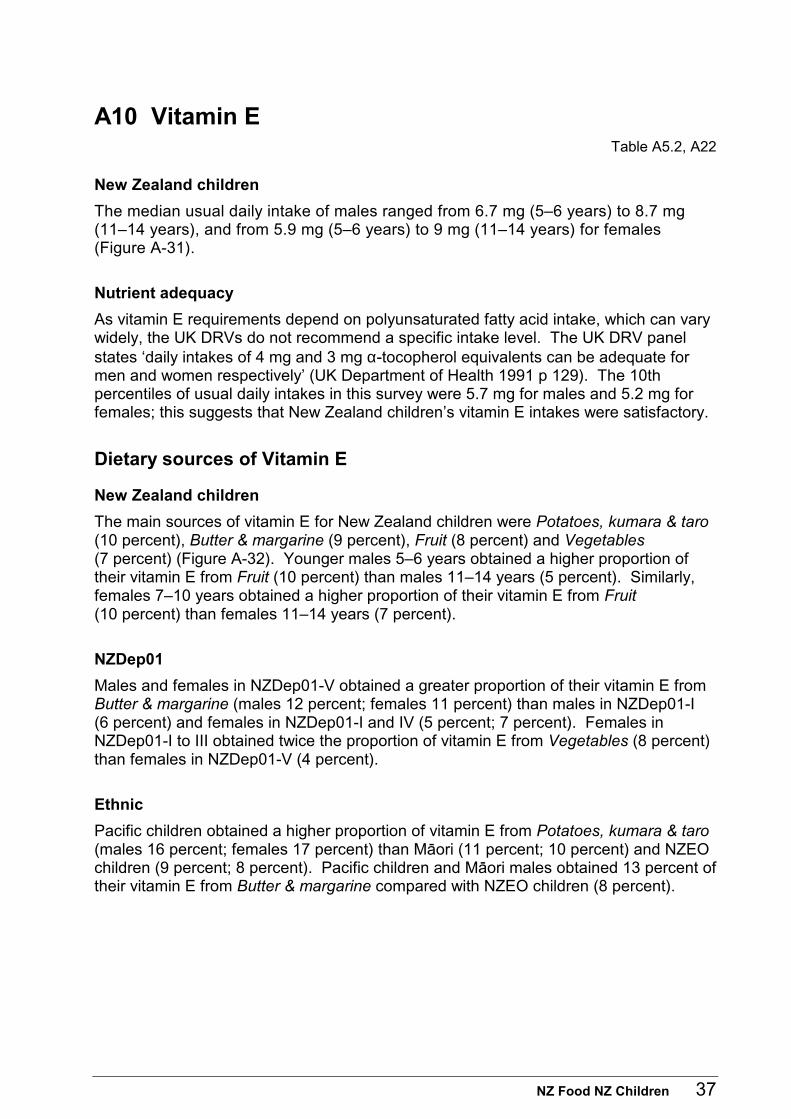
NZ Food NZ Children 37
A10 Vitamin E Table A5.2, A22
New Zealand children
The median usual daily intake of males ranged from 6.7 mg (5–6 years) to 8.7 mg (11–14 years), and from 5.9 mg (5–6 years) to 9 mg (11–14 years) for females (Figure A-31).
Nutrient adequacy
As vitamin E requirements depend on polyunsaturated fatty acid intake, which can vary widely, the UK DRVs do not recommend a specific intake level. The UK DRV panel states ‘daily intakes of 4 mg and 3 mg α-tocopherol equivalents can be adequate for men and women respectively’ (UK Department of Health 1991 p 129). The 10th percentiles of usual daily intakes in this survey were 5.7 mg for males and 5.2 mg for females; this suggests that New Zealand children’s vitamin E intakes were satisfactory.
Dietary sources of Vitamin E
New Zealand children
The main sources of vitamin E for New Zealand children were Potatoes, kumara & taro (10 percent), Butter & margarine (9 percent), Fruit (8 percent) and Vegetables (7 percent) (Figure A-32). Younger males 5–6 years obtained a higher proportion of their vitamin E from Fruit (10 percent) than males 11–14 years (5 percent). Similarly, females 7–10 years obtained a higher proportion of their vitamin E from Fruit (10 percent) than females 11–14 years (7 percent).
NZDep01
Males and females in NZDep01-V obtained a greater proportion of their vitamin E from Butter & margarine (males 12 percent; females 11 percent) than males in NZDep01-I (6 percent) and females in NZDep01-I and IV (5 percent; 7 percent). Females in NZDep01-I to III obtained twice the proportion of vitamin E from Vegetables (8 percent) than females in NZDep01-V (4 percent).
Ethnic
Pacific children obtained a higher proportion of vitamin E from Potatoes, kumara & taro (males 16 percent; females 17 percent) than Mäori (11 percent; 10 percent) and NZEO children (9 percent; 8 percent). Pacific children and Mäori males obtained 13 percent of their vitamin E from Butter & margarine compared with NZEO children (8 percent).
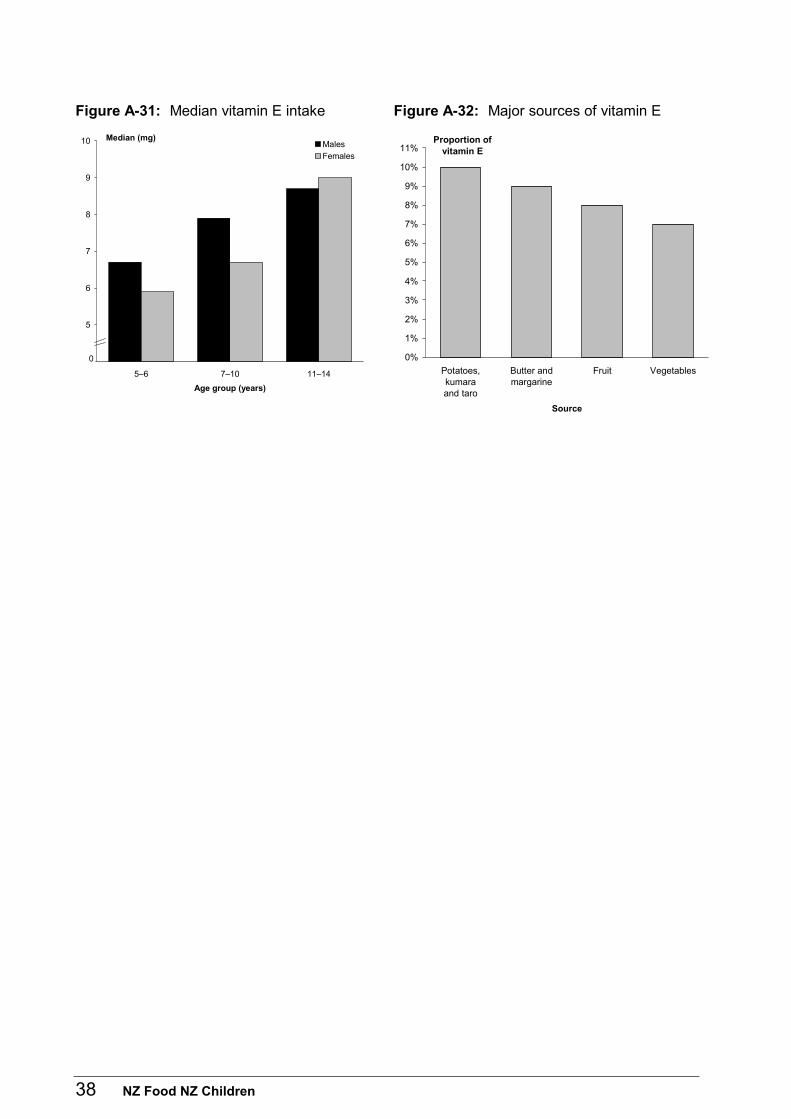
38 NZ Food NZ Children
Figure A-31: Median vitamin E intake Figure A-32: Major sources of vitamin E
4
5
6
7
8
9
10
5–6 7–10 11–14
Age group (years)
Median (mg)Males
Females
0 0%
1%
2%
3%
4%
5%
6%
7%
8%
9%
10%
11%
Potatoes,kumaraand taro
Butter andmargarine
Fruit Vegetables
Source
Proportion ofvitamin E
NZ Food NZ Children 39
A11 B-vitamins Tables A6.1, A6.2
Thiamin
New Zealand children
The median usual daily thiamin intake of males ranged from 1.6 mg (5–6 years) to 1.7 mg (11–14 years) and from 1.2 mg (5–6 years) to 1.3 mg (11–14 years) in females (Figure A-33). Breakfast cereals and Bread were the largest contributors to the thiamin intakes of New Zealand children (Appendix C).
Ethnic
Mäori children had the highest median usual daily intakes of thiamin (males 1.8 mg; females 1.3 mg) compared with Pacific children (1.1 mg). Mäori and NZEO males 11–14 years had the highest median intakes of thiamin (2 mg; 1.7 mg) possibly because of the high consumption of Breakfast cereals and Bread, both of which may be fortified with thiamin.
Nutrient adequacy
Thiamin is related to energy metabolism, so requirements are determined by energy intake. UK DRVs are based on the estimated average requirement (EAR) for energy (UK Department of Health 1991). The UK RNI is 0.7 mg/day for females 4–14 years and males 4–10 years, and 0.9 mg/day for males 11–14 years. Intakes of thiamin at the 10th percentile for New Zealand children were equal to or above these values across all subgroups. Therefore, it is unlikely that thiamin intakes of New Zealand children were inadequate.
Figure A-33: Median thiamin intake Figure A-34: Median riboflavin intake
1.0
1.2
1.4
1.6
1.8
5–6 7–10 11–14
Age group (years)
Median (mg)Males
Females
0
1.0
1.2
1.4
1.6
1.8
2.0
2.2
Māori Pacific NZEO
Ethnic group
Median (mg) Males
Females
0
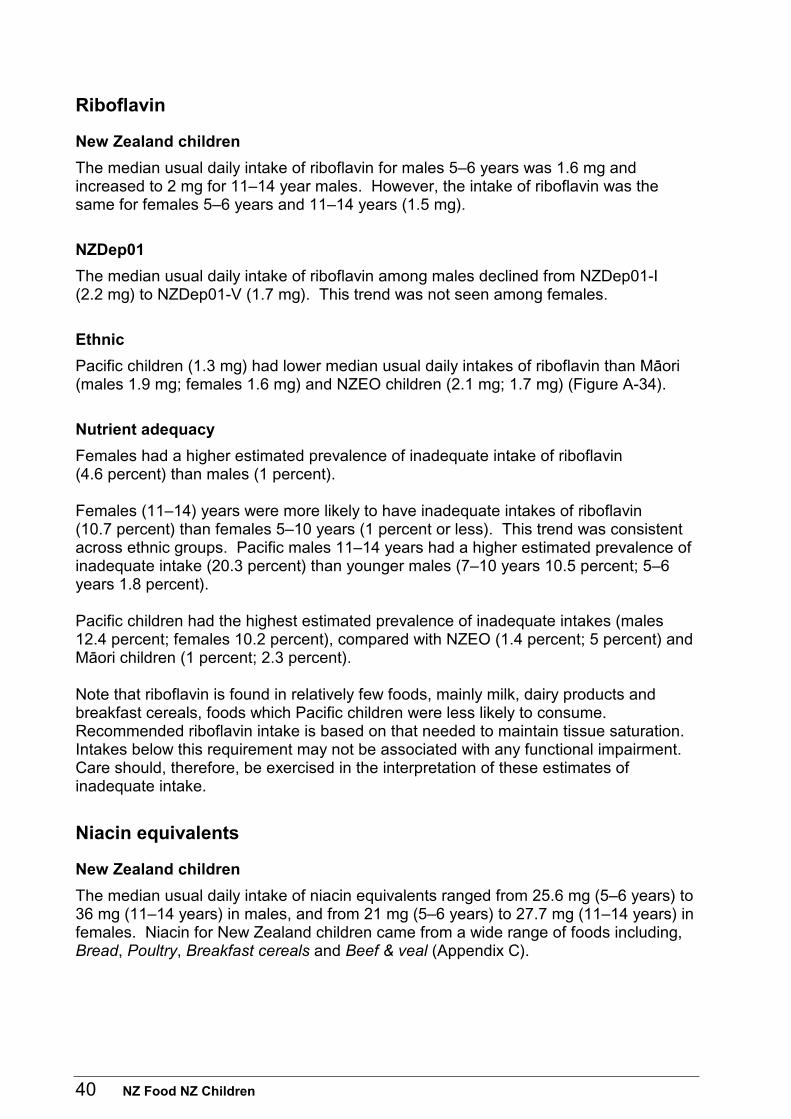
40 NZ Food NZ Children
Riboflavin
New Zealand children
The median usual daily intake of riboflavin for males 5–6 years was 1.6 mg and increased to 2 mg for 11–14 year males. However, the intake of riboflavin was the same for females 5–6 years and 11–14 years (1.5 mg).
NZDep01
The median usual daily intake of riboflavin among males declined from NZDep01-I (2.2 mg) to NZDep01-V (1.7 mg). This trend was not seen among females.
Ethnic
Pacific children (1.3 mg) had lower median usual daily intakes of riboflavin than Mäori (males 1.9 mg; females 1.6 mg) and NZEO children (2.1 mg; 1.7 mg) (Figure A-34).
Nutrient adequacy
Females had a higher estimated prevalence of inadequate intake of riboflavin (4.6 percent) than males (1 percent). Females (11–14) years were more likely to have inadequate intakes of riboflavin (10.7 percent) than females 5–10 years (1 percent or less). This trend was consistent across ethnic groups. Pacific males 11–14 years had a higher estimated prevalence of inadequate intake (20.3 percent) than younger males (7–10 years 10.5 percent; 5–6 years 1.8 percent). Pacific children had the highest estimated prevalence of inadequate intakes (males 12.4 percent; females 10.2 percent), compared with NZEO (1.4 percent; 5 percent) and Mäori children (1 percent; 2.3 percent). Note that riboflavin is found in relatively few foods, mainly milk, dairy products and breakfast cereals, foods which Pacific children were less likely to consume. Recommended riboflavin intake is based on that needed to maintain tissue saturation. Intakes below this requirement may not be associated with any functional impairment. Care should, therefore, be exercised in the interpretation of these estimates of inadequate intake.
Niacin equivalents
New Zealand children
The median usual daily intake of niacin equivalents ranged from 25.6 mg (5–6 years) to 36 mg (11–14 years) in males, and from 21 mg (5–6 years) to 27.7 mg (11–14 years) in females. Niacin for New Zealand children came from a wide range of foods including, Bread, Poultry, Breakfast cereals and Beef & veal (Appendix C).
NZ Food NZ Children 41
Ethnic
Mäori children 5–6 years had higher median usual daily intakes of niacin equivalents (males 28.9 mg; females 23.7 mg) than NZEO (23.4 mg; 20.4 mg) and Pacific children (24.6 mg; 21 mg) within the same age group.
Nutrient adequacy
The requirement for niacin is related to energy expenditure, so depends on the level of energy intake. For children, the UK RNIs range from 11 mg (males 4–10 years and females 4–14 years) to 15 mg (males 11–14 years). Intakes at the 10th percentile for New Zealand children and for all subgroups fall above the RNIs. Therefore, it appeared intakes of niacin for New Zealand children were adequate.
Vitamin B6
New Zealand children
Median usual daily intakes of vitamin B6 for males ranged from 1.1 mg (5–6 years) to 1.5 mg (11–14 years), and for females from 1 mg (5–6 years) to 1.2 mg (11–14 years). Dietary supplements, Fruit, Potatoes, kumara & taro and Breakfast cereals provided the most vitamin B6 to the diets of New Zealand children (Appendix C).
Nutrient intakes
Vitamin B6 is involved in protein metabolism, so recommended intakes are based on protein intake. The UK DRV (UK Department of Health 1991) calculations were based on protein providing 14.7 percent of the EAR for energy. Median intakes of vitamin B6 for all subgroups of children were above the RNIs that range from 0.9 mg (4–6 years) to 1.2 mg (11–14 years). On this basis the vitamin B6 intake of New Zealand children appeared satisfactory.
Vitamin B12
New Zealand children
The median usual daily intake of vitamin B12 ranged from 3.2 µg (5–6 years) to 4 µg (11–14 years) in males, and from 2.6 µg (5–6 years) to 3.1 µg (11–14 years) in females. Vitamin B12 is concentrated in animal products and New Zealand children sourced most of their vitamin B12 from Milk, Beef & veal, Fish & seafood and Dietary supplements (Appendix C).
Nutrient adequacy
The estimated prevalence of inadequate vitamin B12 intakes of New Zealand children was low (males 0.1 percent; females 0 percent). The highest prevalence of inadequate intake was 2.8 percent for NZEO males 11–14 years. The EAR is set to maintain liver stores and to sustain a period of zero intake of vitamin B12. There was negligible risk of deficiency of vitamin B12 among New Zealand children.
42 NZ Food NZ Children
A12 Folate Tables A6.2, A23
Nutrient intake
New Zealand children
Median intakes of folate for New Zealand children ranged from 226 µg (5–6 years) to 283 µg (11–14 years) in males, and from 201 µg (5–6 years) to 216 µg (11–14 years) in females (Figure A-35).
NZDep01
The median intake for males in NZDep01-I was higher (301 µg) than for males in NZDep01-III, IV (240 µg) and V (241 µg).
Ethnic
Pacific children had lower median intakes of folate (males 196 µg; females 172 µg) than NZEO (275 µg; 220 µg) and Mäori children (248 µg; 208 µg). NZEO males had higher folate intakes (275 µg) than Mäori males (248 µg).
Nutrient adequacy
The estimated prevalence of inadequate intake of folate was higher for females (8.8 percent) than males (0.6 percent). Females 11–14 years in the three ethnic groups had higher estimated prevalence of inadequate intakes (Mäori 22.8 percent; Pacific 30 percent; NZEO 15 percent) than females 5–6 years (0 percent; 4.8 percent; 0 percent) (Figure A-36). Pacific females (13.9 percent) were more likely than NZEO (6.9 percent) and Mäori females (9.3 percent) to have inadequate intakes of folate. The estimated prevalence of inadequate intakes was higher for Pacific males (10 percent) than Mäori (3.3 percent) and NZEO males (0.7 percent). Pacific males 11–14 years (25.5 percent) were more likely to have inadequate intakes of folate than NZEO (1.5 percent) and Mäori males 11–14 years (0 percent). The present food composition data do not differentiate between folic acid (synthetic fortificant) and naturally occurring folate. The bioavailability of folic acid is known to be higher than natural folate (Lewis et al 1999). Recommendations for folate intake assume equal bioavailability of natural folate and folic acid. It is also possible that folate intake and the estimated prevalence of inadequate intakes have been over-estimated because the compositional data imputed are based on manufacturers’ claims for some fortified foods. Therefore, it is likely that intakes and the estimated prevalence of inadequate intakes have been over-estimated.
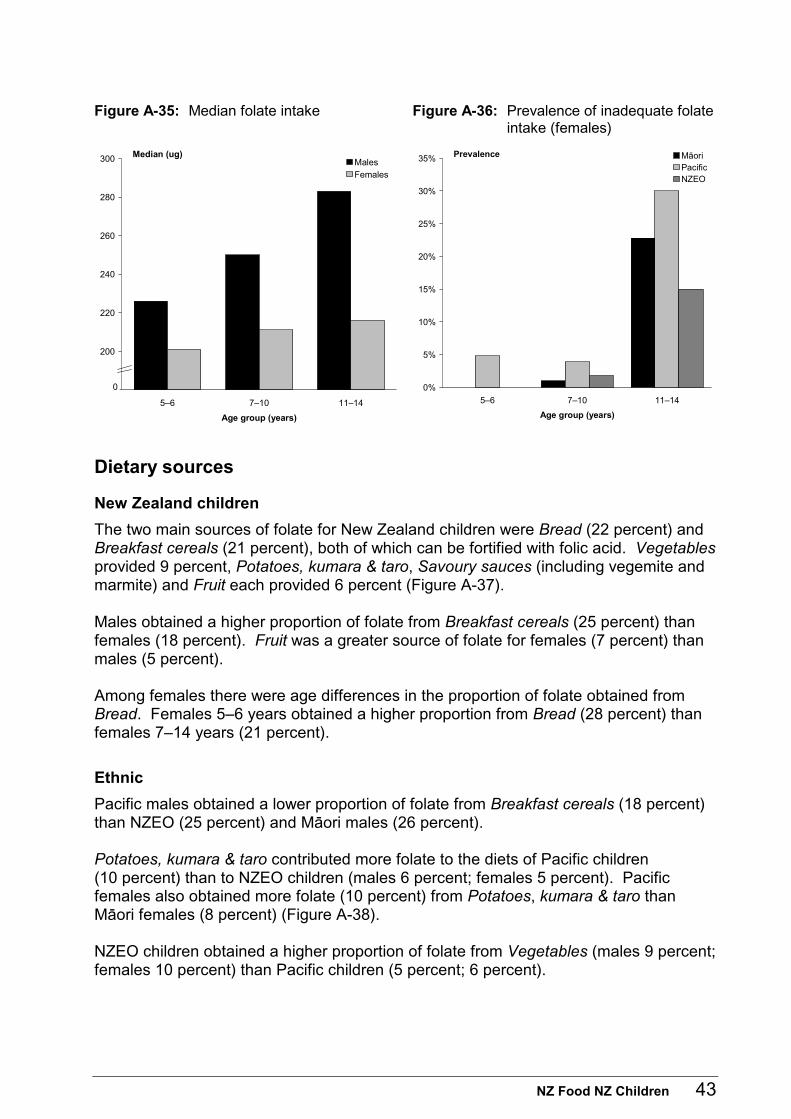
NZ Food NZ Children 43
Figure A-35: Median folate intake Figure A-36: Prevalence of inadequate folate intake (females)
180
200
220
240
260
280
300
5–6 7–10 11–14
Age group (years)
Median (ug)Males
Females
0 0%
5%
10%
15%
20%
25%
30%
35%
5–6 7–10 11–14
Age group (years)
Prevalence Māori PacificNZEO
Dietary sources
New Zealand children
The two main sources of folate for New Zealand children were Bread (22 percent) and Breakfast cereals (21 percent), both of which can be fortified with folic acid. Vegetables provided 9 percent, Potatoes, kumara & taro, Savoury sauces (including vegemite and marmite) and Fruit each provided 6 percent (Figure A-37). Males obtained a higher proportion of folate from Breakfast cereals (25 percent) than females (18 percent). Fruit was a greater source of folate for females (7 percent) than males (5 percent). Among females there were age differences in the proportion of folate obtained from Bread. Females 5–6 years obtained a higher proportion from Bread (28 percent) than females 7–14 years (21 percent).
Ethnic
Pacific males obtained a lower proportion of folate from Breakfast cereals (18 percent) than NZEO (25 percent) and Mäori males (26 percent). Potatoes, kumara & taro contributed more folate to the diets of Pacific children (10 percent) than to NZEO children (males 6 percent; females 5 percent). Pacific females also obtained more folate (10 percent) from Potatoes, kumara & taro than Mäori females (8 percent) (Figure A-38). NZEO children obtained a higher proportion of folate from Vegetables (males 9 percent; females 10 percent) than Pacific children (5 percent; 6 percent).
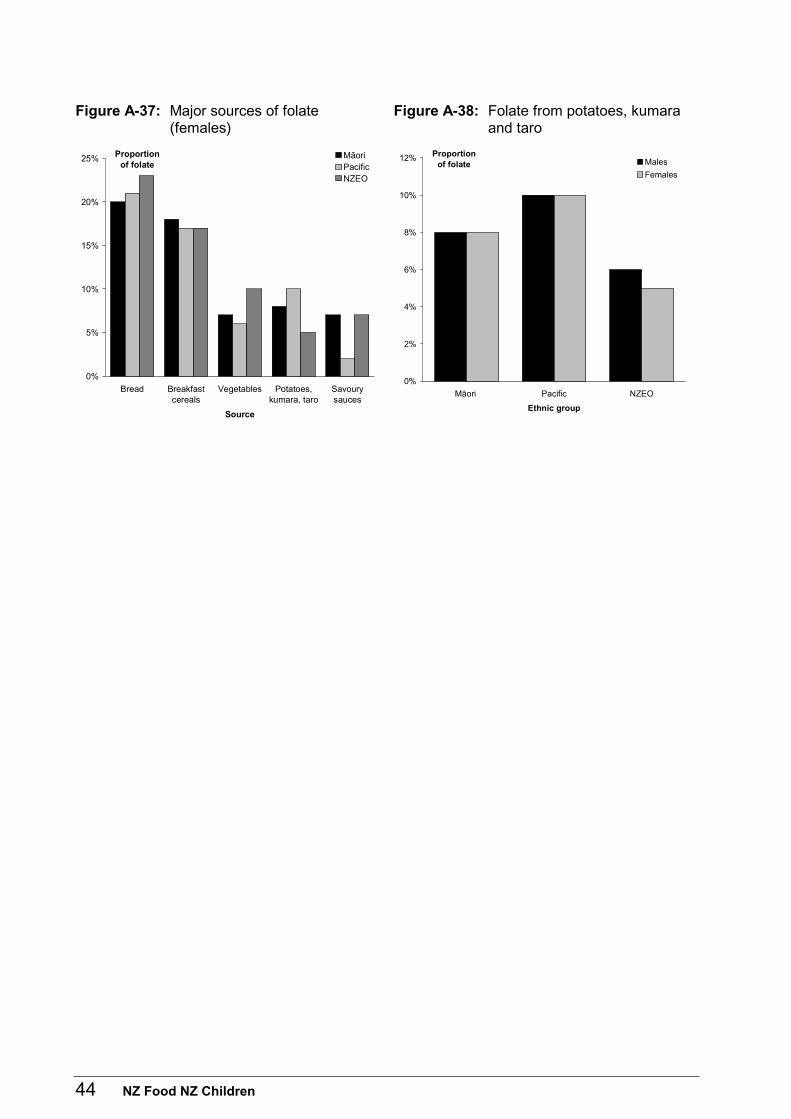
44 NZ Food NZ Children
Figure A-37: Major sources of folate (females)
Figure A-38: Folate from potatoes, kumara and taro
0%
5%
10%
15%
20%
25%
Bread Breakfastcereals
Vegetables Potatoes,kumara, taro
Savourysauces
Source
Proportionof folate
Māori PacificNZEO
0%
2%
4%
6%
8%
10%
12%
Māori Pacific NZEO
Ethnic group
Proportionof folate Males
Females
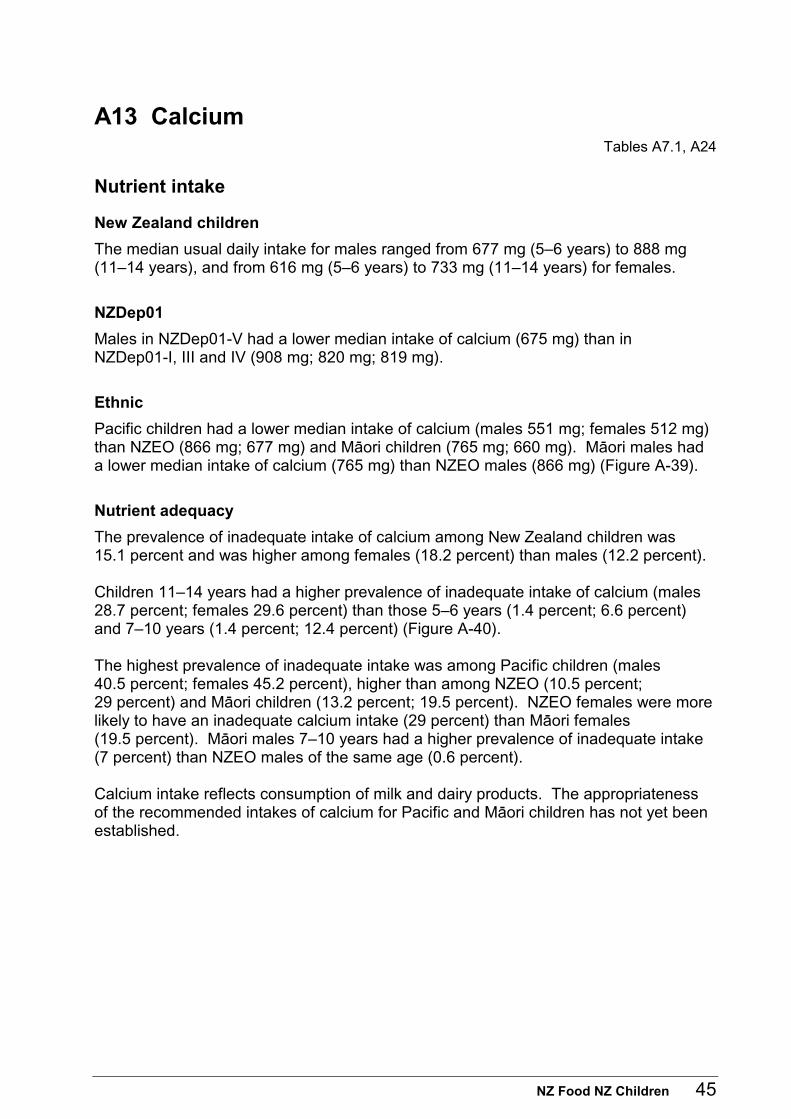
NZ Food NZ Children 45
A13 Calcium Tables A7.1, A24
Nutrient intake
New Zealand children
The median usual daily intake for males ranged from 677 mg (5–6 years) to 888 mg (11–14 years), and from 616 mg (5–6 years) to 733 mg (11–14 years) for females.
NZDep01
Males in NZDep01-V had a lower median intake of calcium (675 mg) than in NZDep01-I, III and IV (908 mg; 820 mg; 819 mg).
Ethnic
Pacific children had a lower median intake of calcium (males 551 mg; females 512 mg) than NZEO (866 mg; 677 mg) and Mäori children (765 mg; 660 mg). Mäori males had a lower median intake of calcium (765 mg) than NZEO males (866 mg) (Figure A-39).
Nutrient adequacy
The prevalence of inadequate intake of calcium among New Zealand children was 15.1 percent and was higher among females (18.2 percent) than males (12.2 percent). Children 11–14 years had a higher prevalence of inadequate intake of calcium (males 28.7 percent; females 29.6 percent) than those 5–6 years (1.4 percent; 6.6 percent) and 7–10 years (1.4 percent; 12.4 percent) (Figure A-40). The highest prevalence of inadequate intake was among Pacific children (males 40.5 percent; females 45.2 percent), higher than among NZEO (10.5 percent; 29 percent) and Mäori children (13.2 percent; 19.5 percent). NZEO females were more likely to have an inadequate calcium intake (29 percent) than Mäori females (19.5 percent). Mäori males 7–10 years had a higher prevalence of inadequate intake (7 percent) than NZEO males of the same age (0.6 percent). Calcium intake reflects consumption of milk and dairy products. The appropriateness of the recommended intakes of calcium for Pacific and Mäori children has not yet been established.
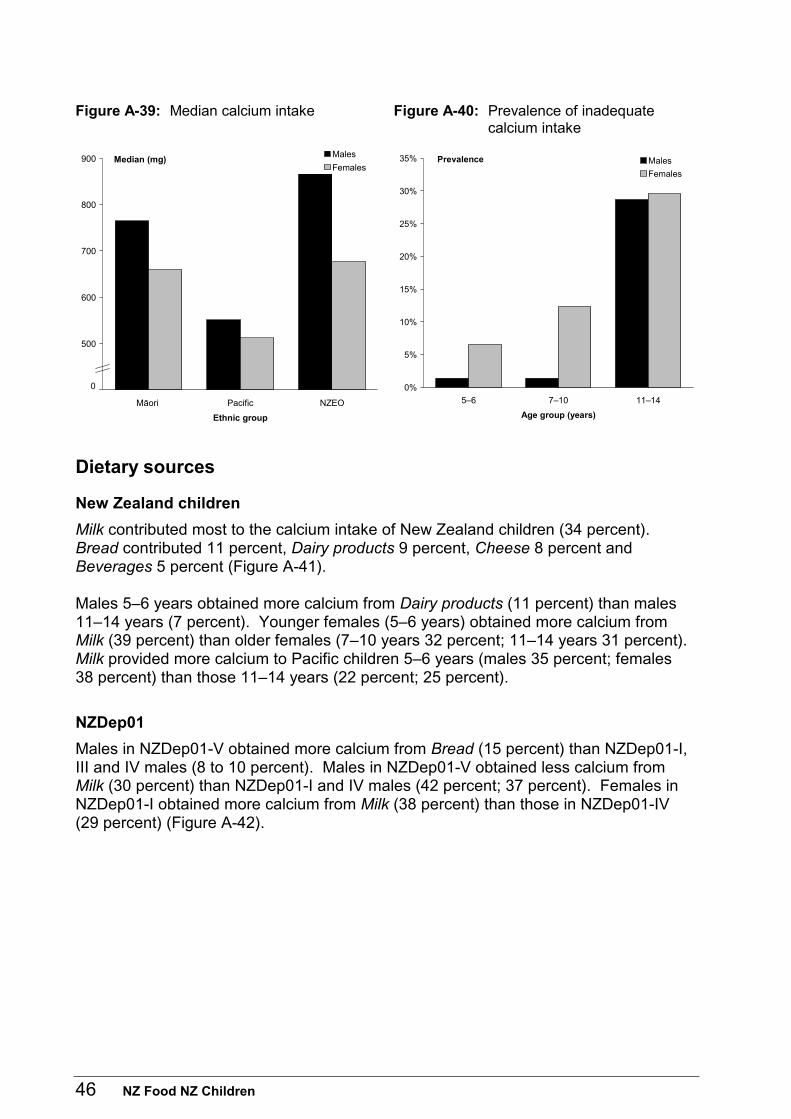
46 NZ Food NZ Children
Figure A-39: Median calcium intake Figure A-40: Prevalence of inadequate calcium intake
400
500
600
700
800
900
Māori Pacific NZEO
Ethnic group
Median (mg)Males
Females
0 0%
5%
10%
15%
20%
25%
30%
35%
5–6 7–10 11–14
Age group (years)
Prevalence Males
Females
Dietary sources
New Zealand children
Milk contributed most to the calcium intake of New Zealand children (34 percent). Bread contributed 11 percent, Dairy products 9 percent, Cheese 8 percent and Beverages 5 percent (Figure A-41). Males 5–6 years obtained more calcium from Dairy products (11 percent) than males 11–14 years (7 percent). Younger females (5–6 years) obtained more calcium from Milk (39 percent) than older females (7–10 years 32 percent; 11–14 years 31 percent). Milk provided more calcium to Pacific children 5–6 years (males 35 percent; females 38 percent) than those 11–14 years (22 percent; 25 percent).
NZDep01
Males in NZDep01-V obtained more calcium from Bread (15 percent) than NZDep01-I, III and IV males (8 to 10 percent). Males in NZDep01-V obtained less calcium from Milk (30 percent) than NZDep01-I and IV males (42 percent; 37 percent). Females in NZDep01-I obtained more calcium from Milk (38 percent) than those in NZDep01-IV (29 percent) (Figure A-42).
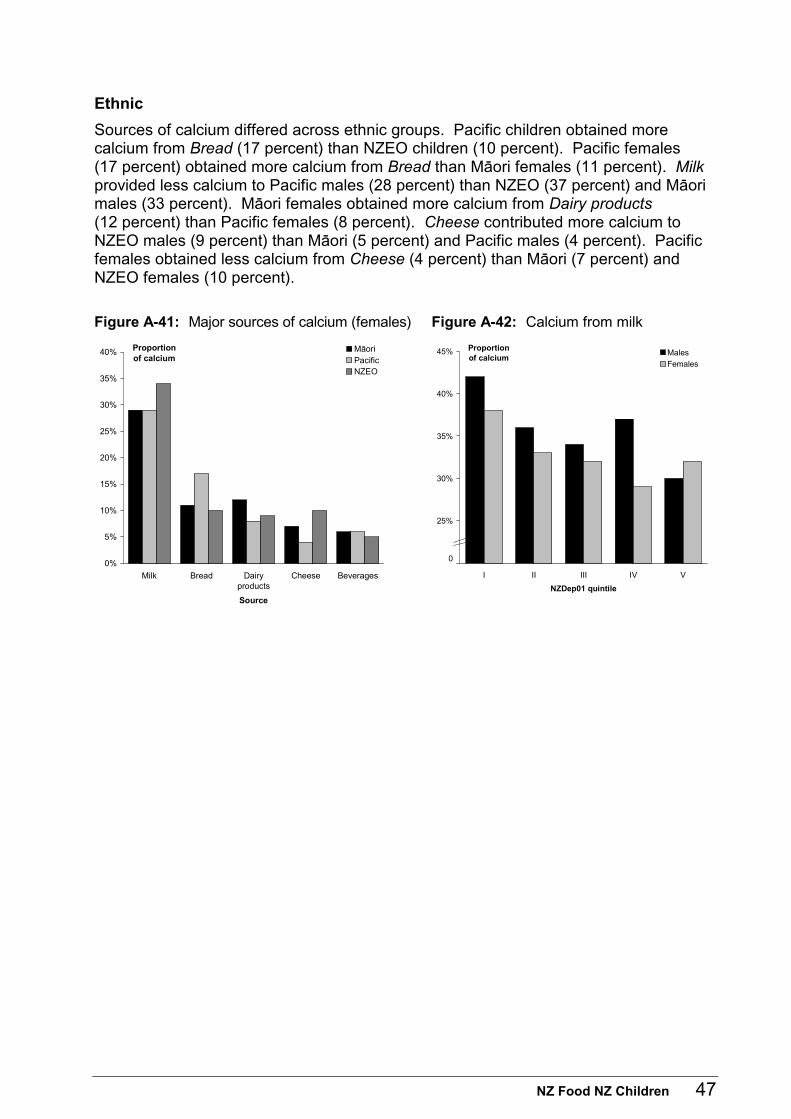
NZ Food NZ Children 47
Ethnic
Sources of calcium differed across ethnic groups. Pacific children obtained more calcium from Bread (17 percent) than NZEO children (10 percent). Pacific females (17 percent) obtained more calcium from Bread than Mäori females (11 percent). Milk provided less calcium to Pacific males (28 percent) than NZEO (37 percent) and Mäori males (33 percent). Mäori females obtained more calcium from Dairy products (12 percent) than Pacific females (8 percent). Cheese contributed more calcium to NZEO males (9 percent) than Mäori (5 percent) and Pacific males (4 percent). Pacific females obtained less calcium from Cheese (4 percent) than Mäori (7 percent) and NZEO females (10 percent).
Figure A-41: Major sources of calcium (females) Figure A-42: Calcium from milk
0%
5%
10%
15%
20%
25%
30%
35%
40%
Milk Bread Dairyproducts
Cheese Beverages
Source
Proportionof calcium
Māori PacificNZEO
20%
25%
30%
35%
40%
45%
I II III IV V
NZDep01 quintile
Proportionof calcium
Males
Females
0
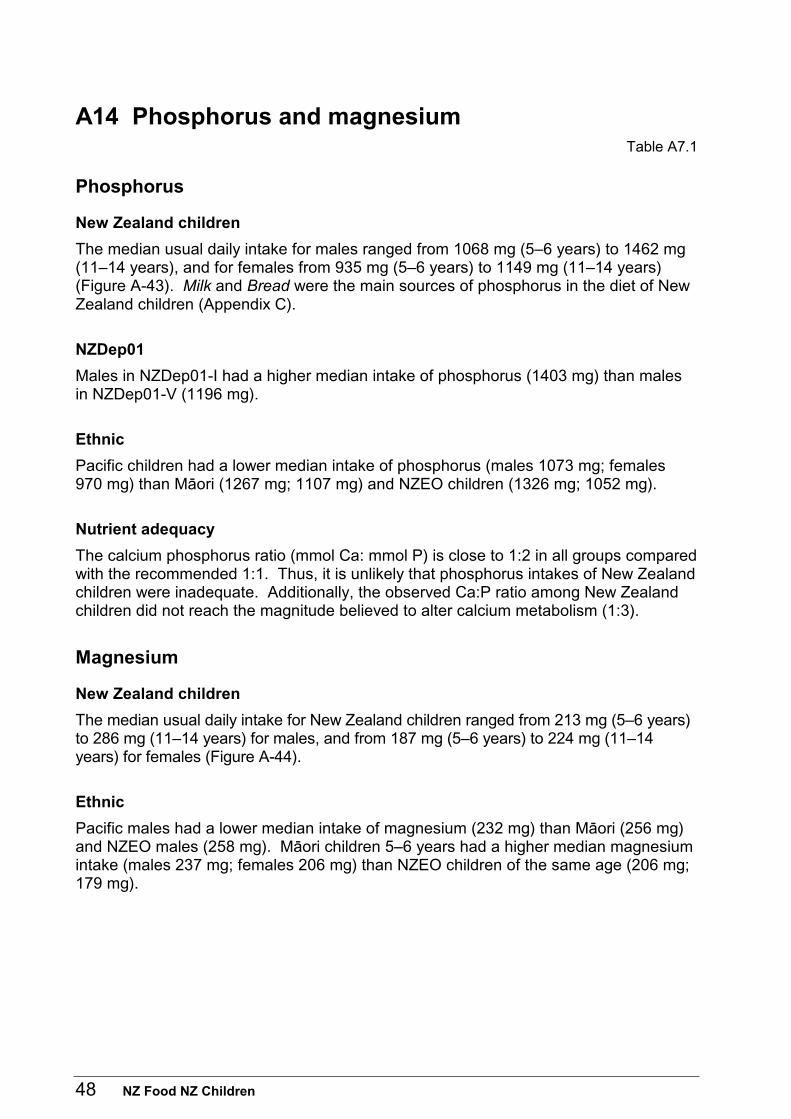
48 NZ Food NZ Children
A14 Phosphorus and magnesium Table A7.1
Phosphorus
New Zealand children
The median usual daily intake for males ranged from 1068 mg (5–6 years) to 1462 mg (11–14 years), and for females from 935 mg (5–6 years) to 1149 mg (11–14 years) (Figure A-43). Milk and Bread were the main sources of phosphorus in the diet of New Zealand children (Appendix C).
NZDep01
Males in NZDep01-I had a higher median intake of phosphorus (1403 mg) than males in NZDep01-V (1196 mg).
Ethnic
Pacific children had a lower median intake of phosphorus (males 1073 mg; females 970 mg) than Mäori (1267 mg; 1107 mg) and NZEO children (1326 mg; 1052 mg).
Nutrient adequacy
The calcium phosphorus ratio (mmol Ca: mmol P) is close to 1:2 in all groups compared with the recommended 1:1. Thus, it is unlikely that phosphorus intakes of New Zealand children were inadequate. Additionally, the observed Ca:P ratio among New Zealand children did not reach the magnitude believed to alter calcium metabolism (1:3).
Magnesium
New Zealand children
The median usual daily intake for New Zealand children ranged from 213 mg (5–6 years) to 286 mg (11–14 years) for males, and from 187 mg (5–6 years) to 224 mg (11–14 years) for females (Figure A-44).
Ethnic
Pacific males had a lower median intake of magnesium (232 mg) than Mäori (256 mg) and NZEO males (258 mg). Mäori children 5–6 years had a higher median magnesium intake (males 237 mg; females 206 mg) than NZEO children of the same age (206 mg; 179 mg).
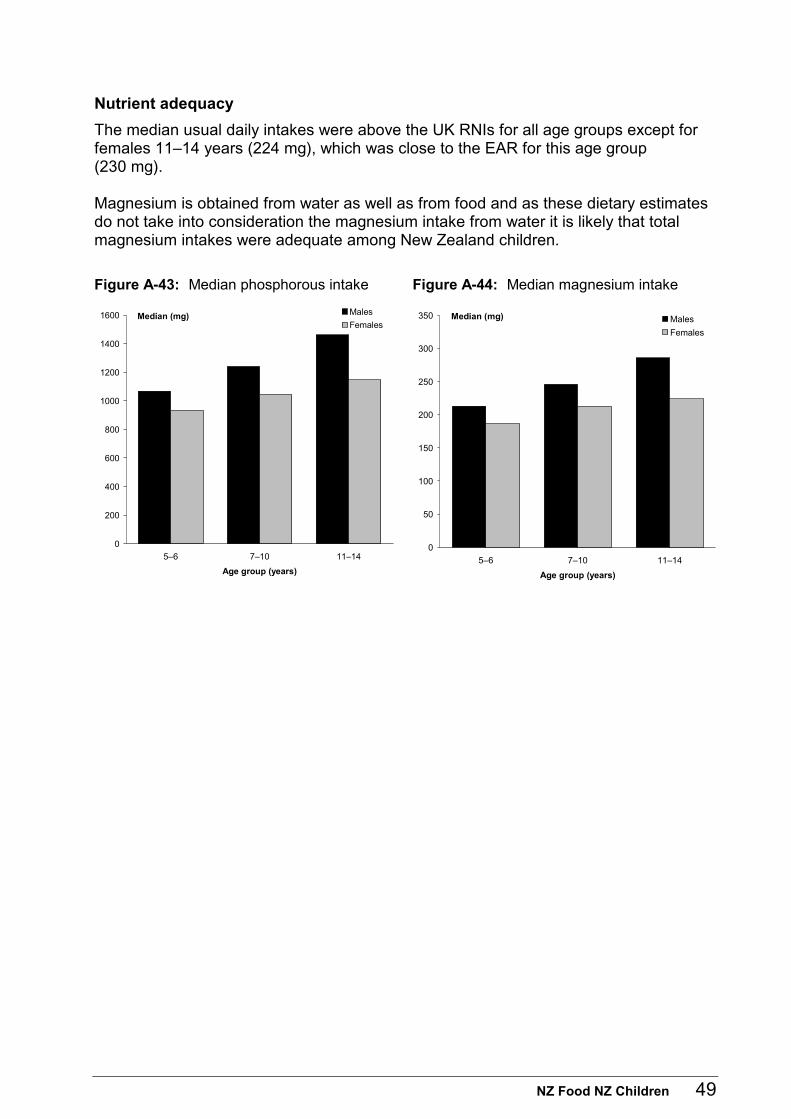
NZ Food NZ Children 49
Nutrient adequacy
The median usual daily intakes were above the UK RNIs for all age groups except for females 11–14 years (224 mg), which was close to the EAR for this age group (230 mg). Magnesium is obtained from water as well as from food and as these dietary estimates do not take into consideration the magnesium intake from water it is likely that total magnesium intakes were adequate among New Zealand children.
Figure A-43: Median phosphorous intake Figure A-44: Median magnesium intake
0
200
400
600
800
1000
1200
1400
1600
5–6 7–10 11–14
Age group (years)
Median (mg) Males
Females
0
50
100
150
200
250
300
350
5–6 7–10 11–14
Age group (years)
Median (mg) Males
Females
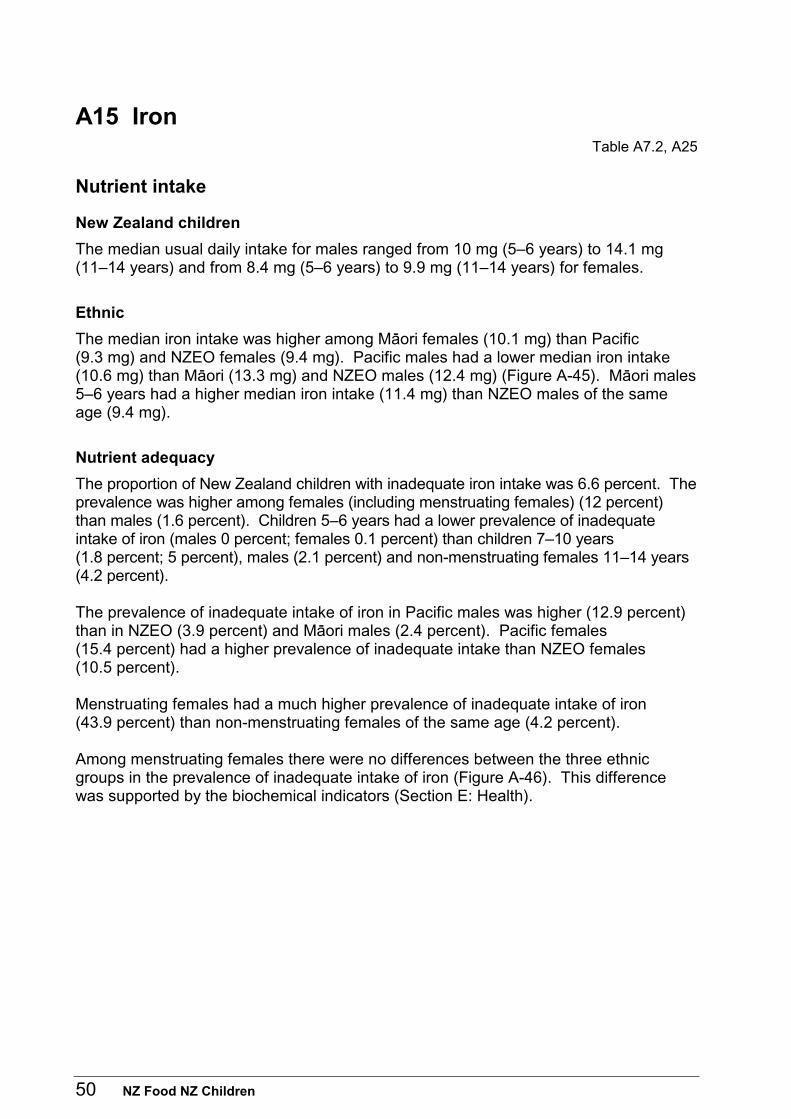
50 NZ Food NZ Children
A15 Iron Table A7.2, A25
Nutrient intake
New Zealand children
The median usual daily intake for males ranged from 10 mg (5–6 years) to 14.1 mg (11–14 years) and from 8.4 mg (5–6 years) to 9.9 mg (11–14 years) for females.
Ethnic
The median iron intake was higher among Mäori females (10.1 mg) than Pacific (9.3 mg) and NZEO females (9.4 mg). Pacific males had a lower median iron intake (10.6 mg) than Mäori (13.3 mg) and NZEO males (12.4 mg) (Figure A-45). Mäori males 5–6 years had a higher median iron intake (11.4 mg) than NZEO males of the same age (9.4 mg).
Nutrient adequacy
The proportion of New Zealand children with inadequate iron intake was 6.6 percent. The prevalence was higher among females (including menstruating females) (12 percent) than males (1.6 percent). Children 5–6 years had a lower prevalence of inadequate intake of iron (males 0 percent; females 0.1 percent) than children 7–10 years (1.8 percent; 5 percent), males (2.1 percent) and non-menstruating females 11–14 years (4.2 percent). The prevalence of inadequate intake of iron in Pacific males was higher (12.9 percent) than in NZEO (3.9 percent) and Mäori males (2.4 percent). Pacific females (15.4 percent) had a higher prevalence of inadequate intake than NZEO females (10.5 percent). Menstruating females had a much higher prevalence of inadequate intake of iron (43.9 percent) than non-menstruating females of the same age (4.2 percent). Among menstruating females there were no differences between the three ethnic groups in the prevalence of inadequate intake of iron (Figure A-46). This difference was supported by the biochemical indicators (Section E: Health).
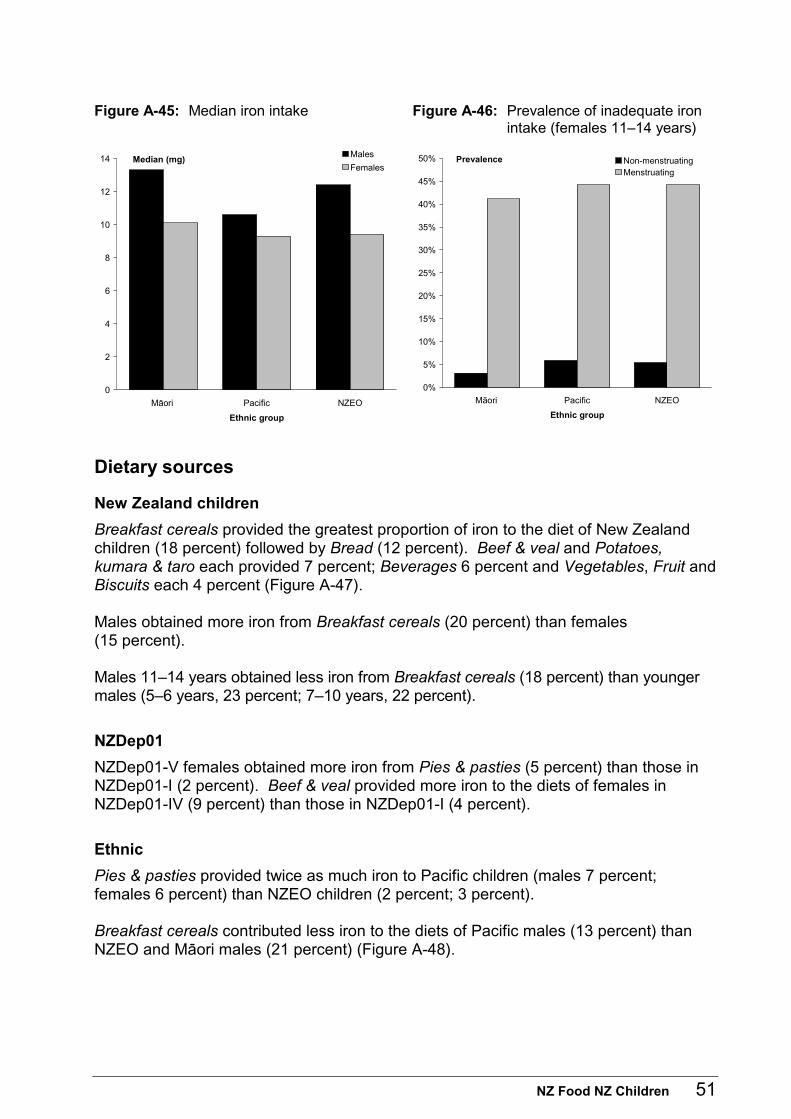
NZ Food NZ Children 51
Figure A-45: Median iron intake Figure A-46: Prevalence of inadequate iron intake (females 11–14 years)
0
2
4
6
8
10
12
14
Māori Pacific NZEO
Ethnic group
Median (mg)Males
Females
0%
5%
10%
15%
20%
25%
30%
35%
40%
45%
50%
Māori Pacific NZEO
Ethnic group
Prevalence Non-menstruatingMenstruating
Dietary sources
New Zealand children
Breakfast cereals provided the greatest proportion of iron to the diet of New Zealand children (18 percent) followed by Bread (12 percent). Beef & veal and Potatoes, kumara & taro each provided 7 percent; Beverages 6 percent and Vegetables, Fruit and Biscuits each 4 percent (Figure A-47). Males obtained more iron from Breakfast cereals (20 percent) than females (15 percent). Males 11–14 years obtained less iron from Breakfast cereals (18 percent) than younger males (5–6 years, 23 percent; 7–10 years, 22 percent).
NZDep01
NZDep01-V females obtained more iron from Pies & pasties (5 percent) than those in NZDep01-I (2 percent). Beef & veal provided more iron to the diets of females in NZDep01-IV (9 percent) than those in NZDep01-I (4 percent).
Ethnic
Pies & pasties provided twice as much iron to Pacific children (males 7 percent; females 6 percent) than NZEO children (2 percent; 3 percent). Breakfast cereals contributed less iron to the diets of Pacific males (13 percent) than NZEO and Mäori males (21 percent) (Figure A-48).
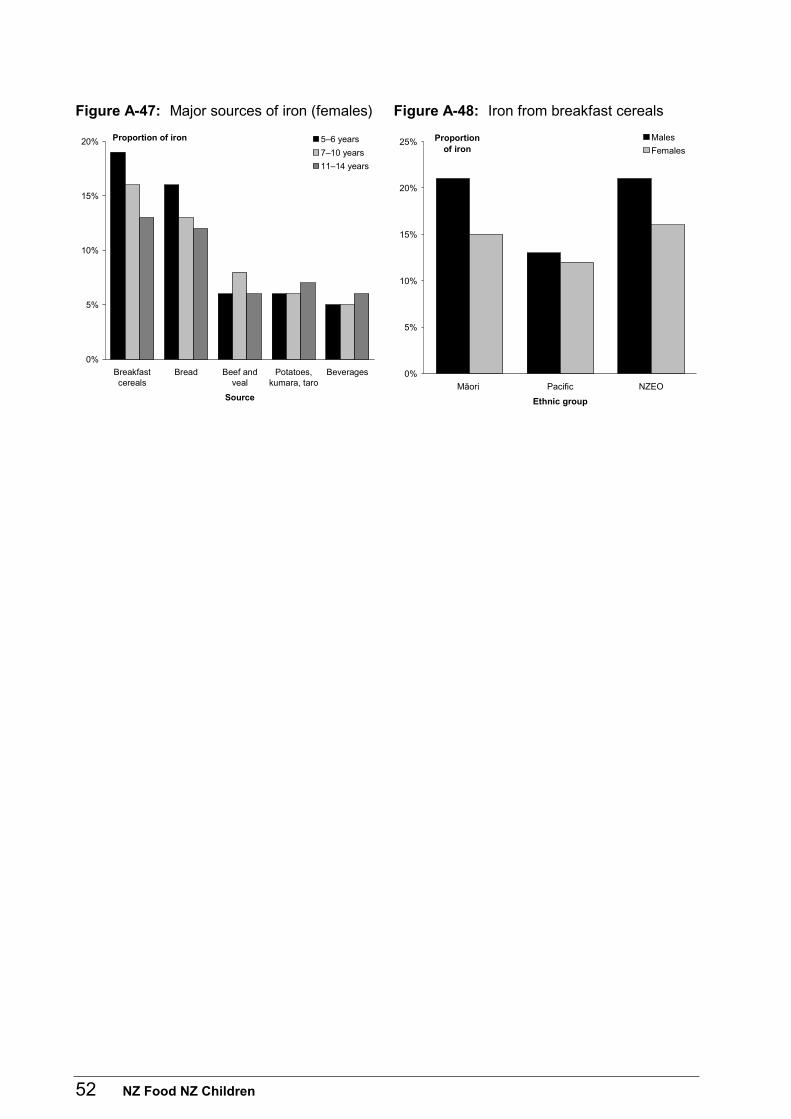
52 NZ Food NZ Children
Figure A-47: Major sources of iron (females) Figure A-48: Iron from breakfast cereals
0%
5%
10%
15%
20%
Breakfastcereals
Bread Beef andveal
Potatoes,kumara, taro
Beverages
Source
Proportion of iron 5–6 years
7–10 years
11–14 years
0%
5%
10%
15%
20%
25%
Māori Pacific NZEO
Ethnic group
Proportionof iron
Males
Females
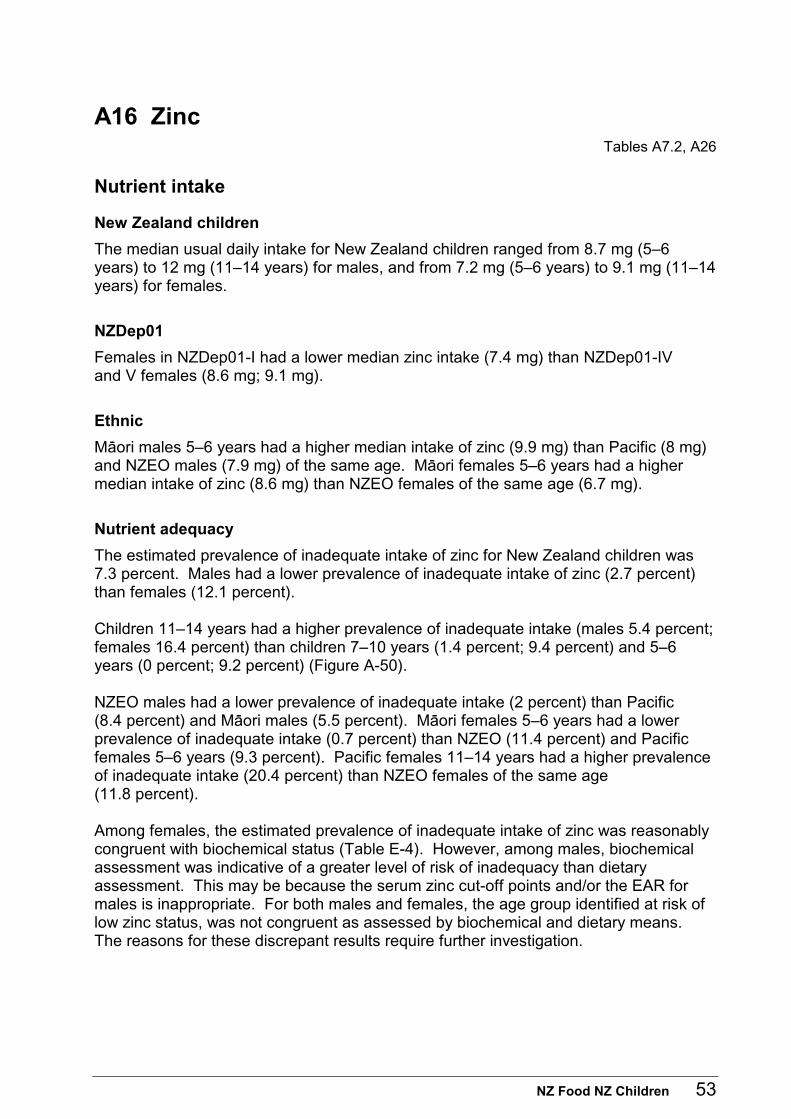
NZ Food NZ Children 53
A16 Zinc Tables A7.2, A26
Nutrient intake
New Zealand children
The median usual daily intake for New Zealand children ranged from 8.7 mg (5–6 years) to 12 mg (11–14 years) for males, and from 7.2 mg (5–6 years) to 9.1 mg (11–14 years) for females.
NZDep01
Females in NZDep01-I had a lower median zinc intake (7.4 mg) than NZDep01-IV and V females (8.6 mg; 9.1 mg).
Ethnic
Mäori males 5–6 years had a higher median intake of zinc (9.9 mg) than Pacific (8 mg) and NZEO males (7.9 mg) of the same age. Mäori females 5–6 years had a higher median intake of zinc (8.6 mg) than NZEO females of the same age (6.7 mg).
Nutrient adequacy
The estimated prevalence of inadequate intake of zinc for New Zealand children was 7.3 percent. Males had a lower prevalence of inadequate intake of zinc (2.7 percent) than females (12.1 percent). Children 11–14 years had a higher prevalence of inadequate intake (males 5.4 percent; females 16.4 percent) than children 7–10 years (1.4 percent; 9.4 percent) and 5–6 years (0 percent; 9.2 percent) (Figure A-50). NZEO males had a lower prevalence of inadequate intake (2 percent) than Pacific (8.4 percent) and Mäori males (5.5 percent). Mäori females 5–6 years had a lower prevalence of inadequate intake (0.7 percent) than NZEO (11.4 percent) and Pacific females 5–6 years (9.3 percent). Pacific females 11–14 years had a higher prevalence of inadequate intake (20.4 percent) than NZEO females of the same age (11.8 percent). Among females, the estimated prevalence of inadequate intake of zinc was reasonably congruent with biochemical status (Table E-4). However, among males, biochemical assessment was indicative of a greater level of risk of inadequacy than dietary assessment. This may be because the serum zinc cut-off points and/or the EAR for males is inappropriate. For both males and females, the age group identified at risk of low zinc status, was not congruent as assessed by biochemical and dietary means. The reasons for these discrepant results require further investigation.
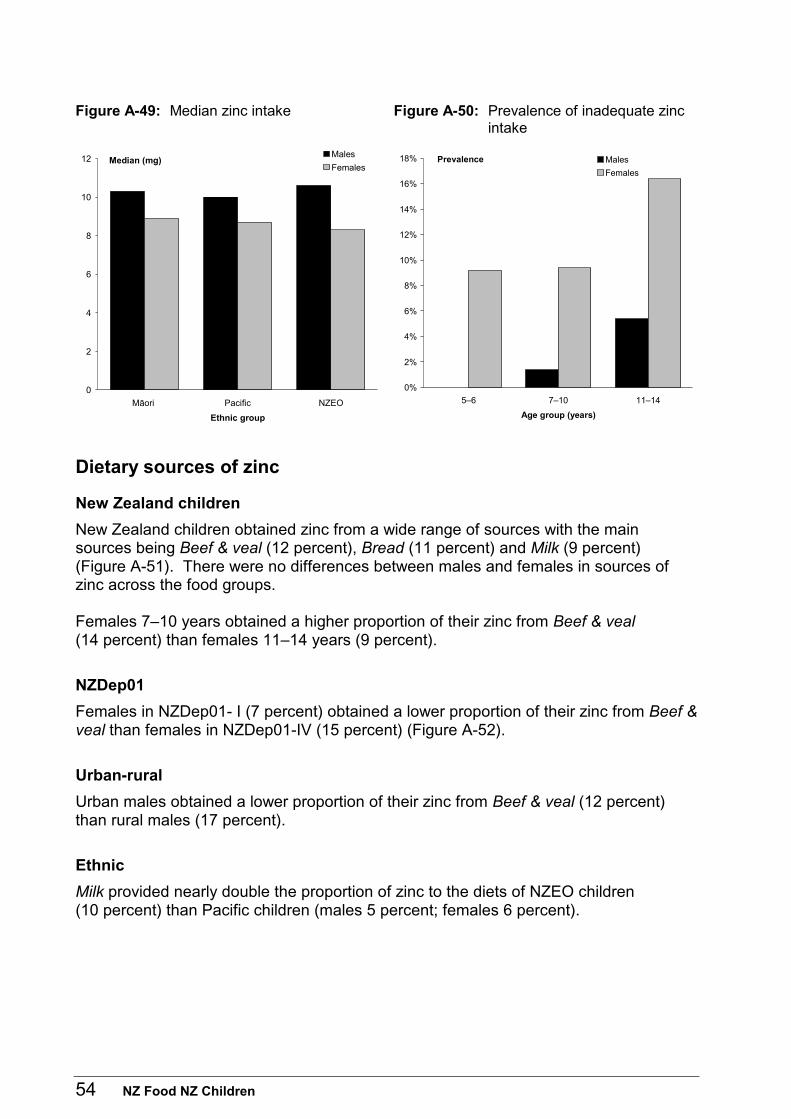
54 NZ Food NZ Children
Figure A-49: Median zinc intake Figure A-50: Prevalence of inadequate zinc intake
0
2
4
6
8
10
12
Māori Pacific NZEO
Ethnic group
Median (mg)Males
Females
0%
2%
4%
6%
8%
10%
12%
14%
16%
18%
5–6 7–10 11–14
Age group (years)
Prevalence Males
Females
Dietary sources of zinc
New Zealand children
New Zealand children obtained zinc from a wide range of sources with the main sources being Beef & veal (12 percent), Bread (11 percent) and Milk (9 percent) (Figure A-51). There were no differences between males and females in sources of zinc across the food groups. Females 7–10 years obtained a higher proportion of their zinc from Beef & veal (14 percent) than females 11–14 years (9 percent).
NZDep01
Females in NZDep01- I (7 percent) obtained a lower proportion of their zinc from Beef & veal than females in NZDep01-IV (15 percent) (Figure A-52).
Urban-rural
Urban males obtained a lower proportion of their zinc from Beef & veal (12 percent) than rural males (17 percent).
Ethnic
Milk provided nearly double the proportion of zinc to the diets of NZEO children (10 percent) than Pacific children (males 5 percent; females 6 percent).
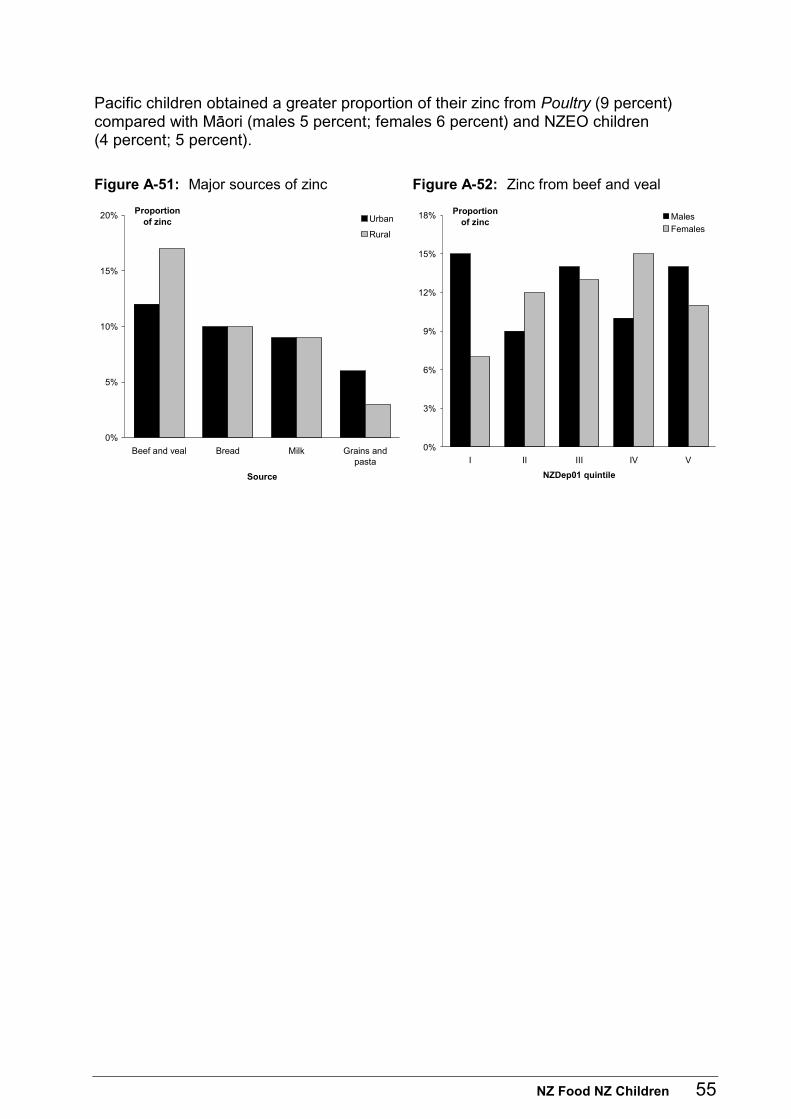
NZ Food NZ Children 55
Pacific children obtained a greater proportion of their zinc from Poultry (9 percent) compared with Mäori (males 5 percent; females 6 percent) and NZEO children (4 percent; 5 percent).
Figure A-51: Major sources of zinc Figure A-52: Zinc from beef and veal
0%
5%
10%
15%
20%
Beef and veal Bread Milk Grains andpasta
Source
Proportionof zinc Urban
Rural
0%
3%
6%
9%
12%
15%
18%
I II III IV V
NZDep01 quintile
Proportionof zinc
Males
Females
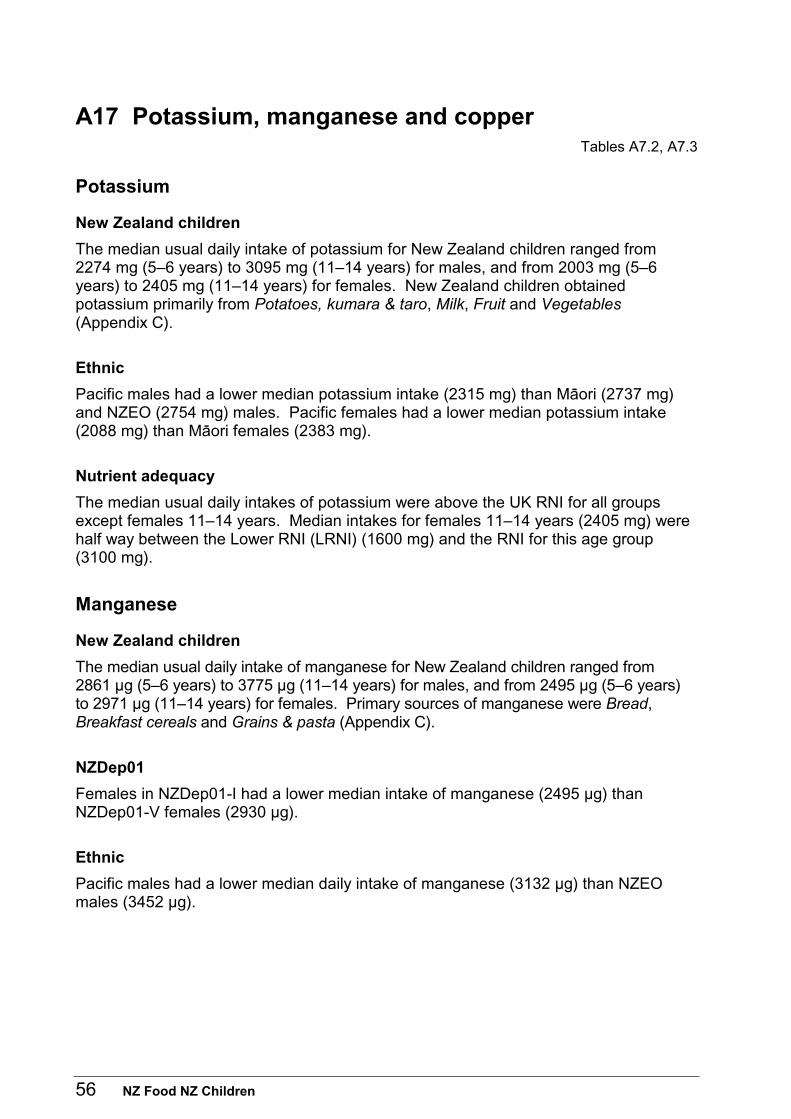
56 NZ Food NZ Children
A17 Potassium, manganese and copper Tables A7.2, A7.3
Potassium
New Zealand children
The median usual daily intake of potassium for New Zealand children ranged from 2274 mg (5–6 years) to 3095 mg (11–14 years) for males, and from 2003 mg (5–6 years) to 2405 mg (11–14 years) for females. New Zealand children obtained potassium primarily from Potatoes, kumara & taro, Milk, Fruit and Vegetables (Appendix C).
Ethnic
Pacific males had a lower median potassium intake (2315 mg) than Mäori (2737 mg) and NZEO (2754 mg) males. Pacific females had a lower median potassium intake (2088 mg) than Mäori females (2383 mg).
Nutrient adequacy
The median usual daily intakes of potassium were above the UK RNI for all groups except females 11–14 years. Median intakes for females 11–14 years (2405 mg) were half way between the Lower RNI (LRNI) (1600 mg) and the RNI for this age group (3100 mg).
Manganese
New Zealand children
The median usual daily intake of manganese for New Zealand children ranged from 2861 µg (5–6 years) to 3775 µg (11–14 years) for males, and from 2495 µg (5–6 years) to 2971 µg (11–14 years) for females. Primary sources of manganese were Bread, Breakfast cereals and Grains & pasta (Appendix C).
NZDep01
Females in NZDep01-I had a lower median intake of manganese (2495 µg) than NZDep01-V females (2930 µg).
Ethnic
Pacific males had a lower median daily intake of manganese (3132 µg) than NZEO males (3452 µg).
NZ Food NZ Children 57
Nutrient adequacy
For all age groups, the usual median daily intakes were above the intakes designated for adults by the UK DRV (1.4 mg/d).
Copper
New Zealand children
The median usual daily intake of copper for New Zealand children ranged from 1 mg (5–6 years) to 1.4 mg (11–14 years) for males and from 1 mg (5–6 years) to 1.1 mg (11–14 years) for females. Bread, Potatoes, kumara & taro and Vegetables were the primary sources of copper for New Zealand children (Appendix C).
Ethnic
NZEO males had a higher median intake of copper (1.2 mg) than Pacific males (1.1 mg). Mäori females had a higher median intake of copper (1.1 mg) than Pacific females (1 mg).
Nutrient adequacy
The UK RNIs for copper range from 0.6 mg/day (children 4–6 years) to 0.8 mg/day (males 11–14 years). For New Zealand children median usual daily intakes of copper are just under double these age specific recommendations. Furthermore, median intakes of copper for all ethnic subgroups are above these RNIs.
58 NZ Food NZ Children
A18 Selenium Tables A7.3, A27
Nutrient intake
New Zealand children
The usual median daily intake of selenium for New Zealand children ranged from 29.7 µg (5–6 years) to 44 µg (11–14 years) for males, and from 24.6 µg (5–6 years) to 34.9 µg (11–14 years) for females (Figure A-53).
NZDep01
Females in NZDep01-I and II had a lower median intake of selenium (25.4 µg; 29.1 µg) than NZDep01-V females (35.8 µg).
Ethnic
Mäori males 7–10 years had a lower median intake of selenium (34.4 µg) than Pacific males of the same age (42 µg). Pacific females had a higher median intake of selenium (36.2 µg) than NZEO females (29.3 µg). Mäori females 5–6 years had a higher median selenium intake (28.3 µg) than NZEO females of the same age (20.8 µg).
Nutrient adequacy
Comparisons of New Zealand children’s usual daily median intakes of selenium with recommendations are difficult as the age grouping in this survey differs from that used for the recently proposed selenium RNI (Figure A-54). These proposed RNIs have been estimated specifically for the New Zealand population (Thomson and Paterson 2001). Younger males (5–6 years) had a median selenium intake (29.7 µg) close to the RNI for children 4–8 years (30 µg), while females 5–6 years were below (24.6 µg). Males 7–10 years (35.2 µg) had a median selenium intake higher than the RNI for children 4–8 years (30 µg) but lower than the RNI for males 9–13 years (50 µg). Females 7–10 years had a median intake (30.4 µg) close to the RNI for children 4–8 years (30 µg), but it was 20 µg lower than the RNI for females 9–13 years (50 µg). Children 11–14 years had median intakes (males 44 µg, females 34.9 µg) below the RNI for children 9–13 years (50 µg; 50 µg). These results suggested New Zealand children, especially older children, were at risk of having inadequate selenium intakes.
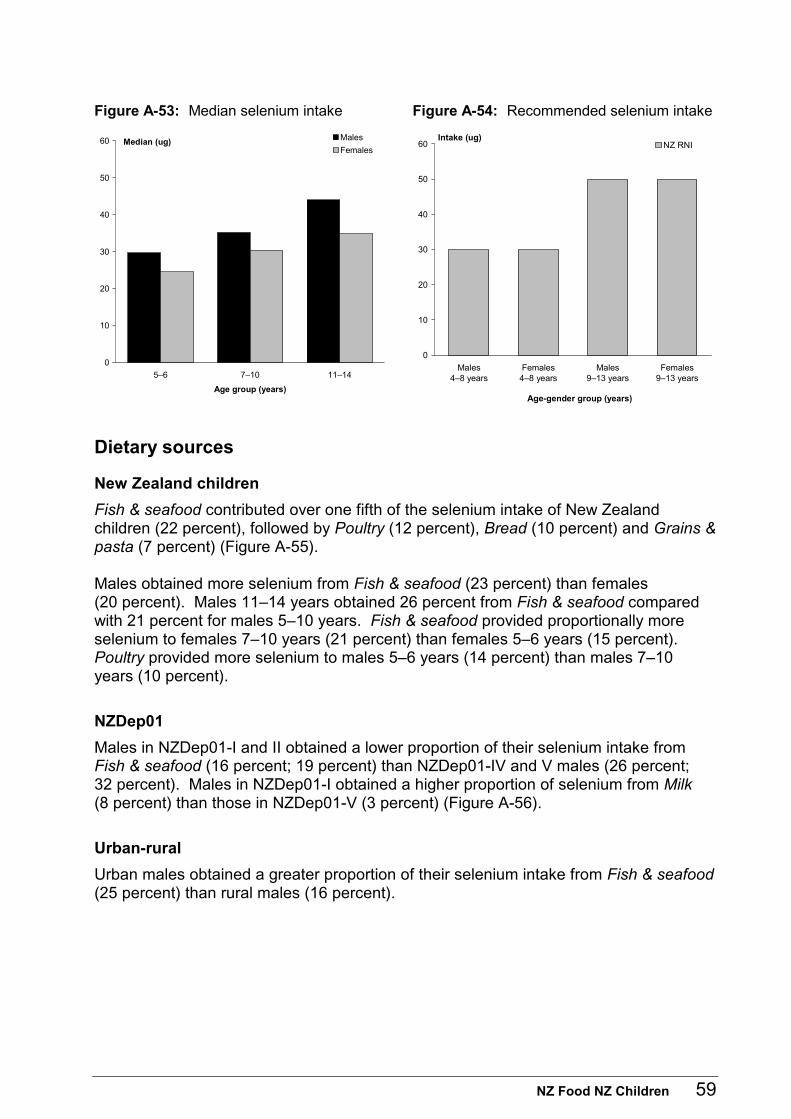
NZ Food NZ Children 59
Figure A-53: Median selenium intake Figure A-54: Recommended selenium intake
0
10
20
30
40
50
60
5–6 7–10 11–14
Age group (years)
Median (ug) Males
Females
0
10
20
30
40
50
60
Males4–8 years
Females4–8 years
Males9–13 years
Females9–13 years
Age-gender group (years)
Intake (ug)NZ RNI
Dietary sources
New Zealand children
Fish & seafood contributed over one fifth of the selenium intake of New Zealand children (22 percent), followed by Poultry (12 percent), Bread (10 percent) and Grains & pasta (7 percent) (Figure A-55). Males obtained more selenium from Fish & seafood (23 percent) than females (20 percent). Males 11–14 years obtained 26 percent from Fish & seafood compared with 21 percent for males 5–10 years. Fish & seafood provided proportionally more selenium to females 7–10 years (21 percent) than females 5–6 years (15 percent). Poultry provided more selenium to males 5–6 years (14 percent) than males 7–10 years (10 percent).
NZDep01
Males in NZDep01-I and II obtained a lower proportion of their selenium intake from Fish & seafood (16 percent; 19 percent) than NZDep01-IV and V males (26 percent; 32 percent). Males in NZDep01-I obtained a higher proportion of selenium from Milk (8 percent) than those in NZDep01-V (3 percent) (Figure A-56).
Urban-rural
Urban males obtained a greater proportion of their selenium intake from Fish & seafood (25 percent) than rural males (16 percent).
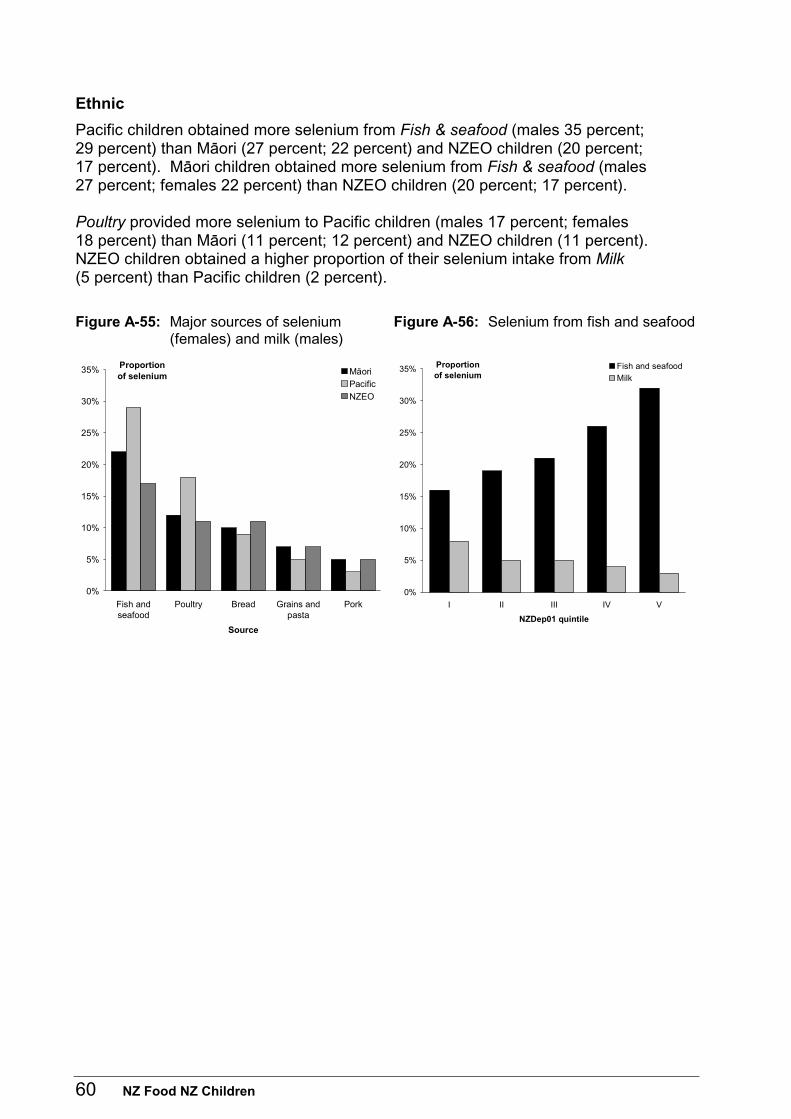
60 NZ Food NZ Children
Ethnic
Pacific children obtained more selenium from Fish & seafood (males 35 percent; 29 percent) than Mäori (27 percent; 22 percent) and NZEO children (20 percent; 17 percent). Mäori children obtained more selenium from Fish & seafood (males 27 percent; females 22 percent) than NZEO children (20 percent; 17 percent). Poultry provided more selenium to Pacific children (males 17 percent; females 18 percent) than Mäori (11 percent; 12 percent) and NZEO children (11 percent). NZEO children obtained a higher proportion of their selenium intake from Milk (5 percent) than Pacific children (2 percent).
Figure A-55: Major sources of selenium (females) and milk (males)
Figure A-56: Selenium from fish and seafood
0%
5%
10%
15%
20%
25%
30%
35%
Fish andseafood
Poultry Bread Grains andpasta
Pork
Source
Proportionof selenium Māori
Pacific
NZEO
0%
5%
10%
15%
20%
25%
30%
35%
I II III IV V
NZDep01 quintile
Proportionof selenium
Fish and seafood
Milk
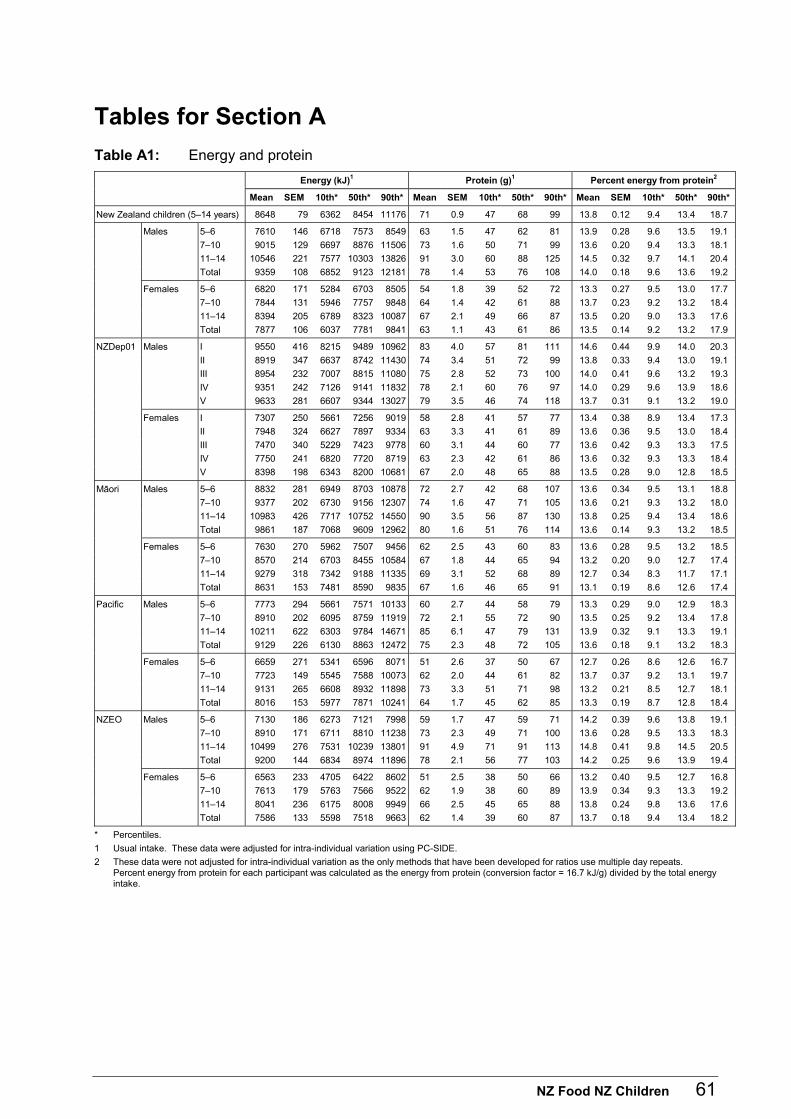
NZ Food NZ Children 61
Tables for Section A
Table A1: Energy and protein
Energy (kJ)1 Protein (g)1 Percent energy from protein2
Mean SEM 10th* 50th* 90th* Mean SEM 10th* 50th* 90th* Mean SEM 10th* 50th* 90th*
New Zealand children (5–14 years) 8648 79 6362 8454 11176 71 0.9 47 68 99 13.8 0.12 9.4 13.4 18.7
Males 5–6 7610 146 6718 7573 8549 63 1.5 47 62 81 13.9 0.28 9.6 13.5 19.1
7–10 9015 129 6697 8876 11506 73 1.6 50 71 99 13.6 0.20 9.4 13.3 18.1
11–14 10546 221 7577 10303 13826 91 3.0 60 88 125 14.5 0.32 9.7 14.1 20.4
Total 9359 108 6852 9123 12181 78 1.4 53 76 108 14.0 0.18 9.6 13.6 19.2
Females 5–6 6820 171 5284 6703 8505 54 1.8 39 52 72 13.3 0.27 9.5 13.0 17.7
7–10 7844 131 5946 7757 9848 64 1.4 42 61 88 13.7 0.23 9.2 13.2 18.4
11–14 8394 205 6789 8323 10087 67 2.1 49 66 87 13.5 0.20 9.0 13.3 17.6
Total 7877 106 6037 7781 9841 63 1.1 43 61 86 13.5 0.14 9.2 13.2 17.9
NZDep01 Males I 9550 416 8215 9489 10962 83 4.0 57 81 111 14.6 0.44 9.9 14.0 20.3
II 8919 347 6637 8742 11430 74 3.4 51 72 99 13.8 0.33 9.4 13.0 19.1
III 8954 232 7007 8815 11080 75 2.8 52 73 100 14.0 0.41 9.6 13.2 19.3
IV 9351 242 7126 9141 11832 78 2.1 60 76 97 14.0 0.29 9.6 13.9 18.6
V 9633 281 6607 9344 13027 79 3.5 46 74 118 13.7 0.31 9.1 13.2 19.0
Females I 7307 250 5661 7256 9019 58 2.8 41 57 77 13.4 0.38 8.9 13.4 17.3
II 7948 324 6627 7897 9334 63 3.3 41 61 89 13.6 0.36 9.5 13.0 18.4
III 7470 340 5229 7423 9778 60 3.1 44 60 77 13.6 0.42 9.3 13.3 17.5
IV 7750 241 6820 7720 8719 63 2.3 42 61 86 13.6 0.32 9.3 13.3 18.4
V 8398 198 6343 8200 10681 67 2.0 48 65 88 13.5 0.28 9.0 12.8 18.5
Mäori Males 5–6 8832 281 6949 8703 10878 72 2.7 42 68 107 13.6 0.34 9.5 13.1 18.8
7–10 9377 202 6730 9156 12307 74 1.6 47 71 105 13.6 0.21 9.3 13.2 18.0
11–14 10983 426 7717 10752 14550 90 3.5 56 87 130 13.8 0.25 9.4 13.4 18.6
Total 9861 187 7068 9609 12962 80 1.6 51 76 114 13.6 0.14 9.3 13.2 18.5
Females 5–6 7630 270 5962 7507 9456 62 2.5 43 60 83 13.6 0.28 9.5 13.2 18.5
7–10 8570 214 6703 8455 10584 67 1.8 44 65 94 13.2 0.20 9.0 12.7 17.4
11–14 9279 318 7342 9188 11335 69 3.1 52 68 89 12.7 0.34 8.3 11.7 17.1
Total 8631 153 7481 8590 9835 67 1.6 46 65 91 13.1 0.19 8.6 12.6 17.4
Pacific Males 5–6 7773 294 5661 7571 10133 60 2.7 44 58 79 13.3 0.29 9.0 12.9 18.3
7–10 8910 202 6095 8759 11919 72 2.1 55 72 90 13.5 0.25 9.2 13.4 17.8
11–14 10211 622 6303 9784 14671 85 6.1 47 79 131 13.9 0.32 9.1 13.3 19.1
Total 9129 226 6130 8863 12472 75 2.3 48 72 105 13.6 0.18 9.1 13.2 18.3
Females 5–6 6659 271 5341 6596 8071 51 2.6 37 50 67 12.7 0.26 8.6 12.6 16.7
7–10 7723 149 5545 7588 10073 62 2.0 44 61 82 13.7 0.37 9.2 13.1 19.7
11–14 9131 265 6608 8932 11898 73 3.3 51 71 98 13.2 0.21 8.5 12.7 18.1
Total 8016 153 5977 7871 10241 64 1.7 45 62 85 13.3 0.19 8.7 12.8 18.4
NZEO Males 5–6 7130 186 6273 7121 7998 59 1.7 47 59 71 14.2 0.39 9.6 13.8 19.1
7–10 8910 171 6711 8810 11238 73 2.3 49 71 100 13.6 0.28 9.5 13.3 18.3
11–14 10499 276 7531 10239 13801 91 4.9 71 91 113 14.8 0.41 9.8 14.5 20.5
Total 9200 144 6834 8974 11896 78 2.1 56 77 103 14.2 0.25 9.6 13.9 19.4
Females 5–6 6563 233 4705 6422 8602 51 2.5 38 50 66 13.2 0.40 9.5 12.7 16.8
7–10 7613 179 5763 7566 9522 62 1.9 38 60 89 13.9 0.34 9.3 13.3 19.2
11–14 8041 236 6175 8008 9949 66 2.5 45 65 88 13.8 0.24 9.8 13.6 17.6
Total 7586 133 5598 7518 9663 62 1.4 39 60 87 13.7 0.18 9.4 13.4 18.2
* Percentiles.
1 Usual intake. These data were adjusted for intra-individual variation using PC-SIDE.
2 These data were not adjusted for intra-individual variation as the only methods that have been developed for ratios use multiple day repeats. Percent energy from protein for each participant was calculated as the energy from protein (conversion factor = 16.7 kJ/g) divided by the total energy intake.
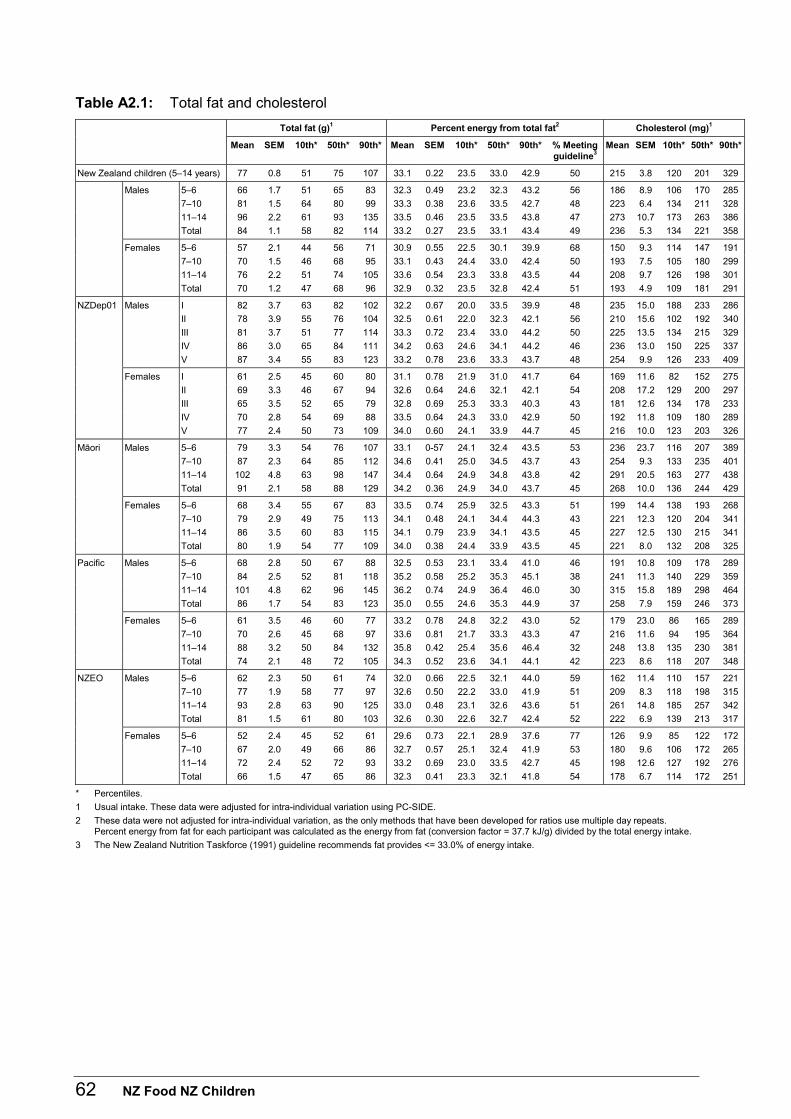
62 NZ Food NZ Children
Table A2.1: Total fat and cholesterol
Total fat (g)1 Percent energy from total fat2 Cholesterol (mg)1
Mean SEM 10th* 50th* 90th* Mean SEM 10th* 50th* 90th* % Meeting guideline3
Mean SEM 10th* 50th* 90th*
New Zealand children (5–14 years) 77 0.8 51 75 107 33.1 0.22 23.5 33.0 42.9 50 215 3.8 120 201 329
Males 5–6 66 1.7 51 65 83 32.3 0.49 23.2 32.3 43.2 56 186 8.9 106 170 285
7–10 81 1.5 64 80 99 33.3 0.38 23.6 33.5 42.7 48 223 6.4 134 211 328
11–14 96 2.2 61 93 135 33.5 0.46 23.5 33.5 43.8 47 273 10.7 173 263 386
Total 84 1.1 58 82 114 33.2 0.27 23.5 33.1 43.4 49 236 5.3 134 221 358
Females 5–6 57 2.1 44 56 71 30.9 0.55 22.5 30.1 39.9 68 150 9.3 114 147 191
7–10 70 1.5 46 68 95 33.1 0.43 24.4 33.0 42.4 50 193 7.5 105 180 299
11–14 76 2.2 51 74 105 33.6 0.54 23.3 33.8 43.5 44 208 9.7 126 198 301
Total 70 1.2 47 68 96 32.9 0.32 23.5 32.8 42.4 51 193 4.9 109 181 291
NZDep01 Males I 82 3.7 63 82 102 32.2 0.67 20.0 33.5 39.9 48 235 15.0 188 233 286
II 78 3.9 55 76 104 32.5 0.61 22.0 32.3 42.1 56 210 15.6 102 192 340
III 81 3.7 51 77 114 33.3 0.72 23.4 33.0 44.2 50 225 13.5 134 215 329
IV 86 3.0 65 84 111 34.2 0.63 24.6 34.1 44.2 46 236 13.0 150 225 337
V 87 3.4 55 83 123 33.2 0.78 23.6 33.3 43.7 48 254 9.9 126 233 409
Females I 61 2.5 45 60 80 31.1 0.78 21.9 31.0 41.7 64 169 11.6 82 152 275
II 69 3.3 46 67 94 32.6 0.64 24.6 32.1 42.1 54 208 17.2 129 200 297
III 65 3.5 52 65 79 32.8 0.69 25.3 33.3 40.3 43 181 12.6 134 178 233
IV 70 2.8 54 69 88 33.5 0.64 24.3 33.0 42.9 50 192 11.8 109 180 289
V 77 2.4 50 73 109 34.0 0.60 24.1 33.9 44.7 45 216 10.0 123 203 326
Mäori Males 5–6 79 3.3 54 76 107 33.1 0-57 24.1 32.4 43.5 53 236 23.7 116 207 389
7–10 87 2.3 64 85 112 34.6 0.41 25.0 34.5 43.7 43 254 9.3 133 235 401
11–14 102 4.8 63 98 147 34.4 0.64 24.9 34.8 43.8 42 291 20.5 163 277 438
Total 91 2.1 58 88 129 34.2 0.36 24.9 34.0 43.7 45 268 10.0 136 244 429
Females 5–6 68 3.4 55 67 83 33.5 0.74 25.9 32.5 43.3 51 199 14.4 138 193 268
7–10 79 2.9 49 75 113 34.1 0.48 24.1 34.4 44.3 43 221 12.3 120 204 341
11–14 86 3.5 60 83 115 34.1 0.79 23.9 34.1 43.5 45 227 12.5 130 215 341
Total 80 1.9 54 77 109 34.0 0.38 24.4 33.9 43.5 45 221 8.0 132 208 325
Pacific Males 5–6 68 2.8 50 67 88 32.5 0.53 23.1 33.4 41.0 46 191 10.8 109 178 289
7–10 84 2.5 52 81 118 35.2 0.58 25.2 35.3 45.1 38 241 11.3 140 229 359
11–14 101 4.8 62 96 145 36.2 0.74 24.9 36.4 46.0 30 315 15.8 189 298 464
Total 86 1.7 54 83 123 35.0 0.55 24.6 35.3 44.9 37 258 7.9 159 246 373
Females 5–6 61 3.5 46 60 77 33.2 0.78 24.8 32.2 43.0 52 179 23.0 86 165 289
7–10 70 2.6 45 68 97 33.6 0.81 21.7 33.3 43.3 47 216 11.6 94 195 364
11–14 88 3.2 50 84 132 35.8 0.42 25.4 35.6 46.4 32 248 13.8 135 230 381
Total 74 2.1 48 72 105 34.3 0.52 23.6 34.1 44.1 42 223 8.6 118 207 348
NZEO Males 5–6 62 2.3 50 61 74 32.0 0.66 22.5 32.1 44.0 59 162 11.4 110 157 221
7–10 77 1.9 58 77 97 32.6 0.50 22.2 33.0 41.9 51 209 8.3 118 198 315
11–14 93 2.8 63 90 125 33.0 0.48 23.1 32.6 43.6 51 261 14.8 185 257 342
Total 81 1.5 61 80 103 32.6 0.30 22.6 32.7 42.4 52 222 6.9 139 213 317
Females 5–6 52 2.4 45 52 61 29.6 0.73 22.1 28.9 37.6 77 126 9.9 85 122 172
7–10 67 2.0 49 66 86 32.7 0.57 25.1 32.4 41.9 53 180 9.6 106 172 265
11–14 72 2.4 52 72 93 33.2 0.69 23.0 33.5 42.7 45 198 12.6 127 192 276
Total 66 1.5 47 65 86 32.3 0.41 23.3 32.1 41.8 54 178 6.7 114 172 251
* Percentiles.
1 Usual intake. These data were adjusted for intra-individual variation using PC-SIDE.
2 These data were not adjusted for intra-individual variation, as the only methods that have been developed for ratios use multiple day repeats. Percent energy from fat for each participant was calculated as the energy from fat (conversion factor = 37.7 kJ/g) divided by the total energy intake.
3 The New Zealand Nutrition Taskforce (1991) guideline recommends fat provides <= 33.0% of energy intake.
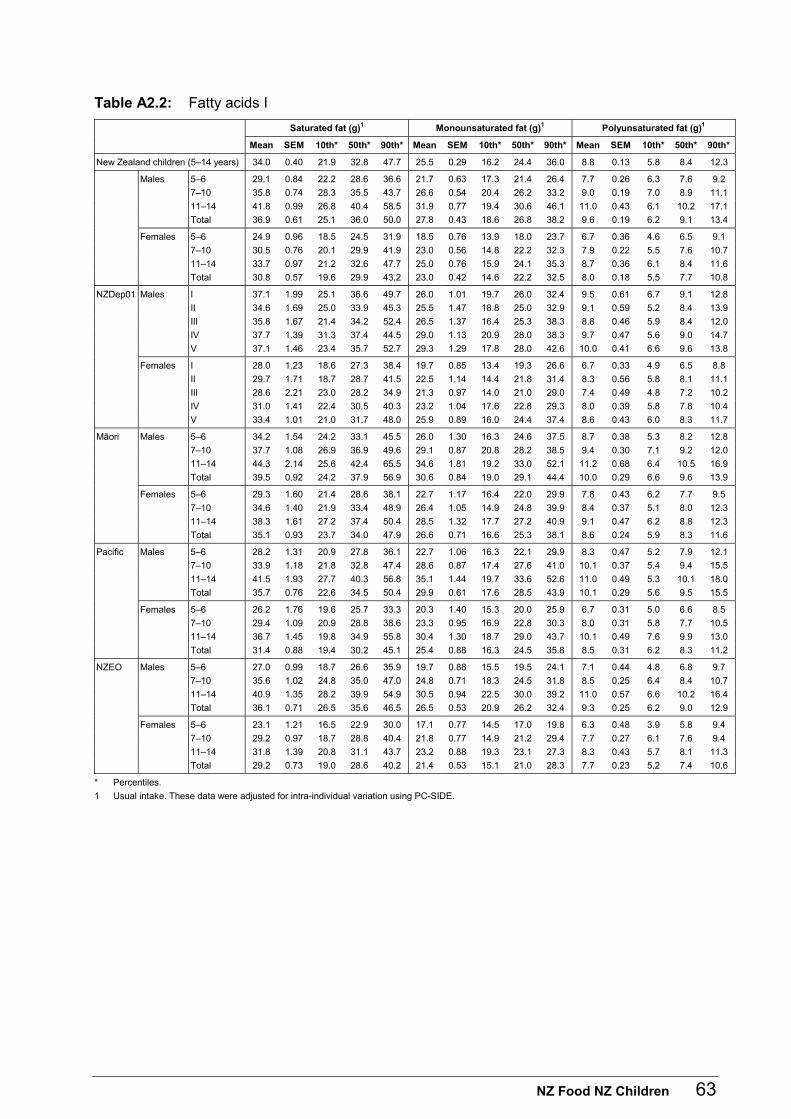
NZ Food NZ Children 63
Table A2.2: Fatty acids I
Saturated fat (g)1 Monounsaturated fat (g)1 Polyunsaturated fat (g)1
Mean SEM 10th* 50th* 90th* Mean SEM 10th* 50th* 90th* Mean SEM 10th* 50th* 90th*
New Zealand children (5–14 years) 34.0 0.40 21.9 32.8 47.7 25.5 0.29 16.2 24.4 36.0 8.8 0.13 5.8 8.4 12.3
Males 5–6 29.1 0.84 22.2 28.6 36.6 21.7 0.63 17.3 21.4 26.4 7.7 0.26 6.3 7.6 9.2
7–10 35.8 0.74 28.3 35.5 43.7 26.6 0.54 20.4 26.2 33.2 9.0 0.19 7.0 8.9 11.1
11–14 41.8 0.99 26.8 40.4 58.5 31.9 0.77 19.4 30.6 46.1 11.0 0.43 6.1 10.2 17.1
Total 36.9 0.61 25.1 36.0 50.0 27.8 0.43 18.6 26.8 38.2 9.6 0.19 6.2 9.1 13.4
Females 5–6 24.9 0.96 18.5 24.5 31.9 18.5 0.76 13.9 18.0 23.7 6.7 0.36 4.6 6.5 9.1
7–10 30.5 0.76 20.1 29.9 41.9 23.0 0.56 14.8 22.2 32.3 7.9 0.22 5.5 7.6 10.7
11–14 33.7 0.97 21.2 32.6 47.7 25.0 0.76 15.9 24.1 35.3 8.7 0.36 6.1 8.4 11.6
Total 30.8 0.57 19.6 29.9 43.2 23.0 0.42 14.6 22.2 32.5 8.0 0.18 5.5 7.7 10.8
NZDep01 Males I 37.1 1.99 25.1 36.6 49.7 26.0 1.01 19.7 26.0 32.4 9.5 0.61 6.7 9.1 12.8
II 34.6 1.69 25.0 33.9 45.3 25.5 1.47 18.8 25.0 32.9 9.1 0.59 5.2 8.4 13.9
III 35.8 1.67 21.4 34.2 52.4 26.5 1.37 16.4 25.3 38.3 8.8 0.46 5.9 8.4 12.0
IV 37.7 1.39 31.3 37.4 44.5 29.0 1.13 20.9 28.0 38.3 9.7 0.47 5.6 9.0 14.7
V 37.1 1.46 23.4 35.7 52.7 29.3 1.29 17.8 28.0 42.6 10.0 0.41 6.6 9.6 13.8
Females I 28.0 1.23 18.6 27.3 38.4 19.7 0.85 13.4 19.3 26.6 6.7 0.33 4.9 6.5 8.8
II 29.7 1.71 18.7 28.7 41.5 22.5 1.14 14.4 21.8 31.4 8.3 0.56 5.8 8.1 11.1
III 28.6 2.21 23.0 28.2 34.9 21.3 0.97 14.0 21.0 29.0 7.4 0.49 4.8 7.2 10.2
IV 31.0 1.41 22.4 30.5 40.3 23.2 1.04 17.6 22.8 29.3 8.0 0.39 5.8 7.8 10.4
V 33.4 1.01 21.0 31.7 48.0 25.9 0.89 16.0 24.4 37.4 8.6 0.43 6.0 8.3 11.7
Mäori Males 5–6 34.2 1.54 24.2 33.1 45.5 26.0 1.30 16.3 24.6 37.5 8.7 0.38 5.3 8.2 12.8
7–10 37.7 1.08 26.9 36.9 49.6 29.1 0.87 20.8 28.2 38.5 9.4 0.30 7.1 9.2 12.0
11–14 44.3 2.14 25.6 42.4 65.5 34.6 1.81 19.2 33.0 52.1 11.2 0.68 6.4 10.5 16.9
Total 39.5 0.92 24.2 37.9 56.9 30.6 0.84 19.0 29.1 44.4 10.0 0.29 6.6 9.6 13.9
Females 5–6 29.3 1.60 21.4 28.6 38.1 22.7 1.17 16.4 22.0 29.9 7.8 0.43 6.2 7.7 9.5
7–10 34.6 1.40 21.9 33.4 48.9 26.4 1.05 14.9 24.8 39.9 8.4 0.37 5.1 8.0 12.3
11–14 38.3 1.61 27.2 37.4 50.4 28.5 1.32 17.7 27.2 40.9 9.1 0.47 6.2 8.8 12.3
Total 35.1 0.93 23.7 34.0 47.9 26.6 0.71 16.6 25.3 38.1 8.6 0.24 5.9 8.3 11.6
Pacific Males 5–6 28.2 1.31 20.9 27.8 36.1 22.7 1.06 16.3 22.1 29.9 8.3 0.47 5.2 7.9 12.1
7–10 33.9 1.18 21.8 32.8 47.4 28.6 0.87 17.4 27.6 41.0 10.1 0.37 5.4 9.4 15.5
11–14 41.5 1.93 27.7 40.3 56.8 35.1 1.44 19.7 33.6 52.6 11.0 0.49 5.3 10.1 18.0
Total 35.7 0.76 22.6 34.5 50.4 29.9 0.61 17.6 28.5 43.9 10.1 0.29 5.6 9.5 15.5
Females 5–6 26.2 1.76 19.6 25.7 33.3 20.3 1.40 15.3 20.0 25.9 6.7 0.31 5.0 6.6 8.5
7–10 29.4 1.09 20.9 28.8 38.6 23.3 0.95 16.9 22.8 30.3 8.0 0.31 5.8 7.7 10.5
11–14 36.7 1.45 19.8 34.9 55.8 30.4 1.30 18.7 29.0 43.7 10.1 0.49 7.6 9.9 13.0
Total 31.4 0.88 19.4 30.2 45.1 25.4 0.88 16.3 24.5 35.8 8.5 0.31 6.2 8.3 11.2
NZEO Males 5–6 27.0 0.99 18.7 26.6 35.9 19.7 0.88 15.5 19.5 24.1 7.1 0.44 4.8 6.8 9.7
7–10 35.6 1.02 24.8 35.0 47.0 24.8 0.71 18.3 24.5 31.8 8.5 0.25 6.4 8.4 10.7
11–14 40.9 1.35 28.2 39.9 54.9 30.5 0.94 22.5 30.0 39.2 11.0 0.57 6.6 10.2 16.4
Total 36.1 0.71 26.5 35.6 46.5 26.5 0.53 20.9 26.2 32.4 9.3 0.25 6.2 9.0 12.9
Females 5–6 23.1 1.21 16.5 22.9 30.0 17.1 0.77 14.5 17.0 19.8 6.3 0.48 3.9 5.8 9.4
7–10 29.2 0.97 18.7 28.8 40.4 21.8 0.77 14.9 21.2 29.4 7.7 0.27 6.1 7.6 9.4
11–14 31.8 1.39 20.8 31.1 43.7 23.2 0.88 19.3 23.1 27.3 8.3 0.43 5.7 8.1 11.3
Total 29.2 0.73 19.0 28.6 40.2 21.4 0.53 15.1 21.0 28.3 7.7 0.23 5.2 7.4 10.6
* Percentiles.
1 Usual intake. These data were adjusted for intra-individual variation using PC-SIDE.
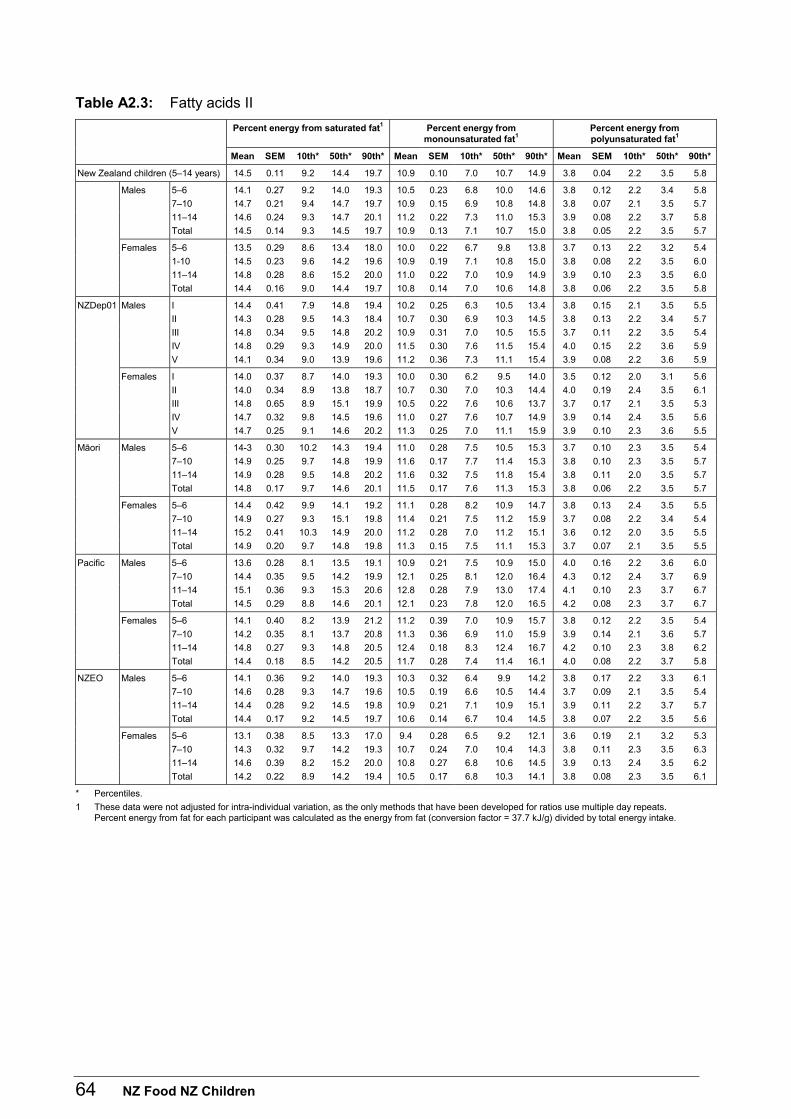
64 NZ Food NZ Children
Table A2.3: Fatty acids II
Percent energy from saturated fat1 Percent energy from monounsaturated fat1
Percent energy from polyunsaturated fat1
Mean SEM 10th* 50th* 90th* Mean SEM 10th* 50th* 90th* Mean SEM 10th* 50th* 90th*
New Zealand children (5–14 years) 14.5 0.11 9.2 14.4 19.7 10.9 0.10 7.0 10.7 14.9 3.8 0.04 2.2 3.5 5.8
Males 5–6 14.1 0.27 9.2 14.0 19.3 10.5 0.23 6.8 10.0 14.6 3.8 0.12 2.2 3.4 5.8
7–10 14.7 0.21 9.4 14.7 19.7 10.9 0.15 6.9 10.8 14.8 3.8 0.07 2.1 3.5 5.7
11–14 14.6 0.24 9.3 14.7 20.1 11.2 0.22 7.3 11.0 15.3 3.9 0.08 2.2 3.7 5.8
Total 14.5 0.14 9.3 14.5 19.7 10.9 0.13 7.1 10.7 15.0 3.8 0.05 2.2 3.5 5.7
Females 5–6 13.5 0.29 8.6 13.4 18.0 10.0 0.22 6.7 9.8 13.8 3.7 0.13 2.2 3.2 5.4
1-10 14.5 0.23 9.6 14.2 19.6 10.9 0.19 7.1 10.8 15.0 3.8 0.08 2.2 3.5 6.0
11–14 14.8 0.28 8.6 15.2 20.0 11.0 0.22 7.0 10.9 14.9 3.9 0.10 2.3 3.5 6.0
Total 14.4 0.16 9.0 14.4 19.7 10.8 0.14 7.0 10.6 14.8 3.8 0.06 2.2 3.5 5.8
NZDep01 Males I 14.4 0.41 7.9 14.8 19.4 10.2 0.25 6.3 10.5 13.4 3.8 0.15 2.1 3.5 5.5
II 14.3 0.28 9.5 14.3 18.4 10.7 0.30 6.9 10.3 14.5 3.8 0.13 2.2 3.4 5.7
III 14.8 0.34 9.5 14.8 20.2 10.9 0.31 7.0 10.5 15.5 3.7 0.11 2.2 3.5 5.4
IV 14.8 0.29 9.3 14.9 20.0 11.5 0.30 7.6 11.5 15.4 4.0 0.15 2.2 3.6 5.9
V 14.1 0.34 9.0 13.9 19.6 11.2 0.36 7.3 11.1 15.4 3.9 0.08 2.2 3.6 5.9
Females I 14.0 0.37 8.7 14.0 19.3 10.0 0.30 6.2 9.5 14.0 3.5 0.12 2.0 3.1 5.6
II 14.0 0.34 8.9 13.8 18.7 10.7 0.30 7.0 10.3 14.4 4.0 0.19 2.4 3.5 6.1
III 14.8 0.65 8.9 15.1 19.9 10.5 0.22 7.6 10.6 13.7 3.7 0.17 2.1 3.5 5.3
IV 14.7 0.32 9.8 14.5 19.6 11.0 0.27 7.6 10.7 14.9 3.9 0.14 2.4 3.5 5.6
V 14.7 0.25 9.1 14.6 20.2 11.3 0.25 7.0 11.1 15.9 3.9 0.10 2.3 3.6 5.5
Mäori Males 5–6 14-3 0.30 10.2 14.3 19.4 11.0 0.28 7.5 10.5 15.3 3.7 0.10 2.3 3.5 5.4
7–10 14.9 0.25 9.7 14.8 19.9 11.6 0.17 7.7 11.4 15.3 3.8 0.10 2.3 3.5 5.7
11–14 14.9 0.28 9.5 14.8 20.2 11.6 0.32 7.5 11.8 15.4 3.8 0.11 2.0 3.5 5.7
Total 14.8 0.17 9.7 14.6 20.1 11.5 0.17 7.6 11.3 15.3 3.8 0.06 2.2 3.5 5.7
Females 5–6 14.4 0.42 9.9 14.1 19.2 11.1 0.28 8.2 10.9 14.7 3.8 0.13 2.4 3.5 5.5
7–10 14.9 0.27 9.3 15.1 19.8 11.4 0.21 7.5 11.2 15.9 3.7 0.08 2.2 3.4 5.4
11–14 15.2 0.41 10.3 14.9 20.0 11.2 0.28 7.0 11.2 15.1 3.6 0.12 2.0 3.5 5.5
Total 14.9 0.20 9.7 14.8 19.8 11.3 0.15 7.5 11.1 15.3 3.7 0.07 2.1 3.5 5.5
Pacific Males 5–6 13.6 0.28 8.1 13.5 19.1 10.9 0.21 7.5 10.9 15.0 4.0 0.16 2.2 3.6 6.0
7–10 14.4 0.35 9.5 14.2 19.9 12.1 0.25 8.1 12.0 16.4 4.3 0.12 2.4 3.7 6.9
11–14 15.1 0.36 9.3 15.3 20.6 12.8 0.28 7.9 13.0 17.4 4.1 0.10 2.3 3.7 6.7
Total 14.5 0.29 8.8 14.6 20.1 12.1 0.23 7.8 12.0 16.5 4.2 0.08 2.3 3.7 6.7
Females 5–6 14.1 0.40 8.2 13.9 21.2 11.2 0.39 7.0 10.9 15.7 3.8 0.12 2.2 3.5 5.4
7–10 14.2 0.35 8.1 13.7 20.8 11.3 0.36 6.9 11.0 15.9 3.9 0.14 2.1 3.6 5.7
11–14 14.8 0.27 9.3 14.8 20.5 12.4 0.18 8.3 12.4 16.7 4.2 0.10 2.3 3.8 6.2
Total 14.4 0.18 8.5 14.2 20.5 11.7 0.28 7.4 11.4 16.1 4.0 0.08 2.2 3.7 5.8
NZEO Males 5–6 14.1 0.36 9.2 14.0 19.3 10.3 0.32 6.4 9.9 14.2 3.8 0.17 2.2 3.3 6.1
7–10 14.6 0.28 9.3 14.7 19.6 10.5 0.19 6.6 10.5 14.4 3.7 0.09 2.1 3.5 5.4
11–14 14.4 0.28 9.2 14.5 19.8 10.9 0.21 7.1 10.9 15.1 3.9 0.11 2.2 3.7 5.7
Total 14.4 0.17 9.2 14.5 19.7 10.6 0.14 6.7 10.4 14.5 3.8 0.07 2.2 3.5 5.6
Females 5–6 13.1 0.38 8.5 13.3 17.0 9.4 0.28 6.5 9.2 12.1 3.6 0.19 2.1 3.2 5.3
7–10 14.3 0.32 9.7 14.2 19.3 10.7 0.24 7.0 10.4 14.3 3.8 0.11 2.3 3.5 6.3
11–14 14.6 0.39 8.2 15.2 20.0 10.8 0.27 6.8 10.6 14.5 3.9 0.13 2.4 3.5 6.2
Total 14.2 0.22 8.9 14.2 19.4 10.5 0.17 6.8 10.3 14.1 3.8 0.08 2.3 3.5 6.1
* Percentiles.
1 These data were not adjusted for intra-individual variation, as the only methods that have been developed for ratios use multiple day repeats. Percent energy from fat for each participant was calculated as the energy from fat (conversion factor = 37.7 kJ/g) divided by total energy intake.
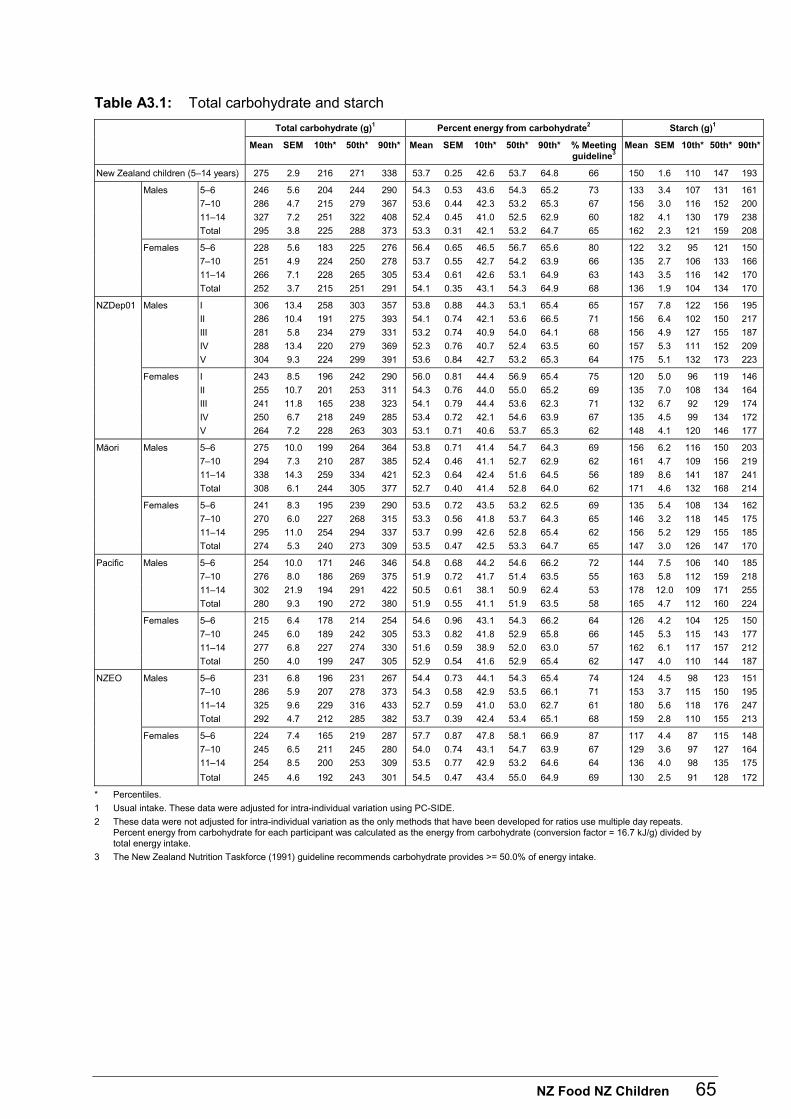
NZ Food NZ Children 65
Table A3.1: Total carbohydrate and starch
Total carbohydrate (g)1 Percent energy from carbohydrate2 Starch (g)1
Mean SEM 10th* 50th* 90th* Mean SEM 10th* 50th* 90th* % Meeting guideline3
Mean SEM 10th* 50th* 90th*
New Zealand children (5–14 years) 275 2.9 216 271 338 53.7 0.25 42.6 53.7 64.8 66 150 1.6 110 147 193
Males 5–6 246 5.6 204 244 290 54.3 0.53 43.6 54.3 65.2 73 133 3.4 107 131 161
7–10 286 4.7 215 279 367 53.6 0.44 42.3 53.2 65.3 67 156 3.0 116 152 200
11–14 327 7.2 251 322 408 52.4 0.45 41.0 52.5 62.9 60 182 4.1 130 179 238
Total 295 3.8 225 288 373 53.3 0.31 42.1 53.2 64.7 65 162 2.3 121 159 208
Females 5–6 228 5.6 183 225 276 56.4 0.65 46.5 56.7 65.6 80 122 3.2 95 121 150
7–10 251 4.9 224 250 278 53.7 0.55 42.7 54.2 63.9 66 135 2.7 106 133 166
11–14 266 7.1 228 265 305 53.4 0.61 42.6 53.1 64.9 63 143 3.5 116 142 170
Total 252 3.7 215 251 291 54.1 0.35 43.1 54.3 64.9 68 136 1.9 104 134 170
NZDep01 Males I 306 13.4 258 303 357 53.8 0.88 44.3 53.1 65.4 65 157 7.8 122 156 195
II 286 10.4 191 275 393 54.1 0.74 42.1 53.6 66.5 71 156 6.4 102 150 217
III 281 5.8 234 279 331 53.2 0.74 40.9 54.0 64.1 68 156 4.9 127 155 187
IV 288 13.4 220 279 369 52.3 0.76 40.7 52.4 63.5 60 157 5.3 111 152 209
V 304 9.3 224 299 391 53.6 0.84 42.7 53.2 65.3 64 175 5.1 132 173 223
Females I 243 8.5 196 242 290 56.0 0.81 44.4 56.9 65.4 75 120 5.0 96 119 146
II 255 10.7 201 253 311 54.3 0.76 44.0 55.0 65.2 69 135 7.0 108 134 164
III 241 11.8 165 238 323 54.1 0.79 44.4 53.6 62.3 71 132 6.7 92 129 174
IV 250 6.7 218 249 285 53.4 0.72 42.1 54.6 63.9 67 135 4.5 99 134 172
V 264 7.2 228 263 303 53.1 0.71 40.6 53.7 65.3 62 148 4.1 120 146 177
Mäori Males 5–6 275 10.0 199 264 364 53.8 0.71 41.4 54.7 64.3 69 156 6.2 116 150 203
7–10 294 7.3 210 287 385 52.4 0.46 41.1 52.7 62.9 62 161 4.7 109 156 219
11–14 338 14.3 259 334 421 52.3 0.64 42.4 51.6 64.5 56 189 8.6 141 187 241
Total 308 6.1 244 305 377 52.7 0.40 41.4 52.8 64.0 62 171 4.6 132 168 214
Females 5–6 241 8.3 195 239 290 53.5 0.72 43.5 53.2 62.5 69 135 5.4 108 134 162
7–10 270 6.0 227 268 315 53.3 0.56 41.8 53.7 64.3 65 146 3.2 118 145 175
11–14 295 11.0 254 294 337 53.7 0.99 42.6 52.8 65.4 62 156 5.2 129 155 185
Total 274 5.3 240 273 309 53.5 0.47 42.5 53.3 64.7 65 147 3.0 126 147 170
Pacific Males 5–6 254 10.0 171 246 346 54.8 0.68 44.2 54.6 66.2 72 144 7.5 106 140 185
7–10 276 8.0 186 269 375 51.9 0.72 41.7 51.4 63.5 55 163 5.8 112 159 218
11–14 302 21.9 194 291 422 50.5 0.61 38.1 50.9 62.4 53 178 12.0 109 171 255
Total 280 9.3 190 272 380 51.9 0.55 41.1 51.9 63.5 58 165 4.7 112 160 224
Females 5–6 215 6.4 178 214 254 54.6 0.96 43.1 54.3 66.2 64 126 4.2 104 125 150
7–10 245 6.0 189 242 305 53.3 0.82 41.8 52.9 65.8 66 145 5.3 115 143 177
11–14 277 6.8 227 274 330 51.6 0.59 38.9 52.0 63.0 57 162 6.1 117 157 212
Total 250 4.0 199 247 305 52.9 0.54 41.6 52.9 65.4 62 147 4.0 110 144 187
NZEO Males 5–6 231 6.8 196 231 267 54.4 0.73 44.1 54.3 65.4 74 124 4.5 98 123 151
7–10 286 5.9 207 278 373 54.3 0.58 42.9 53.5 66.1 71 153 3.7 115 150 195
11–14 325 9.6 229 316 433 52.7 0.59 41.0 53.0 62.7 61 180 5.6 118 176 247
Total 292 4.7 212 285 382 53.7 0.39 42.4 53.4 65.1 68 159 2.8 110 155 213
Females 5–6 224 7.4 165 219 287 57.7 0.87 47.8 58.1 66.9 87 117 4.4 87 115 148
7–10 245 6.5 211 245 280 54.0 0.74 43.1 54.7 63.9 67 129 3.6 97 127 164
11–14 254 8.5 200 253 309 53.5 0.77 42.9 53.2 64.6 64 136 4.0 98 135 175
Total 245 4.6 192 243 301 54.5 0.47 43.4 55.0 64.9 69 130 2.5 91 128 172
* Percentiles.
1 Usual intake. These data were adjusted for intra-individual variation using PC-SIDE.
2 These data were not adjusted for intra-individual variation as the only methods that have been developed for ratios use multiple day repeats. Percent energy from carbohydrate for each participant was calculated as the energy from carbohydrate (conversion factor = 16.7 kJ/g) divided by total energy intake.
3 The New Zealand Nutrition Taskforce (1991) guideline recommends carbohydrate provides >= 50.0% of energy intake.
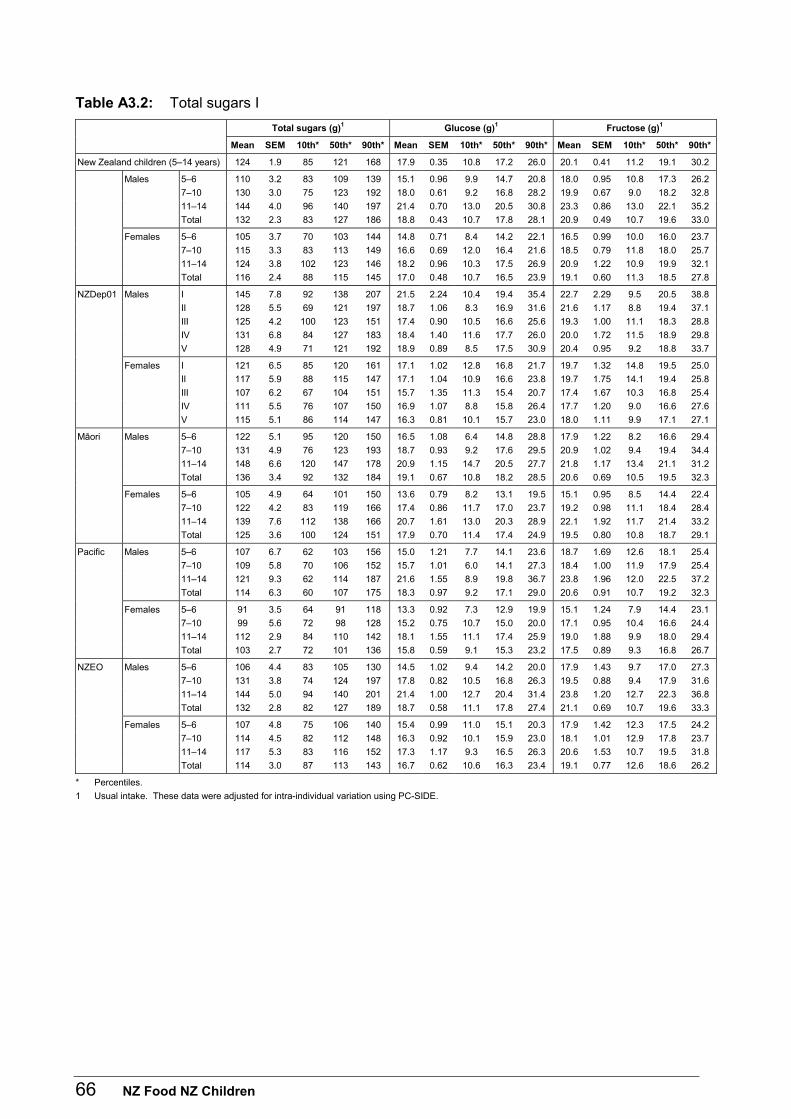
66 NZ Food NZ Children
Table A3.2: Total sugars I
Total sugars (g)1 Glucose (g)1 Fructose (g)1
Mean SEM 10th* 50th* 90th* Mean SEM 10th* 50th* 90th* Mean SEM 10th* 50th* 90th*
New Zealand children (5–14 years) 124 1.9 85 121 168 17.9 0.35 10.8 17.2 26.0 20.1 0.41 11.2 19.1 30.2
Males 5–6 110 3.2 83 109 139 15.1 0.96 9.9 14.7 20.8 18.0 0.95 10.8 17.3 26.2
7–10 130 3.0 75 123 192 18.0 0.61 9.2 16.8 28.2 19.9 0.67 9.0 18.2 32.8
11–14 144 4.0 96 140 197 21.4 0.70 13.0 20.5 30.8 23.3 0.86 13.0 22.1 35.2
Total 132 2.3 83 127 186 18.8 0.43 10.7 17.8 28.1 20.9 0.49 10.7 19.6 33.0
Females 5–6 105 3.7 70 103 144 14.8 0.71 8.4 14.2 22.1 16.5 0.99 10.0 16.0 23.7
7–10 115 3.3 83 113 149 16.6 0.69 12.0 16.4 21.6 18.5 0.79 11.8 18.0 25.7
11–14 124 3.8 102 123 146 18.2 0.96 10.3 17.5 26.9 20.9 1.22 10.9 19.9 32.1
Total 116 2.4 88 115 145 17.0 0.48 10.7 16.5 23.9 19.1 0.60 11.3 18.5 27.8
NZDep01 Males I 145 7.8 92 138 207 21.5 2.24 10.4 19.4 35.4 22.7 2.29 9.5 20.5 38.8
II 128 5.5 69 121 197 18.7 1.06 8.3 16.9 31.6 21.6 1.17 8.8 19.4 37.1
III 125 4.2 100 123 151 17.4 0.90 10.5 16.6 25.6 19.3 1.00 11.1 18.3 28.8
IV 131 6.8 84 127 183 18.4 1.40 11.6 17.7 26.0 20.0 1.72 11.5 18.9 29.8
V 128 4.9 71 121 192 18.9 0.89 8.5 17.5 30.9 20.4 0.95 9.2 18.8 33.7
Females I 121 6.5 85 120 161 17.1 1.02 12.8 16.8 21.7 19.7 1.32 14.8 19.5 25.0
II 117 5.9 88 115 147 17.1 1.04 10.9 16.6 23.8 19.7 1.75 14.1 19.4 25.8
III 107 6.2 67 104 151 15.7 1.35 11.3 15.4 20.7 17.4 1.67 10.3 16.8 25.4
IV 111 5.5 76 107 150 16.9 1.07 8.8 15.8 26.4 17.7 1.20 9.0 16.6 27.6
V 115 5.1 86 114 147 16.3 0.81 10.1 15.7 23.0 18.0 1.11 9.9 17.1 27.1
Mäori Males 5–6 122 5.1 95 120 150 16.5 1.08 6.4 14.8 28.8 17.9 1.22 8.2 16.6 29.4
7–10 131 4.9 76 123 193 18.7 0.93 9.2 17.6 29.5 20.9 1.02 9.4 19.4 34.4
11–14 148 6.6 120 147 178 20.9 1.15 14.7 20.5 27.7 21.8 1.17 13.4 21.1 31.2
Total 136 3.4 92 132 184 19.1 0.67 10.8 18.2 28.5 20.6 0.69 10.5 19.5 32.3
Females 5–6 105 4.9 64 101 150 13.6 0.79 8.2 13.1 19.5 15.1 0.95 8.5 14.4 22.4
7–10 122 4.2 83 119 166 17.4 0.86 11.7 17.0 23.7 19.2 0.98 11.1 18.4 28.4
11–14 139 7.6 112 138 166 20.7 1.61 13.0 20.3 28.9 22.1 1.92 11.7 21.4 33.2
Total 125 3.6 100 124 151 17.9 0.70 11.4 17.4 24.9 19.5 0.80 10.8 18.7 29.1
Pacific Males 5–6 107 6.7 62 103 156 15.0 1.21 7.7 14.1 23.6 18.7 1.69 12.6 18.1 25.4
7–10 109 5.8 70 106 152 15.7 1.01 6.0 14.1 27.3 18.4 1.00 11.9 17.9 25.4
11–14 121 9.3 62 114 187 21.6 1.55 8.9 19.8 36.7 23.8 1.96 12.0 22.5 37.2
Total 114 6.3 60 107 175 18.3 0.97 9.2 17.1 29.0 20.6 0.91 10.7 19.2 32.3
Females 5–6 91 3.5 64 91 118 13.3 0.92 7.3 12.9 19.9 15.1 1.24 7.9 14.4 23.1
7–10 99 5.6 72 98 128 15.2 0.75 10.7 15.0 20.0 17.1 0.95 10.4 16.6 24.4
11–14 112 2.9 84 110 142 18.1 1.55 11.1 17.4 25.9 19.0 1.88 9.9 18.0 29.4
Total 103 2.7 72 101 136 15.8 0.59 9.1 15.3 23.2 17.5 0.89 9.3 16.8 26.7
NZEO Males 5–6 106 4.4 83 105 130 14.5 1.02 9.4 14.2 20.0 17.9 1.43 9.7 17.0 27.3
7–10 131 3.8 74 124 197 17.8 0.82 10.5 16.8 26.3 19.5 0.88 9.4 17.9 31.6
11–14 144 5.0 94 140 201 21.4 1.00 12.7 20.4 31.4 23.8 1.20 12.7 22.3 36.8
Total 132 2.8 82 127 189 18.7 0.58 11.1 17.8 27.4 21.1 0.69 10.7 19.6 33.3
Females 5–6 107 4.8 75 106 140 15.4 0.99 11.0 15.1 20.3 17.9 1.42 12.3 17.5 24.2
7–10 114 4.5 82 112 148 16.3 0.92 10.1 15.9 23.0 18.1 1.01 12.9 17.8 23.7
11–14 117 5.3 83 116 152 17.3 1.17 9.3 16.5 26.3 20.6 1.53 10.7 19.5 31.8
Total 114 3.0 87 113 143 16.7 0.62 10.6 16.3 23.4 19.1 0.77 12.6 18.6 26.2
* Percentiles.
1 Usual intake. These data were adjusted for intra-individual variation using PC-SIDE.
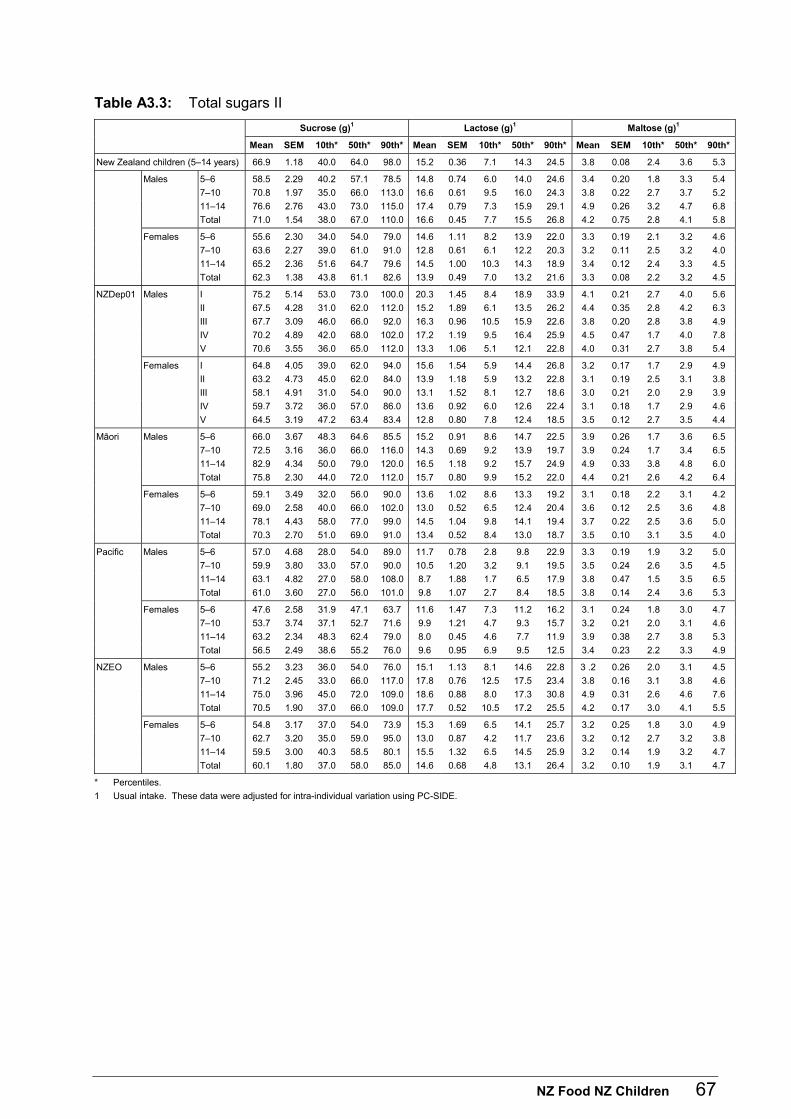
NZ Food NZ Children 67
Table A3.3: Total sugars II
Sucrose (g)1 Lactose (g)1 Maltose (g)1
Mean SEM 10th* 50th* 90th* Mean SEM 10th* 50th* 90th* Mean SEM 10th* 50th* 90th*
New Zealand children (5–14 years) 66.9 1.18 40.0 64.0 98.0 15.2 0.36 7.1 14.3 24.5 3.8 0.08 2.4 3.6 5.3
Males 5–6 58.5 2.29 40.2 57.1 78.5 14.8 0.74 6.0 14.0 24.6 3.4 0.20 1.8 3.3 5.4
7–10 70.8 1.97 35.0 66.0 113.0 16.6 0.61 9.5 16.0 24.3 3.8 0.22 2.7 3.7 5.2
11–14 76.6 2.76 43.0 73.0 115.0 17.4 0.79 7.3 15.9 29.1 4.9 0.26 3.2 4.7 6.8
Total 71.0 1.54 38.0 67.0 110.0 16.6 0.45 7.7 15.5 26.8 4.2 0.75 2.8 4.1 5.8
Females 5–6 55.6 2.30 34.0 54.0 79.0 14.6 1.11 8.2 13.9 22.0 3.3 0.19 2.1 3.2 4.6
7–10 63.6 2.27 39.0 61.0 91.0 12.8 0.61 6.1 12.2 20.3 3.2 0.11 2.5 3.2 4.0
11–14 65.2 2.36 51.6 64.7 79.6 14.5 1.00 10.3 14.3 18.9 3.4 0.12 2.4 3.3 4.5
Total 62.3 1.38 43.8 61.1 82.6 13.9 0.49 7.0 13.2 21.6 3.3 0.08 2.2 3.2 4.5
NZDep01 Males I 75.2 5.14 53.0 73.0 100.0 20.3 1.45 8.4 18.9 33.9 4.1 0.21 2.7 4.0 5.6
II 67.5 4.28 31.0 62.0 112.0 15.2 1.89 6.1 13.5 26.2 4.4 0.35 2.8 4.2 6.3
III 67.7 3.09 46.0 66.0 92.0 16.3 0.96 10.5 15.9 22.6 3.8 0.20 2.8 3.8 4.9
IV 70.2 4.89 42.0 68.0 102.0 17.2 1.19 9.5 16.4 25.9 4.5 0.47 1.7 4.0 7.8
V 70.6 3.55 36.0 65.0 112.0 13.3 1.06 5.1 12.1 22.8 4.0 0.31 2.7 3.8 5.4
Females I 64.8 4.05 39.0 62.0 94.0 15.6 1.54 5.9 14.4 26.8 3.2 0.17 1.7 2.9 4.9
II 63.2 4.73 45.0 62.0 84.0 13.9 1.18 5.9 13.2 22.8 3.1 0.19 2.5 3.1 3.8
III 58.1 4.91 31.0 54.0 90.0 13.1 1.52 8.1 12.7 18.6 3.0 0.21 2.0 2.9 3.9
IV 59.7 3.72 36.0 57.0 86.0 13.6 0.92 6.0 12.6 22.4 3.1 0.18 1.7 2.9 4.6
V 64.5 3.19 47.2 63.4 83.4 12.8 0.80 7.8 12.4 18.5 3.5 0.12 2.7 3.5 4.4
Mäori Males 5–6 66.0 3.67 48.3 64.6 85.5 15.2 0.91 8.6 14.7 22.5 3.9 0.26 1.7 3.6 6.5
7–10 72.5 3.16 36.0 66.0 116.0 14.3 0.69 9.2 13.9 19.7 3.9 0.24 1.7 3.4 6.5
11–14 82.9 4.34 50.0 79.0 120.0 16.5 1.18 9.2 15.7 24.9 4.9 0.33 3.8 4.8 6.0
Total 75.8 2.30 44.0 72.0 112.0 15.7 0.80 9.9 15.2 22.0 4.4 0.21 2.6 4.2 6.4
Females 5–6 59.1 3.49 32.0 56.0 90.0 13.6 1.02 8.6 13.3 19.2 3.1 0.18 2.2 3.1 4.2
7–10 69.0 2.58 40.0 66.0 102.0 13.0 0.52 6.5 12.4 20.4 3.6 0.12 2.5 3.6 4.8
11–14 78.1 4.43 58.0 77.0 99.0 14.5 1.04 9.8 14.1 19.4 3.7 0.22 2.5 3.6 5.0
Total 70.3 2.70 51.0 69.0 91.0 13.4 0.52 8.4 13.0 18.7 3.5 0.10 3.1 3.5 4.0
Pacific Males 5–6 57.0 4.68 28.0 54.0 89.0 11.7 0.78 2.8 9.8 22.9 3.3 0.19 1.9 3.2 5.0
7–10 59.9 3.80 33.0 57.0 90.0 10.5 1.20 3.2 9.1 19.5 3.5 0.24 2.6 3.5 4.5
11–14 63.1 4.82 27.0 58.0 108.0 8.7 1.88 1.7 6.5 17.9 3.8 0.47 1.5 3.5 6.5
Total 61.0 3.60 27.0 56.0 101.0 9.8 1.07 2.7 8.4 18.5 3.8 0.14 2.4 3.6 5.3
Females 5–6 47.6 2.58 31.9 47.1 63.7 11.6 1.47 7.3 11.2 16.2 3.1 0.24 1.8 3.0 4.7
7–10 53.7 3.74 37.1 52.7 71.6 9.9 1.21 4.7 9.3 15.7 3.2 0.21 2.0 3.1 4.6
11–14 63.2 2.34 48.3 62.4 79.0 8.0 0.45 4.6 7.7 11.9 3.9 0.38 2.7 3.8 5.3
Total 56.5 2.49 38.6 55.2 76.0 9.6 0.95 6.9 9.5 12.5 3.4 0.23 2.2 3.3 4.9
NZEO Males 5–6 55.2 3.23 36.0 54.0 76.0 15.1 1.13 8.1 14.6 22.8 3 .2 0.26 2.0 3.1 4.5
7–10 71.2 2.45 33.0 66.0 117.0 17.8 0.76 12.5 17.5 23.4 3.8 0.16 3.1 3.8 4.6
11–14 75.0 3.96 45.0 72.0 109.0 18.6 0.88 8.0 17.3 30.8 4.9 0.31 2.6 4.6 7.6
Total 70.5 1.90 37.0 66.0 109.0 17.7 0.52 10.5 17.2 25.5 4.2 0.17 3.0 4.1 5.5
Females 5–6 54.8 3.17 37.0 54.0 73.9 15.3 1.69 6.5 14.1 25.7 3.2 0.25 1.8 3.0 4.9
7–10 62.7 3.20 35.0 59.0 95.0 13.0 0.87 4.2 11.7 23.6 3.2 0.12 2.7 3.2 3.8
11–14 59.5 3.00 40.3 58.5 80.1 15.5 1.32 6.5 14.5 25.9 3.2 0.14 1.9 3.2 4.7
Total 60.1 1.80 37.0 58.0 85.0 14.6 0.68 4.8 13.1 26.4 3.2 0.10 1.9 3.1 4.7
* Percentiles.
1 Usual intake. These data were adjusted for intra-individual variation using PC-SIDE.
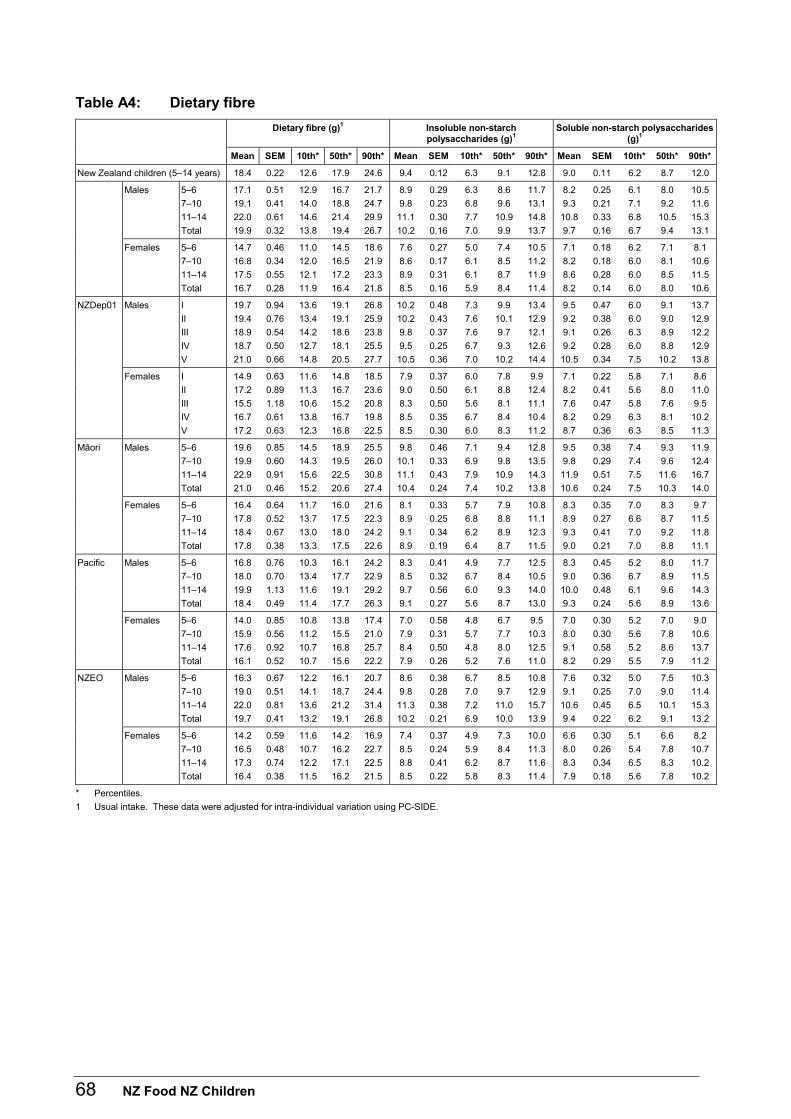
68 NZ Food NZ Children
Table A4: Dietary fibre
Dietary fibre (g)1 Insoluble non-starch polysaccharides (g)1
Soluble non-starch polysaccharides (g)1
Mean SEM 10th* 50th* 90th* Mean SEM 10th* 50th* 90th* Mean SEM 10th* 50th* 90th*
New Zealand children (5–14 years) 18.4 0.22 12.6 17.9 24.6 9.4 0.12 6.3 9.1 12.8 9.0 0.11 6.2 8.7 12.0
Males 5–6 17.1 0.51 12.9 16.7 21.7 8.9 0.29 6.3 8.6 11.7 8.2 0.25 6.1 8.0 10.5
7–10 19.1 0.41 14.0 18.8 24.7 9.8 0.23 6.8 9.6 13.1 9.3 0.21 7.1 9.2 11.6
11–14 22.0 0.61 14.6 21.4 29.9 11.1 0.30 7.7 10.9 14.8 10.8 0.33 6.8 10.5 15.3
Total 19.9 0.32 13.8 19.4 26.7 10.2 0.16 7.0 9.9 13.7 9.7 0.16 6.7 9.4 13.1
Females 5–6 14.7 0.46 11.0 14.5 18.6 7.6 0.27 5.0 7.4 10.5 7.1 0.18 6.2 7.1 8.1
7–10 16.8 0.34 12.0 16.5 21.9 8.6 0.17 6.1 8.5 11.2 8.2 0.18 6.0 8.1 10.6
11–14 17.5 0.55 12.1 17.2 23.3 8.9 0.31 6.1 8.7 11.9 8.6 0.28 6.0 8.5 11.5
Total 16.7 0.28 11.9 16.4 21.8 8.5 0.16 5.9 8.4 11.4 8.2 0.14 6.0 8.0 10.6
NZDep01 Males I 19.7 0.94 13.6 19.1 26.8 10.2 0.48 7.3 9.9 13.4 9.5 0.47 6.0 9.1 13.7
II 19.4 0.76 13.4 19.1 25.9 10.2 0.43 7.6 10.1 12.9 9.2 0.38 6.0 9.0 12.9
III 18.9 0.54 14.2 18.6 23.8 9.8 0.37 7.6 9.7 12.1 9.1 0.26 6.3 8.9 12.2
IV 18.7 0.50 12.7 18.1 25.5 9.5 0.25 6.7 9.3 12.6 9.2 0.28 6.0 8.8 12.9
V 21.0 0.66 14.8 20.5 27.7 10.5 0.36 7.0 10.2 14.4 10.5 0.34 7.5 10.2 13.8
Females I 14.9 0.63 11.6 14.8 18.5 7.9 0.37 6.0 7.8 9.9 7.1 0.22 5.8 7.1 8.6
II 17.2 0.89 11.3 16.7 23.6 9.0 0.50 6.1 8.8 12.4 8.2 0.41 5.6 8.0 11.0
III 15.5 1.18 10.6 15.2 20.8 8.3 0.50 5.6 8.1 11.1 7.6 0.47 5.8 7.6 9.5
IV 16.7 0.61 13.8 16.7 19.8 8.5 0.35 6.7 8.4 10.4 8.2 0.29 6.3 8.1 10.2
V 17.2 0.63 12.3 16.8 22.5 8.5 0.30 6.0 8.3 11.2 8.7 0.36 6.3 8.5 11.3
Mäori Males 5–6 19.6 0.85 14.5 18.9 25.5 9.8 0.46 7.1 9.4 12.8 9.5 0.38 7.4 9.3 11.9
7–10 19.9 0.60 14.3 19.5 26.0 10.1 0.33 6.9 9.8 13.5 9.8 0.29 7.4 9.6 12.4
11–14 22.9 0.91 15.6 22.5 30.8 11.1 0.43 7.9 10.9 14.3 11.9 0.51 7.5 11.6 16.7
Total 21.0 0.46 15.2 20.6 27.4 10.4 0.24 7.4 10.2 13.8 10.6 0.24 7.5 10.3 14.0
Females 5–6 16.4 0.64 11.7 16.0 21.6 8.1 0.33 5.7 7.9 10.8 8.3 0.35 7.0 8.3 9.7
7–10 17.8 0.52 13.7 17.5 22.3 8.9 0.25 6.8 8.8 11.1 8.9 0.27 6.6 8.7 11.5
11–14 18.4 0.67 13.0 18.0 24.2 9.1 0.34 6.2 8.9 12.3 9.3 0.41 7.0 9.2 11.8
Total 17.8 0.38 13.3 17.5 22.6 8.9 0.19 6.4 8.7 11.5 9.0 0.21 7.0 8.8 11.1
Pacific Males 5–6 16.8 0.76 10.3 16.1 24.2 8.3 0.41 4.9 7.7 12.5 8.3 0.45 5.2 8.0 11.7
7–10 18.0 0.70 13.4 17.7 22.9 8.5 0.32 6.7 8.4 10.5 9.0 0.36 6.7 8.9 11.5
11–14 19.9 1.13 11.6 19.1 29.2 9.7 0.56 6.0 9.3 14.0 10.0 0.48 6.1 9.6 14.3
Total 18.4 0.49 11.4 17.7 26.3 9.1 0.27 5.6 8.7 13.0 9.3 0.24 5.6 8.9 13.6
Females 5–6 14.0 0.85 10.8 13.8 17.4 7.0 0.58 4.8 6.7 9.5 7.0 0.30 5.2 7.0 9.0
7–10 15.9 0.56 11.2 15.5 21.0 7.9 0.31 5.7 7.7 10.3 8.0 0.30 5.6 7.8 10.6
11–14 17.6 0.92 10.7 16.8 25.7 8.4 0.50 4.8 8.0 12.5 9.1 0.58 5.2 8.6 13.7
Total 16.1 0.52 10.7 15.6 22.2 7.9 0.26 5.2 7.6 11.0 8.2 0.29 5.5 7.9 11.2
NZEO Males 5–6 16.3 0.67 12.2 16.1 20.7 8.6 0.38 6.7 8.5 10.8 7.6 0.32 5.0 7.5 10.3
7–10 19.0 0.51 14.1 18.7 24.4 9.8 0.28 7.0 9.7 12.9 9.1 0.25 7.0 9.0 11.4
11–14 22.0 0.81 13.6 21.2 31.4 11.3 0.38 7.2 11.0 15.7 10.6 0.45 6.5 10.1 15.3
Total 19.7 0.41 13.2 19.1 26.8 10.2 0.21 6.9 10.0 13.9 9.4 0.22 6.2 9.1 13.2
Females 5–6 14.2 0.59 11.6 14.2 16.9 7.4 0.37 4.9 7.3 10.0 6.6 0.30 5.1 6.6 8.2
7–10 16.5 0.48 10.7 16.2 22.7 8.5 0.24 5.9 8.4 11.3 8.0 0.26 5.4 7.8 10.7
11–14 17.3 0.74 12.2 17.1 22.5 8.8 0.41 6.2 8.7 11.6 8.3 0.34 6.5 8.3 10.2
Total 16.4 0.38 11.5 16.2 21.5 8.5 0.22 5.8 8.3 11.4 7.9 0.18 5.6 7.8 10.2
* Percentiles.
1 Usual intake. These data were adjusted for intra-individual variation using PC-SIDE.
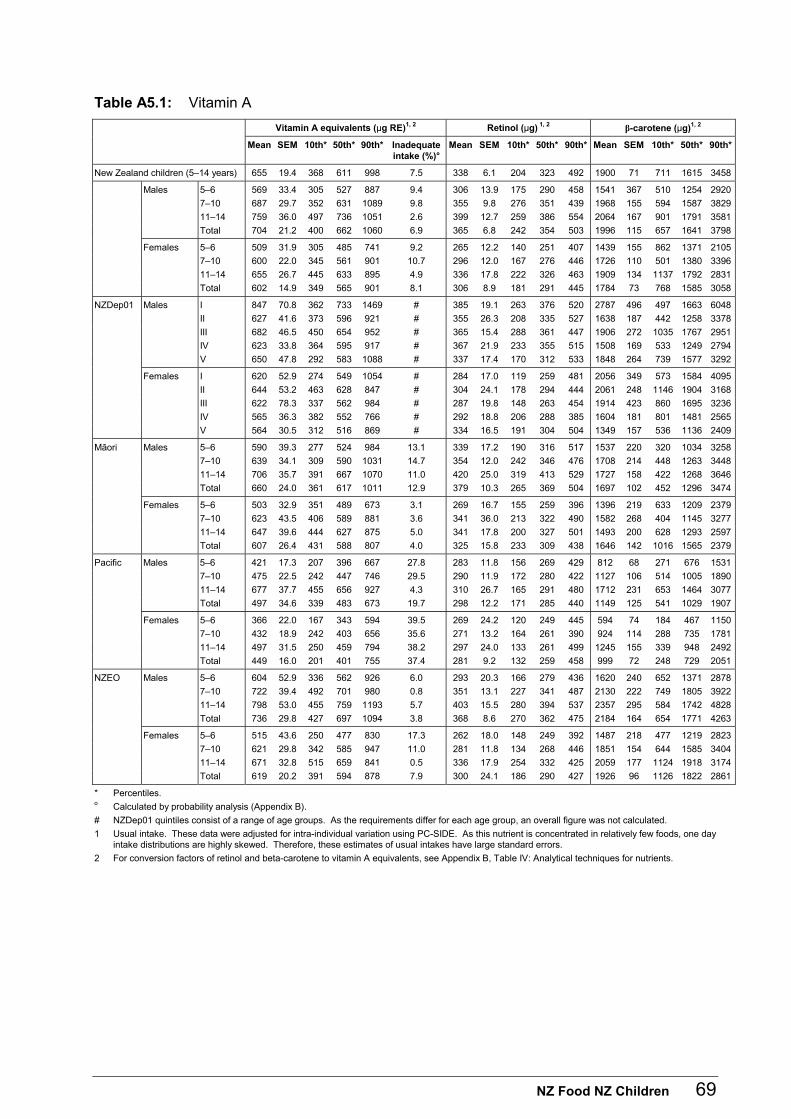
NZ Food NZ Children 69
Table A5.1: Vitamin A
Vitamin A equivalents (µg RE)1, 2 Retinol (µg) 1, 2 β-carotene (µg)1, 2
Mean SEM 10th* 50th* 90th* Inadequate intake (%)°
Mean SEM 10th* 50th* 90th* Mean SEM 10th* 50th* 90th*
New Zealand children (5–14 years) 655 19.4 368 611 998 7.5 338 6.1 204 323 492 1900 71 711 1615 3458
Males 5–6 569 33.4 305 527 887 9.4 306 13.9 175 290 458 1541 367 510 1254 2920
7–10 687 29.7 352 631 1089 9.8 355 9.8 276 351 439 1968 155 594 1587 3829
11–14 759 36.0 497 736 1051 2.6 399 12.7 259 386 554 2064 167 901 1791 3581
Total 704 21.2 400 662 1060 6.9 365 6.8 242 354 503 1996 115 657 1641 3798
Females 5–6 509 31.9 305 485 741 9.2 265 12.2 140 251 407 1439 155 862 1371 2105
7–10 600 22.0 345 561 901 10.7 296 12.0 167 276 446 1726 110 501 1380 3396
11–14 655 26.7 445 633 895 4.9 336 17.8 222 326 463 1909 134 1137 1792 2831
Total 602 14.9 349 565 901 8.1 306 8.9 181 291 445 1784 73 768 1585 3058
NZDep01 Males I 847 70.8 362 733 1469 # 385 19.1 263 376 520 2787 496 497 1663 6048
II 627 41.6 373 596 921 # 355 26.3 208 335 527 1638 187 442 1258 3378
III 682 46.5 450 654 952 # 365 15.4 288 361 447 1906 272 1035 1767 2951
IV 623 33.8 364 595 917 # 367 21.9 233 355 515 1508 169 533 1249 2794
V 650 47.8 292 583 1088 # 337 17.4 170 312 533 1848 264 739 1577 3292
Females I 620 52.9 274 549 1054 # 284 17.0 119 259 481 2056 349 573 1584 4095
II 644 53.2 463 628 847 # 304 24.1 178 294 444 2061 248 1146 1904 3168
III 622 78.3 337 562 984 # 287 19.8 148 263 454 1914 423 860 1695 3236
IV 565 36.3 382 552 766 # 292 18.8 206 288 385 1604 181 801 1481 2565
V 564 30.5 312 516 869 # 334 16.5 191 304 504 1349 157 536 1136 2409
Mäori Males 5–6 590 39.3 277 524 984 13.1 339 17.2 190 316 517 1537 220 320 1034 3258
7–10 639 34.1 309 590 1031 14.7 354 12.0 242 346 476 1708 214 448 1263 3448
11–14 706 35.7 391 667 1070 11.0 420 25.0 319 413 529 1727 158 422 1268 3646
Total 660 24.0 361 617 1011 12.9 379 10.3 265 369 504 1697 102 452 1296 3474
Females 5–6 503 32.9 351 489 673 3.1 269 16.7 155 259 396 1396 219 633 1209 2379
7–10 623 43.5 406 589 881 3.6 341 36.0 213 322 490 1582 268 404 1145 3277
11–14 647 39.6 444 627 875 5.0 341 17.8 200 327 501 1493 200 628 1293 2597
Total 607 26.4 431 588 807 4.0 325 15.8 233 309 438 1646 142 1016 1565 2379
Pacific Males 5–6 421 17.3 207 396 667 27.8 283 11.8 156 269 429 812 68 271 676 1531
7–10 475 22.5 242 447 746 29.5 290 11.9 172 280 422 1127 106 514 1005 1890
11–14 677 37.7 455 656 927 4.3 310 26.7 165 291 480 1712 231 653 1464 3077
Total 497 34.6 339 483 673 19.7 298 12.2 171 285 440 1149 125 541 1029 1907
Females 5–6 366 22.0 167 343 594 39.5 269 24.2 120 249 445 594 74 184 467 1150
7–10 432 18.9 242 403 656 35.6 271 13.2 164 261 390 924 114 288 735 1781
11–14 497 31.5 250 459 794 38.2 297 24.0 133 261 499 1245 155 339 948 2492
Total 449 16.0 201 401 755 37.4 281 9.2 132 259 458 999 72 248 729 2051
NZEO Males 5–6 604 52.9 336 562 926 6.0 293 20.3 166 279 436 1620 240 652 1371 2878
7–10 722 39.4 492 701 980 0.8 351 13.1 227 341 487 2130 222 749 1805 3922
11–14 798 53.0 455 759 1193 5.7 403 15.5 280 394 537 2357 295 584 1742 4828
Total 736 29.8 427 697 1094 3.8 368 8.6 270 362 475 2184 164 654 1771 4263
Females 5–6 515 43.6 250 477 830 17.3 262 18.0 148 249 392 1487 218 477 1219 2823
7–10 621 29.8 342 585 947 11.0 281 11.8 134 268 446 1851 154 644 1585 3404
11–14 671 32.8 515 659 841 0.5 336 17.9 254 332 425 2059 177 1124 1918 3174
Total 619 20.2 391 594 878 7.9 300 24.1 186 290 427 1926 96 1126 1822 2861
* Percentiles. o Calculated by probability analysis (Appendix B).
# NZDep01 quintiles consist of a range of age groups. As the requirements differ for each age group, an overall figure was not calculated.
1 Usual intake. These data were adjusted for intra-individual variation using PC-SIDE. As this nutrient is concentrated in relatively few foods, one day intake distributions are highly skewed. Therefore, these estimates of usual intakes have large standard errors.
2 For conversion factors of retinol and beta-carotene to vitamin A equivalents, see Appendix B, Table IV: Analytical techniques for nutrients.
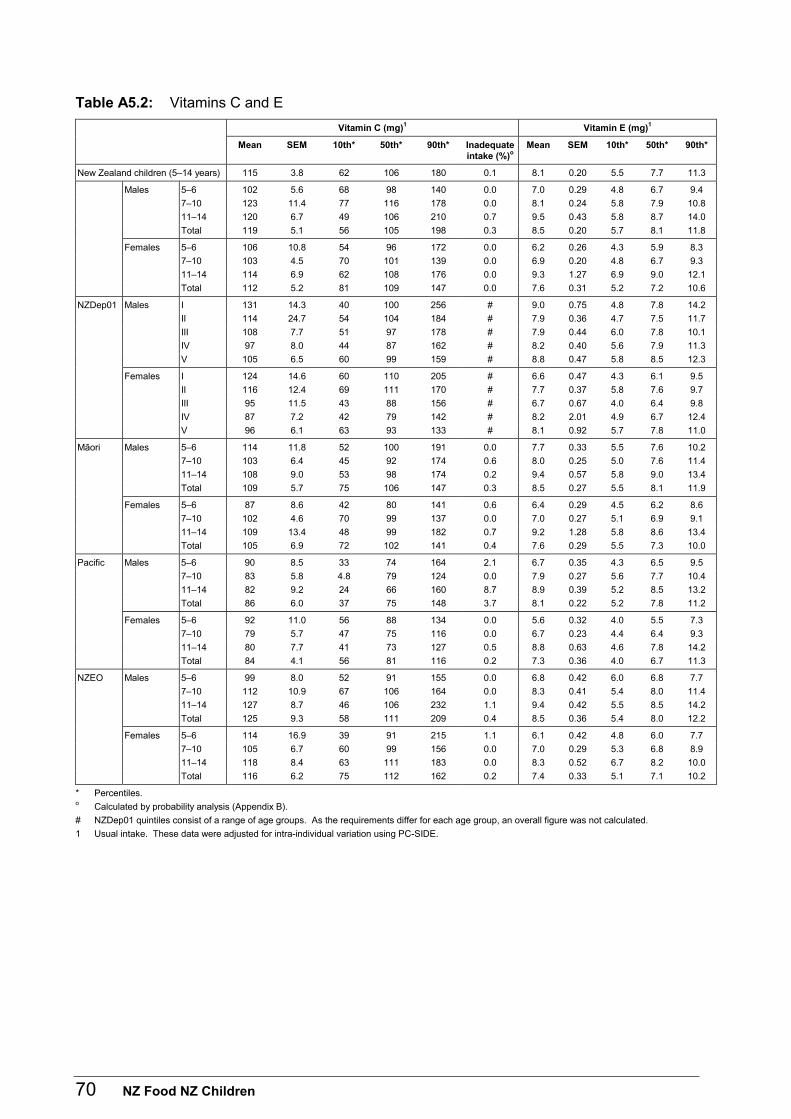
70 NZ Food NZ Children
Table A5.2: Vitamins C and E
Vitamin C (mg)1 Vitamin E (mg)1
Mean SEM 10th* 50th* 90th* Inadequate intake (%)o
Mean SEM 10th* 50th* 90th*
New Zealand children (5–14 years) 115 3.8 62 106 180 0.1 8.1 0.20 5.5 7.7 11.3
Males 5–6 102 5.6 68 98 140 0.0 7.0 0.29 4.8 6.7 9.4
7–10 123 11.4 77 116 178 0.0 8.1 0.24 5.8 7.9 10.8
11–14 120 6.7 49 106 210 0.7 9.5 0.43 5.8 8.7 14.0
Total 119 5.1 56 105 198 0.3 8.5 0.20 5.7 8.1 11.8
Females 5–6 106 10.8 54 96 172 0.0 6.2 0.26 4.3 5.9 8.3
7–10 103 4.5 70 101 139 0.0 6.9 0.20 4.8 6.7 9.3
11–14 114 6.9 62 108 176 0.0 9.3 1.27 6.9 9.0 12.1
Total 112 5.2 81 109 147 0.0 7.6 0.31 5.2 7.2 10.6
NZDep01 Males I 131 14.3 40 100 256 # 9.0 0.75 4.8 7.8 14.2
II 114 24.7 54 104 184 # 7.9 0.36 4.7 7.5 11.7
III 108 7.7 51 97 178 # 7.9 0.44 6.0 7.8 10.1
IV 97 8.0 44 87 162 # 8.2 0.40 5.6 7.9 11.3
V 105 6.5 60 99 159 # 8.8 0.47 5.8 8.5 12.3
Females I 124 14.6 60 110 205 # 6.6 0.47 4.3 6.1 9.5
II 116 12.4 69 111 170 # 7.7 0.37 5.8 7.6 9.7
III 95 11.5 43 88 156 # 6.7 0.67 4.0 6.4 9.8
IV 87 7.2 42 79 142 # 8.2 2.01 4.9 6.7 12.4
V 96 6.1 63 93 133 # 8.1 0.92 5.7 7.8 11.0
Mäori Males 5–6 114 11.8 52 100 191 0.0 7.7 0.33 5.5 7.6 10.2
7–10 103 6.4 45 92 174 0.6 8.0 0.25 5.0 7.6 11.4
11–14 108 9.0 53 98 174 0.2 9.4 0.57 5.8 9.0 13.4
Total 109 5.7 75 106 147 0.3 8.5 0.27 5.5 8.1 11.9
Females 5–6 87 8.6 42 80 141 0.6 6.4 0.29 4.5 6.2 8.6
7–10 102 4.6 70 99 137 0.0 7.0 0.27 5.1 6.9 9.1
11–14 109 13.4 48 99 182 0.7 9.2 1.28 5.8 8.6 13.4
Total 105 6.9 72 102 141 0.4 7.6 0.29 5.5 7.3 10.0
Pacific Males 5–6 90 8.5 33 74 164 2.1 6.7 0.35 4.3 6.5 9.5
7–10 83 5.8 4.8 79 124 0.0 7.9 0.27 5.6 7.7 10.4
11–14 82 9.2 24 66 160 8.7 8.9 0.39 5.2 8.5 13.2
Total 86 6.0 37 75 148 3.7 8.1 0.22 5.2 7.8 11.2
Females 5–6 92 11.0 56 88 134 0.0 5.6 0.32 4.0 5.5 7.3
7–10 79 5.7 47 75 116 0.0 6.7 0.23 4.4 6.4 9.3
11–14 80 7.7 41 73 127 0.5 8.8 0.63 4.6 7.8 14.2
Total 84 4.1 56 81 116 0.2 7.3 0.36 4.0 6.7 11.3
NZEO Males 5–6 99 8.0 52 91 155 0.0 6.8 0.42 6.0 6.8 7.7
7–10 112 10.9 67 106 164 0.0 8.3 0.41 5.4 8.0 11.4
11–14 127 8.7 46 106 232 1.1 9.4 0.42 5.5 8.5 14.2
Total 125 9.3 58 111 209 0.4 8.5 0.36 5.4 8.0 12.2
Females 5–6 114 16.9 39 91 215 1.1 6.1 0.42 4.8 6.0 7.7
7–10 105 6.7 60 99 156 0.0 7.0 0.29 5.3 6.8 8.9
11–14 118 8.4 63 111 183 0.0 8.3 0.52 6.7 8.2 10.0
Total 116 6.2 75 112 162 0.2 7.4 0.33 5.1 7.1 10.2
* Percentiles. o Calculated by probability analysis (Appendix B).
# NZDep01 quintiles consist of a range of age groups. As the requirements differ for each age group, an overall figure was not calculated.
1 Usual intake. These data were adjusted for intra-individual variation using PC-SIDE.
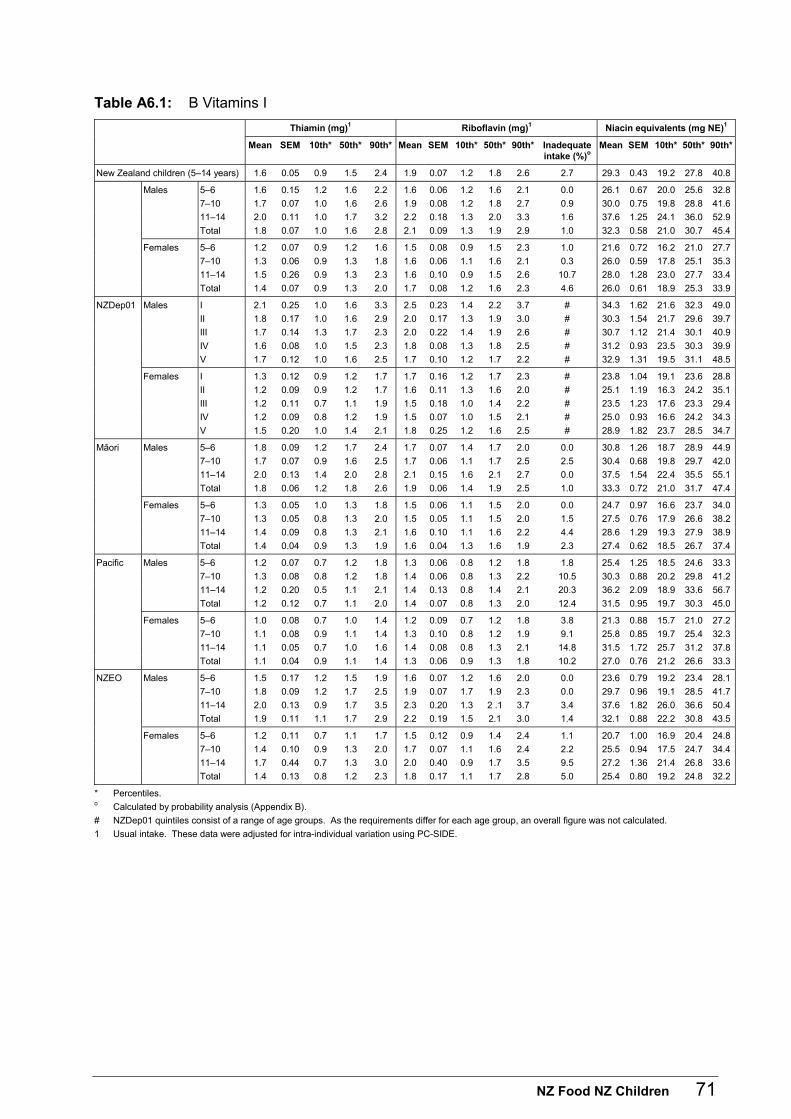
NZ Food NZ Children 71
Table A6.1: B Vitamins I
Thiamin (mg)1 Riboflavin (mg)1 Niacin equivalents (mg NE)1
Mean SEM 10th* 50th* 90th* Mean SEM 10th* 50th* 90th* Inadequate intake (%)o
Mean SEM 10th* 50th* 90th*
New Zealand children (5–14 years) 1.6 0.05 0.9 1.5 2.4 1.9 0.07 1.2 1.8 2.6 2.7 29.3 0.43 19.2 27.8 40.8
Males 5–6 1.6 0.15 1.2 1.6 2.2 1.6 0.06 1.2 1.6 2.1 0.0 26.1 0.67 20.0 25.6 32.8
7–10 1.7 0.07 1.0 1.6 2.6 1.9 0.08 1.2 1.8 2.7 0.9 30.0 0.75 19.8 28.8 41.6
11–14 2.0 0.11 1.0 1.7 3.2 2.2 0.18 1.3 2.0 3.3 1.6 37.6 1.25 24.1 36.0 52.9
Total 1.8 0.07 1.0 1.6 2.8 2.1 0.09 1.3 1.9 2.9 1.0 32.3 0.58 21.0 30.7 45.4
Females 5–6 1.2 0.07 0.9 1.2 1.6 1.5 0.08 0.9 1.5 2.3 1.0 21.6 0.72 16.2 21.0 27.7
7–10 1.3 0.06 0.9 1.3 1.8 1.6 0.06 1.1 1.6 2.1 0.3 26.0 0.59 17.8 25.1 35.3
11–14 1.5 0.26 0.9 1.3 2.3 1.6 0.10 0.9 1.5 2.6 10.7 28.0 1.28 23.0 27.7 33.4
Total 1.4 0.07 0.9 1.3 2.0 1.7 0.08 1.2 1.6 2.3 4.6 26.0 0.61 18.9 25.3 33.9
NZDep01 Males I 2.1 0.25 1.0 1.6 3.3 2.5 0.23 1.4 2.2 3.7 # 34.3 1.62 21.6 32.3 49.0
II 1.8 0.17 1.0 1.6 2.9 2.0 0.17 1.3 1.9 3.0 # 30.3 1.54 21.7 29.6 39.7
III 1.7 0.14 1.3 1.7 2.3 2.0 0.22 1.4 1.9 2.6 # 30.7 1.12 21.4 30.1 40.9
IV 1.6 0.08 1.0 1.5 2.3 1.8 0.08 1.3 1.8 2.5 # 31.2 0.93 23.5 30.3 39.9
V 1.7 0.12 1.0 1.6 2.5 1.7 0.10 1.2 1.7 2.2 # 32.9 1.31 19.5 31.1 48.5
Females I 1.3 0.12 0.9 1.2 1.7 1.7 0.16 1.2 1.7 2.3 # 23.8 1.04 19.1 23.6 28.8
II 1.2 0.09 0.9 1.2 1.7 1.6 0.11 1.3 1.6 2.0 # 25.1 1.19 16.3 24.2 35.1
III 1.2 0.11 0.7 1.1 1.9 1.5 0.18 1.0 1.4 2.2 # 23.5 1.23 17.6 23.3 29.4
IV 1.2 0.09 0.8 1.2 1.9 1.5 0.07 1.0 1.5 2.1 # 25.0 0.93 16.6 24.2 34.3
V 1.5 0.20 1.0 1.4 2.1 1.8 0.25 1.2 1.6 2.5 # 28.9 1.82 23.7 28.5 34.7
Mäori Males 5–6 1.8 0.09 1.2 1.7 2.4 1.7 0.07 1.4 1.7 2.0 0.0 30.8 1.26 18.7 28.9 44.9
7–10 1.7 0.07 0.9 1.6 2.5 1.7 0.06 1.1 1.7 2.5 2.5 30.4 0.68 19.8 29.7 42.0
11–14 2.0 0.13 1.4 2.0 2.8 2.1 0.15 1.6 2.1 2.7 0.0 37.5 1.54 22.4 35.5 55.1
Total 1.8 0.06 1.2 1.8 2.6 1.9 0.06 1.4 1.9 2.5 1.0 33.3 0.72 21.0 31.7 47.4
Females 5–6 1.3 0.05 1.0 1.3 1.8 1.5 0.06 1.1 1.5 2.0 0.0 24.7 0.97 16.6 23.7 34.0
7–10 1.3 0.05 0.8 1.3 2.0 1.5 0.05 1.1 1.5 2.0 1.5 27.5 0.76 17.9 26.6 38.2
11–14 1.4 0.09 0.8 1.3 2.1 1.6 0.10 1.1 1.6 2.2 4.4 28.6 1.29 19.3 27.9 38.9
Total 1.4 0.04 0.9 1.3 1.9 1.6 0.04 1.3 1.6 1.9 2.3 27.4 0.62 18.5 26.7 37.4
Pacific Males 5–6 1.2 0.07 0.7 1.2 1.8 1.3 0.06 0.8 1.2 1.8 1.8 25.4 1.25 18.5 24.6 33.3
7–10 1.3 0.08 0.8 1.2 1.8 1.4 0.06 0.8 1.3 2.2 10.5 30.3 0.88 20.2 29.8 41.2
11–14 1.2 0.20 0.5 1.1 2.1 1.4 0.13 0.8 1.4 2.1 20.3 36.2 2.09 18.9 33.6 56.7
Total 1.2 0.12 0.7 1.1 2.0 1.4 0.07 0.8 1.3 2.0 12.4 31.5 0.95 19.7 30.3 45.0
Females 5–6 1.0 0.08 0.7 1.0 1.4 1.2 0.09 0.7 1.2 1.8 3.8 21.3 0.88 15.7 21.0 27.2
7–10 1.1 0.08 0.9 1.1 1.4 1.3 0.10 0.8 1.2 1.9 9.1 25.8 0.85 19.7 25.4 32.3
11–14 1.1 0.05 0.7 1.0 1.6 1.4 0.08 0.8 1.3 2.1 14.8 31.5 1.72 25.7 31.2 37.8
Total 1.1 0.04 0.9 1.1 1.4 1.3 0.06 0.9 1.3 1.8 10.2 27.0 0.76 21.2 26.6 33.3
NZEO Males 5–6 1.5 0.17 1.2 1.5 1.9 1.6 0.07 1.2 1.6 2.0 0.0 23.6 0.79 19.2 23.4 28.1
7–10 1.8 0.09 1.2 1.7 2.5 1.9 0.07 1.7 1.9 2.3 0.0 29.7 0.96 19.1 28.5 41.7
11–14 2.0 0.13 0.9 1.7 3.5 2.3 0.20 1.3 2 .1 3.7 3.4 37.6 1.82 26.0 36.6 50.4
Total 1.9 0.11 1.1 1.7 2.9 2.2 0.19 1.5 2.1 3.0 1.4 32.1 0.88 22.2 30.8 43.5
Females 5–6 1.2 0.11 0.7 1.1 1.7 1.5 0.12 0.9 1.4 2.4 1.1 20.7 1.00 16.9 20.4 24.8
7–10 1.4 0.10 0.9 1.3 2.0 1.7 0.07 1.1 1.6 2.4 2.2 25.5 0.94 17.5 24.7 34.4
11–14 1.7 0.44 0.7 1.3 3.0 2.0 0.40 0.9 1.7 3.5 9.5 27.2 1.36 21.4 26.8 33.6
Total 1.4 0.13 0.8 1.2 2.3 1.8 0.17 1.1 1.7 2.8 5.0 25.4 0.80 19.2 24.8 32.2
* Percentiles. o Calculated by probability analysis (Appendix B).
# NZDep01 quintiles consist of a range of age groups. As the requirements differ for each age group, an overall figure was not calculated.
1 Usual intake. These data were adjusted for intra-individual variation using PC-SIDE.
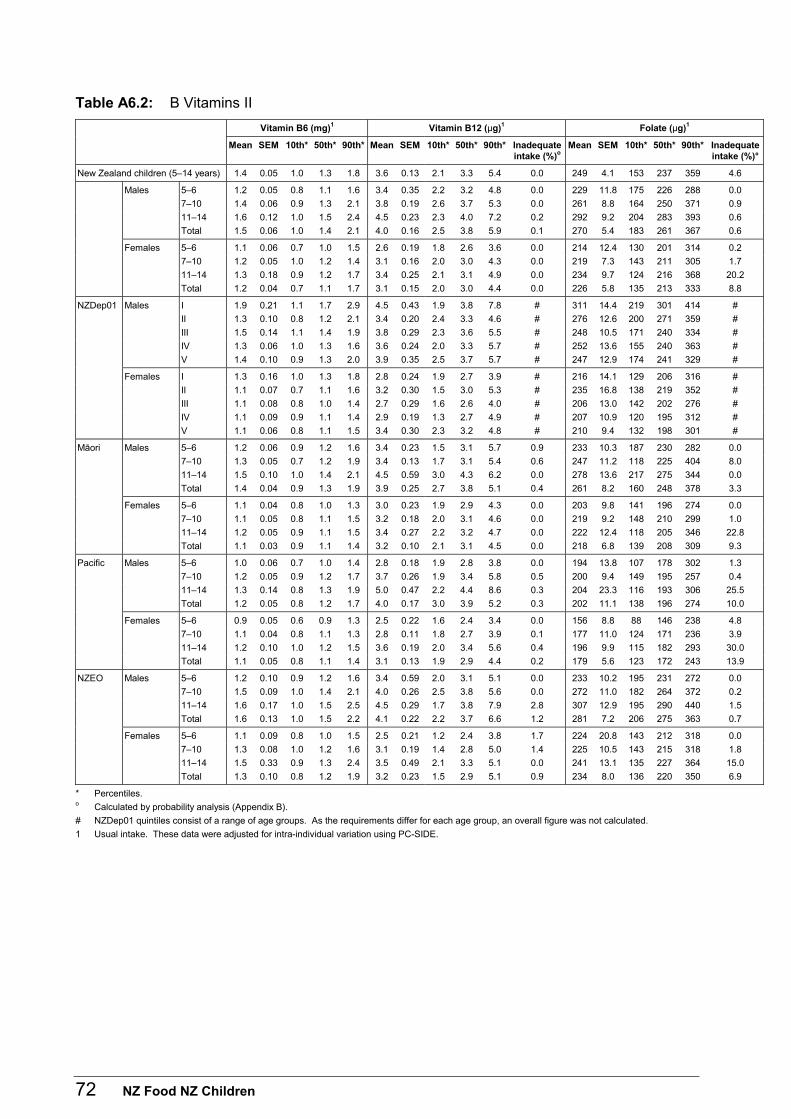
72 NZ Food NZ Children
Table A6.2: B Vitamins II
Vitamin B6 (mg)1 Vitamin B12 (µg)1 Folate (µg)1
Mean SEM 10th* 50th* 90th* Mean SEM 10th* 50th* 90th* Inadequate intake (%)o
Mean SEM 10th* 50th* 90th* Inadequate intake (%)°
New Zealand children (5–14 years) 1.4 0.05 1.0 1.3 1.8 3.6 0.13 2.1 3.3 5.4 0.0 249 4.1 153 237 359 4.6
Males 5–6 1.2 0.05 0.8 1.1 1.6 3.4 0.35 2.2 3.2 4.8 0.0 229 11.8 175 226 288 0.0
7–10 1.4 0.06 0.9 1.3 2.1 3.8 0.19 2.6 3.7 5.3 0.0 261 8.8 164 250 371 0.9
11–14 1.6 0.12 1.0 1.5 2.4 4.5 0.23 2.3 4.0 7.2 0.2 292 9.2 204 283 393 0.6
Total 1.5 0.06 1.0 1.4 2.1 4.0 0.16 2.5 3.8 5.9 0.1 270 5.4 183 261 367 0.6
Females 5–6 1.1 0.06 0.7 1.0 1.5 2.6 0.19 1.8 2.6 3.6 0.0 214 12.4 130 201 314 0.2
7–10 1.2 0.05 1.0 1.2 1.4 3.1 0.16 2.0 3.0 4.3 0.0 219 7.3 143 211 305 1.7
11–14 1.3 0.18 0.9 1.2 1.7 3.4 0.25 2.1 3.1 4.9 0.0 234 9.7 124 216 368 20.2
Total 1.2 0.04 0.7 1.1 1.7 3.1 0.15 2.0 3.0 4.4 0.0 226 5.8 135 213 333 8.8
NZDep01 Males I 1.9 0.21 1.1 1.7 2.9 4.5 0.43 1.9 3.8 7.8 # 311 14.4 219 301 414 #
II 1.3 0.10 0.8 1.2 2.1 3.4 0.20 2.4 3.3 4.6 # 276 12.6 200 271 359 #
III 1.5 0.14 1.1 1.4 1.9 3.8 0.29 2.3 3.6 5.5 # 248 10.5 171 240 334 #
IV 1.3 0.06 1.0 1.3 1.6 3.6 0.24 2.0 3.3 5.7 # 252 13.6 155 240 363 #
V 1.4 0.10 0.9 1.3 2.0 3.9 0.35 2.5 3.7 5.7 # 247 12.9 174 241 329 #
Females I 1.3 0.16 1.0 1.3 1.8 2.8 0.24 1.9 2.7 3.9 # 216 14.1 129 206 316 #
II 1.1 0.07 0.7 1.1 1.6 3.2 0.30 1.5 3.0 5.3 # 235 16.8 138 219 352 #
III 1.1 0.08 0.8 1.0 1.4 2.7 0.29 1.6 2.6 4.0 # 206 13.0 142 202 276 #
IV 1.1 0.09 0.9 1.1 1.4 2.9 0.19 1.3 2.7 4.9 # 207 10.9 120 195 312 #
V 1.1 0.06 0.8 1.1 1.5 3.4 0.30 2.3 3.2 4.8 # 210 9.4 132 198 301 #
Mäori Males 5–6 1.2 0.06 0.9 1.2 1.6 3.4 0.23 1.5 3.1 5.7 0.9 233 10.3 187 230 282 0.0
7–10 1.3 0.05 0.7 1.2 1.9 3.4 0.13 1.7 3.1 5.4 0.6 247 11.2 118 225 404 8.0
11–14 1.5 0.10 1.0 1.4 2.1 4.5 0.59 3.0 4.3 6.2 0.0 278 13.6 217 275 344 0.0
Total 1.4 0.04 0.9 1.3 1.9 3.9 0.25 2.7 3.8 5.1 0.4 261 8.2 160 248 378 3.3
Females 5–6 1.1 0.04 0.8 1.0 1.3 3.0 0.23 1.9 2.9 4.3 0.0 203 9.8 141 196 274 0.0
7–10 1.1 0.05 0.8 1.1 1.5 3.2 0.18 2.0 3.1 4.6 0.0 219 9.2 148 210 299 1.0
11–14 1.2 0.05 0.9 1.1 1.5 3.4 0.27 2.2 3.2 4.7 0.0 222 12.4 118 205 346 22.8
Total 1.1 0.03 0.9 1.1 1.4 3.2 0.10 2.1 3.1 4.5 0.0 218 6.8 139 208 309 9.3
Pacific Males 5–6 1.0 0.06 0.7 1.0 1.4 2.8 0.18 1.9 2.8 3.8 0.0 194 13.8 107 178 302 1.3
7–10 1.2 0.05 0.9 1.2 1.7 3.7 0.26 1.9 3.4 5.8 0.5 200 9.4 149 195 257 0.4
11–14 1.3 0.14 0.8 1.3 1.9 5.0 0.47 2.2 4.4 8.6 0.3 204 23.3 116 193 306 25.5
Total 1.2 0.05 0.8 1.2 1.7 4.0 0.17 3.0 3.9 5.2 0.3 202 11.1 138 196 274 10.0
Females 5–6 0.9 0.05 0.6 0.9 1.3 2.5 0.22 1.6 2.4 3.4 0.0 156 8.8 88 146 238 4.8
7–10 1.1 0.04 0.8 1.1 1.3 2.8 0.11 1.8 2.7 3.9 0.1 177 11.0 124 171 236 3.9
11–14 1.2 0.10 1.0 1.2 1.5 3.6 0.19 2.0 3.4 5.6 0.4 196 9.9 115 182 293 30.0
Total 1.1 0.05 0.8 1.1 1.4 3.1 0.13 1.9 2.9 4.4 0.2 179 5.6 123 172 243 13.9
NZEO Males 5–6 1.2 0.10 0.9 1.2 1.6 3.4 0.59 2.0 3.1 5.1 0.0 233 10.2 195 231 272 0.0
7–10 1.5 0.09 1.0 1.4 2.1 4.0 0.26 2.5 3.8 5.6 0.0 272 11.0 182 264 372 0.2
11–14 1.6 0.17 1.0 1.5 2.5 4.5 0.29 1.7 3.8 7.9 2.8 307 12.9 195 290 440 1.5
Total 1.6 0.13 1.0 1.5 2.2 4.1 0.22 2.2 3.7 6.6 1.2 281 7.2 206 275 363 0.7
Females 5–6 1.1 0.09 0.8 1.0 1.5 2.5 0.21 1.2 2.4 3.8 1.7 224 20.8 143 212 318 0.0
7–10 1.3 0.08 1.0 1.2 1.6 3.1 0.19 1.4 2.8 5.0 1.4 225 10.5 143 215 318 1.8
11–14 1.5 0.33 0.9 1.3 2.4 3.5 0.49 2.1 3.3 5.1 0.0 241 13.1 135 227 364 15.0
Total 1.3 0.10 0.8 1.2 1.9 3.2 0.23 1.5 2.9 5.1 0.9 234 8.0 136 220 350 6.9
* Percentiles. o Calculated by probability analysis (Appendix B).
# NZDep01 quintiles consist of a range of age groups. As the requirements differ for each age group, an overall figure was not calculated.
1 Usual intake. These data were adjusted for intra-individual variation using PC-SIDE.
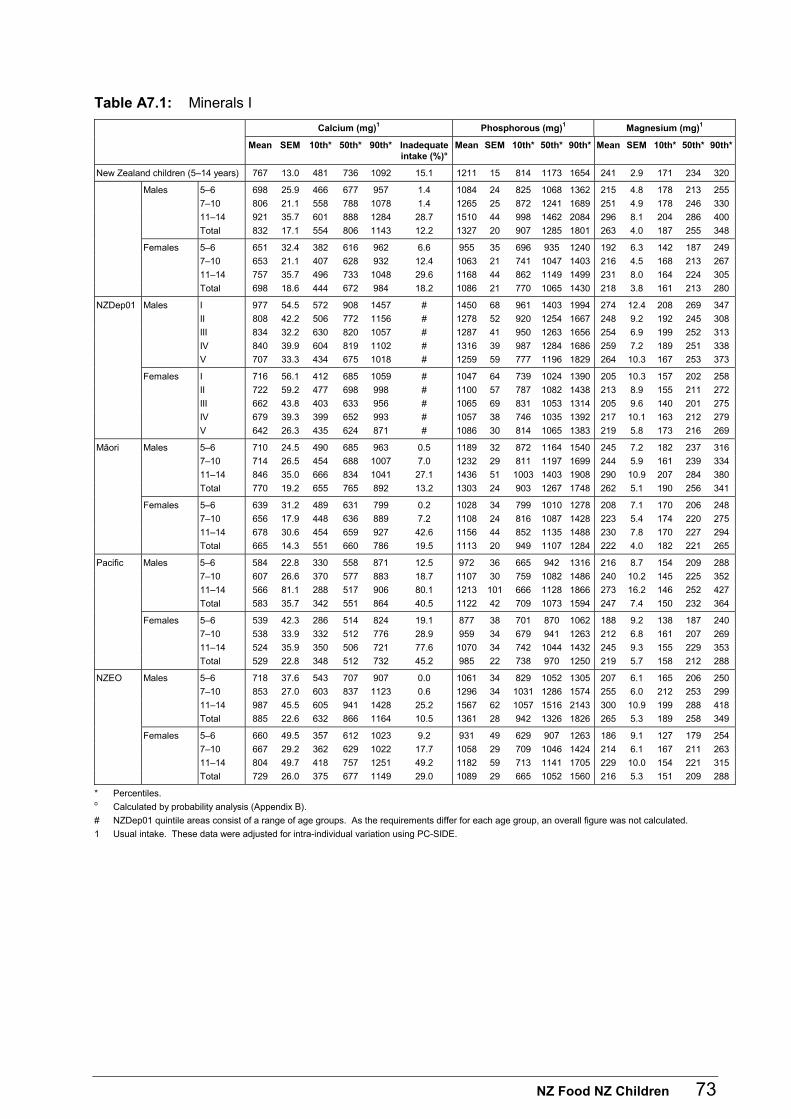
NZ Food NZ Children 73
Table A7.1: Minerals I
Calcium (mg)1 Phosphorous (mg)1 Magnesium (mg)1
Mean SEM 10th* 50th* 90th* Inadequate intake (%)°
Mean SEM 10th* 50th* 90th* Mean SEM 10th* 50th* 90th*
New Zealand children (5–14 years) 767 13.0 481 736 1092 15.1 1211 15 814 1173 1654 241 2.9 171 234 320
Males 5–6 698 25.9 466 677 957 1.4 1084 24 825 1068 1362 215 4.8 178 213 255
7–10 806 21.1 558 788 1078 1.4 1265 25 872 1241 1689 251 4.9 178 246 330
11–14 921 35.7 601 888 1284 28.7 1510 44 998 1462 2084 296 8.1 204 286 400
Total 832 17.1 554 806 1143 12.2 1327 20 907 1285 1801 263 4.0 187 255 348
Females 5–6 651 32.4 382 616 962 6.6 955 35 696 935 1240 192 6.3 142 187 249
7–10 653 21.1 407 628 932 12.4 1063 21 741 1047 1403 216 4.5 168 213 267
11–14 757 35.7 496 733 1048 29.6 1168 44 862 1149 1499 231 8.0 164 224 305
Total 698 18.6 444 672 984 18.2 1086 21 770 1065 1430 218 3.8 161 213 280
NZDep01 Males I 977 54.5 572 908 1457 # 1450 68 961 1403 1994 274 12.4 208 269 347
II 808 42.2 506 772 1156 # 1278 52 920 1254 1667 248 9.2 192 245 308
III 834 32.2 630 820 1057 # 1287 41 950 1263 1656 254 6.9 199 252 313
IV 840 39.9 604 819 1102 # 1316 39 987 1284 1686 259 7.2 189 251 338
V 707 33.3 434 675 1018 # 1259 59 777 1196 1829 264 10.3 167 253 373
Females I 716 56.1 412 685 1059 # 1047 64 739 1024 1390 205 10.3 157 202 258
II 722 59.2 477 698 998 # 1100 57 787 1082 1438 213 8.9 155 211 272
III 662 43.8 403 633 956 # 1065 69 831 1053 1314 205 9.6 140 201 275
IV 679 39.3 399 652 993 # 1057 38 746 1035 1392 217 10.1 163 212 279
V 642 26.3 435 624 871 # 1086 30 814 1065 1383 219 5.8 173 216 269
Mäori Males 5–6 710 24.5 490 685 963 0.5 1189 32 872 1164 1540 245 7.2 182 237 316
7–10 714 26.5 454 688 1007 7.0 1232 29 811 1197 1699 244 5.9 161 239 334
11–14 846 35.0 666 834 1041 27.1 1436 51 1003 1403 1908 290 10.9 207 284 380
Total 770 19.2 655 765 892 13.2 1303 24 903 1267 1748 262 5.1 190 256 341
Females 5–6 639 31.2 489 631 799 0.2 1028 34 799 1010 1278 208 7.1 170 206 248
7–10 656 17.9 448 636 889 7.2 1108 24 816 1087 1428 223 5.4 174 220 275
11–14 678 30.6 454 659 927 42.6 1156 44 852 1135 1488 230 7.8 170 227 294
Total 665 14.3 551 660 786 19.5 1113 20 949 1107 1284 222 4.0 182 221 265
Pacific Males 5–6 584 22.8 330 558 871 12.5 972 36 665 942 1316 216 8.7 154 209 288
7–10 607 26.6 370 577 883 18.7 1107 30 759 1082 1486 240 10.2 145 225 352
11–14 566 81.1 288 517 906 80.1 1213 101 666 1128 1866 273 16.2 146 252 427
Total 583 35.7 342 551 864 40.5 1122 42 709 1073 1594 247 7.4 150 232 364
Females 5–6 539 42.3 286 514 824 19.1 877 38 701 870 1062 188 9.2 138 187 240
7–10 538 33.9 332 512 776 28.9 959 34 679 941 1263 212 6.8 161 207 269
11–14 524 35.9 350 506 721 77.6 1070 34 742 1044 1432 245 9.3 155 229 353
Total 529 22.8 348 512 732 45.2 985 22 738 970 1250 219 5.7 158 212 288
NZEO Males 5–6 718 37.6 543 707 907 0.0 1061 34 829 1052 1305 207 6.1 165 206 250
7–10 853 27.0 603 837 1123 0.6 1296 34 1031 1286 1574 255 6.0 212 253 299
11–14 987 45.5 605 941 1428 25.2 1567 62 1057 1516 2143 300 10.9 199 288 418
Total 885 22.6 632 866 1164 10.5 1361 28 942 1326 1826 265 5.3 189 258 349
Females 5–6 660 49.5 357 612 1023 9.2 931 49 629 907 1263 186 9.1 127 179 254
7–10 667 29.2 362 629 1022 17.7 1058 29 709 1046 1424 214 6.1 167 211 263
11–14 804 49.7 418 757 1251 49.2 1182 59 713 1141 1705 229 10.0 154 221 315
Total 729 26.0 375 677 1149 29.0 1089 29 665 1052 1560 216 5.3 151 209 288
* Percentiles. o Calculated by probability analysis (Appendix B).
# NZDep01 quintile areas consist of a range of age groups. As the requirements differ for each age group, an overall figure was not calculated.
1 Usual intake. These data were adjusted for intra-individual variation using PC-SIDE.
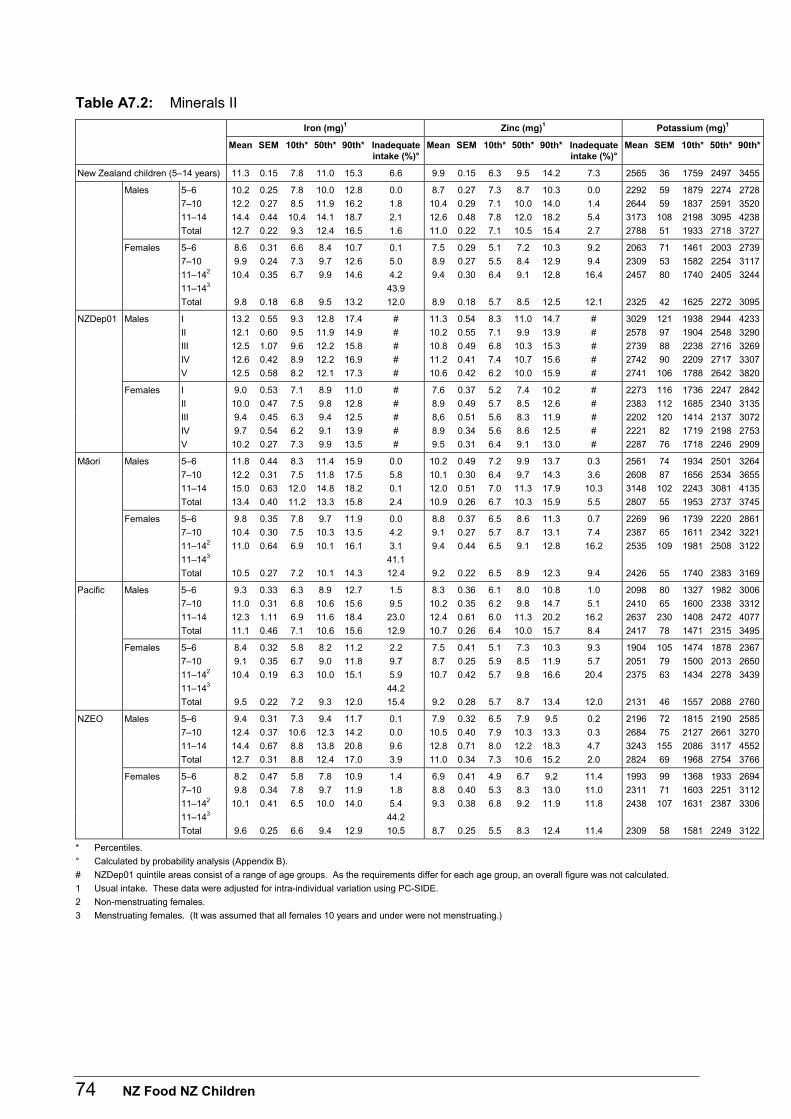
74 NZ Food NZ Children
Table A7.2: Minerals II
Iron (mg)1 Zinc (mg)1 Potassium (mg)1
Mean SEM 10th* 50th* 90th* Inadequate intake (%)°
Mean SEM 10th* 50th* 90th* Inadequate intake (%)°
Mean SEM 10th* 50th* 90th*
New Zealand children (5–14 years) 11.3 0.15 7.8 11.0 15.3 6.6 9.9 0.15 6.3 9.5 14.2 7.3 2565 36 1759 2497 3455
Males 5–6 10.2 0.25 7.8 10.0 12.8 0.0 8.7 0.27 7.3 8.7 10.3 0.0 2292 59 1879 2274 2728
7–10 12.2 0.27 8.5 11.9 16.2 1.8 10.4 0.29 7.1 10.0 14.0 1.4 2644 59 1837 2591 3520
11–14 14.4 0.44 10.4 14.1 18.7 2.1 12.6 0.48 7.8 12.0 18.2 5.4 3173 108 2198 3095 4238
Total 12.7 0.22 9.3 12.4 16.5 1.6 11.0 0.22 7.1 10.5 15.4 2.7 2788 51 1933 2718 3727
Females 5–6 8.6 0.31 6.6 8.4 10.7 0.1 7.5 0.29 5.1 7.2 10.3 9.2 2063 71 1461 2003 2739
7–10 9.9 0.24 7.3 9.7 12.6 5.0 8.9 0.27 5.5 8.4 12.9 9.4 2309 53 1582 2254 3117
11–142 10.4 0.35 6.7 9.9 14.6 4.2 9.4 0.30 6.4 9.1 12.8 16.4 2457 80 1740 2405 3244
11–143 43.9
Total 9.8 0.18 6.8 9.5 13.2 12.0 8.9 0.18 5.7 8.5 12.5 12.1 2325 42 1625 2272 3095
NZDep01 Males I 13.2 0.55 9.3 12.8 17.4 # 11.3 0.54 8.3 11.0 14.7 # 3029 121 1938 2944 4233
II 12.1 0.60 9.5 11.9 14.9 # 10.2 0.55 7.1 9.9 13.9 # 2578 97 1904 2548 3290
III 12.5 1.07 9.6 12.2 15.8 # 10.8 0.49 6.8 10.3 15.3 # 2739 88 2238 2716 3269
IV 12.6 0.42 8.9 12.2 16.9 # 11.2 0.41 7.4 10.7 15.6 # 2742 90 2209 2717 3307
V 12.5 0.58 8.2 12.1 17.3 # 10.6 0.42 6.2 10.0 15.9 # 2741 106 1788 2642 3820
Females I 9.0 0.53 7.1 8.9 11.0 # 7.6 0.37 5.2 7.4 10.2 # 2273 116 1736 2247 2842
II 10.0 0.47 7.5 9.8 12.8 # 8.9 0.49 5.7 8.5 12.6 # 2383 112 1685 2340 3135
III 9.4 0.45 6.3 9.4 12.5 # 8,6 0.51 5.6 8.3 11.9 # 2202 120 1414 2137 3072
IV 9.7 0.54 6.2 9.1 13.9 # 8.9 0.34 5.6 8.6 12.5 # 2221 82 1719 2198 2753
V 10.2 0.27 7.3 9.9 13.5 # 9.5 0.31 6.4 9.1 13.0 # 2287 76 1718 2246 2909
Mäori Males 5–6 11.8 0.44 8.3 11.4 15.9 0.0 10.2 0.49 7.2 9.9 13.7 0.3 2561 74 1934 2501 3264
7–10 12.2 0.31 7.5 11.8 17.5 5.8 10.1 0.30 6.4 9.7 14.3 3.6 2608 87 1656 2534 3655
11–14 15.0 0.63 12.0 14.8 18.2 0.1 12.0 0.51 7.0 11.3 17.9 10.3 3148 102 2243 3081 4135
Total 13.4 0.40 11.2 13.3 15.8 2.4 10.9 0.26 6.7 10.3 15.9 5.5 2807 55 1953 2737 3745
Females 5–6 9.8 0.35 7.8 9.7 11.9 0.0 8.8 0.37 6.5 8.6 11.3 0.7 2269 96 1739 2220 2861
7–10 10.4 0.30 7.5 10.3 13.5 4.2 9.1 0.27 5.7 8.7 13.1 7.4 2387 65 1611 2342 3221
11–142 11.0 0.64 6.9 10.1 16.1 3.1 9.4 0.44 6.5 9.1 12.8 16.2 2535 109 1981 2508 3122
11–143 41.1
Total 10.5 0.27 7.2 10.1 14.3 12.4 9.2 0.22 6.5 8.9 12.3 9.4 2426 55 1740 2383 3169
Pacific Males 5–6 9.3 0.33 6.3 8.9 12.7 1.5 8.3 0.36 6.1 8.0 10.8 1.0 2098 80 1327 1982 3006
7–10 11.0 0.31 6.8 10.6 15.6 9.5 10.2 0.35 6.2 9.8 14.7 5.1 2410 65 1600 2338 3312
11–14 12.3 1.11 6.9 11.6 18.4 23.0 12.4 0.61 6.0 11.3 20.2 16.2 2637 230 1408 2472 4077
Total 11.1 0.46 7.1 10.6 15.6 12.9 10.7 0.26 6.4 10.0 15.7 8.4 2417 78 1471 2315 3495
Females 5–6 8.4 0.32 5.8 8.2 11.2 2.2 7.5 0.41 5.1 7.3 10.3 9.3 1904 105 1474 1878 2367
7–10 9.1 0.35 6.7 9.0 11.8 9.7 8.7 0.25 5.9 8.5 11.9 5.7 2051 79 1500 2013 2650
11–142 10.4 0.19 6.3 10.0 15.1 5.9 10.7 0.42 5.7 9.8 16.6 20.4 2375 63 1434 2278 3439
11–143 44.2
Total 9.5 0.22 7.2 9.3 12.0 15.4 9.2 0.28 5.7 8.7 13.4 12.0 2131 46 1557 2088 2760
NZEO Males 5–6 9.4 0.31 7.3 9.4 11.7 0.1 7.9 0.32 6.5 7.9 9.5 0.2 2196 72 1815 2190 2585
7–10 12.4 0.37 10.6 12.3 14.2 0.0 10.5 0.40 7.9 10.3 13.3 0.3 2684 75 2127 2661 3270
11–14 14.4 0.67 8.8 13.8 20.8 9.6 12.8 0.71 8.0 12.2 18.3 4.7 3243 155 2086 3117 4552
Total 12.7 0.31 8.8 12.4 17.0 3.9 11.0 0.34 7.3 10.6 15.2 2.0 2824 69 1968 2754 3766
Females 5–6 8.2 0.47 5.8 7.8 10.9 1.4 6.9 0.41 4.9 6.7 9.2 11.4 1993 99 1368 1933 2694
7–10 9.8 0.34 7.8 9.7 11.9 1.8 8.8 0.40 5.3 8.3 13.0 11.0 2311 71 1603 2251 3112
11–142 10.1 0.41 6.5 10.0 14.0 5.4 9.3 0.38 6.8 9.2 11.9 11.8 2438 107 1631 2387 3306
11–143 44.2
Total 9.6 0.25 6.6 9.4 12.9 10.5 8.7 0.25 5.5 8.3 12.4 11.4 2309 58 1581 2249 3122
* Percentiles.
° Calculated by probability analysis (Appendix B).
# NZDep01 quintile areas consist of a range of age groups. As the requirements differ for each age group, an overall figure was not calculated.
1 Usual intake. These data were adjusted for intra-individual variation using PC-SIDE.
2 Non-menstruating females.
3 Menstruating females. (It was assumed that all females 10 years and under were not menstruating.)
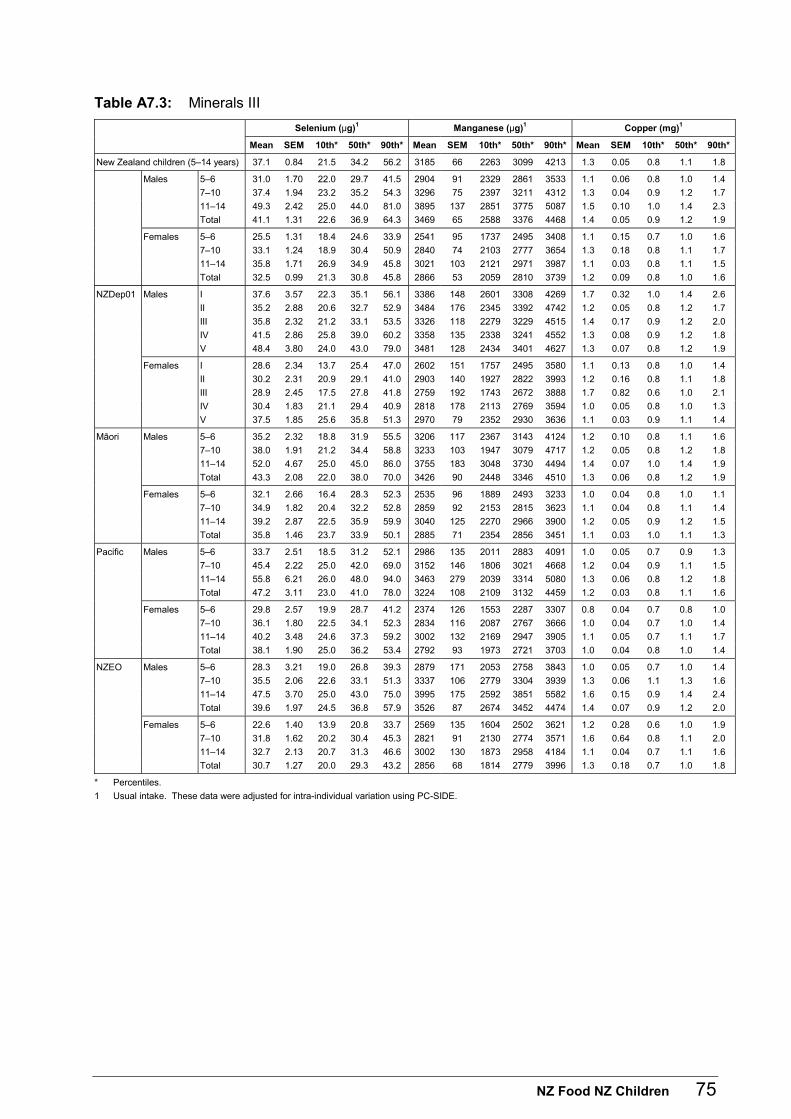
NZ Food NZ Children 75
Table A7.3: Minerals III
Selenium (µg)1 Manganese (µg)1 Copper (mg)1
Mean SEM 10th* 50th* 90th* Mean SEM 10th* 50th* 90th* Mean SEM 10th* 50th* 90th*
New Zealand children (5–14 years) 37.1 0.84 21.5 34.2 56.2 3185 66 2263 3099 4213 1.3 0.05 0.8 1.1 1.8
Males 5–6 31.0 1.70 22.0 29.7 41.5 2904 91 2329 2861 3533 1.1 0.06 0.8 1.0 1.4
7–10 37.4 1.94 23.2 35.2 54.3 3296 75 2397 3211 4312 1.3 0.04 0.9 1.2 1.7
11–14 49.3 2.42 25.0 44.0 81.0 3895 137 2851 3775 5087 1.5 0.10 1.0 1.4 2.3
Total 41.1 1.31 22.6 36.9 64.3 3469 65 2588 3376 4468 1.4 0.05 0.9 1.2 1.9
Females 5–6 25.5 1.31 18.4 24.6 33.9 2541 95 1737 2495 3408 1.1 0.15 0.7 1.0 1.6
7–10 33.1 1.24 18.9 30.4 50.9 2840 74 2103 2777 3654 1.3 0.18 0.8 1.1 1.7
11–14 35.8 1.71 26.9 34.9 45.8 3021 103 2121 2971 3987 1.1 0.03 0.8 1.1 1.5
Total 32.5 0.99 21.3 30.8 45.8 2866 53 2059 2810 3739 1.2 0.09 0.8 1.0 1.6
NZDep01 Males I 37.6 3.57 22.3 35.1 56.1 3386 148 2601 3308 4269 1.7 0.32 1.0 1.4 2.6
II 35.2 2.88 20.6 32.7 52.9 3484 176 2345 3392 4742 1.2 0.05 0.8 1.2 1.7
III 35.8 2.32 21.2 33.1 53.5 3326 118 2279 3229 4515 1.4 0.17 0.9 1.2 2.0
IV 41.5 2.86 25.8 39.0 60.2 3358 135 2338 3241 4552 1.3 0.08 0.9 1.2 1.8
V 48.4 3.80 24.0 43.0 79.0 3481 128 2434 3401 4627 1.3 0.07 0.8 1.2 1.9
Females I 28.6 2.34 13.7 25.4 47.0 2602 151 1757 2495 3580 1.1 0.13 0.8 1.0 1.4
II 30.2 2.31 20.9 29.1 41.0 2903 140 1927 2822 3993 1.2 0.16 0.8 1.1 1.8
III 28.9 2.45 17.5 27.8 41.8 2759 192 1743 2672 3888 1.7 0.82 0.6 1.0 2.1
IV 30.4 1.83 21.1 29.4 40.9 2818 178 2113 2769 3594 1.0 0.05 0.8 1.0 1.3
V 37.5 1.85 25.6 35.8 51.3 2970 79 2352 2930 3636 1.1 0.03 0.9 1.1 1.4
Mäori Males 5–6 35.2 2.32 18.8 31.9 55.5 3206 117 2367 3143 4124 1.2 0.10 0.8 1.1 1.6
7–10 38.0 1.91 21.2 34.4 58.8 3233 103 1947 3079 4717 1.2 0.05 0.8 1.2 1.8
11–14 52.0 4.67 25.0 45.0 86.0 3755 183 3048 3730 4494 1.4 0.07 1.0 1.4 1.9
Total 43.3 2.08 22.0 38.0 70.0 3426 90 2448 3346 4510 1.3 0.06 0.8 1.2 1.9
Females 5–6 32.1 2.66 16.4 28.3 52.3 2535 96 1889 2493 3233 1.0 0.04 0.8 1.0 1.1
7–10 34.9 1.82 20.4 32.2 52.8 2859 92 2153 2815 3623 1.1 0.04 0.8 1.1 1.4
11–14 39.2 2.87 22.5 35.9 59.9 3040 125 2270 2966 3900 1.2 0.05 0.9 1.2 1.5
Total 35.8 1.46 23.7 33.9 50.1 2885 71 2354 2856 3451 1.1 0.03 1.0 1.1 1.3
Pacific Males 5–6 33.7 2.51 18.5 31.2 52.1 2986 135 2011 2883 4091 1.0 0.05 0.7 0.9 1.3
7–10 45.4 2.22 25.0 42.0 69.0 3152 146 1806 3021 4668 1.2 0.04 0.9 1.1 1.5
11–14 55.8 6.21 26.0 48.0 94.0 3463 279 2039 3314 5080 1.3 0.06 0.8 1.2 1.8
Total 47.2 3.11 23.0 41.0 78.0 3224 108 2109 3132 4459 1.2 0.03 0.8 1.1 1.6
Females 5–6 29.8 2.57 19.9 28.7 41.2 2374 126 1553 2287 3307 0.8 0.04 0.7 0.8 1.0
7–10 36.1 1.80 22.5 34.1 52.3 2834 116 2087 2767 3666 1.0 0.04 0.7 1.0 1.4
11–14 40.2 3.48 24.6 37.3 59.2 3002 132 2169 2947 3905 1.1 0.05 0.7 1.1 1.7
Total 38.1 1.90 25.0 36.2 53.4 2792 93 1973 2721 3703 1.0 0.04 0.8 1.0 1.4
NZEO Males 5–6 28.3 3.21 19.0 26.8 39.3 2879 171 2053 2758 3843 1.0 0.05 0.7 1.0 1.4
7–10 35.5 2.06 22.6 33.1 51.3 3337 106 2779 3304 3939 1.3 0.06 1.1 1.3 1.6
11–14 47.5 3.70 25.0 43.0 75.0 3995 175 2592 3851 5582 1.6 0.15 0.9 1.4 2.4
Total 39.6 1.97 24.5 36.8 57.9 3526 87 2674 3452 4474 1.4 0.07 0.9 1.2 2.0
Females 5–6 22.6 1.40 13.9 20.8 33.7 2569 135 1604 2502 3621 1.2 0.28 0.6 1.0 1.9
7–10 31.8 1.62 20.2 30.4 45.3 2821 91 2130 2774 3571 1.6 0.64 0.8 1.1 2.0
11–14 32.7 2.13 20.7 31.3 46.6 3002 130 1873 2958 4184 1.1 0.04 0.7 1.1 1.6
Total 30.7 1.27 20.0 29.3 43.2 2856 68 1814 2779 3996 1.3 0.18 0.7 1.0 1.8
* Percentiles.
1 Usual intake. These data were adjusted for intra-individual variation using PC-SIDE.
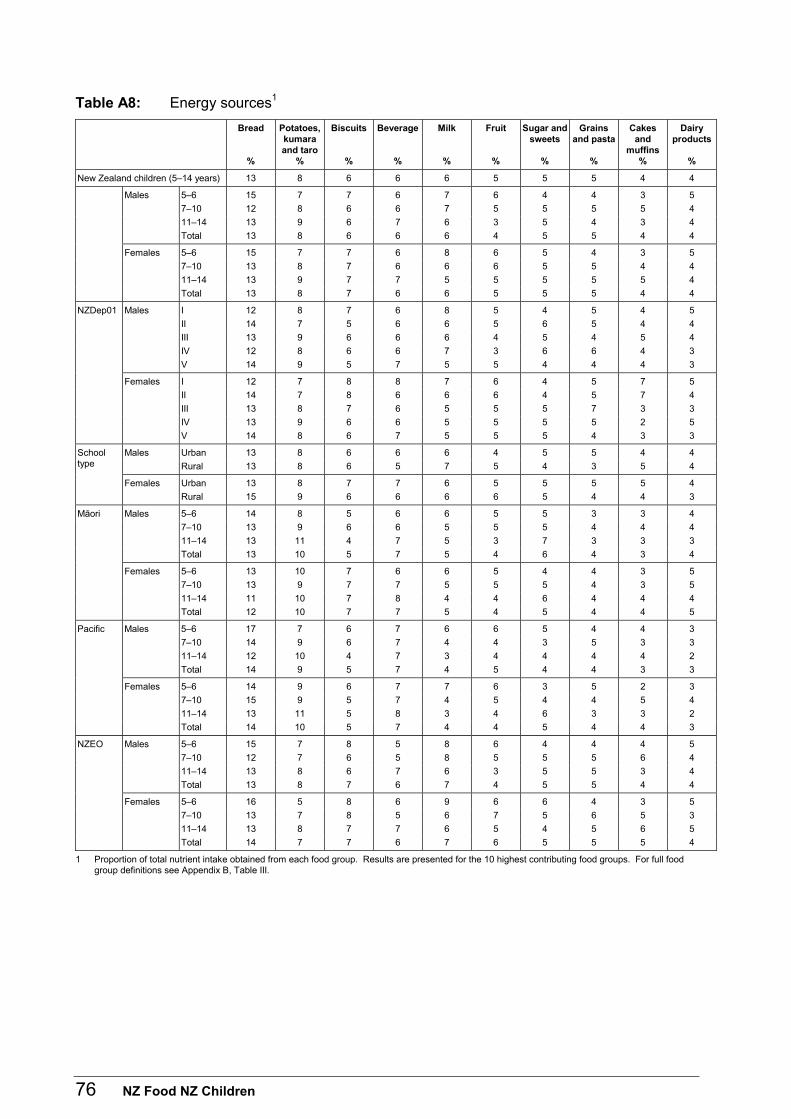
76 NZ Food NZ Children
Table A8: Energy sources1
Bread
%
Potatoes, kumara and taro
%
Biscuits
%
Beverage
%
Milk
%
Fruit
%
Sugar and sweets
%
Grains and pasta
%
Cakes and
muffins%
Dairy products
%
New Zealand children (5–14 years) 13 8 6 6 6 5 5 5 4 4
Males 5–6 15 7 7 6 7 6 4 4 3 5
7–10 12 8 6 6 7 5 5 5 5 4
11–14 13 9 6 7 6 3 5 4 3 4
Total 13 8 6 6 6 4 5 5 4 4
Females 5–6 15 7 7 6 8 6 5 4 3 5
7–10 13 8 7 6 6 6 5 5 4 4
11–14 13 9 7 7 5 5 5 5 5 4
Total 13 8 7 6 6 5 5 5 4 4
NZDep01 Males I 12 8 7 6 8 5 4 5 4 5
II 14 7 5 6 6 5 6 5 4 4
III 13 9 6 6 6 4 5 4 5 4
IV 12 8 6 6 7 3 6 6 4 3
V 14 9 5 7 5 5 4 4 4 3
Females I 12 7 8 8 7 6 4 5 7 5
II 14 7 8 6 6 6 4 5 7 4
III 13 8 7 6 5 5 5 7 3 3
IV 13 9 6 6 5 5 5 5 2 5
V 14 8 6 7 5 5 5 4 3 3
Males Urban 13 8 6 6 6 4 5 5 4 4 School type Rural 13 8 6 5 7 5 4 3 5 4
Females Urban 13 8 7 7 6 5 5 5 5 4
Rural 15 9 6 6 6 6 5 4 4 3
Mäori Males 5–6 14 8 5 6 6 5 5 3 3 4
7–10 13 9 6 6 5 5 5 4 4 4
11–14 13 11 4 7 5 3 7 3 3 3
Total 13 10 5 7 5 4 6 4 3 4
Females 5–6 13 10 7 6 6 5 4 4 3 5
7–10 13 9 7 7 5 5 5 4 3 5
11–14 11 10 7 8 4 4 6 4 4 4
Total 12 10 7 7 5 4 5 4 4 5
Pacific Males 5–6 17 7 6 7 6 6 5 4 4 3
7–10 14 9 6 7 4 4 3 5 3 3
11–14 12 10 4 7 3 4 4 4 4 2
Total 14 9 5 7 4 5 4 4 3 3
Females 5–6 14 9 6 7 7 6 3 5 2 3
7–10 15 9 5 7 4 5 4 4 5 4
11–14 13 11 5 8 3 4 6 3 3 2
Total 14 10 5 7 4 4 5 4 4 3
NZEO Males 5–6 15 7 8 5 8 6 4 4 4 5
7–10 12 7 6 5 8 5 5 5 6 4
11–14 13 8 6 7 6 3 5 5 3 4
Total 13 8 7 6 7 4 5 5 4 4
Females 5–6 16 5 8 6 9 6 6 4 3 5
7–10 13 7 8 5 6 7 5 6 5 3
11–14 13 8 7 7 6 5 4 5 6 5
Total 14 7 7 6 7 6 5 5 5 4
1 Proportion of total nutrient intake obtained from each food group. Results are presented for the 10 highest contributing food groups. For full food group definitions see Appendix B, Table III.
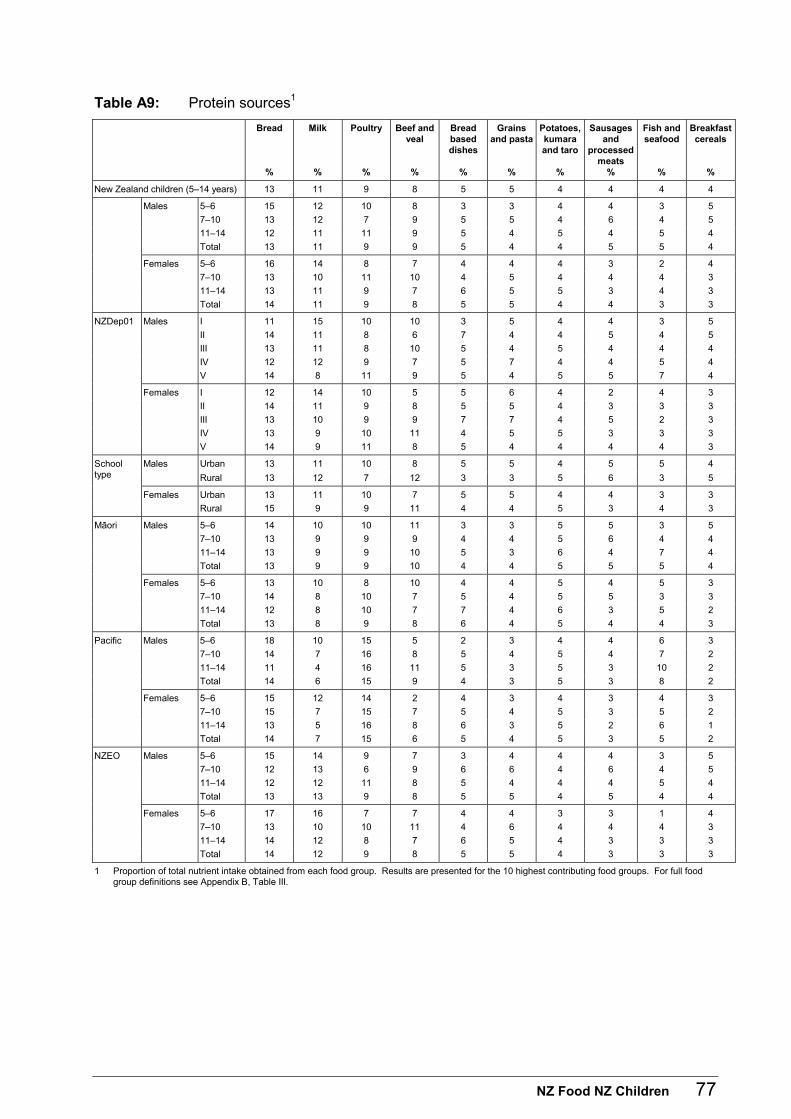
NZ Food NZ Children 77
Table A9: Protein sources1
Bread
%
Milk
%
Poultry
%
Beef and veal
%
Bread based dishes
%
Grains and pasta
%
Potatoes, kumara and taro
%
Sausages and
processed meats
%
Fish and seafood
%
Breakfast cereals
%
New Zealand children (5–14 years) 13 11 9 8 5 5 4 4 4 4
Males 5–6 15 12 10 8 3 3 4 4 3 5
7–10 13 12 7 9 5 5 4 6 4 5
11–14 12 11 11 9 5 4 5 4 5 4
Total 13 11 9 9 5 4 4 5 5 4
Females 5–6 16 14 8 7 4 4 4 3 2 4
7–10 13 10 11 10 4 5 4 4 4 3
11–14 13 11 9 7 6 5 5 3 4 3
Total 14 11 9 8 5 5 4 4 3 3
NZDep01 Males I 11 15 10 10 3 5 4 4 3 5
II 14 11 8 6 7 4 4 5 4 5
III 13 11 8 10 5 4 5 4 4 4
IV 12 12 9 7 5 7 4 4 5 4
V 14 8 11 9 5 4 5 5 7 4
Females I 12 14 10 5 5 6 4 2 4 3
II 14 11 9 8 5 5 4 3 3 3
III 13 10 9 9 7 7 4 5 2 3
IV 13 9 10 11 4 5 5 3 3 3
V 14 9 11 8 5 4 4 4 4 3
Males Urban 13 11 10 8 5 5 4 5 5 4 School type Rural 13 12 7 12 3 3 5 6 3 5
Females Urban 13 11 10 7 5 5 4 4 3 3
Rural 15 9 9 11 4 4 5 3 4 3
Mäori Males 5–6 14 10 10 11 3 3 5 5 3 5
7–10 13 9 9 9 4 4 5 6 4 4
11–14 13 9 9 10 5 3 6 4 7 4
Total 13 9 9 10 4 4 5 5 5 4
Females 5–6 13 10 8 10 4 4 5 4 5 3
7–10 14 8 10 7 5 4 5 5 3 3
11–14 12 8 10 7 7 4 6 3 5 2
Total 13 8 9 8 6 4 5 4 4 3
Pacific Males 5–6 18 10 15 5 2 3 4 4 6 3
7–10 14 7 16 8 5 4 5 4 7 2
11–14 11 4 16 11 5 3 5 3 10 2
Total 14 6 15 9 4 3 5 3 8 2
Females 5–6 15 12 14 2 4 3 4 3 4 3
7–10 15 7 15 7 5 4 5 3 5 2
11–14 13 5 16 8 6 3 5 2 6 1
Total 14 7 15 6 5 4 5 3 5 2
NZEO Males 5–6 15 14 9 7 3 4 4 4 3 5
7–10 12 13 6 9 6 6 4 6 4 5
11–14 12 12 11 8 5 4 4 4 5 4
Total 13 13 9 8 5 5 4 5 4 4
Females 5–6 17 16 7 7 4 4 3 3 1 4
7–10 13 10 10 11 4 6 4 4 4 3
11–14 14 12 8 7 6 5 4 3 3 3
Total 14 12 9 8 5 5 4 3 3 3
1 Proportion of total nutrient intake obtained from each food group. Results are presented for the 10 highest contributing food groups. For full food group definitions see Appendix B, Table III.
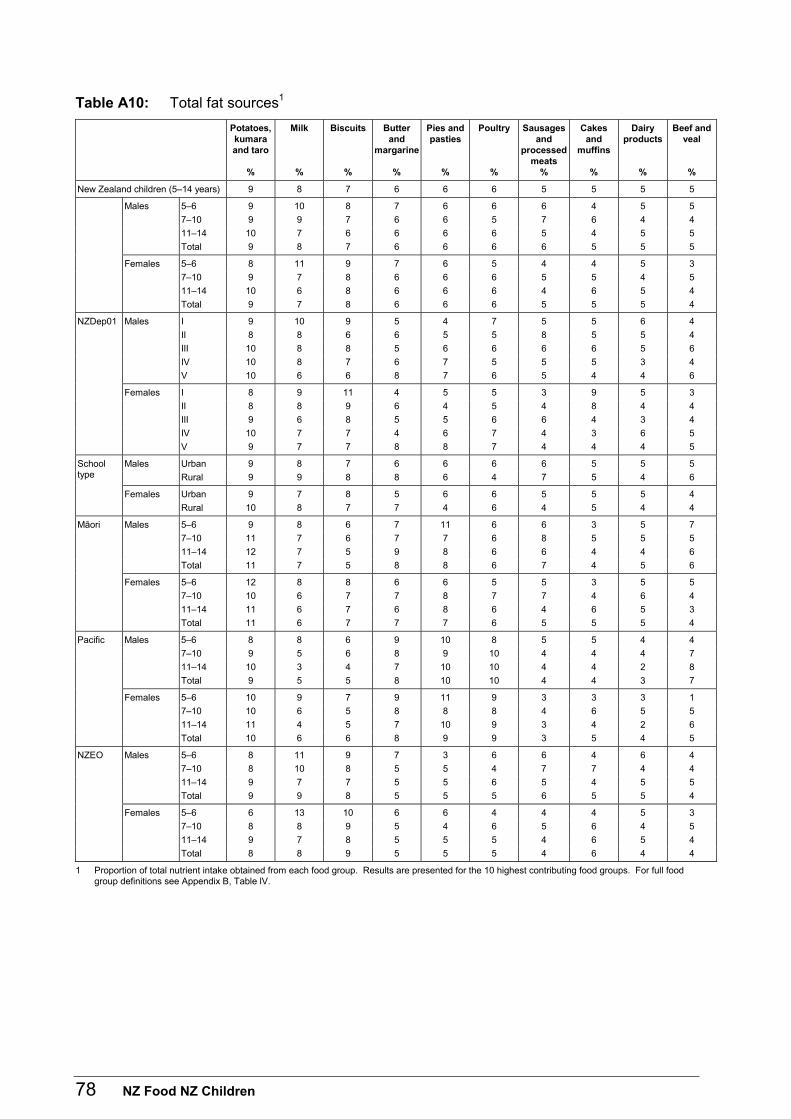
78 NZ Food NZ Children
Table A10: Total fat sources1
Potatoes, kumara and taro
%
Milk
%
Biscuits
%
Butter and
margarine
%
Pies and pasties
%
Poultry
%
Sausages and
processed meats
%
Cakes and
muffins
%
Dairy products
%
Beef and veal
%
New Zealand children (5–14 years) 9 8 7 6 6 6 5 5 5 5
Males 5–6 9 10 8 7 6 6 6 4 5 5
7–10 9 9 7 6 6 5 7 6 4 4
11–14 10 7 6 6 6 6 5 4 5 5
Total 9 8 7 6 6 6 6 5 5 5
Females 5–6 8 11 9 7 6 5 4 4 5 3
7–10 9 7 8 6 6 6 5 5 4 5
11–14 10 6 8 6 6 6 4 6 5 4
Total 9 7 8 6 6 6 5 5 5 4
NZDep01 Males I 9 10 9 5 4 7 5 5 6 4
II 8 8 6 6 5 5 8 5 5 4
III 10 8 8 5 6 6 6 6 5 6
IV 10 8 7 6 7 5 5 5 3 4
V 10 6 6 8 7 6 5 4 4 6
Females I 8 9 11 4 5 5 3 9 5 3
II 8 8 9 6 4 5 4 8 4 4
III 9 6 8 5 5 6 6 4 3 4
IV 10 7 7 4 6 7 4 3 6 5
V 9 7 7 8 8 7 4 4 4 5
Males Urban 9 8 7 6 6 6 6 5 5 5 School type Rural 9 9 8 8 6 4 7 5 4 6
Females Urban 9 7 8 5 6 6 5 5 5 4
Rural 10 8 7 7 4 6 4 5 4 4
Mäori Males 5–6 9 8 6 7 11 6 6 3 5 7
7–10 11 7 6 7 7 6 8 5 5 5
11–14 12 7 5 9 8 6 6 4 4 6
Total 11 7 5 8 8 6 7 4 5 6
Females 5–6 12 8 8 6 6 5 5 3 5 5
7–10 10 6 7 7 8 7 7 4 6 4
11–14 11 6 7 6 8 6 4 6 5 3
Total 11 6 7 7 7 6 5 5 5 4
Pacific Males 5–6 8 8 6 9 10 8 5 5 4 4
7–10 9 5 6 8 9 10 4 4 4 7
11–14 10 3 4 7 10 10 4 4 2 8
Total 9 5 5 8 10 10 4 4 3 7
Females 5–6 10 9 7 9 11 9 3 3 3 1
7–10 10 6 5 8 8 8 4 6 5 5
11–14 11 4 5 7 10 9 3 4 2 6
Total 10 6 6 8 9 9 3 5 4 5
NZEO Males 5–6 8 11 9 7 3 6 6 4 6 4
7–10 8 10 8 5 5 4 7 7 4 4
11–14 9 7 7 5 5 6 5 4 5 5
Total 9 9 8 5 5 5 6 5 5 4
Females 5–6 6 13 10 6 6 4 4 4 5 3
7–10 8 8 9 5 4 6 5 6 4 5
11–14 9 7 8 5 5 5 4 6 5 4
Total 8 8 9 5 5 5 4 6 4 4
1 Proportion of total nutrient intake obtained from each food group. Results are presented for the 10 highest contributing food groups. For full food group definitions see Appendix B, Table lV.
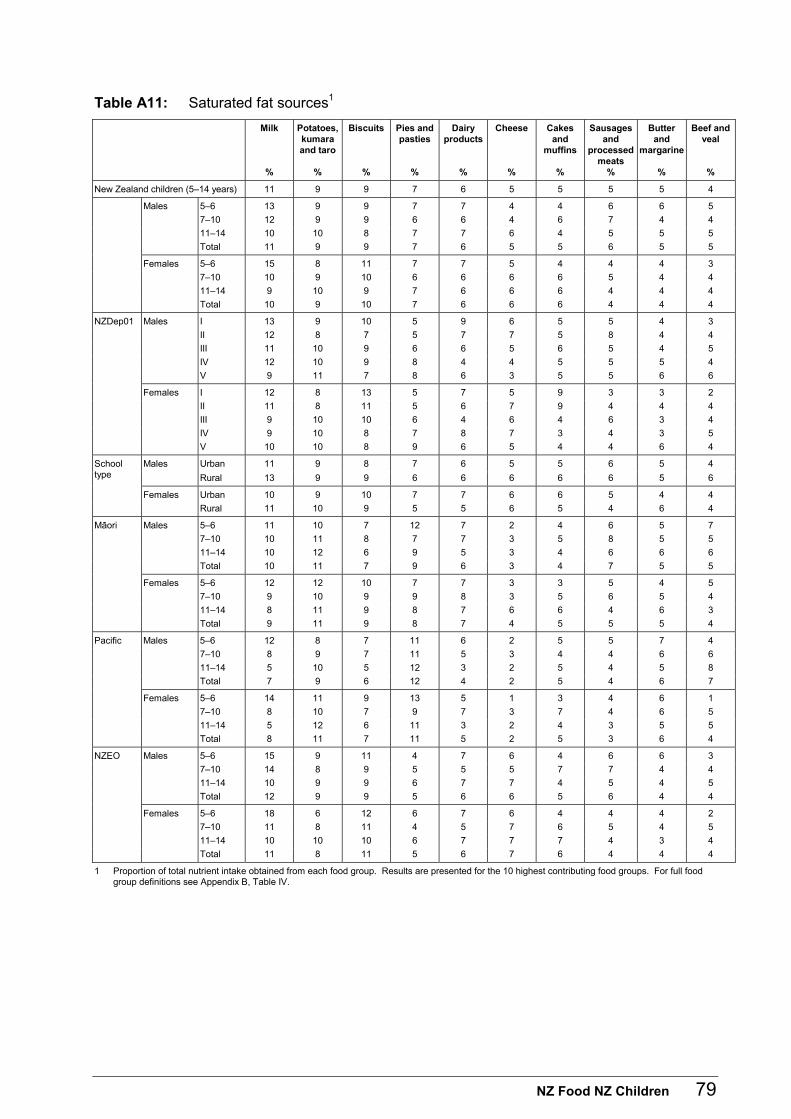
NZ Food NZ Children 79
Table A11: Saturated fat sources1
Milk
%
Potatoes, kumara and taro
%
Biscuits
%
Pies and pasties
%
Dairy products
%
Cheese
%
Cakes and
muffins
%
Sausages and
processed meats
%
Butter and
margarine
%
Beef and veal
%
New Zealand children (5–14 years) 11 9 9 7 6 5 5 5 5 4
Males 5–6 13 9 9 7 7 4 4 6 6 5
7–10 12 9 9 6 6 4 6 7 4 4
11–14 10 10 8 7 7 6 4 5 5 5
Total 11 9 9 7 6 5 5 6 5 5
Females 5–6 15 8 11 7 7 5 4 4 4 3
7–10 10 9 10 6 6 6 6 5 4 4
11–14 9 10 9 7 6 6 6 4 4 4
Total 10 9 10 7 6 6 6 4 4 4
NZDep01 Males I 13 9 10 5 9 6 5 5 4 3
II 12 8 7 5 7 7 5 8 4 4
III 11 10 9 6 6 5 6 5 4 5
IV 12 10 9 8 4 4 5 5 5 4
V 9 11 7 8 6 3 5 5 6 6
Females I 12 8 13 5 7 5 9 3 3 2
II 11 8 11 5 6 7 9 4 4 4
III 9 10 10 6 4 6 4 6 3 4
IV 9 10 8 7 8 7 3 4 3 5
V 10 10 8 9 6 5 4 4 6 4
Males Urban 11 9 8 7 6 5 5 6 5 4 School type Rural 13 9 9 6 6 6 6 6 5 6
Females Urban 10 9 10 7 7 6 6 5 4 4
Rural 11 10 9 5 5 6 5 4 6 4
Mäori Males 5–6 11 10 7 12 7 2 4 6 5 7
7–10 10 11 8 7 7 3 5 8 5 5
11–14 10 12 6 9 5 3 4 6 6 6
Total 10 11 7 9 6 3 4 7 5 5
Females 5–6 12 12 10 7 7 3 3 5 4 5
7–10 9 10 9 9 8 3 5 6 5 4
11–14 8 11 9 8 7 6 6 4 6 3
Total 9 11 9 8 7 4 5 5 5 4
Pacific Males 5–6 12 8 7 11 6 2 5 5 7 4
7–10 8 9 7 11 5 3 4 4 6 6
11–14 5 10 5 12 3 2 5 4 5 8
Total 7 9 6 12 4 2 5 4 6 7
Females 5–6 14 11 9 13 5 1 3 4 6 1
7–10 8 10 7 9 7 3 7 4 6 5
11–14 5 12 6 11 3 2 4 3 5 5
Total 8 11 7 11 5 2 5 3 6 4
NZEO Males 5–6 15 9 11 4 7 6 4 6 6 3
7–10 14 8 9 5 5 5 7 7 4 4
11–14 10 9 9 6 7 7 4 5 4 5
Total 12 9 9 5 6 6 5 6 4 4
Females 5–6 18 6 12 6 7 6 4 4 4 2
7–10 11 8 11 4 5 7 6 5 4 5
11–14 10 10 10 6 7 7 7 4 3 4
Total 11 8 11 5 6 7 6 4 4 4
1 Proportion of total nutrient intake obtained from each food group. Results are presented for the 10 highest contributing food groups. For full food group definitions see Appendix B, Table IV.
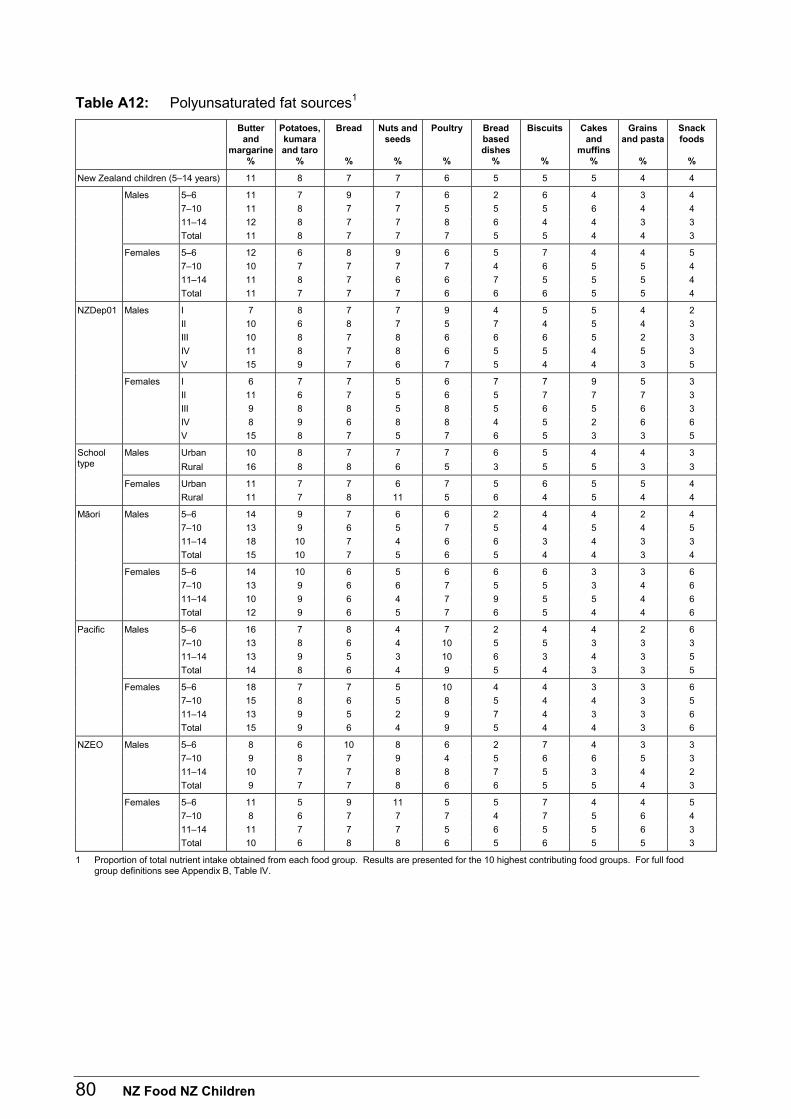
80 NZ Food NZ Children
Table A12: Polyunsaturated fat sources1
Butter and
margarine%
Potatoes, kumara and taro
%
Bread
%
Nuts and seeds
%
Poultry
%
Bread based dishes
%
Biscuits
%
Cakes and
muffins %
Grains and pasta
%
Snack foods
%
New Zealand children (5–14 years) 11 8 7 7 6 5 5 5 4 4
Males 5–6 11 7 9 7 6 2 6 4 3 4
7–10 11 8 7 7 5 5 5 6 4 4
11–14 12 8 7 7 8 6 4 4 3 3
Total 11 8 7 7 7 5 5 4 4 3
Females 5–6 12 6 8 9 6 5 7 4 4 5
7–10 10 7 7 7 7 4 6 5 5 4
11–14 11 8 7 6 6 7 5 5 5 4
Total 11 7 7 7 6 6 6 5 5 4
NZDep01 Males I 7 8 7 7 9 4 5 5 4 2
II 10 6 8 7 5 7 4 5 4 3
III 10 8 7 8 6 6 6 5 2 3
IV 11 8 7 8 6 5 5 4 5 3
V 15 9 7 6 7 5 4 4 3 5
Females I 6 7 7 5 6 7 7 9 5 3
II 11 6 7 5 6 5 7 7 7 3
III 9 8 8 5 8 5 6 5 6 3
IV 8 9 6 8 8 4 5 2 6 6
V 15 8 7 5 7 6 5 3 3 5
Males Urban 10 8 7 7 7 6 5 4 4 3 School type Rural 16 8 8 6 5 3 5 5 3 3
Females Urban 11 7 7 6 7 5 6 5 5 4
Rural 11 7 8 11 5 6 4 5 4 4
Mäori Males 5–6 14 9 7 6 6 2 4 4 2 4
7–10 13 9 6 5 7 5 4 5 4 5
11–14 18 10 7 4 6 6 3 4 3 3
Total 15 10 7 5 6 5 4 4 3 4
Females 5–6 14 10 6 5 6 6 6 3 3 6
7–10 13 9 6 6 7 5 5 3 4 6
11–14 10 9 6 4 7 9 5 5 4 6
Total 12 9 6 5 7 6 5 4 4 6
Pacific Males 5–6 16 7 8 4 7 2 4 4 2 6
7–10 13 8 6 4 10 5 5 3 3 3
11–14 13 9 5 3 10 6 3 4 3 5
Total 14 8 6 4 9 5 4 3 3 5
Females 5–6 18 7 7 5 10 4 4 3 3 6
7–10 15 8 6 5 8 5 4 4 3 5
11–14 13 9 5 2 9 7 4 3 3 6
Total 15 9 6 4 9 5 4 4 3 6
NZEO Males 5–6 8 6 10 8 6 2 7 4 3 3
7–10 9 8 7 9 4 5 6 6 5 3
11–14 10 7 7 8 8 7 5 3 4 2
Total 9 7 7 8 6 6 5 5 4 3
Females 5–6 11 5 9 11 5 5 7 4 4 5
7–10 8 6 7 7 7 4 7 5 6 4
11–14 11 7 7 7 5 6 5 5 6 3
Total 10 6 8 8 6 5 6 5 5 3
1 Proportion of total nutrient intake obtained from each food group. Results are presented for the 10 highest contributing food groups. For full food group definitions see Appendix B, Table IV.
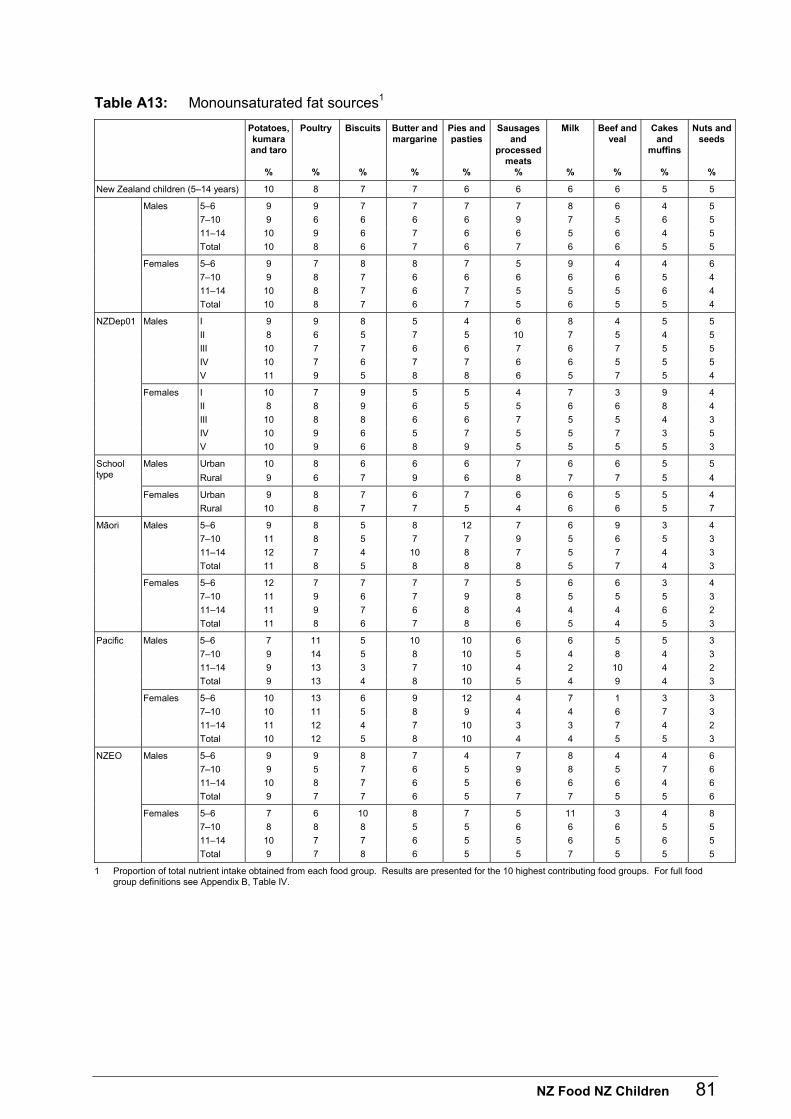
NZ Food NZ Children 81
Table A13: Monounsaturated fat sources1
Potatoes, kumara and taro
%
Poultry
%
Biscuits
%
Butter and margarine
%
Pies and pasties
%
Sausages and
processed meats
%
Milk
%
Beef and veal
%
Cakes and
muffins
%
Nuts and seeds
%
New Zealand children (5–14 years) 10 8 7 7 6 6 6 6 5 5
Males 5–6 9 9 7 7 7 7 8 6 4 5
7–10 9 6 6 6 6 9 7 5 6 5
11–14 10 9 6 7 6 6 5 6 4 5
Total 10 8 6 7 6 7 6 6 5 5
Females 5–6 9 7 8 8 7 5 9 4 4 6
7–10 9 8 7 6 6 6 6 6 5 4
11–14 10 8 7 6 7 5 5 5 6 4
Total 10 8 7 6 7 5 6 5 5 4
NZDep01 Males I 9 9 8 5 4 6 8 4 5 5
II 8 6 5 7 5 10 7 5 4 5
III 10 7 7 6 6 7 6 7 5 5
IV 10 7 6 7 7 6 6 5 5 5
V 11 9 5 8 8 6 5 7 5 4
Females I 10 7 9 5 5 4 7 3 9 4
II 8 8 9 6 5 5 6 6 8 4
III 10 8 8 6 6 7 5 5 4 3
IV 10 9 6 5 7 5 5 7 3 5
V 10 9 6 8 9 5 5 5 5 3
Males Urban 10 8 6 6 6 7 6 6 5 5 School type Rural 9 6 7 9 6 8 7 7 5 4
Females Urban 9 8 7 6 7 6 6 5 5 4
Rural 10 8 7 7 5 4 6 6 5 7
Mäori Males 5–6 9 8 5 8 12 7 6 9 3 4
7–10 11 8 5 7 7 9 5 6 5 3
11–14 12 7 4 10 8 7 5 7 4 3
Total 11 8 5 8 8 8 5 7 4 3
Females 5–6 12 7 7 7 7 5 6 6 3 4
7–10 11 9 6 7 9 8 5 5 5 3
11–14 11 9 7 6 8 4 4 4 6 2
Total 11 8 6 7 8 6 5 4 5 3
Pacific Males 5–6 7 11 5 10 10 6 6 5 5 3
7–10 9 14 5 8 10 5 4 8 4 3
11–14 9 13 3 7 10 4 2 10 4 2
Total 9 13 4 8 10 5 4 9 4 3
Females 5–6 10 13 6 9 12 4 7 1 3 3
7–10 10 11 5 8 9 4 4 6 7 3
11–14 11 12 4 7 10 3 3 7 4 2
Total 10 12 5 8 10 4 4 5 5 3
NZEO Males 5–6 9 9 8 7 4 7 8 4 4 6
7–10 9 5 7 6 5 9 8 5 7 6
11–14 10 8 7 6 5 6 6 6 4 6
Total 9 7 7 6 5 7 7 5 5 6
Females 5–6 7 6 10 8 7 5 11 3 4 8
7–10 8 8 8 5 5 6 6 6 5 5
11–14 10 7 7 6 5 5 6 5 6 5
Total 9 7 8 6 5 5 7 5 5 5
1 Proportion of total nutrient intake obtained from each food group. Results are presented for the 10 highest contributing food groups. For full food group definitions see Appendix B, Table IV.
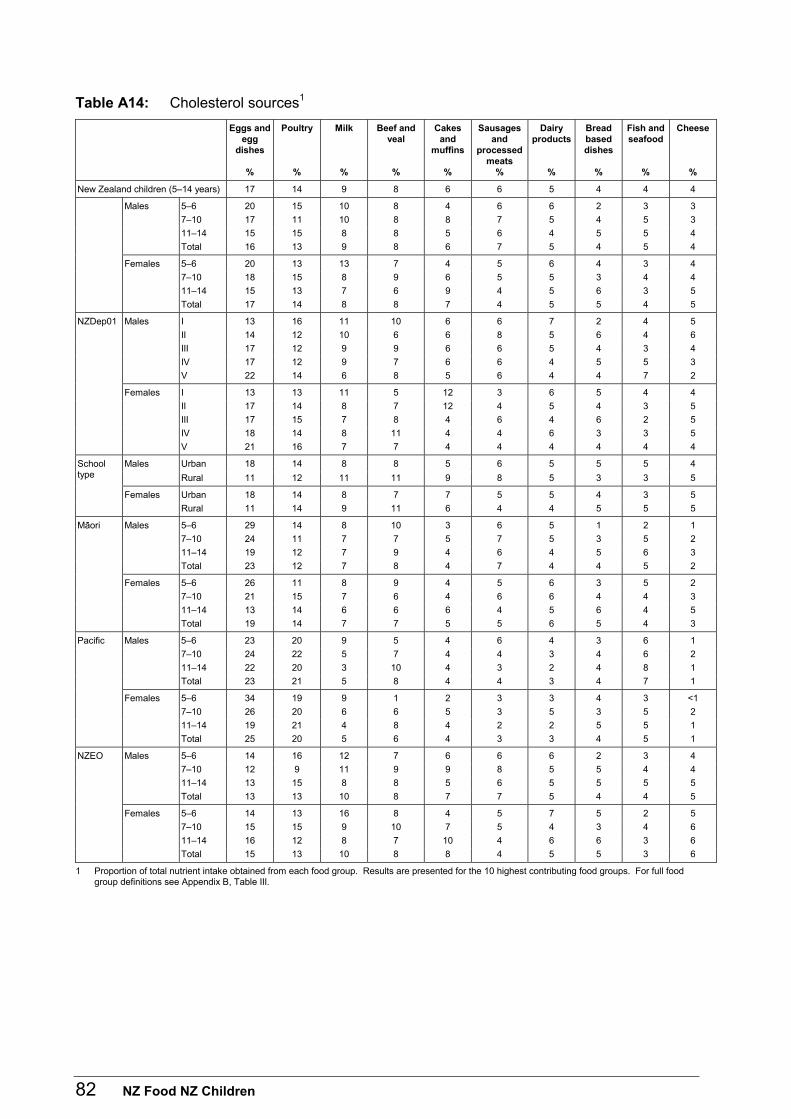
82 NZ Food NZ Children
Table A14: Cholesterol sources1
Eggs and egg
dishes
%
Poultry
%
Milk
%
Beef and veal
%
Cakes and
muffins
%
Sausages and
processed meats
%
Dairy products
%
Bread based dishes
%
Fish and seafood
%
Cheese
%
New Zealand children (5–14 years) 17 14 9 8 6 6 5 4 4 4
Males 5–6 20 15 10 8 4 6 6 2 3 3
7–10 17 11 10 8 8 7 5 4 5 3
11–14 15 15 8 8 5 6 4 5 5 4
Total 16 13 9 8 6 7 5 4 5 4
Females 5–6 20 13 13 7 4 5 6 4 3 4
7–10 18 15 8 9 6 5 5 3 4 4
11–14 15 13 7 6 9 4 5 6 3 5
Total 17 14 8 8 7 4 5 5 4 5
NZDep01 Males I 13 16 11 10 6 6 7 2 4 5
II 14 12 10 6 6 8 5 6 4 6
III 17 12 9 9 6 6 5 4 3 4
IV 17 12 9 7 6 6 4 5 5 3
V 22 14 6 8 5 6 4 4 7 2
Females I 13 13 11 5 12 3 6 5 4 4
II 17 14 8 7 12 4 5 4 3 5
III 17 15 7 8 4 6 4 6 2 5
IV 18 14 8 11 4 4 6 3 3 5
V 21 16 7 7 4 4 4 4 4 4
Males Urban 18 14 8 8 5 6 5 5 5 4 School type Rural 11 12 11 11 9 8 5 3 3 5
Females Urban 18 14 8 7 7 5 5 4 3 5
Rural 11 14 9 11 6 4 4 5 5 5
Mäori Males 5–6 29 14 8 10 3 6 5 1 2 1
7–10 24 11 7 7 5 7 5 3 5 2
11–14 19 12 7 9 4 6 4 5 6 3
Total 23 12 7 8 4 7 4 4 5 2
Females 5–6 26 11 8 9 4 5 6 3 5 2
7–10 21 15 7 6 4 6 6 4 4 3
11–14 13 14 6 6 6 4 5 6 4 5
Total 19 14 7 7 5 5 6 5 4 3
Pacific Males 5–6 23 20 9 5 4 6 4 3 6 1
7–10 24 22 5 7 4 4 3 4 6 2
11–14 22 20 3 10 4 3 2 4 8 1
Total 23 21 5 8 4 4 3 4 7 1
Females 5–6 34 19 9 1 2 3 3 4 3 <1
7–10 26 20 6 6 5 3 5 3 5 2
11–14 19 21 4 8 4 2 2 5 5 1
Total 25 20 5 6 4 3 3 4 5 1
NZEO Males 5–6 14 16 12 7 6 6 6 2 3 4
7–10 12 9 11 9 9 8 5 5 4 4
11–14 13 15 8 8 5 6 5 5 5 5
Total 13 13 10 8 7 7 5 4 4 5
Females 5–6 14 13 16 8 4 5 7 5 2 5
7–10 15 15 9 10 7 5 4 3 4 6
11–14 16 12 8 7 10 4 6 6 3 6
Total 15 13 10 8 8 4 5 5 3 6
1 Proportion of total nutrient intake obtained from each food group. Results are presented for the 10 highest contributing food groups. For full food group definitions see Appendix B, Table III.
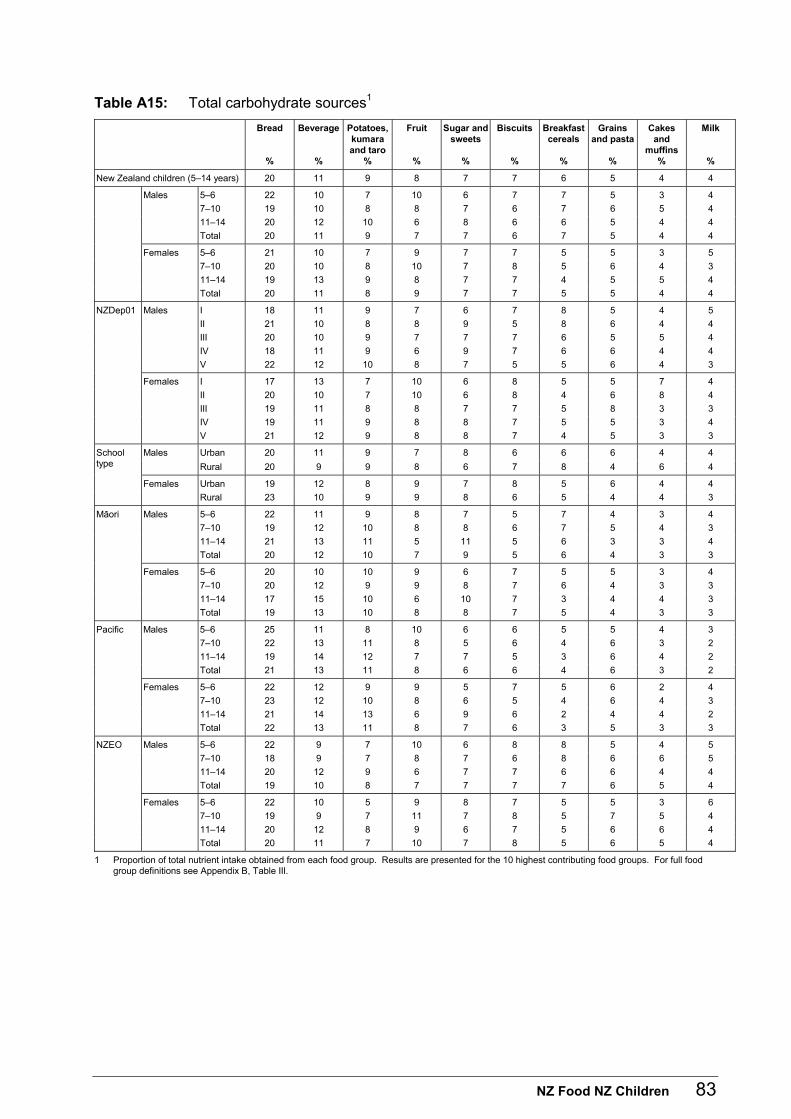
NZ Food NZ Children 83
Table A15: Total carbohydrate sources1
Bread
%
Beverage
%
Potatoes, kumara and taro
%
Fruit
%
Sugar and sweets
%
Biscuits
%
Breakfast cereals
%
Grains and pasta
%
Cakes and
muffins%
Milk
%
New Zealand children (5–14 years) 20 11 9 8 7 7 6 5 4 4
Males 5–6 22 10 7 10 6 7 7 5 3 4
7–10 19 10 8 8 7 6 7 6 5 4
11–14 20 12 10 6 8 6 6 5 4 4
Total 20 11 9 7 7 6 7 5 4 4
Females 5–6 21 10 7 9 7 7 5 5 3 5
7–10 20 10 8 10 7 8 5 6 4 3
11–14 19 13 9 8 7 7 4 5 5 4
Total 20 11 8 9 7 7 5 5 4 4
NZDep01 Males I 18 11 9 7 6 7 8 5 4 5
II 21 10 8 8 9 5 8 6 4 4
III 20 10 9 7 7 7 6 5 5 4
IV 18 11 9 6 9 7 6 6 4 4
V 22 12 10 8 7 5 5 6 4 3
Females I 17 13 7 10 6 8 5 5 7 4
II 20 10 7 10 6 8 4 6 8 4
III 19 11 8 8 7 7 5 8 3 3
IV 19 11 9 8 8 7 5 5 3 4
V 21 12 9 8 8 7 4 5 3 3
Males Urban 20 11 9 7 8 6 6 6 4 4 School type Rural 20 9 9 8 6 7 8 4 6 4
Females Urban 19 12 8 9 7 8 5 6 4 4
Rural 23 10 9 9 8 6 5 4 4 3
Mäori Males 5–6 22 11 9 8 7 5 7 4 3 4
7–10 19 12 10 8 8 6 7 5 4 3
11–14 21 13 11 5 11 5 6 3 3 4
Total 20 12 10 7 9 5 6 4 3 3
Females 5–6 20 10 10 9 6 7 5 5 3 4
7–10 20 12 9 9 8 7 6 4 3 3
11–14 17 15 10 6 10 7 3 4 4 3
Total 19 13 10 8 8 7 5 4 3 3
Pacific Males 5–6 25 11 8 10 6 6 5 5 4 3
7–10 22 13 11 8 5 6 4 6 3 2
11–14 19 14 12 7 7 5 3 6 4 2
Total 21 13 11 8 6 6 4 6 3 2
Females 5–6 22 12 9 9 5 7 5 6 2 4
7–10 23 12 10 8 6 5 4 6 4 3
11–14 21 14 13 6 9 6 2 4 4 2
Total 22 13 11 8 7 6 3 5 3 3
NZEO Males 5–6 22 9 7 10 6 8 8 5 4 5
7–10 18 9 7 8 7 6 8 6 6 5
11–14 20 12 9 6 7 7 6 6 4 4
Total 19 10 8 7 7 7 7 6 5 4
Females 5–6 22 10 5 9 8 7 5 5 3 6
7–10 19 9 7 11 7 8 5 7 5 4
11–14 20 12 8 9 6 7 5 6 6 4
Total 20 11 7 10 7 8 5 6 5 4
1 Proportion of total nutrient intake obtained from each food group. Results are presented for the 10 highest contributing food groups. For full food group definitions see Appendix B, Table III.
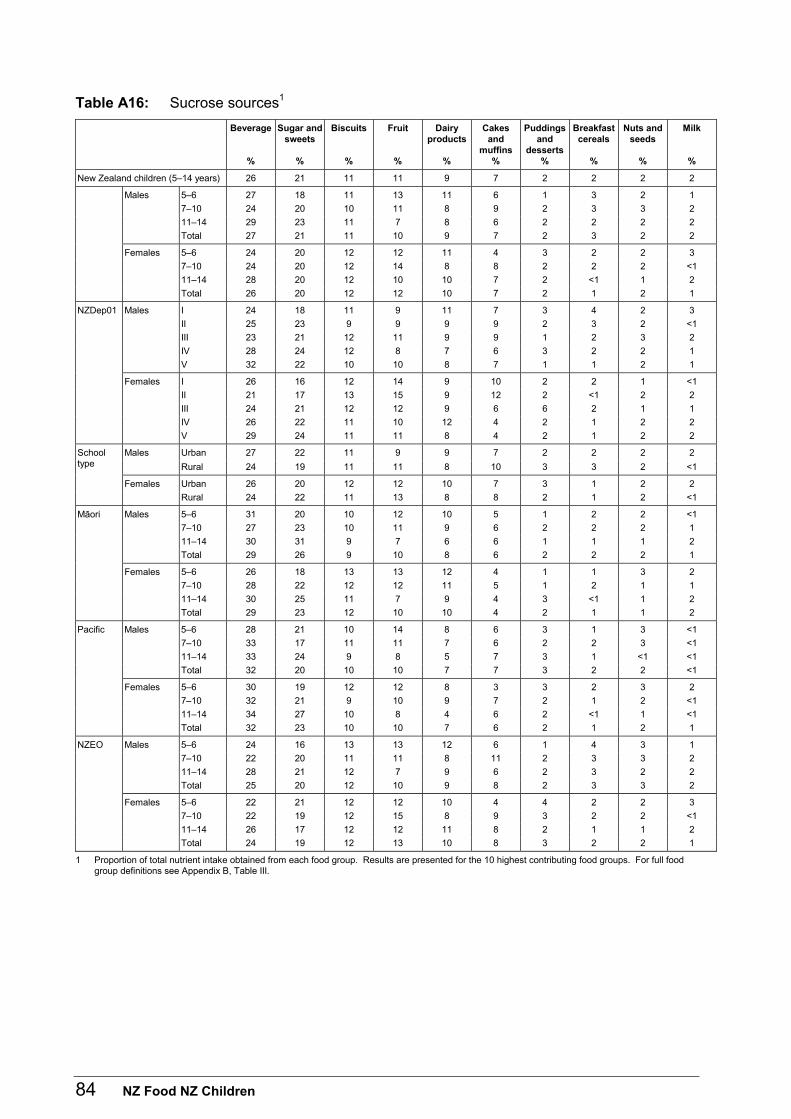
84 NZ Food NZ Children
Table A16: Sucrose sources1
Beverage
%
Sugar and sweets
%
Biscuits
%
Fruit
%
Dairy products
%
Cakes and
muffins%
Puddings and
desserts %
Breakfast cereals
%
Nuts and seeds
%
Milk
%
New Zealand children (5–14 years) 26 21 11 11 9 7 2 2 2 2
Males 5–6 27 18 11 13 11 6 1 3 2 1
7–10 24 20 10 11 8 9 2 3 3 2
11–14 29 23 11 7 8 6 2 2 2 2
Total 27 21 11 10 9 7 2 3 2 2
Females 5–6 24 20 12 12 11 4 3 2 2 3
7–10 24 20 12 14 8 8 2 2 2 <1
11–14 28 20 12 10 10 7 2 <1 1 2
Total 26 20 12 12 10 7 2 1 2 1
NZDep01 Males I 24 18 11 9 11 7 3 4 2 3
II 25 23 9 9 9 9 2 3 2 <1
III 23 21 12 11 9 9 1 2 3 2
IV 28 24 12 8 7 6 3 2 2 1
V 32 22 10 10 8 7 1 1 2 1
Females I 26 16 12 14 9 10 2 2 1 <1
II 21 17 13 15 9 12 2 <1 2 2
III 24 21 12 12 9 6 6 2 1 1
IV 26 22 11 10 12 4 2 1 2 2
V 29 24 11 11 8 4 2 1 2 2
Males Urban 27 22 11 9 9 7 2 2 2 2 School type Rural 24 19 11 11 8 10 3 3 2 <1
Females Urban 26 20 12 12 10 7 3 1 2 2
Rural 24 22 11 13 8 8 2 1 2 <1
Mäori Males 5–6 31 20 10 12 10 5 1 2 2 <1
7–10 27 23 10 11 9 6 2 2 2 1
11–14 30 31 9 7 6 6 1 1 1 2
Total 29 26 9 10 8 6 2 2 2 1
Females 5–6 26 18 13 13 12 4 1 1 3 2
7–10 28 22 12 12 11 5 1 2 1 1
11–14 30 25 11 7 9 4 3 <1 1 2
Total 29 23 12 10 10 4 2 1 1 2
Pacific Males 5–6 28 21 10 14 8 6 3 1 3 <1
7–10 33 17 11 11 7 6 2 2 3 <1
11–14 33 24 9 8 5 7 3 1 <1 <1
Total 32 20 10 10 7 7 3 2 2 <1
Females 5–6 30 19 12 12 8 3 3 2 3 2
7–10 32 21 9 10 9 7 2 1 2 <1
11–14 34 27 10 8 4 6 2 <1 1 <1
Total 32 23 10 10 7 6 2 1 2 1
NZEO Males 5–6 24 16 13 13 12 6 1 4 3 1
7–10 22 20 11 11 8 11 2 3 3 2
11–14 28 21 12 7 9 6 2 3 2 2
Total 25 20 12 10 9 8 2 3 3 2
Females 5–6 22 21 12 12 10 4 4 2 2 3
7–10 22 19 12 15 8 9 3 2 2 <1
11–14 26 17 12 12 11 8 2 1 1 2
Total 24 19 12 13 10 8 3 2 2 1
1 Proportion of total nutrient intake obtained from each food group. Results are presented for the 10 highest contributing food groups. For full food group definitions see Appendix B, Table III.

NZ Food NZ Children 85
Table A17: Fructose sources1
Fruit
%
Beverage
%
Sugar and sweets
%
Vegetables
%
Bread
%
Savoury sauces
%
Breakfast cereals
%
Snack bars
%
Dairy products
%
Cakes and
muffins%
New Zealand children (5–14 years) 38 32 6 4 3 2 2 2 2 1
Males 5–6 47 24 8 4 3 2 3 2 2 1
7–10 40 28 7 4 3 3 3 2 2 2
11–14 29 38 9 5 3 3 3 2 2 1
Total 36 32 8 4 3 3 3 2 2 1
Females 5–6 41 31 6 3 3 2 2 3 2 1
7–10 45 27 5 4 4 2 1 2 2 2
11–14 35 39 5 4 3 2 2 2 2 2
Total 40 33 5 4 3 2 2 2 2 1
NZDep01 Males I 35 33 6 5 3 2 5 2 2 1
II 39 29 9 4 4 3 4 2 2 <1
III 36 32 6 5 2 2 3 3 2 2
IV 30 30 13 4 3 3 4 3 1 2
V 38 34 7 3 3 3 <1 1 2 1
Females I 42 35 3 3 3 2 2 2 1 3
II 43 28 4 5 3 2 2 2 2 2
III 35 35 5 5 4 2 2 2 2 <1
IV 41 32 6 3 4 2 2 2 2 1
V 39 34 6 3 2 2 1 2 2 1
Males Urban 35 33 8 4 3 3 3 2 2 1 School type Rural 42 25 7 5 3 3 3 2 2 2
Females Urban 39 34 5 4 3 2 2 2 2 2
Rural 41 30 7 4 3 2 2 2 1 1
Mäori Males 5–6 42 28 8 4 3 3 2 2 2 <1
7–10 41 32 5 3 3 3 2 2 2 1
11–14 27 39 10 4 2 5 2 1 1 1
Total 35 34 7 4 3 4 2 2 2 1
Females 5–6 48 22 6 4 3 3 2 4 1 1
7–10 40 34 5 3 3 2 2 2 2 1
11–14 28 45 6 3 2 3 <1 1 2 1
Total 36 37 6 3 3 3 2 2 2 1
Pacific Males 5–6 46 34 4 1 3 2 1 1 <1 1
7–10 41 38 3 3 2 2 <1 <1 <1 1
11–14 35 43 4 3 2 2 <1 <1 3 2
Total 39 39 4 2 2 2 <1 <1 2 2
Females 5–6 49 32 3 2 2 <1 <1 1 2 <1
7–10 40 38 4 3 2 1 1 <1 1 2
11–14 30 46 6 3 2 3 <1 <1 <1 1
Total 38 40 5 3 2 2 <1 <1 1 2
NZEO Males 5–6 49 21 8 4 2 2 4 2 3 1
7–10 40 25 8 4 3 3 4 2 2 2
11–14 29 37 9 5 3 2 3 2 2 1
Total 36 30 8 4 3 3 4 2 2 1
Females 5–6 38 34 7 3 3 1 2 3 2 1
7–10 47 23 5 5 5 2 1 2 2 2
11–14 38 36 4 4 3 2 3 2 2 2
Total 41 31 5 4 4 2 2 2 2 2
1 Proportion of total nutrient intake obtained from each food group. Results are presented for the 10 highest contributing food groups. For full food group definitions see Appendix B, Table III.
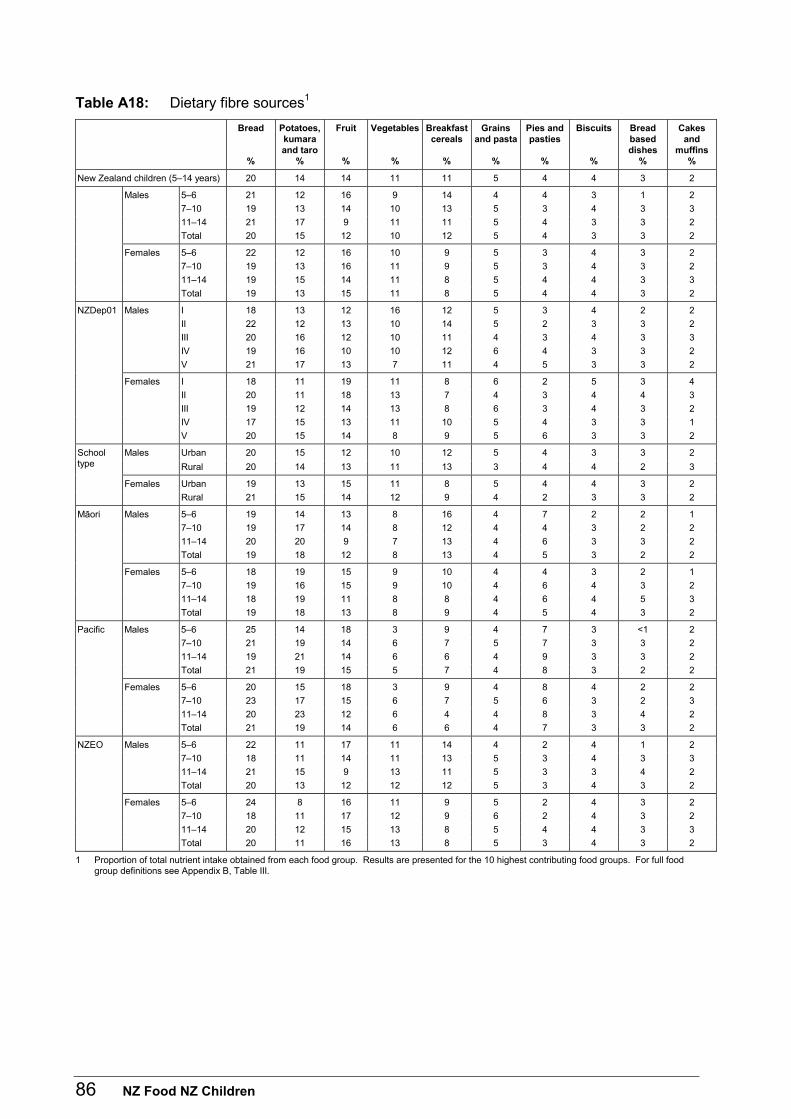
86 NZ Food NZ Children
Table A18: Dietary fibre sources1
Bread
%
Potatoes, kumara and taro
%
Fruit
%
Vegetables
%
Breakfast cereals
%
Grains and pasta
%
Pies and pasties
%
Biscuits
%
Bread based dishes
%
Cakes and
muffins%
New Zealand children (5–14 years) 20 14 14 11 11 5 4 4 3 2
Males 5–6 21 12 16 9 14 4 4 3 1 2
7–10 19 13 14 10 13 5 3 4 3 3
11–14 21 17 9 11 11 5 4 3 3 2
Total 20 15 12 10 12 5 4 3 3 2
Females 5–6 22 12 16 10 9 5 3 4 3 2
7–10 19 13 16 11 9 5 3 4 3 2
11–14 19 15 14 11 8 5 4 4 3 3
Total 19 13 15 11 8 5 4 4 3 2
NZDep01 Males I 18 13 12 16 12 5 3 4 2 2
II 22 12 13 10 14 5 2 3 3 2
III 20 16 12 10 11 4 3 4 3 3
IV 19 16 10 10 12 6 4 3 3 2
V 21 17 13 7 11 4 5 3 3 2
Females I 18 11 19 11 8 6 2 5 3 4
II 20 11 18 13 7 4 3 4 4 3
III 19 12 14 13 8 6 3 4 3 2
IV 17 15 13 11 10 5 4 3 3 1
V 20 15 14 8 9 5 6 3 3 2
Males Urban 20 15 12 10 12 5 4 3 3 2 School type Rural 20 14 13 11 13 3 4 4 2 3
Females Urban 19 13 15 11 8 5 4 4 3 2
Rural 21 15 14 12 9 4 2 3 3 2
Mäori Males 5–6 19 14 13 8 16 4 7 2 2 1
7–10 19 17 14 8 12 4 4 3 2 2
11–14 20 20 9 7 13 4 6 3 3 2
Total 19 18 12 8 13 4 5 3 2 2
Females 5–6 18 19 15 9 10 4 4 3 2 1
7–10 19 16 15 9 10 4 6 4 3 2
11–14 18 19 11 8 8 4 6 4 5 3
Total 19 18 13 8 9 4 5 4 3 2
Pacific Males 5–6 25 14 18 3 9 4 7 3 <1 2
7–10 21 19 14 6 7 5 7 3 3 2
11–14 19 21 14 6 6 4 9 3 3 2
Total 21 19 15 5 7 4 8 3 2 2
Females 5–6 20 15 18 3 9 4 8 4 2 2
7–10 23 17 15 6 7 5 6 3 2 3
11–14 20 23 12 6 4 4 8 3 4 2
Total 21 19 14 6 6 4 7 3 3 2
NZEO Males 5–6 22 11 17 11 14 4 2 4 1 2
7–10 18 11 14 11 13 5 3 4 3 3
11–14 21 15 9 13 11 5 3 3 4 2
Total 20 13 12 12 12 5 3 4 3 2
Females 5–6 24 8 16 11 9 5 2 4 3 2
7–10 18 11 17 12 9 6 2 4 3 2
11–14 20 12 15 13 8 5 4 4 3 3
Total 20 11 16 13 8 5 3 4 3 2
1 Proportion of total nutrient intake obtained from each food group. Results are presented for the 10 highest contributing food groups. For full food group definitions see Appendix B, Table III.
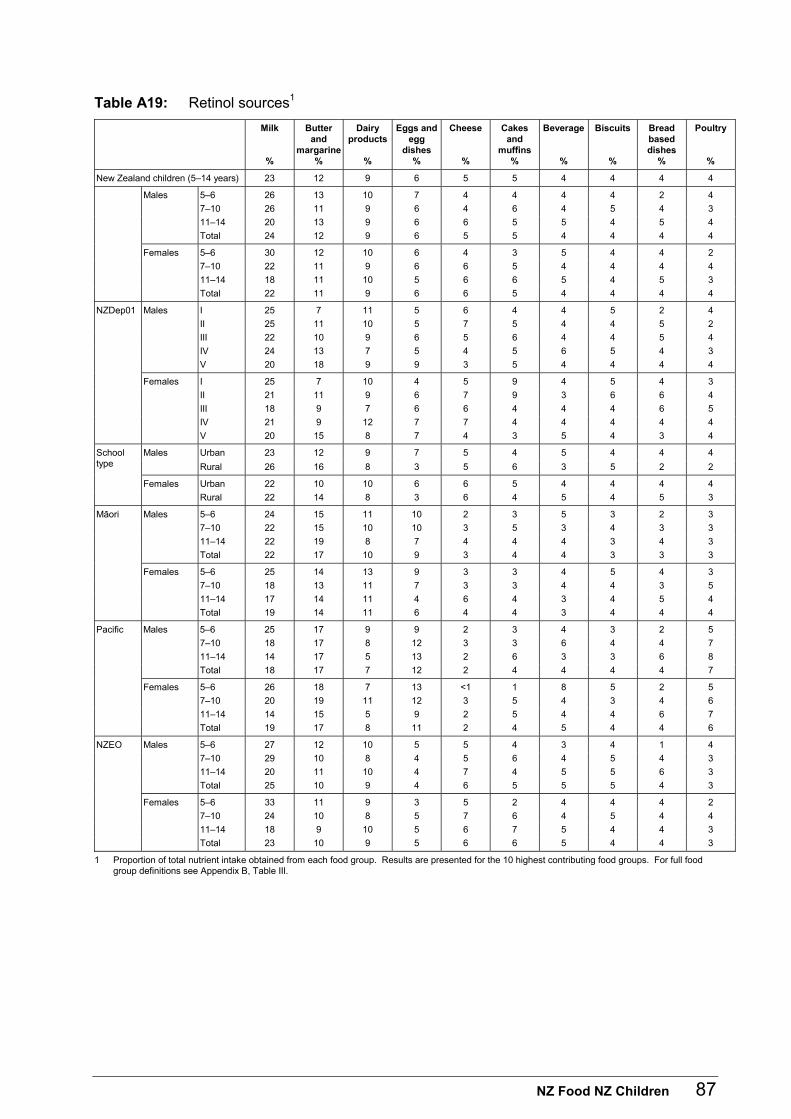
NZ Food NZ Children 87
Table A19: Retinol sources1
Milk
%
Butter and
margarine%
Dairy products
%
Eggs and egg
dishes%
Cheese
%
Cakes and
muffins%
Beverage
%
Biscuits
%
Bread based dishes
%
Poultry
%
New Zealand children (5–14 years) 23 12 9 6 5 5 4 4 4 4
Males 5–6 26 13 10 7 4 4 4 4 2 4
7–10 26 11 9 6 4 6 4 5 4 3
11–14 20 13 9 6 6 5 5 4 5 4
Total 24 12 9 6 5 5 4 4 4 4
Females 5–6 30 12 10 6 4 3 5 4 4 2
7–10 22 11 9 6 6 5 4 4 4 4
11–14 18 11 10 5 6 6 5 4 5 3
Total 22 11 9 6 6 5 4 4 4 4
NZDep01 Males I 25 7 11 5 6 4 4 5 2 4
II 25 11 10 5 7 5 4 4 5 2
III 22 10 9 6 5 6 4 4 5 4
IV 24 13 7 5 4 5 6 5 4 3
V 20 18 9 9 3 5 4 4 4 4
Females I 25 7 10 4 5 9 4 5 4 3
II 21 11 9 6 7 9 3 6 6 4
III 18 9 7 6 6 4 4 4 6 5
IV 21 9 12 7 7 4 4 4 4 4
V 20 15 8 7 4 3 5 4 3 4
Males Urban 23 12 9 7 5 4 5 4 4 4 School type Rural 26 16 8 3 5 6 3 5 2 2
Females Urban 22 10 10 6 6 5 4 4 4 4
Rural 22 14 8 3 6 4 5 4 5 3
Mäori Males 5–6 24 15 11 10 2 3 5 3 2 3
7–10 22 15 10 10 3 5 3 4 3 3
11–14 22 19 8 7 4 4 4 3 4 3
Total 22 17 10 9 3 4 4 3 3 3
Females 5–6 25 14 13 9 3 3 4 5 4 3
7–10 18 13 11 7 3 3 4 4 3 5
11–14 17 14 11 4 6 4 3 4 5 4
Total 19 14 11 6 4 4 3 4 4 4
Pacific Males 5–6 25 17 9 9 2 3 4 3 2 5
7–10 18 17 8 12 3 3 6 4 4 7
11–14 14 17 5 13 2 6 3 3 6 8
Total 18 17 7 12 2 4 4 4 4 7
Females 5–6 26 18 7 13 <1 1 8 5 2 5
7–10 20 19 11 12 3 5 4 3 4 6
11–14 14 15 5 9 2 5 4 4 6 7
Total 19 17 8 11 2 4 5 4 4 6
NZEO Males 5–6 27 12 10 5 5 4 3 4 1 4
7–10 29 10 8 4 5 6 4 5 4 3
11–14 20 11 10 4 7 4 5 5 6 3
Total 25 10 9 4 6 5 5 5 4 3
Females 5–6 33 11 9 3 5 2 4 4 4 2
7–10 24 10 8 5 7 6 4 5 4 4
11–14 18 9 10 5 6 7 5 4 4 3
Total 23 10 9 5 6 6 5 4 4 3
1 Proportion of total nutrient intake obtained from each food group. Results are presented for the 10 highest contributing food groups. For full food group definitions see Appendix B, Table III.
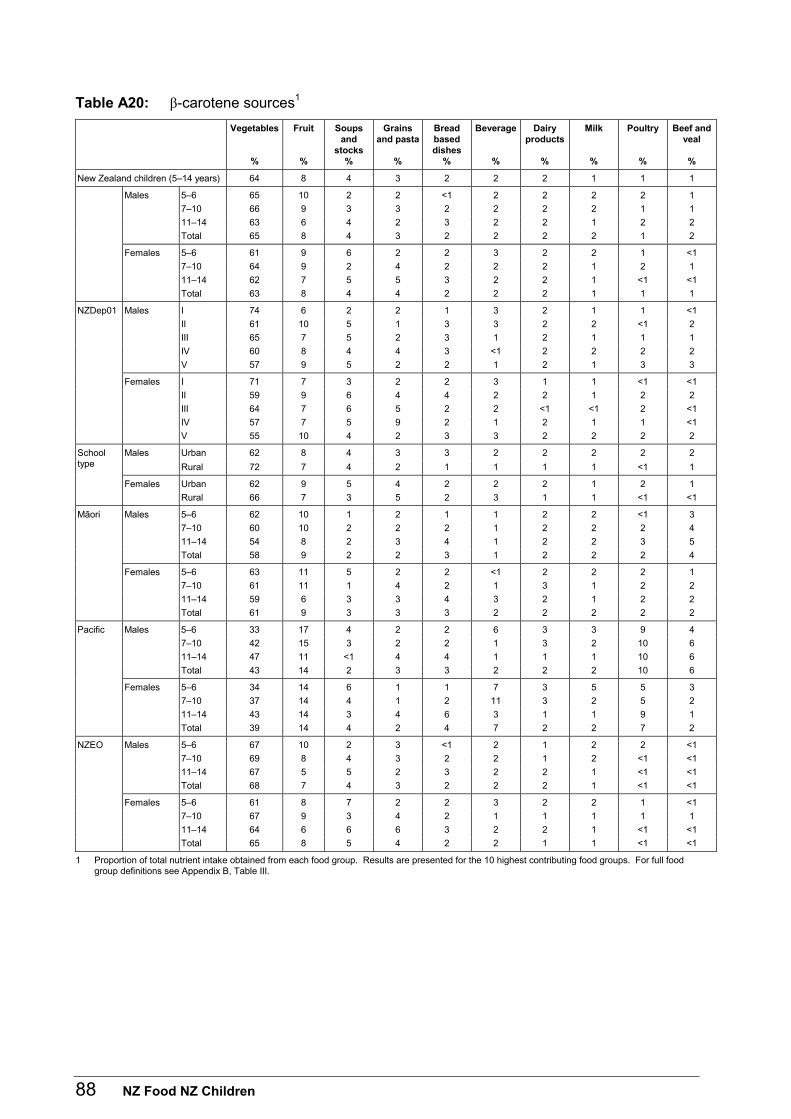
88 NZ Food NZ Children
Table A20: β-carotene sources1
Vegetables
%
Fruit
%
Soups and
stocks%
Grains and pasta
%
Bread based dishes
%
Beverage
%
Dairy products
%
Milk
%
Poultry
%
Beef and veal
%
New Zealand children (5–14 years) 64 8 4 3 2 2 2 1 1 1
Males 5–6 65 10 2 2 <1 2 2 2 2 1
7–10 66 9 3 3 2 2 2 2 1 1
11–14 63 6 4 2 3 2 2 1 2 2
Total 65 8 4 3 2 2 2 2 1 2
Females 5–6 61 9 6 2 2 3 2 2 1 <1
7–10 64 9 2 4 2 2 2 1 2 1
11–14 62 7 5 5 3 2 2 1 <1 <1
Total 63 8 4 4 2 2 2 1 1 1
NZDep01 Males I 74 6 2 2 1 3 2 1 1 <1
II 61 10 5 1 3 3 2 2 <1 2
III 65 7 5 2 3 1 2 1 1 1
IV 60 8 4 4 3 <1 2 2 2 2
V 57 9 5 2 2 1 2 1 3 3
Females I 71 7 3 2 2 3 1 1 <1 <1
II 59 9 6 4 4 2 2 1 2 2
III 64 7 6 5 2 2 <1 <1 2 <1
IV 57 7 5 9 2 1 2 1 1 <1
V 55 10 4 2 3 3 2 2 2 2
Males Urban 62 8 4 3 3 2 2 2 2 2 School type Rural 72 7 4 2 1 1 1 1 <1 1
Females Urban 62 9 5 4 2 2 2 1 2 1
Rural 66 7 3 5 2 3 1 1 <1 <1
Mäori Males 5–6 62 10 1 2 1 1 2 2 <1 3
7–10 60 10 2 2 2 1 2 2 2 4
11–14 54 8 2 3 4 1 2 2 3 5
Total 58 9 2 2 3 1 2 2 2 4
Females 5–6 63 11 5 2 2 <1 2 2 2 1
7–10 61 11 1 4 2 1 3 1 2 2
11–14 59 6 3 3 4 3 2 1 2 2
Total 61 9 3 3 3 2 2 2 2 2
Pacific Males 5–6 33 17 4 2 2 6 3 3 9 4
7–10 42 15 3 2 2 1 3 2 10 6
11–14 47 11 <1 4 4 1 1 1 10 6
Total 43 14 2 3 3 2 2 2 10 6
Females 5–6 34 14 6 1 1 7 3 5 5 3
7–10 37 14 4 1 2 11 3 2 5 2
11–14 43 14 3 4 6 3 1 1 9 1
Total 39 14 4 2 4 7 2 2 7 2
NZEO Males 5–6 67 10 2 3 <1 2 1 2 2 <1
7–10 69 8 4 3 2 2 1 2 <1 <1
11–14 67 5 5 2 3 2 2 1 <1 <1
Total 68 7 4 3 2 2 2 1 <1 <1
Females 5–6 61 8 7 2 2 3 2 2 1 <1
7–10 67 9 3 4 2 1 1 1 1 1
11–14 64 6 6 6 3 2 2 1 <1 <1
Total 65 8 5 4 2 2 1 1 <1 <1
1 Proportion of total nutrient intake obtained from each food group. Results are presented for the 10 highest contributing food groups. For full food group definitions see Appendix B, Table III.
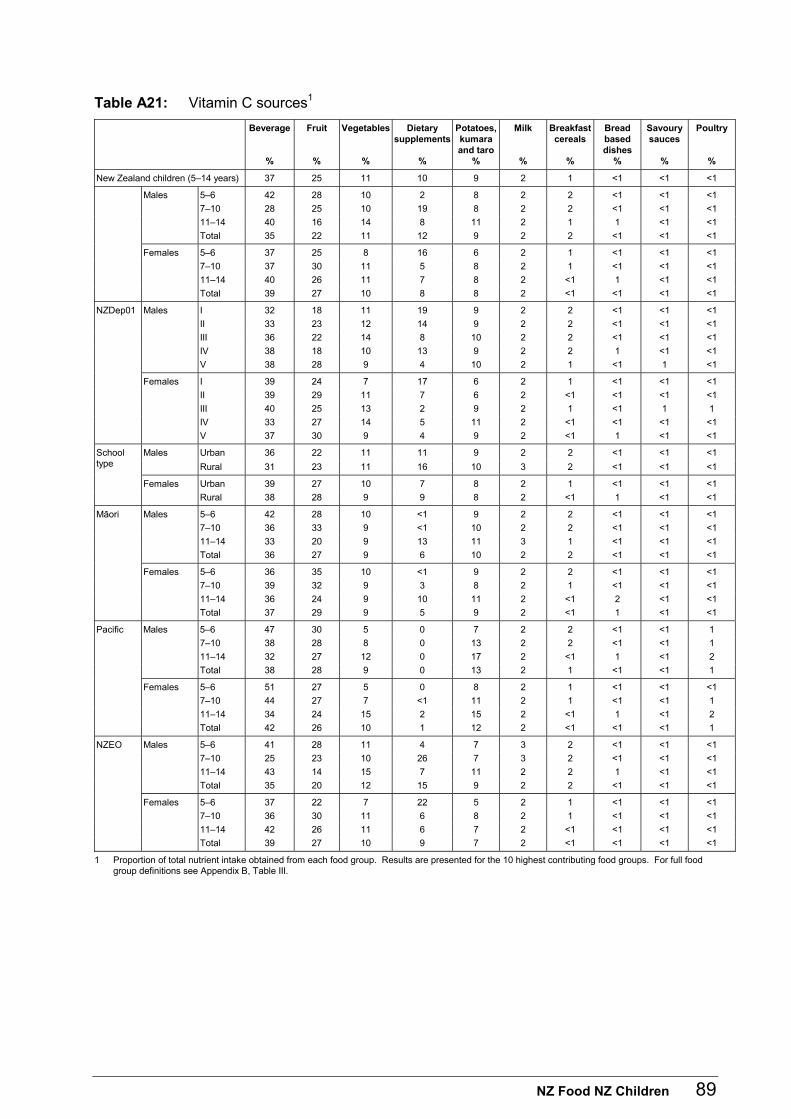
NZ Food NZ Children 89
Table A21: Vitamin C sources1
Beverage
%
Fruit
%
Vegetables
%
Dietary supplements
%
Potatoes, kumara and taro
%
Milk
%
Breakfast cereals
%
Bread based dishes
%
Savoury sauces
%
Poultry
%
New Zealand children (5–14 years) 37 25 11 10 9 2 1 <1 <1 <1
Males 5–6 42 28 10 2 8 2 2 <1 <1 <1
7–10 28 25 10 19 8 2 2 <1 <1 <1
11–14 40 16 14 8 11 2 1 1 <1 <1
Total 35 22 11 12 9 2 2 <1 <1 <1
Females 5–6 37 25 8 16 6 2 1 <1 <1 <1
7–10 37 30 11 5 8 2 1 <1 <1 <1
11–14 40 26 11 7 8 2 <1 1 <1 <1
Total 39 27 10 8 8 2 <1 <1 <1 <1
NZDep01 Males I 32 18 11 19 9 2 2 <1 <1 <1
II 33 23 12 14 9 2 2 <1 <1 <1
III 36 22 14 8 10 2 2 <1 <1 <1
IV 38 18 10 13 9 2 2 1 <1 <1
V 38 28 9 4 10 2 1 <1 1 <1
Females I 39 24 7 17 6 2 1 <1 <1 <1
II 39 29 11 7 6 2 <1 <1 <1 <1
III 40 25 13 2 9 2 1 <1 1 1
IV 33 27 14 5 11 2 <1 <1 <1 <1
V 37 30 9 4 9 2 <1 1 <1 <1
Males Urban 36 22 11 11 9 2 2 <1 <1 <1 School type Rural 31 23 11 16 10 3 2 <1 <1 <1
Females Urban 39 27 10 7 8 2 1 <1 <1 <1
Rural 38 28 9 9 8 2 <1 1 <1 <1
Mäori Males 5–6 42 28 10 <1 9 2 2 <1 <1 <1
7–10 36 33 9 <1 10 2 2 <1 <1 <1
11–14 33 20 9 13 11 3 1 <1 <1 <1
Total 36 27 9 6 10 2 2 <1 <1 <1
Females 5–6 36 35 10 <1 9 2 2 <1 <1 <1
7–10 39 32 9 3 8 2 1 <1 <1 <1
11–14 36 24 9 10 11 2 <1 2 <1 <1
Total 37 29 9 5 9 2 <1 1 <1 <1
Pacific Males 5–6 47 30 5 0 7 2 2 <1 <1 1
7–10 38 28 8 0 13 2 2 <1 <1 1
11–14 32 27 12 0 17 2 <1 1 <1 2
Total 38 28 9 0 13 2 1 <1 <1 1
Females 5–6 51 27 5 0 8 2 1 <1 <1 <1
7–10 44 27 7 <1 11 2 1 <1 <1 1
11–14 34 24 15 2 15 2 <1 1 <1 2
Total 42 26 10 1 12 2 <1 <1 <1 1
NZEO Males 5–6 41 28 11 4 7 3 2 <1 <1 <1
7–10 25 23 10 26 7 3 2 <1 <1 <1
11–14 43 14 15 7 11 2 2 1 <1 <1
Total 35 20 12 15 9 2 2 <1 <1 <1
Females 5–6 37 22 7 22 5 2 1 <1 <1 <1
7–10 36 30 11 6 8 2 1 <1 <1 <1
11–14 42 26 11 6 7 2 <1 <1 <1 <1
Total 39 27 10 9 7 2 <1 <1 <1 <1
1 Proportion of total nutrient intake obtained from each food group. Results are presented for the 10 highest contributing food groups. For full food group definitions see Appendix B, Table III.
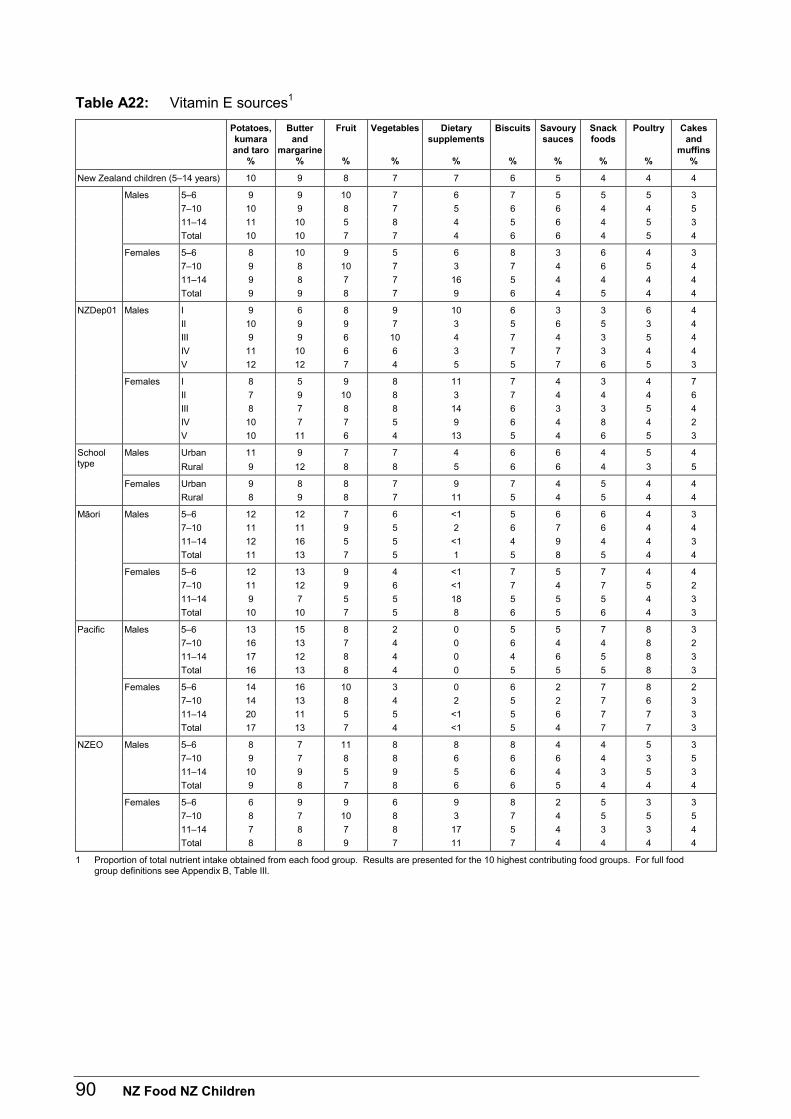
90 NZ Food NZ Children
Table A22: Vitamin E sources1
Potatoes, kumara and taro
%
Butter and
margarine %
Fruit
%
Vegetables
%
Dietary supplements
%
Biscuits
%
Savoury sauces
%
Snack foods
%
Poultry
%
Cakes and
muffins%
New Zealand children (5–14 years) 10 9 8 7 7 6 5 4 4 4
Males 5–6 9 9 10 7 6 7 5 5 5 3
7–10 10 9 8 7 5 6 6 4 4 5
11–14 11 10 5 8 4 5 6 4 5 3
Total 10 10 7 7 4 6 6 4 5 4
Females 5–6 8 10 9 5 6 8 3 6 4 3
7–10 9 8 10 7 3 7 4 6 5 4
11–14 9 8 7 7 16 5 4 4 4 4
Total 9 9 8 7 9 6 4 5 4 4
NZDep01 Males I 9 6 8 9 10 6 3 3 6 4
II 10 9 9 7 3 5 6 5 3 4
III 9 9 6 10 4 7 4 3 5 4
IV 11 10 6 6 3 7 7 3 4 4
V 12 12 7 4 5 5 7 6 5 3
Females I 8 5 9 8 11 7 4 3 4 7
II 7 9 10 8 3 7 4 4 4 6
III 8 7 8 8 14 6 3 3 5 4
IV 10 7 7 5 9 6 4 8 4 2
V 10 11 6 4 13 5 4 6 5 3
Males Urban 11 9 7 7 4 6 6 4 5 4 School type Rural 9 12 8 8 5 6 6 4 3 5
Females Urban 9 8 8 7 9 7 4 5 4 4
Rural 8 9 8 7 11 5 4 5 4 4
Mäori Males 5–6 12 12 7 6 <1 5 6 6 4 3
7–10 11 11 9 5 2 6 7 6 4 4
11–14 12 16 5 5 <1 4 9 4 4 3
Total 11 13 7 5 1 5 8 5 4 4
Females 5–6 12 13 9 4 <1 7 5 7 4 4
7–10 11 12 9 6 <1 7 4 7 5 2
11–14 9 7 5 5 18 5 5 5 4 3
Total 10 10 7 5 8 6 5 6 4 3
Pacific Males 5–6 13 15 8 2 0 5 5 7 8 3
7–10 16 13 7 4 0 6 4 4 8 2
11–14 17 12 8 4 0 4 6 5 8 3
Total 16 13 8 4 0 5 5 5 8 3
Females 5–6 14 16 10 3 0 6 2 7 8 2
7–10 14 13 8 4 2 5 2 7 6 3
11–14 20 11 5 5 <1 5 6 7 7 3
Total 17 13 7 4 <1 5 4 7 7 3
NZEO Males 5–6 8 7 11 8 8 8 4 4 5 3
7–10 9 7 8 8 6 6 6 4 3 5
11–14 10 9 5 9 5 6 4 3 5 3
Total 9 8 7 8 6 6 5 4 4 4
Females 5–6 6 9 9 6 9 8 2 5 3 3
7–10 8 7 10 8 3 7 4 5 5 5
11–14 7 8 7 8 17 5 4 3 3 4
Total 8 8 9 7 11 7 4 4 4 4
1 Proportion of total nutrient intake obtained from each food group. Results are presented for the 10 highest contributing food groups. For full food group definitions see Appendix B, Table III.
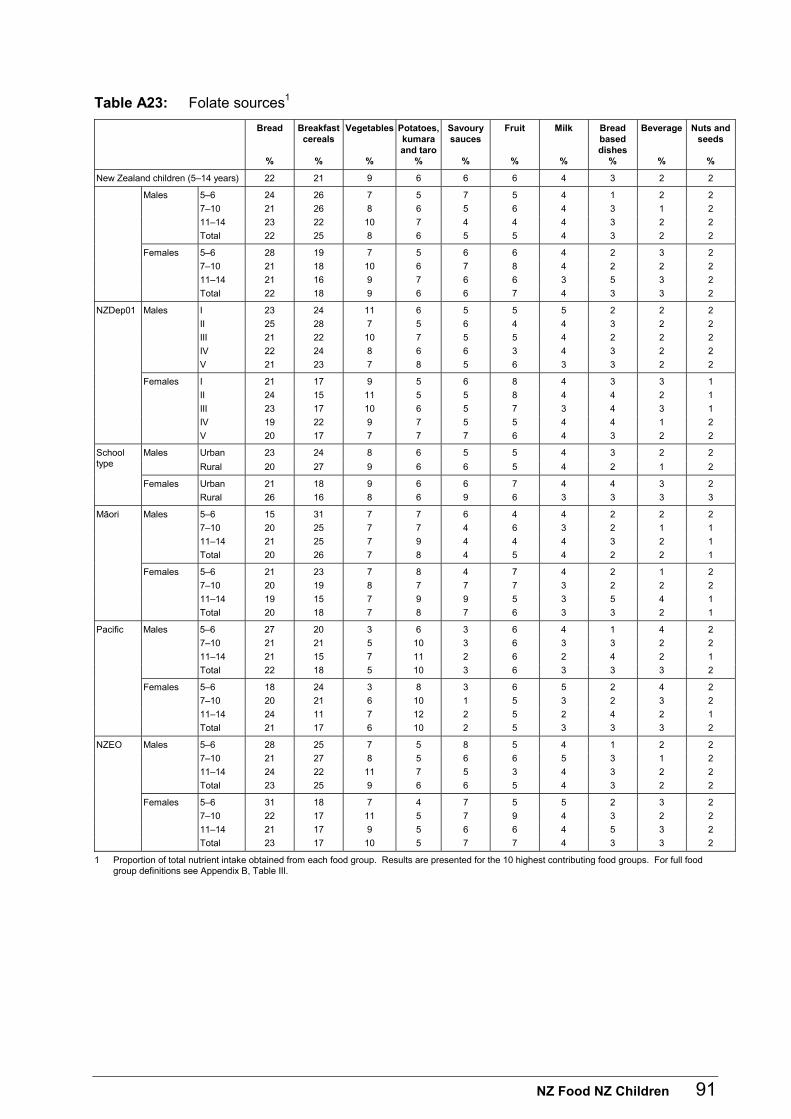
NZ Food NZ Children 91
Table A23: Folate sources1
Bread
%
Breakfast cereals
%
Vegetables
%
Potatoes, kumara and taro
%
Savoury sauces
%
Fruit
%
Milk
%
Bread based dishes
%
Beverage
%
Nuts and seeds
%
New Zealand children (5–14 years) 22 21 9 6 6 6 4 3 2 2
Males 5–6 24 26 7 5 7 5 4 1 2 2
7–10 21 26 8 6 5 6 4 3 1 2
11–14 23 22 10 7 4 4 4 3 2 2
Total 22 25 8 6 5 5 4 3 2 2
Females 5–6 28 19 7 5 6 6 4 2 3 2
7–10 21 18 10 6 7 8 4 2 2 2
11–14 21 16 9 7 6 6 3 5 3 2
Total 22 18 9 6 6 7 4 3 3 2
NZDep01 Males I 23 24 11 6 5 5 5 2 2 2
II 25 28 7 5 6 4 4 3 2 2
III 21 22 10 7 5 5 4 2 2 2
IV 22 24 8 6 6 3 4 3 2 2
V 21 23 7 8 5 6 3 3 2 2
Females I 21 17 9 5 6 8 4 3 3 1
II 24 15 11 5 5 8 4 4 2 1
III 23 17 10 6 5 7 3 4 3 1
IV 19 22 9 7 5 5 4 4 1 2
V 20 17 7 7 7 6 4 3 2 2
Males Urban 23 24 8 6 5 5 4 3 2 2 School type Rural 20 27 9 6 6 5 4 2 1 2
Females Urban 21 18 9 6 6 7 4 4 3 2
Rural 26 16 8 6 9 6 3 3 3 3
Mäori Males 5–6 15 31 7 7 6 4 4 2 2 2
7–10 20 25 7 7 4 6 3 2 1 1
11–14 21 25 7 9 4 4 4 3 2 1
Total 20 26 7 8 4 5 4 2 2 1
Females 5–6 21 23 7 8 4 7 4 2 1 2
7–10 20 19 8 7 7 7 3 2 2 2
11–14 19 15 7 9 9 5 3 5 4 1
Total 20 18 7 8 7 6 3 3 2 1
Pacific Males 5–6 27 20 3 6 3 6 4 1 4 2
7–10 21 21 5 10 3 6 3 3 2 2
11–14 21 15 7 11 2 6 2 4 2 1
Total 22 18 5 10 3 6 3 3 3 2
Females 5–6 18 24 3 8 3 6 5 2 4 2
7–10 20 21 6 10 1 5 3 2 3 2
11–14 24 11 7 12 2 5 2 4 2 1
Total 21 17 6 10 2 5 3 3 3 2
NZEO Males 5–6 28 25 7 5 8 5 4 1 2 2
7–10 21 27 8 5 6 6 5 3 1 2
11–14 24 22 11 7 5 3 4 3 2 2
Total 23 25 9 6 6 5 4 3 2 2
Females 5–6 31 18 7 4 7 5 5 2 3 2
7–10 22 17 11 5 7 9 4 3 2 2
11–14 21 17 9 5 6 6 4 5 3 2
Total 23 17 10 5 7 7 4 3 3 2
1 Proportion of total nutrient intake obtained from each food group. Results are presented for the 10 highest contributing food groups. For full food group definitions see Appendix B, Table III.

92 NZ Food NZ Children
Table A24: Calcium sources1
Milk
%
Bread
%
Dairy products
%
Cheese
%
Beverage
%
Bread based dishes
%
Vegetables
%
Fruit
%
Grains and pasta
%
Cakes and
muffins%
New Zealand children (5–14 years) 34 11 9 8 5 3 3 3 2 2
Males 5–6 37 12 11 7 5 2 2 3 1 2
7–10 36 10 9 7 5 4 2 3 3 3
11–14 35 10 7 9 5 4 3 2 3 2
Total 36 11 9 8 5 3 3 2 2 2
Females 5–6 39 12 11 6 5 3 2 3 1 1
7–10 32 11 9 9 5 3 3 4 2 2
11–14 31 10 10 9 5 4 3 3 3 3
Total 33 11 10 9 5 3 3 3 2 3
NZDep01 Males I 42 8 10 8 4 2 4 2 3 2
II 36 11 9 12 4 5 2 2 2 2
III 34 10 9 8 5 3 3 2 1 2
IV 37 10 7 6 6 4 2 2 5 2
V 30 15 9 5 6 3 3 3 1 2
Females I 38 9 10 7 6 3 2 3 3 3
II 33 10 10 10 4 4 3 4 2 5
III 32 10 9 9 5 5 4 3 3 2
IV 29 11 11 10 5 4 3 2 3 1
V 32 14 9 7 6 4 2 3 2 2
Males Urban 36 11 9 7 5 3 3 2 3 2 School type Rural 36 10 9 9 4 3 3 2 2 3
Females Urban 33 11 10 9 5 3 3 3 2 3
Rural 31 12 9 9 5 4 3 3 2 2
Mäori Males 5–6 35 13 12 3 5 2 2 3 1 1
7–10 32 13 11 5 5 3 2 4 3 2
11–14 33 13 7 6 6 3 2 2 2 2
Total 33 13 9 5 5 3 2 3 2 2
Females 5–6 34 12 14 4 6 3 3 4 <1 2
7–10 29 13 12 6 6 3 2 4 1 2
11–14 27 10 12 9 5 5 2 3 2 3
Total 29 11 12 7 6 4 2 3 1 2
Pacific Males 5–6 35 18 9 3 5 2 1 4 <1 1
7–10 29 17 8 5 6 4 2 3 1 1
11–14 22 16 6 4 5 4 3 3 2 3
Total 28 17 8 4 6 3 2 3 1 2
Females 5–6 38 15 8 2 9 3 <1 3 <1 1
7–10 29 17 10 5 5 3 3 3 2 3
11–14 25 17 5 4 6 5 3 3 1 3
Total 29 17 8 4 6 4 3 3 1 2
NZEO Males 5–6 39 11 11 8 5 1 2 3 1 2
7–10 38 9 9 8 5 4 2 3 3 3
11–14 36 9 7 10 5 4 4 1 3 2
Total 37 10 8 9 5 3 3 2 3 2
Females 5–6 41 12 11 7 5 3 3 3 2 1
7–10 33 10 9 11 5 3 3 4 3 3
11–14 33 10 9 10 5 3 3 3 3 3
Total 34 10 9 10 5 3 3 3 3 3
1 Proportion of total nutrient intake obtained from each food group. Results are presented for the 10 highest contributing food groups. For full food group definitions see Appendix B, Table III.
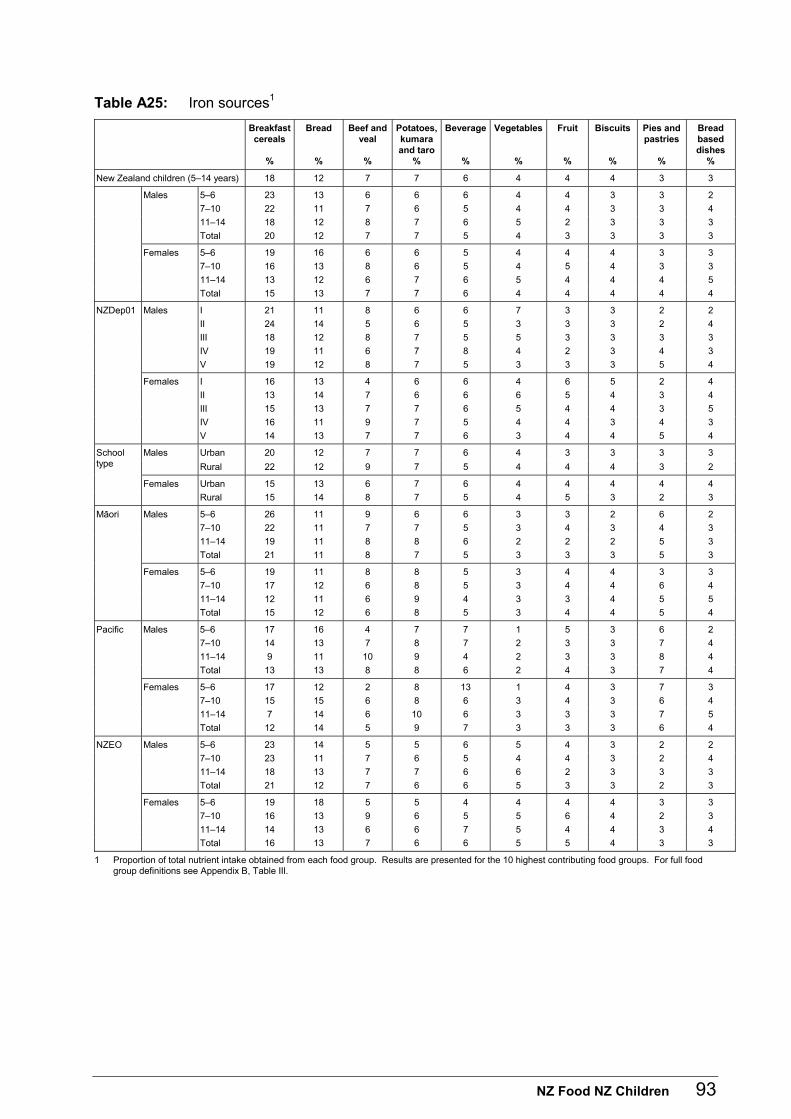
NZ Food NZ Children 93
Table A25: Iron sources1
Breakfast cereals
%
Bread
%
Beef and veal
%
Potatoes, kumara and taro
%
Beverage
%
Vegetables
%
Fruit
%
Biscuits
%
Pies and pastries
%
Bread based dishes
%
New Zealand children (5–14 years) 18 12 7 7 6 4 4 4 3 3
Males 5–6 23 13 6 6 6 4 4 3 3 2
7–10 22 11 7 6 5 4 4 3 3 4
11–14 18 12 8 7 6 5 2 3 3 3
Total 20 12 7 7 5 4 3 3 3 3
Females 5–6 19 16 6 6 5 4 4 4 3 3
7–10 16 13 8 6 5 4 5 4 3 3
11–14 13 12 6 7 6 5 4 4 4 5
Total 15 13 7 7 6 4 4 4 4 4
NZDep01 Males I 21 11 8 6 6 7 3 3 2 2
II 24 14 5 6 5 3 3 3 2 4
III 18 12 8 7 5 5 3 3 3 3
IV 19 11 6 7 8 4 2 3 4 3
V 19 12 8 7 5 3 3 3 5 4
Females I 16 13 4 6 6 4 6 5 2 4
II 13 14 7 6 6 6 5 4 3 4
III 15 13 7 7 6 5 4 4 3 5
IV 16 11 9 7 5 4 4 3 4 3
V 14 13 7 7 6 3 4 4 5 4
Males Urban 20 12 7 7 6 4 3 3 3 3 School type Rural 22 12 9 7 5 4 4 4 3 2
Females Urban 15 13 6 7 6 4 4 4 4 4
Rural 15 14 8 7 5 4 5 3 2 3
Mäori Males 5–6 26 11 9 6 6 3 3 2 6 2
7–10 22 11 7 7 5 3 4 3 4 3
11–14 19 11 8 8 6 2 2 2 5 3
Total 21 11 8 7 5 3 3 3 5 3
Females 5–6 19 11 8 8 5 3 4 4 3 3
7–10 17 12 6 8 5 3 4 4 6 4
11–14 12 11 6 9 4 3 3 4 5 5
Total 15 12 6 8 5 3 4 4 5 4
Pacific Males 5–6 17 16 4 7 7 1 5 3 6 2
7–10 14 13 7 8 7 2 3 3 7 4
11–14 9 11 10 9 4 2 3 3 8 4
Total 13 13 8 8 6 2 4 3 7 4
Females 5–6 17 12 2 8 13 1 4 3 7 3
7–10 15 15 6 8 6 3 4 3 6 4
11–14 7 14 6 10 6 3 3 3 7 5
Total 12 14 5 9 7 3 3 3 6 4
NZEO Males 5–6 23 14 5 5 6 5 4 3 2 2
7–10 23 11 7 6 5 4 4 3 2 4
11–14 18 13 7 7 6 6 2 3 3 3
Total 21 12 7 6 6 5 3 3 2 3
Females 5–6 19 18 5 5 4 4 4 4 3 3
7–10 16 13 9 6 5 5 6 4 2 3
11–14 14 13 6 6 7 5 4 4 3 4
Total 16 13 7 6 6 5 5 4 3 3
1 Proportion of total nutrient intake obtained from each food group. Results are presented for the 10 highest contributing food groups. For full food group definitions see Appendix B, Table III.
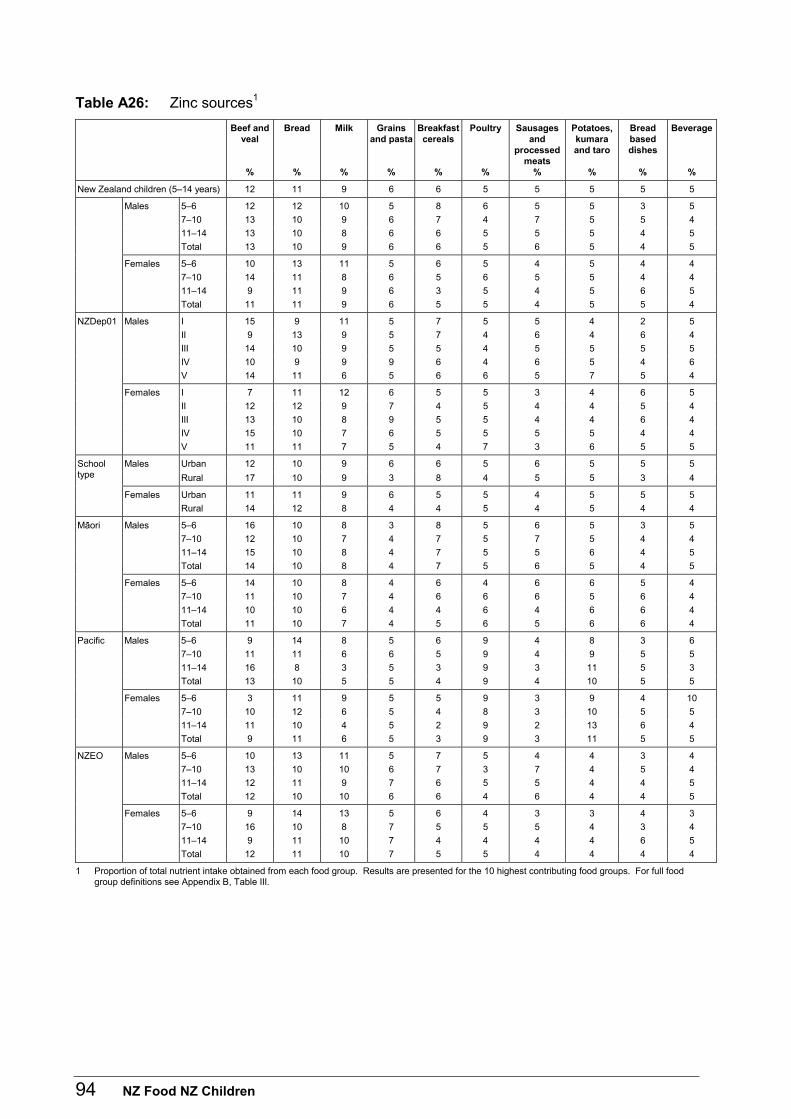
94 NZ Food NZ Children
Table A26: Zinc sources1
Beef and veal
%
Bread
%
Milk
%
Grains and pasta
%
Breakfast cereals
%
Poultry
%
Sausages and
processed meats
%
Potatoes, kumara and taro
%
Bread based dishes
%
Beverage
%
New Zealand children (5–14 years) 12 11 9 6 6 5 5 5 5 5
Males 5–6 12 12 10 5 8 6 5 5 3 5
7–10 13 10 9 6 7 4 7 5 5 4
11–14 13 10 8 6 6 5 5 5 4 5
Total 13 10 9 6 6 5 6 5 4 5
Females 5–6 10 13 11 5 6 5 4 5 4 4
7–10 14 11 8 6 5 6 5 5 4 4
11–14 9 11 9 6 3 5 4 5 6 5
Total 11 11 9 6 5 5 4 5 5 4
NZDep01 Males I 15 9 11 5 7 5 5 4 2 5
II 9 13 9 5 7 4 6 4 6 4
III 14 10 9 5 5 4 5 5 5 5
IV 10 9 9 9 6 4 6 5 4 6
V 14 11 6 5 6 6 5 7 5 4
Females I 7 11 12 6 5 5 3 4 6 5
II 12 12 9 7 4 5 4 4 5 4
III 13 10 8 9 5 5 4 4 6 4
IV 15 10 7 6 5 5 5 5 4 4
V 11 11 7 5 4 7 3 6 5 5
Males Urban 12 10 9 6 6 5 6 5 5 5 School type Rural 17 10 9 3 8 4 5 5 3 4
Females Urban 11 11 9 6 5 5 4 5 5 5
Rural 14 12 8 4 4 5 4 5 4 4
Mäori Males 5–6 16 10 8 3 8 5 6 5 3 5
7–10 12 10 7 4 7 5 7 5 4 4
11–14 15 10 8 4 7 5 5 6 4 5
Total 14 10 8 4 7 5 6 5 4 5
Females 5–6 14 10 8 4 6 4 6 6 5 4
7–10 11 10 7 4 6 6 6 5 6 4
11–14 10 10 6 4 4 6 4 6 6 4
Total 11 10 7 4 5 6 5 6 6 4
Pacific Males 5–6 9 14 8 5 6 9 4 8 3 6
7–10 11 11 6 6 5 9 4 9 5 5
11–14 16 8 3 5 3 9 3 11 5 3
Total 13 10 5 5 4 9 4 10 5 5
Females 5–6 3 11 9 5 5 9 3 9 4 10
7–10 10 12 6 5 4 8 3 10 5 5
11–14 11 10 4 5 2 9 2 13 6 4
Total 9 11 6 5 3 9 3 11 5 5
NZEO Males 5–6 10 13 11 5 7 5 4 4 3 4
7–10 13 10 10 6 7 3 7 4 5 4
11–14 12 11 9 7 6 5 5 4 4 5
Total 12 10 10 6 6 4 6 4 4 5
Females 5–6 9 14 13 5 6 4 3 3 4 3
7–10 16 10 8 7 5 5 5 4 3 4
11–14 9 11 10 7 4 4 4 4 6 5
Total 12 11 10 7 5 5 4 4 4 4
1 Proportion of total nutrient intake obtained from each food group. Results are presented for the 10 highest contributing food groups. For full food group definitions see Appendix B, Table III.

NZ Food NZ Children 95
Table A27: Selenium sources1
Fish and seafood
%
Poultry
%
Bread
%
Grains and pasta
%
Pork
%
Milk
%
Bread based dishes
%
Beef and veal
%
Sausages and
processed meats
%
Eggs and egg
dishes
%
New Zealand children (5–14 years) 22 12 10 7 5 5 4 3 3 3
Males 5–6 21 14 12 6 3 5 2 3 4 4
7–10 21 10 10 9 4 5 6 4 5 3
11–14 26 13 10 5 6 4 4 3 3 3
Total 23 12 10 7 5 5 4 4 4 3
Females 5–6 15 11 14 8 4 6 5 3 3 5
7–10 21 14 10 7 5 4 4 4 3 4
11–14 20 12 10 7 5 4 5 3 2 3
Total 20 12 11 7 5 4 4 3 3 3
NZDep01 Males I 16 15 11 7 7 8 2 5 3 2
II 19 11 13 5 5 5 9 3 4 3
III 21 11 11 5 6 5 4 4 4 4
IV 26 11 9 11 4 4 4 3 3 3
V 32 11 9 7 4 3 3 3 4 4
Females I 19 13 10 9 5 6 5 2 2 3
II 19 13 11 6 5 5 5 3 3 4
III 9 12 13 8 4 5 5 4 4 4
IV 19 13 11 7 5 4 5 4 2 3
V 22 13 10 8 5 3 4 3 3 4
Males Urban 25 12 10 7 5 4 4 3 3 3 School type Rural 16 11 11 5 4 5 3 5 6 3
Females Urban 19 13 10 8 5 5 5 3 3 4
Rural 23 11 12 5 5 4 4 4 2 2
Mäori Males 5–6 18 13 10 8 3 4 2 5 5 7
7–10 24 11 9 8 7 3 3 3 6 5
11–14 33 10 9 5 5 3 4 4 3 3
Total 27 11 9 7 5 3 3 4 4 5
Females 5–6 26 9 9 8 4 4 3 4 3 6
7–10 19 14 11 7 5 3 4 3 4 5
11–14 24 11 9 7 6 3 5 2 3 3
Total 22 12 10 7 5 3 4 3 3 4
Pacific Males 5–6 28 19 11 4 3 3 1 2 4 4
7–10 32 17 8 6 4 2 3 2 3 4
11–14 39 16 6 3 4 1 3 3 2 4
Total 35 17 8 4 4 2 2 2 3 4
Females 5–6 21 19 9 6 4 4 4 <1 3 8
7–10 28 18 9 7 2 2 3 2 2 5
11–14 33 19 8 4 3 2 4 1 2 4
Total 29 18 9 5 3 2 4 1 2 5
NZEO Males 5–6 21 14 13 6 3 6 3 3 4 3
7–10 18 8 11 10 3 6 7 4 5 2
11–14 22 13 11 5 6 5 4 4 3 2
Total 20 11 11 7 5 5 5 4 4 2
Females 5–6 8 10 18 8 4 8 6 3 4 3
7–10 20 13 10 7 5 4 5 4 3 3
11–14 17 11 11 7 5 6 4 3 2 3
Total 17 11 11 7 5 5 5 3 3 3
1 Proportion of total nutrient intake obtained from each food group. Results are presented for the 10 highest contributing food groups. For full food group definitions see Appendix B, Table III.
96 NZ Food NZ Children
B. Eating Patterns
Introduction This section provides an insight into selected eating patterns of New Zealand children. It includes the proportion of children avoiding certain food types, the prevalence of dietary supplement use and the addition of salt to meals during preparation and at the table. Also described in this section is the issue where children obtain the food they eat during the school day. Children spend a significant amount of time within the school environment, so understanding the factors that influence food choice within this environment will provide important information for public health initiatives. The issue of whether households feel they can obtain all the food they want for a healthy diet has been captured in responses by parents/caregivers to eight food security statements.
Key points
Dietary choices
• Most New Zealand children (95.3 percent) consumed an omnivorous diet.
Dietary supplement use
• Approximately 5 percent of New Zealand children reported using a dietary supplement in the previous 24 hours.
• Dietary supplement use was negligible among Mäori and Pacific children.
School day food consumption patterns
• Older children were less likely to Usually eat food at home before school but more likely to eat food on the way to school.
• NZEO children were the most likely to eat food at home before school, followed by Mäori and then Pacific children.
Food consumed at school
• The majority of New Zealand school children brought Most of their food from home; younger children were more likely to bring Most of their food from home than older children.
• Children living in NZDep01-I and II were more likely to bring most of their food from home than those in NZDep01-IV and V.
NZ Food NZ Children 97
• Older children were less likely to Usually consume food at lunchtime and morning break than younger children.
• NZEO children were more likely to Usually consume food at lunchtime and morning break than Mäori and Pacific children.
Salt additions
• One half of New Zealand children Never added salt to their meals at the table.
• NZEO children were less likely to add salt to meals at the table or to have salt added to meals during preparation than Mäori and Pacific children.
Food security
• Households in NZDep01-V were the least likely to Always be able to afford to eat properly compared to those living in NZDep01-I to IV quintiles.
• Households with NZEO children were the most food ‘secure’, followed by households with Mäori and then Pacific children.
• Food ‘secure’ households were most likely to have the least number of children.
98 NZ Food NZ Children
B1 Dietary choices Table B1
Type of diet
New Zealand children
The majority of New Zealand children (95.3 percent) consumed an omnivorous diet (Figure B-1). Only 3.6 percent of children Avoided red meat and 0.7 percent Avoided all meat. Females 7–10 years were more likely to consume an omnivorous diet (96.1 percent) than females 11–14 years (93.5 percent). Females 11–14 years (5.6 percent) were more likely to have Avoided red meat than males of the same age (2.7 percent).
NZDep01
Males in NZDep01-II were more likely to consume an omnivorous diet (98.3 percent) than males in NZDep01-IV and V (93.8 percent; 93.6 percent). The proportion of males who Avoided red meat was highest in NZDep01-III and IV (4.3 percent; 6.2 percent). A higher proportion of males in NZDep01-V Avoided all meat (4 percent) than in all NZDep01-I to IV quintiles (0 percent to 0.6 percent).
Urban-rural
Rural children were more likely to consume an omnivorous diet (males 99.8 percent; females 98.4 percent) than urban children (94.7 percent; 94 percent). Urban children were more likely to have Avoided red meat (males 3.7 percent; females 4.8 percent) than rural children (0 percent; 1.6 percent).
Ethnic
Pacific males were more likely to consume an omnivorous diet (97.7 percent) than NZEO males (95.1 percent).
Avoidance of dairy products and eggs
New Zealand children
Among New Zealand children, 5.2 percent avoided Eggs and 1.5 percent avoided Dairy products. Mäori males 5–6 years were more likely to avoid Eggs (8.7 percent) than those 11–14 years (3.1 percent). Pacific males 5–6 years were more likely to avoid Dairy products (5.5 percent) than those 11–14 years (0.6 percent).
NZDep01
Males in NZDep01-I were more likely to avoid Dairy products (5.4 percent) than males in NZDep01-II to V (≤ 1 percent).
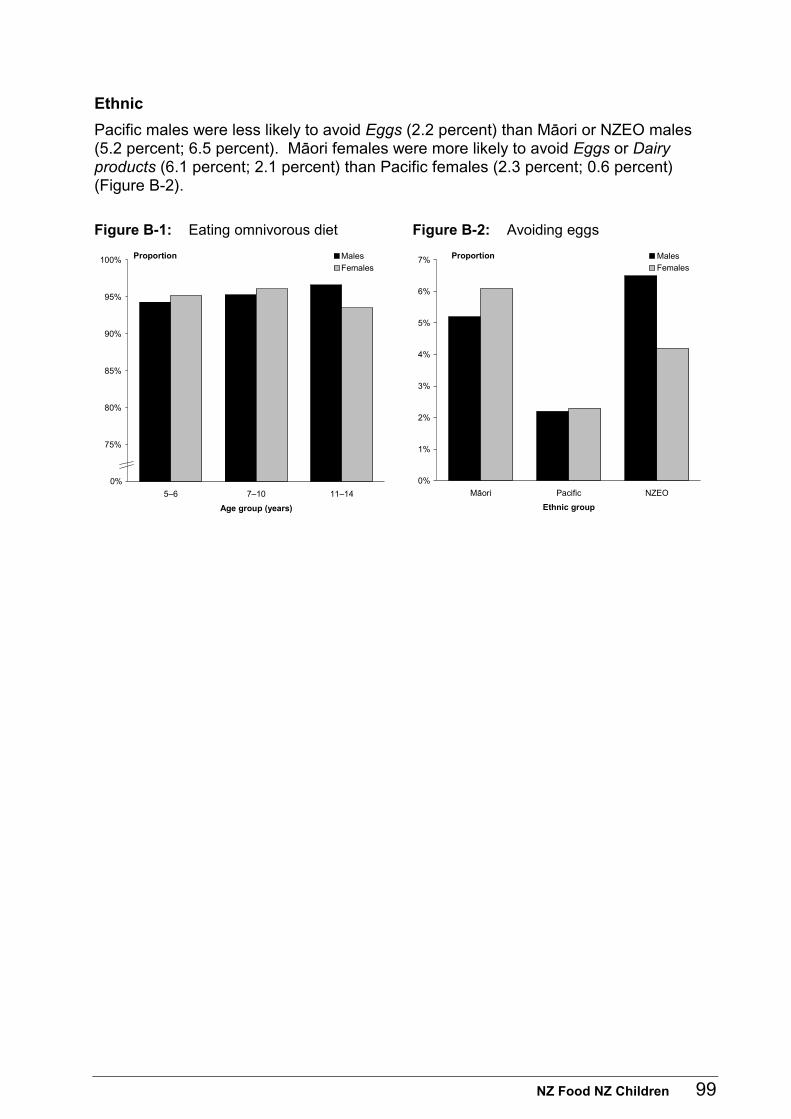
NZ Food NZ Children 99
Ethnic
Pacific males were less likely to avoid Eggs (2.2 percent) than Mäori or NZEO males (5.2 percent; 6.5 percent). Mäori females were more likely to avoid Eggs or Dairy products (6.1 percent; 2.1 percent) than Pacific females (2.3 percent; 0.6 percent) (Figure B-2).
Figure B-1: Eating omnivorous diet Figure B-2: Avoiding eggs
70%
75%
80%
85%
90%
95%
100%
5–6 7–10 11–14
Age group (years)
Proportion Males
Females
0%
0%
1%
2%
3%
4%
5%
6%
7%
Mäori Pacific NZEO
Ethnic group
Proportion Males
Females
100 NZ Food NZ Children
B2 Dietary supplement use Table B2
These data are derived from the 24-hour diet recall.
New Zealand children
About 5 percent of New Zealand children reported using a dietary supplement in the previous 24 hours (males 6 percent; females 4.7 percent). The most frequently reported supplements were Multivitamins & minerals (2.1 percent), Vitamin C (2 percent) and Meal replacements (0.8 percent). There were no differences between males and females in the types of supplement consumed except that males were more likely than females to consume Meal replacements (males 1.2 percent; females 0.3 percent) (Figure B-3). Females 5–6 years were more likely to consume Any dietary supplements (7.7 percent), than females 7–10 years (3.1 percent). Males 5–6 years and 7–10 years were more likely to consume Multivitamins & minerals (2.6 percent; 2.5 percent) than males 11–14 years (0.7 percent). Frequency of consumption of Multivitamins & minerals among females 7–10 years (0.9 percent) was lower than among females 5–6 years and 11–14 years (4.1 percent; 2.8 percent).
NZDep01
The prevalence of Any supplement use was lower for males in NZDep01-V (2.1 percent) than in NZDep01-I and II (14.6 percent; 6.6 percent). Females in NZDep01-V reported a lower use of Any supplement (2.8 percent) than those in NZDep01-III (7.3 percent).
Urban-rural
Rural females were more likely to consume Any supplement or Multivitamin & minerals (8.2 percent; 4.6 percent) than urban females (3.9 percent; 1.7 percent).
Ethnic
NZEO children were the most likely to consume dietary supplements. A lower proportion of Pacific children reported the use of Any supplement (males 0 percent; females 0.9 percent) than Mäori (1.6 percent; 2.5 percent) and NZEO children (8.2 percent; 6 percent) (Figure B-4). This trend was repeated with the use of Multivitamins & minerals and Vitamin C supplements.
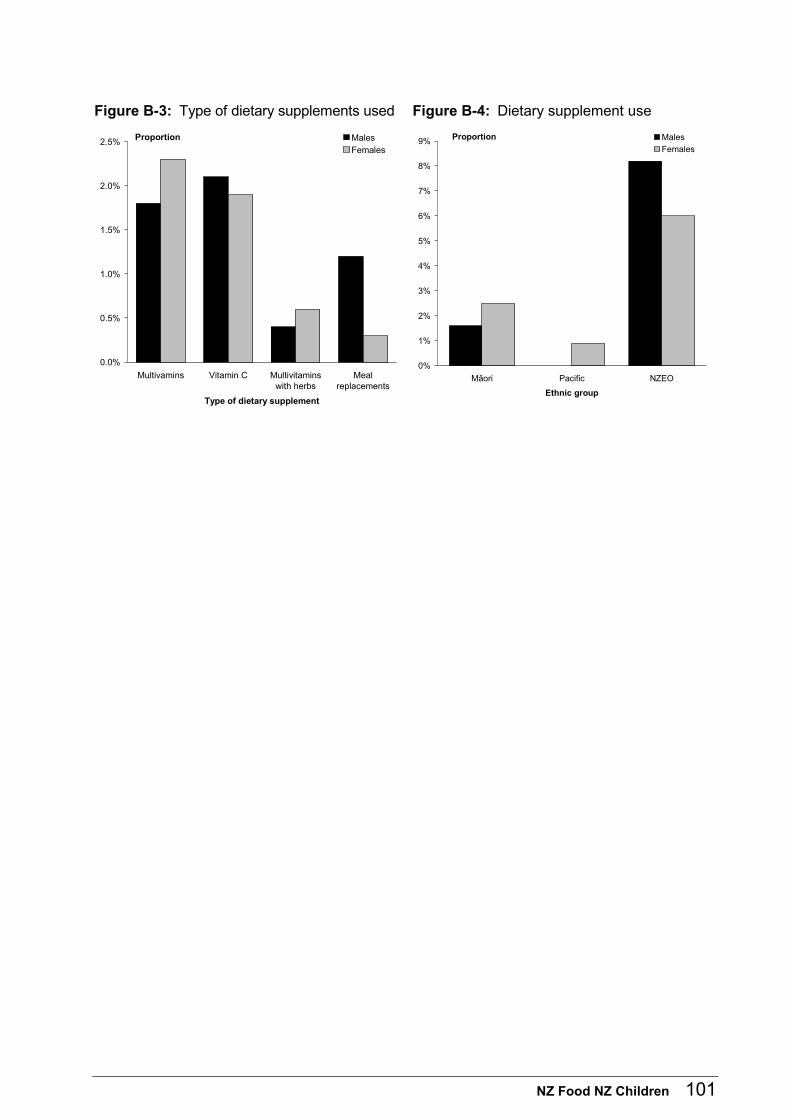
NZ Food NZ Children 101
Figure B-3: Type of dietary supplements used Figure B-4: Dietary supplement use
0.0%
0.5%
1.0%
1.5%
2.0%
2.5%
Multivamins Vitamin C Multivitaminswith herbs
Mealreplacements
Type of dietary supplement
Proportion Males
Females
0%
1%
2%
3%
4%
5%
6%
7%
8%
9%
Mäori Pacific NZEO
Ethnic group
Proportion Males
Females
102 NZ Food NZ Children
B3 School day food consumption patterns Table B3
New Zealand children
Males were more likely to Usually eat or drink at home before school (86.2 percent) than females (79.2 percent). The proportion of males and females who (Sometimes or Usually) ate or drank on the way to school was similar (15.6 percent; 15.7 percent). New Zealand children Usually (5.6 percent) or Sometimes (31.4 percent) ate or drank on their way home after school. Children 11–14 years were less likely to Usually eat or drink at home before school than younger children. Children 11–14 years were more likely to eat or drink on the way to school than children 5–6 years.
Urban-rural
Rural females were more likely to Usually eat or drink at home before school (84.3 percent) than urban females (78.2 percent). Urban males were more likely to Sometimes or Usually eat on the way to school (16.8 percent) than rural males (10.3 percent).
NZDep01
The proportion of children who Usually ate or drank at home before school decreased consistently from NZDep01-I to V. NZDep01-V children were the most likely to eat and drink on the way to school.
Ethnic
NZEO children were more likely to Usually eat or drink at home before school (males 94.4 percent; females 87.7 percent) than Mäori (74.7 percent; 66 percent) and Pacific children (53.3 percent; 50.3 percent). NZEO children were less likely to Usually or Sometimes eat or drink on the way to school than Mäori and Pacific children (Figure B-6).
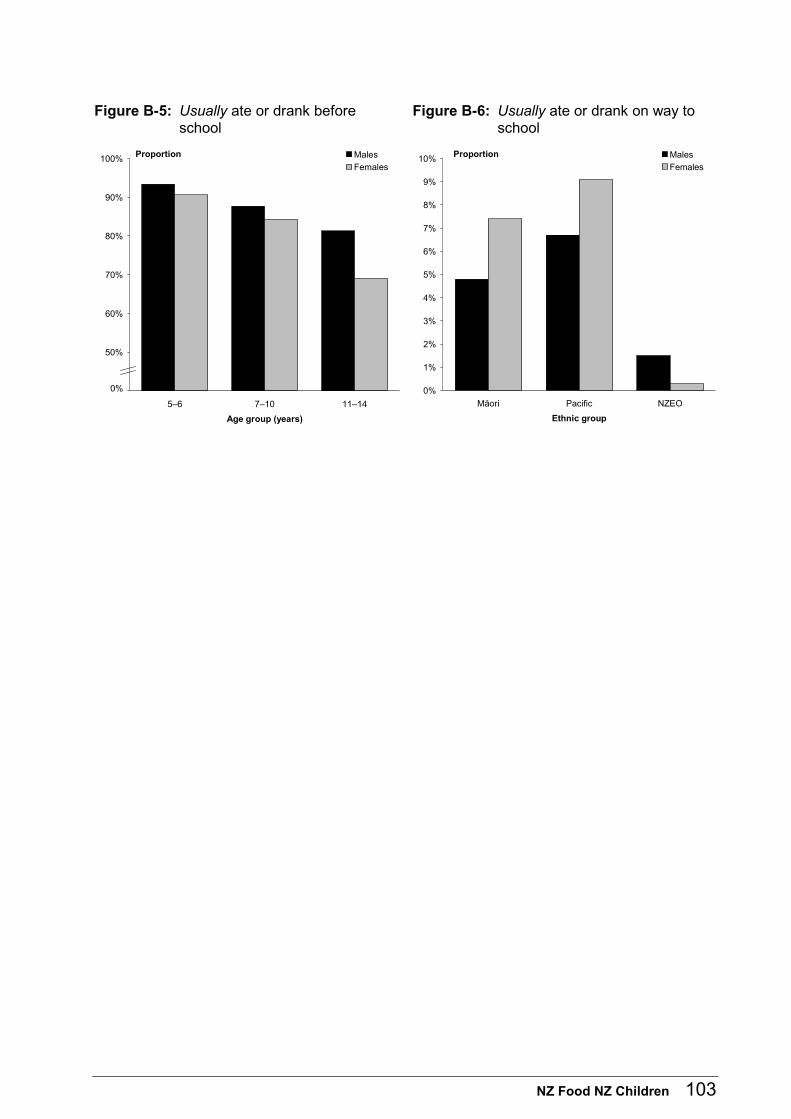
NZ Food NZ Children 103
Figure B-5: Usually ate or drank before school
Figure B-6: Usually ate or drank on way to school
40%
50%
60%
70%
80%
90%
100%
5–6 7–10 11–14
Age group (years)
Proportion Males
Females
0% 0%
1%
2%
3%
4%
5%
6%
7%
8%
9%
10%
Mäori Pacific NZEO
Ethnic group
Proportion Males
Females
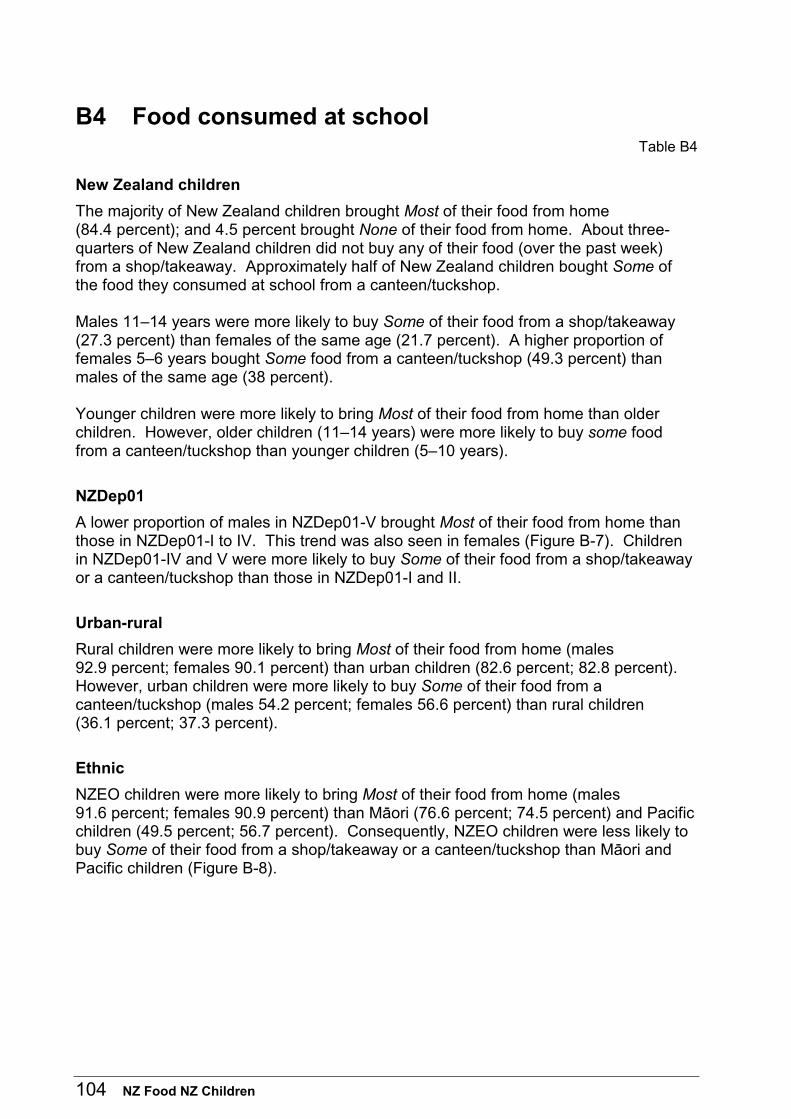
104 NZ Food NZ Children
B4 Food consumed at school Table B4
New Zealand children
The majority of New Zealand children brought Most of their food from home (84.4 percent); and 4.5 percent brought None of their food from home. About three-quarters of New Zealand children did not buy any of their food (over the past week) from a shop/takeaway. Approximately half of New Zealand children bought Some of the food they consumed at school from a canteen/tuckshop. Males 11–14 years were more likely to buy Some of their food from a shop/takeaway (27.3 percent) than females of the same age (21.7 percent). A higher proportion of females 5–6 years bought Some food from a canteen/tuckshop (49.3 percent) than males of the same age (38 percent). Younger children were more likely to bring Most of their food from home than older children. However, older children (11–14 years) were more likely to buy some food from a canteen/tuckshop than younger children (5–10 years).
NZDep01
A lower proportion of males in NZDep01-V brought Most of their food from home than those in NZDep01-I to IV. This trend was also seen in females (Figure B-7). Children in NZDep01-IV and V were more likely to buy Some of their food from a shop/takeaway or a canteen/tuckshop than those in NZDep01-I and II.
Urban-rural
Rural children were more likely to bring Most of their food from home (males 92.9 percent; females 90.1 percent) than urban children (82.6 percent; 82.8 percent). However, urban children were more likely to buy Some of their food from a canteen/tuckshop (males 54.2 percent; females 56.6 percent) than rural children (36.1 percent; 37.3 percent).
Ethnic
NZEO children were more likely to bring Most of their food from home (males 91.6 percent; females 90.9 percent) than Mäori (76.6 percent; 74.5 percent) and Pacific children (49.5 percent; 56.7 percent). Consequently, NZEO children were less likely to buy Some of their food from a shop/takeaway or a canteen/tuckshop than Mäori and Pacific children (Figure B-8).
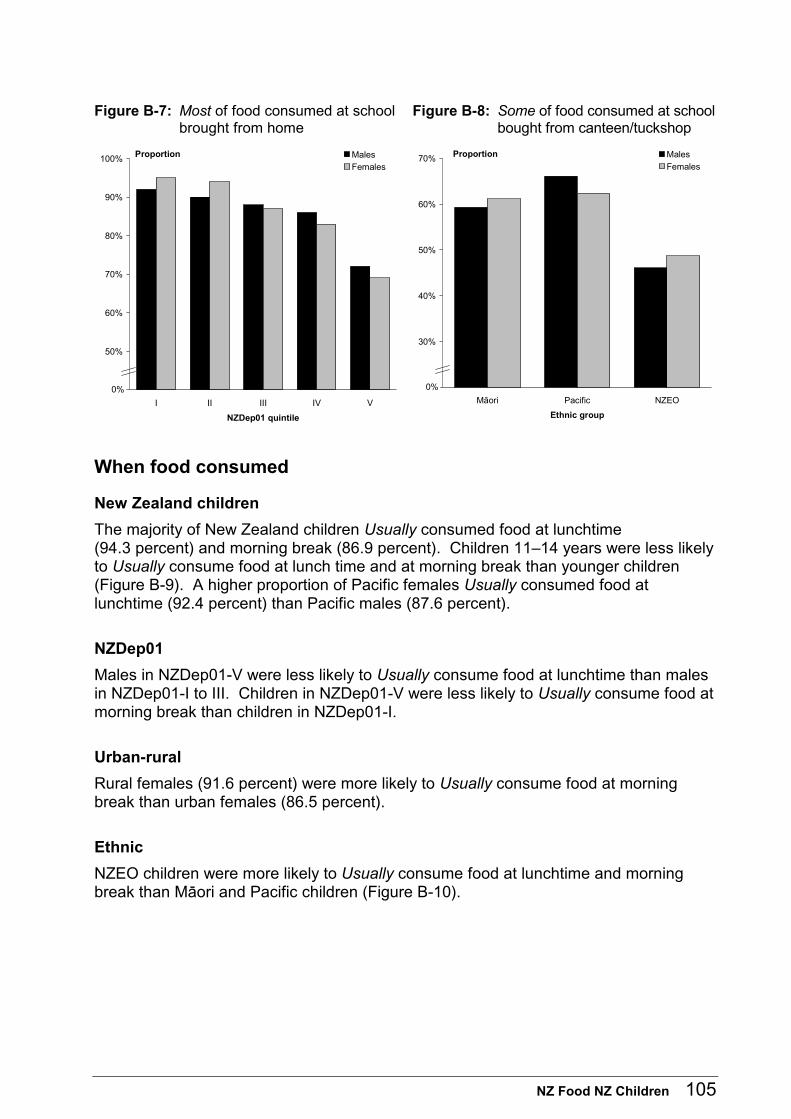
NZ Food NZ Children 105
Figure B-7: Most of food consumed at school brought from home
Figure B-8: Some of food consumed at school bought from canteen/tuckshop
40%
50%
60%
70%
80%
90%
100%
I II III IV V
NZDep01 quintile
Proportion Males
Females
0% 20%
30%
40%
50%
60%
70%
Mäori Pacific NZEO
Ethnic group
Proportion Males
Females
0%
When food consumed
New Zealand children
The majority of New Zealand children Usually consumed food at lunchtime (94.3 percent) and morning break (86.9 percent). Children 11–14 years were less likely to Usually consume food at lunch time and at morning break than younger children (Figure B-9). A higher proportion of Pacific females Usually consumed food at lunchtime (92.4 percent) than Pacific males (87.6 percent).
NZDep01
Males in NZDep01-V were less likely to Usually consume food at lunchtime than males in NZDep01-I to III. Children in NZDep01-V were less likely to Usually consume food at morning break than children in NZDep01-I.
Urban-rural
Rural females (91.6 percent) were more likely to Usually consume food at morning break than urban females (86.5 percent).
Ethnic
NZEO children were more likely to Usually consume food at lunchtime and morning break than Mäori and Pacific children (Figure B-10).
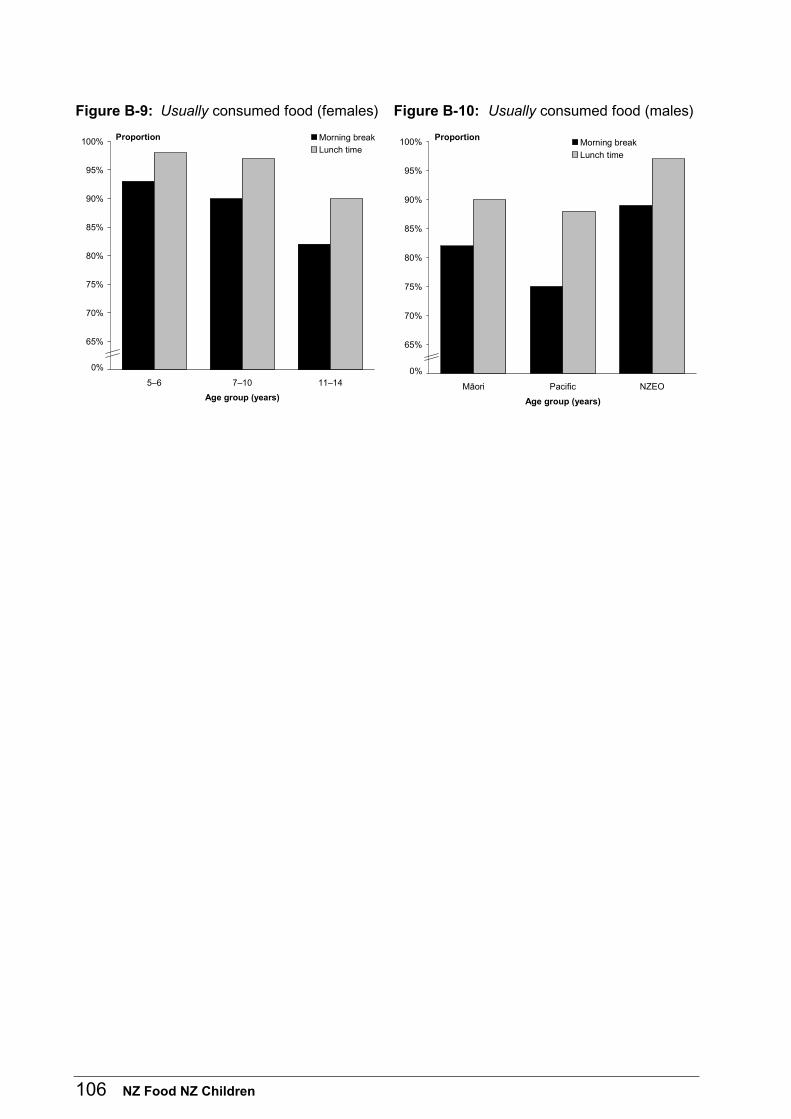
106 NZ Food NZ Children
Figure B-9: Usually consumed food (females) Figure B-10: Usually consumed food (males)
60%
65%
70%
75%
80%
85%
90%
95%
100%
5–6 7–10 11–14
Age group (years)
Proportion Morning break
Lunch time
0%60%
65%
70%
75%
80%
85%
90%
95%
100%
Mäori Pacific NZEO
Age group (years)
ProportionMorning break
Lunch time
0%
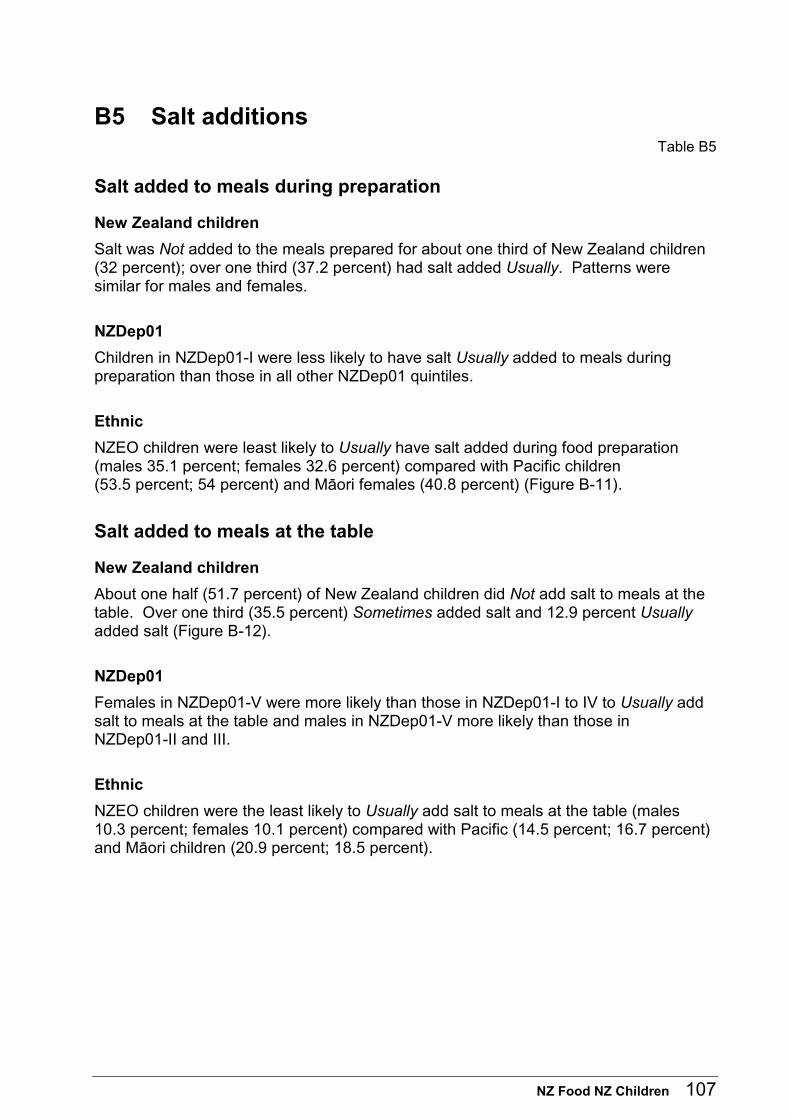
NZ Food NZ Children 107
B5 Salt additions Table B5
Salt added to meals during preparation
New Zealand children
Salt was Not added to the meals prepared for about one third of New Zealand children (32 percent); over one third (37.2 percent) had salt added Usually. Patterns were similar for males and females.
NZDep01
Children in NZDep01-I were less likely to have salt Usually added to meals during preparation than those in all other NZDep01 quintiles.
Ethnic
NZEO children were least likely to Usually have salt added during food preparation (males 35.1 percent; females 32.6 percent) compared with Pacific children (53.5 percent; 54 percent) and Mäori females (40.8 percent) (Figure B-11).
Salt added to meals at the table
New Zealand children
About one half (51.7 percent) of New Zealand children did Not add salt to meals at the table. Over one third (35.5 percent) Sometimes added salt and 12.9 percent Usually added salt (Figure B-12).
NZDep01
Females in NZDep01-V were more likely than those in NZDep01-I to IV to Usually add salt to meals at the table and males in NZDep01-V more likely than those in NZDep01-II and III.
Ethnic
NZEO children were the least likely to Usually add salt to meals at the table (males 10.3 percent; females 10.1 percent) compared with Pacific (14.5 percent; 16.7 percent) and Mäori children (20.9 percent; 18.5 percent).
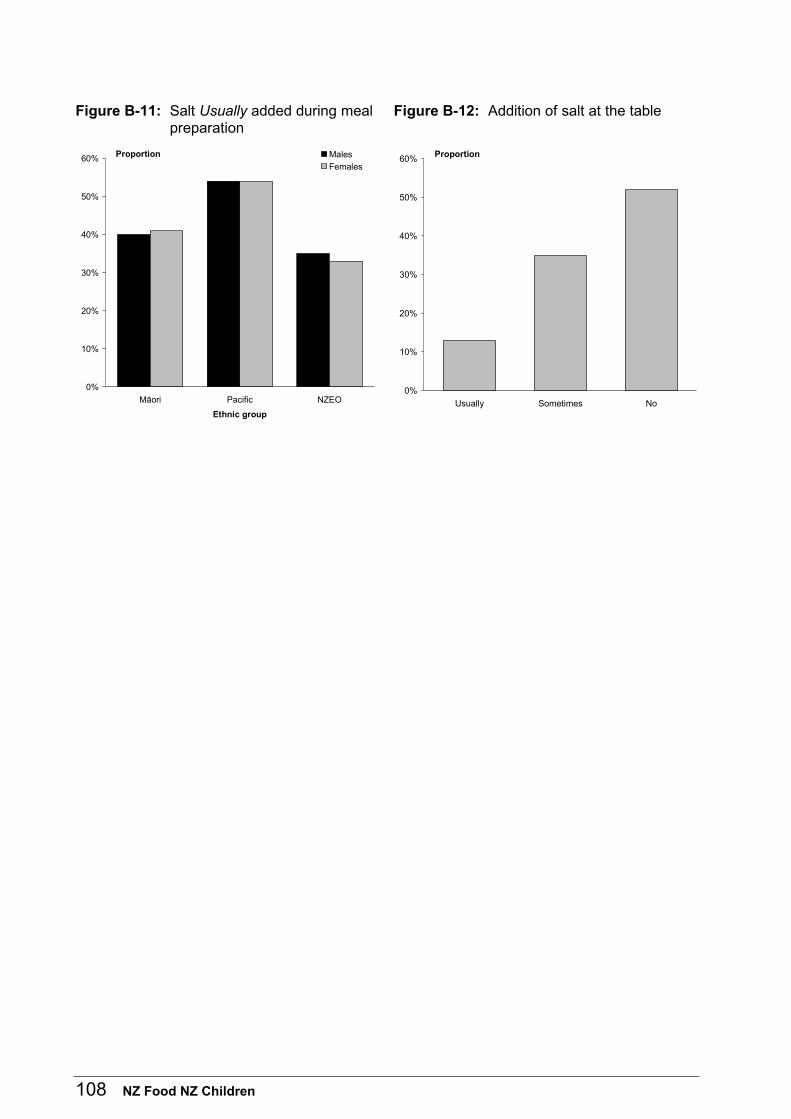
108 NZ Food NZ Children
Figure B-11: Salt Usually added during meal preparation
Figure B-12: Addition of salt at the table
0%
10%
20%
30%
40%
50%
60%
Mäori Pacific NZEO
Ethnic group
Proportion Males
Females
0%
10%
20%
30%
40%
50%
60%
Usually Sometimes No
Proportion
NZ Food NZ Children 109
B6 Household food security Table B6
‘Food security’ is an internationally recognised term that encompasses the ready availability of nutritionally adequate and safe foods and the assumed ability of people to acquire personally acceptable foods in a socially acceptable way. Whenever adult members of the households of the children who participated in the survey were available they were asked to respond to eight statements on behalf of the child’s household. Each of these statements about food related to affordability, that is, the response was made in light of whether the respondent felt their household had enough money.
We can afford to eat properly
New Zealand households
About 78 percent of households reported that they could always afford to eat properly, but 20.1 percent said they could only Sometimes afford to do so. The largest households (those with seven or more members) and those with at least five children were more likely than smaller households to report that they could afford to eat properly only Sometimes.
NZDep01
Households in NZDep01-V were less likely to Always be able to afford to eat properly (59.5 percent) than those in NZDep01-I to IV (94 percent to 72 percent) (Figure B-13).
Ethnic
Households with NZEO children were most likely to state they Always ‘can afford to eat properly’ (86.1 percent), compared with households with Mäori (64.3 percent), and Pacific children (46.6 percent) (Figure B-14). Mäori, Pacific and NZEO households with one or two children more frequently said they could Always and Sometimes afford to eat properly than households with five or more children. Across all ethnic groups, households with seven or more members were less likely to say they could Always afford to eat properly than those with less than five members.
110 NZ Food NZ Children
Figure B-13: Can Always afford to eat properly
Figure B-14: Can Always and Sometimes afford to eat properly
0%
20%
40%
60%
80%
100%
I II III IV V
NZDep01 quintile
Proportion of households
0%
20%
40%
60%
80%
100%
Māori Pacific NZEO
Ethnic group
Proportion of households Always
Sometimes
Food runs out in our household due to lack of money
New Zealand households
Over 22 percent of households reported that ‘food runs out because of lack of money’ Sometimes (18.5 percent) and Often (3.6 percent). Around 40 percent of households with at least seven members or at least five children reported that ‘food runs out in their household because of lack of money’ Often or Sometimes, and they were more likely to report this than smaller households (Figure B-15).
NZDep01
Households in NZDep01-V were most likely to ‘run out of food due to lack of money’ Sometimes (36.3 percent) and Often (8.9 percent) than those in NZDep01-I to IV (Figure B-16).
Ethnic
Households with Pacific children (53.9 percent) were more likely to say food runs out in their household Often or Sometimes than those with Mäori (37.5 percent) and NZEO children (13 percent). Mäori, Pacific and NZEO households with five or more children were more likely to report that food runs out in their household due to lack of money Often or Sometimes than those with one or two children.
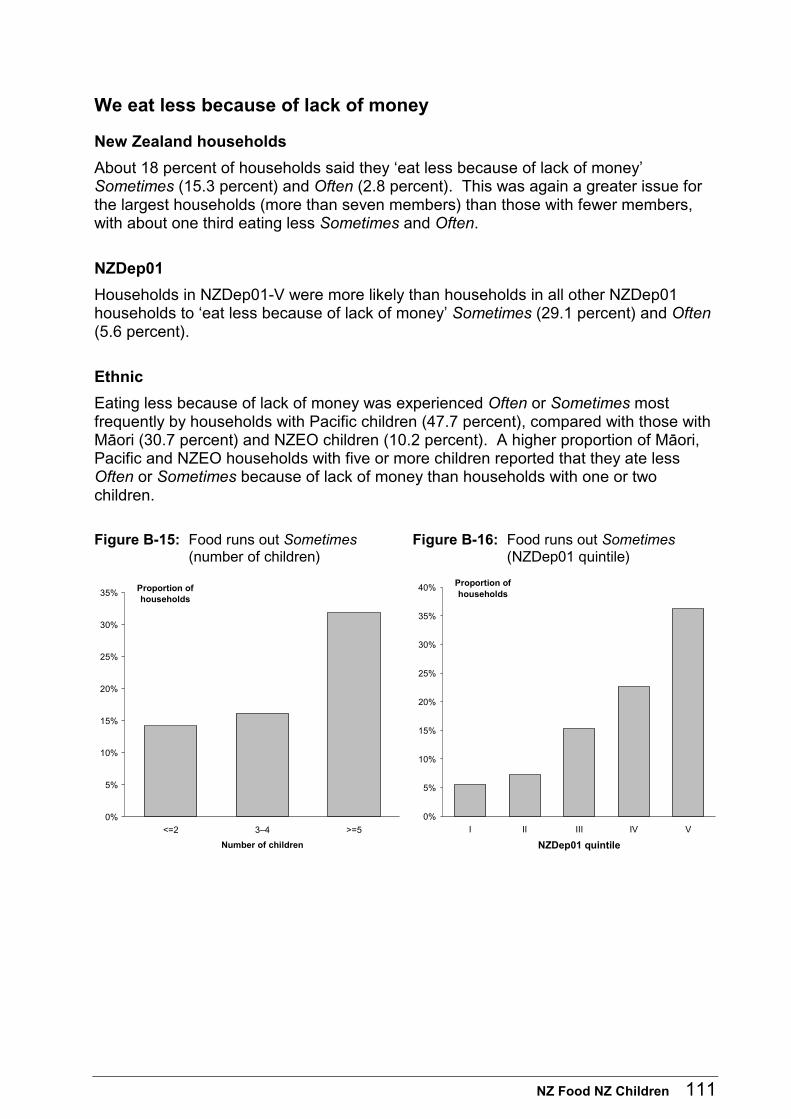
NZ Food NZ Children 111
We eat less because of lack of money
New Zealand households
About 18 percent of households said they ‘eat less because of lack of money’ Sometimes (15.3 percent) and Often (2.8 percent). This was again a greater issue for the largest households (more than seven members) than those with fewer members, with about one third eating less Sometimes and Often.
NZDep01
Households in NZDep01-V were more likely than households in all other NZDep01 households to ‘eat less because of lack of money’ Sometimes (29.1 percent) and Often (5.6 percent).
Ethnic
Eating less because of lack of money was experienced Often or Sometimes most frequently by households with Pacific children (47.7 percent), compared with those with Mäori (30.7 percent) and NZEO children (10.2 percent). A higher proportion of Mäori, Pacific and NZEO households with five or more children reported that they ate less Often or Sometimes because of lack of money than households with one or two children.
Figure B-15: Food runs out Sometimes (number of children)
Figure B-16: Food runs out Sometimes (NZDep01 quintile)
0%
5%
10%
15%
20%
25%
30%
35%
<=2 3–4 >=5
Number of children
Proportion of households
0%
5%
10%
15%
20%
25%
30%
35%
40%
I II III IV V
NZDep01 quintile
Proportion of households
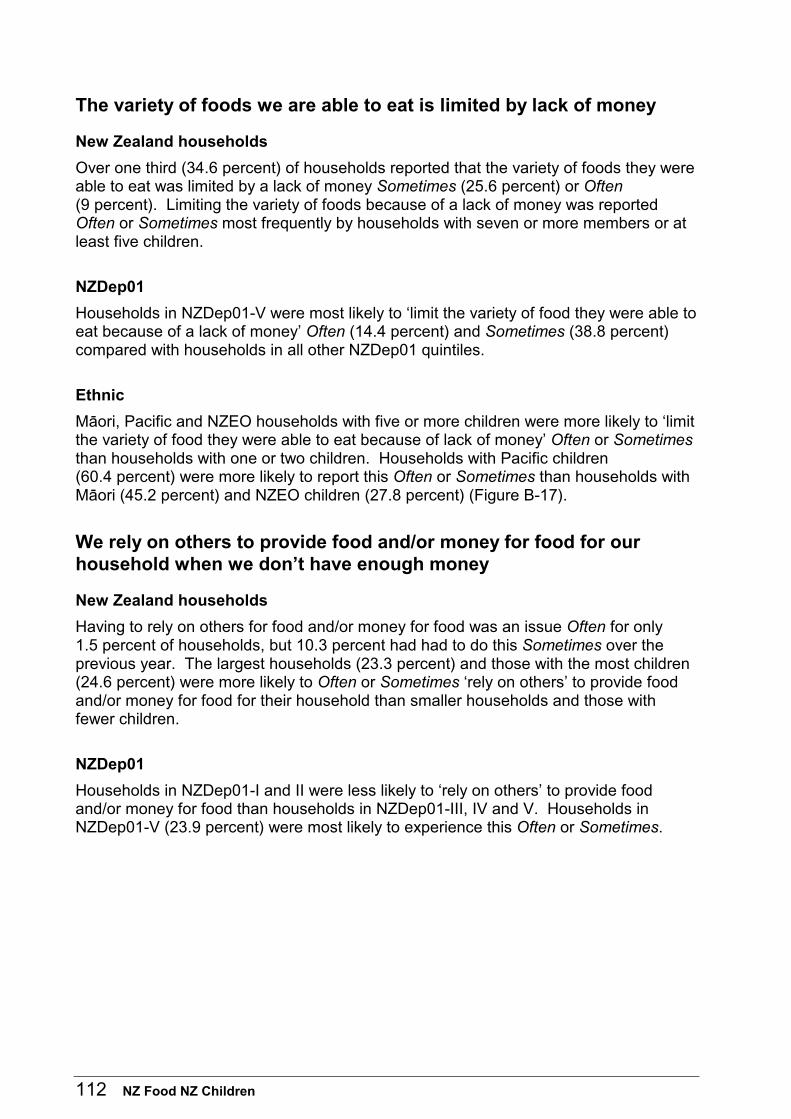
112 NZ Food NZ Children
The variety of foods we are able to eat is limited by lack of money
New Zealand households
Over one third (34.6 percent) of households reported that the variety of foods they were able to eat was limited by a lack of money Sometimes (25.6 percent) or Often (9 percent). Limiting the variety of foods because of a lack of money was reported Often or Sometimes most frequently by households with seven or more members or at least five children.
NZDep01
Households in NZDep01-V were most likely to ‘limit the variety of food they were able to eat because of a lack of money’ Often (14.4 percent) and Sometimes (38.8 percent) compared with households in all other NZDep01 quintiles.
Ethnic
Mäori, Pacific and NZEO households with five or more children were more likely to ‘limit the variety of food they were able to eat because of lack of money’ Often or Sometimes than households with one or two children. Households with Pacific children (60.4 percent) were more likely to report this Often or Sometimes than households with Mäori (45.2 percent) and NZEO children (27.8 percent) (Figure B-17).
We rely on others to provide food and/or money for food for our household when we don’t have enough money
New Zealand households
Having to rely on others for food and/or money for food was an issue Often for only 1.5 percent of households, but 10.3 percent had had to do this Sometimes over the previous year. The largest households (23.3 percent) and those with the most children (24.6 percent) were more likely to Often or Sometimes ‘rely on others’ to provide food and/or money for food for their household than smaller households and those with fewer children.
NZDep01
Households in NZDep01-I and II were less likely to ‘rely on others’ to provide food and/or money for food than households in NZDep01-III, IV and V. Households in NZDep01-V (23.9 percent) were most likely to experience this Often or Sometimes.
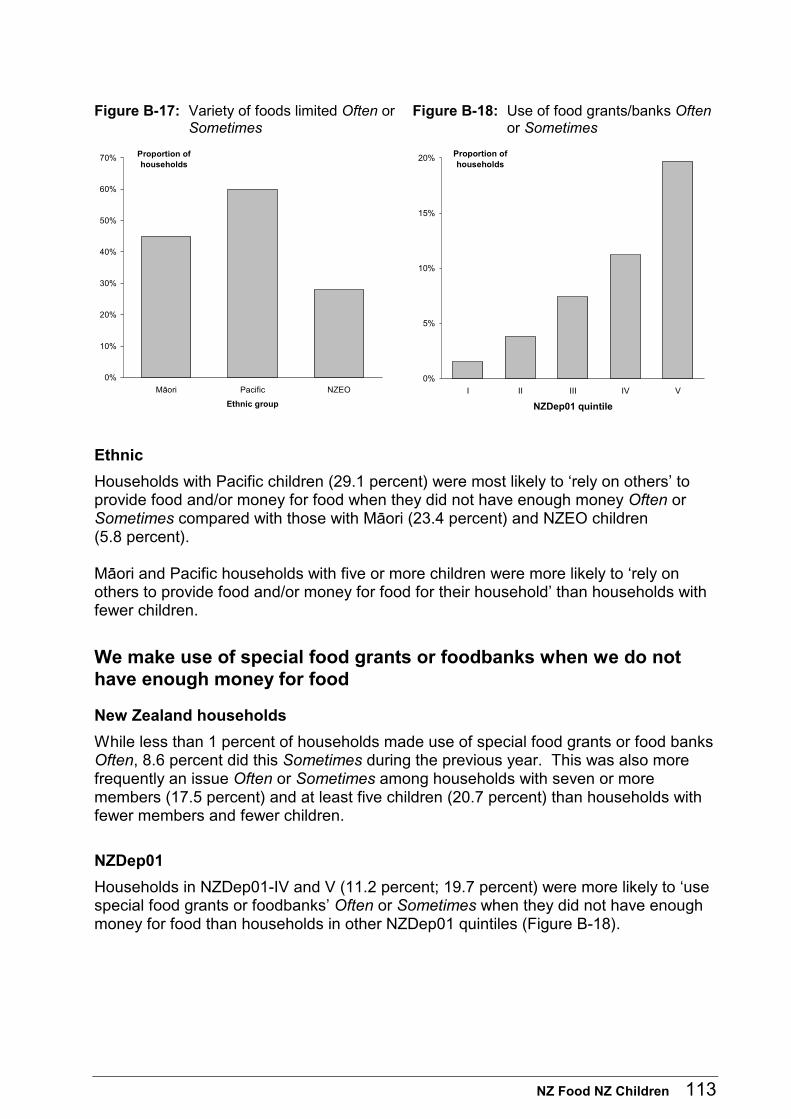
NZ Food NZ Children 113
Figure B-17: Variety of foods limited Often or Sometimes
Figure B-18: Use of food grants/banks Often or Sometimes
0%
10%
20%
30%
40%
50%
60%
70%
Mäori Pacific NZEO
Ethnic group
Proportion of households
0%
5%
10%
15%
20%
I II III IV V
NZDep01 quintile
Proportion of households
Ethnic
Households with Pacific children (29.1 percent) were most likely to ‘rely on others’ to provide food and/or money for food when they did not have enough money Often or Sometimes compared with those with Mäori (23.4 percent) and NZEO children (5.8 percent). Mäori and Pacific households with five or more children were more likely to ‘rely on others to provide food and/or money for food for their household’ than households with fewer children.
We make use of special food grants or foodbanks when we do not have enough money for food
New Zealand households
While less than 1 percent of households made use of special food grants or food banks Often, 8.6 percent did this Sometimes during the previous year. This was also more frequently an issue Often or Sometimes among households with seven or more members (17.5 percent) and at least five children (20.7 percent) than households with fewer members and fewer children.
NZDep01
Households in NZDep01-IV and V (11.2 percent; 19.7 percent) were more likely to ‘use special food grants or foodbanks’ Often or Sometimes when they did not have enough money for food than households in other NZDep01 quintiles (Figure B-18).
114 NZ Food NZ Children
Ethnic
Households with Mäori (20 percent) and Pacific children (19.3 percent) Often or Sometimes made use of special food grants or foodbank more frequently than households with NZEO children (4.5 percent). Mäori, Pacific and NZEO households with five or more children were more likely to use special food grants or foodbanks Often or Sometimes than households with one or two children.
We feel stressed because of not having enough money for food
New Zealand households
Over 18 percent of households experienced stress because they did not have enough money for food Sometimes, and 6.4 percent experienced this Often. Close to 40 percent of households with seven or more members and 44 percent of those with five or more children were stressed about lack of money for food Often or Sometimes over the previous year.
NZDep01
Households in NZDep01-I and II (7.7 percent; 10.3 percent) were less likely to be ‘stressed about not having enough money for food’ Often or Sometimes than households in NZDep01-III, IV and V (27.4 percent; 29.3 percent; 43.8 percent).
Ethnic
Feeling ‘stressed because of not having enough money for food’ was most frequently experienced Often or Sometimes by households with Pacific children (46.6 percent), followed by those with Mäori (40 percent) and NZEO children (16.5 percent). Across all ethnic groups, households with five or more children were more likely to experience this stress Often and Sometimes than households with one or two children (Figure B-19).
We feel stressed because we can’t provide the food we want for social occasions
New Zealand households
Just over 20 percent of households experienced stress because they could not provide the food they wanted to provide for social occasions Often or Sometimes (20.2 percent). The largest households, those with seven or more members (29.7 percent) and those with five or more children (32.4 percent), were the most likely to feel ‘stressed because they could not provide the food they wanted for social occasions’ Often or Sometimes compared with smaller households and households with fewer children.
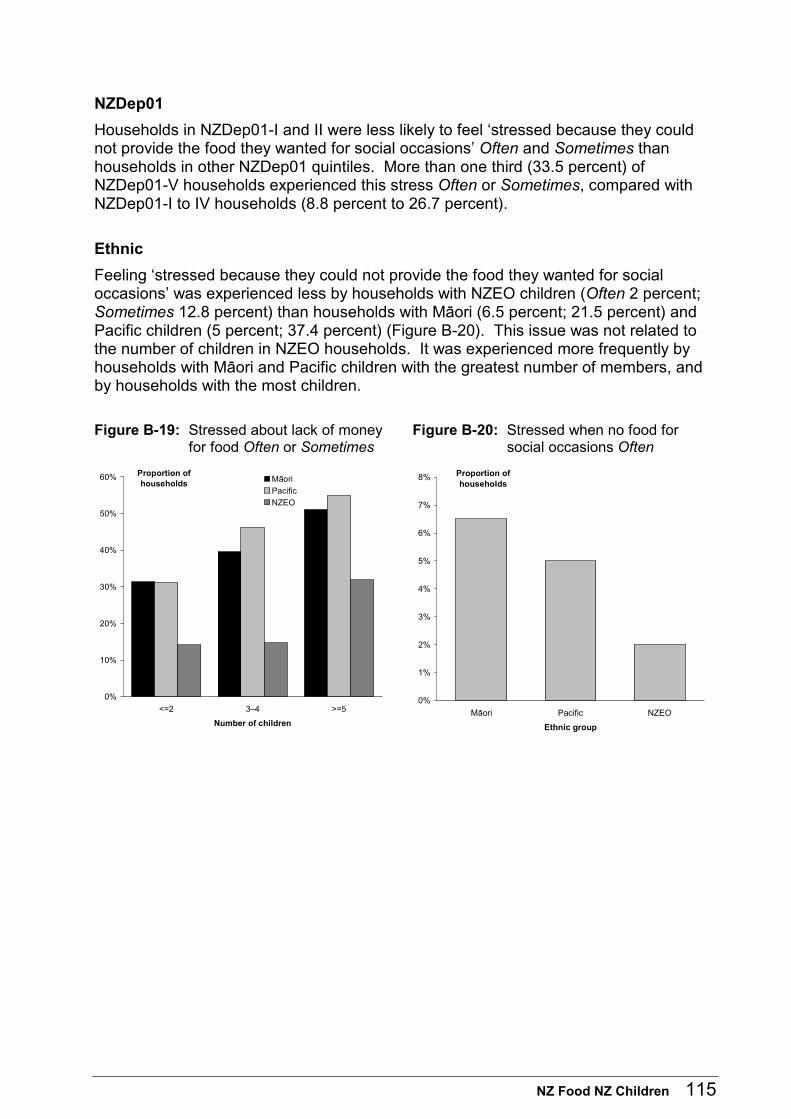
NZ Food NZ Children 115
NZDep01
Households in NZDep01-I and II were less likely to feel ‘stressed because they could not provide the food they wanted for social occasions’ Often and Sometimes than households in other NZDep01 quintiles. More than one third (33.5 percent) of NZDep01-V households experienced this stress Often or Sometimes, compared with NZDep01-I to IV households (8.8 percent to 26.7 percent).
Ethnic
Feeling ‘stressed because they could not provide the food they wanted for social occasions’ was experienced less by households with NZEO children (Often 2 percent; Sometimes 12.8 percent) than households with Mäori (6.5 percent; 21.5 percent) and Pacific children (5 percent; 37.4 percent) (Figure B-20). This issue was not related to the number of children in NZEO households. It was experienced more frequently by households with Mäori and Pacific children with the greatest number of members, and by households with the most children.
Figure B-19: Stressed about lack of money for food Often or Sometimes
Figure B-20: Stressed when no food for social occasions Often
0%
10%
20%
30%
40%
50%
60%
<=2 3–4 >=5
Number of children
Proportion of households Māori
Pacific
NZEO
0%
1%
2%
3%
4%
5%
6%
7%
8%
Mäori Pacific NZEO
Ethnic group
Proportion of households
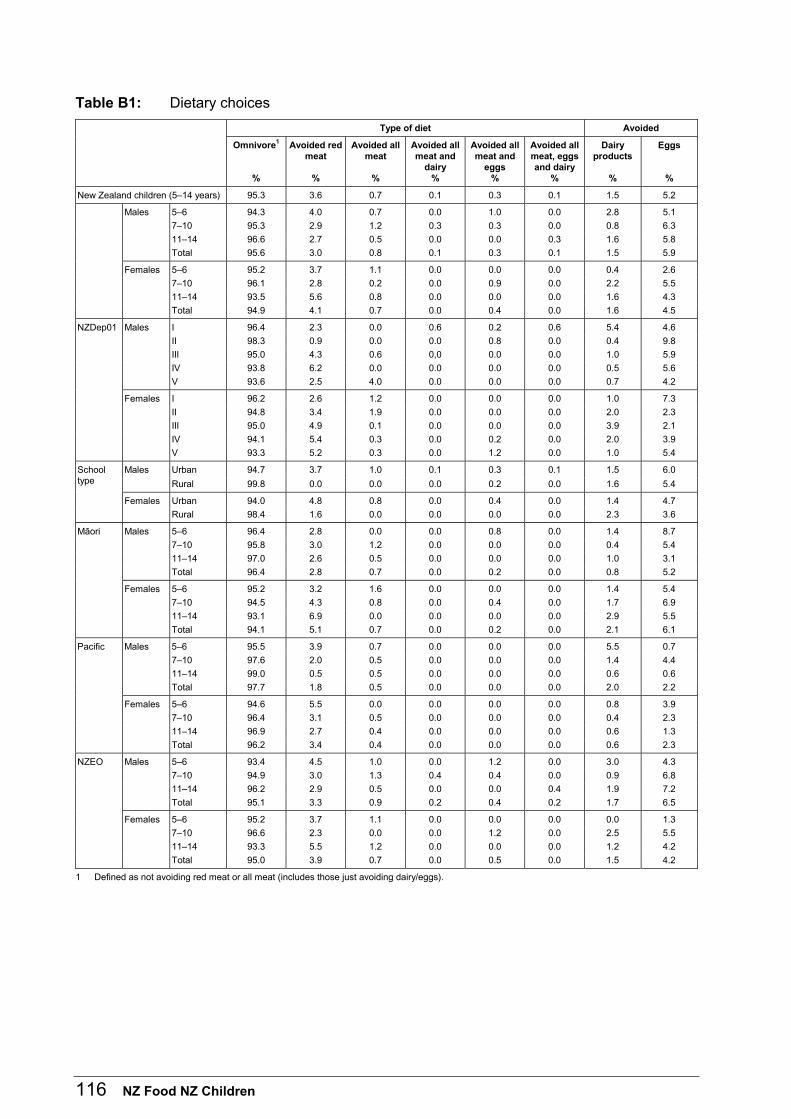
116 NZ Food NZ Children
Table B1: Dietary choices
Type of diet Avoided
Omnivore1
%
Avoided red meat
%
Avoided all meat
%
Avoided all meat and
dairy %
Avoided all meat and
eggs %
Avoided all meat, eggs and dairy
%
Dairy products
%
Eggs
%
New Zealand children (5–14 years) 95.3 3.6 0.7 0.1 0.3 0.1 1.5 5.2
Males 5–6 94.3 4.0 0.7 0.0 1.0 0.0 2.8 5.1
7–10 95.3 2.9 1.2 0.3 0.3 0.0 0.8 6.3
11–14 96.6 2.7 0.5 0.0 0.0 0.3 1.6 5.8
Total 95.6 3.0 0.8 0.1 0.3 0.1 1.5 5.9
Females 5–6 95.2 3.7 1.1 0.0 0.0 0.0 0.4 2.6
7–10 96.1 2.8 0.2 0.0 0.9 0.0 2.2 5.5
11–14 93.5 5.6 0.8 0.0 0.0 0.0 1.6 4.3
Total 94.9 4.1 0.7 0.0 0.4 0.0 1.6 4.5
NZDep01 Males I 96.4 2.3 0.0 0.6 0.2 0.6 5.4 4.6
II 98.3 0.9 0.0 0.0 0.8 0.0 0.4 9.8
III 95.0 4.3 0.6 0,0 0.0 0.0 1.0 5.9
IV 93.8 6.2 0.0 0.0 0.0 0.0 0.5 5.6
V 93.6 2.5 4.0 0.0 0.0 0.0 0.7 4.2
Females I 96.2 2.6 1.2 0.0 0.0 0.0 1.0 7.3
II 94.8 3.4 1.9 0.0 0.0 0.0 2.0 2.3
III 95.0 4.9 0.1 0.0 0.0 0.0 3.9 2.1
IV 94.1 5.4 0.3 0.0 0.2 0.0 2.0 3.9
V 93.3 5.2 0.3 0.0 1.2 0.0 1.0 5.4
Males Urban 94.7 3.7 1.0 0.1 0.3 0.1 1.5 6.0 School type Rural 99.8 0.0 0.0 0.0 0.2 0.0 1.6 5.4
Females Urban 94.0 4.8 0.8 0.0 0.4 0.0 1.4 4.7
Rural 98.4 1.6 0.0 0.0 0.0 0.0 2.3 3.6
Mäori Males 5–6 96.4 2.8 0.0 0.0 0.8 0.0 1.4 8.7
7–10 95.8 3.0 1.2 0.0 0.0 0.0 0.4 5.4
11–14 97.0 2.6 0.5 0.0 0.0 0.0 1.0 3.1
Total 96.4 2.8 0.7 0.0 0.2 0.0 0.8 5.2
Females 5–6 95.2 3.2 1.6 0.0 0.0 0.0 1.4 5.4
7–10 94.5 4.3 0.8 0.0 0.4 0.0 1.7 6.9
11–14 93.1 6.9 0.0 0.0 0.0 0.0 2.9 5.5
Total 94.1 5.1 0.7 0.0 0.2 0.0 2.1 6.1
Pacific Males 5–6 95.5 3.9 0.7 0.0 0.0 0.0 5.5 0.7
7–10 97.6 2.0 0.5 0.0 0.0 0.0 1.4 4.4
11–14 99.0 0.5 0.5 0.0 0.0 0.0 0.6 0.6
Total 97.7 1.8 0.5 0.0 0.0 0.0 2.0 2.2
Females 5–6 94.6 5.5 0.0 0.0 0.0 0.0 0.8 3.9
7–10 96.4 3.1 0.5 0.0 0.0 0.0 0.4 2.3
11–14 96.9 2.7 0.4 0.0 0.0 0.0 0.6 1.3
Total 96.2 3.4 0.4 0.0 0.0 0.0 0.6 2.3
NZEO Males 5–6 93.4 4.5 1.0 0.0 1.2 0.0 3.0 4.3
7–10 94.9 3.0 1.3 0.4 0.4 0.0 0.9 6.8
11–14 96.2 2.9 0.5 0.0 0.0 0.4 1.9 7.2
Total 95.1 3.3 0.9 0.2 0.4 0.2 1.7 6.5
Females 5–6 95.2 3.7 1.1 0.0 0.0 0.0 0.0 1.3
7–10 96.6 2.3 0.0 0.0 1.2 0.0 2.5 5.5
11–14 93.3 5.5 1.2 0.0 0.0 0.0 1.2 4.2
Total 95.0 3.9 0.7 0.0 0.5 0.0 1.5 4.2
1 Defined as not avoiding red meat or all meat (includes those just avoiding dairy/eggs).
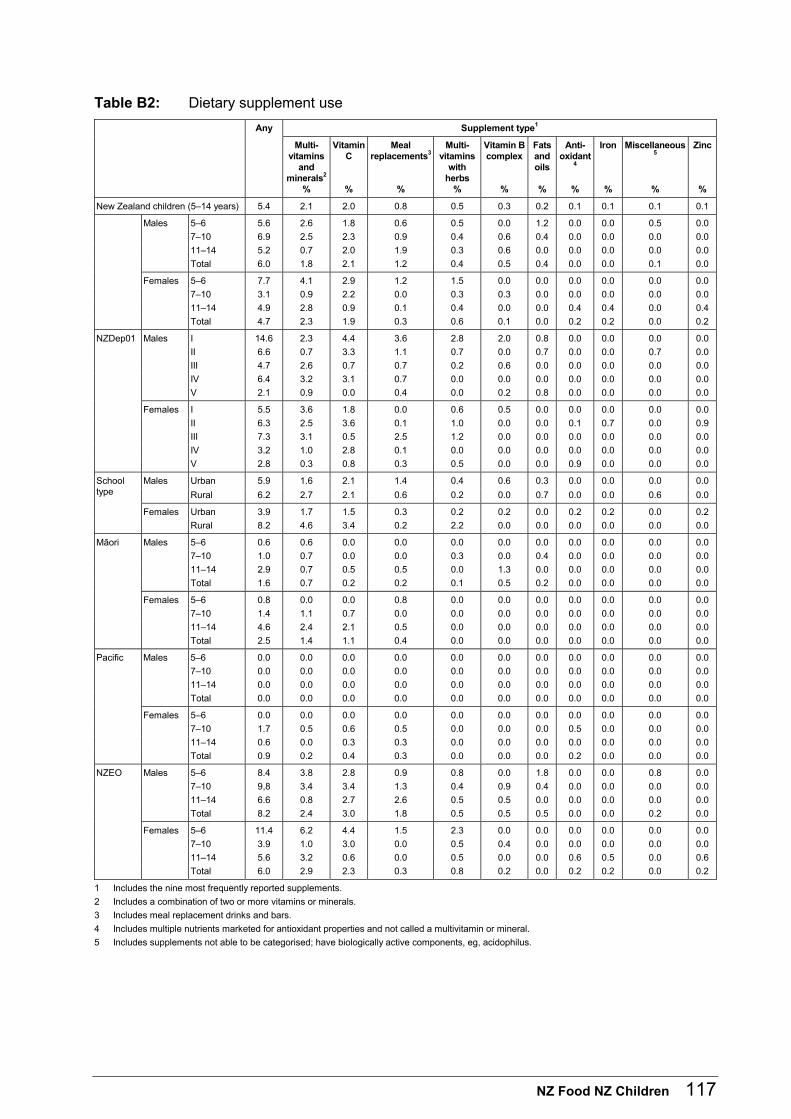
NZ Food NZ Children 117
Table B2: Dietary supplement use
Supplement type1 Any
Multi-vitamins
and minerals2
%
Vitamin C
%
Meal replacements3
%
Multi-vitamins
with herbs
%
Vitamin B complex
%
Fats and oils
%
Anti-oxidant
4
%
Iron
%
Miscellaneous5
%
Zinc
%
New Zealand children (5–14 years) 5.4 2.1 2.0 0.8 0.5 0.3 0.2 0.1 0.1 0.1 0.1
Males 5–6 5.6 2.6 1.8 0.6 0.5 0.0 1.2 0.0 0.0 0.5 0.0
7–10 6.9 2.5 2.3 0.9 0.4 0.6 0.4 0.0 0.0 0.0 0.0
11–14 5.2 0.7 2.0 1.9 0.3 0.6 0.0 0.0 0.0 0.0 0.0
Total 6.0 1.8 2.1 1.2 0.4 0.5 0.4 0.0 0.0 0.1 0.0
Females 5–6 7.7 4.1 2.9 1.2 1.5 0.0 0.0 0.0 0.0 0.0 0.0
7–10 3.1 0.9 2.2 0.0 0.3 0.3 0.0 0.0 0.0 0.0 0.0
11–14 4.9 2.8 0.9 0.1 0.4 0.0 0.0 0.4 0.4 0.0 0.4
Total 4.7 2.3 1.9 0.3 0.6 0.1 0.0 0.2 0.2 0.0 0.2
NZDep01 Males I 14.6 2.3 4.4 3.6 2.8 2.0 0.8 0.0 0.0 0.0 0.0
II 6.6 0.7 3.3 1.1 0.7 0.0 0.7 0.0 0.0 0.7 0.0
III 4.7 2.6 0.7 0.7 0.2 0.6 0.0 0.0 0.0 0.0 0.0
IV 6.4 3.2 3.1 0.7 0.0 0.0 0.0 0.0 0.0 0.0 0.0
V 2.1 0.9 0.0 0.4 0.0 0.2 0.8 0.0 0.0 0.0 0.0
Females I 5.5 3.6 1.8 0.0 0.6 0.5 0.0 0.0 0.0 0.0 0.0
II 6.3 2.5 3.6 0.1 1.0 0.0 0.0 0.1 0.7 0.0 0.9
III 7.3 3.1 0.5 2.5 1.2 0.0 0.0 0.0 0.0 0.0 0.0
IV 3.2 1.0 2.8 0.1 0.0 0.0 0.0 0.0 0.0 0.0 0.0
V 2.8 0.3 0.8 0.3 0.5 0.0 0.0 0.9 0.0 0.0 0.0
Males Urban 5.9 1.6 2.1 1.4 0.4 0.6 0.3 0.0 0.0 0.0 0.0 School type Rural 6.2 2.7 2.1 0.6 0.2 0.0 0.7 0.0 0.0 0.6 0.0
Females Urban 3.9 1.7 1.5 0.3 0.2 0.2 0.0 0.2 0.2 0.0 0.2
Rural 8.2 4.6 3.4 0.2 2.2 0.0 0.0 0.0 0.0 0.0 0.0
Mäori Males 5–6 0.6 0.6 0.0 0.0 0.0 0.0 0.0 0.0 0.0 0.0 0.0
7–10 1.0 0.7 0.0 0.0 0.3 0.0 0.4 0.0 0.0 0.0 0.0
11–14 2.9 0.7 0.5 0.5 0.0 1.3 0.0 0.0 0.0 0.0 0.0
Total 1.6 0.7 0.2 0.2 0.1 0.5 0.2 0.0 0.0 0.0 0.0
Females 5–6 0.8 0.0 0.0 0.8 0.0 0.0 0.0 0.0 0.0 0.0 0.0
7–10 1.4 1.1 0.7 0.0 0.0 0.0 0.0 0.0 0.0 0.0 0.0
11–14 4.6 2.4 2.1 0.5 0.0 0.0 0.0 0.0 0.0 0.0 0.0
Total 2.5 1.4 1.1 0.4 0.0 0.0 0.0 0.0 0.0 0.0 0.0
Pacific Males 5–6 0.0 0.0 0.0 0.0 0.0 0.0 0.0 0.0 0.0 0.0 0.0
7–10 0.0 0.0 0.0 0.0 0.0 0.0 0.0 0.0 0.0 0.0 0.0
11–14 0.0 0.0 0.0 0.0 0.0 0.0 0.0 0.0 0.0 0.0 0.0
Total 0.0 0.0 0.0 0.0 0.0 0.0 0.0 0.0 0.0 0.0 0.0
Females 5–6 0.0 0.0 0.0 0.0 0.0 0.0 0.0 0.0 0.0 0.0 0.0
7–10 1.7 0.5 0.6 0.5 0.0 0.0 0.0 0.5 0.0 0.0 0.0
11–14 0.6 0.0 0.3 0.3 0.0 0.0 0.0 0.0 0.0 0.0 0.0
Total 0.9 0.2 0.4 0.3 0.0 0.0 0.0 0.2 0.0 0.0 0.0
NZEO Males 5–6 8.4 3.8 2.8 0.9 0.8 0.0 1.8 0.0 0.0 0.8 0.0
7–10 9,8 3.4 3.4 1.3 0.4 0.9 0.4 0.0 0.0 0.0 0.0
11–14 6.6 0.8 2.7 2.6 0.5 0.5 0.0 0.0 0.0 0.0 0.0
Total 8.2 2.4 3.0 1.8 0.5 0.5 0.5 0.0 0.0 0.2 0.0
Females 5–6 11.4 6.2 4.4 1.5 2.3 0.0 0.0 0.0 0.0 0.0 0.0
7–10 3.9 1.0 3.0 0.0 0.5 0.4 0.0 0.0 0.0 0.0 0.0
11–14 5.6 3.2 0.6 0.0 0.5 0.0 0.0 0.6 0.5 0.0 0.6
Total 6.0 2.9 2.3 0.3 0.8 0.2 0.0 0.2 0.2 0.0 0.2
1 Includes the nine most frequently reported supplements.
2 Includes a combination of two or more vitamins or minerals.
3 Includes meal replacement drinks and bars.
4 Includes multiple nutrients marketed for antioxidant properties and not called a multivitamin or mineral.
5 Includes supplements not able to be categorised; have biologically active components, eg, acidophilus.
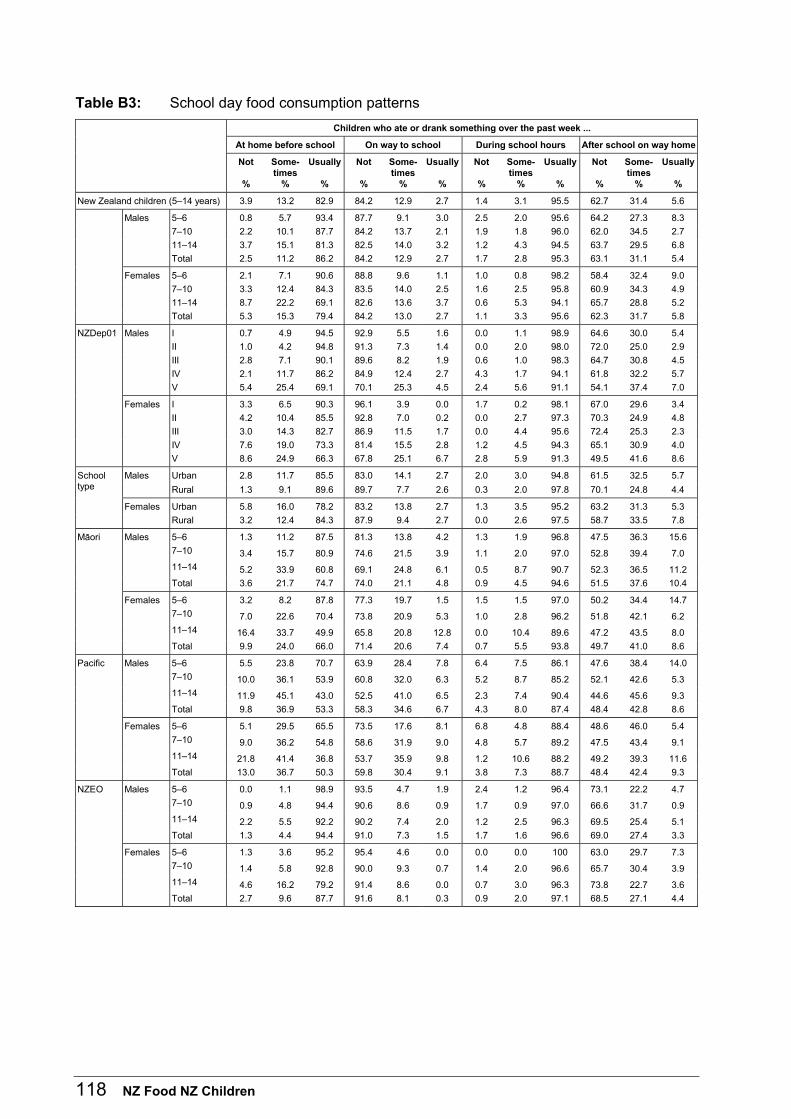
118 NZ Food NZ Children
Table B3: School day food consumption patterns
Children who ate or drank something over the past week ...
At home before school On way to school During school hours After school on way home
Not
%
Some-times
%
Usually
%
Not
%
Some-times
%
Usually
%
Not
%
Some-times
%
Usually
%
Not
%
Some-times
%
Usually
%
New Zealand children (5–14 years) 3.9 13.2 82.9 84.2 12.9 2.7 1.4 3.1 95.5 62.7 31.4 5.6
Males 5–6 0.8 5.7 93.4 87.7 9.1 3.0 2.5 2.0 95.6 64.2 27.3 8.3
7–10 2.2 10.1 87.7 84.2 13.7 2.1 1.9 1.8 96.0 62.0 34.5 2.7
11–14 3.7 15.1 81.3 82.5 14.0 3.2 1.2 4.3 94.5 63.7 29.5 6.8
Total 2.5 11.2 86.2 84.2 12.9 2.7 1.7 2.8 95.3 63.1 31.1 5.4
Females 5–6 2.1 7.1 90.6 88.8 9.6 1.1 1.0 0.8 98.2 58.4 32.4 9.0
7–10 3.3 12.4 84.3 83.5 14.0 2.5 1.6 2.5 95.8 60.9 34.3 4.9
11–14 8.7 22.2 69.1 82.6 13.6 3.7 0.6 5.3 94.1 65.7 28.8 5.2
Total 5.3 15.3 79.4 84.2 13.0 2.7 1.1 3.3 95.6 62.3 31.7 5.8
NZDep01 Males I 0.7 4.9 94.5 92.9 5.5 1.6 0.0 1.1 98.9 64.6 30.0 5.4
II 1.0 4.2 94.8 91.3 7.3 1.4 0.0 2.0 98.0 72.0 25.0 2.9
III 2.8 7.1 90.1 89.6 8.2 1.9 0.6 1.0 98.3 64.7 30.8 4.5
IV 2.1 11.7 86.2 84.9 12.4 2.7 4.3 1.7 94.1 61.8 32.2 5.7
V 5.4 25.4 69.1 70.1 25.3 4.5 2.4 5.6 91.1 54.1 37.4 7.0
Females I 3.3 6.5 90.3 96.1 3.9 0.0 1.7 0.2 98.1 67.0 29.6 3.4
II 4.2 10.4 85.5 92.8 7.0 0.2 0.0 2.7 97.3 70.3 24.9 4.8
III 3.0 14.3 82.7 86.9 11.5 1.7 0.0 4.4 95.6 72.4 25.3 2.3
IV 7.6 19.0 73.3 81.4 15.5 2.8 1.2 4.5 94.3 65.1 30.9 4.0
V 8.6 24.9 66.3 67.8 25.1 6.7 2.8 5.9 91.3 49.5 41.6 8.6
Males Urban 2.8 11.7 85.5 83.0 14.1 2.7 2.0 3.0 94.8 61.5 32.5 5.7 School type Rural 1.3 9.1 89.6 89.7 7.7 2.6 0.3 2.0 97.8 70.1 24.8 4.4
Females Urban 5.8 16.0 78.2 83.2 13.8 2.7 1.3 3.5 95.2 63.2 31.3 5.3
Rural 3.2 12.4 84.3 87.9 9.4 2.7 0.0 2.6 97.5 58.7 33.5 7.8
Mäori Males 5–6 1.3 11.2 87.5 81.3 13.8 4.2 1.3 1.9 96.8 47.5 36.3 15.6
7–10 3.4 15.7 80.9 74.6 21.5 3.9 1.1 2.0 97.0 52.8 39.4 7.0
11–14 5.2 33.9 60.8 69.1 24.8 6.1 0.5 8.7 90.7 52.3 36.5 11.2
Total 3.6 21.7 74.7 74.0 21.1 4.8 0.9 4.5 94.6 51.5 37.6 10.4
Females 5–6 3.2 8.2 87.8 77.3 19.7 1.5 1.5 1.5 97.0 50.2 34.4 14.7
7–10 7.0 22.6 70.4 73.8 20.9 5.3 1.0 2.8 96.2 51.8 42.1 6.2
11–14 16.4 33.7 49.9 65.8 20.8 12.8 0.0 10.4 89.6 47.2 43.5 8.0
Total 9.9 24.0 66.0 71.4 20.6 7.4 0.7 5.5 93.8 49.7 41.0 8.6
Pacific Males 5–6 5.5 23.8 70.7 63.9 28.4 7.8 6.4 7.5 86.1 47.6 38.4 14.0
7–10 10.0 36.1 53.9 60.8 32.0 6.3 5.2 8.7 85.2 52.1 42.6 5.3
11–14 11.9 45.1 43.0 52.5 41.0 6.5 2.3 7.4 90.4 44.6 45.6 9.3
Total 9.8 36.9 53.3 58.3 34.6 6.7 4.3 8.0 87.4 48.4 42.8 8.6
Females 5–6 5.1 29.5 65.5 73.5 17.6 8.1 6.8 4.8 88.4 48.6 46.0 5.4
7–10 9.0 36.2 54.8 58.6 31.9 9.0 4.8 5.7 89.2 47.5 43.4 9.1
11–14 21.8 41.4 36.8 53.7 35.9 9.8 1.2 10.6 88.2 49.2 39.3 11.6
Total 13.0 36.7 50.3 59.8 30.4 9.1 3.8 7.3 88.7 48.4 42.4 9.3
NZEO Males 5–6 0.0 1.1 98.9 93.5 4.7 1.9 2.4 1.2 96.4 73.1 22.2 4.7
7–10 0.9 4.8 94.4 90.6 8.6 0.9 1.7 0.9 97.0 66.6 31.7 0.9
11–14 2.2 5.5 92.2 90.2 7.4 2.0 1.2 2.5 96.3 69.5 25.4 5.1
Total 1.3 4.4 94.4 91.0 7.3 1.5 1.7 1.6 96.6 69.0 27.4 3.3
Females 5–6 1.3 3.6 95.2 95.4 4.6 0.0 0.0 0.0 100 63.0 29.7 7.3
7–10 1.4 5.8 92.8 90.0 9.3 0.7 1.4 2.0 96.6 65.7 30.4 3.9
11–14 4.6 16.2 79.2 91.4 8.6 0.0 0.7 3.0 96.3 73.8 22.7 3.6
Total 2.7 9.6 87.7 91.6 8.1 0.3 0.9 2.0 97.1 68.5 27.1 4.4
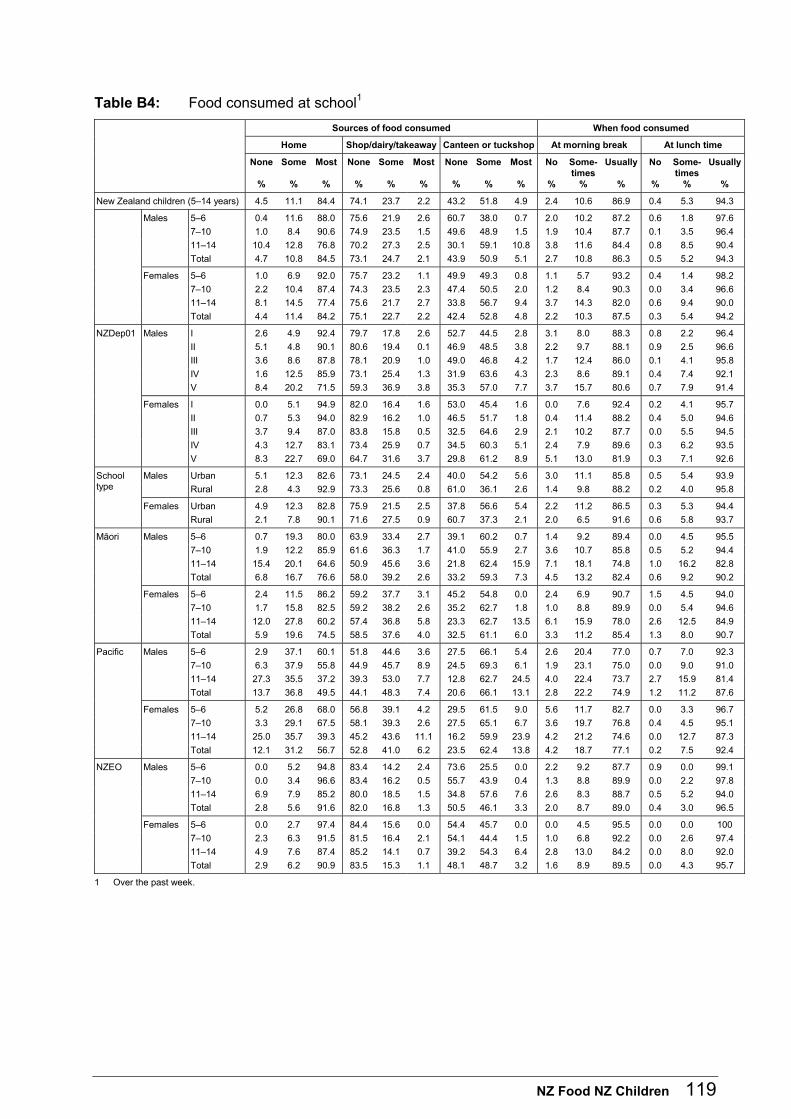
NZ Food NZ Children 119
Table B4: Food consumed at school1
Sources of food consumed When food consumed
Home Shop/dairy/takeaway Canteen or tuckshop At morning break At lunch time
None
%
Some
%
Most
%
None
%
Some
%
Most
%
None
%
Some
%
Most
%
No
%
Some-times
%
Usually
%
No
%
Some-times
%
Usually
%
New Zealand children (5–14 years) 4.5 11.1 84.4 74.1 23.7 2.2 43.2 51.8 4.9 2.4 10.6 86.9 0.4 5.3 94.3
Males 5–6 0.4 11.6 88.0 75.6 21.9 2.6 60.7 38.0 0.7 2.0 10.2 87.2 0.6 1.8 97.6
7–10 1.0 8.4 90.6 74.9 23.5 1.5 49.6 48.9 1.5 1.9 10.4 87.7 0.1 3.5 96.4
11–14 10.4 12.8 76.8 70.2 27.3 2.5 30.1 59.1 10.8 3.8 11.6 84.4 0.8 8.5 90.4
Total 4.7 10.8 84.5 73.1 24.7 2.1 43.9 50.9 5.1 2.7 10.8 86.3 0.5 5.2 94.3
Females 5–6 1.0 6.9 92.0 75.7 23.2 1.1 49.9 49.3 0.8 1.1 5.7 93.2 0.4 1.4 98.2
7–10 2.2 10.4 87.4 74.3 23.5 2.3 47.4 50.5 2.0 1.2 8.4 90.3 0.0 3.4 96.6
11–14 8.1 14.5 77.4 75.6 21.7 2.7 33.8 56.7 9.4 3.7 14.3 82.0 0.6 9.4 90.0
Total 4.4 11.4 84.2 75.1 22.7 2.2 42.4 52.8 4.8 2.2 10.3 87.5 0.3 5.4 94.2
NZDep01 Males I 2.6 4.9 92.4 79.7 17.8 2.6 52.7 44.5 2.8 3.1 8.0 88.3 0.8 2.2 96.4
II 5.1 4.8 90.1 80.6 19.4 0.1 46.9 48.5 3.8 2.2 9.7 88.1 0.9 2.5 96.6
III 3.6 8.6 87.8 78.1 20.9 1.0 49.0 46.8 4.2 1.7 12.4 86.0 0.1 4.1 95.8
IV 1.6 12.5 85.9 73.1 25.4 1.3 31.9 63.6 4.3 2.3 8.6 89.1 0.4 7.4 92.1
V 8.4 20.2 71.5 59.3 36.9 3.8 35.3 57.0 7.7 3.7 15.7 80.6 0.7 7.9 91.4
Females I 0.0 5.1 94.9 82.0 16.4 1.6 53.0 45.4 1.6 0.0 7.6 92.4 0.2 4.1 95.7
II 0.7 5.3 94.0 82.9 16.2 1.0 46.5 51.7 1.8 0.4 11.4 88.2 0.4 5.0 94.6
III 3.7 9.4 87.0 83.8 15.8 0.5 32.5 64.6 2.9 2.1 10.2 87.7 0.0 5.5 94.5
IV 4.3 12.7 83.1 73.4 25.9 0.7 34.5 60.3 5.1 2.4 7.9 89.6 0.3 6.2 93.5
V 8.3 22.7 69.0 64.7 31.6 3.7 29.8 61.2 8.9 5.1 13.0 81.9 0.3 7.1 92.6
Males Urban 5.1 12.3 82.6 73.1 24.5 2.4 40.0 54.2 5.6 3.0 11.1 85.8 0.5 5.4 93.9 School type Rural 2.8 4.3 92.9 73.3 25.6 0.8 61.0 36.1 2.6 1.4 9.8 88.2 0.2 4.0 95.8
Females Urban 4.9 12.3 82.8 75.9 21.5 2.5 37.8 56.6 5.4 2.2 11.2 86.5 0.3 5.3 94.4
Rural 2.1 7.8 90.1 71.6 27.5 0.9 60.7 37.3 2.1 2.0 6.5 91.6 0.6 5.8 93.7
Mäori Males 5–6 0.7 19.3 80.0 63.9 33.4 2.7 39.1 60.2 0.7 1.4 9.2 89.4 0.0 4.5 95.5
7–10 1.9 12.2 85.9 61.6 36.3 1.7 41.0 55.9 2.7 3.6 10.7 85.8 0.5 5.2 94.4
11–14 15.4 20.1 64.6 50.9 45.6 3.6 21.8 62.4 15.9 7.1 18.1 74.8 1.0 16.2 82.8
Total 6.8 16.7 76.6 58.0 39.2 2.6 33.2 59.3 7.3 4.5 13.2 82.4 0.6 9.2 90.2
Females 5–6 2.4 11.5 86.2 59.2 37.7 3.1 45.2 54.8 0.0 2.4 6.9 90.7 1.5 4.5 94.0
7–10 1.7 15.8 82.5 59.2 38.2 2.6 35.2 62.7 1.8 1.0 8.8 89.9 0.0 5.4 94.6
11–14 12.0 27.8 60.2 57.4 36.8 5.8 23.3 62.7 13.5 6.1 15.9 78.0 2.6 12.5 84.9
Total 5.9 19.6 74.5 58.5 37.6 4.0 32.5 61.1 6.0 3.3 11.2 85.4 1.3 8.0 90.7
Pacific Males 5–6 2.9 37.1 60.1 51.8 44.6 3.6 27.5 66.1 5.4 2.6 20.4 77.0 0.7 7.0 92.3
7–10 6.3 37.9 55.8 44.9 45.7 8.9 24.5 69.3 6.1 1.9 23.1 75.0 0.0 9.0 91.0
11–14 27.3 35.5 37.2 39.3 53.0 7.7 12.8 62.7 24.5 4.0 22.4 73.7 2.7 15.9 81.4
Total 13.7 36.8 49.5 44.1 48.3 7.4 20.6 66.1 13.1 2.8 22.2 74.9 1.2 11.2 87.6
Females 5–6 5.2 26.8 68.0 56.8 39.1 4.2 29.5 61.5 9.0 5.6 11.7 82.7 0.0 3.3 96.7
7–10 3.3 29.1 67.5 58.1 39.3 2.6 27.5 65.1 6.7 3.6 19.7 76.8 0.4 4.5 95.1
11–14 25.0 35.7 39.3 45.2 43.6 11.1 16.2 59.9 23.9 4.2 21.2 74.6 0.0 12.7 87.3
Total 12.1 31.2 56.7 52.8 41.0 6.2 23.5 62.4 13.8 4.2 18.7 77.1 0.2 7.5 92.4
NZEO Males 5–6 0.0 5.2 94.8 83.4 14.2 2.4 73.6 25.5 0.0 2.2 9.2 87.7 0.9 0.0 99.1
7–10 0.0 3.4 96.6 83.4 16.2 0.5 55.7 43.9 0.4 1.3 8.8 89.9 0.0 2.2 97.8
11–14 6.9 7.9 85.2 80.0 18.5 1.5 34.8 57.6 7.6 2.6 8.3 88.7 0.5 5.2 94.0
Total 2.8 5.6 91.6 82.0 16.8 1.3 50.5 46.1 3.3 2.0 8.7 89.0 0.4 3.0 96.5
Females 5–6 0.0 2.7 97.4 84.4 15.6 0.0 54.4 45.7 0.0 0.0 4.5 95.5 0.0 0.0 100
7–10 2.3 6.3 91.5 81.5 16.4 2.1 54.1 44.4 1.5 1.0 6.8 92.2 0.0 2.6 97.4
11–14 4.9 7.6 87.4 85.2 14.1 0.7 39.2 54.3 6.4 2.8 13.0 84.2 0.0 8.0 92.0
Total 2.9 6.2 90.9 83.5 15.3 1.1 48.1 48.7 3.2 1.6 8.9 89.5 0.0 4.3 95.7
1 Over the past week.
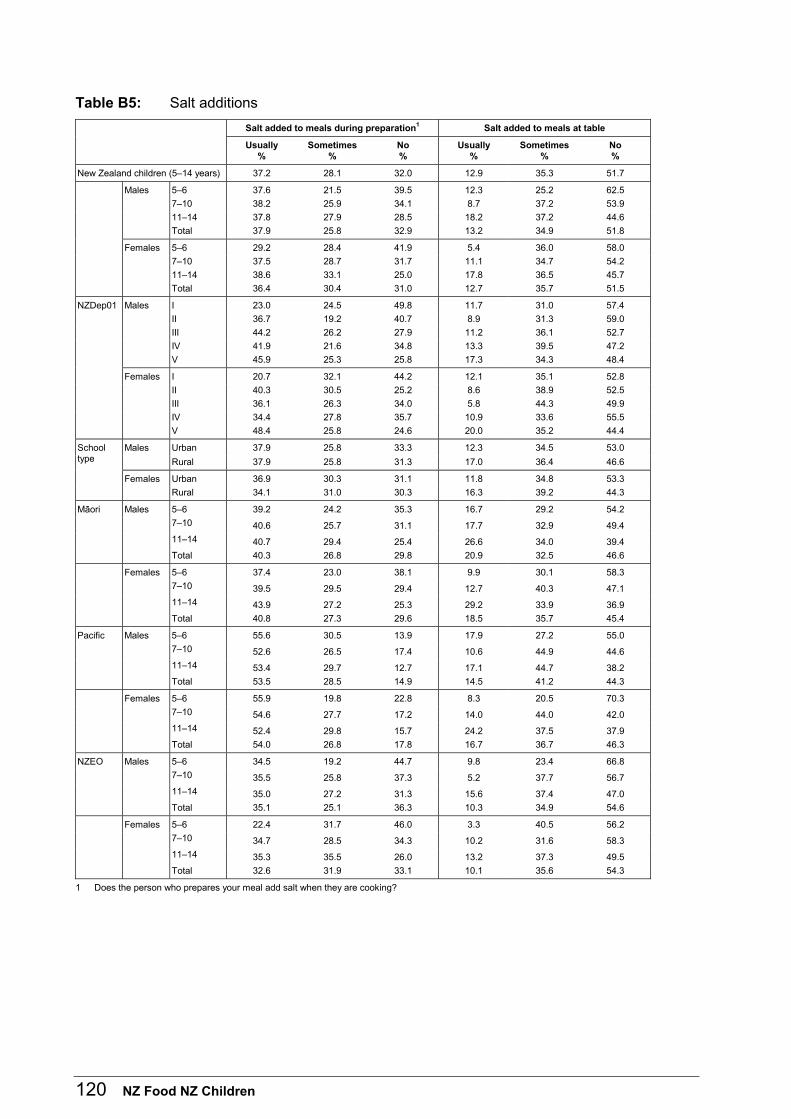
120 NZ Food NZ Children
Table B5: Salt additions
Salt added to meals during preparation1 Salt added to meals at table
Usually %
Sometimes %
No %
Usually %
Sometimes %
No %
New Zealand children (5–14 years) 37.2 28.1 32.0 12.9 35.3 51.7
Males 5–6 37.6 21.5 39.5 12.3 25.2 62.5
7–10 38.2 25.9 34.1 8.7 37.2 53.9
11–14 37.8 27.9 28.5 18.2 37.2 44.6
Total 37.9 25.8 32.9 13.2 34.9 51.8
Females 5–6 29.2 28.4 41.9 5.4 36.0 58.0
7–10 37.5 28.7 31.7 11.1 34.7 54.2
11–14 38.6 33.1 25.0 17.8 36.5 45.7
Total 36.4 30.4 31.0 12.7 35.7 51.5
NZDep01 Males I 23.0 24.5 49.8 11.7 31.0 57.4
II 36.7 19.2 40.7 8.9 31.3 59.0
III 44.2 26.2 27.9 11.2 36.1 52.7
IV 41.9 21.6 34.8 13.3 39.5 47.2
V 45.9 25.3 25.8 17.3 34.3 48.4
Females I 20.7 32.1 44.2 12.1 35.1 52.8
II 40.3 30.5 25.2 8.6 38.9 52.5
III 36.1 26.3 34.0 5.8 44.3 49.9
IV 34.4 27.8 35.7 10.9 33.6 55.5
V 48.4 25.8 24.6 20.0 35.2 44.4
Males Urban 37.9 25.8 33.3 12.3 34.5 53.0 School type Rural 37.9 25.8 31.3 17.0 36.4 46.6
Females Urban 36.9 30.3 31.1 11.8 34.8 53.3
Rural 34.1 31.0 30.3 16.3 39.2 44.3
Mäori Males 5–6 39.2 24.2 35.3 16.7 29.2 54.2
7–10 40.6 25.7 31.1 17.7 32.9 49.4
11–14 40.7 29.4 25.4 26.6 34.0 39.4
Total 40.3 26.8 29.8 20.9 32.5 46.6
Females 5–6 37.4 23.0 38.1 9.9 30.1 58.3
7–10 39.5 29.5 29.4 12.7 40.3 47.1
11–14 43.9 27.2 25.3 29.2 33.9 36.9
Total 40.8 27.3 29.6 18.5 35.7 45.4
Pacific Males 5–6 55.6 30.5 13.9 17.9 27.2 55.0
7–10 52.6 26.5 17.4 10.6 44.9 44.6
11–14 53.4 29.7 12.7 17.1 44.7 38.2
Total 53.5 28.5 14.9 14.5 41.2 44.3
Females 5–6 55.9 19.8 22.8 8.3 20.5 70.3
7–10 54.6 27.7 17.2 14.0 44.0 42.0
11–14 52.4 29.8 15.7 24.2 37.5 37.9
Total 54.0 26.8 17.8 16.7 36.7 46.3
NZEO Males 5–6 34.5 19.2 44.7 9.8 23.4 66.8
7–10 35.5 25.8 37.3 5.2 37.7 56.7
11–14 35.0 27.2 31.3 15.6 37.4 47.0
Total 35.1 25.1 36.3 10.3 34.9 54.6
Females 5–6 22.4 31.7 46.0 3.3 40.5 56.2
7–10 34.7 28.5 34.3 10.2 31.6 58.3
11–14 35.3 35.5 26.0 13.2 37.3 49.5
Total 32.6 31.9 33.1 10.1 35.6 54.3
1 Does the person who prepares your meal add salt when they are cooking?
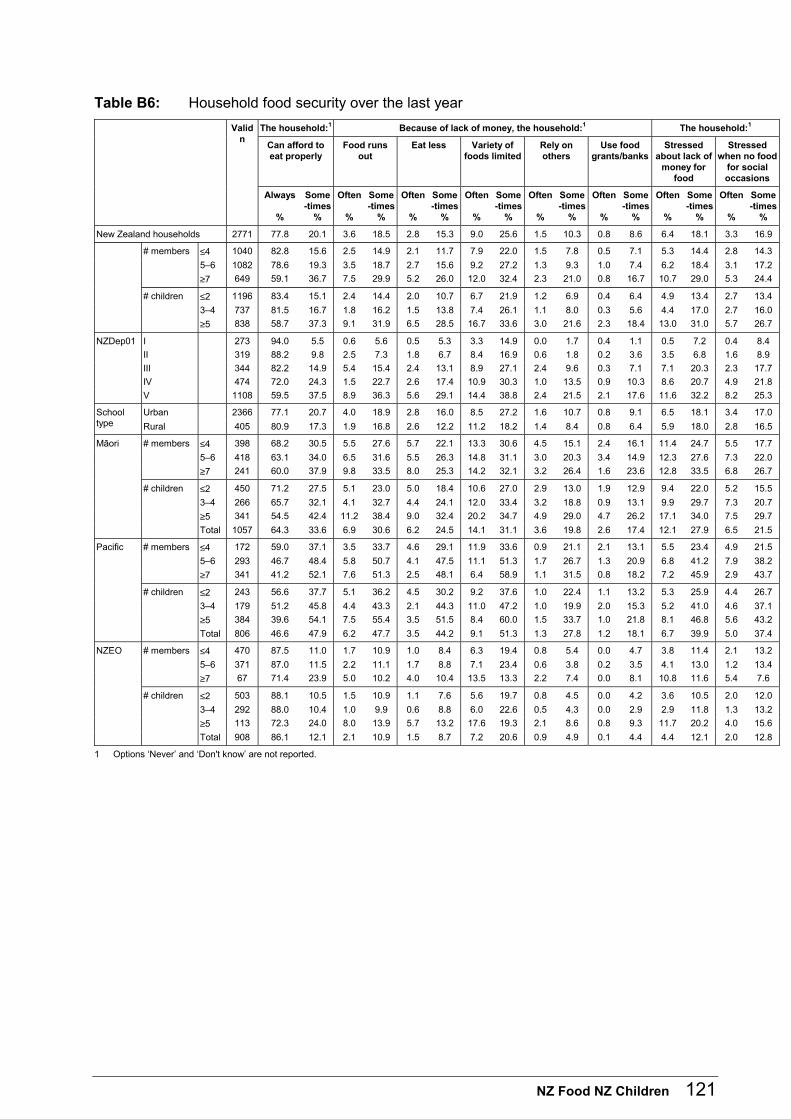
NZ Food NZ Children 121
Table B6: Household food security over the last year
The household:1 Because of lack of money, the household:1 The household:1
Can afford to eat properly
Food runs out
Eat less Variety of foods limited
Rely on others
Use food grants/banks
Stressed about lack of
money for food
Stressed when no food
for social occasions
Valid n
Always
%
Some-times
%
Often
%
Some-times
%
Often
%
Some-times
%
Often
%
Some-times
%
Often
%
Some-times
%
Often
%
Some-times
%
Often
%
Some-times
%
Often
%
Some-times
%
New Zealand households 2771 77.8 20.1 3.6 18.5 2.8 15.3 9.0 25.6 1.5 10.3 0.8 8.6 6.4 18.1 3.3 16.9
# members ≤4 1040 82.8 15.6 2.5 14.9 2.1 11.7 7.9 22.0 1.5 7.8 0.5 7.1 5.3 14.4 2.8 14.3
5–6 1082 78.6 19.3 3.5 18.7 2.7 15.6 9.2 27.2 1.3 9.3 1.0 7.4 6.2 18.4 3.1 17.2
≥7 649 59.1 36.7 7.5 29.9 5.2 26.0 12.0 32.4 2.3 21.0 0.8 16.7 10.7 29.0 5.3 24.4
# children ≤2 1196 83.4 15.1 2.4 14.4 2.0 10.7 6.7 21.9 1.2 6.9 0.4 6.4 4.9 13.4 2.7 13.4
3–4 737 81.5 16.7 1.8 16.2 1.5 13.8 7.4 26.1 1.1 8.0 0.3 5.6 4.4 17.0 2.7 16.0
≥5 838 58.7 37.3 9.1 31.9 6.5 28.5 16.7 33.6 3.0 21.6 2.3 18.4 13.0 31.0 5.7 26.7
NZDep01 I 273 94.0 5.5 0.6 5.6 0.5 5.3 3.3 14.9 0.0 1.7 0.4 1.1 0.5 7.2 0.4 8.4
II 319 88.2 9.8 2.5 7.3 1.8 6.7 8.4 16.9 0.6 1.8 0.2 3.6 3.5 6.8 1.6 8.9
III 344 82.2 14.9 5.4 15.4 2.4 13.1 8.9 27.1 2.4 9.6 0.3 7.1 7.1 20.3 2.3 17.7
IV 474 72.0 24.3 1.5 22.7 2.6 17.4 10.9 30.3 1.0 13.5 0.9 10.3 8.6 20.7 4.9 21.8
V 1108 59.5 37.5 8.9 36.3 5.6 29.1 14.4 38.8 2.4 21.5 2.1 17.6 11.6 32.2 8.2 25.3
Urban 2366 77.1 20.7 4.0 18.9 2.8 16.0 8.5 27.2 1.6 10.7 0.8 9.1 6.5 18.1 3.4 17.0 School type Rural 405 80.9 17.3 1.9 16.8 2.6 12.2 11.2 18.2 1.4 8.4 0.8 6.4 5.9 18.0 2.8 16.5
Mäori # members ≤4 398 68.2 30.5 5.5 27.6 5.7 22.1 13.3 30.6 4.5 15.1 2.4 16.1 11.4 24.7 5.5 17.7
5–6 418 63.1 34.0 6.5 31.6 5.5 26.3 14.8 31.1 3.0 20.3 3.4 14.9 12.3 27.6 7.3 22.0
≥7 241 60.0 37.9 9.8 33.5 8.0 25.3 14.2 32.1 3.2 26.4 1.6 23.6 12.8 33.5 6.8 26.7
# children ≤2 450 71.2 27.5 5.1 23.0 5.0 18.4 10.6 27.0 2.9 13.0 1.9 12.9 9.4 22.0 5.2 15.5
3–4 266 65.7 32.1 4.1 32.7 4.4 24.1 12.0 33.4 3.2 18.8 0.9 13.1 9.9 29.7 7.3 20.7
≥5 341 54.5 42.4 11.2 38.4 9.0 32.4 20.2 34.7 4.9 29.0 4.7 26.2 17.1 34.0 7.5 29.7
Total 1057 64.3 33.6 6.9 30.6 6.2 24.5 14.1 31.1 3.6 19.8 2.6 17.4 12.1 27.9 6.5 21.5
Pacific # members ≤4 172 59.0 37.1 3.5 33.7 4.6 29.1 11.9 33.6 0.9 21.1 2.1 13.1 5.5 23.4 4.9 21.5
5–6 293 46.7 48.4 5.8 50.7 4.1 47.5 11.1 51.3 1.7 26.7 1.3 20.9 6.8 41.2 7.9 38.2
≥7 341 41.2 52.1 7.6 51.3 2.5 48.1 6.4 58.9 1.1 31.5 0.8 18.2 7.2 45.9 2.9 43.7
# children ≤2 243 56.6 37.7 5.1 36.2 4.5 30.2 9.2 37.6 1.0 22.4 1.1 13.2 5.3 25.9 4.4 26.7
3–4 179 51.2 45.8 4.4 43.3 2.1 44.3 11.0 47.2 1.0 19.9 2.0 15.3 5.2 41.0 4.6 37.1
≥5 384 39.6 54.1 7.5 55.4 3.5 51.5 8.4 60.0 1.5 33.7 1.0 21.8 8.1 46.8 5.6 43.2
Total 806 46.6 47.9 6.2 47.7 3.5 44.2 9.1 51.3 1.3 27.8 1.2 18.1 6.7 39.9 5.0 37.4
NZEO # members ≤4 470 87.5 11.0 1.7 10.9 1.0 8.4 6.3 19.4 0.8 5.4 0.0 4.7 3.8 11.4 2.1 13.2
5–6 371 87.0 11.5 2.2 11.1 1.7 8.8 7.1 23.4 0.6 3.8 0.2 3.5 4.1 13.0 1.2 13.4
≥7 67 71.4 23.9 5.0 10.2 4.0 10.4 13.5 13.3 2.2 7.4 0.0 8.1 10.8 11.6 5.4 7.6
# children ≤2 503 88.1 10.5 1.5 10.9 1.1 7.6 5.6 19.7 0.8 4.5 0.0 4.2 3.6 10.5 2.0 12.0
3–4 292 88.0 10.4 1.0 9.9 0.6 8.8 6.0 22.6 0.5 4.3 0.0 2.9 2.9 11.8 1.3 13.2
≥5 113 72.3 24.0 8.0 13.9 5.7 13.2 17.6 19.3 2.1 8.6 0.8 9.3 11.7 20.2 4.0 15.6
Total 908 86.1 12.1 2.1 10.9 1.5 8.7 7.2 20.6 0.9 4.9 0.1 4.4 4.4 12.1 2.0 12.8
1 Options ‘Never’ and ‘Don't know’ are not reported.
122 NZ Food NZ Children
C. Frequently Eaten Foods
Introduction Data on usual frequency of intake of commonly eaten foods over the four-week period before interview were derived from a qualitative food frequency questionnaire (FFQ). Foods were grouped in the FFQ as follows: Fruit; Vegetables; Mixed dishes; Eggs, meat, poultry and fish; Pies, burgers, sausage-meats; Bread and cereals; Spreads, sauces; Convenience meals/snacks; Dairy (excluding milk); Biscuits/cakes; Snacks and sweets; Milks; and Other (non-milk) drinks. In this section, weekly consumption of a food or group of foods applies to children who ate that food weekly or more often; that is all who ate the food 1–2 times a week, 3–4 times a week, 5–6 times a week, once a day and 2 or more times a day.
Key points
Fruit
• About two out of five New Zealand children ate fruit at least twice a day.
• Older children (11–14 years) ate fruit less frequently than younger children (5–6 years).
Vegetables
• About three out of five New Zealand children ate vegetables three or more times a day.
• Compared with other groups NZEO children were most likely to eat Carrots and Broccoli at least once a week; Mäori children, Silverbeet, spinach, puha or watercress; and Pacific children, Taro, Cooked green banana, Cassava and Tomatoes.
Meat, fish, poultry and eggs
• Chicken was the most commonly eaten among these foods.
• Children in NZDep01-V had a higher frequency of consumption of meat, fish, poultry and eggs than NZDep01-I children.
Mixed dishes and convenience meals/snacks
• Mixed dishes most commonly eaten were Pasta with meat and tomato sauce and Chinese type dishes, both eaten weekly by about half of New Zealand children.
• Noodles were the most commonly eaten convenience meal/snack, eaten weekly by about half of New Zealand children.
NZ Food NZ Children 123
Bread
• White bread was the most common bread type eaten by New Zealand children (79 percent).
• Margarine or margarine blend was more frequently spread on bread by New Zealand children (about half) than Butter (one in five).
Breakfast cereal and rice
• Forty percent of New Zealand children ate breakfast cereal at least once a day. Daily consumption of breakfast cereal was higher among Mäori and NZEO children than among Pacific children.
• The most frequently eaten breakfast cereal, chosen weekly, was Weetbix type (62 percent) followed by Cornflakes type (50 percent).
• Pacific children were more likely to eat Rice weekly than Mäori and NZEO children.
Spreads and sauces
• About half of New Zealand children used Jam or honey, Marmite or vegemite and Peanut butter weekly. Eighty percent of New Zealand children consumed Tomato sauce or ketchup weekly.
• Weekly consumption of sweet spreads (Jam or honey and Nutella) declined with increasing age, but weekly consumption of Mayonnaise or salad dressing increased with age.
Biscuits/cakes
• Biscuits (plain, chocolate chip, semi-sweet, gingernut, shortbread) were eaten by about 80 percent of New Zealand children weekly.
Snacks, sweets and dairy (excluding milk)
• Chocolate (eg, Moro bar) was eaten weekly by a higher proportion of children 11–14 years than by younger children.
• Dairy items eaten weekly, were Cheese (68 percent), Ice-cream (64 percent) and Yoghurt or dairy food (64 percent).
• Potato crisps, corn snacks or chips were consumed weekly by 83 percent of New Zealand children.
124 NZ Food NZ Children
Milks
• Thirty-eight percent of New Zealand children reported drinking Milk (not flavoured) daily, 34 percent weekly, and 17 percent drank Milk less than monthly or never.
• The type of milk most frequently consumed by New Zealand children was Standard milk (74 percent); the least frequently consumed was Soy (2 percent).
• The proportion of NZEO and Mäori children drinking Milk was higher than Pacific children.
Other drinks
• Powdered fruit drink (eg, Raro and Refresh) was the most popular non-milk drink among New Zealand children.
• Pacific and Mäori children were more likely than NZEO children to drink, weekly, Powdered fruit drink, Coca Cola or other cola drinks, Mountain Dew, ‘New Age’ drinks, Soft drinks, Tea and Coffee.
Fats put on cooked vegetables and fats used to cook meat, poultry or fish
• Thirty-five percent of New Zealand children added Butter or margarine to their cooked vegetables weekly.
• Mäori and Pacific children were more likely than NZEO children to use Margarine to cook meat, poultry or fish, but less likely to use Olive oil.
NZ Food NZ Children 125
C1 Fruit Table C1
New Zealand children
Forty-three percent of New Zealand children ate fruit at least twice a day. Apples or pears were the most commonly consumed fruit group, eaten weekly by 83 percent of New Zealand children. The next most frequently consumed fruits eaten weekly were Oranges or mandarins (67 percent) and Bananas (63 percent). With one exception, the consumption of fruit by males and females was similar. A lower proportion of males (64 percent) consumed Oranges or mandarins weekly than females (71 percent). Older children ate fruit less frequently than younger children (Figure C-1). Children 11–14 years consumed fruit at least twice a day (males 39 percent; females 36 percent) compared with children 5–6 years (46 percent; 55 percent). Older children ate Bananas, Apples or pears and Dried fruit less frequently.
Urban-rural
A higher proportion of rural children (males 48 percent; females 45 percent) than urban (37 percent; 38 percent) ate Canned or cooked fruit weekly.
Ethnic
A higher proportion of Pacific children (males 51 percent; females 50 percent) ate fruit at least twice a day than Mäori (40 percent; 43 percent) and NZEO children (41 percent; 44 percent). The proportion eating Bananas weekly was higher for Pacific than for Mäori and NZEO females. A higher proportion of Pacific and Mäori males ate Bananas weekly than NZEO males (Figure C-2). A higher proportion of NZEO females ate Kiwifruit weekly than Mäori females. Similarly, a higher proportion of Pacific and NZEO males ate Kiwifruit weekly than Mäori males. A higher proportion of Mäori children ate Canned or cooked fruit weekly than NZEO children.
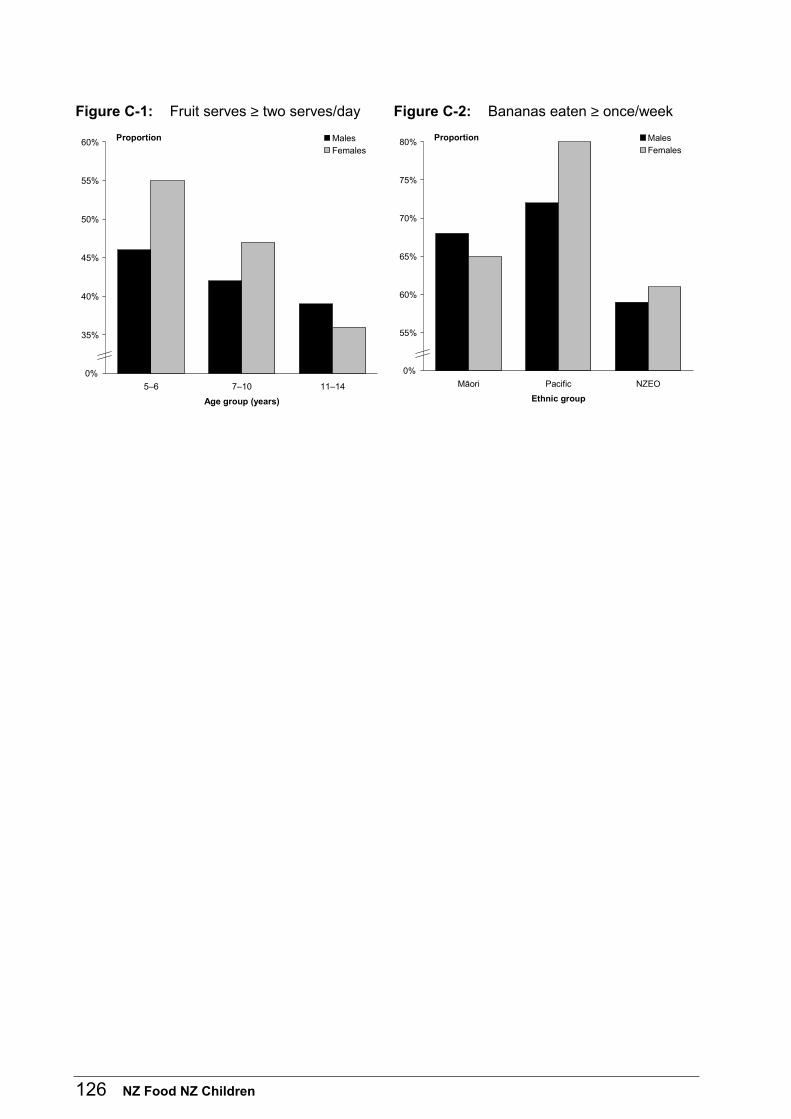
126 NZ Food NZ Children
Figure C-1: Fruit serves ≥ two serves/day Figure C-2: Bananas eaten ≥ once/week
30%
35%
40%
45%
50%
55%
60%
5–6 7–10 11–14
Age group (years)
Proportion Males
Females
0% 50%
55%
60%
65%
70%
75%
80%
Mäori Pacific NZEO
Ethnic group
Proportion Males
Females
0%
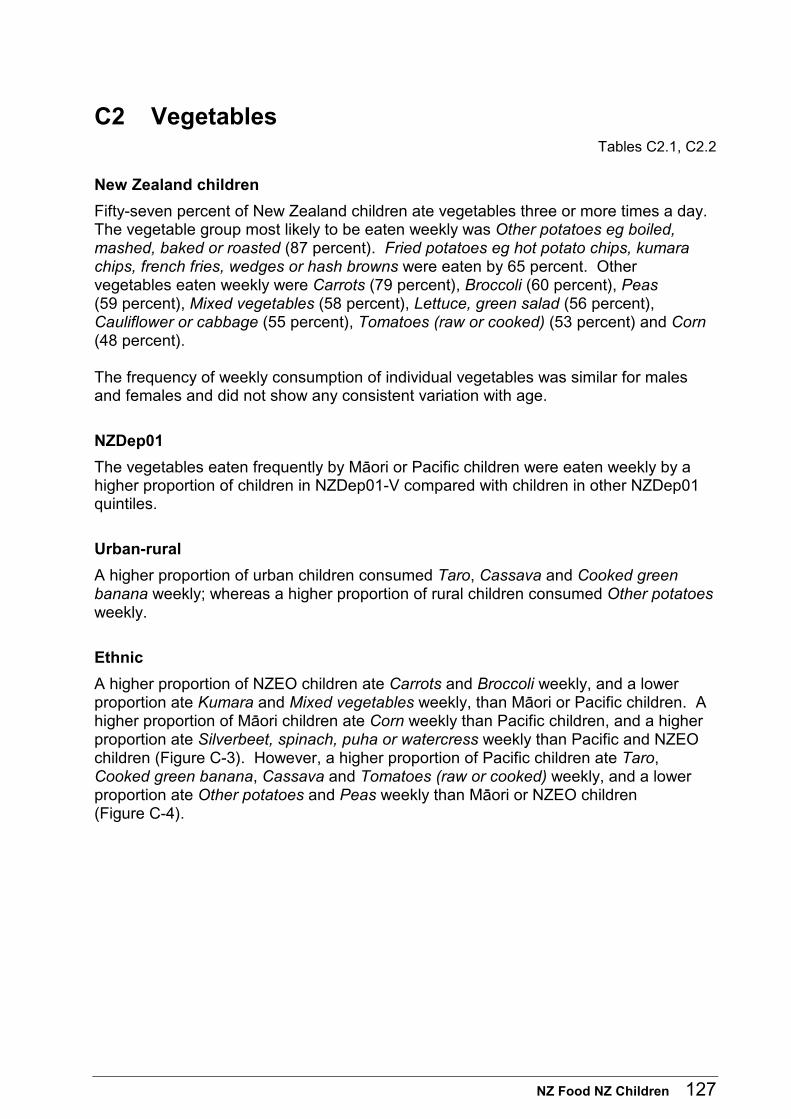
NZ Food NZ Children 127
C2 Vegetables Tables C2.1, C2.2
New Zealand children
Fifty-seven percent of New Zealand children ate vegetables three or more times a day. The vegetable group most likely to be eaten weekly was Other potatoes eg boiled, mashed, baked or roasted (87 percent). Fried potatoes eg hot potato chips, kumara chips, french fries, wedges or hash browns were eaten by 65 percent. Other vegetables eaten weekly were Carrots (79 percent), Broccoli (60 percent), Peas (59 percent), Mixed vegetables (58 percent), Lettuce, green salad (56 percent), Cauliflower or cabbage (55 percent), Tomatoes (raw or cooked) (53 percent) and Corn (48 percent). The frequency of weekly consumption of individual vegetables was similar for males and females and did not show any consistent variation with age.
NZDep01
The vegetables eaten frequently by Mäori or Pacific children were eaten weekly by a higher proportion of children in NZDep01-V compared with children in other NZDep01 quintiles.
Urban-rural
A higher proportion of urban children consumed Taro, Cassava and Cooked green banana weekly; whereas a higher proportion of rural children consumed Other potatoes weekly.
Ethnic
A higher proportion of NZEO children ate Carrots and Broccoli weekly, and a lower proportion ate Kumara and Mixed vegetables weekly, than Mäori or Pacific children. A higher proportion of Mäori children ate Corn weekly than Pacific children, and a higher proportion ate Silverbeet, spinach, puha or watercress weekly than Pacific and NZEO children (Figure C-3). However, a higher proportion of Pacific children ate Taro, Cooked green banana, Cassava and Tomatoes (raw or cooked) weekly, and a lower proportion ate Other potatoes and Peas weekly than Mäori or NZEO children (Figure C-4).
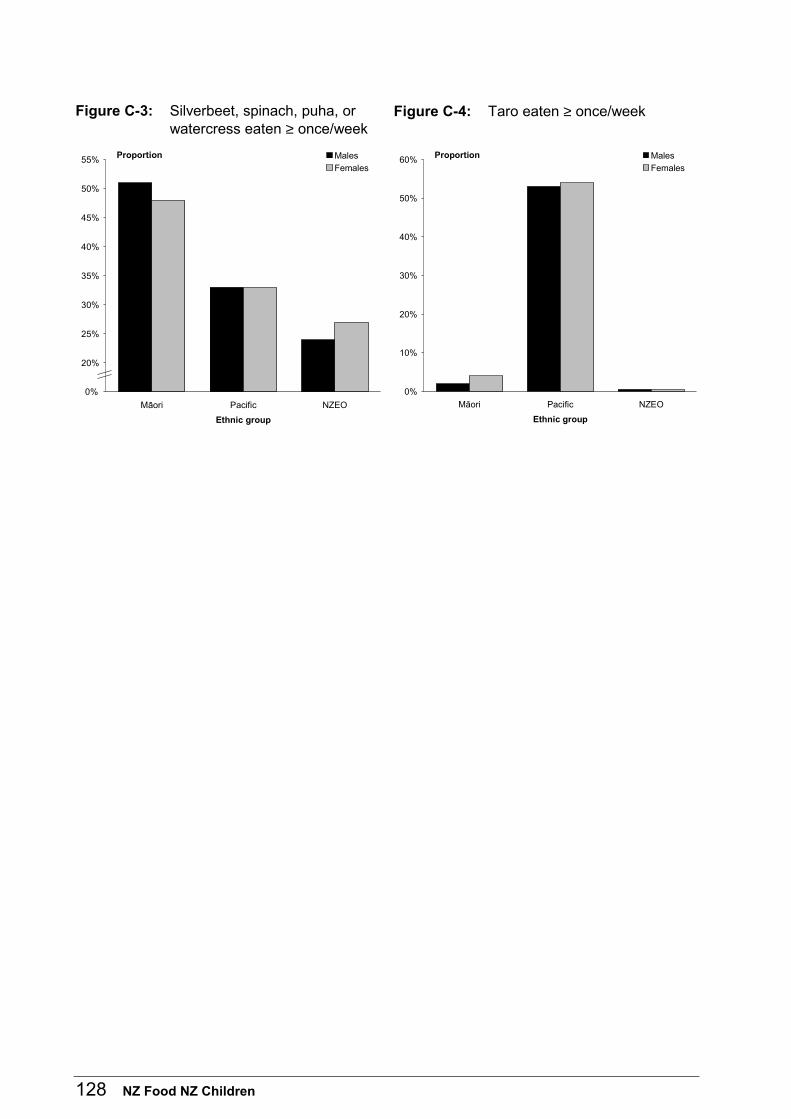
128 NZ Food NZ Children
Figure C-3: Silverbeet, spinach, puha, or watercress eaten ≥ once/week
Figure C-4: Taro eaten ≥ once/week
15%
20%
25%
30%
35%
40%
45%
50%
55%
Mäori Pacific NZEO
Ethnic group
Proportion Males
Females
0% 0%
10%
20%
30%
40%
50%
60%
Mäori Pacific NZEO
Ethnic group
Proportion Males
Females
NZ Food NZ Children 129
C3 Meat, fish, poultry and eggs Tables C3.1, C3.2
This section describes foods eaten in two FFQ sections: Eggs, meat, poultry and fish and Pies, burgers, sausage-meats.
New Zealand children
Chicken (83 percent), Eggs (62 percent), Mince (54 percent) Luncheon, ham and chicken (48 percent), Sausages (45 percent), Bacon or ham (43 percent), Fish (37 percent), Roast beef, lamb or pork (36 percent), Meat pie (36 percent), Steak (34 percent), and Lamb or mutton chops (26 percent) were the most common foods in this group consumed weekly by New Zealand children. There were no consistent differences in the proportions of males and females that ate foods in the meat, fish, poultry and eggs group weekly. The proportion of New Zealand children consuming these foods weekly did not vary with age in any consistent pattern.
NZDep01
A higher proportion of children in NZDep01-V consumed foods from this group two or more times a day (males 68 percent; females 68 percent) than NZDep01-I children (44 percent; 36 percent) (Figure C-5). Compared with NZDep01-I to IV, a higher proportion of children in NZDep01-V consumed the following foods weekly: Lamb or mutton chops, Canned corned beef, Fish cake, fish fingers or fish pie, Shell fish (eg mussel, paua or crabmeat), Meat pie, Burgers, Sausages (all types) and Sausage rolls.
Urban-rural
A higher proportion of urban children ate Burgers at least weekly (males 22 percent; females 22 percent) than rural children (13 percent; 9 percent).
Ethnic
A higher proportion of Pacific children ate foods in this group two or more times a day (males 81 percent; females 79 percent) than Mäori (64 percent; 61 percent) and NZEO children (48 percent; 39 percent) (Figure C-6). All items in this group, except Steak, were more likely to be eaten weekly by Pacific and Mäori children than NZEO children.
130 NZ Food NZ Children
Figure C-5: Meat, fish, poultry or eggs eaten ≥ twice/day (NZDep01)
Figure C-6: Meat, fish, poultry or eggs eaten ≥ twice/day (ethnic)
10%
20%
30%
40%
50%
60%
70%
I II III IV V
NZDep01 quintile
Proportion Males
Females
0% 0%
10%
20%
30%
40%
50%
60%
70%
80%
90%
Mäori Pacific NZEO
Ethnic group
Proportion Males
Females
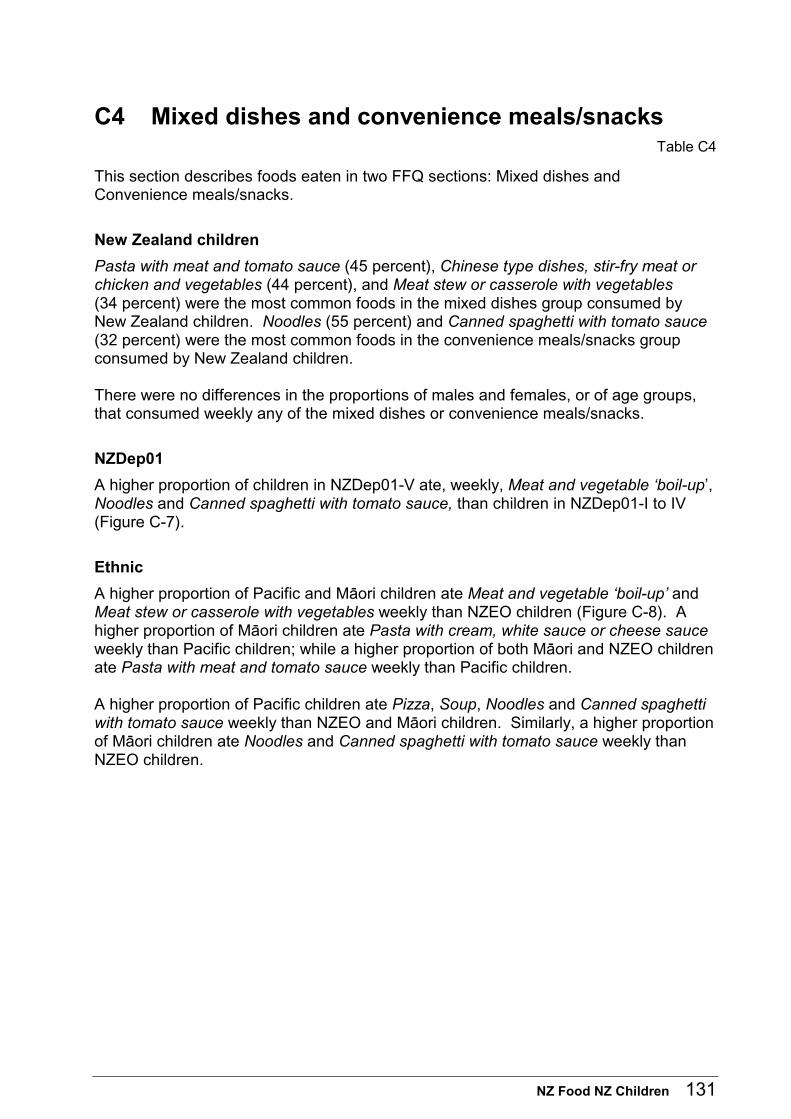
NZ Food NZ Children 131
C4 Mixed dishes and convenience meals/snacks Table C4
This section describes foods eaten in two FFQ sections: Mixed dishes and Convenience meals/snacks.
New Zealand children
Pasta with meat and tomato sauce (45 percent), Chinese type dishes, stir-fry meat or chicken and vegetables (44 percent), and Meat stew or casserole with vegetables (34 percent) were the most common foods in the mixed dishes group consumed by New Zealand children. Noodles (55 percent) and Canned spaghetti with tomato sauce (32 percent) were the most common foods in the convenience meals/snacks group consumed by New Zealand children. There were no differences in the proportions of males and females, or of age groups, that consumed weekly any of the mixed dishes or convenience meals/snacks.
NZDep01
A higher proportion of children in NZDep01-V ate, weekly, Meat and vegetable ‘boil-up’, Noodles and Canned spaghetti with tomato sauce, than children in NZDep01-I to IV (Figure C-7).
Ethnic
A higher proportion of Pacific and Mäori children ate Meat and vegetable ‘boil-up’ and Meat stew or casserole with vegetables weekly than NZEO children (Figure C-8). A higher proportion of Mäori children ate Pasta with cream, white sauce or cheese sauce weekly than Pacific children; while a higher proportion of both Mäori and NZEO children ate Pasta with meat and tomato sauce weekly than Pacific children. A higher proportion of Pacific children ate Pizza, Soup, Noodles and Canned spaghetti with tomato sauce weekly than NZEO and Mäori children. Similarly, a higher proportion of Mäori children ate Noodles and Canned spaghetti with tomato sauce weekly than NZEO children.
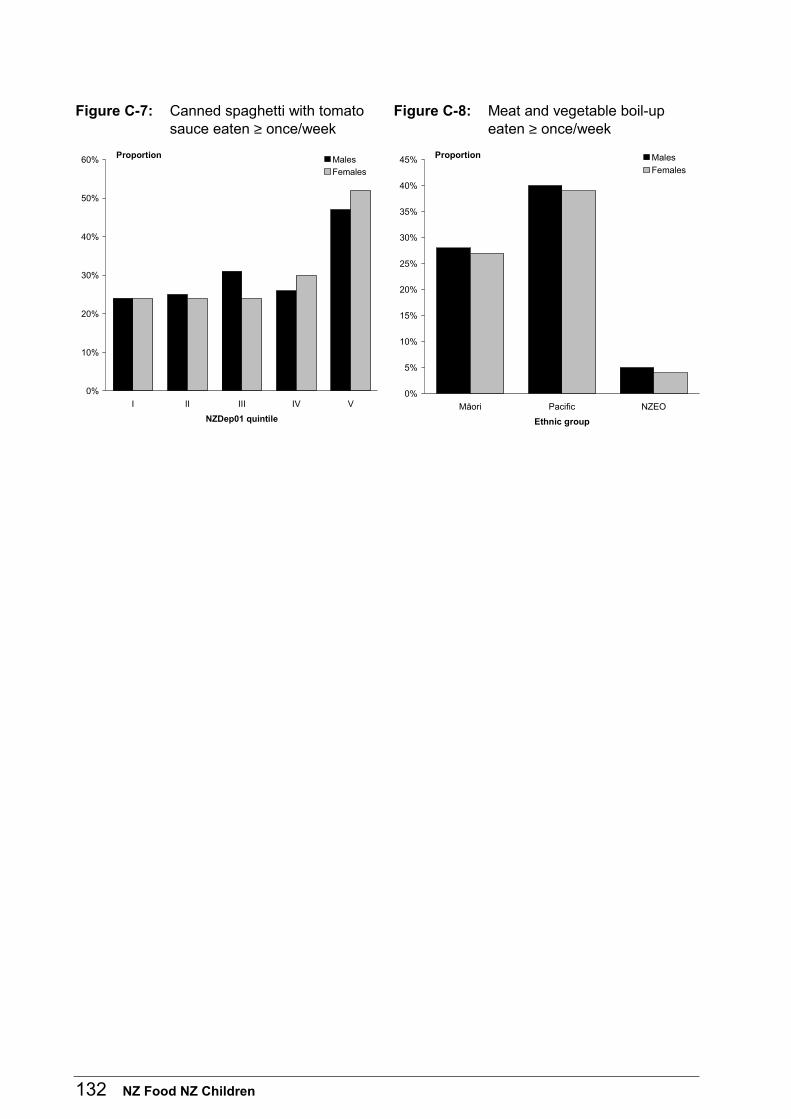
132 NZ Food NZ Children
Figure C-7: Canned spaghetti with tomato sauce eaten ≥ once/week
Figure C-8: Meat and vegetable boil-up eaten ≥ once/week
0%
10%
20%
30%
40%
50%
60%
I II III IV V
NZDep01 quintile
Proportion Males
Females
0%
5%
10%
15%
20%
25%
30%
35%
40%
45%
Mäori Pacific NZEO
Ethnic group
Proportion Males
Females
NZ Food NZ Children 133
C5 Bread Table C5
Frequency of bread intake
Forty-three percent of New Zealand children reported eating bread two or more times a day, 28 percent once per day, and 29 percent less than once a day. The frequency of bread consumption was the same for males and females and did not vary by age. A higher proportion of Mäori and NZEO children ate bread daily or more often than Pacific children.
Type of bread usually eaten
White was the type of bread usually eaten by New Zealand children (79 percent), while 15 percent ate Whole-meal and 13 percent Mixed-grain. The type of bread usually eaten did not vary between males and females, or consistently by age. White bread was most likely to be usually eaten by Pacific children, and least likely to be usually eaten by NZEO children. On the other hand, Mixed grain was most likely to be usually eaten by NZEO children and least likely to be usually eaten by Pacific children (Figure C-9).
Use of butter and margarine or margarine blend on bread
Margarine or margarine blend was the most common spread on bread (used most of the time) by 52 percent of New Zealand children. Butter was used most of the time by 21 percent. Fourteen percent reported they rarely or never used either Butter or Margarine or margarine blend. Females were more likely than males to use (most of the time) Margarine or margarine blend, but their use of Butter was the same. Use of Butter and Margarine or margarine blend was similar for all age groups. Children in NZDep01-V were more likely to use Butter than NZDep01-I children (Figure C-10). A higher proportion of Mäori and Pacific children mostly used Butter than NZEO children. The proportion using mostly Margarine or margarine blend did not vary by ethnicity.
Type of margarine
Polyunsaturated margarine was the most common type of margarine usually used by New Zealand children (58 percent). Eleven percent reported usually using Canola margarine, Olive oil margarine (22 percent) and Blend of butter and margarine (7 percent). There were no differences in the type of margarine used by males and females and across age groups. Children in NZDep01-I were less likely to use Polyunsaturated margarine, and more likely to use Olive oil margarine than NZDep01-V children. NZEO children were more likely to report use of Olive oil margarine than Mäori or Pacific children.
134 NZ Food NZ Children
Figure C-9: Type of bread (males) Figure C-10: Butter on bread most of the time
0%
10%
20%
30%
40%
50%
60%
70%
80%
90%
100%
Mäori Pacific NZEO
Ethnic group
Proportion White
Wholemeal
Mixed grain
0%
5%
10%
15%
20%
25%
30%
35%
I II III IV V
NZDep01 quintile
Proportion Males
Females
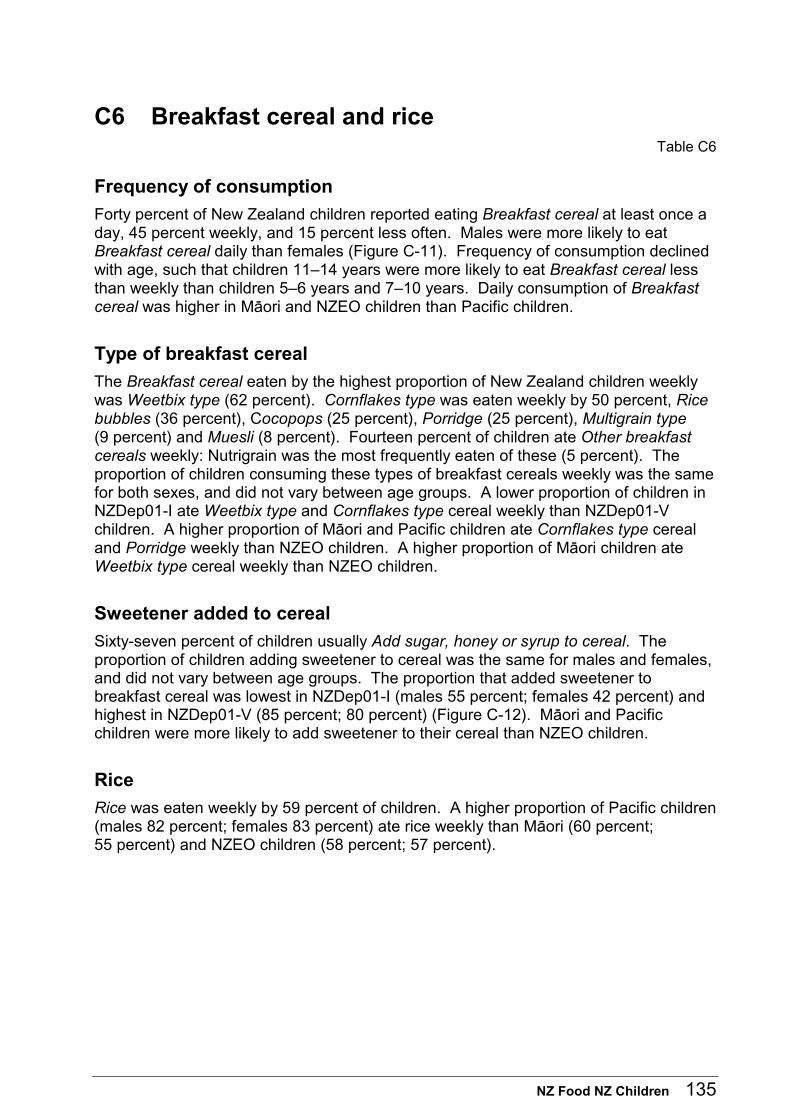
NZ Food NZ Children 135
C6 Breakfast cereal and rice Table C6
Frequency of consumption
Forty percent of New Zealand children reported eating Breakfast cereal at least once a day, 45 percent weekly, and 15 percent less often. Males were more likely to eat Breakfast cereal daily than females (Figure C-11). Frequency of consumption declined with age, such that children 11–14 years were more likely to eat Breakfast cereal less than weekly than children 5–6 years and 7–10 years. Daily consumption of Breakfast cereal was higher in Mäori and NZEO children than Pacific children.
Type of breakfast cereal
The Breakfast cereal eaten by the highest proportion of New Zealand children weekly was Weetbix type (62 percent). Cornflakes type was eaten weekly by 50 percent, Rice bubbles (36 percent), Cocopops (25 percent), Porridge (25 percent), Multigrain type (9 percent) and Muesli (8 percent). Fourteen percent of children ate Other breakfast cereals weekly: Nutrigrain was the most frequently eaten of these (5 percent). The proportion of children consuming these types of breakfast cereals weekly was the same for both sexes, and did not vary between age groups. A lower proportion of children in NZDep01-I ate Weetbix type and Cornflakes type cereal weekly than NZDep01-V children. A higher proportion of Mäori and Pacific children ate Cornflakes type cereal and Porridge weekly than NZEO children. A higher proportion of Mäori children ate Weetbix type cereal weekly than NZEO children.
Sweetener added to cereal
Sixty-seven percent of children usually Add sugar, honey or syrup to cereal. The proportion of children adding sweetener to cereal was the same for males and females, and did not vary between age groups. The proportion that added sweetener to breakfast cereal was lowest in NZDep01-I (males 55 percent; females 42 percent) and highest in NZDep01-V (85 percent; 80 percent) (Figure C-12). Mäori and Pacific children were more likely to add sweetener to their cereal than NZEO children.
Rice
Rice was eaten weekly by 59 percent of children. A higher proportion of Pacific children (males 82 percent; females 83 percent) ate rice weekly than Mäori (60 percent; 55 percent) and NZEO children (58 percent; 57 percent).
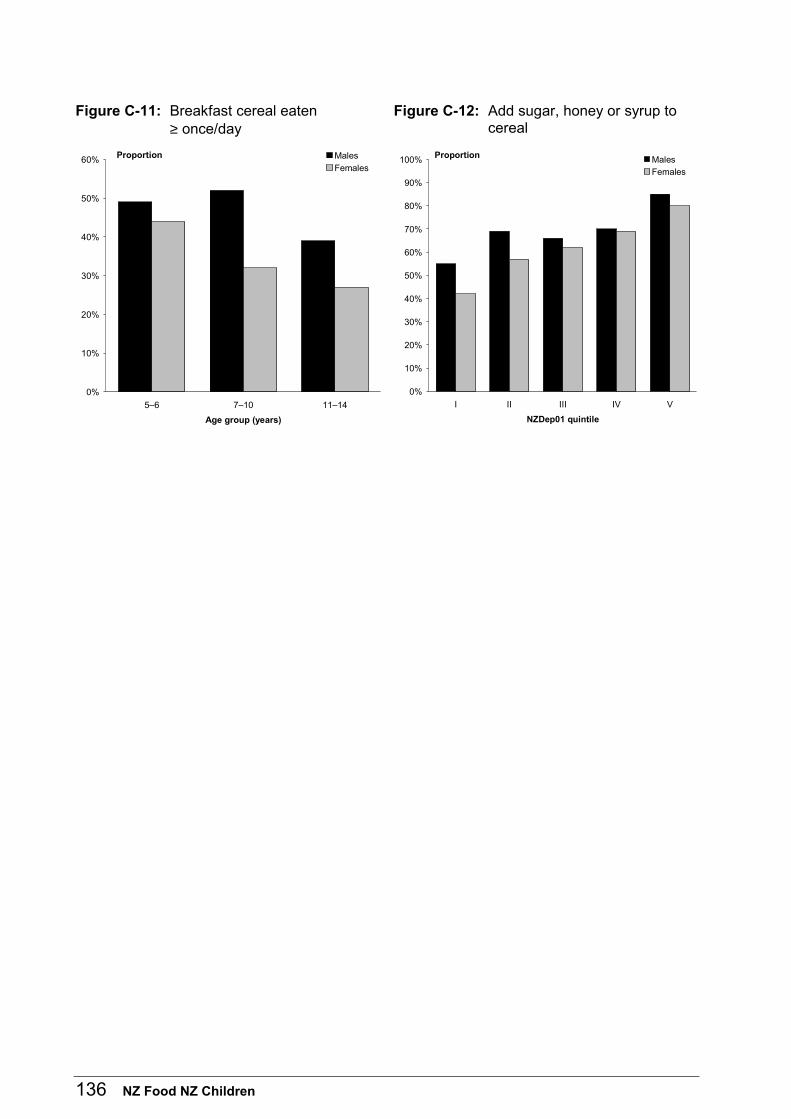
136 NZ Food NZ Children
Figure C-11: Breakfast cereal eaten ≥ once/day
Figure C-12: Add sugar, honey or syrup to cereal
0%
10%
20%
30%
40%
50%
60%
5–6 7–10 11–14
Age group (years)
Proportion Males
Females
0%
10%
20%
30%
40%
50%
60%
70%
80%
90%
100%
I II III IV V
NZDep01 quintile
Proportion Males
Females
NZ Food NZ Children 137
C7 Spreads, sauces Table C7
New Zealand children
The main spreads and sauces consumed weekly by New Zealand children were Jam or honey (53 percent), Peanut butter (49 percent), Marmite or vegemite (47 percent), Nutella (30 percent), Mayonnaise or salad dressing (29 percent), Tomato sauce or ketchup (80 percent) and Gravy (37 percent) (Figures C-13, C-14). The proportion of children consuming spreads or sauces weekly was the same for both sexes with one exception: a higher proportion of females than males consumed Marmite or vegemite. The proportion consuming Jam or honey and Nutella weekly declined with age, whereas weekly consumption of Mayonnaise or salad dressing was higher in older age groups.
Ethnic
A higher proportion of Mäori children ate Jam or honey and Peanut butter weekly than NZEO children. Similarly, a higher proportion of Pacific children, than Mäori or NZEO children, reported eating Nutella weekly. A higher proportion of Pacific children reported eating Mayonnaise or salad dressing weekly than NZEO children. A higher proportion of NZEO females ate Marmite or vegemite than other sex or ethnic categories.
Figure C-13: Spreads eaten ≥ once/week Figure C-14: Sauces eaten ≥ once/week
0%
10%
20%
30%
40%
50%
60%
70%
80%
Jam or honey Nutella Marmite orvegemite
Peanut butter
Spread
Proportion Males
Females
0%
10%
20%
30%
40%
50%
60%
70%
80%
90%
Tomato sauce orketchup
Gravy Mayonnaise or saladdressing
Sauces
Proportion Males
Females
138 NZ Food NZ Children
C8 Biscuits/cakes Table C8
New Zealand children
Biscuits (plain, chocolate chip, semi-sweet, gingernut, shortbread) were consumed weekly by 78 percent of New Zealand children. Other foods commonly eaten weekly in this group were Crackers or crispbreads (52 percent), Bars (51 percent), Chocolate-coated or cream filled biscuits (46 percent), Cake or slice (37 percent), Scones, muffins or sweet buns (27 percent), and Pancake or pikelets (15 percent). For all biscuits/cakes there were no differences between the proportions of males and females who consumed them weekly. The only group of foods for which weekly consumption was consistently related to age in both males and females was Crackers or crispbreads, with the proportion consuming these weekly being lower in older age groups (Figure C-15).
NZDep01
A higher proportion of children in NZDep01-I consumed Crackers or crispbreads, and a lower proportion consumed Doughnuts or croissants weekly than NZDep01-V children.
Ethnic
A higher proportion of Pacific children consumed, weekly, Chocolate coated or cream filled biscuits, Doughnuts or croissants, Scones, muffins or sweet buns and Pancake or pikelets than NZEO children (Figure C-16). A higher proportion of NZEO children consumed Bars weekly than Pacific children. A lower proportion of Mäori children consumed Crackers or crispbreads weekly than Pacific and NZEO children.
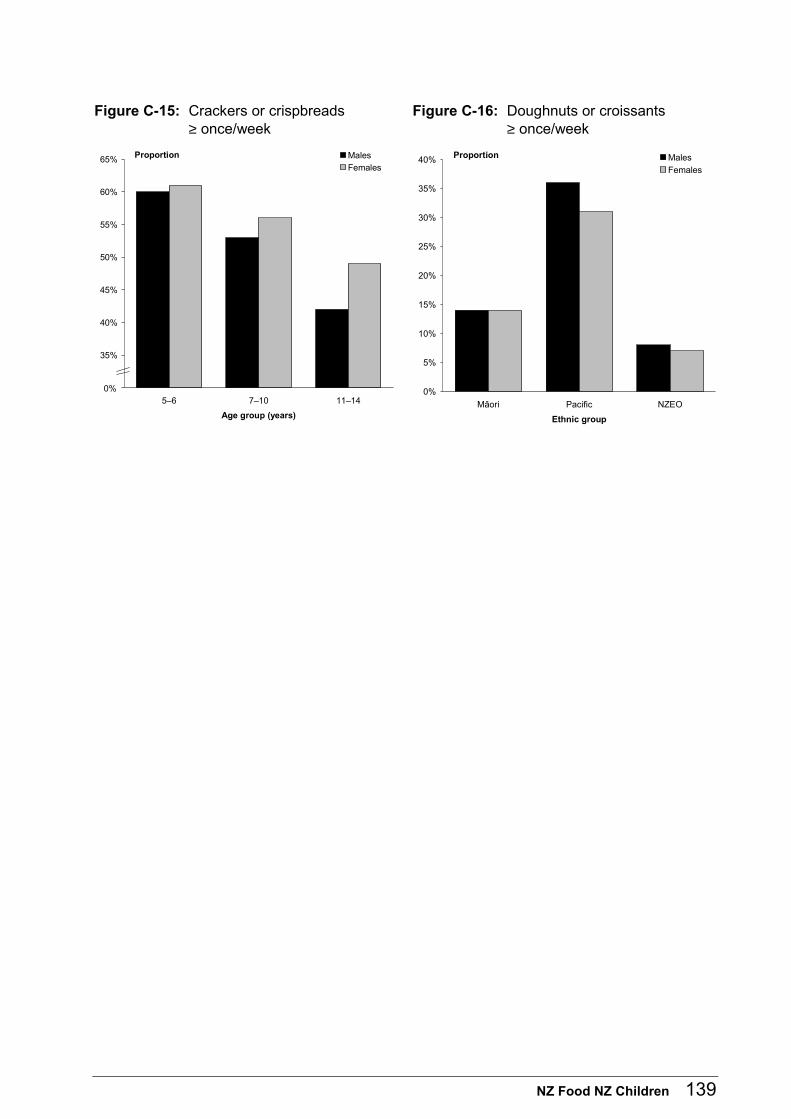
NZ Food NZ Children 139
Figure C-15: Crackers or crispbreads ≥ once/week
Figure C-16: Doughnuts or croissants ≥ once/week
30%
35%
40%
45%
50%
55%
60%
65%
5–6 7–10 11–14
Age group (years)
Proportion Males
Females
0% 0%
5%
10%
15%
20%
25%
30%
35%
40%
Mäori Pacific NZEO
Ethnic group
Proportion Males
Females
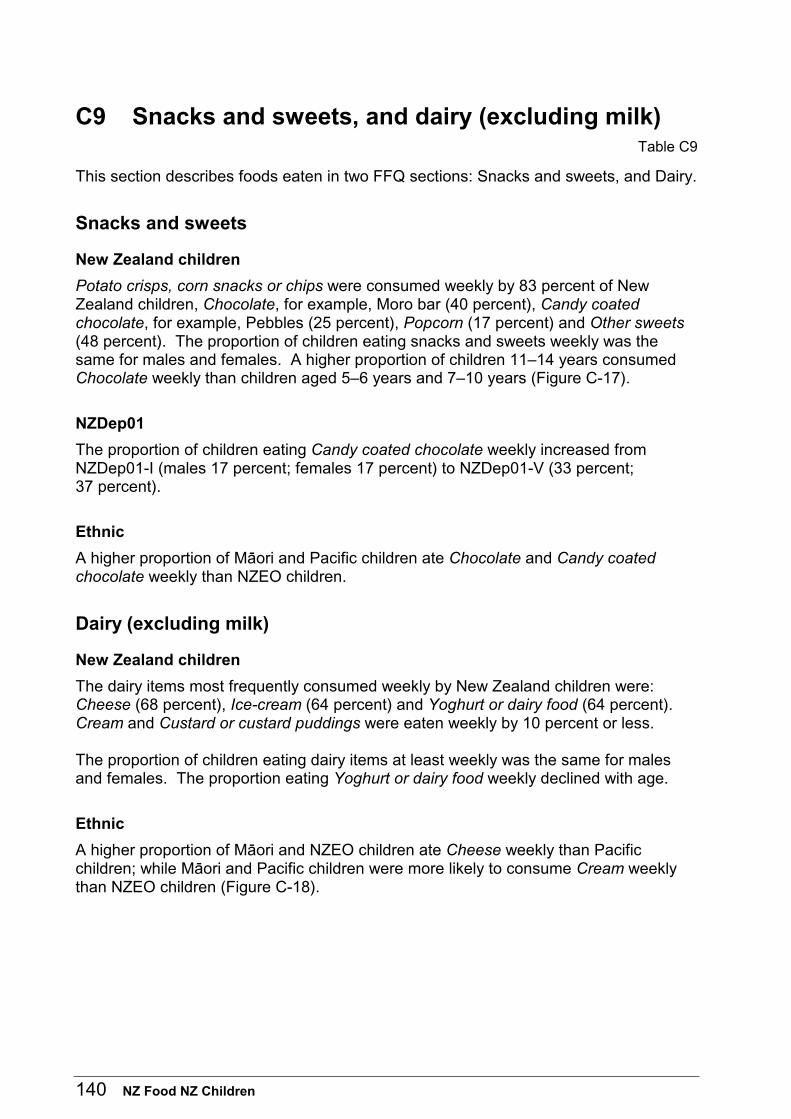
140 NZ Food NZ Children
C9 Snacks and sweets, and dairy (excluding milk) Table C9
This section describes foods eaten in two FFQ sections: Snacks and sweets, and Dairy.
Snacks and sweets
New Zealand children
Potato crisps, corn snacks or chips were consumed weekly by 83 percent of New Zealand children, Chocolate, for example, Moro bar (40 percent), Candy coated chocolate, for example, Pebbles (25 percent), Popcorn (17 percent) and Other sweets (48 percent). The proportion of children eating snacks and sweets weekly was the same for males and females. A higher proportion of children 11–14 years consumed Chocolate weekly than children aged 5–6 years and 7–10 years (Figure C-17).
NZDep01
The proportion of children eating Candy coated chocolate weekly increased from NZDep01-I (males 17 percent; females 17 percent) to NZDep01-V (33 percent; 37 percent).
Ethnic
A higher proportion of Mäori and Pacific children ate Chocolate and Candy coated chocolate weekly than NZEO children.
Dairy (excluding milk)
New Zealand children
The dairy items most frequently consumed weekly by New Zealand children were: Cheese (68 percent), Ice-cream (64 percent) and Yoghurt or dairy food (64 percent). Cream and Custard or custard puddings were eaten weekly by 10 percent or less. The proportion of children eating dairy items at least weekly was the same for males and females. The proportion eating Yoghurt or dairy food weekly declined with age.
Ethnic
A higher proportion of Mäori and NZEO children ate Cheese weekly than Pacific children; while Mäori and Pacific children were more likely to consume Cream weekly than NZEO children (Figure C-18).
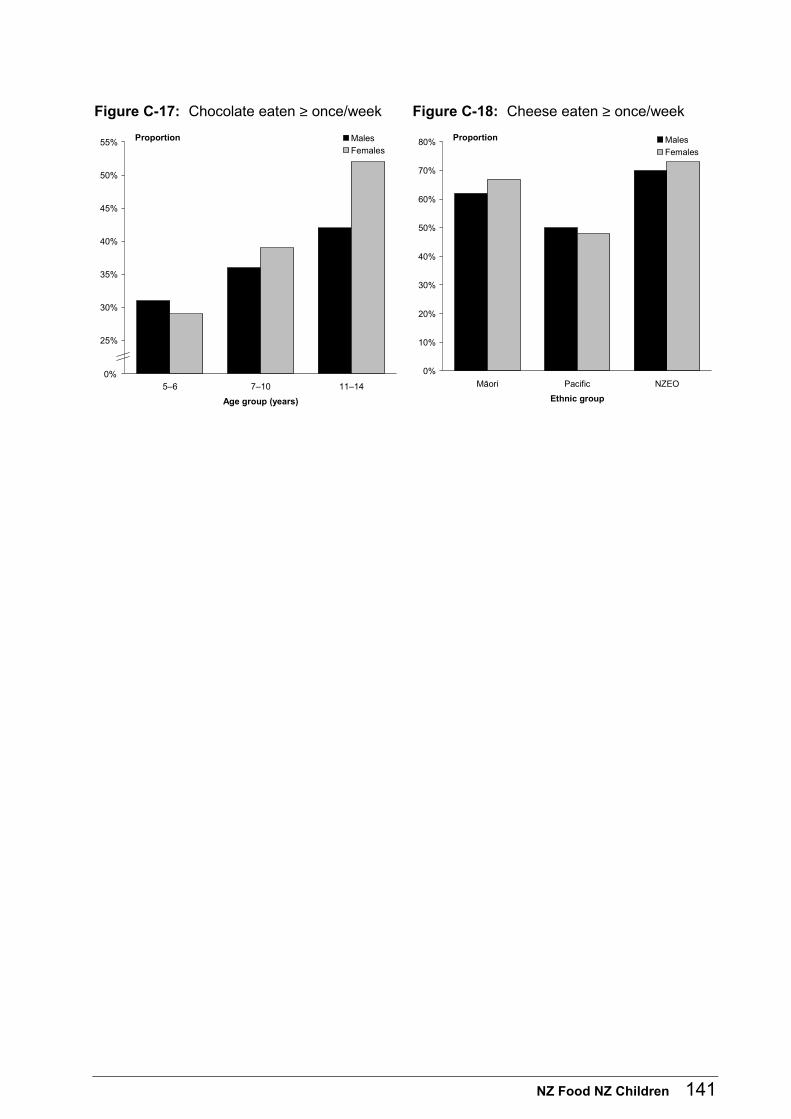
NZ Food NZ Children 141
Figure C-17: Chocolate eaten ≥ once/week Figure C-18: Cheese eaten ≥ once/week
20%
25%
30%
35%
40%
45%
50%
55%
5–6 7–10 11–14
Age group (years)
Proportion Males
Females
0% 0%
10%
20%
30%
40%
50%
60%
70%
80%
Mäori Pacific NZEO
Ethnic group
Proportion Males
Females
142 NZ Food NZ Children
C10 Milks Table C10
Milk (not flavoured)
Thirty-eight percent of New Zealand children reported drinking milk (not flavoured) every day, 34 percent weekly, 10 percent monthly and 17 percent less than monthly or never. Frequency of milk consumption was unrelated to sex or age. The proportion consuming milk daily was higher for NZEO (males 41 percent; females 39 percent) and Mäori (39 percent; 33 percent) children than for Pacific children (32 percent; 23 percent) (Figure C-19).
Types of milk
Standard milk was the kind of milk usually drunk by New Zealand children (74 percent). Low-fat milk was usually consumed by 13 percent, Trim (7 percent), Extra-calcium (4 percent) and Soy (2 percent). The type of milk drunk was the same for males and females. The 11–14 year females were less likely to usually drink Standard milk (64 percent) than females 5–6 years (79 percent). Conversely, the proportion of females who usually drank Low-fat and Trim milk was highest for those 11–14 years (Figure C-20). Mäori (males 84 percent; females 83 percent) and Pacific (82 percent; 79 percent) children were more likely to usually drink Standard milk than NZEO children (72 percent; 67 percent).
Flavoured milk, milk shake, food drink
Fifty-nine percent of New Zealand children consumed a Food drink (eg, Milo, Nesquik) weekly, while drinking Flavoured milk weekly was reported by 22 percent and Milk shake by 13 percent. Weekly consumption of these milk drinks was unrelated to sex and age, except for Flavoured milk, where weekly consumption increased with age, particularly in males. A higher proportion of Pacific children consumed Flavoured milk or Milk shake weekly than Mäori or NZEO children.
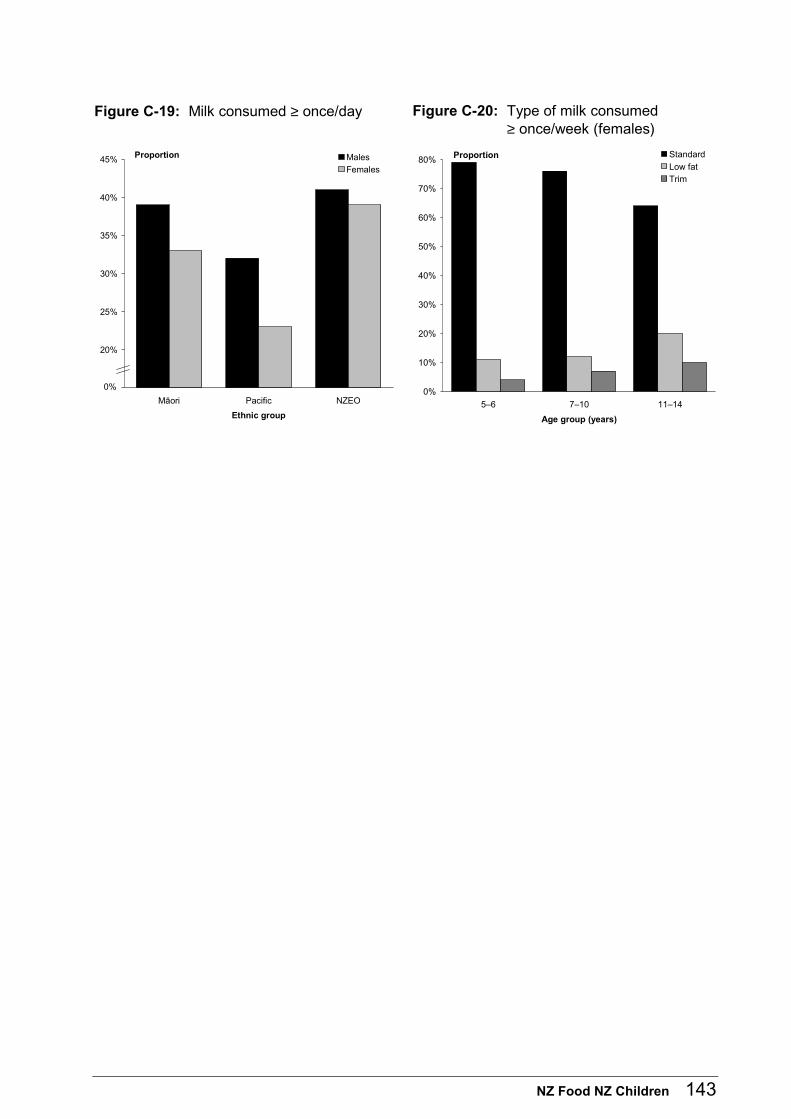
NZ Food NZ Children 143
Figure C-19: Milk consumed ≥ once/day Figure C-20: Type of milk consumed ≥ once/week (females)
15%
20%
25%
30%
35%
40%
45%
Mäori Pacific NZEO
Ethnic group
Proportion Males
Females
0%0%
10%
20%
30%
40%
50%
60%
70%
80%
5–6 7–10 11–14
Age group (years)
Proportion Standard
Low fat
Trim
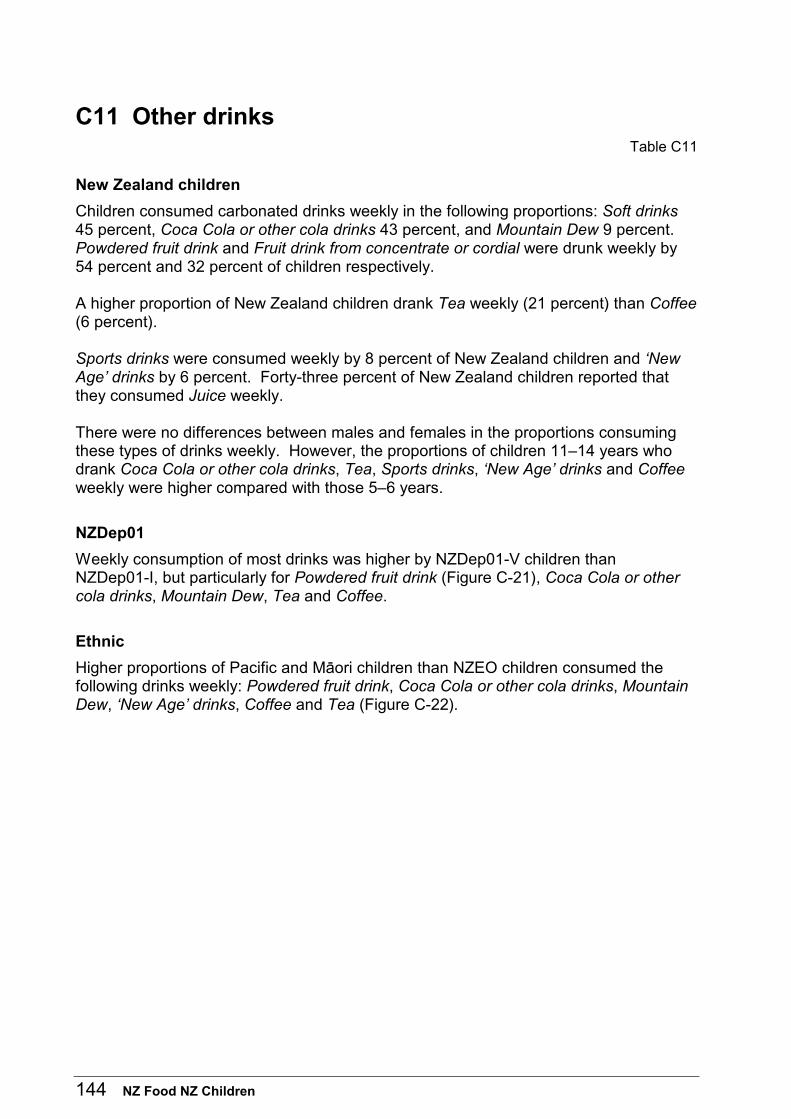
144 NZ Food NZ Children
C11 Other drinks Table C11
New Zealand children
Children consumed carbonated drinks weekly in the following proportions: Soft drinks 45 percent, Coca Cola or other cola drinks 43 percent, and Mountain Dew 9 percent. Powdered fruit drink and Fruit drink from concentrate or cordial were drunk weekly by 54 percent and 32 percent of children respectively. A higher proportion of New Zealand children drank Tea weekly (21 percent) than Coffee (6 percent). Sports drinks were consumed weekly by 8 percent of New Zealand children and ‘New Age’ drinks by 6 percent. Forty-three percent of New Zealand children reported that they consumed Juice weekly. There were no differences between males and females in the proportions consuming these types of drinks weekly. However, the proportions of children 11–14 years who drank Coca Cola or other cola drinks, Tea, Sports drinks, ‘New Age’ drinks and Coffee weekly were higher compared with those 5–6 years.
NZDep01
Weekly consumption of most drinks was higher by NZDep01-V children than NZDep01-I, but particularly for Powdered fruit drink (Figure C-21), Coca Cola or other cola drinks, Mountain Dew, Tea and Coffee.
Ethnic
Higher proportions of Pacific and Mäori children than NZEO children consumed the following drinks weekly: Powdered fruit drink, Coca Cola or other cola drinks, Mountain Dew, ‘New Age’ drinks, Coffee and Tea (Figure C-22).
NZ Food NZ Children 145
Figure C-21: Powdered fruit drink consumed ≥ once/week
Figure C-22: Tea consumed ≥ once/week
20%
30%
40%
50%
60%
70%
I II III IV V
NZDep01 quintile
Proportion Males
Females
0%0%
10%
20%
30%
40%
50%
60%
Mäori Pacific NZEO
Ethnic group
Proportion Males
Females
146 NZ Food NZ Children
C12 Fats put on cooked vegetables and fats used to cook meat, poultry or fish
Table C12
Fats put on cooked vegetables
Thirty-five percent of New Zealand children Add butter/margarine weekly to their cooked vegetables. There were no consistent differences between males and females or by age group. A higher proportion of NZDep01-V children reported that they Add butter/margarine to cooked vegetables weekly than those in NZDep01-I and II (Figure C-23). Mäori and Pacific children were more likely to Add butter/margarine weekly to cooked vegetables than NZEO children. The following types of fat spread were usually added to vegetables: Butter (25 percent), Margarine (22 percent), Low-fat spread (6 percent), and Blend (margarine and butter) (3 percent). The type of fat spread usually added was similar between males and females and across age groups. Children in NZDep01-V were more likely to add Margarine to vegetables (males 26 percent; females 29 percent) than NZDep01-I (10 percent; 13 percent). Mäori children were more likely to add Butter to vegetables than Pacific and NZEO children, and more likely to add Margarine than NZEO children.
Fats regularly used to cook meat, poultry or fish
The types of fat reported to be used regularly to cook meat, poultry or fish by New Zealand children were: Olive oil (46 percent), Canola oil (24 percent), Other vegetable oil (22 percent), Butter (16 percent), Sunflower oil (13 percent), Margarine (10 percent), Lard or dripping (5 percent), Corn oil (1 percent) and Safflower oil (1 percent). The type of fat used was similar for males and females and across age groups. Olive oil used in this way was reported to be highest in NZDep01-I children (males 65 percent; females 65 percent) and lowest in NZDep01-V children (26 percent; 24 percent) (Figure C-24). Mäori and Pacific children were more likely to use Margarine, and less likely to use Olive oil, than NZEO children. Mäori children were more likely to use Butter than NZEO children, and to use Lard or dripping than Pacific and NZEO children.
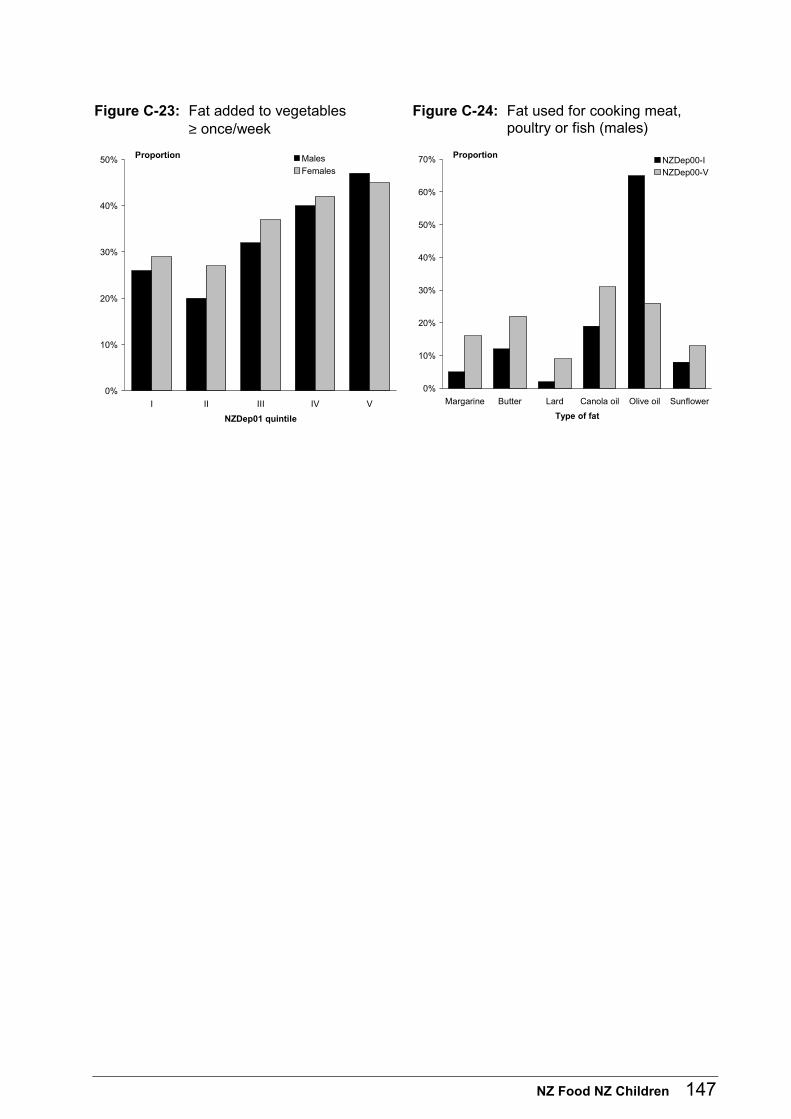
NZ Food NZ Children 147
Figure C-23: Fat added to vegetables ≥ once/week
Figure C-24: Fat used for cooking meat, poultry or fish (males)
0%
10%
20%
30%
40%
50%
I II III IV V
NZDep01 quintile
Proportion Males
Females
0%
10%
20%
30%
40%
50%
60%
70%
Margarine Butter Lard Canola oil Olive oil Sunflower
Type of fat
ProportionNZDep00-INZDep00-V
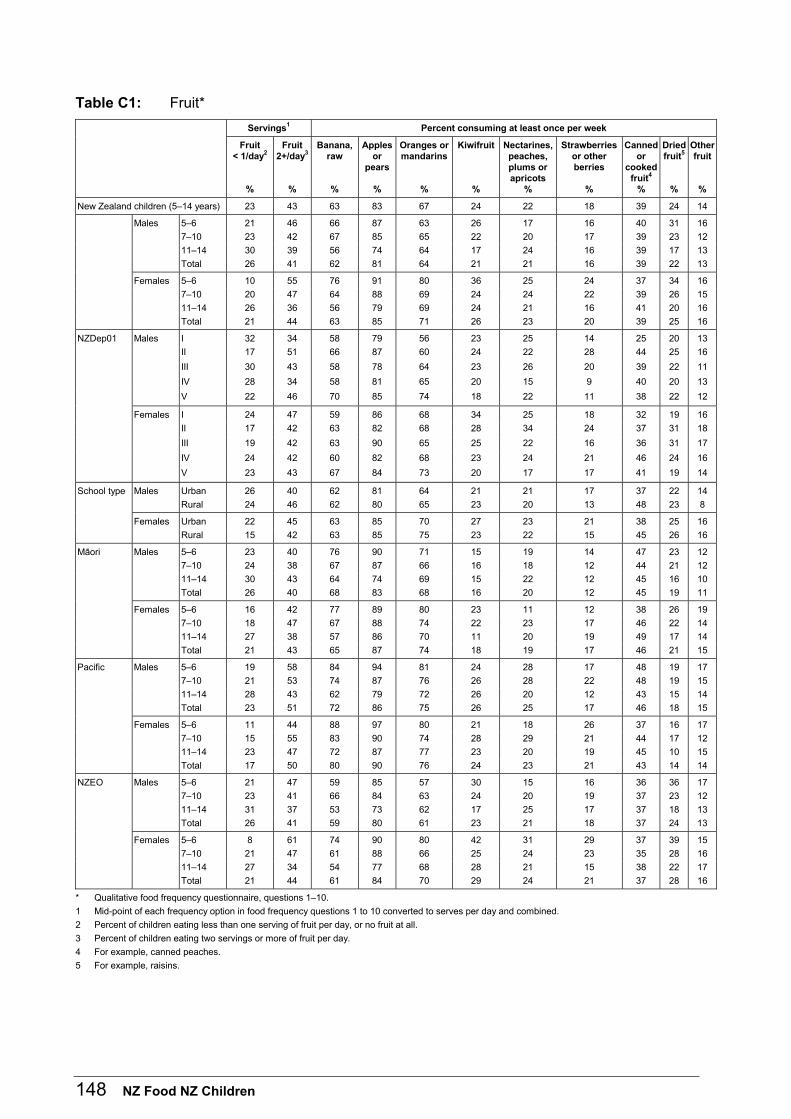
148 NZ Food NZ Children
Table C1: Fruit*
Servings1 Percent consuming at least once per week
Fruit < 1/day2
%
Fruit 2+/day3
%
Banana, raw
%
Apples or
pears
%
Oranges or mandarins
%
Kiwifruit
%
Nectarines, peaches, plums or apricots
%
Strawberries or other berries
%
Canned or
cooked fruit4
%
Dried fruit5
%
Other fruit
%
New Zealand children (5–14 years) 23 43 63 83 67 24 22 18 39 24 14
Males 5–6 21 46 66 87 63 26 17 16 40 31 16
7–10 23 42 67 85 65 22 20 17 39 23 12
11–14 30 39 56 74 64 17 24 16 39 17 13
Total 26 41 62 81 64 21 21 16 39 22 13
Females 5–6 10 55 76 91 80 36 25 24 37 34 16
7–10 20 47 64 88 69 24 24 22 39 26 15
11–14 26 36 56 79 69 24 21 16 41 20 16
Total 21 44 63 85 71 26 23 20 39 25 16
NZDep01 Males I 32 34 58 79 56 23 25 14 25 20 13
II 17 51 66 87 60 24 22 28 44 25 16
III 30 43 58 78 64 23 26 20 39 22 11
IV 28 34 58 81 65 20 15 9 40 20 13
V 22 46 70 85 74 18 22 11 38 22 12
Females I 24 47 59 86 68 34 25 18 32 19 16
II 17 42 63 82 68 28 34 24 37 31 18
III 19 42 63 90 65 25 22 16 36 31 17
IV 24 42 60 82 68 23 24 21 46 24 16
V 23 43 67 84 73 20 17 17 41 19 14
School type Males Urban 26 40 62 81 64 21 21 17 37 22 14
Rural 24 46 62 80 65 23 20 13 48 23 8
Females Urban 22 45 63 85 70 27 23 21 38 25 16
Rural 15 42 63 85 75 23 22 15 45 26 16
Mäori Males 5–6 23 40 76 90 71 15 19 14 47 23 12
7–10 24 38 67 87 66 16 18 12 44 21 12
11–14 30 43 64 74 69 15 22 12 45 16 10
Total 26 40 68 83 68 16 20 12 45 19 11
Females 5–6 16 42 77 89 80 23 11 12 38 26 19
7–10 18 47 67 88 74 22 23 17 46 22 14
11–14 27 38 57 86 70 11 20 19 49 17 14
Total 21 43 65 87 74 18 19 17 46 21 15
Pacific Males 5–6 19 58 84 94 81 24 28 17 48 19 17
7–10 21 53 74 87 76 26 28 22 48 19 15
11–14 28 43 62 79 72 26 20 12 43 15 14
Total 23 51 72 86 75 26 25 17 46 18 15
Females 5–6 11 44 88 97 80 21 18 26 37 16 17
7–10 15 55 83 90 74 28 29 21 44 17 12
11–14 23 47 72 87 77 23 20 19 45 10 15
Total 17 50 80 90 76 24 23 21 43 14 14
NZEO Males 5–6 21 47 59 85 57 30 15 16 36 36 17
7–10 23 41 66 84 63 24 20 19 37 23 12
11–14 31 37 53 73 62 17 25 17 37 18 13
Total 26 41 59 80 61 23 21 18 37 24 13
Females 5–6 8 61 74 90 80 42 31 29 37 39 15
7–10 21 47 61 88 66 25 24 23 35 28 16
11–14 27 34 54 77 68 28 21 15 38 22 17
Total 21 44 61 84 70 29 24 21 37 28 16
* Qualitative food frequency questionnaire, questions 1–10.
1 Mid-point of each frequency option in food frequency questions 1 to 10 converted to serves per day and combined.
2 Percent of children eating less than one serving of fruit per day, or no fruit at all.
3 Percent of children eating two servings or more of fruit per day.
4 For example, canned peaches.
5 For example, raisins.
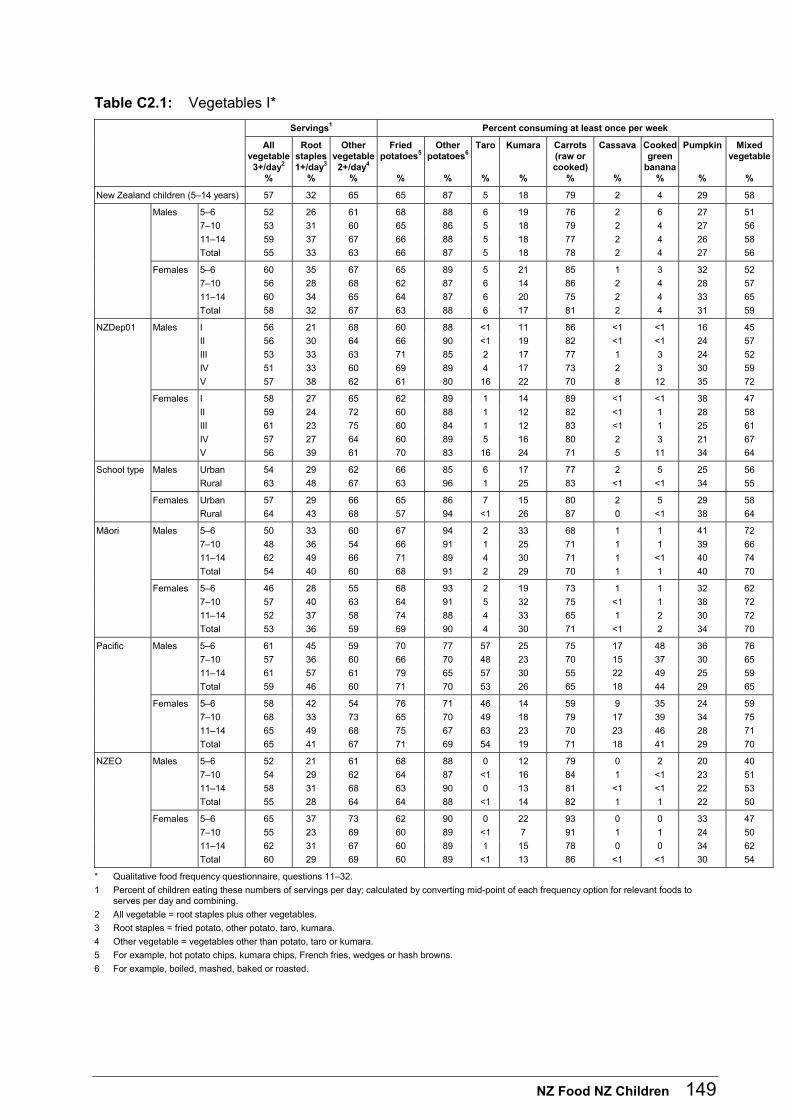
NZ Food NZ Children 149
Table C2.1: Vegetables I*
Servings1 Percent consuming at least once per week
All vegetable 3+/day2
%
Root staples 1+/day3
%
Other vegetable2+/day4
%
Fried potatoes5
%
Other potatoes6
%
Taro
%
Kumara
%
Carrots (raw or cooked)
%
Cassava
%
Cooked green
banana%
Pumpkin
%
Mixed vegetable
%
New Zealand children (5–14 years) 57 32 65 65 87 5 18 79 2 4 29 58
Males 5–6 52 26 61 68 88 6 19 76 2 6 27 51
7–10 53 31 60 65 86 5 18 79 2 4 27 56
11–14 59 37 67 66 88 5 18 77 2 4 26 58
Total 55 33 63 66 87 5 18 78 2 4 27 56
Females 5–6 60 35 67 65 89 5 21 85 1 3 32 52
7–10 56 28 68 62 87 6 14 86 2 4 28 57
11–14 60 34 65 64 87 6 20 75 2 4 33 65
Total 58 32 67 63 88 6 17 81 2 4 31 59
NZDep01 Males I 56 21 68 60 88 <1 11 86 <1 <1 16 45
II 56 30 64 66 90 <1 19 82 <1 <1 24 57
III 53 33 63 71 85 2 17 77 1 3 24 52
IV 51 33 60 69 89 4 17 73 2 3 30 59
V 57 38 62 61 80 16 22 70 8 12 35 72
Females I 58 27 65 62 89 1 14 89 <1 <1 38 47
II 59 24 72 60 88 1 12 82 <1 1 28 58
III 61 23 75 60 84 1 12 83 <1 1 25 61
IV 57 27 64 60 89 5 16 80 2 3 21 67
V 56 39 61 70 83 16 24 71 5 11 34 64
School type Males Urban 54 29 62 66 85 6 17 77 2 5 25 56
Rural 63 48 67 63 96 1 25 83 <1 <1 34 55
Females Urban 57 29 66 65 86 7 15 80 2 5 29 58
Rural 64 43 68 57 94 <1 26 87 0 <1 38 64
Mäori Males 5–6 50 33 60 67 94 2 33 68 1 1 41 72
7–10 48 36 54 66 91 1 25 71 1 1 39 66
11–14 62 49 66 71 89 4 30 71 1 <1 40 74
Total 54 40 60 68 91 2 29 70 1 1 40 70
Females 5–6 46 28 55 68 93 2 19 73 1 1 32 62
7–10 57 40 63 64 91 5 32 75 <1 1 38 72
11–14 52 37 58 74 88 4 33 65 1 2 30 72
Total 53 36 59 69 90 4 30 71 <1 2 34 70
Pacific Males 5–6 61 45 59 70 77 57 25 75 17 48 36 76
7–10 57 36 60 66 70 48 23 70 15 37 30 65
11–14 61 57 61 79 65 57 30 55 22 49 25 59
Total 59 46 60 71 70 53 26 65 18 44 29 65
Females 5–6 58 42 54 76 71 46 14 59 9 35 24 59
7–10 68 33 73 65 70 49 18 79 17 39 34 75
11–14 65 49 68 75 67 63 23 70 23 46 28 71
Total 65 41 67 71 69 54 19 71 18 41 29 70
NZEO Males 5–6 52 21 61 68 88 0 12 79 0 2 20 40
7–10 54 29 62 64 87 <1 16 84 1 <1 23 51
11–14 58 31 68 63 90 0 13 81 <1 <1 22 53
Total 55 28 64 64 88 <1 14 82 1 1 22 50
Females 5–6 65 37 73 62 90 0 22 93 0 0 33 47
7–10 55 23 69 60 89 <1 7 91 1 1 24 50
11–14 62 31 67 60 89 1 15 78 0 0 34 62
Total 60 29 69 60 89 <1 13 86 <1 <1 30 54
* Qualitative food frequency questionnaire, questions 11–32.
1 Percent of children eating these numbers of servings per day; calculated by converting mid-point of each frequency option for relevant foods to serves per day and combining.
2 All vegetable = root staples plus other vegetables.
3 Root staples = fried potato, other potato, taro, kumara.
4 Other vegetable = vegetables other than potato, taro or kumara.
5 For example, hot potato chips, kumara chips, French fries, wedges or hash browns.
6 For example, boiled, mashed, baked or roasted.
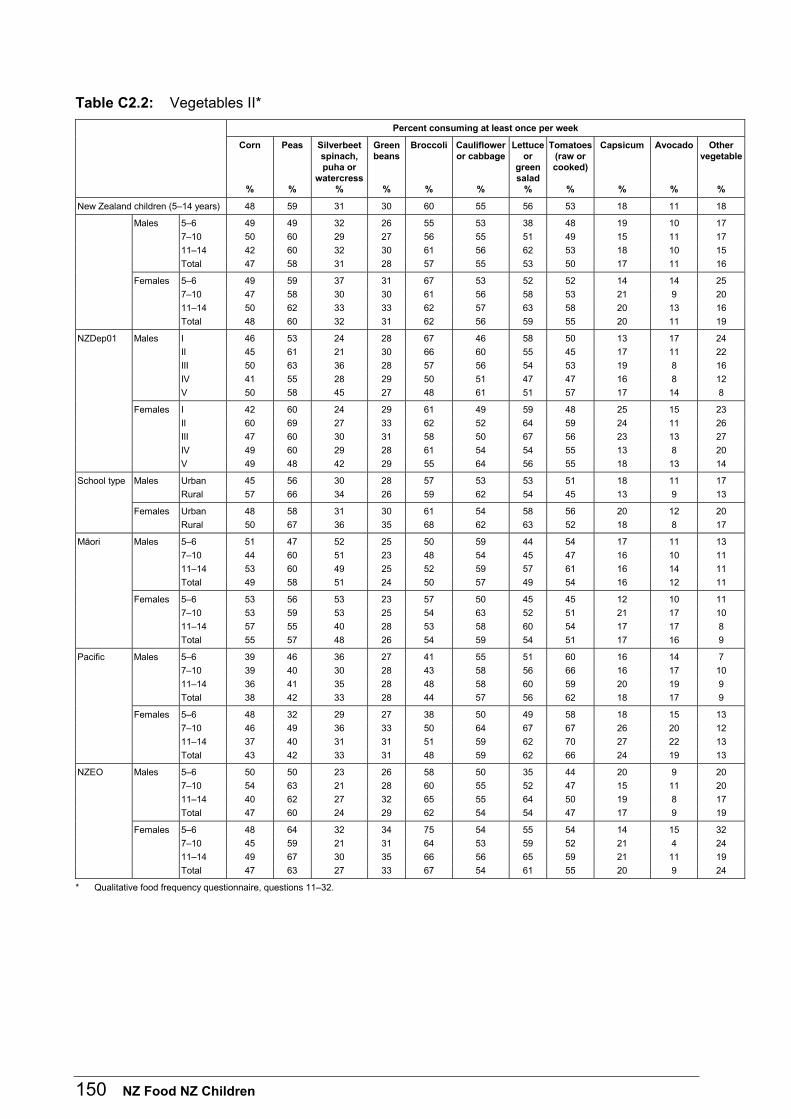
150 NZ Food NZ Children
Table C2.2: Vegetables II*
Percent consuming at least once per week
Corn
%
Peas
%
Silverbeet spinach, puha or
watercress%
Green beans
%
Broccoli
%
Cauliflower or cabbage
%
Lettuce or
green salad
%
Tomatoes (raw or cooked)
%
Capsicum
%
Avocado
%
Other vegetable
%
New Zealand children (5–14 years) 48 59 31 30 60 55 56 53 18 11 18
Males 5–6 49 49 32 26 55 53 38 48 19 10 17
7–10 50 60 29 27 56 55 51 49 15 11 17
11–14 42 60 32 30 61 56 62 53 18 10 15
Total 47 58 31 28 57 55 53 50 17 11 16
Females 5–6 49 59 37 31 67 53 52 52 14 14 25
7–10 47 58 30 30 61 56 58 53 21 9 20
11–14 50 62 33 33 62 57 63 58 20 13 16
Total 48 60 32 31 62 56 59 55 20 11 19
NZDep01 Males I 46 53 24 28 67 46 58 50 13 17 24
II 45 61 21 30 66 60 55 45 17 11 22
III 50 63 36 28 57 56 54 53 19 8 16
IV 41 55 28 29 50 51 47 47 16 8 12
V 50 58 45 27 48 61 51 57 17 14 8
Females I 42 60 24 29 61 49 59 48 25 15 23
II 60 69 27 33 62 52 64 59 24 11 26
III 47 60 30 31 58 50 67 56 23 13 27
IV 49 60 29 28 61 54 54 55 13 8 20
V 49 48 42 29 55 64 56 55 18 13 14
School type Males Urban 45 56 30 28 57 53 53 51 18 11 17
Rural 57 66 34 26 59 62 54 45 13 9 13
Females Urban 48 58 31 30 61 54 58 56 20 12 20
Rural 50 67 36 35 68 62 63 52 18 8 17
Mäori Males 5–6 51 47 52 25 50 59 44 54 17 11 13
7–10 44 60 51 23 48 54 45 47 16 10 11
11–14 53 60 49 25 52 59 57 61 16 14 11
Total 49 58 51 24 50 57 49 54 16 12 11
Females 5–6 53 56 53 23 57 50 45 45 12 10 11
7–10 53 59 53 25 54 63 52 51 21 17 10
11–14 57 55 40 28 53 58 60 54 17 17 8
Total 55 57 48 26 54 59 54 51 17 16 9
Pacific Males 5–6 39 46 36 27 41 55 51 60 16 14 7
7–10 39 40 30 28 43 58 56 66 16 17 10
11–14 36 41 35 28 48 58 60 59 20 19 9
Total 38 42 33 28 44 57 56 62 18 17 9
Females 5–6 48 32 29 27 38 50 49 58 18 15 13
7–10 46 49 36 33 50 64 67 67 26 20 12
11–14 37 40 31 31 51 59 62 70 27 22 13
Total 43 42 33 31 48 59 62 66 24 19 13
NZEO Males 5–6 50 50 23 26 58 50 35 44 20 9 20
7–10 54 63 21 28 60 55 52 47 15 11 20
11–14 40 62 27 32 65 55 64 50 19 8 17
Total 47 60 24 29 62 54 54 47 17 9 19
Females 5–6 48 64 32 34 75 54 55 54 14 15 32
7–10 45 59 21 31 64 53 59 52 21 4 24
11–14 49 67 30 35 66 56 65 59 21 11 19
Total 47 63 27 33 67 54 61 55 20 9 24
* Qualitative food frequency questionnaire, questions 11–32.
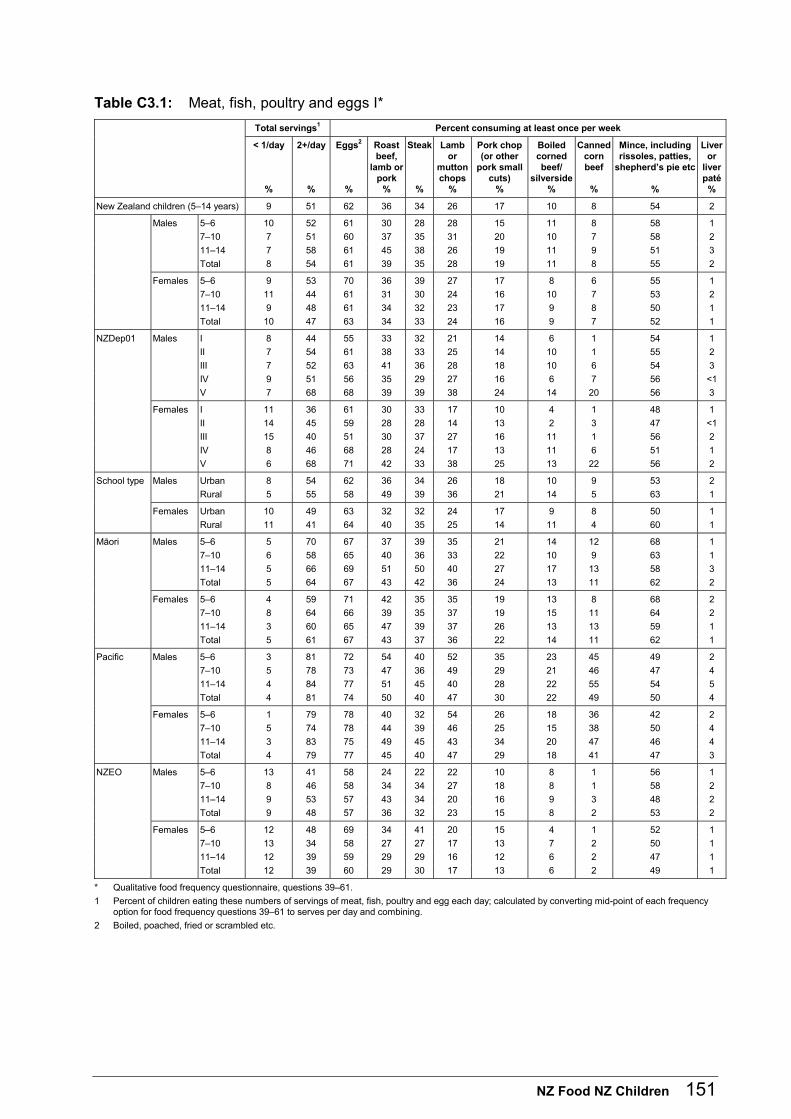
NZ Food NZ Children 151
Table C3.1: Meat, fish, poultry and eggs I*
Total servings1 Percent consuming at least once per week
< 1/day
%
2+/day
%
Eggs2
%
Roast beef,
lamb or pork
%
Steak
%
Lamb or
mutton chops
%
Pork chop (or other
pork small cuts)
%
Boiled corned beef/
silverside %
Canned corn beef
%
Mince, including rissoles, patties,
shepherd’s pie etc
%
Liver or
liver paté
%
New Zealand children (5–14 years) 9 51 62 36 34 26 17 10 8 54 2
Males 5–6 10 52 61 30 28 28 15 11 8 58 1
7–10 7 51 60 37 35 31 20 10 7 58 2
11–14 7 58 61 45 38 26 19 11 9 51 3
Total 8 54 61 39 35 28 19 11 8 55 2
Females 5–6 9 53 70 36 39 27 17 8 6 55 1
7–10 11 44 61 31 30 24 16 10 7 53 2
11–14 9 48 61 34 32 23 17 9 8 50 1
Total 10 47 63 34 33 24 16 9 7 52 1
NZDep01 Males I 8 44 55 33 32 21 14 6 1 54 1
II 7 54 61 38 33 25 14 10 1 55 2
III 7 52 63 41 36 28 18 10 6 54 3
IV 9 51 56 35 29 27 16 6 7 56 <1
V 7 68 68 39 39 38 24 14 20 56 3
Females I 11 36 61 30 33 17 10 4 1 48 1
II 14 45 59 28 28 14 13 2 3 47 <1
III 15 40 51 30 37 27 16 11 1 56 2
IV 8 46 68 28 24 17 13 11 6 51 1
V 6 68 71 42 33 38 25 13 22 56 2
School type Males Urban 8 54 62 36 34 26 18 10 9 53 2
Rural 5 55 58 49 39 36 21 14 5 63 1
Females Urban 10 49 63 32 32 24 17 9 8 50 1
Rural 11 41 64 40 35 25 14 11 4 60 1
Mäori Males 5–6 5 70 67 37 39 35 21 14 12 68 1
7–10 6 58 65 40 36 33 22 10 9 63 1
11–14 5 66 69 51 50 40 27 17 13 58 3
Total 5 64 67 43 42 36 24 13 11 62 2
Females 5–6 4 59 71 42 35 35 19 13 8 68 2
7–10 8 64 66 39 35 37 19 15 11 64 2
11–14 3 60 65 47 39 37 26 13 13 59 1
Total 5 61 67 43 37 36 22 14 11 62 1
Pacific Males 5–6 3 81 72 54 40 52 35 23 45 49 2
7–10 5 78 73 47 36 49 29 21 46 47 4
11–14 4 84 77 51 45 40 28 22 55 54 5
Total 4 81 74 50 40 47 30 22 49 50 4
Females 5–6 1 79 78 40 32 54 26 18 36 42 2
7–10 5 74 78 44 39 46 25 15 38 50 4
11–14 3 83 75 49 45 43 34 20 47 46 4
Total 4 79 77 45 40 47 29 18 41 47 3
NZEO Males 5–6 13 41 58 24 22 22 10 8 1 56 1
7–10 8 46 58 34 34 27 18 8 1 58 2
11–14 9 53 57 43 34 20 16 9 3 48 2
Total 9 48 57 36 32 23 15 8 2 53 2
Females 5–6 12 48 69 34 41 20 15 4 1 52 1
7–10 13 34 58 27 27 17 13 7 2 50 1
11–14 12 39 59 29 29 16 12 6 2 47 1
Total 12 39 60 29 30 17 13 6 2 49 1
* Qualitative food frequency questionnaire, questions 39–61.
1 Percent of children eating these numbers of servings of meat, fish, poultry and egg each day; calculated by converting mid-point of each frequency option for food frequency questions 39–61 to serves per day and combining.
2 Boiled, poached, fried or scrambled etc.
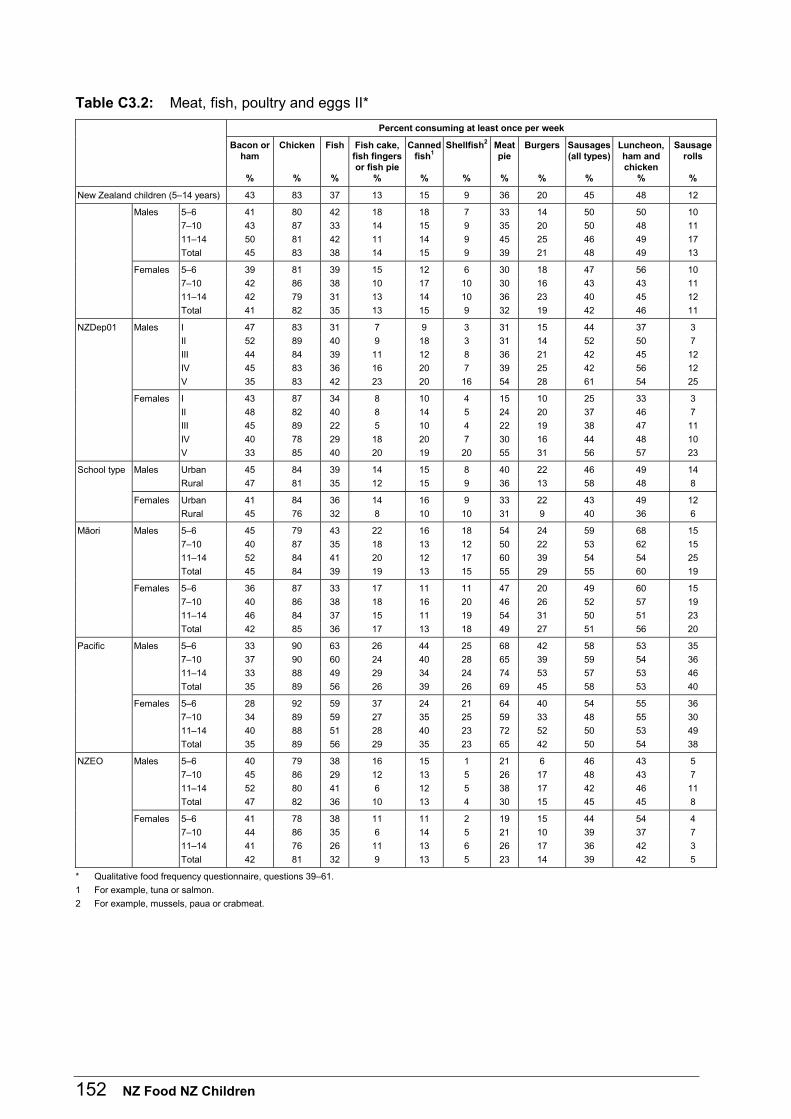
152 NZ Food NZ Children
Table C3.2: Meat, fish, poultry and eggs II*
Percent consuming at least once per week
Bacon or ham
%
Chicken
%
Fish
%
Fish cake, fish fingers or fish pie
%
Canned fish1
%
Shellfish2
%
Meat pie
%
Burgers
%
Sausages (all types)
%
Luncheon, ham and chicken
%
Sausage rolls
%
New Zealand children (5–14 years) 43 83 37 13 15 9 36 20 45 48 12
Males 5–6 41 80 42 18 18 7 33 14 50 50 10
7–10 43 87 33 14 15 9 35 20 50 48 11
11–14 50 81 42 11 14 9 45 25 46 49 17
Total 45 83 38 14 15 9 39 21 48 49 13
Females 5–6 39 81 39 15 12 6 30 18 47 56 10
7–10 42 86 38 10 17 10 30 16 43 43 11
11–14 42 79 31 13 14 10 36 23 40 45 12
Total 41 82 35 13 15 9 32 19 42 46 11
NZDep01 Males I 47 83 31 7 9 3 31 15 44 37 3
II 52 89 40 9 18 3 31 14 52 50 7
III 44 84 39 11 12 8 36 21 42 45 12
IV 45 83 36 16 20 7 39 25 42 56 12
V 35 83 42 23 20 16 54 28 61 54 25
Females I 43 87 34 8 10 4 15 10 25 33 3
II 48 82 40 8 14 5 24 20 37 46 7
III 45 89 22 5 10 4 22 19 38 47 11
IV 40 78 29 18 20 7 30 16 44 48 10
V 33 85 40 20 19 20 55 31 56 57 23
School type Males Urban 45 84 39 14 15 8 40 22 46 49 14
Rural 47 81 35 12 15 9 36 13 58 48 8
Females Urban 41 84 36 14 16 9 33 22 43 49 12
Rural 45 76 32 8 10 10 31 9 40 36 6
Mäori Males 5–6 45 79 43 22 16 18 54 24 59 68 15
7–10 40 87 35 18 13 12 50 22 53 62 15
11–14 52 84 41 20 12 17 60 39 54 54 25
Total 45 84 39 19 13 15 55 29 55 60 19
Females 5–6 36 87 33 17 11 11 47 20 49 60 15
7–10 40 86 38 18 16 20 46 26 52 57 19
11–14 46 84 37 15 11 19 54 31 50 51 23
Total 42 85 36 17 13 18 49 27 51 56 20
Pacific Males 5–6 33 90 63 26 44 25 68 42 58 53 35
7–10 37 90 60 24 40 28 65 39 59 54 36
11–14 33 88 49 29 34 24 74 53 57 53 46
Total 35 89 56 26 39 26 69 45 58 53 40
Females 5–6 28 92 59 37 24 21 64 40 54 55 36
7–10 34 89 59 27 35 25 59 33 48 55 30
11–14 40 88 51 28 40 23 72 52 50 53 49
Total 35 89 56 29 35 23 65 42 50 54 38
NZEO Males 5–6 40 79 38 16 15 1 21 6 46 43 5
7–10 45 86 29 12 13 5 26 17 48 43 7
11–14 52 80 41 6 12 5 38 17 42 46 11
Total 47 82 36 10 13 4 30 15 45 45 8
Females 5–6 41 78 38 11 11 2 19 15 44 54 4
7–10 44 86 35 6 14 5 21 10 39 37 7
11–14 41 76 26 11 13 6 26 17 36 42 3
Total 42 81 32 9 13 5 23 14 39 42 5
* Qualitative food frequency questionnaire, questions 39–61.
1 For example, tuna or salmon.
2 For example, mussels, paua or crabmeat.
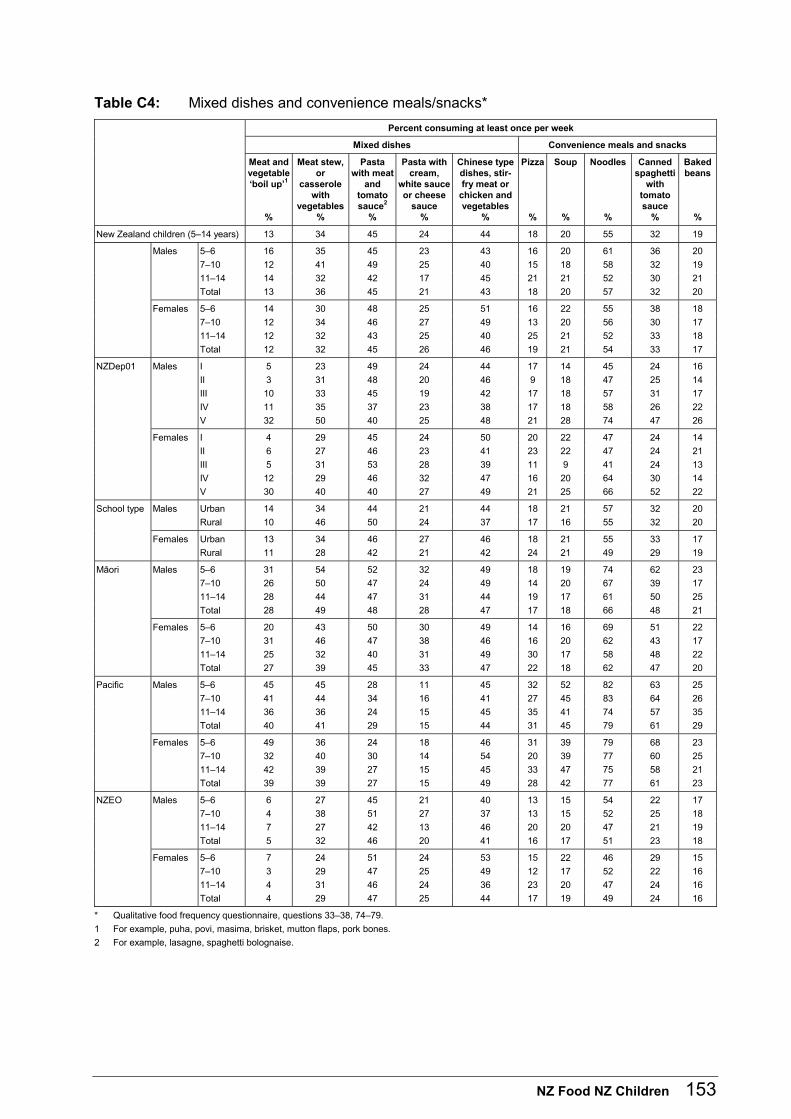
NZ Food NZ Children 153
Table C4: Mixed dishes and convenience meals/snacks*
Percent consuming at least once per week
Mixed dishes Convenience meals and snacks
Meat and vegetable ‘boil up’1
%
Meat stew, or
casserole with
vegetables%
Pasta with meat
and tomato sauce2
%
Pasta with cream,
white sauce or cheese
sauce %
Chinese type dishes, stir-fry meat or
chicken and vegetables
%
Pizza
%
Soup
%
Noodles
%
Canned spaghetti
with tomato sauce
%
Baked beans
%
New Zealand children (5–14 years) 13 34 45 24 44 18 20 55 32 19
Males 5–6 16 35 45 23 43 16 20 61 36 20
7–10 12 41 49 25 40 15 18 58 32 19
11–14 14 32 42 17 45 21 21 52 30 21
Total 13 36 45 21 43 18 20 57 32 20
Females 5–6 14 30 48 25 51 16 22 55 38 18
7–10 12 34 46 27 49 13 20 56 30 17
11–14 12 32 43 25 40 25 21 52 33 18
Total 12 32 45 26 46 19 21 54 33 17
NZDep01 Males I 5 23 49 24 44 17 14 45 24 16
II 3 31 48 20 46 9 18 47 25 14
III 10 33 45 19 42 17 18 57 31 17
IV 11 35 37 23 38 17 18 58 26 22
V 32 50 40 25 48 21 28 74 47 26
Females I 4 29 45 24 50 20 22 47 24 14
II 6 27 46 23 41 23 22 47 24 21
III 5 31 53 28 39 11 9 41 24 13
IV 12 29 46 32 47 16 20 64 30 14
V 30 40 40 27 49 21 25 66 52 22
School type Males Urban 14 34 44 21 44 18 21 57 32 20
Rural 10 46 50 24 37 17 16 55 32 20
Females Urban 13 34 46 27 46 18 21 55 33 17
Rural 11 28 42 21 42 24 21 49 29 19
Mäori Males 5–6 31 54 52 32 49 18 19 74 62 23
7–10 26 50 47 24 49 14 20 67 39 17
11–14 28 44 47 31 44 19 17 61 50 25
Total 28 49 48 28 47 17 18 66 48 21
Females 5–6 20 43 50 30 49 14 16 69 51 22
7–10 31 46 47 38 46 16 20 62 43 17
11–14 25 32 40 31 49 30 17 58 48 22
Total 27 39 45 33 47 22 18 62 47 20
Pacific Males 5–6 45 45 28 11 45 32 52 82 63 25
7–10 41 44 34 16 41 27 45 83 64 26
11–14 36 36 24 15 45 35 41 74 57 35
Total 40 41 29 15 44 31 45 79 61 29
Females 5–6 49 36 24 18 46 31 39 79 68 23
7–10 32 40 30 14 54 20 39 77 60 25
11–14 42 39 27 15 45 33 47 75 58 21
Total 39 39 27 15 49 28 42 77 61 23
NZEO Males 5–6 6 27 45 21 40 13 15 54 22 17
7–10 4 38 51 27 37 13 15 52 25 18
11–14 7 27 42 13 46 20 20 47 21 19
Total 5 32 46 20 41 16 17 51 23 18
Females 5–6 7 24 51 24 53 15 22 46 29 15
7–10 3 29 47 25 49 12 17 52 22 16
11–14 4 31 46 24 36 23 20 47 24 16
Total 4 29 47 25 44 17 19 49 24 16
* Qualitative food frequency questionnaire, questions 33–38, 74–79.
1 For example, puha, povi, masima, brisket, mutton flaps, pork bones.
2 For example, lasagne, spaghetti bolognaise.
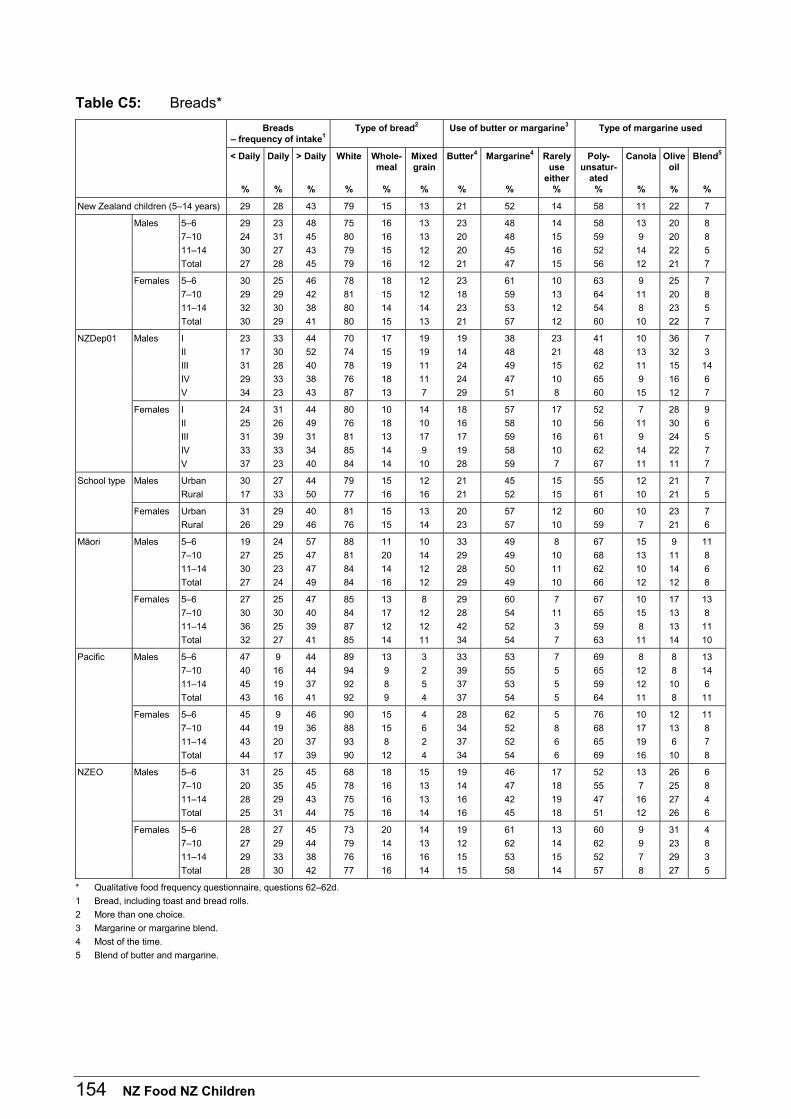
154 NZ Food NZ Children
Table C5: Breads*
Breads – frequency of intake1
Type of bread2 Use of butter or margarine3 Type of margarine used
< Daily
%
Daily
%
> Daily
%
White
%
Whole-meal
%
Mixed grain
%
Butter4
%
Margarine4
%
Rarely use
either %
Poly-unsatur-
ated %
Canola
%
Olive oil
%
Blend5
%
New Zealand children (5–14 years) 29 28 43 79 15 13 21 52 14 58 11 22 7
Males 5–6 29 23 48 75 16 13 23 48 14 58 13 20 8
7–10 24 31 45 80 16 13 20 48 15 59 9 20 8
11–14 30 27 43 79 15 12 20 45 16 52 14 22 5
Total 27 28 45 79 16 12 21 47 15 56 12 21 7
Females 5–6 30 25 46 78 18 12 23 61 10 63 9 25 7
7–10 29 29 42 81 15 12 18 59 13 64 11 20 8
11–14 32 30 38 80 14 14 23 53 12 54 8 23 5
Total 30 29 41 80 15 13 21 57 12 60 10 22 7
NZDep01 Males I 23 33 44 70 17 19 19 38 23 41 10 36 7
II 17 30 52 74 15 19 14 48 21 48 13 32 3
III 31 28 40 78 19 11 24 49 15 62 11 15 14
IV 29 33 38 76 18 11 24 47 10 65 9 16 6
V 34 23 43 87 13 7 29 51 8 60 15 12 7
Females I 24 31 44 80 10 14 18 57 17 52 7 28 9
II 25 26 49 76 18 10 16 58 10 56 11 30 6
III 31 39 31 81 13 17 17 59 16 61 9 24 5
IV 33 33 34 85 14 9 19 58 10 62 14 22 7
V 37 23 40 84 14 10 28 59 7 67 11 11 7
School type Males Urban 30 27 44 79 15 12 21 45 15 55 12 21 7
Rural 17 33 50 77 16 16 21 52 15 61 10 21 5
Females Urban 31 29 40 81 15 13 20 57 12 60 10 23 7
Rural 26 29 46 76 15 14 23 57 10 59 7 21 6
Mäori Males 5–6 19 24 57 88 11 10 33 49 8 67 15 9 11
7–10 27 25 47 81 20 14 29 49 10 68 13 11 8
11–14 30 23 47 84 14 12 28 50 11 62 10 14 6
Total 27 24 49 84 16 12 29 49 10 66 12 12 8
Females 5–6 27 25 47 85 13 8 29 60 7 67 10 17 13
7–10 30 30 40 84 17 12 28 54 11 65 15 13 8
11–14 36 25 39 87 12 12 42 52 3 59 8 13 11
Total 32 27 41 85 14 11 34 54 7 63 11 14 10
Pacific Males 5–6 47 9 44 89 13 3 33 53 7 69 8 8 13
7–10 40 16 44 94 9 2 39 55 5 65 12 8 14
11–14 45 19 37 92 8 5 37 53 5 59 12 10 6
Total 43 16 41 92 9 4 37 54 5 64 11 8 11
Females 5–6 45 9 46 90 15 4 28 62 5 76 10 12 11
7–10 44 19 36 88 15 6 34 52 8 68 17 13 8
11–14 43 20 37 93 8 2 37 52 6 65 19 6 7
Total 44 17 39 90 12 4 34 54 6 69 16 10 8
NZEO Males 5–6 31 25 45 68 18 15 19 46 17 52 13 26 6
7–10 20 35 45 78 16 13 14 47 18 55 7 25 8
11–14 28 29 43 75 16 13 16 42 19 47 16 27 4
Total 25 31 44 75 16 14 16 45 18 51 12 26 6
Females 5–6 28 27 45 73 20 14 19 61 13 60 9 31 4
7–10 27 29 44 79 14 13 12 62 14 62 9 23 8
11–14 29 33 38 76 16 16 15 53 15 52 7 29 3
Total 28 30 42 77 16 14 15 58 14 57 8 27 5
* Qualitative food frequency questionnaire, questions 62–62d. 1 Bread, including toast and bread rolls. 2 More than one choice. 3 Margarine or margarine blend. 4 Most of the time. 5 Blend of butter and margarine.
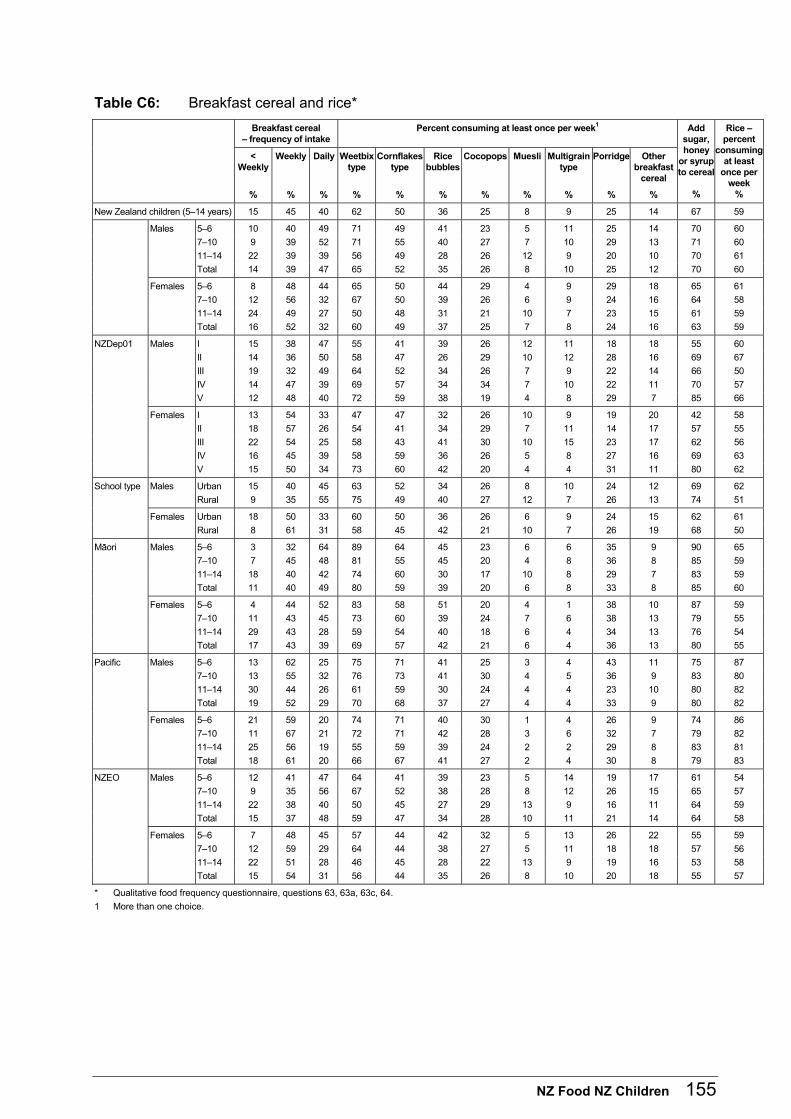
NZ Food NZ Children 155
Table C6: Breakfast cereal and rice*
Breakfast cereal – frequency of intake
Percent consuming at least once per week1
< Weekly
%
Weekly
%
Daily
%
Weetbix type
%
Cornflakes type
%
Rice bubbles
%
Cocopops
%
Muesli
%
Multigrain type
%
Porridge
%
Other breakfast
cereal %
Add sugar, honey
or syrup to cereal
%
Rice – percent
consuming at least
once per week
%
New Zealand children (5–14 years) 15 45 40 62 50 36 25 8 9 25 14 67 59
Males 5–6 10 40 49 71 49 41 23 5 11 25 14 70 60
7–10 9 39 52 71 55 40 27 7 10 29 13 71 60
11–14 22 39 39 56 49 28 26 12 9 20 10 70 61
Total 14 39 47 65 52 35 26 8 10 25 12 70 60
Females 5–6 8 48 44 65 50 44 29 4 9 29 18 65 61
7–10 12 56 32 67 50 39 26 6 9 24 16 64 58
11–14 24 49 27 50 48 31 21 10 7 23 15 61 59
Total 16 52 32 60 49 37 25 7 8 24 16 63 59
NZDep01 Males I 15 38 47 55 41 39 26 12 11 18 18 55 60
II 14 36 50 58 47 26 29 10 12 28 16 69 67
III 19 32 49 64 52 34 26 7 9 22 14 66 50
IV 14 47 39 69 57 34 34 7 10 22 11 70 57
V 12 48 40 72 59 38 19 4 8 29 7 85 66
Females I 13 54 33 47 47 32 26 10 9 19 20 42 58
II 18 57 26 54 41 34 29 7 11 14 17 57 55
III 22 54 25 58 43 41 30 10 15 23 17 62 56
IV 16 45 39 58 59 36 26 5 8 27 16 69 63
V 15 50 34 73 60 42 20 4 4 31 11 80 62
School type Males Urban 15 40 45 63 52 34 26 8 10 24 12 69 62
Rural 9 35 55 75 49 40 27 12 7 26 13 74 51
Females Urban 18 50 33 60 50 36 26 6 9 24 15 62 61
Rural 8 61 31 58 45 42 21 10 7 26 19 68 50
Mäori Males 5–6 3 32 64 89 64 45 23 6 6 35 9 90 65
7–10 7 45 48 81 55 45 20 4 8 36 8 85 59
11–14 18 40 42 74 60 30 17 10 8 29 7 83 59
Total 11 40 49 80 59 39 20 6 8 33 8 85 60
Females 5–6 4 44 52 83 58 51 20 4 1 38 10 87 59
7–10 11 43 45 73 60 39 24 7 6 38 13 79 55
11–14 29 43 28 59 54 40 18 6 4 34 13 76 54
Total 17 43 39 69 57 42 21 6 4 36 13 80 55
Pacific Males 5–6 13 62 25 75 71 41 25 3 4 43 11 75 87
7–10 13 55 32 76 73 41 30 4 5 36 9 83 80
11–14 30 44 26 61 59 30 24 4 4 23 10 80 82
Total 19 52 29 70 68 37 27 4 4 33 9 80 82
Females 5–6 21 59 20 74 71 40 30 1 4 26 9 74 86
7–10 11 67 21 72 71 42 28 3 6 32 7 79 82
11–14 25 56 19 55 59 39 24 2 2 29 8 83 81
Total 18 61 20 66 67 41 27 2 4 30 8 79 83
NZEO Males 5–6 12 41 47 64 41 39 23 5 14 19 17 61 54
7–10 9 35 56 67 52 38 28 8 12 26 15 65 57
11–14 22 38 40 50 45 27 29 13 9 16 11 64 59
Total 15 37 48 59 47 34 28 10 11 21 14 64 58
Females 5–6 7 48 45 57 44 42 32 5 13 26 22 55 59
7–10 12 59 29 64 44 38 27 5 11 18 18 57 56
11–14 22 51 28 46 45 28 22 13 9 19 16 53 58
Total 15 54 31 56 44 35 26 8 10 20 18 55 57
* Qualitative food frequency questionnaire, questions 63, 63a, 63c, 64.
1 More than one choice.
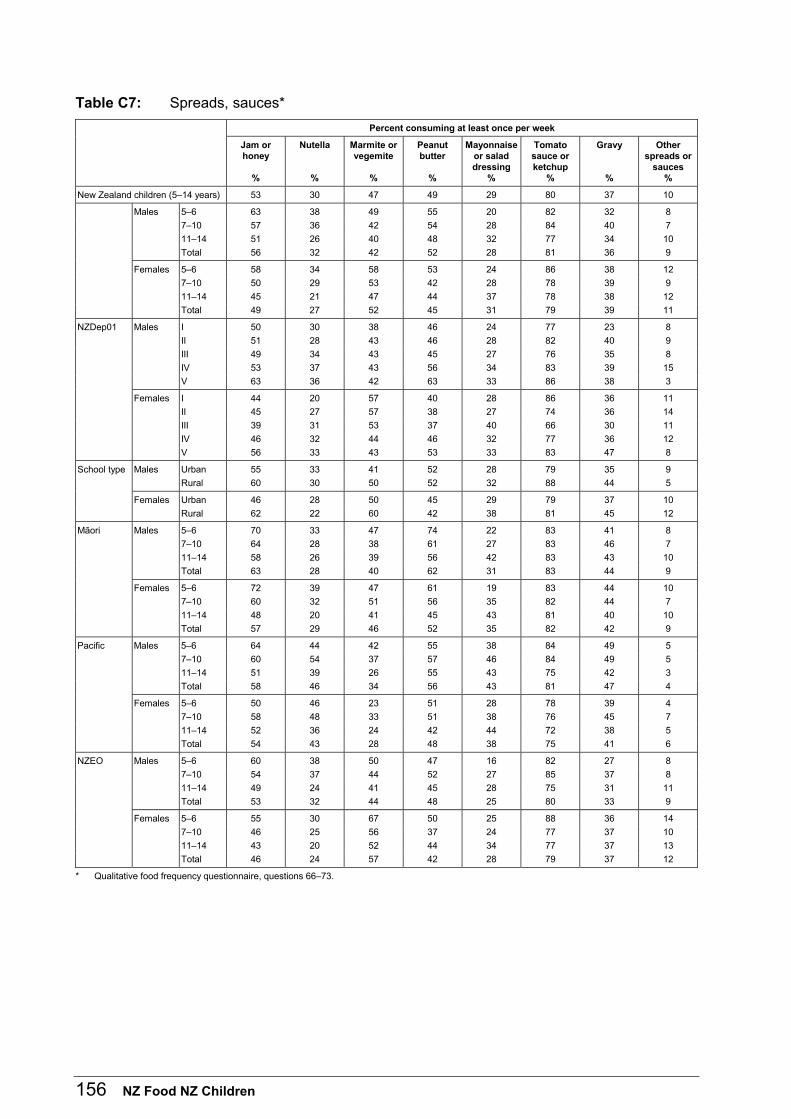
156 NZ Food NZ Children
Table C7: Spreads, sauces*
Percent consuming at least once per week
Jam or honey
%
Nutella
%
Marmite or vegemite
%
Peanut butter
%
Mayonnaise or salad dressing
%
Tomato sauce or ketchup
%
Gravy
%
Other spreads or
sauces %
New Zealand children (5–14 years) 53 30 47 49 29 80 37 10
Males 5–6 63 38 49 55 20 82 32 8
7–10 57 36 42 54 28 84 40 7
11–14 51 26 40 48 32 77 34 10
Total 56 32 42 52 28 81 36 9
Females 5–6 58 34 58 53 24 86 38 12
7–10 50 29 53 42 28 78 39 9
11–14 45 21 47 44 37 78 38 12
Total 49 27 52 45 31 79 39 11
NZDep01 Males I 50 30 38 46 24 77 23 8
II 51 28 43 46 28 82 40 9
III 49 34 43 45 27 76 35 8
IV 53 37 43 56 34 83 39 15
V 63 36 42 63 33 86 38 3
Females I 44 20 57 40 28 86 36 11
II 45 27 57 38 27 74 36 14
III 39 31 53 37 40 66 30 11
IV 46 32 44 46 32 77 36 12
V 56 33 43 53 33 83 47 8
School type Males Urban 55 33 41 52 28 79 35 9
Rural 60 30 50 52 32 88 44 5
Females Urban 46 28 50 45 29 79 37 10
Rural 62 22 60 42 38 81 45 12
Mäori Males 5–6 70 33 47 74 22 83 41 8
7–10 64 28 38 61 27 83 46 7
11–14 58 26 39 56 42 83 43 10
Total 63 28 40 62 31 83 44 9
Females 5–6 72 39 47 61 19 83 44 10
7–10 60 32 51 56 35 82 44 7
11–14 48 20 41 45 43 81 40 10
Total 57 29 46 52 35 82 42 9
Pacific Males 5–6 64 44 42 55 38 84 49 5
7–10 60 54 37 57 46 84 49 5
11–14 51 39 26 55 43 75 42 3
Total 58 46 34 56 43 81 47 4
Females 5–6 50 46 23 51 28 78 39 4
7–10 58 48 33 51 38 76 45 7
11–14 52 36 24 42 44 72 38 5
Total 54 43 28 48 38 75 41 6
NZEO Males 5–6 60 38 50 47 16 82 27 8
7–10 54 37 44 52 27 85 37 8
11–14 49 24 41 45 28 75 31 11
Total 53 32 44 48 25 80 33 9
Females 5–6 55 30 67 50 25 88 36 14
7–10 46 25 56 37 24 77 37 10
11–14 43 20 52 44 34 77 37 13
Total 46 24 57 42 28 79 37 12
* Qualitative food frequency questionnaire, questions 66–73.
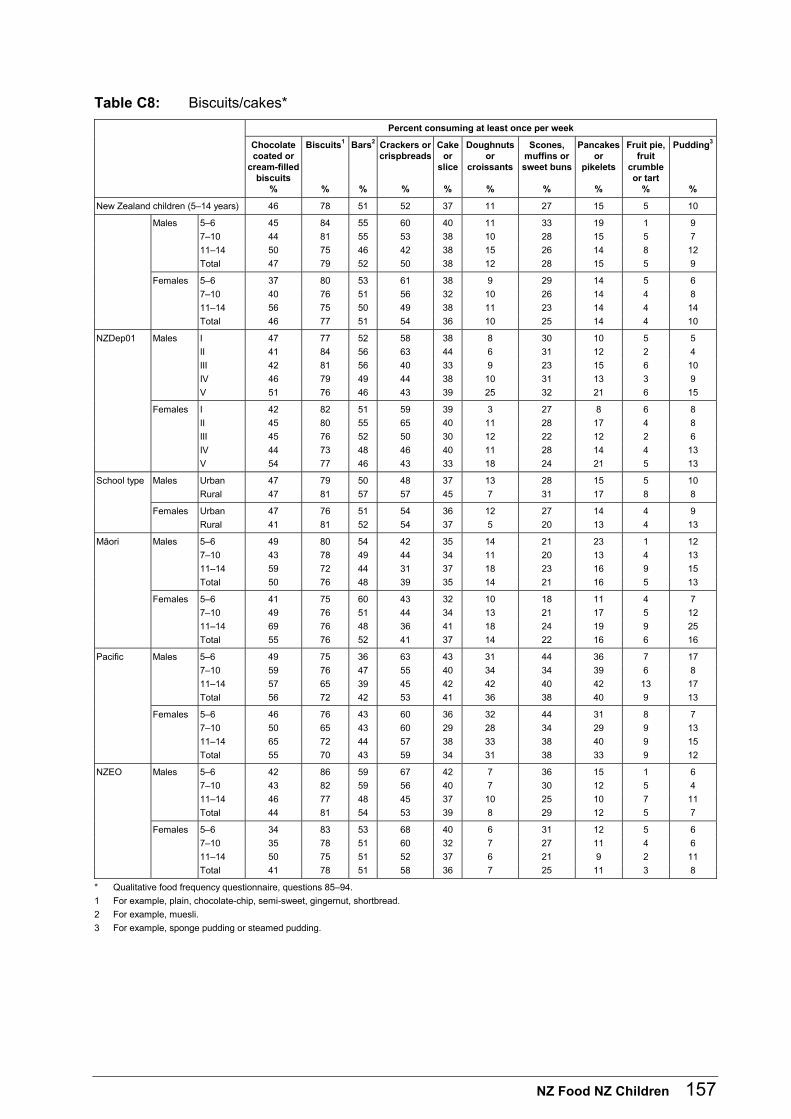
NZ Food NZ Children 157
Table C8: Biscuits/cakes*
Percent consuming at least once per week
Chocolate coated or
cream-filled biscuits
%
Biscuits1
%
Bars2
%
Crackers or crispbreads
%
Cake or
slice
%
Doughnuts or
croissants
%
Scones, muffins or sweet buns
%
Pancakes or
pikelets
%
Fruit pie, fruit
crumble or tart
%
Pudding3
%
New Zealand children (5–14 years) 46 78 51 52 37 11 27 15 5 10
Males 5–6 45 84 55 60 40 11 33 19 1 9
7–10 44 81 55 53 38 10 28 15 5 7
11–14 50 75 46 42 38 15 26 14 8 12
Total 47 79 52 50 38 12 28 15 5 9
Females 5–6 37 80 53 61 38 9 29 14 5 6
7–10 40 76 51 56 32 10 26 14 4 8
11–14 56 75 50 49 38 11 23 14 4 14
Total 46 77 51 54 36 10 25 14 4 10
NZDep01 Males I 47 77 52 58 38 8 30 10 5 5
II 41 84 56 63 44 6 31 12 2 4
III 42 81 56 40 33 9 23 15 6 10
IV 46 79 49 44 38 10 31 13 3 9
V 51 76 46 43 39 25 32 21 6 15
Females I 42 82 51 59 39 3 27 8 6 8
II 45 80 55 65 40 11 28 17 4 8
III 45 76 52 50 30 12 22 12 2 6
IV 44 73 48 46 40 11 28 14 4 13
V 54 77 46 43 33 18 24 21 5 13
School type Males Urban 47 79 50 48 37 13 28 15 5 10
Rural 47 81 57 57 45 7 31 17 8 8
Females Urban 47 76 51 54 36 12 27 14 4 9
Rural 41 81 52 54 37 5 20 13 4 13
Mäori Males 5–6 49 80 54 42 35 14 21 23 1 12
7–10 43 78 49 44 34 11 20 13 4 13
11–14 59 72 44 31 37 18 23 16 9 15
Total 50 76 48 39 35 14 21 16 5 13
Females 5–6 41 75 60 43 32 10 18 11 4 7
7–10 49 76 51 44 34 13 21 17 5 12
11–14 69 76 48 36 41 18 24 19 9 25
Total 55 76 52 41 37 14 22 16 6 16
Pacific Males 5–6 49 75 36 63 43 31 44 36 7 17
7–10 59 76 47 55 40 34 34 39 6 8
11–14 57 65 39 45 42 42 40 42 13 17
Total 56 72 42 53 41 36 38 40 9 13
Females 5–6 46 76 43 60 36 32 44 31 8 7
7–10 50 65 43 60 29 28 34 29 9 13
11–14 65 72 44 57 38 33 38 40 9 15
Total 55 70 43 59 34 31 38 33 9 12
NZEO Males 5–6 42 86 59 67 42 7 36 15 1 6
7–10 43 82 59 56 40 7 30 12 5 4
11–14 46 77 48 45 37 10 25 10 7 11
Total 44 81 54 53 39 8 29 12 5 7
Females 5–6 34 83 53 68 40 6 31 12 5 6
7–10 35 78 51 60 32 7 27 11 4 6
11–14 50 75 51 52 37 6 21 9 2 11
Total 41 78 51 58 36 7 25 11 3 8
* Qualitative food frequency questionnaire, questions 85–94. 1 For example, plain, chocolate-chip, semi-sweet, gingernut, shortbread. 2 For example, muesli. 3 For example, sponge pudding or steamed pudding.
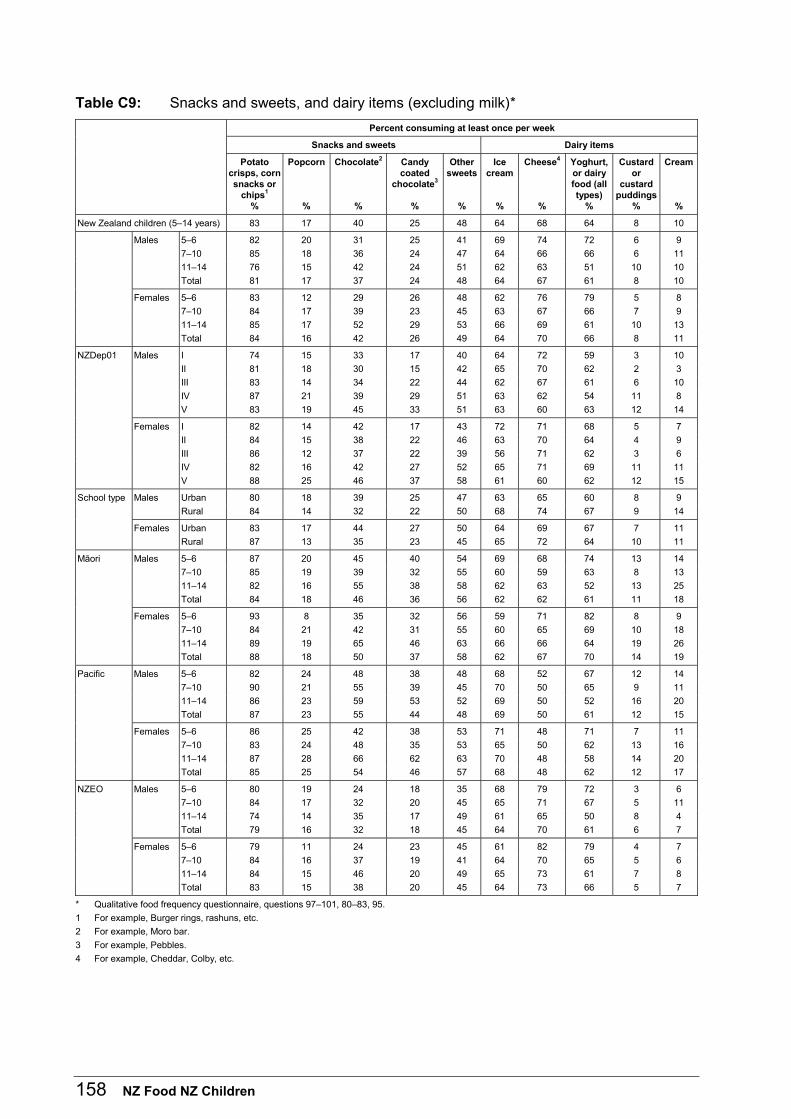
158 NZ Food NZ Children
Table C9: Snacks and sweets, and dairy items (excluding milk)*
Percent consuming at least once per week
Snacks and sweets Dairy items
Potato crisps, corn snacks or
chips1 %
Popcorn
%
Chocolate2
%
Candy coated
chocolate3
%
Other sweets
%
Ice cream
%
Cheese4
%
Yoghurt, or dairy food (all types)
%
Custard or
custard puddings
%
Cream
%
New Zealand children (5–14 years) 83 17 40 25 48 64 68 64 8 10
Males 5–6 82 20 31 25 41 69 74 72 6 9
7–10 85 18 36 24 47 64 66 66 6 11
11–14 76 15 42 24 51 62 63 51 10 10
Total 81 17 37 24 48 64 67 61 8 10
Females 5–6 83 12 29 26 48 62 76 79 5 8
7–10 84 17 39 23 45 63 67 66 7 9
11–14 85 17 52 29 53 66 69 61 10 13
Total 84 16 42 26 49 64 70 66 8 11
NZDep01 Males I 74 15 33 17 40 64 72 59 3 10
II 81 18 30 15 42 65 70 62 2 3
III 83 14 34 22 44 62 67 61 6 10
IV 87 21 39 29 51 63 62 54 11 8
V 83 19 45 33 51 63 60 63 12 14
Females I 82 14 42 17 43 72 71 68 5 7
II 84 15 38 22 46 63 70 64 4 9
III 86 12 37 22 39 56 71 62 3 6
IV 82 16 42 27 52 65 71 69 11 11
V 88 25 46 37 58 61 60 62 12 15
School type Males Urban 80 18 39 25 47 63 65 60 8 9
Rural 84 14 32 22 50 68 74 67 9 14
Females Urban 83 17 44 27 50 64 69 67 7 11
Rural 87 13 35 23 45 65 72 64 10 11
Mäori Males 5–6 87 20 45 40 54 69 68 74 13 14
7–10 85 19 39 32 55 60 59 63 8 13
11–14 82 16 55 38 58 62 63 52 13 25
Total 84 18 46 36 56 62 62 61 11 18
Females 5–6 93 8 35 32 56 59 71 82 8 9
7–10 84 21 42 31 55 60 65 69 10 18
11–14 89 19 65 46 63 66 66 64 19 26
Total 88 18 50 37 58 62 67 70 14 19
Pacific Males 5–6 82 24 48 38 48 68 52 67 12 14
7–10 90 21 55 39 45 70 50 65 9 11
11–14 86 23 59 53 52 69 50 52 16 20
Total 87 23 55 44 48 69 50 61 12 15
Females 5–6 86 25 42 38 53 71 48 71 7 11
7–10 83 24 48 35 53 65 50 62 13 16
11–14 87 28 66 62 63 70 48 58 14 20
Total 85 25 54 46 57 68 48 62 12 17
NZEO Males 5–6 80 19 24 18 35 68 79 72 3 6
7–10 84 17 32 20 45 65 71 67 5 11
11–14 74 14 35 17 49 61 65 50 8 4
Total 79 16 32 18 45 64 70 61 6 7
Females 5–6 79 11 24 23 45 61 82 79 4 7
7–10 84 16 37 19 41 64 70 65 5 6
11–14 84 15 46 20 49 65 73 61 7 8
Total 83 15 38 20 45 64 73 66 5 7
* Qualitative food frequency questionnaire, questions 97–101, 80–83, 95.
1 For example, Burger rings, rashuns, etc.
2 For example, Moro bar.
3 For example, Pebbles.
4 For example, Cheddar, Colby, etc.
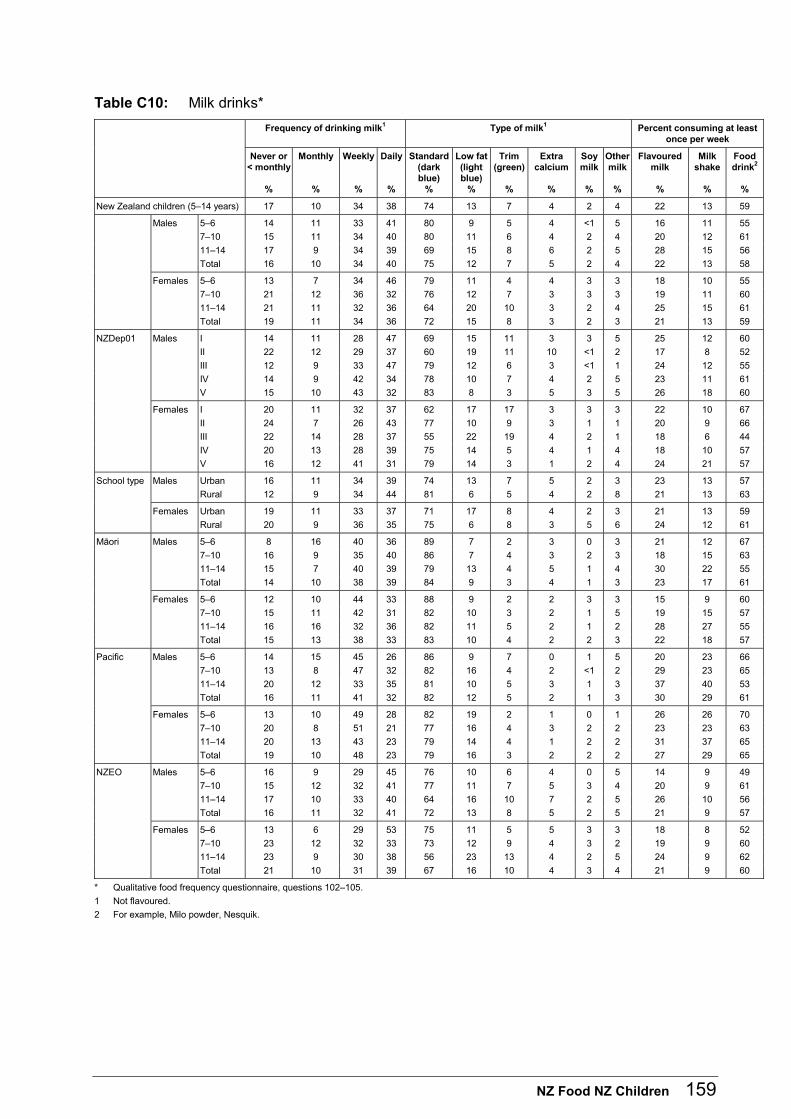
NZ Food NZ Children 159
Table C10: Milk drinks*
Frequency of drinking milk1 Type of milk1 Percent consuming at least once per week
Never or < monthly
%
Monthly
%
Weekly
%
Daily
%
Standard (dark blue)
%
Low fat (light blue)
%
Trim (green)
%
Extra calcium
%
Soy milk
%
Other milk
%
Flavoured milk
%
Milk shake
%
Food drink2
%
New Zealand children (5–14 years) 17 10 34 38 74 13 7 4 2 4 22 13 59
Males 5–6 14 11 33 41 80 9 5 4 <1 5 16 11 55
7–10 15 11 34 40 80 11 6 4 2 4 20 12 61
11–14 17 9 34 39 69 15 8 6 2 5 28 15 56
Total 16 10 34 40 75 12 7 5 2 4 22 13 58
Females 5–6 13 7 34 46 79 11 4 4 3 3 18 10 55
7–10 21 12 36 32 76 12 7 3 3 3 19 11 60
11–14 21 11 32 36 64 20 10 3 2 4 25 15 61
Total 19 11 34 36 72 15 8 3 2 3 21 13 59
NZDep01 Males I 14 11 28 47 69 15 11 3 3 5 25 12 60
II 22 12 29 37 60 19 11 10 <1 2 17 8 52
III 12 9 33 47 79 12 6 3 <1 1 24 12 55
IV 14 9 42 34 78 10 7 4 2 5 23 11 61
V 15 10 43 32 83 8 3 5 3 5 26 18 60
Females I 20 11 32 37 62 17 17 3 3 3 22 10 67
II 24 7 26 43 77 10 9 3 1 1 20 9 66
III 22 14 28 37 55 22 19 4 2 1 18 6 44
IV 20 13 28 39 75 14 5 4 1 4 18 10 57
V 16 12 41 31 79 14 3 1 2 4 24 21 57
School type Males Urban 16 11 34 39 74 13 7 5 2 3 23 13 57
Rural 12 9 34 44 81 6 5 4 2 8 21 13 63
Females Urban 19 11 33 37 71 17 8 4 2 3 21 13 59
Rural 20 9 36 35 75 6 8 3 5 6 24 12 61
Mäori Males 5–6 8 16 40 36 89 7 2 3 0 3 21 12 67
7–10 16 9 35 40 86 7 4 3 2 3 18 15 63
11–14 15 7 40 39 79 13 4 5 1 4 30 22 55
Total 14 10 38 39 84 9 3 4 1 3 23 17 61
Females 5–6 12 10 44 33 88 9 2 2 3 3 15 9 60
7–10 15 11 42 31 82 10 3 2 1 5 19 15 57
11–14 16 16 32 36 82 11 5 2 1 2 28 27 55
Total 15 13 38 33 83 10 4 2 2 3 22 18 57
Pacific Males 5–6 14 15 45 26 86 9 7 0 1 5 20 23 66
7–10 13 8 47 32 82 16 4 2 <1 2 29 23 65
11–14 20 12 33 35 81 10 5 3 1 3 37 40 53
Total 16 11 41 32 82 12 5 2 1 3 30 29 61
Females 5–6 13 10 49 28 82 19 2 1 0 1 26 26 70
7–10 20 8 51 21 77 16 4 3 2 2 23 23 63
11–14 20 13 43 23 79 14 4 1 2 2 31 37 65
Total 19 10 48 23 79 16 3 2 2 2 27 29 65
NZEO Males 5–6 16 9 29 45 76 10 6 4 0 5 14 9 49
7–10 15 12 32 41 77 11 7 5 3 4 20 9 61
11–14 17 10 33 40 64 16 10 7 2 5 26 10 56
Total 16 11 32 41 72 13 8 5 2 5 21 9 57
Females 5–6 13 6 29 53 75 11 5 5 3 3 18 8 52
7–10 23 12 32 33 73 12 9 4 3 2 19 9 60
11–14 23 9 30 38 56 23 13 4 2 5 24 9 62
Total 21 10 31 39 67 16 10 4 3 4 21 9 60
* Qualitative food frequency questionnaire, questions 102–105.
1 Not flavoured.
2 For example, Milo powder, Nesquik.
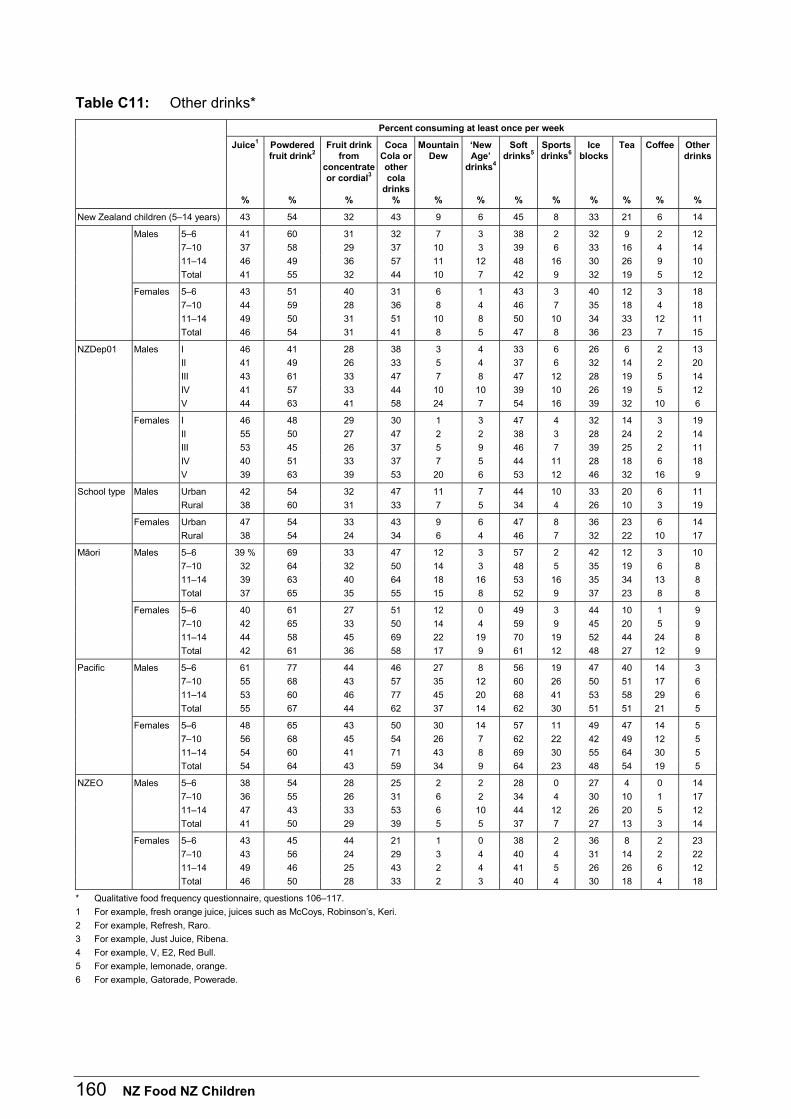
160 NZ Food NZ Children
Table C11: Other drinks*
Percent consuming at least once per week
Juice1
%
Powdered fruit drink2
%
Fruit drink from
concentrate or cordial3
%
Coca Cola or other cola
drinks%
Mountain Dew
%
‘New Age’
drinks4
%
Soft drinks5
%
Sports drinks6
%
Ice blocks
%
Tea
%
Coffee
%
Other drinks
%
New Zealand children (5–14 years) 43 54 32 43 9 6 45 8 33 21 6 14
Males 5–6 41 60 31 32 7 3 38 2 32 9 2 12
7–10 37 58 29 37 10 3 39 6 33 16 4 14
11–14 46 49 36 57 11 12 48 16 30 26 9 10
Total 41 55 32 44 10 7 42 9 32 19 5 12
Females 5–6 43 51 40 31 6 1 43 3 40 12 3 18
7–10 44 59 28 36 8 4 46 7 35 18 4 18
11–14 49 50 31 51 10 8 50 10 34 33 12 11
Total 46 54 31 41 8 5 47 8 36 23 7 15
NZDep01 Males I 46 41 28 38 3 4 33 6 26 6 2 13
II 41 49 26 33 5 4 37 6 32 14 2 20
III 43 61 33 47 7 8 47 12 28 19 5 14
IV 41 57 33 44 10 10 39 10 26 19 5 12
V 44 63 41 58 24 7 54 16 39 32 10 6
Females I 46 48 29 30 1 3 47 4 32 14 3 19
II 55 50 27 47 2 2 38 3 28 24 2 14
III 53 45 26 37 5 9 46 7 39 25 2 11
IV 40 51 33 37 7 5 44 11 28 18 6 18
V 39 63 39 53 20 6 53 12 46 32 16 9
School type Males Urban 42 54 32 47 11 7 44 10 33 20 6 11
Rural 38 60 31 33 7 5 34 4 26 10 3 19
Females Urban 47 54 33 43 9 6 47 8 36 23 6 14
Rural 38 54 24 34 6 4 46 7 32 22 10 17
Mäori Males 5–6 39 % 69 33 47 12 3 57 2 42 12 3 10
7–10 32 64 32 50 14 3 48 5 35 19 6 8
11–14 39 63 40 64 18 16 53 16 35 34 13 8
Total 37 65 35 55 15 8 52 9 37 23 8 8
Females 5–6 40 61 27 51 12 0 49 3 44 10 1 9
7–10 42 65 33 50 14 4 59 9 45 20 5 9
11–14 44 58 45 69 22 19 70 19 52 44 24 8
Total 42 61 36 58 17 9 61 12 48 27 12 9
Pacific Males 5–6 61 77 44 46 27 8 56 19 47 40 14 3
7–10 55 68 43 57 35 12 60 26 50 51 17 6
11–14 53 60 46 77 45 20 68 41 53 58 29 6
Total 55 67 44 62 37 14 62 30 51 51 21 5
Females 5–6 48 65 43 50 30 14 57 11 49 47 14 5
7–10 56 68 45 54 26 7 62 22 42 49 12 5
11–14 54 60 41 71 43 8 69 30 55 64 30 5
Total 54 64 43 59 34 9 64 23 48 54 19 5
NZEO Males 5–6 38 54 28 25 2 2 28 0 27 4 0 14
7–10 36 55 26 31 6 2 34 4 30 10 1 17
11–14 47 43 33 53 6 10 44 12 26 20 5 12
Total 41 50 29 39 5 5 37 7 27 13 3 14
Females 5–6 43 45 44 21 1 0 38 2 36 8 2 23
7–10 43 56 24 29 3 4 40 4 31 14 2 22
11–14 49 46 25 43 2 4 41 5 26 26 6 12
Total 46 50 28 33 2 3 40 4 30 18 4 18
* Qualitative food frequency questionnaire, questions 106–117.
1 For example, fresh orange juice, juices such as McCoys, Robinson’s, Keri.
2 For example, Refresh, Raro.
3 For example, Just Juice, Ribena.
4 For example, V, E2, Red Bull.
5 For example, lemonade, orange.
6 For example, Gatorade, Powerade.
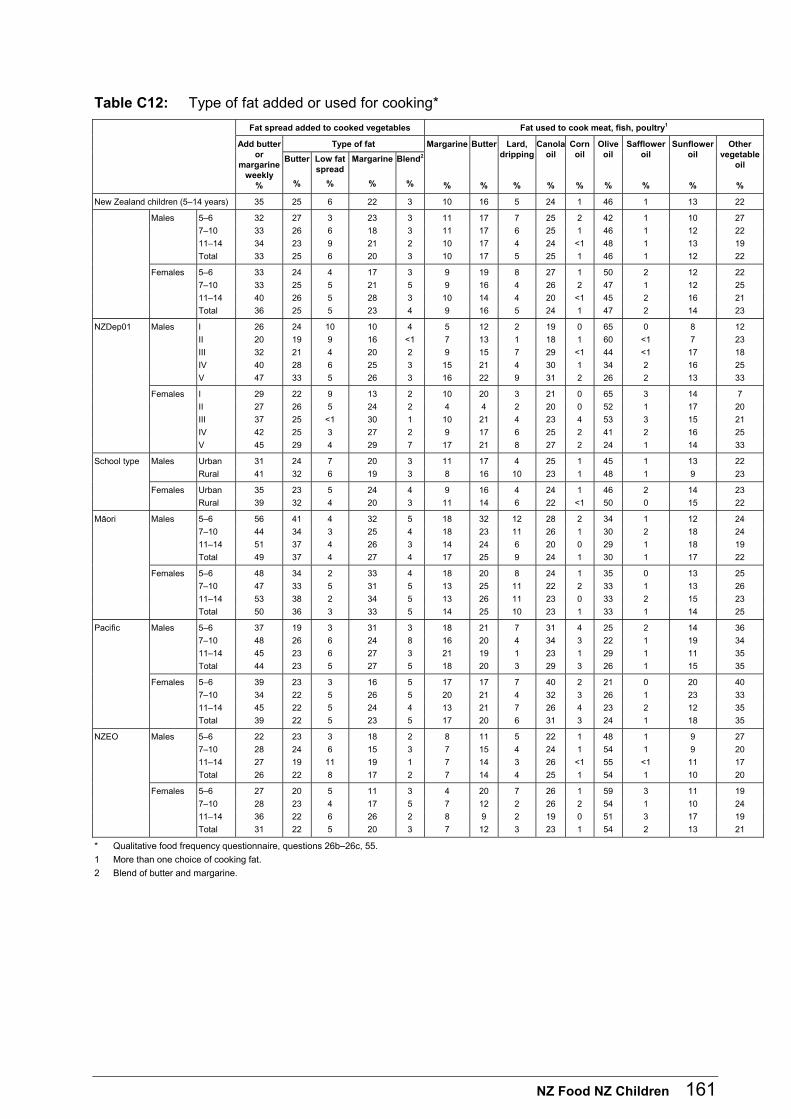
NZ Food NZ Children 161
Table C12: Type of fat added or used for cooking*
Fat spread added to cooked vegetables Fat used to cook meat, fish, poultry1
Type of fat
Add butter or
margarine weekly
%
Butter
%
Low fat spread
%
Margarine
%
Blend2
%
Margarine
%
Butter
%
Lard, dripping
%
Canola oil
%
Corn oil
%
Olive oil
%
Safflower oil
%
Sunflower oil
%
Other vegetable
oil
%
New Zealand children (5–14 years) 35 25 6 22 3 10 16 5 24 1 46 1 13 22
Males 5–6 32 27 3 23 3 11 17 7 25 2 42 1 10 27
7–10 33 26 6 18 3 11 17 6 25 1 46 1 12 22
11–14 34 23 9 21 2 10 17 4 24 <1 48 1 13 19
Total 33 25 6 20 3 10 17 5 25 1 46 1 12 22
Females 5–6 33 24 4 17 3 9 19 8 27 1 50 2 12 22
7–10 33 25 5 21 5 9 16 4 26 2 47 1 12 25
11–14 40 26 5 28 3 10 14 4 20 <1 45 2 16 21
Total 36 25 5 23 4 9 16 5 24 1 47 2 14 23
NZDep01 Males I 26 24 10 10 4 5 12 2 19 0 65 0 8 12
II 20 19 9 16 <1 7 13 1 18 1 60 <1 7 23
III 32 21 4 20 2 9 15 7 29 <1 44 <1 17 18
IV 40 28 6 25 3 15 21 4 30 1 34 2 16 25
V 47 33 5 26 3 16 22 9 31 2 26 2 13 33
Females I 29 22 9 13 2 10 20 3 21 0 65 3 14 7
II 27 26 5 24 2 4 4 2 20 0 52 1 17 20
III 37 25 <1 30 1 10 21 4 23 4 53 3 15 21
IV 42 25 3 27 2 9 17 6 25 2 41 2 16 25
V 45 29 4 29 7 17 21 8 27 2 24 1 14 33
School type Males Urban 31 24 7 20 3 11 17 4 25 1 45 1 13 22
Rural 41 32 6 19 3 8 16 10 23 1 48 1 9 23
Females Urban 35 23 5 24 4 9 16 4 24 1 46 2 14 23
Rural 39 32 4 20 3 11 14 6 22 <1 50 0 15 22
Mäori Males 5–6 56 41 4 32 5 18 32 12 28 2 34 1 12 24
7–10 44 34 3 25 4 18 23 11 26 1 30 2 18 24
11–14 51 37 4 26 3 14 24 6 20 0 29 1 18 19
Total 49 37 4 27 4 17 25 9 24 1 30 1 17 22
Females 5–6 48 34 2 33 4 18 20 8 24 1 35 0 13 25
7–10 47 33 5 31 5 13 25 11 22 2 33 1 13 26
11–14 53 38 2 34 5 13 26 11 23 0 33 2 15 23
Total 50 36 3 33 5 14 25 10 23 1 33 1 14 25
Pacific Males 5–6 37 19 3 31 3 18 21 7 31 4 25 2 14 36
7–10 48 26 6 24 8 16 20 4 34 3 22 1 19 34
11–14 45 23 6 27 3 21 19 1 23 1 29 1 11 35
Total 44 23 5 27 5 18 20 3 29 3 26 1 15 35
Females 5–6 39 23 3 16 5 17 17 7 40 2 21 0 20 40
7–10 34 22 5 26 5 20 21 4 32 3 26 1 23 33
11–14 45 22 5 24 4 13 21 7 26 4 23 2 12 35
Total 39 22 5 23 5 17 20 6 31 3 24 1 18 35
NZEO Males 5–6 22 23 3 18 2 8 11 5 22 1 48 1 9 27
7–10 28 24 6 15 3 7 15 4 24 1 54 1 9 20
11–14 27 19 11 19 1 7 14 3 26 <1 55 <1 11 17
Total 26 22 8 17 2 7 14 4 25 1 54 1 10 20
Females 5–6 27 20 5 11 3 4 20 7 26 1 59 3 11 19
7–10 28 23 4 17 5 7 12 2 26 2 54 1 10 24
11–14 36 22 6 26 2 8 9 2 19 0 51 3 17 19
Total 31 22 5 20 3 7 12 3 23 1 54 2 13 21
* Qualitative food frequency questionnaire, questions 26b–26c, 55.
1 More than one choice of cooking fat.
2 Blend of butter and margarine.
162 NZ Food NZ Children
D. Physical Activity
Introduction Participants were questioned about the time spent in the previous seven days watching television or videos or playing computer or video games. The questions also provided data on the reported amount of time spent on these activities on the weekend days and the ‘normal’ time spent on weekdays. The physical activity questions were based on the Physical Activity Questionnaire for Children (PAQ-C) (Crocker et al 1997). The questions provided data on the reported frequency of participation in several activities and a profile of the times of day when children were most active in the previous seven days. An overall activity score was calculated for each child (see Appendix B).
Key points
Television or video watching
• Seventy-three percent of New Zealand children did not watch or watched less than two hours of television or videos per weekday, and 60 percent per weekend day.
• A higher proportion of Mäori and Pacific children watched television or videos at least four hours per day than NZEO children, both during the week and weekends.
Computer or video games
• About 60 percent of New Zealand children did not play computer or video games during the weekend or the week.
• Males were more likely than females to have reported playing computer or video games.
• Pacific children were less likely than Mäori or NZEO children to have played computer or video games.
Overall physical activity
• Males (29 percent) were more likely than females (15.6 percent) to be in the highest activity quartile.
• Children in NZDep01-V were more likely to be in the highest activity quartile than NZDep01-I children.
• NZEO females (12.9 percent) were less likely than Pacific (20.4 percent) and Mäori (21.8 percent) females to be represented in the highest activity quartile.
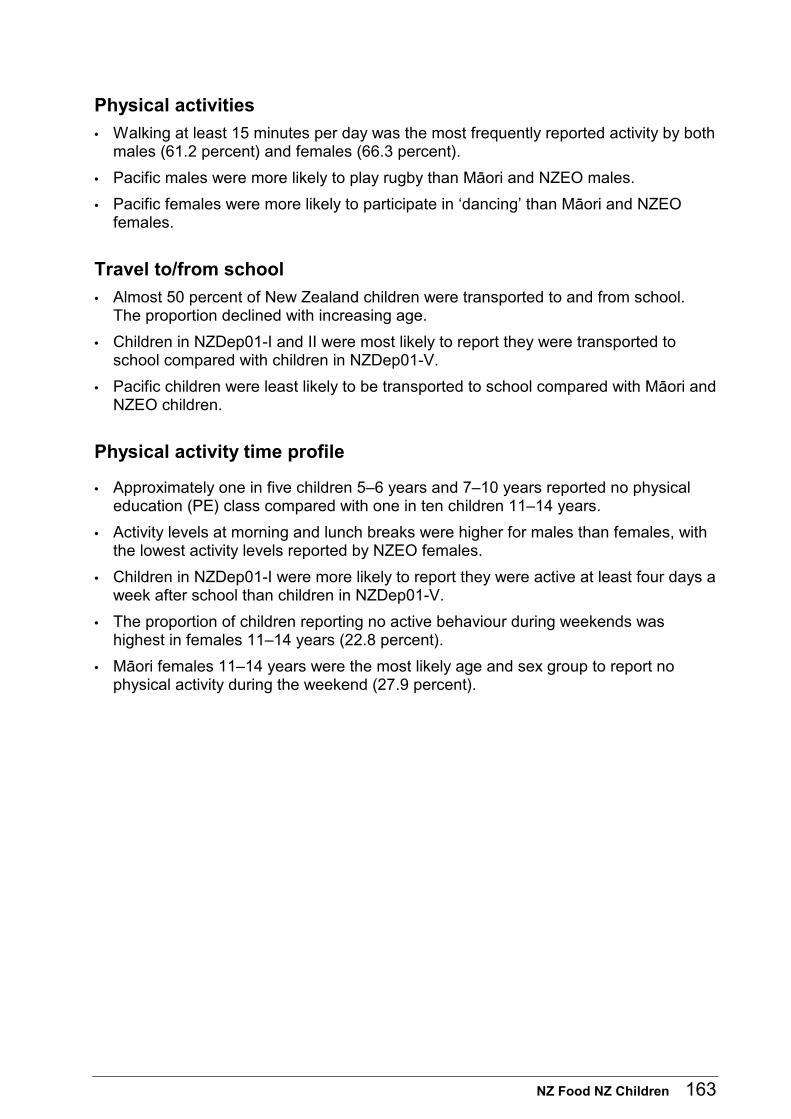
NZ Food NZ Children 163
Physical activities
• Walking at least 15 minutes per day was the most frequently reported activity by both males (61.2 percent) and females (66.3 percent).
• Pacific males were more likely to play rugby than Mäori and NZEO males.
• Pacific females were more likely to participate in ‘dancing’ than Mäori and NZEO females.
Travel to/from school
• Almost 50 percent of New Zealand children were transported to and from school. The proportion declined with increasing age.
• Children in NZDep01-I and II were most likely to report they were transported to school compared with children in NZDep01-V.
• Pacific children were least likely to be transported to school compared with Mäori and NZEO children.
Physical activity time profile
• Approximately one in five children 5–6 years and 7–10 years reported no physical education (PE) class compared with one in ten children 11–14 years.
• Activity levels at morning and lunch breaks were higher for males than females, with the lowest activity levels reported by NZEO females.
• Children in NZDep01-I were more likely to report they were active at least four days a week after school than children in NZDep01-V.
• The proportion of children reporting no active behaviour during weekends was highest in females 11–14 years (22.8 percent).
• Mäori females 11–14 years were the most likely age and sex group to report no physical activity during the weekend (27.9 percent).
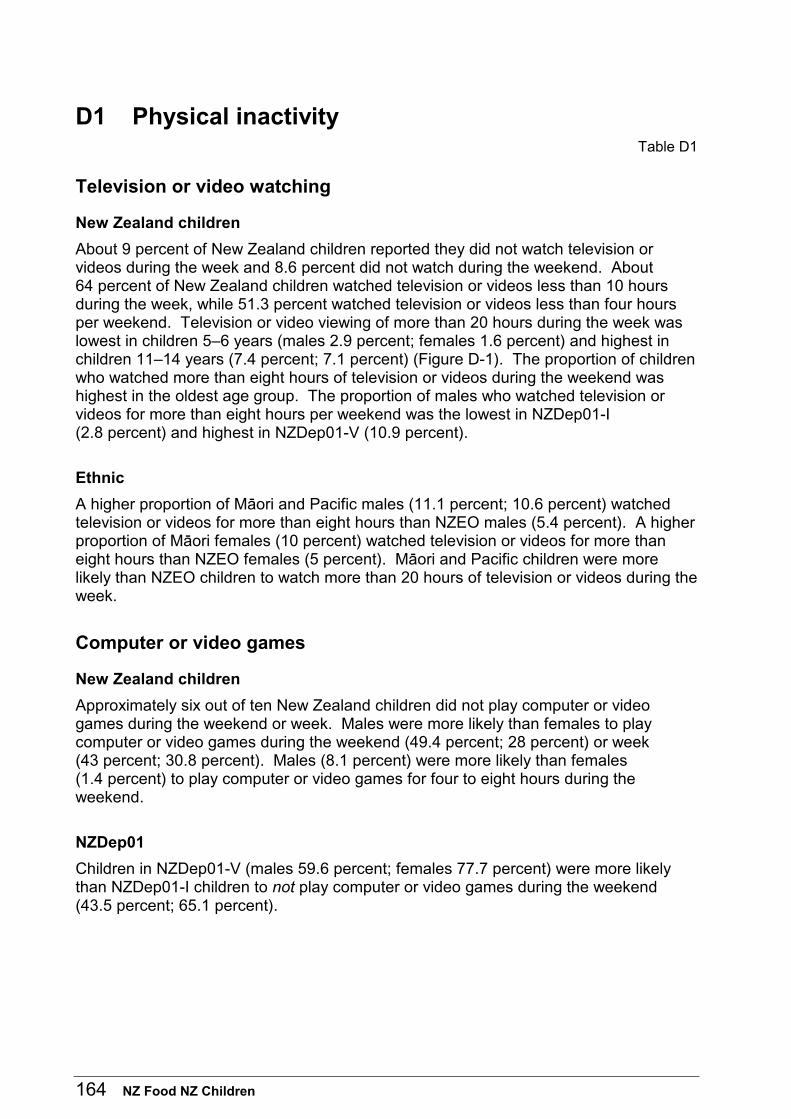
164 NZ Food NZ Children
D1 Physical inactivity Table D1
Television or video watching
New Zealand children
About 9 percent of New Zealand children reported they did not watch television or videos during the week and 8.6 percent did not watch during the weekend. About 64 percent of New Zealand children watched television or videos less than 10 hours during the week, while 51.3 percent watched television or videos less than four hours per weekend. Television or video viewing of more than 20 hours during the week was lowest in children 5–6 years (males 2.9 percent; females 1.6 percent) and highest in children 11–14 years (7.4 percent; 7.1 percent) (Figure D-1). The proportion of children who watched more than eight hours of television or videos during the weekend was highest in the oldest age group. The proportion of males who watched television or videos for more than eight hours per weekend was the lowest in NZDep01-I (2.8 percent) and highest in NZDep01-V (10.9 percent).
Ethnic
A higher proportion of Mäori and Pacific males (11.1 percent; 10.6 percent) watched television or videos for more than eight hours than NZEO males (5.4 percent). A higher proportion of Mäori females (10 percent) watched television or videos for more than eight hours than NZEO females (5 percent). Mäori and Pacific children were more likely than NZEO children to watch more than 20 hours of television or videos during the week.
Computer or video games
New Zealand children
Approximately six out of ten New Zealand children did not play computer or video games during the weekend or week. Males were more likely than females to play computer or video games during the weekend (49.4 percent; 28 percent) or week (43 percent; 30.8 percent). Males (8.1 percent) were more likely than females (1.4 percent) to play computer or video games for four to eight hours during the weekend.
NZDep01
Children in NZDep01-V (males 59.6 percent; females 77.7 percent) were more likely than NZDep01-I children to not play computer or video games during the weekend (43.5 percent; 65.1 percent).
NZ Food NZ Children 165
Ethnic
Pacific children (males 70.1 percent; females 82.5 percent) were more likely than Mäori (58.1 percent; 75.4 percent) or NZEO children (47.1 percent; 69.5 percent) not to play computer or video games during the weekend (Figure D-2).
Figure D-1: Television or video > 20 hours during school days
Figure D-2: No weekend computer or video games (males)
0%
1%
2%
3%
4%
5%
6%
7%
8%
5–6 7–10 11–14
Age group (years)
Proportion Males
Females
0%
10%
20%
30%
40%
50%
60%
70%
80%
5–6 7–10 11–14
Age group (years)
Proportion Mäori
Pacific
NZEO
166 NZ Food NZ Children
D2 Physical activity participation Table D2
Overall physical activity
New Zealand children
Children were assigned to one of four activity quartiles based on their reported overall activity in the previous seven days. Children in quartile I were the least active and those in quartile IV the most active. Females (all age groups) were more likely than males to be in the least active group. Males (29 percent) were more likely than females (15.6 percent) to be in the highest activity quartile (Figure D-3).
NZDep01
NZDep01-V children (males 31.4 percent; females 20.8 percent) were more likely to be in the most active group than NZDep01-I children (males 20.7 percent; females 13.1 percent).
Ethnic
NZEO children were more likely to be in the least active group (males 23.1 percent; females 37.7 percent) and least likely to be in the most active group (27.7 percent; 12.9 percent) than Mäori or Pacific children. Pacific children had the lowest proportion in the least active group (males 17 percent; females 30.6 percent) and Mäori children the highest proportion in the most active group (33 percent; 21.8 percent).
Physical activities
New Zealand children
Walking at least 15 minutes per day was the most frequently reported activity by New Zealand children (63.7 percent). The youngest children (5–6 years) were less likely to participate in this activity (males 54.3 percent; females 57.7 percent) than children 11–14 years (65.2 percent; 74.2 percent). On the other hand, the youngest children were more likely to participate in active games (males 74.2 percent; females 76 percent) than children 11–14 years (46 percent; 43 percent).
NZDep01
Children in NZDep01-I were least likely to participate in active games (for example, tag, bull rush or skipping) than children in NZDep01-V. NZDep01-I males were more likely to report cycling than NZDep01-V males (51.4 percent; 38.3 percent).
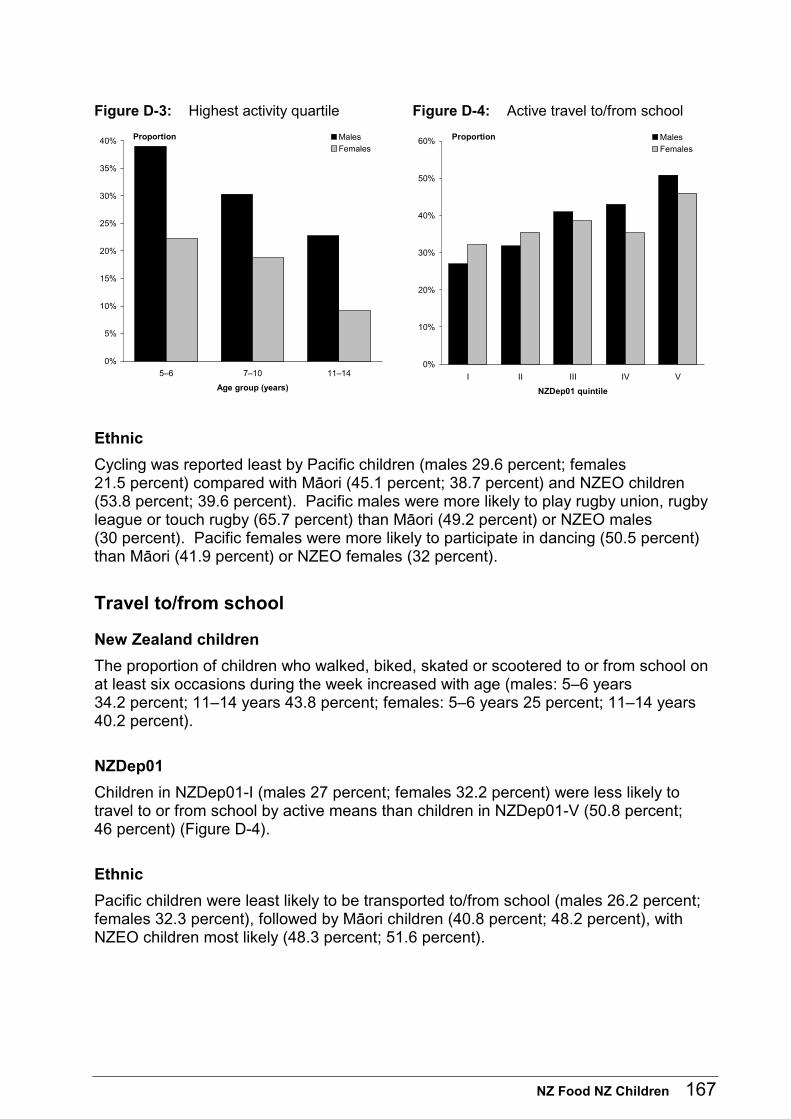
NZ Food NZ Children 167
Figure D-3: Highest activity quartile Figure D-4: Active travel to/from school
0%
5%
10%
15%
20%
25%
30%
35%
40%
5–6 7–10 11–14
Age group (years)
Proportion Males
Females
0%
10%
20%
30%
40%
50%
60%
I II III IV V
NZDep01 quintile
Proportion Males
Females
Ethnic
Cycling was reported least by Pacific children (males 29.6 percent; females 21.5 percent) compared with Mäori (45.1 percent; 38.7 percent) and NZEO children (53.8 percent; 39.6 percent). Pacific males were more likely to play rugby union, rugby league or touch rugby (65.7 percent) than Mäori (49.2 percent) or NZEO males (30 percent). Pacific females were more likely to participate in dancing (50.5 percent) than Mäori (41.9 percent) or NZEO females (32 percent).
Travel to/from school
New Zealand children
The proportion of children who walked, biked, skated or scootered to or from school on at least six occasions during the week increased with age (males: 5–6 years 34.2 percent; 11–14 years 43.8 percent; females: 5–6 years 25 percent; 11–14 years 40.2 percent).
NZDep01
Children in NZDep01-I (males 27 percent; females 32.2 percent) were less likely to travel to or from school by active means than children in NZDep01-V (50.8 percent; 46 percent) (Figure D-4).
Ethnic
Pacific children were least likely to be transported to/from school (males 26.2 percent; females 32.3 percent), followed by Mäori children (40.8 percent; 48.2 percent), with NZEO children most likely (48.3 percent; 51.6 percent).
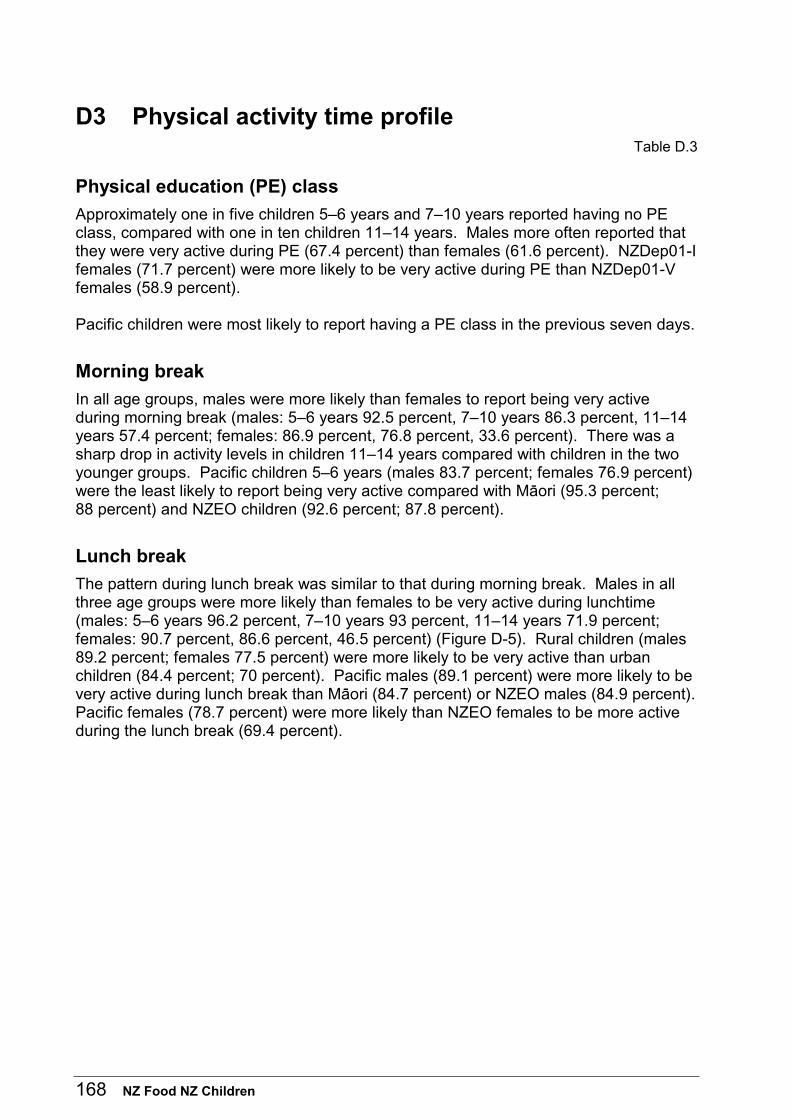
168 NZ Food NZ Children
D3 Physical activity time profile Table D.3
Physical education (PE) class
Approximately one in five children 5–6 years and 7–10 years reported having no PE class, compared with one in ten children 11–14 years. Males more often reported that they were very active during PE (67.4 percent) than females (61.6 percent). NZDep01-I females (71.7 percent) were more likely to be very active during PE than NZDep01-V females (58.9 percent). Pacific children were most likely to report having a PE class in the previous seven days.
Morning break
In all age groups, males were more likely than females to report being very active during morning break (males: 5–6 years 92.5 percent, 7–10 years 86.3 percent, 11–14 years 57.4 percent; females: 86.9 percent, 76.8 percent, 33.6 percent). There was a sharp drop in activity levels in children 11–14 years compared with children in the two younger groups. Pacific children 5–6 years (males 83.7 percent; females 76.9 percent) were the least likely to report being very active compared with Mäori (95.3 percent; 88 percent) and NZEO children (92.6 percent; 87.8 percent).
Lunch break
The pattern during lunch break was similar to that during morning break. Males in all three age groups were more likely than females to be very active during lunchtime (males: 5–6 years 96.2 percent, 7–10 years 93 percent, 11–14 years 71.9 percent; females: 90.7 percent, 86.6 percent, 46.5 percent) (Figure D-5). Rural children (males 89.2 percent; females 77.5 percent) were more likely to be very active than urban children (84.4 percent; 70 percent). Pacific males (89.1 percent) were more likely to be very active during lunch break than Mäori (84.7 percent) or NZEO males (84.9 percent). Pacific females (78.7 percent) were more likely than NZEO females to be more active during the lunch break (69.4 percent).
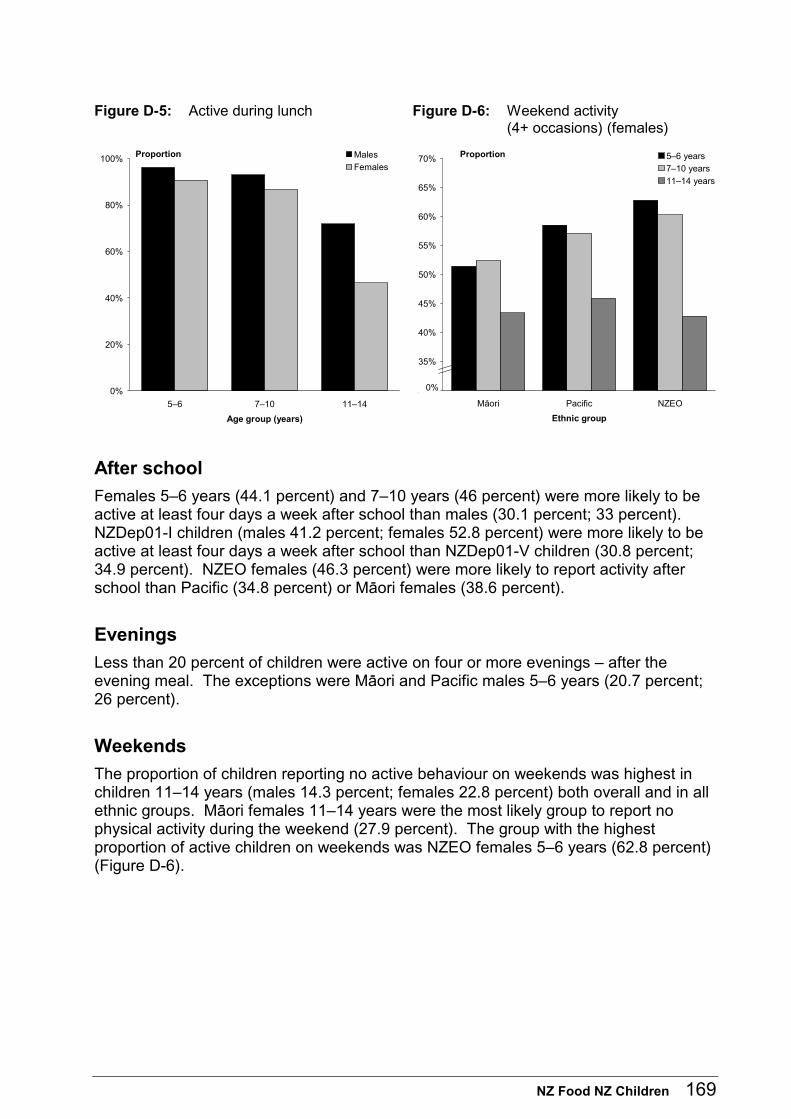
NZ Food NZ Children 169
Figure D-5: Active during lunch Figure D-6: Weekend activity (4+ occasions) (females)
0%
20%
40%
60%
80%
100%
5–6 7–10 11–14
Age group (years)
Proportion Males
Females
30%
35%
40%
45%
50%
55%
60%
65%
70%
Mäori Pacific NZEO
Ethnic group
Proportion 5–6 years
7–10 years
11–14 years
0%
After school
Females 5–6 years (44.1 percent) and 7–10 years (46 percent) were more likely to be active at least four days a week after school than males (30.1 percent; 33 percent). NZDep01-I children (males 41.2 percent; females 52.8 percent) were more likely to be active at least four days a week after school than NZDep01-V children (30.8 percent; 34.9 percent). NZEO females (46.3 percent) were more likely to report activity after school than Pacific (34.8 percent) or Mäori females (38.6 percent).
Evenings
Less than 20 percent of children were active on four or more evenings – after the evening meal. The exceptions were Mäori and Pacific males 5–6 years (20.7 percent; 26 percent).
Weekends
The proportion of children reporting no active behaviour on weekends was highest in children 11–14 years (males 14.3 percent; females 22.8 percent) both overall and in all ethnic groups. Mäori females 11–14 years were the most likely group to report no physical activity during the weekend (27.9 percent). The group with the highest proportion of active children on weekends was NZEO females 5–6 years (62.8 percent) (Figure D-6).
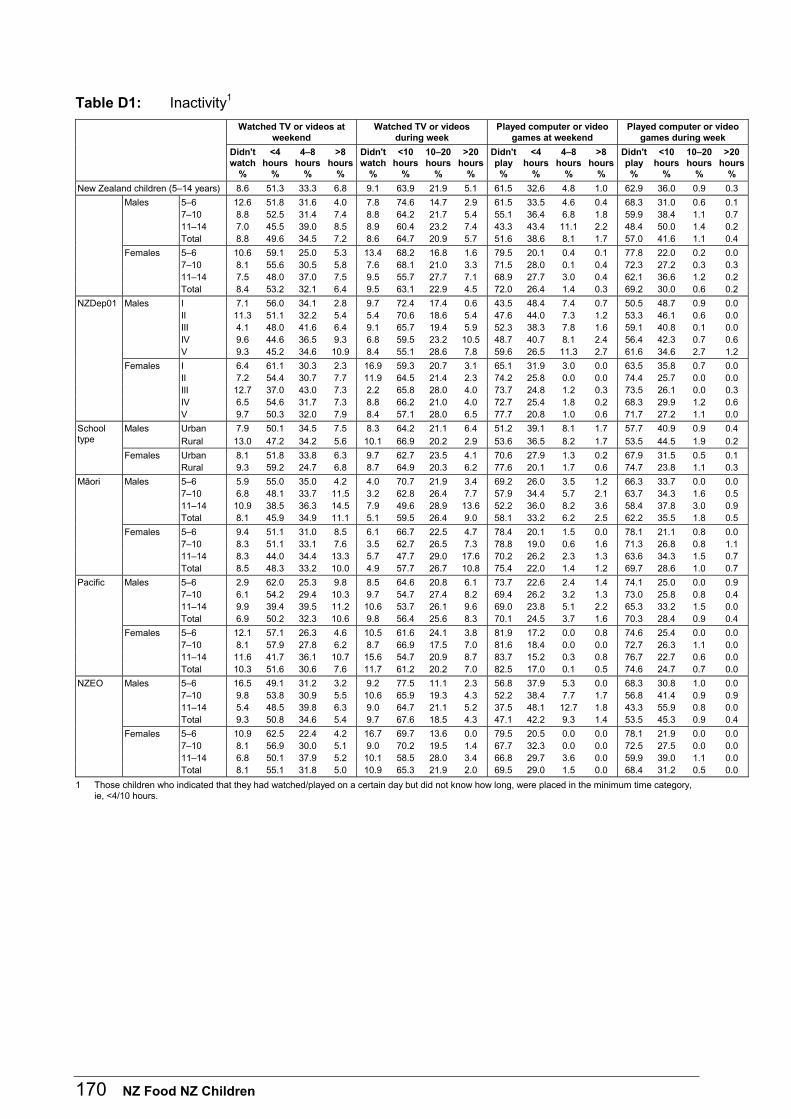
170 NZ Food NZ Children
Table D1: Inactivity1
Watched TV or videos at weekend
Watched TV or videos during week
Played computer or video games at weekend
Played computer or video games during week
Didn't watch
%
<4 hours
%
4–8 hours
%
>8 hours
%
Didn't watch
%
<10 hours
%
10–20 hours
%
>20 hours
%
Didn't play%
<4 hours
%
4–8 hours
%
>8 hours
%
Didn't play %
<10 hours
%
10–20 hours
%
>20 hours
%
New Zealand children (5–14 years) 8.6 51.3 33.3 6.8 9.1 63.9 21.9 5.1 61.5 32.6 4.8 1.0 62.9 36.0 0.9 0.3
Males 5–6 12.6 51.8 31.6 4.0 7.8 74.6 14.7 2.9 61.5 33.5 4.6 0.4 68.3 31.0 0.6 0.1 7–10 8.8 52.5 31.4 7.4 8.8 64.2 21.7 5.4 55.1 36.4 6.8 1.8 59.9 38.4 1.1 0.7 11–14 7.0 45.5 39.0 8.5 8.9 60.4 23.2 7.4 43.3 43.4 11.1 2.2 48.4 50.0 1.4 0.2 Total 8.8 49.6 34.5 7.2 8.6 64.7 20.9 5.7 51.6 38.6 8.1 1.7 57.0 41.6 1.1 0.4
Females 5–6 10.6 59.1 25.0 5.3 13.4 68.2 16.8 1.6 79.5 20.1 0.4 0.1 77.8 22.0 0.2 0.0 7–10 8.1 55.6 30.5 5.8 7.6 68.1 21.0 3.3 71.5 28.0 0.1 0.4 72.3 27.2 0.3 0.3 11–14 7.5 48.0 37.0 7.5 9.5 55.7 27.7 7.1 68.9 27.7 3.0 0.4 62.1 36.6 1.2 0.2 Total 8.4 53.2 32.1 6.4 9.5 63.1 22.9 4.5 72.0 26.4 1.4 0.3 69.2 30.0 0.6 0.2
NZDep01 Males I 7.1 56.0 34.1 2.8 9.7 72.4 17.4 0.6 43.5 48.4 7.4 0.7 50.5 48.7 0.9 0.0 II 11.3 51.1 32.2 5.4 5.4 70.6 18.6 5.4 47.6 44.0 7.3 1.2 53.3 46.1 0.6 0.0 III 4.1 48.0 41.6 6.4 9.1 65.7 19.4 5.9 52.3 38.3 7.8 1.6 59.1 40.8 0.1 0.0 IV 9.6 44.6 36.5 9.3 6.8 59.5 23.2 10.5 48.7 40.7 8.1 2.4 56.4 42.3 0.7 0.6 V 9.3 45.2 34.6 10.9 8.4 55.1 28.6 7.8 59.6 26.5 11.3 2.7 61.6 34.6 2.7 1.2
Females I 6.4 61.1 30.3 2.3 16.9 59.3 20.7 3.1 65.1 31.9 3.0 0.0 63.5 35.8 0.7 0.0 II 7.2 54.4 30.7 7.7 11.9 64.5 21.4 2.3 74.2 25.8 0.0 0.0 74.4 25.7 0.0 0.0 III 12.7 37.0 43.0 7.3 2.2 65.8 28.0 4.0 73.7 24.8 1.2 0.3 73.5 26.1 0.0 0.3 IV 6.5 54.6 31.7 7.3 8.8 66.2 21.0 4.0 72.7 25.4 1.8 0.2 68.3 29.9 1.2 0.6 V 9.7 50.3 32.0 7.9 8.4 57.1 28.0 6.5 77.7 20.8 1.0 0.6 71.7 27.2 1.1 0.0
Males Urban 7.9 50.1 34.5 7.5 8.3 64.2 21.1 6.4 51.2 39.1 8.1 1.7 57.7 40.9 0.9 0.4 School type Rural 13.0 47.2 34.2 5.6 10.1 66.9 20.2 2.9 53.6 36.5 8.2 1.7 53.5 44.5 1.9 0.2
Females Urban 8.1 51.8 33.8 6.3 9.7 62.7 23.5 4.1 70.6 27.9 1.3 0.2 67.9 31.5 0.5 0.1 Rural 9.3 59.2 24.7 6.8 8.7 64.9 20.3 6.2 77.6 20.1 1.7 0.6 74.7 23.8 1.1 0.3
Mäori Males 5–6 5.9 55.0 35.0 4.2 4.0 70.7 21.9 3.4 69.2 26.0 3.5 1.2 66.3 33.7 0.0 0.0 7–10 6.8 48.1 33.7 11.5 3.2 62.8 26.4 7.7 57.9 34.4 5.7 2.1 63.7 34.3 1.6 0.5 11–14 10.9 38.5 36.3 14.5 7.9 49.6 28.9 13.6 52.2 36.0 8.2 3.6 58.4 37.8 3.0 0.9 Total 8.1 45.9 34.9 11.1 5.1 59.5 26.4 9.0 58.1 33.2 6.2 2.5 62.2 35.5 1.8 0.5
Females 5–6 9.4 51.1 31.0 8.5 6.1 66.7 22.5 4.7 78.4 20.1 1.5 0.0 78.1 21.1 0.8 0.0 7–10 8.3 51.1 33.1 7.6 3.5 62.7 26.5 7.3 78.8 19.0 0.6 1.6 71.3 26.8 0.8 1.1 11–14 8.3 44.0 34.4 13.3 5.7 47.7 29.0 17.6 70.2 26.2 2.3 1.3 63.6 34.3 1.5 0.7 Total 8.5 48.3 33.2 10.0 4.9 57.7 26.7 10.8 75.4 22.0 1.4 1.2 69.7 28.6 1.0 0.7
Pacific Males 5–6 2.9 62.0 25.3 9.8 8.5 64.6 20.8 6.1 73.7 22.6 2.4 1.4 74.1 25.0 0.0 0.9 7–10 6.1 54.2 29.4 10.3 9.7 54.7 27.4 8.2 69.4 26.2 3.2 1.3 73.0 25.8 0.8 0.4 11–14 9.9 39.4 39.5 11.2 10.6 53.7 26.1 9.6 69.0 23.8 5.1 2.2 65.3 33.2 1.5 0.0 Total 6.9 50.2 32.3 10.6 9.8 56.4 25.6 8.3 70.1 24.5 3.7 1.6 70.3 28.4 0.9 0.4
Females 5–6 12.1 57.1 26.3 4.6 10.5 61.6 24.1 3.8 81.9 17.2 0.0 0.8 74.6 25.4 0.0 0.0 7–10 8.1 57.9 27.8 6.2 8.7 66.9 17.5 7.0 81.6 18.4 0.0 0.0 72.7 26.3 1.1 0.0 11–14 11.6 41.7 36.1 10.7 15.6 54.7 20.9 8.7 83.7 15.2 0.3 0.8 76.7 22.7 0.6 0.0 Total 10.3 51.6 30.6 7.6 11.7 61.2 20.2 7.0 82.5 17.0 0.1 0.5 74.6 24.7 0.7 0.0
NZEO Males 5–6 16.5 49.1 31.2 3.2 9.2 77.5 11.1 2.3 56.8 37.9 5.3 0.0 68.3 30.8 1.0 0.0 7–10 9.8 53.8 30.9 5.5 10.6 65.9 19.3 4.3 52.2 38.4 7.7 1.7 56.8 41.4 0.9 0.9 11–14 5.4 48.5 39.8 6.3 9.0 64.7 21.1 5.2 37.5 48.1 12.7 1.8 43.3 55.9 0.8 0.0 Total 9.3 50.8 34.6 5.4 9.7 67.6 18.5 4.3 47.1 42.2 9.3 1.4 53.5 45.3 0.9 0.4
Females 5–6 10.9 62.5 22.4 4.2 16.7 69.7 13.6 0.0 79.5 20.5 0.0 0.0 78.1 21.9 0.0 0.0 7–10 8.1 56.9 30.0 5.1 9.0 70.2 19.5 1.4 67.7 32.3 0.0 0.0 72.5 27.5 0.0 0.0 11–14 6.8 50.1 37.9 5.2 10.1 58.5 28.0 3.4 66.8 29.7 3.6 0.0 59.9 39.0 1.1 0.0 Total 8.1 55.1 31.8 5.0 10.9 65.3 21.9 2.0 69.5 29.0 1.5 0.0 68.4 31.2 0.5 0.0
1 Those children who indicated that they had watched/played on a certain day but did not know how long, were placed in the minimum time category, ie, <4/10 hours.
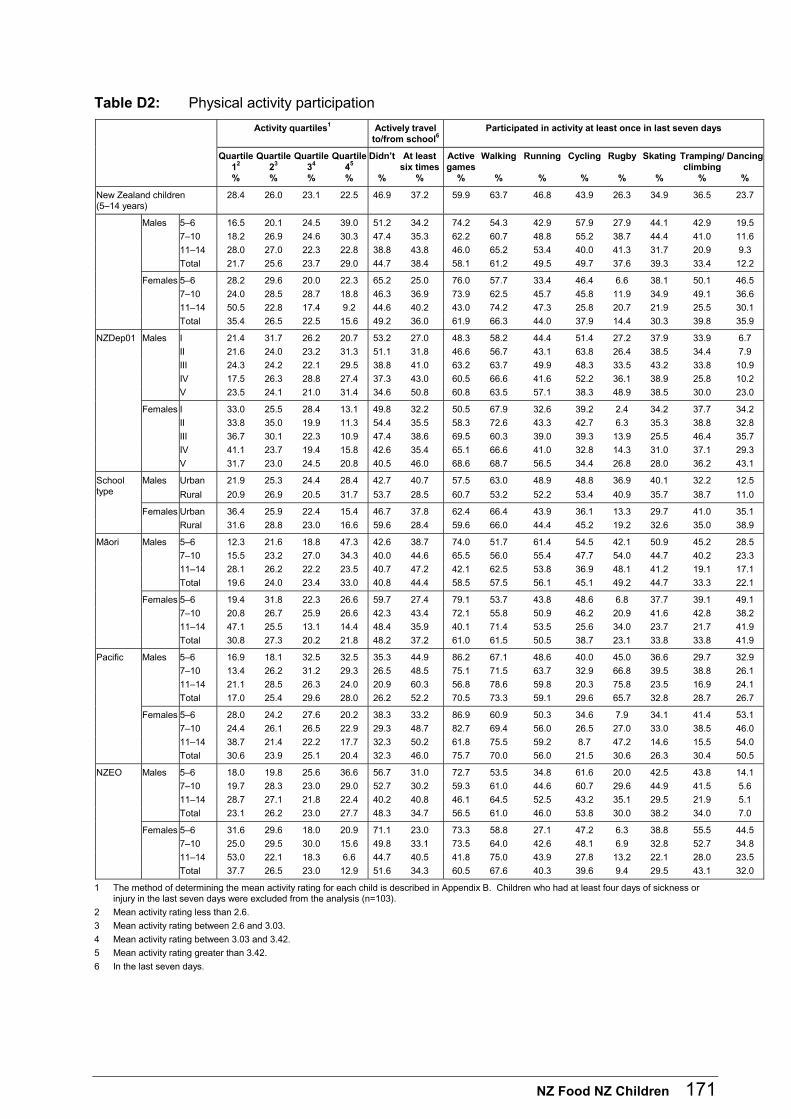
NZ Food NZ Children 171
Table D2: Physical activity participation
Activity quartiles1 Actively travel to/from school6
Participated in activity at least once in last seven days
Quartile 12 %
Quartile 23 %
Quartile 34 %
Quartile 45 %
Didn’t
%
At least six times
%
Active games
%
Walking
%
Running
%
Cycling
%
Rugby
%
Skating
%
Tramping/ climbing
%
Dancing
%
New Zealand children (5–14 years)
28.4 26.0 23.1 22.5 46.9 37.2 59.9 63.7 46.8 43.9 26.3 34.9 36.5 23.7
Males 5–6 16.5 20.1 24.5 39.0 51.2 34.2 74.2 54.3 42.9 57.9 27.9 44.1 42.9 19.5
7–10 18.2 26.9 24.6 30.3 47.4 35.3 62.2 60.7 48.8 55.2 38.7 44.4 41.0 11.6
11–14 28.0 27.0 22.3 22.8 38.8 43.8 46.0 65.2 53.4 40.0 41.3 31.7 20.9 9.3
Total 21.7 25.6 23.7 29.0 44.7 38.4 58.1 61.2 49.5 49.7 37.6 39.3 33.4 12.2
Females 5–6 28.2 29.6 20.0 22.3 65.2 25.0 76.0 57.7 33.4 46.4 6.6 38.1 50.1 46.5
7–10 24.0 28.5 28.7 18.8 46.3 36.9 73.9 62.5 45.7 45.8 11.9 34.9 49.1 36.6
11–14 50.5 22.8 17.4 9.2 44.6 40.2 43.0 74.2 47.3 25.8 20.7 21.9 25.5 30.1
Total 35.4 26.5 22.5 15.6 49.2 36.0 61.9 66.3 44.0 37.9 14.4 30.3 39.8 35.9
NZDep01 Males I 21.4 31.7 26.2 20.7 53.2 27.0 48.3 58.2 44.4 51.4 27.2 37.9 33.9 6.7
II 21.6 24.0 23.2 31.3 51.1 31.8 46.6 56.7 43.1 63.8 26.4 38.5 34.4 7.9
III 24.3 24.2 22.1 29.5 38.8 41.0 63.2 63.7 49.9 48.3 33.5 43.2 33.8 10.9
IV 17.5 26.3 28.8 27.4 37.3 43.0 60.5 66.6 41.6 52.2 36.1 38.9 25.8 10.2
V 23.5 24.1 21.0 31.4 34.6 50.8 60.8 63.5 57.1 38.3 48.9 38.5 30.0 23.0
Females I 33.0 25.5 28.4 13.1 49.8 32.2 50.5 67.9 32.6 39.2 2.4 34.2 37.7 34.2
II 33.8 35.0 19.9 11.3 54.4 35.5 58.3 72.6 43.3 42.7 6.3 35.3 38.8 32.8
III 36.7 30.1 22.3 10.9 47.4 38.6 69.5 60.3 39.0 39.3 13.9 25.5 46.4 35.7
IV 41.1 23.7 19.4 15.8 42.6 35.4 65.1 66.6 41.0 32.8 14.3 31.0 37.1 29.3
V 31.7 23.0 24.5 20.8 40.5 46.0 68.6 68.7 56.5 34.4 26.8 28.0 36.2 43.1
Males Urban 21.9 25.3 24.4 28.4 42.7 40.7 57.5 63.0 48.9 48.8 36.9 40.1 32.2 12.5 School type Rural 20.9 26.9 20.5 31.7 53.7 28.5 60.7 53.2 52.2 53.4 40.9 35.7 38.7 11.0
Females Urban 36.4 25.9 22.4 15.4 46.7 37.8 62.4 66.4 43.9 36.1 13.3 29.7 41.0 35.1
Rural 31.6 28.8 23.0 16.6 59.6 28.4 59.6 66.0 44.4 45.2 19.2 32.6 35.0 38.9
Mäori Males 5–6 12.3 21.6 18.8 47.3 42.6 38.7 74.0 51.7 61.4 54.5 42.1 50.9 45.2 28.5
7–10 15.5 23.2 27.0 34.3 40.0 44.6 65.5 56.0 55.4 47.7 54.0 44.7 40.2 23.3
11–14 28.1 26.2 22.2 23.5 40.7 47.2 42.1 62.5 53.8 36.9 48.1 41.2 19.1 17.1
Total 19.6 24.0 23.4 33.0 40.8 44.4 58.5 57.5 56.1 45.1 49.2 44.7 33.3 22.1
Females 5–6 19.4 31.8 22.3 26.6 59.7 27.4 79.1 53.7 43.8 48.6 6.8 37.7 39.1 49.1
7–10 20.8 26.7 25.9 26.6 42.3 43.4 72.1 55.8 50.9 46.2 20.9 41.6 42.8 38.2
11–14 47.1 25.5 13.1 14.4 48.4 35.9 40.1 71.4 53.5 25.6 34.0 23.7 21.7 41.9
Total 30.8 27.3 20.2 21.8 48.2 37.2 61.0 61.5 50.5 38.7 23.1 33.8 33.8 41.9
Pacific Males 5–6 16.9 18.1 32.5 32.5 35.3 44.9 86.2 67.1 48.6 40.0 45.0 36.6 29.7 32.9
7–10 13.4 26.2 31.2 29.3 26.5 48.5 75.1 71.5 63.7 32.9 66.8 39.5 38.8 26.1
11–14 21.1 28.5 26.3 24.0 20.9 60.3 56.8 78.6 59.8 20.3 75.8 23.5 16.9 24.1
Total 17.0 25.4 29.6 28.0 26.2 52.2 70.5 73.3 59.1 29.6 65.7 32.8 28.7 26.7
Females 5–6 28.0 24.2 27.6 20.2 38.3 33.2 86.9 60.9 50.3 34.6 7.9 34.1 41.4 53.1
7–10 24.4 26.1 26.5 22.9 29.3 48.7 82.7 69.4 56.0 26.5 27.0 33.0 38.5 46.0
11–14 38.7 21.4 22.2 17.7 32.3 50.2 61.8 75.5 59.2 8.7 47.2 14.6 15.5 54.0
Total 30.6 23.9 25.1 20.4 32.3 46.0 75.7 70.0 56.0 21.5 30.6 26.3 30.4 50.5
NZEO Males 5–6 18.0 19.8 25.6 36.6 56.7 31.0 72.7 53.5 34.8 61.6 20.0 42.5 43.8 14.1
7–10 19.7 28.3 23.0 29.0 52.7 30.2 59.3 61.0 44.6 60.7 29.6 44.9 41.5 5.6
11–14 28.7 27.1 21.8 22.4 40.2 40.8 46.1 64.5 52.5 43.2 35.1 29.5 21.9 5.1
Total 23.1 26.2 23.0 27.7 48.3 34.7 56.5 61.0 46.0 53.8 30.0 38.2 34.0 7.0
Females 5–6 31.6 29.6 18.0 20.9 71.1 23.0 73.3 58.8 27.1 47.2 6.3 38.8 55.5 44.5
7–10 25.0 29.5 30.0 15.6 49.8 33.1 73.5 64.0 42.6 48.1 6.9 32.8 52.7 34.8
11–14 53.0 22.1 18.3 6.6 44.7 40.5 41.8 75.0 43.9 27.8 13.2 22.1 28.0 23.5
Total 37.7 26.5 23.0 12.9 51.6 34.3 60.5 67.6 40.3 39.6 9.4 29.5 43.1 32.0
1 The method of determining the mean activity rating for each child is described in Appendix B. Children who had at least four days of sickness or injury in the last seven days were excluded from the analysis (n=103).
2 Mean activity rating less than 2.6.
3 Mean activity rating between 2.6 and 3.03.
4 Mean activity rating between 3.03 and 3.42.
5 Mean activity rating greater than 3.42.
6 In the last seven days.
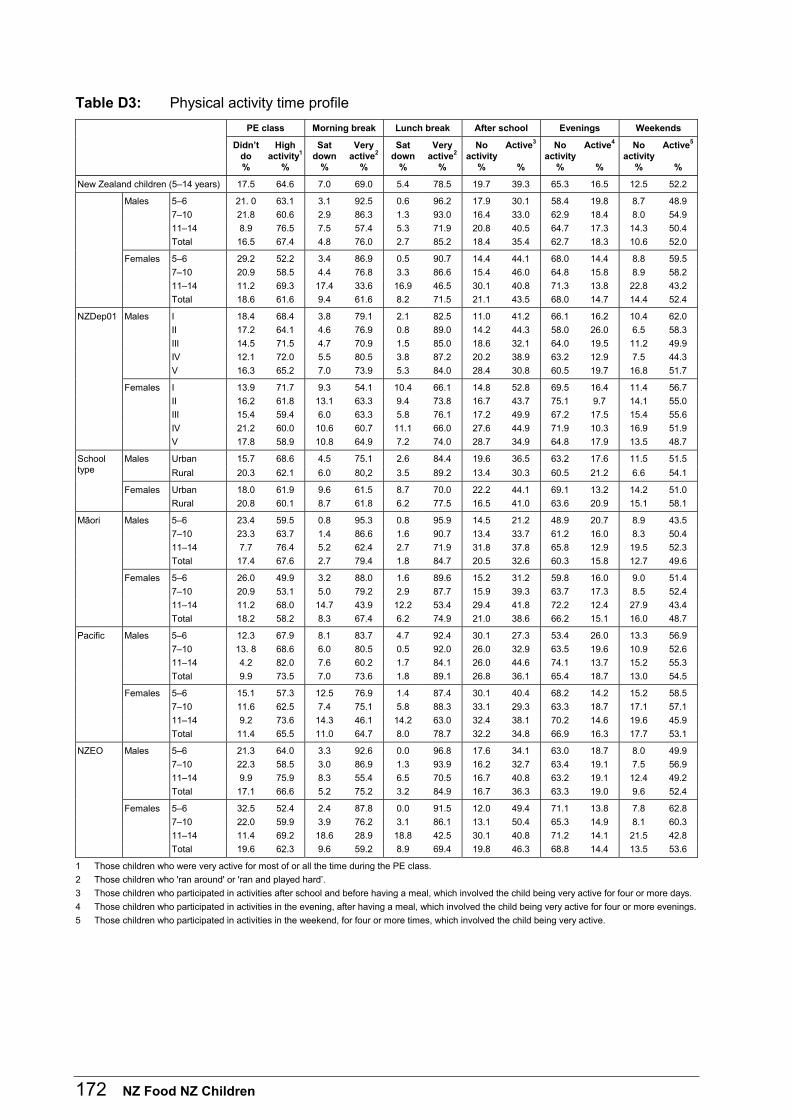
172 NZ Food NZ Children
Table D3: Physical activity time profile
PE class Morning break Lunch break After school Evenings Weekends
Didn’t do %
High activity1
%
Sat down
%
Very active2
%
Sat down
%
Very active2
%
No activity
%
Active3
%
No activity
%
Active4
%
No activity
%
Active5
%
New Zealand children (5–14 years) 17.5 64.6 7.0 69.0 5.4 78.5 19.7 39.3 65.3 16.5 12.5 52.2
Males 5–6 21. 0 63.1 3.1 92.5 0.6 96.2 17.9 30.1 58.4 19.8 8.7 48.9
7–10 21.8 60.6 2.9 86.3 1.3 93.0 16.4 33.0 62.9 18.4 8.0 54.9
11–14 8.9 76.5 7.5 57.4 5.3 71.9 20.8 40.5 64.7 17.3 14.3 50.4
Total 16.5 67.4 4.8 76.0 2.7 85.2 18.4 35.4 62.7 18.3 10.6 52.0
Females 5–6 29.2 52.2 3.4 86.9 0.5 90.7 14.4 44.1 68.0 14.4 8.8 59.5
7–10 20.9 58.5 4.4 76.8 3.3 86.6 15.4 46.0 64.8 15.8 8.9 58.2
11–14 11.2 69.3 17.4 33.6 16.9 46.5 30.1 40.8 71.3 13.8 22.8 43.2
Total 18.6 61.6 9.4 61.6 8.2 71.5 21.1 43.5 68.0 14.7 14.4 52.4
NZDep01 Males I 18.4 68.4 3.8 79.1 2.1 82.5 11.0 41.2 66.1 16.2 10.4 62.0
II 17.2 64.1 4.6 76.9 0.8 89.0 14.2 44.3 58.0 26.0 6.5 58.3
III 14.5 71.5 4.7 70.9 1.5 85.0 18.6 32.1 64.0 19.5 11.2 49.9
IV 12.1 72.0 5.5 80.5 3.8 87.2 20.2 38.9 63.2 12.9 7.5 44.3
V 16.3 65.2 7.0 73.9 5.3 84.0 28.4 30.8 60.5 19.7 16.8 51.7
Females I 13.9 71.7 9.3 54.1 10.4 66.1 14.8 52.8 69.5 16.4 11.4 56.7
II 16.2 61.8 13.1 63.3 9.4 73.8 16.7 43.7 75.1 9.7 14.1 55.0
III 15.4 59.4 6.0 63.3 5.8 76.1 17.2 49.9 67.2 17.5 15.4 55.6
IV 21.2 60.0 10.6 60.7 11.1 66.0 27.6 44.9 71.9 10.3 16.9 51.9
V 17.8 58.9 10.8 64.9 7.2 74.0 28.7 34.9 64.8 17.9 13.5 48.7
Males Urban 15.7 68.6 4.5 75.1 2.6 84.4 19.6 36.5 63.2 17.6 11.5 51.5 School type Rural 20.3 62.1 6.0 80,2 3.5 89.2 13.4 30.3 60.5 21.2 6.6 54.1
Females Urban 18.0 61.9 9.6 61.5 8.7 70.0 22.2 44.1 69.1 13.2 14.2 51.0
Rural 20.8 60.1 8.7 61.8 6.2 77.5 16.5 41.0 63.6 20.9 15.1 58.1
Mäori Males 5–6 23.4 59.5 0.8 95.3 0.8 95.9 14.5 21.2 48.9 20.7 8.9 43.5
7–10 23.3 63.7 1.4 86.6 1.6 90.7 13.4 33.7 61.2 16.0 8.3 50.4
11–14 7.7 76.4 5.2 62.4 2.7 71.9 31.8 37.8 65.8 12.9 19.5 52.3
Total 17.4 67.6 2.7 79.4 1.8 84.7 20.5 32.6 60.3 15.8 12.7 49.6
Females 5–6 26.0 49.9 3.2 88.0 1.6 89.6 15.2 31.2 59.8 16.0 9.0 51.4
7–10 20.9 53.1 5.0 79.2 2.9 87.7 15.9 39.3 63.7 17.3 8.5 52.4
11–14 11.2 68.0 14.7 43.9 12.2 53.4 29.4 41.8 72.2 12.4 27.9 43.4
Total 18.2 58.2 8.3 67.4 6.2 74.9 21.0 38.6 66.2 15.1 16.0 48.7
Pacific Males 5–6 12.3 67.9 8.1 83.7 4.7 92.4 30.1 27.3 53.4 26.0 13.3 56.9
7–10 13. 8 68.6 6.0 80.5 0.5 92.0 26.0 32.9 63.5 19.6 10.9 52.6
11–14 4.2 82.0 7.6 60.2 1.7 84.1 26.0 44.6 74.1 13.7 15.2 55.3
Total 9.9 73.5 7.0 73.6 1.8 89.1 26.8 36.1 65.4 18.7 13.0 54.5
Females 5–6 15.1 57.3 12.5 76.9 1.4 87.4 30.1 40.4 68.2 14.2 15.2 58.5
7–10 11.6 62.5 7.4 75.1 5.8 88.3 33.1 29.3 63.3 18.7 17.1 57.1
11–14 9.2 73.6 14.3 46.1 14.2 63.0 32.4 38.1 70.2 14.6 19.6 45.9
Total 11.4 65.5 11.0 64.7 8.0 78.7 32.2 34.8 66.9 16.3 17.7 53.1
NZEO Males 5–6 21.3 64.0 3.3 92.6 0.0 96.8 17.6 34.1 63.0 18.7 8.0 49.9
7–10 22.3 58.5 3.0 86.9 1.3 93.9 16.2 32.7 63.4 19.1 7.5 56.9
11–14 9.9 75.9 8.3 55.4 6.5 70.5 16.7 40.8 63.2 19.1 12.4 49.2
Total 17.1 66.6 5.2 75.2 3.2 84.9 16.7 36.3 63.3 19.0 9.6 52.4
Females 5–6 32.5 52.4 2.4 87.8 0.0 91.5 12.0 49.4 71.1 13.8 7.8 62.8
7–10 22.0 59.9 3.9 76.2 3.1 86.1 13.1 50.4 65.3 14.9 8.1 60.3
11–14 11.4 69.2 18.6 28.9 18.8 42.5 30.1 40.8 71.2 14.1 21.5 42.8
Total 19.6 62.3 9.6 59.2 8.9 69.4 19.8 46.3 68.8 14.4 13.5 53.6
1 Those children who were very active for most of or all the time during the PE class.
2 Those children who 'ran around' or 'ran and played hard’.
3 Those children who participated in activities after school and before having a meal, which involved the child being very active for four or more days.
4 Those children who participated in activities in the evening, after having a meal, which involved the child being very active for four or more evenings.
5 Those children who participated in activities in the weekend, for four or more times, which involved the child being very active.
NZ Food NZ Children 173
E. Health
Introduction These findings are based on questionnaire data (dental and health questions), anthropometric data, and blood and urine measurements.
Key points
Dental
• About 93 percent of New Zealand children have attended a school dental clinic or dentist.
• About 88 percent of New Zealand children brushed their teeth at least once the previous day (males 85.7 percent; females 89.6 percent).
• Fewer Mäori children reported brushing their teeth at least once the previous day than Pacific and NZEO children.
Body size
• For the majority of New Zealand children (68.9 percent) their weight in relation to height fell within an acceptable range. Using international cut-offs, 21.3 percent were overweight and 9.8 percent obese.
• Pacific children had a higher mean body mass index (BMI) than NZEO children in all age and sex groups, and Mäori children 7–10 years and 11–14 years.
• Using international cut-offs, overweight and obesity levels were highest for Pacific males (33.9 percent; 26.1 percent) and females (32.9 percent; 31 percent), followed by Mäori males (19.6 percent; 15.7 percent) and females (30.6 percent; 16.7 percent), and NZEO males (18.4 percent; 4.7 percent) and females (18.8 percent; 6 percent).
Iron status
• Prevalence of iron deficiency (1.6 percent) was low in New Zealand children.
• Among females 11–14 years, prevalence of iron deficiency was higher for Mäori (11.2 percent) and Pacific (9.6 percent) females than NZEO females (3.2 percent).
Serum zinc
• Prevalence of low serum zinc concentration was 16 percent in New Zealand children (males 21 percent; females 10 percent).
• The highest prevalence of low serum zinc concentration was in children 5–6 years (males 33 percent; females 16 percent).
174 NZ Food NZ Children
Serum cholesterol
• For New Zealand children mean serum total cholesterol was 4.38mmol/L and HDL-cholesterol was 1.43mmol/L.
• NZEO and Mäori children had higher mean serum total cholesterol levels than Pacific children.
Urinary iodine
• While the International Council for Control of Iodine Deficiency Disorders (ICCIDD) recommends no more than 20 percent of children should have a urinary iodine concentration less than 5 µg/dL, 28 percent of New Zealand children were below this level (males 25 percent; females 31 percent).
• NZEO females (33 percent) had the highest proportion with low iodine levels compared with Mäori (29 percent) and Pacific females (24 percent).
Menstruation
• Mäori and Pacific females experienced the onset of menstruation at an earlier age than NZEO females.
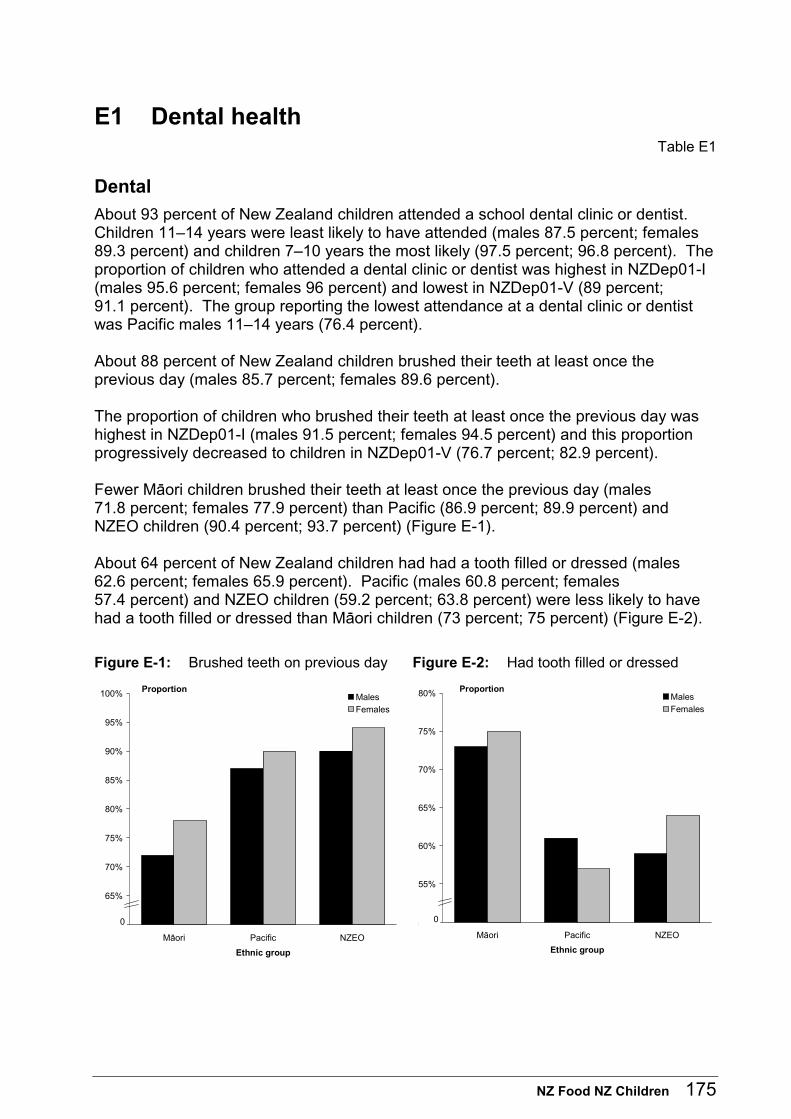
NZ Food NZ Children 175
E1 Dental health Table E1
Dental
About 93 percent of New Zealand children attended a school dental clinic or dentist. Children 11–14 years were least likely to have attended (males 87.5 percent; females 89.3 percent) and children 7–10 years the most likely (97.5 percent; 96.8 percent). The proportion of children who attended a dental clinic or dentist was highest in NZDep01-I (males 95.6 percent; females 96 percent) and lowest in NZDep01-V (89 percent; 91.1 percent). The group reporting the lowest attendance at a dental clinic or dentist was Pacific males 11–14 years (76.4 percent). About 88 percent of New Zealand children brushed their teeth at least once the previous day (males 85.7 percent; females 89.6 percent). The proportion of children who brushed their teeth at least once the previous day was highest in NZDep01-I (males 91.5 percent; females 94.5 percent) and this proportion progressively decreased to children in NZDep01-V (76.7 percent; 82.9 percent). Fewer Mäori children brushed their teeth at least once the previous day (males 71.8 percent; females 77.9 percent) than Pacific (86.9 percent; 89.9 percent) and NZEO children (90.4 percent; 93.7 percent) (Figure E-1). About 64 percent of New Zealand children had had a tooth filled or dressed (males 62.6 percent; females 65.9 percent). Pacific (males 60.8 percent; females 57.4 percent) and NZEO children (59.2 percent; 63.8 percent) were less likely to have had a tooth filled or dressed than Mäori children (73 percent; 75 percent) (Figure E-2).
Figure E-1: Brushed teeth on previous day Figure E-2: Had tooth filled or dressed
60%
65%
70%
75%
80%
85%
90%
95%
100%
Mäori Pacific NZEO
Ethnic group
ProportionMales
Females
0 50%
55%
60%
65%
70%
75%
80%
Māori Pacific NZEO
Ethnic group
ProportionMales
Females
0
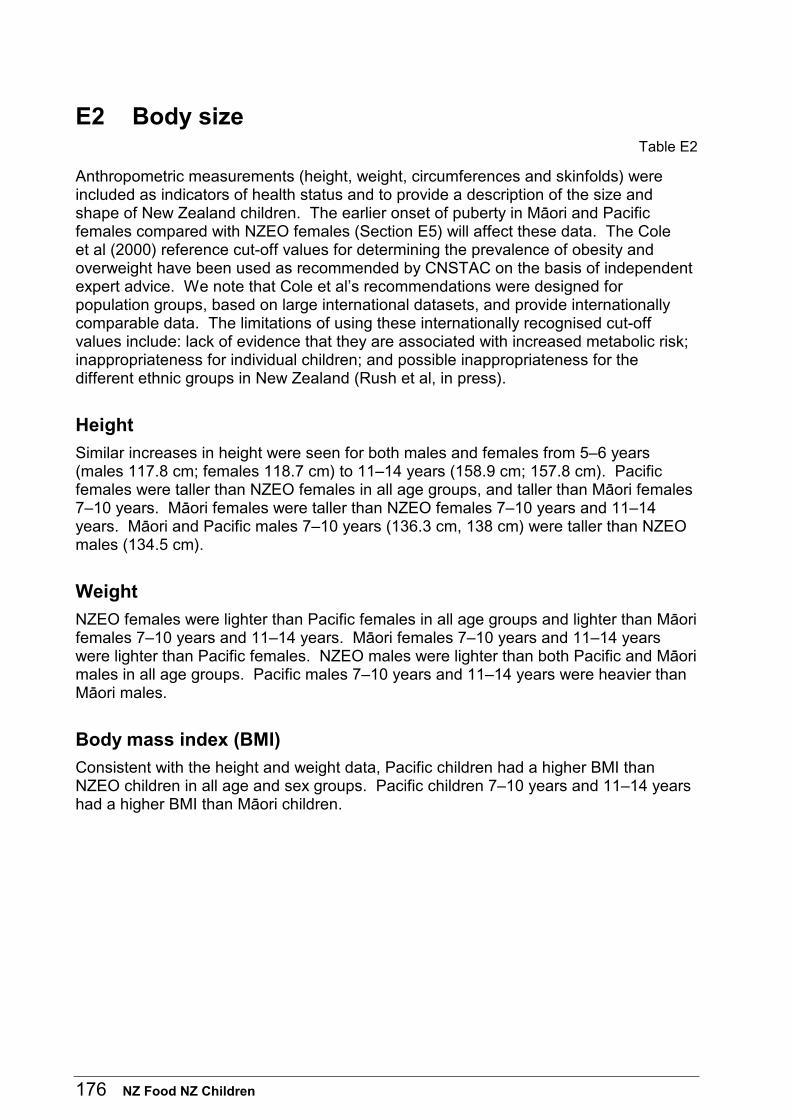
176 NZ Food NZ Children
E2 Body size Table E2
Anthropometric measurements (height, weight, circumferences and skinfolds) were included as indicators of health status and to provide a description of the size and shape of New Zealand children. The earlier onset of puberty in Mäori and Pacific females compared with NZEO females (Section E5) will affect these data. The Cole et al (2000) reference cut-off values for determining the prevalence of obesity and overweight have been used as recommended by CNSTAC on the basis of independent expert advice. We note that Cole et al’s recommendations were designed for population groups, based on large international datasets, and provide internationally comparable data. The limitations of using these internationally recognised cut-off values include: lack of evidence that they are associated with increased metabolic risk; inappropriateness for individual children; and possible inappropriateness for the different ethnic groups in New Zealand (Rush et al, in press).
Height
Similar increases in height were seen for both males and females from 5–6 years (males 117.8 cm; females 118.7 cm) to 11–14 years (158.9 cm; 157.8 cm). Pacific females were taller than NZEO females in all age groups, and taller than Mäori females 7–10 years. Mäori females were taller than NZEO females 7–10 years and 11–14 years. Mäori and Pacific males 7–10 years (136.3 cm, 138 cm) were taller than NZEO males (134.5 cm).
Weight
NZEO females were lighter than Pacific females in all age groups and lighter than Mäori females 7–10 years and 11–14 years. Mäori females 7–10 years and 11–14 years were lighter than Pacific females. NZEO males were lighter than both Pacific and Mäori males in all age groups. Pacific males 7–10 years and 11–14 years were heavier than Mäori males.
Body mass index (BMI)
Consistent with the height and weight data, Pacific children had a higher BMI than NZEO children in all age and sex groups. Pacific children 7–10 years and 11–14 years had a higher BMI than Mäori children.
NZ Food NZ Children 177
Figure E-3: Overweight using international cut-off values
Figure E-4: Obesity using international cut-off values
10%
12%
14%
16%
18%
20%
22%
24%
26%
5–6 7–10 11–14
Age group (years)
ProportionMales
Females
0% 0%
2%
4%
6%
8%
10%
12%
5–6 7–10 11–14
Age group (years)
Proportion Males
Females
About 69 percent of New Zealand children were not overweight or obese; while 21.3 percent were classified as overweight and 9.8 percent obese. The proportion of males who were overweight increased from 16.4 percent (5–6 years) to 23.7 percent (11–14 years) (Figure E-3). While obesity levels for males were similar in the three age groups (8.6 percent; 8.7 percent; 9.6 percent), the levels for females increased from 6.7 percent (5–6 years) to 11.6 percent (7–10 years) and 11.5 percent (11–14 years) (Figure E-4). Using the Cole et al (2000) cut-offs, overweight and obesity levels were highest for Pacific males (33.9 percent; 26.1 percent) and females (32.9 percent; 31 percent), followed by Mäori males (19.6 percent; 15.7 percent) and females (30.6 percent; 16.7 percent), and then NZEO males (18.4 percent; 4.7 percent) and females (18.8 percent; 6 percent).
Girths
Consistent with the other anthropometric indices NZEO children had smaller upper arm and waist girths than Mäori and Pacific children in all age groups. Mäori children had smaller girths than Pacific children in all age groups. Waist circumference was highest in Pacific children (males 70.4 cm; females 72.4 cm), followed by Mäori (66.7 cm; 69 cm) and NZEO children (64.3 cm; 65 cm).
Skinfolds
Females had larger skinfolds (both triceps and subscapular) than males in all age groups.
178 NZ Food NZ Children
Pacific males had larger subscapular skinfolds in all age groups than NZEO males. This was also true for triceps skinfolds in children 7–10 years and 11–14 years. Mäori males 7–10 years and 11–14 years had smaller subscapular and triceps skinfolds than Pacific males. NZEO males 7–10 years had smaller subscapular and triceps skinfolds than Mäori males. Pacific females 7–10 years and 11–14 years had larger subscapular and triceps skinfolds than Mäori and NZEO females.
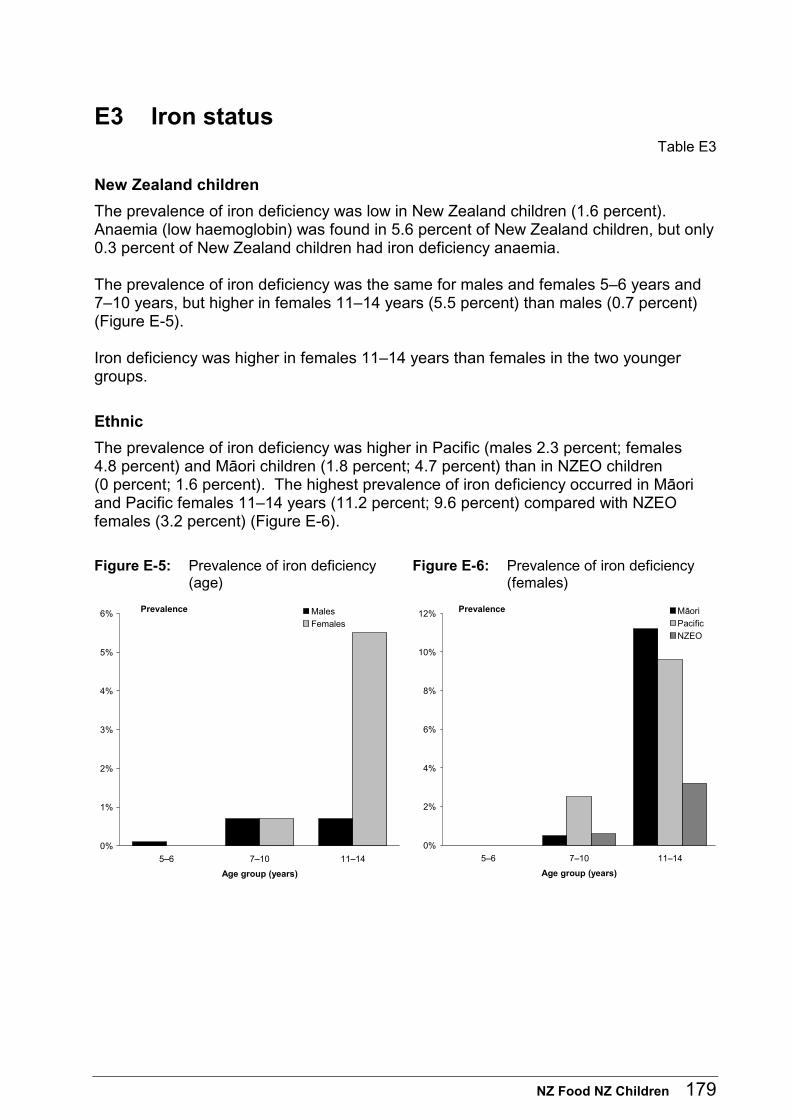
NZ Food NZ Children 179
E3 Iron status Table E3
New Zealand children
The prevalence of iron deficiency was low in New Zealand children (1.6 percent). Anaemia (low haemoglobin) was found in 5.6 percent of New Zealand children, but only 0.3 percent of New Zealand children had iron deficiency anaemia. The prevalence of iron deficiency was the same for males and females 5–6 years and 7–10 years, but higher in females 11–14 years (5.5 percent) than males (0.7 percent) (Figure E-5). Iron deficiency was higher in females 11–14 years than females in the two younger groups.
Ethnic
The prevalence of iron deficiency was higher in Pacific (males 2.3 percent; females 4.8 percent) and Mäori children (1.8 percent; 4.7 percent) than in NZEO children (0 percent; 1.6 percent). The highest prevalence of iron deficiency occurred in Mäori and Pacific females 11–14 years (11.2 percent; 9.6 percent) compared with NZEO females (3.2 percent) (Figure E-6).
Figure E-5: Prevalence of iron deficiency (age)
Figure E-6: Prevalence of iron deficiency (females)
0%
1%
2%
3%
4%
5%
6%
5–6 7–10 11–14
Age group (years)
Prevalence Males
Females
0%
2%
4%
6%
8%
10%
12%
5–6 7–10 11–14
Age group (years)
Prevalence Mäori
Pacific
NZEO
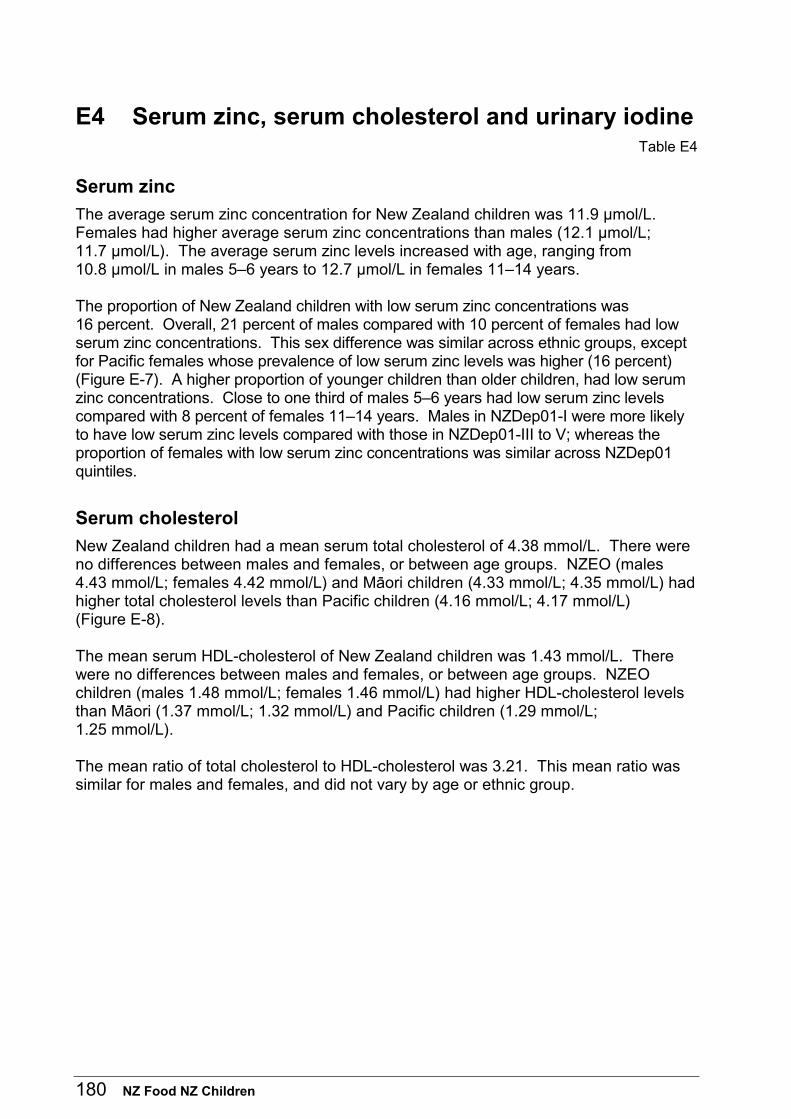
180 NZ Food NZ Children
E4 Serum zinc, serum cholesterol and urinary iodine Table E4
Serum zinc
The average serum zinc concentration for New Zealand children was 11.9 µmol/L. Females had higher average serum zinc concentrations than males (12.1 µmol/L; 11.7 µmol/L). The average serum zinc levels increased with age, ranging from 10.8 µmol/L in males 5–6 years to 12.7 µmol/L in females 11–14 years. The proportion of New Zealand children with low serum zinc concentrations was 16 percent. Overall, 21 percent of males compared with 10 percent of females had low serum zinc concentrations. This sex difference was similar across ethnic groups, except for Pacific females whose prevalence of low serum zinc levels was higher (16 percent) (Figure E-7). A higher proportion of younger children than older children, had low serum zinc concentrations. Close to one third of males 5–6 years had low serum zinc levels compared with 8 percent of females 11–14 years. Males in NZDep01-I were more likely to have low serum zinc levels compared with those in NZDep01-III to V; whereas the proportion of females with low serum zinc concentrations was similar across NZDep01 quintiles.
Serum cholesterol
New Zealand children had a mean serum total cholesterol of 4.38 mmol/L. There were no differences between males and females, or between age groups. NZEO (males 4.43 mmol/L; females 4.42 mmol/L) and Mäori children (4.33 mmol/L; 4.35 mmol/L) had higher total cholesterol levels than Pacific children (4.16 mmol/L; 4.17 mmol/L) (Figure E-8). The mean serum HDL-cholesterol of New Zealand children was 1.43 mmol/L. There were no differences between males and females, or between age groups. NZEO children (males 1.48 mmol/L; females 1.46 mmol/L) had higher HDL-cholesterol levels than Mäori (1.37 mmol/L; 1.32 mmol/L) and Pacific children (1.29 mmol/L; 1.25 mmol/L). The mean ratio of total cholesterol to HDL-cholesterol was 3.21. This mean ratio was similar for males and females, and did not vary by age or ethnic group.
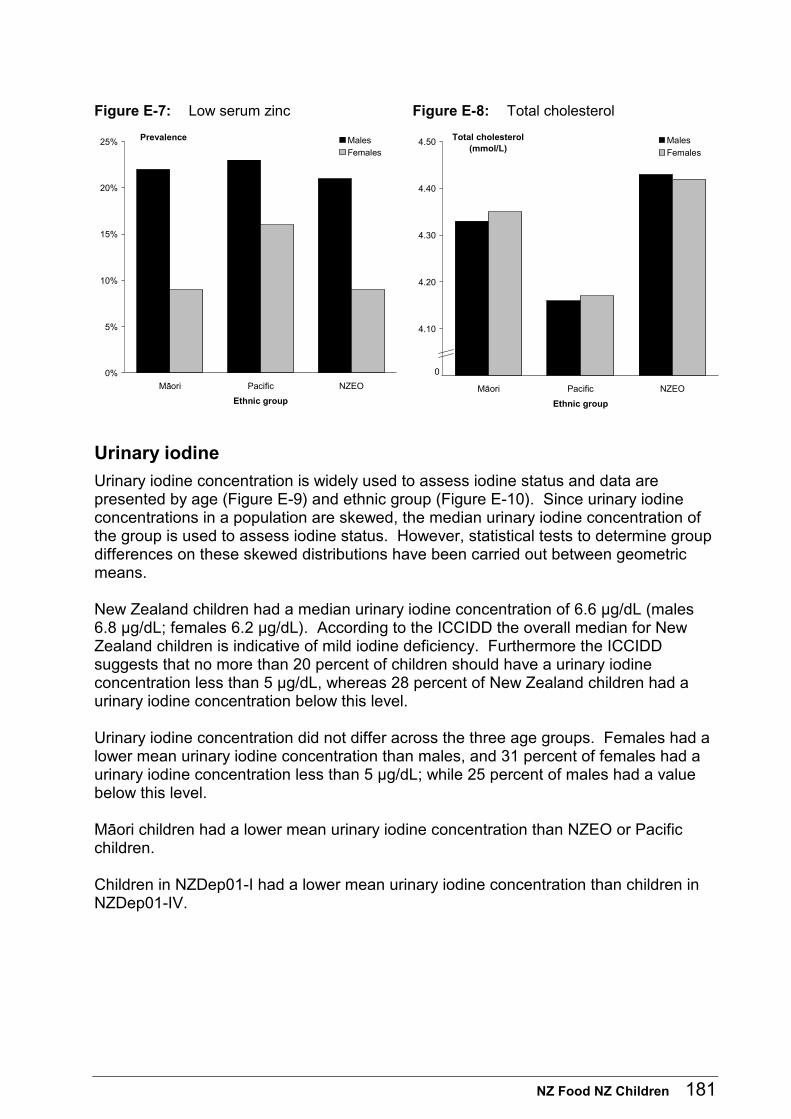
NZ Food NZ Children 181
Figure E-7: Low serum zinc Figure E-8: Total cholesterol
0%
5%
10%
15%
20%
25%
Mäori Pacific NZEO
Ethnic group
Prevalence Males
Females
4.00
4.10
4.20
4.30
4.40
4.50
Mäori Pacific NZEO
Ethnic group
Total cholesterol (mmol/L)
Males
Females
0
Urinary iodine
Urinary iodine concentration is widely used to assess iodine status and data are presented by age (Figure E-9) and ethnic group (Figure E-10). Since urinary iodine concentrations in a population are skewed, the median urinary iodine concentration of the group is used to assess iodine status. However, statistical tests to determine group differences on these skewed distributions have been carried out between geometric means. New Zealand children had a median urinary iodine concentration of 6.6 µg/dL (males 6.8 µg/dL; females 6.2 µg/dL). According to the ICCIDD the overall median for New Zealand children is indicative of mild iodine deficiency. Furthermore the ICCIDD suggests that no more than 20 percent of children should have a urinary iodine concentration less than 5 µg/dL, whereas 28 percent of New Zealand children had a urinary iodine concentration below this level. Urinary iodine concentration did not differ across the three age groups. Females had a lower mean urinary iodine concentration than males, and 31 percent of females had a urinary iodine concentration less than 5 µg/dL; while 25 percent of males had a value below this level. Mäori children had a lower mean urinary iodine concentration than NZEO or Pacific children. Children in NZDep01-I had a lower mean urinary iodine concentration than children in NZDep01-IV.
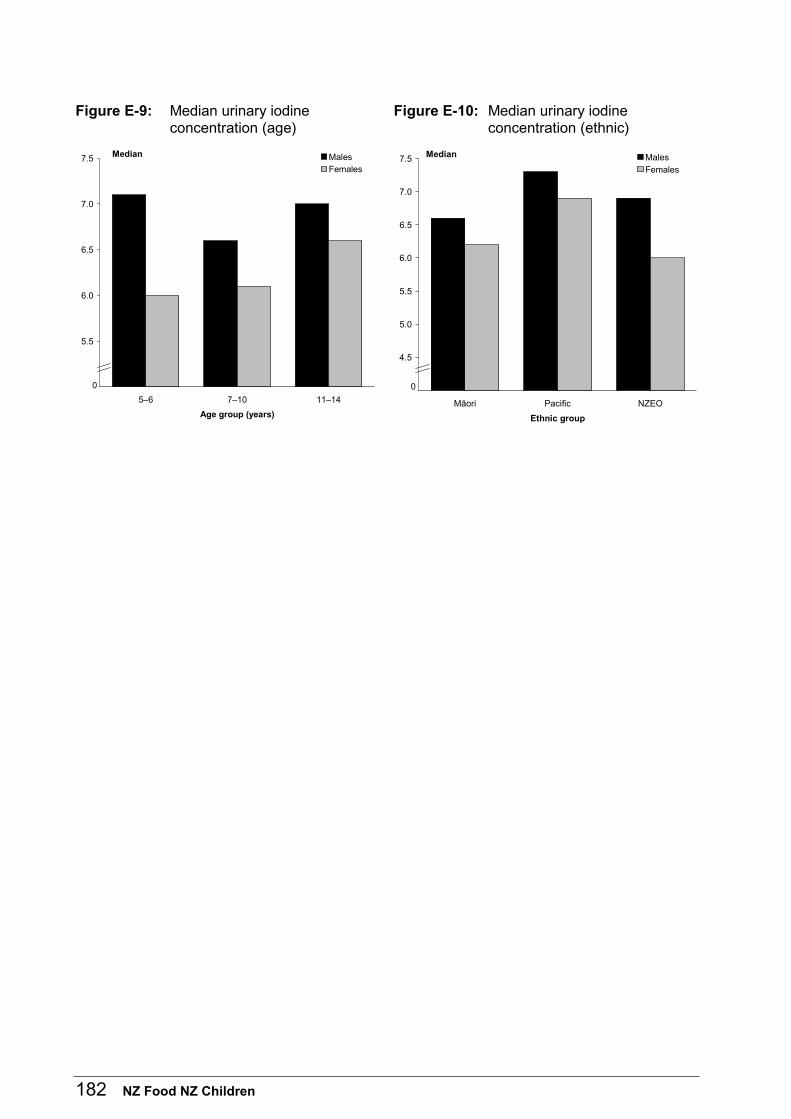
182 NZ Food NZ Children
Figure E-9: Median urinary iodine concentration (age)
Figure E-10: Median urinary iodine concentration (ethnic)
5.0
5.5
6.0
6.5
7.0
7.5
5–6 7–10 11–14
Age group (years)
Median MalesFemales
04.0
4.5
5.0
5.5
6.0
6.5
7.0
7.5
Mäori Pacific NZEO
Ethnic group
Median Males
Females
0
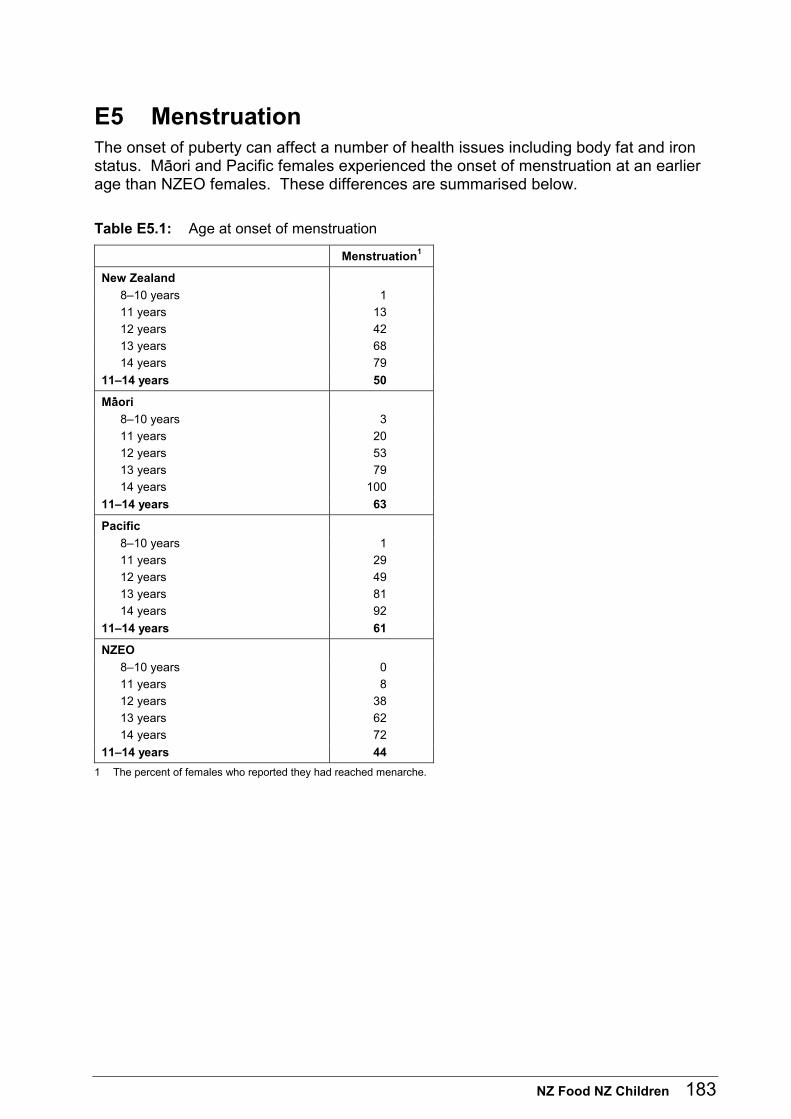
NZ Food NZ Children 183
E5 Menstruation The onset of puberty can affect a number of health issues including body fat and iron status. Mäori and Pacific females experienced the onset of menstruation at an earlier age than NZEO females. These differences are summarised below.
Table E5.1: Age at onset of menstruation
Menstruation1
New Zealand
8–10 years 1
11 years 13
12 years 42
13 years 68
14 years 79
11–14 years 50
Mäori
8–10 years 3
11 years 20
12 years 53
13 years 79
14 years 100
11–14 years 63
Pacific
8–10 years 1
11 years 29
12 years 49
13 years 81
14 years 92
11–14 years 61
NZEO
8–10 years 0
11 years 8
12 years 38
13 years 62
14 years 72
11–14 years 44
1 The percent of females who reported they had reached menarche.
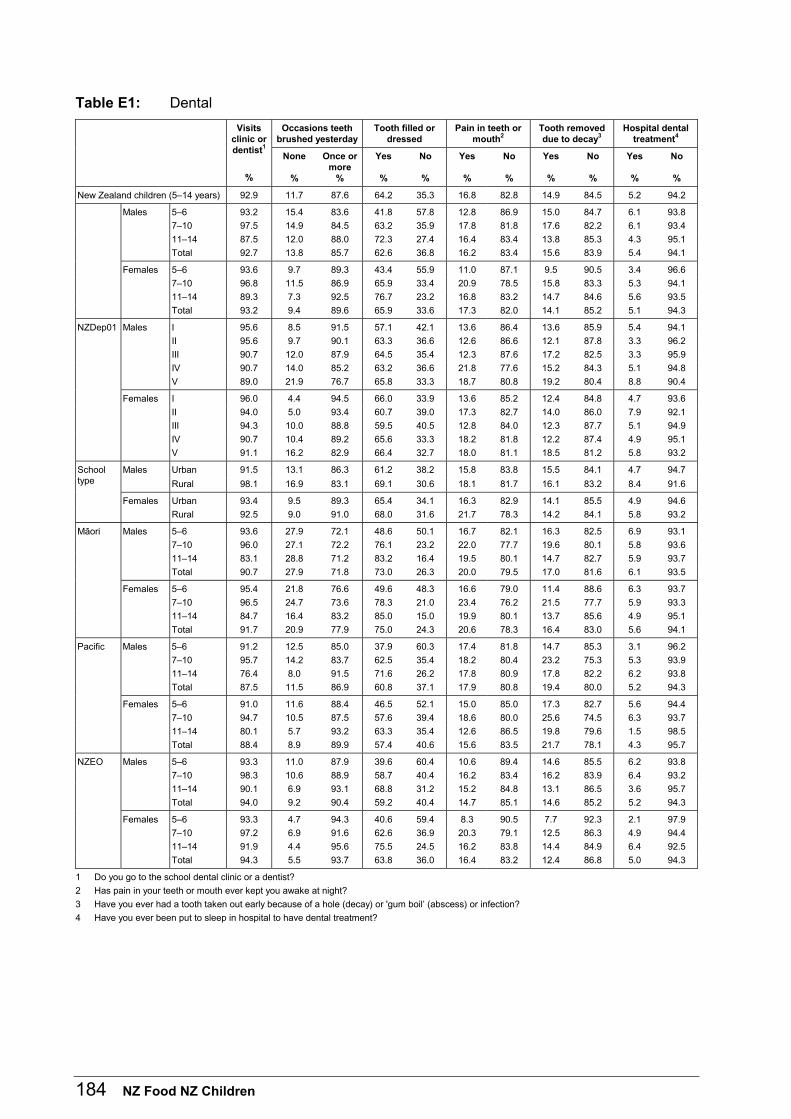
184 NZ Food NZ Children
Table E1: Dental
Occasions teeth brushed yesterday
Tooth filled or dressed
Pain in teeth or mouth2
Tooth removed due to decay3
Hospital dental treatment4
Visits clinic or dentist1
%
None
%
Once or more
%
Yes
%
No
%
Yes
%
No
%
Yes
%
No
%
Yes
%
No
%
New Zealand children (5–14 years) 92.9 11.7 87.6 64.2 35.3 16.8 82.8 14.9 84.5 5.2 94.2
Males 5–6 93.2 15.4 83.6 41.8 57.8 12.8 86.9 15.0 84.7 6.1 93.8
7–10 97.5 14.9 84.5 63.2 35.9 17.8 81.8 17.6 82.2 6.1 93.4
11–14 87.5 12.0 88.0 72.3 27.4 16.4 83.4 13.8 85.3 4.3 95.1
Total 92.7 13.8 85.7 62.6 36.8 16.2 83.4 15.6 83.9 5.4 94.1
Females 5–6 93.6 9.7 89.3 43.4 55.9 11.0 87.1 9.5 90.5 3.4 96.6
7–10 96.8 11.5 86.9 65.9 33.4 20.9 78.5 15.8 83.3 5.3 94.1
11–14 89.3 7.3 92.5 76.7 23.2 16.8 83.2 14.7 84.6 5.6 93.5
Total 93.2 9.4 89.6 65.9 33.6 17.3 82.0 14.1 85.2 5.1 94.3
NZDep01 Males I 95.6 8.5 91.5 57.1 42.1 13.6 86.4 13.6 85.9 5.4 94.1
II 95.6 9.7 90.1 63.3 36.6 12.6 86.6 12.1 87.8 3.3 96.2
III 90.7 12.0 87.9 64.5 35.4 12.3 87.6 17.2 82.5 3.3 95.9
IV 90.7 14.0 85.2 63.2 36.6 21.8 77.6 15.2 84.3 5.1 94.8
V 89.0 21.9 76.7 65.8 33.3 18.7 80.8 19.2 80.4 8.8 90.4
Females I 96.0 4.4 94.5 66.0 33.9 13.6 85.2 12.4 84.8 4.7 93.6
II 94.0 5.0 93.4 60.7 39.0 17.3 82.7 14.0 86.0 7.9 92.1
III 94.3 10.0 88.8 59.5 40.5 12.8 84.0 12.3 87.7 5.1 94.9
IV 90.7 10.4 89.2 65.6 33.3 18.2 81.8 12.2 87.4 4.9 95.1
V 91.1 16.2 82.9 66.4 32.7 18.0 81.1 18.5 81.2 5.8 93.2
Males Urban 91.5 13.1 86.3 61.2 38.2 15.8 83.8 15.5 84.1 4.7 94.7 School type Rural 98.1 16.9 83.1 69.1 30.6 18.1 81.7 16.1 83.2 8.4 91.6
Females Urban 93.4 9.5 89.3 65.4 34.1 16.3 82.9 14.1 85.5 4.9 94.6
Rural 92.5 9.0 91.0 68.0 31.6 21.7 78.3 14.2 84.1 5.8 93.2
Mäori Males 5–6 93.6 27.9 72.1 48.6 50.1 16.7 82.1 16.3 82.5 6.9 93.1
7–10 96.0 27.1 72.2 76.1 23.2 22.0 77.7 19.6 80.1 5.8 93.6
11–14 83.1 28.8 71.2 83.2 16.4 19.5 80.1 14.7 82.7 5.9 93.7
Total 90.7 27.9 71.8 73.0 26.3 20.0 79.5 17.0 81.6 6.1 93.5
Females 5–6 95.4 21.8 76.6 49.6 48.3 16.6 79.0 11.4 88.6 6.3 93.7
7–10 96.5 24.7 73.6 78.3 21.0 23.4 76.2 21.5 77.7 5.9 93.3
11–14 84.7 16.4 83.2 85.0 15.0 19.9 80.1 13.7 85.6 4.9 95.1
Total 91.7 20.9 77.9 75.0 24.3 20.6 78.3 16.4 83.0 5.6 94.1
Pacific Males 5–6 91.2 12.5 85.0 37.9 60.3 17.4 81.8 14.7 85.3 3.1 96.2
7–10 95.7 14.2 83.7 62.5 35.4 18.2 80.4 23.2 75.3 5.3 93.9
11–14 76.4 8.0 91.5 71.6 26.2 17.8 80.9 17.8 82.2 6.2 93.8
Total 87.5 11.5 86.9 60.8 37.1 17.9 80.8 19.4 80.0 5.2 94.3
Females 5–6 91.0 11.6 88.4 46.5 52.1 15.0 85.0 17.3 82.7 5.6 94.4
7–10 94.7 10.5 87.5 57.6 39.4 18.6 80.0 25.6 74.5 6.3 93.7
11–14 80.1 5.7 93.2 63.3 35.4 12.6 86.5 19.8 79.6 1.5 98.5
Total 88.4 8.9 89.9 57.4 40.6 15.6 83.5 21.7 78.1 4.3 95.7
NZEO Males 5–6 93.3 11.0 87.9 39.6 60.4 10.6 89.4 14.6 85.5 6.2 93.8
7–10 98.3 10.6 88.9 58.7 40.4 16.2 83.4 16.2 83.9 6.4 93.2
11–14 90.1 6.9 93.1 68.8 31.2 15.2 84.8 13.1 86.5 3.6 95.7
Total 94.0 9.2 90.4 59.2 40.4 14.7 85.1 14.6 85.2 5.2 94.3
Females 5–6 93.3 4.7 94.3 40.6 59.4 8.3 90.5 7.7 92.3 2.1 97.9
7–10 97.2 6.9 91.6 62.6 36.9 20.3 79.1 12.5 86.3 4.9 94.4
11–14 91.9 4.4 95.6 75.5 24.5 16.2 83.8 14.4 84.9 6.4 92.5
Total 94.3 5.5 93.7 63.8 36.0 16.4 83.2 12.4 86.8 5.0 94.3
1 Do you go to the school dental clinic or a dentist?
2 Has pain in your teeth or mouth ever kept you awake at night?
3 Have you ever had a tooth taken out early because of a hole (decay) or 'gum boil’ (abscess) or infection?
4 Have you ever been put to sleep in hospital to have dental treatment?
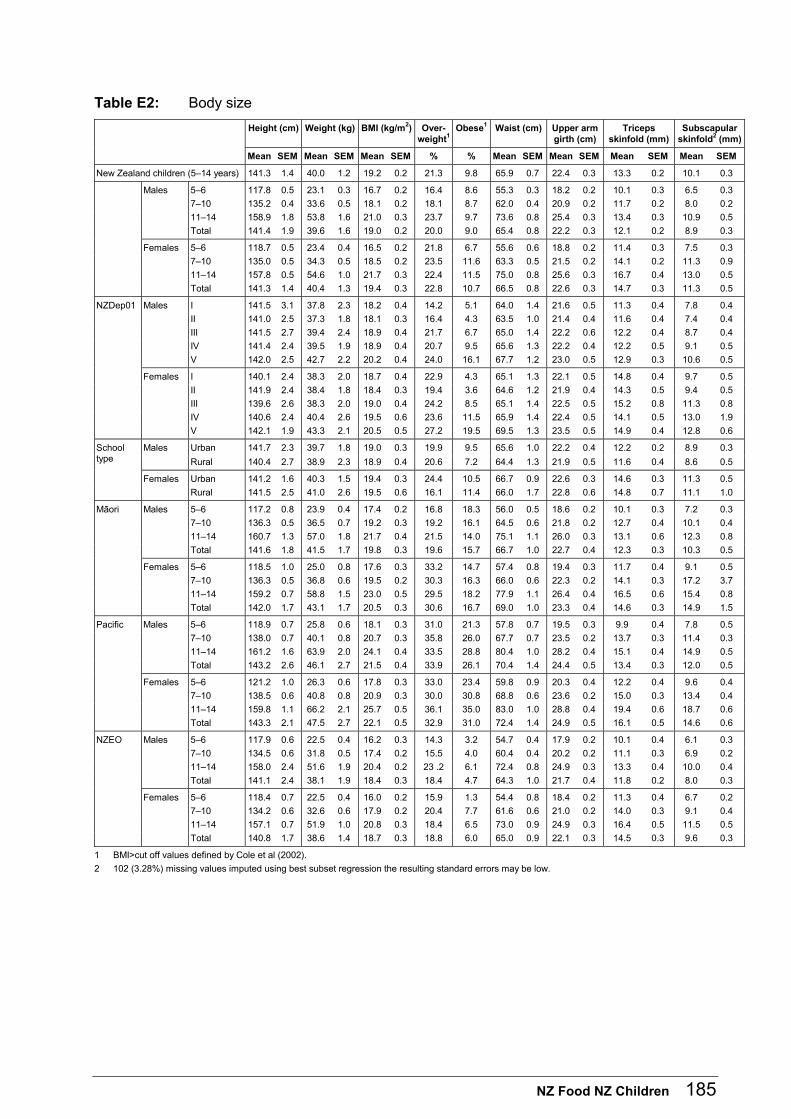
NZ Food NZ Children 185
Table E2: Body size
Height (cm) Weight (kg) BMI (kg/m2) Over-weight1
Obese1 Waist (cm) Upper arm girth (cm)
Triceps skinfold (mm)
Subscapular skinfold2 (mm)
Mean SEM Mean SEM Mean SEM % % Mean SEM Mean SEM Mean SEM Mean SEM
New Zealand children (5–14 years) 141.3 1.4 40.0 1.2 19.2 0.2 21.3 9.8 65.9 0.7 22.4 0.3 13.3 0.2 10.1 0.3
Males 5–6 117.8 0.5 23.1 0.3 16.7 0.2 16.4 8.6 55.3 0.3 18.2 0.2 10.1 0.3 6.5 0.3
7–10 135.2 0.4 33.6 0.5 18.1 0.2 18.1 8.7 62.0 0.4 20.9 0.2 11.7 0.2 8.0 0.2
11–14 158.9 1.8 53.8 1.6 21.0 0.3 23.7 9.7 73.6 0.8 25.4 0.3 13.4 0.3 10.9 0.5
Total 141.4 1.9 39.6 1.6 19.0 0.2 20.0 9.0 65.4 0.8 22.2 0.3 12.1 0.2 8.9 0.3
Females 5–6 118.7 0.5 23.4 0.4 16.5 0.2 21.8 6.7 55.6 0.6 18.8 0.2 11.4 0.3 7.5 0.3
7–10 135.0 0.5 34.3 0.5 18.5 0.2 23.5 11.6 63.3 0.5 21.5 0.2 14.1 0.2 11.3 0.9
11–14 157.8 0.5 54.6 1.0 21.7 0.3 22.4 11.5 75.0 0.8 25.6 0.3 16.7 0.4 13.0 0.5
Total 141.3 1.4 40.4 1.3 19.4 0.3 22.8 10.7 66.5 0.8 22.6 0.3 14.7 0.3 11.3 0.5
NZDep01 Males I 141.5 3.1 37.8 2.3 18.2 0.4 14.2 5.1 64.0 1.4 21.6 0.5 11.3 0.4 7.8 0.4
II 141.0 2.5 37.3 1.8 18.1 0.3 16.4 4.3 63.5 1.0 21.4 0.4 11.6 0.4 7.4 0.4
III 141.5 2.7 39.4 2.4 18.9 0.4 21.7 6.7 65.0 1.4 22.2 0.6 12.2 0.4 8.7 0.4
IV 141.4 2.4 39.5 1.9 18.9 0.4 20.7 9.5 65.6 1.3 22.2 0.4 12.2 0.5 9.1 0.5
V 142.0 2.5 42.7 2.2 20.2 0.4 24.0 16.1 67.7 1.2 23.0 0.5 12.9 0.3 10.6 0.5
Females I 140.1 2.4 38.3 2.0 18.7 0.4 22.9 4.3 65.1 1.3 22.1 0.5 14.8 0.4 9.7 0.5
II 141.9 2.4 38.4 1.8 18.4 0.3 19.4 3.6 64.6 1.2 21.9 0.4 14.3 0.5 9.4 0.5
III 139.6 2.6 38.3 2.0 19.0 0.4 24.2 8.5 65.1 1.4 22.5 0.5 15.2 0.8 11.3 0.8
IV 140.6 2.4 40.4 2.6 19.5 0.6 23.6 11.5 65.9 1.4 22.4 0.5 14.1 0.5 13.0 1.9
V 142.1 1.9 43.3 2.1 20.5 0.5 27.2 19.5 69.5 1.3 23.5 0.5 14.9 0.4 12.8 0.6
Males Urban 141.7 2.3 39.7 1.8 19.0 0.3 19.9 9.5 65.6 1.0 22.2 0.4 12.2 0.2 8.9 0.3 School type Rural 140.4 2.7 38.9 2.3 18.9 0.4 20.6 7.2 64.4 1.3 21.9 0.5 11.6 0.4 8.6 0.5
Females Urban 141.2 1.6 40.3 1.5 19.4 0.3 24.4 10.5 66.7 0.9 22.6 0.3 14.6 0.3 11.3 0.5
Rural 141.5 2.5 41.0 2.6 19.5 0.6 16.1 11.4 66.0 1.7 22.8 0.6 14.8 0.7 11.1 1.0
Mäori Males 5–6 117.2 0.8 23.9 0.4 17.4 0.2 16.8 18.3 56.0 0.5 18.6 0.2 10.1 0.3 7.2 0.3
7–10 136.3 0.5 36.5 0.7 19.2 0.3 19.2 16.1 64.5 0.6 21.8 0.2 12.7 0.4 10.1 0.4
11–14 160.7 1.3 57.0 1.8 21.7 0.4 21.5 14.0 75.1 1.1 26.0 0.3 13.1 0.6 12.3 0.8
Total 141.6 1.8 41.5 1.7 19.8 0.3 19.6 15.7 66.7 1.0 22.7 0.4 12.3 0.3 10.3 0.5
Females 5–6 118.5 1.0 25.0 0.8 17.6 0.3 33.2 14.7 57.4 0.8 19.4 0.3 11.7 0.4 9.1 0.5
7–10 136.3 0.5 36.8 0.6 19.5 0.2 30.3 16.3 66.0 0.6 22.3 0.2 14.1 0.3 17.2 3.7
11–14 159.2 0.7 58.8 1.5 23.0 0.5 29.5 18.2 77.9 1.1 26.4 0.4 16.5 0.6 15.4 0.8
Total 142.0 1.7 43.1 1.7 20.5 0.3 30.6 16.7 69.0 1.0 23.3 0.4 14.6 0.3 14.9 1.5
Pacific Males 5–6 118.9 0.7 25.8 0.6 18.1 0.3 31.0 21.3 57.8 0.7 19.5 0.3 9.9 0.4 7.8 0.5
7–10 138.0 0.7 40.1 0.8 20.7 0.3 35.8 26.0 67.7 0.7 23.5 0.2 13.7 0.3 11.4 0.3
11–14 161.2 1.6 63.9 2.0 24.1 0.4 33.5 28.8 80.4 1.0 28.2 0.4 15.1 0.4 14.9 0.5
Total 143.2 2.6 46.1 2.7 21.5 0.4 33.9 26.1 70.4 1.4 24.4 0.5 13.4 0.3 12.0 0.5
Females 5–6 121.2 1.0 26.3 0.6 17.8 0.3 33.0 23.4 59.8 0.9 20.3 0.4 12.2 0.4 9.6 0.4
7–10 138.5 0.6 40.8 0.8 20.9 0.3 30.0 30.8 68.8 0.6 23.6 0.2 15.0 0.3 13.4 0.4
11–14 159.8 1.1 66.2 2.1 25.7 0.5 36.1 35.0 83.0 1.0 28.8 0.4 19.4 0.6 18.7 0.6
Total 143.3 2.1 47.5 2.7 22.1 0.5 32.9 31.0 72.4 1.4 24.9 0.5 16.1 0.5 14.6 0.6
NZEO Males 5–6 117.9 0.6 22.5 0.4 16.2 0.3 14.3 3.2 54.7 0.4 17.9 0.2 10.1 0.4 6.1 0.3
7–10 134.5 0.6 31.8 0.5 17.4 0.2 15.5 4.0 60.4 0.4 20.2 0.2 11.1 0.3 6.9 0.2
11–14 158.0 2.4 51.6 1.9 20.4 0.2 23 .2 6.1 72.4 0.8 24.9 0.3 13.3 0.4 10.0 0.4
Total 141.1 2.4 38.1 1.9 18.4 0.3 18.4 4.7 64.3 1.0 21.7 0.4 11.8 0.2 8.0 0.3
Females 5–6 118.4 0.7 22.5 0.4 16.0 0.2 15.9 1.3 54.4 0.8 18.4 0.2 11.3 0.4 6.7 0.2
7–10 134.2 0.6 32.6 0.6 17.9 0.2 20.4 7.7 61.6 0.6 21.0 0.2 14.0 0.3 9.1 0.4
11–14 157.1 0.7 51.9 1.0 20.8 0.3 18.4 6.5 73.0 0.9 24.9 0.3 16.4 0.5 11.5 0.5
Total 140.8 1.7 38.6 1.4 18.7 0.3 18.8 6.0 65.0 0.9 22.1 0.3 14.5 0.3 9.6 0.3
1 BMI>cut off values defined by Cole et al (2002).
2 102 (3.28%) missing values imputed using best subset regression the resulting standard errors may be low.
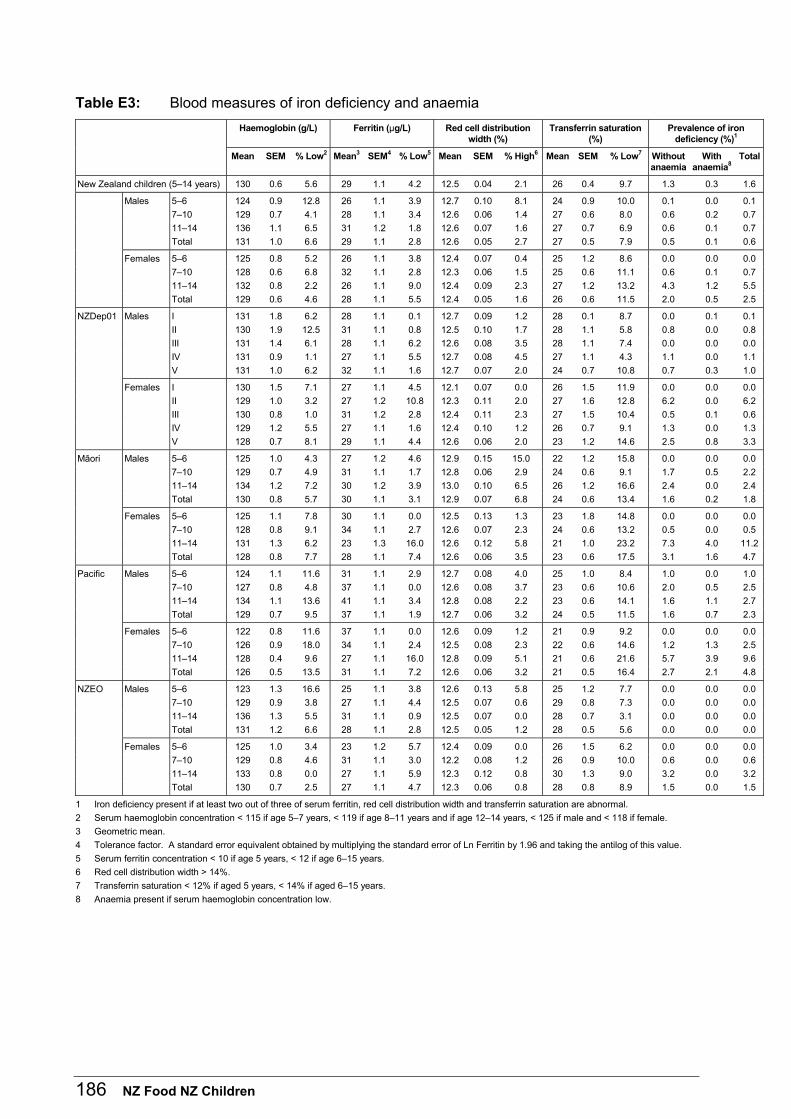
186 NZ Food NZ Children
Table E3: Blood measures of iron deficiency and anaemia
Haemoglobin (g/L) Ferritin (µg/L) Red cell distribution width (%)
Transferrin saturation (%)
Prevalence of iron deficiency (%)1
Mean SEM % Low2 Mean3 SEM4 % Low5 Mean SEM % High6 Mean SEM % Low7 Without anaemia
With anaemia8
Total
New Zealand children (5–14 years) 130 0.6 5.6 29 1.1 4.2 12.5 0.04 2.1 26 0.4 9.7 1.3 0.3 1.6
Males 5–6 124 0.9 12.8 26 1.1 3.9 12.7 0.10 8.1 24 0.9 10.0 0.1 0.0 0.1
7–10 129 0.7 4.1 28 1.1 3.4 12.6 0.06 1.4 27 0.6 8.0 0.6 0.2 0.7
11–14 136 1.1 6.5 31 1.2 1.8 12.6 0.07 1.6 27 0.7 6.9 0.6 0.1 0.7
Total 131 1.0 6.6 29 1.1 2.8 12.6 0.05 2.7 27 0.5 7.9 0.5 0.1 0.6
Females 5–6 125 0.8 5.2 26 1.1 3.8 12.4 0.07 0.4 25 1.2 8.6 0.0 0.0 0.0
7–10 128 0.6 6.8 32 1.1 2.8 12.3 0.06 1.5 25 0.6 11.1 0.6 0.1 0.7
11–14 132 0.8 2.2 26 1.1 9.0 12.4 0.09 2.3 27 1.2 13.2 4.3 1.2 5.5
Total 129 0.6 4.6 28 1.1 5.5 12.4 0.05 1.6 26 0.6 11.5 2.0 0.5 2.5
NZDep01 Males I 131 1.8 6.2 28 1.1 0.1 12.7 0.09 1.2 28 0.1 8.7 0.0 0.1 0.1
II 130 1.9 12.5 31 1.1 0.8 12.5 0.10 1.7 28 1.1 5.8 0.8 0.0 0.8
III 131 1.4 6.1 28 1.1 6.2 12.6 0.08 3.5 28 1.1 7.4 0.0 0.0 0.0
IV 131 0.9 1.1 27 1.1 5.5 12.7 0.08 4.5 27 1.1 4.3 1.1 0.0 1.1
V 131 1.0 6.2 32 1.1 1.6 12.7 0.07 2.0 24 0.7 10.8 0.7 0.3 1.0
Females I 130 1.5 7.1 27 1.1 4.5 12.1 0.07 0.0 26 1.5 11.9 0.0 0.0 0.0
II 129 1.0 3.2 27 1.2 10.8 12.3 0.11 2.0 27 1.6 12.8 6.2 0.0 6.2
III 130 0.8 1.0 31 1.2 2.8 12.4 0.11 2.3 27 1.5 10.4 0.5 0.1 0.6
IV 129 1.2 5.5 27 1.1 1.6 12.4 0.10 1.2 26 0.7 9.1 1.3 0.0 1.3
V 128 0.7 8.1 29 1.1 4.4 12.6 0.06 2.0 23 1.2 14.6 2.5 0.8 3.3
Mäori Males 5–6 125 1.0 4.3 27 1.2 4.6 12.9 0.15 15.0 22 1.2 15.8 0.0 0.0 0.0
7–10 129 0.7 4.9 31 1.1 1.7 12.8 0.06 2.9 24 0.6 9.1 1.7 0.5 2.2
11–14 134 1.2 7.2 30 1.2 3.9 13.0 0.10 6.5 26 1.2 16.6 2.4 0.0 2.4
Total 130 0.8 5.7 30 1.1 3.1 12.9 0.07 6.8 24 0.6 13.4 1.6 0.2 1.8
Females 5–6 125 1.1 7.8 30 1.1 0.0 12.5 0.13 1.3 23 1.8 14.8 0.0 0.0 0.0
7–10 128 0.8 9.1 34 1.1 2.7 12.6 0.07 2.3 24 0.6 13.2 0.5 0.0 0.5
11–14 131 1.3 6.2 23 1.3 16.0 12.6 0.12 5.8 21 1.0 23.2 7.3 4.0 11.2
Total 128 0.8 7.7 28 1.1 7.4 12.6 0.06 3.5 23 0.6 17.5 3.1 1.6 4.7
Pacific Males 5–6 124 1.1 11.6 31 1.1 2.9 12.7 0.08 4.0 25 1.0 8.4 1.0 0.0 1.0
7–10 127 0.8 4.8 37 1.1 0.0 12.6 0.08 3.7 23 0.6 10.6 2.0 0.5 2.5
11–14 134 1.1 13.6 41 1.1 3.4 12.8 0.08 2.2 23 0.6 14.1 1.6 1.1 2.7
Total 129 0.7 9.5 37 1.1 1.9 12.7 0.06 3.2 24 0.5 11.5 1.6 0.7 2.3
Females 5–6 122 0.8 11.6 37 1.1 0.0 12.6 0.09 1.2 21 0.9 9.2 0.0 0.0 0.0
7–10 126 0.9 18.0 34 1.1 2.4 12.5 0.08 2.3 22 0.6 14.6 1.2 1.3 2.5
11–14 128 0.4 9.6 27 1.1 16.0 12.8 0.09 5.1 21 0.6 21.6 5.7 3.9 9.6
Total 126 0.5 13.5 31 1.1 7.2 12.6 0.06 3.2 21 0.5 16.4 2.7 2.1 4.8
NZEO Males 5–6 123 1.3 16.6 25 1.1 3.8 12.6 0.13 5.8 25 1.2 7.7 0.0 0.0 0.0
7–10 129 0.9 3.8 27 1.1 4.4 12.5 0.07 0.6 29 0.8 7.3 0.0 0.0 0.0
11–14 136 1.3 5.5 31 1.1 0.9 12.5 0.07 0.0 28 0.7 3.1 0.0 0.0 0.0
Total 131 1.2 6.6 28 1.1 2.8 12.5 0.05 1.2 28 0.5 5.6 0.0 0.0 0.0
Females 5–6 125 1.0 3.4 23 1.2 5.7 12.4 0.09 0.0 26 1.5 6.2 0.0 0.0 0.0
7–10 129 0.8 4.6 31 1.1 3.0 12.2 0.08 1.2 26 0.9 10.0 0.6 0.0 0.6
11–14 133 0.8 0.0 27 1.1 5.9 12.3 0.12 0.8 30 1.3 9.0 3.2 0.0 3.2
Total 130 0.7 2.5 27 1.1 4.7 12.3 0.06 0.8 28 0.8 8.9 1.5 0.0 1.5
1 Iron deficiency present if at least two out of three of serum ferritin, red cell distribution width and transferrin saturation are abnormal.
2 Serum haemoglobin concentration < 115 if age 5–7 years, < 119 if age 8–11 years and if age 12–14 years, < 125 if male and < 118 if female.
3 Geometric mean.
4 Tolerance factor. A standard error equivalent obtained by multiplying the standard error of Ln Ferritin by 1.96 and taking the antilog of this value.
5 Serum ferritin concentration < 10 if age 5 years, < 12 if age 6–15 years.
6 Red cell distribution width > 14%.
7 Transferrin saturation < 12% if aged 5 years, < 14% if aged 6–15 years.
8 Anaemia present if serum haemoglobin concentration low.
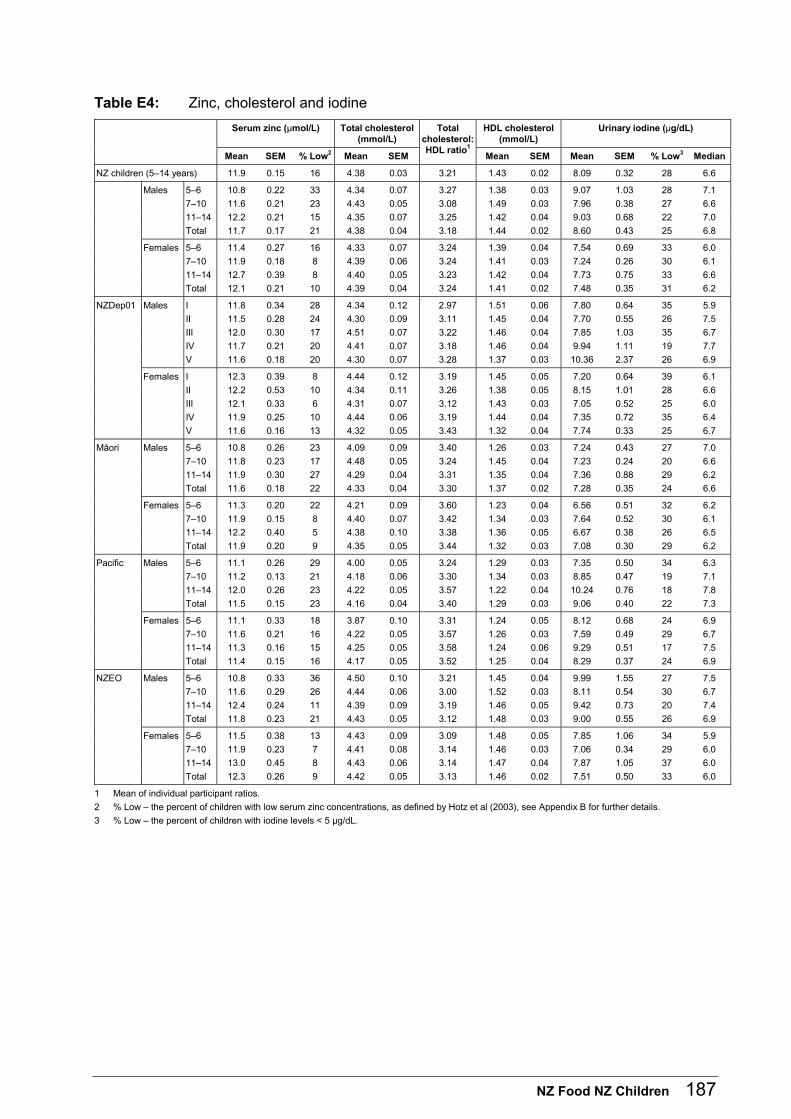
NZ Food NZ Children 187
Table E4: Zinc, cholesterol and iodine
Serum zinc (µmol/L) Total cholesterol (mmol/L)
HDL cholesterol (mmol/L)
Urinary iodine (µg/dL)
Mean SEM % Low2 Mean SEM
Total cholesterol:HDL ratio1
Mean SEM Mean SEM % Low3 Median
NZ children (5–14 years) 11.9 0.15 16 4.38 0.03 3.21 1.43 0.02 8.09 0.32 28 6.6
Males 5–6 10.8 0.22 33 4.34 0.07 3.27 1.38 0.03 9.07 1.03 28 7.1
7–10 11.6 0.21 23 4.43 0.05 3.08 1.49 0.03 7.96 0.38 27 6.6
11–14 12.2 0.21 15 4.35 0.07 3.25 1.42 0.04 9.03 0.68 22 7.0
Total 11.7 0.17 21 4.38 0.04 3.18 1.44 0.02 8.60 0.43 25 6.8
Females 5–6 11.4 0.27 16 4.33 0.07 3.24 1.39 0.04 7.54 0.69 33 6.0
7–10 11.9 0.18 8 4.39 0.06 3.24 1.41 0.03 7.24 0.26 30 6.1
11–14 12.7 0.39 8 4.40 0.05 3.23 1.42 0.04 7.73 0.75 33 6.6
Total 12.1 0.21 10 4.39 0.04 3.24 1.41 0.02 7.48 0.35 31 6.2
NZDep01 Males I 11.8 0.34 28 4.34 0.12 2.97 1.51 0.06 7.80 0.64 35 5.9
II 11.5 0.28 24 4.30 0.09 3.11 1.45 0.04 7.70 0.55 26 7.5
III 12.0 0.30 17 4.51 0.07 3.22 1.46 0.04 7.85 1.03 35 6.7
IV 11.7 0.21 20 4.41 0.07 3.18 1.46 0.04 9.94 1.11 19 7.7
V 11.6 0.18 20 4.30 0.07 3.28 1.37 0.03 10.36 2.37 26 6.9
Females I 12.3 0.39 8 4.44 0.12 3.19 1.45 0.05 7.20 0.64 39 6.1
II 12.2 0.53 10 4.34 0.11 3.26 1.38 0.05 8.15 1.01 28 6.6
III 12.1 0.33 6 4.31 0.07 3.12 1.43 0.03 7.05 0.52 25 6.0
IV 11.9 0.25 10 4.44 0.06 3.19 1.44 0.04 7.35 0.72 35 6.4
V 11.6 0.16 13 4.32 0.05 3.43 1.32 0.04 7.74 0.33 25 6.7
Mäori Males 5–6 10.8 0.26 23 4.09 0.09 3.40 1.26 0.03 7.24 0.43 27 7.0
7–10 11.8 0.23 17 4.48 0.05 3.24 1.45 0.04 7.23 0.24 20 6.6
11–14 11.9 0.30 27 4.29 0.04 3.31 1.35 0.04 7.36 0.88 29 6.2
Total 11.6 0.18 22 4.33 0.04 3.30 1.37 0.02 7.28 0.35 24 6.6
Females 5–6 11.3 0.20 22 4.21 0.09 3.60 1.23 0.04 6.56 0.51 32 6.2
7–10 11.9 0.15 8 4.40 0.07 3.42 1.34 0.03 7.64 0.52 30 6.1
11–14 12.2 0.40 5 4.38 0.10 3.38 1.36 0.05 6.67 0.38 26 6.5
Total 11.9 0.20 9 4.35 0.05 3.44 1.32 0.03 7.08 0.30 29 6.2
Pacific Males 5–6 11.1 0.26 29 4.00 0.05 3.24 1.29 0.03 7.35 0.50 34 6.3
7–10 11.2 0.13 21 4.18 0.06 3.30 1.34 0.03 8.85 0.47 19 7.1
11–14 12.0 0.26 23 4.22 0.05 3.57 1.22 0.04 10.24 0.76 18 7.8
Total 11.5 0.15 23 4.16 0.04 3.40 1.29 0.03 9.06 0.40 22 7.3
Females 5–6 11.1 0.33 18 3.87 0.10 3.31 1.24 0.05 8.12 0.68 24 6.9
7–10 11.6 0.21 16 4.22 0.05 3.57 1.26 0.03 7.59 0.49 29 6.7
11–14 11.3 0.16 15 4.25 0.05 3.58 1.24 0.06 9.29 0.51 17 7.5
Total 11.4 0.15 16 4.17 0.05 3.52 1.25 0.04 8.29 0.37 24 6.9
NZEO Males 5–6 10.8 0.33 36 4.50 0.10 3.21 1.45 0.04 9.99 1.55 27 7.5
7–10 11.6 0.29 26 4.44 0.06 3.00 1.52 0.03 8.11 0.54 30 6.7
11–14 12.4 0.24 11 4.39 0.09 3.19 1.46 0.05 9.42 0.73 20 7.4
Total 11.8 0.23 21 4.43 0.05 3.12 1.48 0.03 9.00 0.55 26 6.9
Females 5–6 11.5 0.38 13 4.43 0.09 3.09 1.48 0.05 7.85 1.06 34 5.9
7–10 11.9 0.23 7 4.41 0.08 3.14 1.46 0.03 7.06 0.34 29 6.0
11–14 13.0 0.45 8 4.43 0.06 3.14 1.47 0.04 7.87 1.05 37 6.0
Total 12.3 0.26 9 4.42 0.05 3.13 1.46 0.02 7.51 0.50 33 6.0
1 Mean of individual participant ratios.
2 % Low – the percent of children with low serum zinc concentrations, as defined by Hotz et al (2003), see Appendix B for further details.
3 % Low – the percent of children with iodine levels < 5 µg/dL.
188 NZ Food NZ Children
F. Mäori Issues A total of 1224 Mäori children (631 males; 593 females) took part in the survey. The overall nutritional status of Mäori children as assessed by many indices (nutrient intake, anthropometric and biochemical) falls between NZEO children and Pacific children. Some areas are entirely satisfactory:
• Vitamin C, riboflavin and vitamin B12 intakes are adequate.
• Calcium and zinc intakes are satisfactory up to the age of 10, and iron intakes are satisfactory except for menstruating females. Folate intakes are only an issue among females 11–14 years.
• About one half of Mäori children consumed Silverbeet, spinach, puha or watercress at least once per week.
• Mäori children had the greatest proportion in the highest activity quartile. The results listed below suggest areas where there might be improvements:
• The mean contribution of fat to energy increased with age.
• Mäori children had high median usual daily intakes of sugar and fat.
• The proportion of females who were overweight was 30.6 percent, and 16.7 percent were obese.
• Over one fifth of children (males 27.9 percent; females 20.9 percent) did not report brushing their teeth the previous day.
• Twenty-nine percent of females and 24 percent of males had low urinary iodine levels when it is recommended that only 20 percent of a population should have levels less than 5 µg/dL.
• Close to 11 percent of females and 9 percent of males watched more than 20 hours of television or videos per week.
• Sixteen percent of females and 12.7 percent of males did not take part in physical activity during the weekends.
• About 16 percent of females 11–14 years did not consume any food before leaving home for school in the morning.
• The more people and children in a household, the less likely it was that households Could always afford to eat properly.
Younger Mäori children, compared with older, were more likely to follow healthier practices with respect to food intake, to have higher levels of physical activity and to be more active within and outside school hours. Consequently these younger children have a lower prevalence of overweight and obesity.
NZ Food NZ Children 189
Overall it appears that if older children emulated the breakfast eating habits (as evidenced by breakfast cereal and milk consumption), snack choices (as evidenced by fruit, sugar and sweets consumption) and activity patterns of younger Mäori children their nutritional health status could be improved. This conclusion is very similar to that reached for Pacific and NZEO children.
190 NZ Food NZ Children
G. Pacific Issues The Pacific group of children included the following ethnic groups: Samoan (52 percent), Tongan (21 percent), Cook Island Mäori (14 percent), Niuean (7 percent), Tokelauan (2 percent), Fijian (2 percent) and Other (2 percent). The following issues illustrate or are likely to influence the nutritional health of Pacific children:
• Over one fifth of children were obese and the prevalence rose with age, so that over one third of females 11–14 years were classified as obese.
• The percent energy from fat rose with age and less than one third of 11–14 year children met the dietary guideline for proportion of energy from fat.
• A major source of total fat was Pies & pasties.
• More Pacific households reported that they experienced food insecurity than households in the other ethnic groups but as was the case for all ethnic groups, households with the most children were the most affected.
• Almost half of Pacific children did not Usually eat or drink at home before school and about one third ate or drank on the way to school.
• Females 11–14 years were less active than males, during the weekend and after school, and fewer females than males were in quartile IV (the most active of the activity quartiles).
• Hours spent watching television or videos during the week and weekend doubled from the youngest to the oldest groups of children.
• Pacific children had low intakes of dietary fibre, vitamin A (retinol and β carotene), riboflavin, folate and calcium.
• Pacific females had the highest intakes of selenium (reflecting fish intake), and Pacific children had a lower intake of total sugars, than all other children.
The food patterns and food choices of Pacific children showed some distinctive features compared with the other children in this study. In particular, the lower consumption of breakfast cereals, dairy products and many vegetables, and the higher consumption of foods such as taro, fish and some meats reflect their ethnic backgrounds. As in other ethnic groups, the quality of food choices of Pacific children declined with age. Younger Pacific children who consumed a lower proportion of their intake from meat and more from milk, bread, fruit and breakfast cereals than older children had better macro and micronutrient intakes. Older Pacific children sourced a greater proportion of their food from outside the home (shop, dairies, takeaways, tuckshops and canteens) than younger Pacific children. Attention must be paid to assisting children to make wiser choices at all times and influencing them by ensuring healthier choices are available and encouraged within the school environment.
NZ Food NZ Children 191
H. New Zealand European and Others Issues The NZEO group of children represented a diverse ethnic mix: New Zealand European (82 percent), Asian (6 percent), Other European (4 percent), Indian (4 percent) and other (5 percent). Although NZEO children had a relatively good outcome in terms of nutritional status including anthropometric and biochemical assessments, there are areas that require attention. The nutrients of some concern, mostly among older NZEO children, were vitamin A and calcium. The prevalence of low urinary iodine status also needs to be addressed. Of particular note is the fact that the younger children studied (5–6 years) had the lowest prevalence of overweight and obesity, and better food choices and nutrient intakes compared with the older groups. It appears that as levels of social independence increase throughout childhood this may adversely influence food choices and hence food and nutrient intake. These issues paralleled an increase in the prevalence of overweight and obesity with age. Compared with older children, younger children:
• ate fruit more frequently, and females ate vegetables more frequently
• consumed less sugar and sweets
• had a lower prevalence of overweight and obesity
• had a higher proportion meet the recommended guidelines for percent energy from fat
• were most likely to consume food at school that came from home
• were most likely not to have watched television or videos during the weekend
• were most likely to have been transported to school
• were most likely to be in the highest activity quartile
• were least likely to have an inadequate intake of riboflavin, folate, calcium and iron. For all NZEO children:
• the estimated prevalence of inadequate intakes of vitamin C, riboflavin, vitamin B12, vitamin A (males), zinc (males), and iron (males) ranged from 0 percent to 5 percent
• the prevalence of iron deficiency was 0 percent for males and 1.5 percent for females
• 26 percent of males and 33 percent of females had low urinary iodine levels when it is recommended that only 20 percent of a population should have levels less than 5 µg/dL.
192 NZ Food NZ Children
Appendix A: Survey Objectives The objectives of the CNS02, determined by the Ministry of Health, were:
1. To collect baseline data on food and nutrient intakes, which are suitable for:
• use in dietary modelling and risk assessment
• using in the development of food policy and regulations related to food composition, labelling and safety
• assisting the ongoing development and impact monitoring of New Zealand’s nutrition policy
• assisting in the future development of health goals and targets
• providing a basis for nutrition education and other strategies to improve nutrition, and providing a means of measurement from existing nutrition programmes
• comparing the intakes of food and nutrients with the recommendations in the Food and Nutrition Guidelines and recommended dietary intakes (RDIs) and taking the results into account in any further development of these recommendations.
2. To measure baseline intake of dietary supplements in order to assess the level of use and contribution to total nutrient intake.
3. To examine patterns of dietary intake and key food habits, providing a basis for comparisons with future periodic surveys.
4. To provide baseline data on physical activity and time use that can be used for comparison with the recommendations in the Food and Nutrition Guidelines and targets of other agencies, such as the Hillary Commission (SPARC).
5. To provide baseline data on food security, barriers to dietery change and nutritional status that can be used for intersectoral policy work.
6. To collect data on height, weight and other physical measures for children of different ages and ethnic groups.
7. To collect data on dental health that can be used in the monitoring and setting of dental health policy goals and targets.
8. To ensure the number of Mäori in the survey is proportional to the number of Mäori in New Zealand, both iwi and non-iwi based, to achieve reliable ethnic-specific rates.
9. To ensure the survey collects data on Pacific peoples that are sufficient to achieve reliable ethnic-specific rates.
10. To ensure sufficient numbers of children in urban and rural areas are included, particularly Mäori, to achieve reliable rates for comparison.
NZ Food NZ Children 193
11. To ensure participation of Mäori at all levels through appropriate consultation, resource allocation and the development of culturally appropriate practices for collecting and disseminating data.
13. To ensure all information collected respects and protects the rights of children and families participating in the survey.
14. To facilitate the development of nutritional status and dietary intake indicators that could be used for more regular surveillance.
15. To collect socioeconomic and family support information that helps with the interpretation of the survey data.
16. To provide much needed information to external users such as dietitians, nutritionists, the food industry, health promoters, Mäori and Pacific health providers, children, young people and their families.
Personnel
Principal investigators
Eljon Fitzgerald School of Mäori Studies, Massey University
Winsome Parnell Human Nutrition, University of Otago
David Schaaf Division of Mäori & Pacific Health, University of Auckland
Associate Professor Robert Scragg School of Population Health, University of Auckland
Dr Noela Wilson LINZ® Activity & Health Research Unit, University of Otago
Co-investigators
Dr Elaine Ferguson Human Nutrition, University of Otago Associate Professor Cameron Grant Paediatrics, University of Auckland Peter Herbison Preventive & Social Medicine,
University of Otago Susan Sharpe School of Population Health,
University of Auckland Alistair Stewart School of Population Health,
University of Auckland
194 NZ Food NZ Children
Consultants
Associate Professor John Broughton Ngai Tahu Mäori Health Research Unit, University of Otago
Dr Bernadette Drummond Dentistry, University of Otago
Professor Rosalind Gibson Human Nutrition, University of Otago
Dr Craig Marshall Biochemistry, University of Otago
Dr Ian Morison Biochemistry, University of Otago, and Southern Community Laboratories
Sheila Skeaff Human Nutrition, University of Otago
Associate Professor Christine Thomson Human Nutrition, University of Otago
Associate Professor Murray Thomson Dentistry, University of Otago
Ministry of Health
Elizabeth Aitken Technical Advisor, Senior Advisor Nutrition Anne Duncan Project Manager,
Senior Advisor Survey Management Mary-Louise Hannah Technical Advisor,
Senior Advisor Nutrition/Survey Anne Masoe Support Manager, The Compass Group Kerris Paterson Publication, The Compass Group Kiri Simonsen Technical Advisor, Mäori Health Directorate Colin Tukuitonga Technical Advisor, Director of Public Health
Project offices
University of Auckland Persees Antia James Chal Pervin Suntoke
Massey University Rangihaanu Rolls
University of Otago Charles Blakey, Software Developer Rachel Bolch, Nutritionist Christine Cleghorn, Nutritionist Maureen Foster, Secretary Sarah McLachlan, Research Assistant Tony Mottershead, Research Assistant Claire Smith, Nutritionist Stephanie Thurlow, Research Assistant Paul Williams, Research Assistant Mark Wohlers, Biostatistician
NZ Food NZ Children 195
Field staff
University of Auckland Debbie Waayer, Regional Manager Katie Clemens Catherine George Yvonne Learmonth Taani Lavulavu Margaret McCormack Patricia Meagher-Lundberg Fina Palaetago Debbie Raroa Henrietta Tinetali
Massey University Hana Karatea, Regional Manager Charlotte Adank Ani Johnson Kawarau Ngaia Sharon Pihema Theresa Waiwiri
University of Otago Anna Davidson Aroha Miller
Advisory groups
CNSTAC
Dr John Birkbeck Massey University Dr Alison Blaiklock Auckland District Health Board Ms Maraea Craft Tairawhiti Health Authority Mrs Karen Fukofuka Lower Hutt District Health Board Professor Rosalind Gibson University of Otago Ms Judith Ka’ai Te Hotu Manawa Mäori Professor Jim Mann University of Otago Professor Ed Mitchell University of Auckland Kiri Simonsen Ministry of Health Robert Templeton Statistics New Zealand Dr Colin Tukuitonga Ministry of Health Dr Clare Wall Massey University

196 NZ Food NZ Children
Board
James Chal Auckland UniServices Ltd Professor Mason Durie Massey University Dr Sitaleki Finau University of Auckland Professor Rod Jackson University of Auckland Judith Ka’ai Te Hotu Manawa Mäori Dr Allen Liang Pediatrician, Auckland Professor Jim Mann Chair of CNSTAC, University of Otago Roger McClay (Chair) Commissioner for Children Emeritus Professor David Russell University of Otago
Kaitiaki
Maraea Craft Tairawhiti Health Authority Tere Gravenor Te Ringa Atawhai Carnation Hetaraka-Bervang Te Whänau o Waipareira Judith Ka’ai Te Hotu Manawa Mäori Inez Kingi Tunohopu Health Cyril Mako Statistics New Zealand Eruera Maxted Northland Health Ben McCrae Te Puni Kökiri Makuini McKerchar Te Waka Hauora Hiki Pihema Te Runanga o Ngäti Porou Iwi Social Services Mavis Roberts University of Auckland Binki Taua University of Auckland Laurie Wharemate Te Hotu Manawa Mäori
Pacific
Moera Douthett Pacific Community
Stephanie Erick-Peleti Auckland University of Technology
’Eseta Finau University of Auckland
Mafi Funaki-Tahifote Massey University
Vaine Joseph Pacific Community
Ta’i Matanga-Smith Auckland Regional Public Health Services, Auckland District Health Board
Soana Muimuiheata Southseas Pacific Health Provider
Malakai ’Ofanoa University of Auckland
Kasalanaita Puniani Auckland Regional Public Health Services, Auckland District Health Board
Associate Professor Elaine Rush Auckland University of Technology
Iutita Rusk Pacific Heart Beat, National Heart Foundation
Laurel Taufauata Pacific Community
Sione Fifita Tupou Community Child Health and Disability Services, Auckland District Health Board
Heather Wright Ministry of Foreign Affairs and Trade
NZ Food NZ Children 197
Appendix B: Methodology
Sampling strategy The primary aim in the sampling strategy was to ensure a nationally representative sample, including sufficient numbers of children in the Mäori and Pacific groups to enable ethnic-specific analyses. A two-stage sampling frame was used to recruit children aged 5–14 from schools throughout New Zealand. The first stage involved sampling 160 schools with equal probability from the Ministry of Education list of schools after excluding some schools for reasons of cost: schools on the Chatham Islands, correspondence schools, and schools with less than 50 students. Te Kura Kaupapa schools were included regardless of size. The second stage involved randomly sampling students from the rolls of selected schools in proportion to the number of students on the school roll. Fee-paying foreign students or foreign students on Ministry of Foreign Affairs and Trade scholarships were excluded. Different sampling proportions from the school roll were used for Mäori, Pacific and NZEO children to ensure approximately equal numbers of children in each ethnic group in the final survey sample. For administrative purposes schools were assigned to three regions: Northern: upper North Island (Hamilton and above); Central: lower North Island (south of Hamilton); Southern: South Island.
Sample size Once a school was selected and approval given to recruit children, the register of students aged 5–14 was divided into the three ethnic groups (Mäori, Pacific, NZEO). Children within each ethnic group were selected according to the following sampling proportions based on the latest available (July 2001) Ministry of Education school rolls: Pacific 0.410, Mäori 0.161 and NZEO 0.050. To ensure the final sample included approximately 1000 children in each of the three ethnic groups sampling proportions included an inflation factor to allow for a 70 percent response rate. Allowing for a design effect of 1.7 from weighting caused by differential ethnic sampling proportions and of 1.5 from school-based clustering (estimated from previous New Zealand school-based surveys) a sample of 1000 was recruited under the study design. This is approximately equivalent to 400 recruited by simple random sampling so that the standard error around a proportion of 50 percent was predicted to be 2.5 percent. From the original sample of 160 selected schools, 16 schools declined to participate in the survey. The number of children who would have been selected for the survey, at schools that declined to participate, was estimated to be 472, based on the July 2001 Ministry of Education school rolls. A further sample of 30 schools was selected with two schools declining. Thus, the final sample was selected from 172 schools.
198 NZ Food NZ Children
Response rate First stage. The overall response rate for schools was 91 percent, with a response rate in the south of 100 percent (54 schools); northern region 90 percent (53 schools participated); central region 84 percent (65 schools participated). Second stage. A participant in the survey was defined as a child who completed a 24-hour diet recall. The total number of children recruited from the 172 schools was 4728, and 3275 of these children participated (response rate 69.3 percent). The response rate was similar for males (70.4 percent) and females (68.1 percent) and did not vary with age (5–6 years 70.4 percent, 7–10 years 69 percent, 11–14 years 68.9 percent). However, the response rate varied with ethnicity, from 74 percent in Pacific children, to 69.8 percent in NZEO children, to 65.3 percent in Mäori children; and was higher for children at rural schools (74.5 percent) than those at urban schools (68.4 percent).
Ethical approval Ethical approval was sought and received from all 13 regional health ethics committees to seek permission from schools for access to their student rolls and from parents/caregivers to interview their children. The consent form sought separate approval from parents (or guardians) for each of the following: to take part in the survey, to collect a blood sample, to collect a urine sample, to store the blood sample long term for later nutrition related tests, to store the urine sample long term for later nutrition related tests, and consent for (anonymous) information about the child to be given to the Ministry of Health.
Mäori
Participation
The Mäori community participated in all aspects of the survey. Professor Mason Durie (Massey University) was a member of the Advisory Board and Eljon Fitzgerald (Massey University), a principal investigator. The research team welcomed the advice and guidance of a Kaitiaki Group throughout the survey. The research fieldwork team included a significant Mäori component – a regional supervisor, Hana Karatea, and six of 15 interviewers (one Northern, four Central and one Southern). The initial training of fieldworkers and the regular update sessions included a focus on Mäori cultural considerations. Considerable effort was made to ensure the 24-hour diet recall food database included appropriate Mäori foods. The information sheet about the survey was translated into Mäori.
NZ Food NZ Children 199
Consultation and publicity
There was extensive consultation with Mäori groups throughout the country over the course of the survey, particularly in the Central region where the response rate was the lowest. This included: a series of consultation hui, meetings and presentations at the Annual Conference of Mäori Dietitians and Nutritionists (Gisborne); Mäori community health and nutrition workers from Waikato, Bay of Plenty and King Country region; Tanenuiarangi Manawatu Inc, Iwi Authority, Palmerston North; Te Waka Huia Health, Palmerston North; Ngati Raukawa Iwi Health Services, Palmerston North; Mäori Women’s Welfare League, Napier/Hastings, Wellington; Te Kura Kaupapa schools; Meetings and discussions took place with principals at all schools selected for the survey. In addition consultation was undertaken with the following Mäori organisations in the Northland region: Te Ringa Atawhai – Mäori Community Health Workers Network (Okaihau, Kaitaia, Coopers Beach, Kaikohe, Broadwood, Hokianga, Bay of Islands); Te Hauora o te Hiku o Te Ika (Mäori Health and Nutrition Unit, Kaitaia Hospital); Te Hauora o te Taitokerau (Iwi Health Authority, Whangarei); Hokianga Health Trust (District School Health Nurses and Clinic, Pawarenga). A number of Mäori radio interviews were undertaken to promote the survey to Mäori families and communities. For example, principal investigator Eljon Fitzgerald appeared on a one-hour health segment at Kia Ora FM broadcasting to the central North Island and the Marlborough/ Nelson regions.
Cultural safety of blood and urine samples
The following processes were carried out in an effort to be responsive to tikanga Mäori in consultation with the Kaitiaki group. Members of the Kaitiaki group visited the laboratories to bless areas where the analyses, storage and disposal of specimens were carried out. A Mäori member of the research team was designated to take responsibility for the collection, signing for and disposal of any specimens from the laboratories where the testing of the blood samples was carried out. Parents (or guardians) were offered an opportunity to request the return of blood and urine samples to their home address.
Pacific
Participation
The Pacific community participated at all levels of the survey. Professor Sitaleki Finau (University of Auckland) represented Pacific people on the Advisory Board. An Advisory Group to the principal investigators was set up consisting of members of the PIFNAG (Pacific Island Food, Nutrition and Physical Activity Action Group), health professionals and Pacific community representatives. David Schaaf (University of Auckland) was a principal investigator. Three of the 13 interviewers were of Samoan, Tongan and Cook Islands descent.
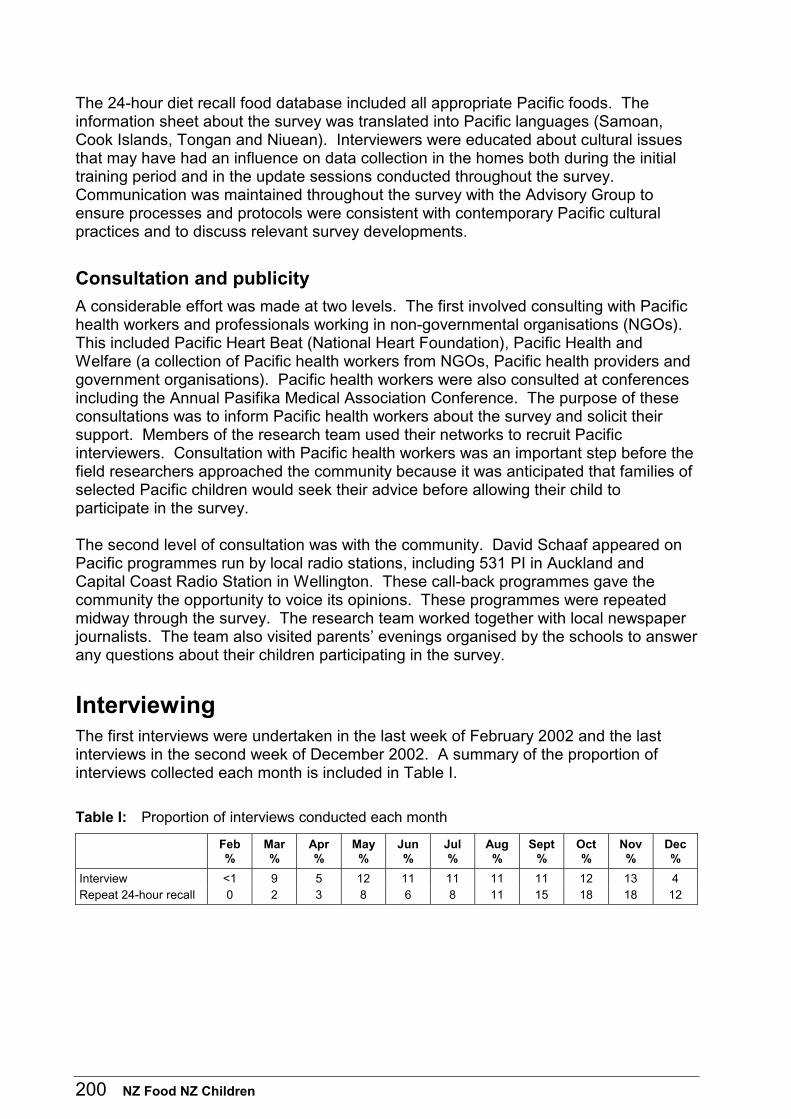
200 NZ Food NZ Children
The 24-hour diet recall food database included all appropriate Pacific foods. The information sheet about the survey was translated into Pacific languages (Samoan, Cook Islands, Tongan and Niuean). Interviewers were educated about cultural issues that may have had an influence on data collection in the homes both during the initial training period and in the update sessions conducted throughout the survey. Communication was maintained throughout the survey with the Advisory Group to ensure processes and protocols were consistent with contemporary Pacific cultural practices and to discuss relevant survey developments.
Consultation and publicity
A considerable effort was made at two levels. The first involved consulting with Pacific health workers and professionals working in non-governmental organisations (NGOs). This included Pacific Heart Beat (National Heart Foundation), Pacific Health and Welfare (a collection of Pacific health workers from NGOs, Pacific health providers and government organisations). Pacific health workers were also consulted at conferences including the Annual Pasifika Medical Association Conference. The purpose of these consultations was to inform Pacific health workers about the survey and solicit their support. Members of the research team used their networks to recruit Pacific interviewers. Consultation with Pacific health workers was an important step before the field researchers approached the community because it was anticipated that families of selected Pacific children would seek their advice before allowing their child to participate in the survey. The second level of consultation was with the community. David Schaaf appeared on Pacific programmes run by local radio stations, including 531 PI in Auckland and Capital Coast Radio Station in Wellington. These call-back programmes gave the community the opportunity to voice its opinions. These programmes were repeated midway through the survey. The research team worked together with local newspaper journalists. The team also visited parents’ evenings organised by the schools to answer any questions about their children participating in the survey.
Interviewing The first interviews were undertaken in the last week of February 2002 and the last interviews in the second week of December 2002. A summary of the proportion of interviews collected each month is included in Table I.
Table I: Proportion of interviews conducted each month
Feb%
Mar %
Apr%
May%
Jun%
Jul %
Aug%
Sept%
Oct %
Nov %
Dec%
Interview <1 9 5 12 11 11 11 11 12 13 4 Repeat 24-hour recall 0 2 3 8 6 8 11 15 18 18 12
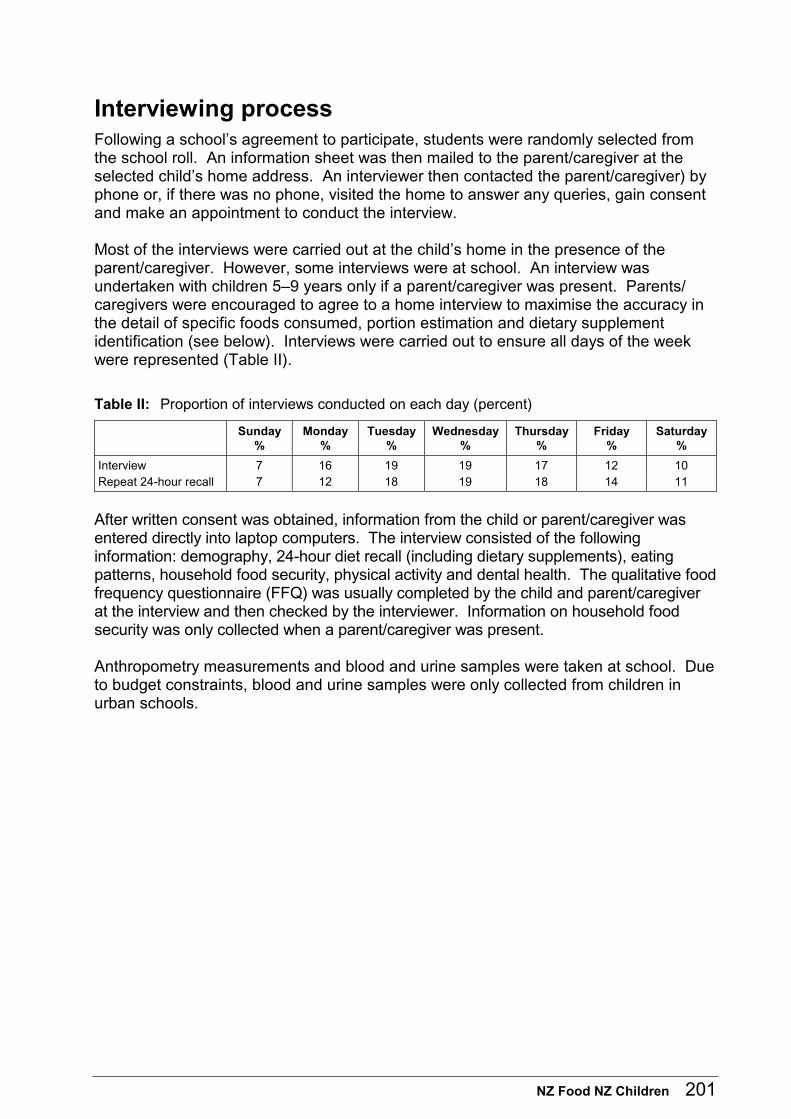
NZ Food NZ Children 201
Interviewing process Following a school’s agreement to participate, students were randomly selected from the school roll. An information sheet was then mailed to the parent/caregiver at the selected child’s home address. An interviewer then contacted the parent/caregiver) by phone or, if there was no phone, visited the home to answer any queries, gain consent and make an appointment to conduct the interview. Most of the interviews were carried out at the child’s home in the presence of the parent/caregiver. However, some interviews were at school. An interview was undertaken with children 5–9 years only if a parent/caregiver was present. Parents/ caregivers were encouraged to agree to a home interview to maximise the accuracy in the detail of specific foods consumed, portion estimation and dietary supplement identification (see below). Interviews were carried out to ensure all days of the week were represented (Table II).
Table II: Proportion of interviews conducted on each day (percent)
Sunday %
Monday%
Tuesday%
Wednesday%
Thursday %
Friday %
Saturday%
Interview 7 16 19 19 17 12 10 Repeat 24-hour recall 7 12 18 19 18 14 11
After written consent was obtained, information from the child or parent/caregiver was entered directly into laptop computers. The interview consisted of the following information: demography, 24-hour diet recall (including dietary supplements), eating patterns, household food security, physical activity and dental health. The qualitative food frequency questionnaire (FFQ) was usually completed by the child and parent/caregiver at the interview and then checked by the interviewer. Information on household food security was only collected when a parent/caregiver was present. Anthropometry measurements and blood and urine samples were taken at school. Due to budget constraints, blood and urine samples were only collected from children in urban schools.
202 NZ Food NZ Children
24-hour diet recall
Development of methodology
A pilot study conducted on 92 New Zealand children (5–14 years) comparing intake by the 24-hour diet recall and the 24-hour record assisted recall with energy expenditure assessed by doubly labelled water, concluded that there was little difference between the two methods (Watson et al, 2001). The methodology chosen for assessing dietary intake in the CNS02 was the 24-hour diet recall, also used for the National Nutrition Survey of adults aged 15 and over conducted in 1997 (Ministry of Health 1999). While the NNS97 recalled intake from the previous day (midnight to midnight) the CNS02 asked for recall of intake from the 24-hour period immediately prior to the time of data collection. This process used a direct computer data entry system LINZ24, a Windows-based program developed by Charles Blakey, that utilised the world wide web to deliver completed interviews back to the project office. The methodology used for NNS97 was modified and developed by the LINZ® Research Unit to be more appropriate for the sample population (children 5–14 years). All children under 10 years were interviewed in the presence of a parent or adult caregiver. The questioning used in NNS97 was modified to reflect foods likely to be consumed by children and to reflect the increased availability of fortified foods, greater variety of packaged foods and drinks, expansion in the variety of serving sizes for packaged products, and proliferation of fast food outlets. The computer assisted, multiple pass 24-hour diet recall interview was structured into three steps (passes) to maximise the child’s recall of foods eaten. The first pass, the ‘quick list’, involved supplying a broad description of all foods, beverages and dietary supplements consumed in the previous 24 hours. In the next stage, a detailed description of each food, beverage or dietary supplement on the quick list was ascertained through a series of programme-controlled questions and prompts specific to each item. Questions for each item included: time of consumption, amount eaten, any additions made before consumption (ie, eaten in combination with other foods, for example, bread with butter), the cooking method and recipes for mixed dishes (excluding baked goods) where they were known. Brand and product names were requested for foods from categories where fortification is legally permitted and for some food categories with a large variety of different products of differing nutrient composition (eg, ice creams, snack bars). When the packaging was available, a bar code scanner was applied to the package to record information directly. The amount of foods or beverages consumed was described by volume using cups, spoons, food photographs and shape dimensions. Alternatively, a measure descriptors file was accessible containing weights of common servings specified items (eg, one slice of bread) and where appropriate the conversions from the raw to cooked weight. This was necessary as recipe ingredients were listed by weight of the component in cooked form. When the child (or parent) supplied a recipe, the amount of each ingredient was obtained and the portion of the whole dish eaten was indicated.
NZ Food NZ Children 203
As with fortified foods, brand and product names were requested for all dietary supplements. If the brand and product name was unknown, a series of questions was asked to obtain as much information about the dietary supplement as possible. Interviewers also recorded the volume amount of a supplement or number of tablets taken. The third and final pass was a review of the recall. The interviewer read aloud the foods eaten in chronological order and verified the descriptions and amounts consumed. A final question checked whether anything had been omitted from the recall. Any information that was forgotten or incorrectly entered was added or edited at this stage. Entry errors with respect to amounts were minimised by warning messages seeking confirmation of unusually large volumes or amounts of a food or beverage consumed. A comprehensive food list, which comprised all the known foods and beverages available for consumption in New Zealand, was contained within the programme. This list was updated throughout the survey. Foods eaten were entered in a format consistent with the names used in this list to produce standardised descriptions. The series of item specific questions in the second pass of the recall, ensured food items were described in sufficient detail to enable accurate matching with food composition data. This also minimised possible variation between interviewers as all questions were read aloud from the computer screen to the children. A notepad function allowed interviewers to record any additional or unusual information about foods eaten by the children. A demonstration of the LINZ24 Diet Recall programme is available on www.otago.ac.nz/LINZ. The day-to-day variation in nutrient intake was estimated by repeating the 24-hour diet recall on a subsample (505 children) and adjusting the nutrient intakes reported (using the PC-SIDE programme) to estimate the distribution of ‘usual’ intakes in the population.
204 NZ Food NZ Children
Dietary analysis
Nutrient analysis
Foods and beverages from the 24-hour diet recall were electronically matched to food composition data to calculate nutrient intake. The primary source of food composition information was the New Zealand Food Composition Database (NZFCD), which contains the composition of approximately 2000 foods. It is compiled and regularly updated by Crop and Food Research Ltd working in conjunction with the manufactured food database (New Zealand Institute for Crop & Food Research Ltd (CFR) 2002; Manufactured Food Database (MFD) 2002). Detailed food composition analytical techniques for nutrients included in the NZFCD are described in Athar et al (2001). Table III provides an outline of the analytical techniques. If a direct match with information in the NZFCD was not available and the frequency of use was high relative to other foods, additional nutrient composition data were sought either from overseas databases (Australian, US and British) if applicable, or the food item was recommended for analysis in New Zealand. When a food or beverage could not be completely described by the child or parent (for example the child had milk but did not know the type) it was matched for nutrient composition to a composite, weighted to reflect use in the survey sample. Foods that were fortified at the commencement of data collection (February 2002), and new fortified products coming onto the market during the survey, were identified by the MFD and from careful monitoring of supermarket foods. The levels of fortified nutrients were based on information obtained from the manufacturer. CFR then incorporated these levels into existing nutrient information for the corresponding food, to create brand and product name specific nutrient composition. Analytical nutrient composition data were also available from CFR for a number of fortified foods. Existing products that became fortified during the survey period or changes in fortificant levels could not be taken into account due to an unknown and variable time lag, between a change in manufacturing procedure and product consumption. If a recipe could not be supplied by the child (or parent/caregiver) for a mixed food item it was matched to a standard recipe. Standard recipes used in NNS97 were modified and recalculated to utilise the most up to date New Zealand nutrient composition data. Recipes were also created from composites of recipes supplied in this survey and obtained from commonly used recipes from top selling New Zealand cook books, internet sites and information from fast food outlets. The nutrient composition of these recipes, allowing for weight and nutrient loss or gain in cooking, was calculated by CFR.
NZ Food NZ Children 205
Dietary supplement matching
A dietary supplement was defined as any product intended for ingestion as a supplement to the diet. To enable nutrient matching of dietary supplements, an updated dietary supplement database including all children’s dietary supplements on the market at the time was supplied by CFR to LINZ® (Lake et al 2001). For supplements that were not on the list supplied by ESR, LINZ® purchased the supplement and calculated its nutrient composition from label information. All nutrient information about dietary supplements used in CNS02 was based on information supplied by the manufacturer. If the brand and product name of a dietary supplement was unknown, it was nutrient matched to a composite of its type, weighted to reflect use in the survey. As the use of dietary supplements with solely herbal ingredients was minimal, and because nutrient breakdowns were not available, they were excluded from the nutrient analyses.
Dietary sources
In order to calculate sources of nutrients by ‘food type’, food items reported in the 24-hour diet recall have been allocated to food groups. Table III describes the groups and illustrates the designation of food items within them. The following issues require explanation.
1. Grouping of components of mixed dishes: Children who consumed a mixed dish, such as macaroni cheese, may or may not have known the recipe. If the recipe was supplied by the child/parent the ingredients were entered individually, ie, each ingredient was separately allocated to the appropriate group. When the exact recipe was unknown, information regarding content was sought from the child/parent, for example, whether meat was added to the macaroni cheese, in order to identify which recipe provided the best nutrient match. In this situation where there was nutrient composition information only for the dish as a whole, it was assigned to the most appropriate group. For example, macaroni cheese would be assigned to Grains and pasta since pasta is the main ingredient.
2. Comparisons of dietary sources of nutrients with the 1997 National Nutrition Survey: While many of the groups are essentially the same as those used in the NNS97 survey, food consumption patterns are different in children compared with adults and some new food group classification was required. Consequently, some food items may fall into different groups under the current scheme and direct comparison of results warrants caution. Asterisks (*) in Table III indicate that this group is not directly comparable to that used in NNS97.
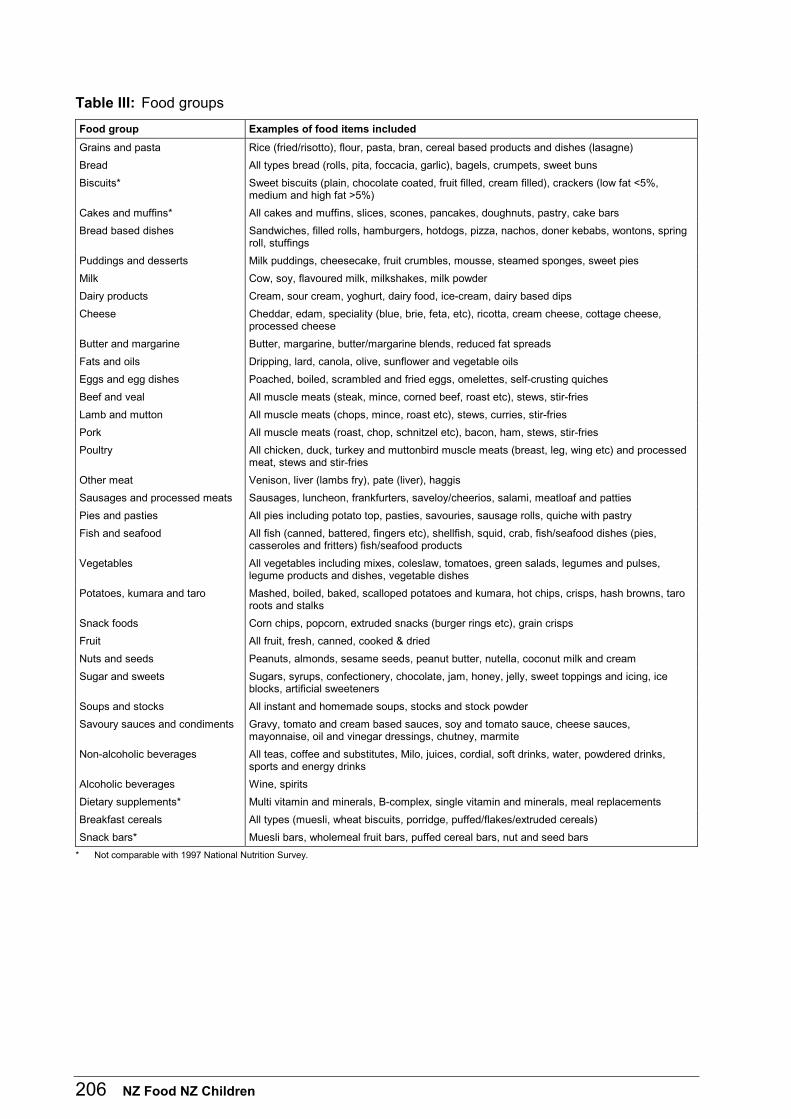
206 NZ Food NZ Children
Table III: Food groups
Food group Examples of food items included
Grains and pasta Rice (fried/risotto), flour, pasta, bran, cereal based products and dishes (lasagne)
Bread All types bread (rolls, pita, foccacia, garlic), bagels, crumpets, sweet buns
Biscuits* Sweet biscuits (plain, chocolate coated, fruit filled, cream filled), crackers (low fat <5%, medium and high fat >5%)
Cakes and muffins* All cakes and muffins, slices, scones, pancakes, doughnuts, pastry, cake bars
Bread based dishes Sandwiches, filled rolls, hamburgers, hotdogs, pizza, nachos, doner kebabs, wontons, spring roll, stuffings
Puddings and desserts Milk puddings, cheesecake, fruit crumbles, mousse, steamed sponges, sweet pies
Milk Cow, soy, flavoured milk, milkshakes, milk powder
Dairy products Cream, sour cream, yoghurt, dairy food, ice-cream, dairy based dips
Cheese Cheddar, edam, speciality (blue, brie, feta, etc), ricotta, cream cheese, cottage cheese, processed cheese
Butter and margarine Butter, margarine, butter/margarine blends, reduced fat spreads
Fats and oils Dripping, lard, canola, olive, sunflower and vegetable oils
Eggs and egg dishes Poached, boiled, scrambled and fried eggs, omelettes, self-crusting quiches
Beef and veal All muscle meats (steak, mince, corned beef, roast etc), stews, stir-fries
Lamb and mutton All muscle meats (chops, mince, roast etc), stews, curries, stir-fries
Pork All muscle meats (roast, chop, schnitzel etc), bacon, ham, stews, stir-fries
Poultry All chicken, duck, turkey and muttonbird muscle meats (breast, leg, wing etc) and processed meat, stews and stir-fries
Other meat Venison, liver (lambs fry), pate (liver), haggis
Sausages and processed meats Sausages, luncheon, frankfurters, saveloy/cheerios, salami, meatloaf and patties
Pies and pasties All pies including potato top, pasties, savouries, sausage rolls, quiche with pastry
Fish and seafood All fish (canned, battered, fingers etc), shellfish, squid, crab, fish/seafood dishes (pies, casseroles and fritters) fish/seafood products
Vegetables All vegetables including mixes, coleslaw, tomatoes, green salads, legumes and pulses, legume products and dishes, vegetable dishes
Potatoes, kumara and taro Mashed, boiled, baked, scalloped potatoes and kumara, hot chips, crisps, hash browns, taro roots and stalks
Snack foods Corn chips, popcorn, extruded snacks (burger rings etc), grain crisps
Fruit All fruit, fresh, canned, cooked & dried
Nuts and seeds Peanuts, almonds, sesame seeds, peanut butter, nutella, coconut milk and cream
Sugar and sweets Sugars, syrups, confectionery, chocolate, jam, honey, jelly, sweet toppings and icing, ice blocks, artificial sweeteners
Soups and stocks All instant and homemade soups, stocks and stock powder
Savoury sauces and condiments Gravy, tomato and cream based sauces, soy and tomato sauce, cheese sauces, mayonnaise, oil and vinegar dressings, chutney, marmite
Non-alcoholic beverages All teas, coffee and substitutes, Milo, juices, cordial, soft drinks, water, powdered drinks, sports and energy drinks
Alcoholic beverages Wine, spirits
Dietary supplements* Multi vitamin and minerals, B-complex, single vitamin and minerals, meal replacements
Breakfast cereals All types (muesli, wheat biscuits, porridge, puffed/flakes/extruded cereals)
Snack bars* Muesli bars, wholemeal fruit bars, puffed cereal bars, nut and seed bars
* Not comparable with 1997 National Nutrition Survey.
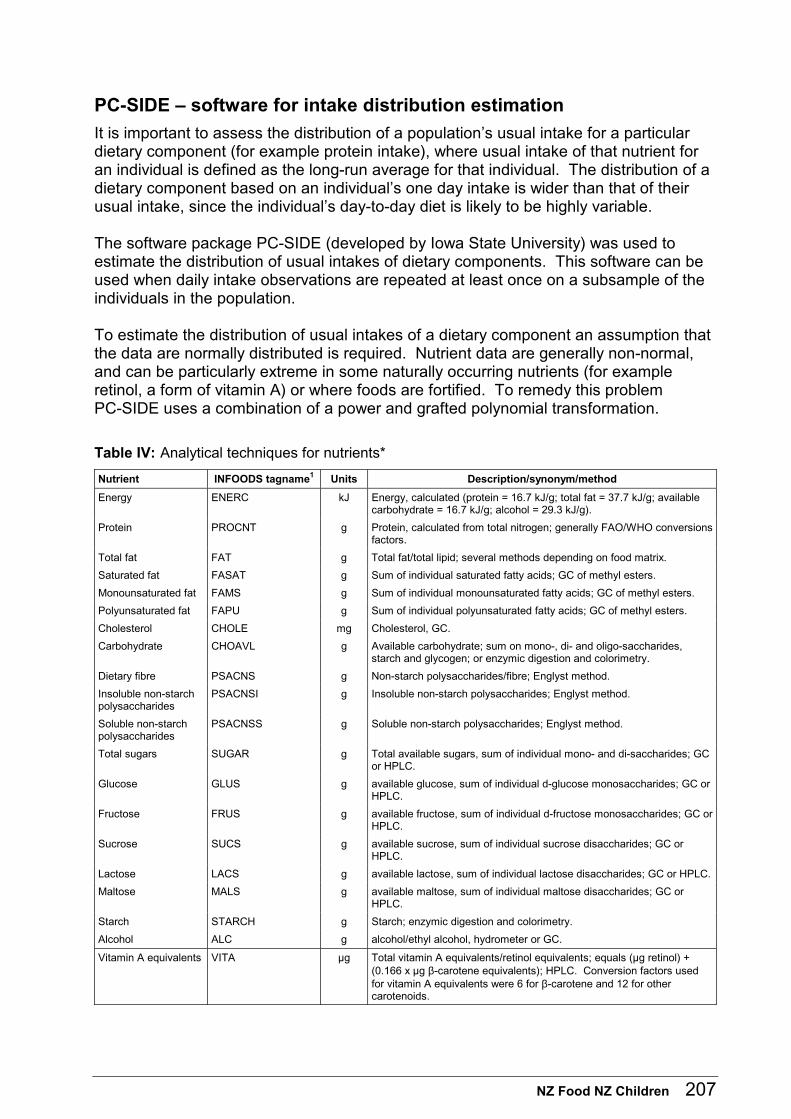
NZ Food NZ Children 207
PC-SIDE – software for intake distribution estimation
It is important to assess the distribution of a population’s usual intake for a particular dietary component (for example protein intake), where usual intake of that nutrient for an individual is defined as the long-run average for that individual. The distribution of a dietary component based on an individual’s one day intake is wider than that of their usual intake, since the individual’s day-to-day diet is likely to be highly variable. The software package PC-SIDE (developed by Iowa State University) was used to estimate the distribution of usual intakes of dietary components. This software can be used when daily intake observations are repeated at least once on a subsample of the individuals in the population. To estimate the distribution of usual intakes of a dietary component an assumption that the data are normally distributed is required. Nutrient data are generally non-normal, and can be particularly extreme in some naturally occurring nutrients (for example retinol, a form of vitamin A) or where foods are fortified. To remedy this problem PC-SIDE uses a combination of a power and grafted polynomial transformation.
Table IV: Analytical techniques for nutrients*
Nutrient INFOODS tagname1 Units Description/synonym/method
Energy ENERC kJ Energy, calculated (protein = 16.7 kJ/g; total fat = 37.7 kJ/g; available carbohydrate = 16.7 kJ/g; alcohol = 29.3 kJ/g).
Protein PROCNT g Protein, calculated from total nitrogen; generally FAO/WHO conversions factors.
Total fat FAT g Total fat/total lipid; several methods depending on food matrix.
Saturated fat FASAT g Sum of individual saturated fatty acids; GC of methyl esters.
Monounsaturated fat FAMS g Sum of individual monounsaturated fatty acids; GC of methyl esters.
Polyunsaturated fat FAPU g Sum of individual polyunsaturated fatty acids; GC of methyl esters.
Cholesterol CHOLE mg Cholesterol, GC.
Carbohydrate CHOAVL g Available carbohydrate; sum on mono-, di- and oligo-saccharides, starch and glycogen; or enzymic digestion and colorimetry.
Dietary fibre PSACNS g Non-starch polysaccharides/fibre; Englyst method.
Insoluble non-starch polysaccharides
PSACNSI g Insoluble non-starch polysaccharides; Englyst method.
Soluble non-starch polysaccharides
PSACNSS g Soluble non-starch polysaccharides; Englyst method.
Total sugars SUGAR g Total available sugars, sum of individual mono- and di-saccharides; GC or HPLC.
Glucose GLUS g available glucose, sum of individual d-glucose monosaccharides; GC or HPLC.
Fructose FRUS g available fructose, sum of individual d-fructose monosaccharides; GC or HPLC.
Sucrose SUCS g available sucrose, sum of individual sucrose disaccharides; GC or HPLC.
Lactose LACS g available lactose, sum of individual lactose disaccharides; GC or HPLC.
Maltose MALS g available maltose, sum of individual maltose disaccharides; GC or HPLC.
Starch STARCH g Starch; enzymic digestion and colorimetry.
Alcohol ALC g alcohol/ethyl alcohol, hydrometer or GC.
Vitamin A equivalents VITA µg Total vitamin A equivalents/retinol equivalents; equals (µg retinol) + (0.166 x µg β-carotene equivalents); HPLC. Conversion factors used for vitamin A equivalents were 6 for β-carotene and 12 for other carotenoids.
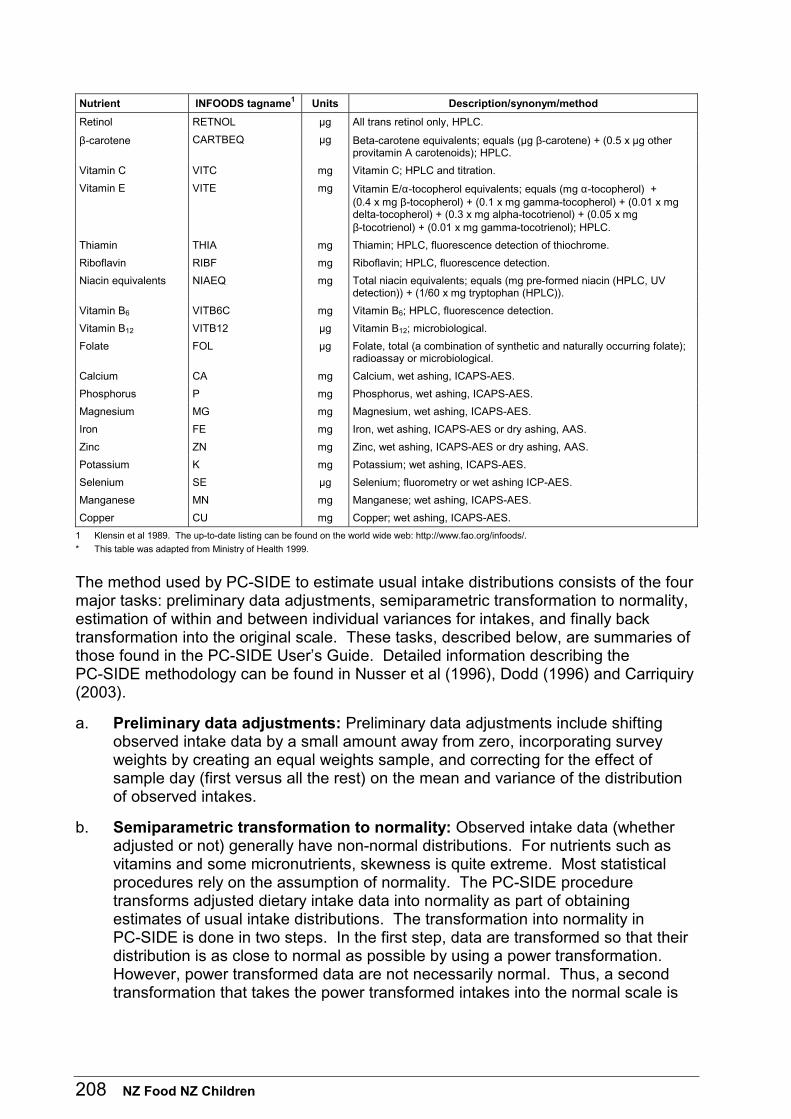
208 NZ Food NZ Children
Nutrient INFOODS tagname1 Units Description/synonym/method
Retinol RETNOL µg All trans retinol only, HPLC.
β-carotene CARTBEQ µg Beta-carotene equivalents; equals (µg β-carotene) + (0.5 x µg other provitamin A carotenoids); HPLC.
Vitamin C VITC mg Vitamin C; HPLC and titration.
Vitamin E VITE mg Vitamin E/α-tocopherol equivalents; equals (mg α-tocopherol) + (0.4 x mg β-tocopherol) + (0.1 x mg gamma-tocopherol) + (0.01 x mg delta-tocopherol) + (0.3 x mg alpha-tocotrienol) + (0.05 x mg β-tocotrienol) + (0.01 x mg gamma-tocotrienol); HPLC.
Thiamin THIA mg Thiamin; HPLC, fluorescence detection of thiochrome.
Riboflavin RIBF mg Riboflavin; HPLC, fluorescence detection.
Niacin equivalents NIAEQ mg Total niacin equivalents; equals (mg pre-formed niacin (HPLC, UV detection)) + (1/60 x mg tryptophan (HPLC)).
Vitamin B6 VITB6C mg Vitamin B6; HPLC, fluorescence detection.
Vitamin B12 VITB12 µg Vitamin B12; microbiological.
Folate FOL µg Folate, total (a combination of synthetic and naturally occurring folate); radioassay or microbiological.
Calcium CA mg Calcium, wet ashing, ICAPS-AES.
Phosphorus P mg Phosphorus, wet ashing, ICAPS-AES.
Magnesium MG mg Magnesium, wet ashing, ICAPS-AES.
Iron FE mg Iron, wet ashing, ICAPS-AES or dry ashing, AAS.
Zinc ZN mg Zinc, wet ashing, ICAPS-AES or dry ashing, AAS.
Potassium K mg Potassium; wet ashing, ICAPS-AES.
Selenium SE µg Selenium; fluorometry or wet ashing ICP-AES.
Manganese MN mg Manganese; wet ashing, ICAPS-AES.
Copper CU mg Copper; wet ashing, ICAPS-AES.
1 Klensin et al 1989. The up-to-date listing can be found on the world wide web: http://www.fao.org/infoods/.
* This table was adapted from Ministry of Health 1999.
The method used by PC-SIDE to estimate usual intake distributions consists of the four major tasks: preliminary data adjustments, semiparametric transformation to normality, estimation of within and between individual variances for intakes, and finally back transformation into the original scale. These tasks, described below, are summaries of those found in the PC-SIDE User’s Guide. Detailed information describing the PC-SIDE methodology can be found in Nusser et al (1996), Dodd (1996) and Carriquiry (2003).
a. Preliminary data adjustments: Preliminary data adjustments include shifting observed intake data by a small amount away from zero, incorporating survey weights by creating an equal weights sample, and correcting for the effect of sample day (first versus all the rest) on the mean and variance of the distribution of observed intakes.
b. Semiparametric transformation to normality: Observed intake data (whether adjusted or not) generally have non-normal distributions. For nutrients such as vitamins and some micronutrients, skewness is quite extreme. Most statistical procedures rely on the assumption of normality. The PC-SIDE procedure transforms adjusted dietary intake data into normality as part of obtaining estimates of usual intake distributions. The transformation into normality in PC-SIDE is done in two steps. In the first step, data are transformed so that their distribution is as close to normal as possible by using a power transformation. However, power transformed data are not necessarily normal. Thus, a second transformation that takes the power transformed intakes into the normal scale is
NZ Food NZ Children 209
employed. This second step in the transformation is nonparametric and is based on a grafted polynomial model. The power transformation plus the grafted polynomial function make up the semiparametric transformation into normality.
c. Estimation of within and between individual variances in intakes: PC-SIDE uses a measurement error model for observed daily intakes, similar to the model proposed by the National Research Council Subcommittee on Criteria for Dietary Evaluation (1986). The model states that the observed intake for an individual on any day is equal to that individual’s usual intake plus a measurement error. The variance of the usual intakes is the between individual variance. The variance of the measurement errors is the within individual variance, and reflects the day-to-day variation in intakes for an individual. Estimates for both the within (intra) and the between (inter) individual variances are obtained under the measurement error model under the assumption of normality. The variances are used to estimate the distribution of usual intakes in the normal scale.
d. Back-transformation into the original scale: The final step in the methodology is to transform the estimated usual intake distribution from the normal scale into the original scale. As the original transformation is nonlinear the transformation into normality by applying the inverse transformation is required. The inverse transformation makes an adjustment for the fact that the mean of a nonlinear function of a random variable is not the nonlinear function of the mean. The inverse transformation is based on an approximation to the mean function. This back transformation is called mean transformation since it brings the distribution of usual intakes (true individual means) back into the original scale. The programme estimates the statistics of interest from the estimated usual intake distribution. For example, estimates for the mean and the variance of the usual intake distribution for a nutrient, for a set of percentiles, or for the proportion of the population below (or above), a given threshold is available.
Adequacy of nutrient intake (probability analysis)
The adequacy of vitamin A, riboflavin, folate, vitamin B12, vitamin C, iron, calcium and zinc intakes were evaluated by probability analysis (National Research Council Subcommittee on Criteria for Dietary Evaluation 1986). Comparison with the mean requirement (shortcut probability approach) was used to evaluate the intake of these nutrients except iron intakes in menstruating females that were evaluated using full probability analysis (see below). Nutrient requirements formulated by the United Kingdom Panel on Dietary Reference Values (UK Department of Health 1991) were used in the analyses (Table V). Vitamin E, copper, manganese, selenium, phosphorus and potassium intakes could not be evaluated by probability analysis, as there were no suitable mean requirement estimates. Niacin, thiamin and vitamin B6 could not be evaluated by probability analysis, because the mean requirement estimates are based on a ratio, for example vitamin B6 is 13 µg/g protein. The current PC-SIDE programme does not allow for ratios to be adjusted for intra-individual variation. Probability analysis compares nutrient intakes with the corresponding requirement distribution and calculates the likelihood (probability) that a particular nutrient intake would fail to meet requirement. Lower nutrient intakes are associated with a higher
210 NZ Food NZ Children
probability of inadequacy as they are less likely to meet requirement, while higher nutrient intakes have a low probability of inadequacy. To perform full probability analysis it is necessary to know the distribution of requirements (symmetry, mean and standard deviation) or to be able to make a reasonable assumption about the distribution. It is reasonable to assume that the distribution of requirements for most nutrients is normal. The only nutrient for which there is evidence to the contrary is iron where requirements in menstruating females are positively skewed. Each nutrient intake is compared to the requirement distribution and the area under the requirement distribution to the right of the intake value is the probability that intake is inadequate to meet requirement. The probabilities are then averaged to obtain the percent of the population with inadequate intakes. The probability approach has been criticised because the variation in requirement (standard deviation) is not known for many nutrients. However, it has been demonstrated that when the requirement distribution is symmetrical (not necessarily normal) the probability approach is relatively insensitive to the variance of requirement (National Research Council 1986). Provided the intake distribution is wider than the requirement distribution, the mean requirement is known, and a symmetrical (not necessarily normal) distribution can be reasonably assumed; the percent of the population with intakes below the mean requirement will approximate the prevalence of inadequate intakes determined by full probability analysis (Beaton 1994). In other words, for those whose intake is below the mean requirement, the prevalence of inadequacy is over-estimated, and for those whose intake is above the mean requirement the prevalence is under-estimated, as the requirement distribution is symmetrical and the errors of over- and under-estimation tend to cancel each other out. The requirement estimates from the UK Dietary Reference Values (UK Department of Health 1991) were chosen as they had been formulated more recently than the Australian Recommended Nutrient Intakes. The recent US requirement estimates (USDRIs) are not suitable, as the age bands do not fit well with the CNS02 sample of 5–14 year children. As the UK diet is similar to the New Zealand diet in factors affecting requirement estimates (eg, intake of animal products), the UK nutrient requirements may be applied to the New Zealand population. The mean requirements and the criteria the requirements are intended to satisfy are presented in Table V. The probability of intake being inadequate was calculated using nutrient intakes first adjusted to remove the effects of day-to-day (intra-individual) variation. Details of this methodology are included in the previous section on PC-SIDE. This is important because on any given day a number of people will have unusually low or high intakes, which are not reflective of their ‘usual’ intake. Nutrient requirements, however, represent the required long-term average (usual) intakes, not amounts that must be consumed each day. Without adjusting for intra-individual variation the prevalence of inadequate intakes would be over- or under-estimated depending on where the intake distribution lies in relation to the requirement distribution. Evaluating nutrient intakes by probability analysis is preferable to making direct comparisons with recommended intakes as the variation in requirement between individuals is taken into account (National Research Council 1986). Directly comparing
NZ Food NZ Children 211
nutrient intakes with recommended intakes fails to recognise that the recommended intakes are devised to be sufficient to meet the needs of almost all healthy individuals. Consequently, an individual may still meet their own requirement although not consuming the recommended intake. When interpreting the prevalence of inadequate intakes it is important to note:
• The prevalence of inadequate intakes reflects the criterion on which requirement is based. For example, if the requirement for nutrient X is based on maintaining body stores (assuming normal losses) and it is estimated 15 percent of the population have inadequate intakes; this indicates 15 percent are not consuming enough nutrient X to maintain body stores but does not indicate functional impairment or a deficiency disorder. It also does not indicate which specific individuals in the population have inadequate intakes to maintain their body stores.
• Accurate assessment of whether dietary intakes are adequate requires a combination of biochemical, anthropometric and dietary measurements. The estimates of the prevalence of inadequate intakes serve to highlight areas which may be of concern. However, the body is highly adaptable and enhances the absorption and/or decreases the obligatory losses of many nutrients if dietary intake is inadequate. Conversely, it is possible that dietary intake appears adequate but due to a high content of absorption inhibitors in the diet and/or high nutrient losses (due to physiological or pathological factors), a deficiency results. In addition, errors in the nutrient intake data (from over or under-reporting and the translation of food into nutrient intakes) introduce error into the estimates of the prevalence of inadequate intakes. Therefore, biochemical and anthropometric measurements are required to accurately determine nutritional status as the net effect of dietary intake and the body’s response must be taken into account (Gibson 1990).
Food security Full food security is defined as ‘access by all people at all times to enough food for an active healthy life; food which is personally acceptable and safe’ (Hamilton et al 1997). Some people in developed countries experience food insecurity due to lack of money, despite a plentiful food supply. To document the food security status of New Zealand households ‘indicators’ were developed for the NNS97. After reviewing the food security indicators currently used in developed countries it was decided to identify the key issues surrounding access to food for New Zealanders by conducting focus groups among groups of New Zealanders on low incomes. The groups included Mäori and Pacific participants who were responsible for food buying and preparation in their households.
212 NZ Food NZ Children
From this information eight questions were developed to encompass the range of issues that might affect New Zealand households. These were pre-tested prior to the NNS97 and re-formatted into eight statements, each preceded by a verbal explanation. Participants were given ‘options’ to choose in response to these statements (for example, ‘often’, ‘sometimes’, ‘never’), which reflected the situation for themselves (if they were a single person household), or for their household. Further details of the methodology and the results for the New Zealand population from the NNS97 have been published (Parnell et al 2001a; Parnell et al 2001b). The same indicator statements used in the NNS97 were presented to adult members of the households of children in the CNS02. Data were not collected from households where the child was interviewed without an adult present. If more than one child from a household participated in the study, the responses were used from the interview that took place with the first child. The data collected thus include a sample of New Zealand households with children 5–14 years. The computer-based statements and responses are included in Appendix D.
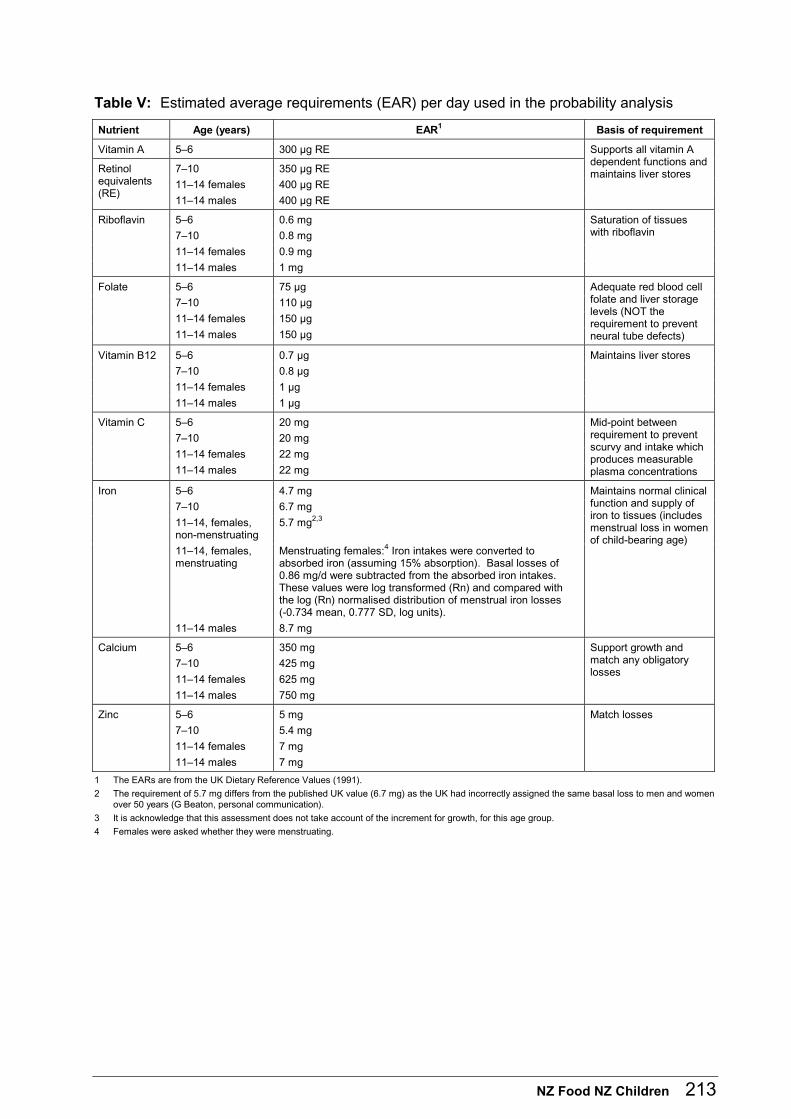
NZ Food NZ Children 213
Table V: Estimated average requirements (EAR) per day used in the probability analysis
Nutrient Age (years) EAR1 Basis of requirement
Vitamin A 5–6 300 µg RE
7–10 350 µg RE
11–14 females 400 µg RE
Retinol equivalents (RE)
11–14 males 400 µg RE
Supports all vitamin A dependent functions and maintains liver stores
5–6 0.6 mg
7–10 0.8 mg
11–14 females 0.9 mg
Riboflavin
11–14 males 1 mg
Saturation of tissues with riboflavin
5–6 75 µg
7–10 110 µg
11–14 females 150 µg
Folate
11–14 males 150 µg
Adequate red blood cell folate and liver storage levels (NOT the requirement to prevent neural tube defects)
5–6 0.7 µg
7–10 0.8 µg
11–14 females 1 µg
Vitamin B12
11–14 males 1 µg
Maintains liver stores
5–6 20 mg
7–10 20 mg
11–14 females 22 mg
Vitamin C
11–14 males 22 mg
Mid-point between requirement to prevent scurvy and intake which produces measurable plasma concentrations
5–6 4.7 mg
7–10 6.7 mg
11–14, females, non-menstruating
5.7 mg2,3
11–14, females, menstruating
Menstruating females:4 Iron intakes were converted to absorbed iron (assuming 15% absorption). Basal losses of 0.86 mg/d were subtracted from the absorbed iron intakes. These values were log transformed (Rn) and compared with the log (Rn) normalised distribution of menstrual iron losses (-0.734 mean, 0.777 SD, log units).
Iron
11–14 males 8.7 mg
Maintains normal clinical function and supply of iron to tissues (includes menstrual loss in women of child-bearing age)
5–6 350 mg
7–10 425 mg
11–14 females 625 mg
Calcium
11–14 males 750 mg
Support growth and match any obligatory losses
5–6 5 mg
7–10 5.4 mg
11–14 females 7 mg
Zinc
11–14 males 7 mg
Match losses
1 The EARs are from the UK Dietary Reference Values (1991).
2 The requirement of 5.7 mg differs from the published UK value (6.7 mg) as the UK had incorrectly assigned the same basal loss to men and women over 50 years (G Beaton, personal communication).
3 It is acknowledge that this assessment does not take account of the increment for growth, for this age group.
4 Females were asked whether they were menstruating.
214 NZ Food NZ Children
Physical activity The decision on the type of physical activity questions used in CNS02 included the following considerations.
1. Length of recall. Consensus is that previous-day recall physical activity instruments offer the most promise for use with children (Welk et al 2000), but the limitation of this format is that data must be obtained on multiple days in order to take into account the normal intra-individual variability in activity patterns. Longer recall periods for children, eg, four weeks, will tend to be associated with more errors of omission than with adults. A seven-day recall can be used to assess ‘typical’ level of physical activity and appeared to be the best compromise.
2. Memory cues. Children are most likely to provide accurate information with the use of memory cues (Baranowski 1988). Baranowski recommended using a segmented day approach (eg, before school, playtime, lunch etc) as well as separating weekday and weekend activities. Another memory cue he recommended was listing common physical activities to use as a checklist.
Following a review of the international literature the Physical Activity Questionnaire for Children (PAQ-C) was chosen. This questionnaire was developed by Crocker et al (1997) and uses a series of questions about general activity patterns to calculate an overall score. The activity list included in question one (see Appendix D) was modified to include the most popular activities identified during the CNS pilot study. In diverse samples of children the scale has consistently demonstrated acceptable internal consistency and validity (Kowalski et al 1997a; Kowalski et al 1997b). External validity has also been examined with moderate relationships (Crocker et al 1997). Limitations of this particular questionnaire include: no estimate of total energy expenditure; while an estimate of frequency of participation in particular activities is provided it does not estimate intensity or duration; the focus is on activities during the school year. These questions covered activity patterns during the most recent school week. The mean activity rating for each child was calculated in the following manner: Each activity in Physical Activity Question 5 was scored on a five-point scale, from 1 for ‘none’ to 5 for ‘7+’ times per week. The score for question 5 was the mean of these activities. The remaining seven physical activity questions were each scored on a five-point scale, with a value of 1 for the least active to 5 for the most active category. The overall mean activity rating was the average of the eight questions, with scores ranging from a minimum of one to a maximum of five. Inactivity questions were based on the pilot study and included questions on time spent watching television or videos and time spent playing computer or video games. These computer-based questions are included in Appendix D.
NZ Food NZ Children 215
Dental This section was based on questions pre-tested by researchers involved in the CNS pilot study (Watson et al 2000). A report covering the procedures and results of this pretesting was presented to the Ministry of Health (Thomson and Drummond 2001) and has been validated with clinical data (Jamieson et al, in press). These computer-based questions are included in Appendix D.
Eating patterns The questions in this section were based on those asked in the CNS Pilot Study (Watson et al 2000). The questions explore the type of diet a child has, eating patterns in a school day, and salt use. These computer-based questions are included in Appendix D.
Food frequency questionnaire Prior to the CNS02, there was no food frequency questionnaire (FFQ) suitable for New Zealand children. A qualitative food frequency questionnaire was developed in the pilot survey. The pilot survey involved collecting diet records from 428 children (224 females, 204 males; 137 Mäori, 143 Pacific and 148 NZEO) aged 1–14 years across the North Island (Watson et al 2000). All 24-hour diet records were converted to nutrient intakes using the New Zealand Food Composition Database (New Zealand Institute for Crop & Food Research Ltd 2000). A list of foods that provided more than 95 percent of nutrient intake was developed for energy and other important nutrients (eg, fat, saturated fat, protein, iron and calcium) for each ethnic, age and gender subgroup surveyed in the pilot study. Identification of foods was facilitated by the use of colour photographs. The FFQ was designed for children and/or their parents/ caregivers, but interviewers assisted in its completion when necessary. The FFQ has similar or better repeatability in New Zealand children compared to child or adolescent FFQs from other countries (Metcalf et al, in press). With the change in age of recruitment from 1–14 years in the pilot survey, to school-based recruitment of children aged 5–14 years in the CNS02 minor changes to the wording of some of the food items were made and questions on infant milks were excluded. In addition, some adjustments of descriptions of foods and beverages were made so that they were more consistent with the 24-hour diet recall categories and dietary supplements were excluded as they were part of the 24-hour diet recall methodology.
216 NZ Food NZ Children
Unlike the 24-hour diet recall method which is designed to collect the quantities of foods and beverages consumed, the FFQ used in this study describes how often foods or beverages are consumed in the previous four weeks. Some of the ‘food categories’ used in the FFQ (ie, ways in which foods were grouped together) differ from the ways in which foods were grouped in order to describe ‘dietary sources’ of nutrients from the 24-hour recall data. It is not intended that direct comparisons of data collected by these two different instruments should be made. However, in most instances a consistent picture of food and beverage intake is provided by these two methods. The FFQ is included in Appendix E.
Anthropometry Anthropometric measurements were taken during the second interview at school: height, weight, mid-upper arm circumference, waist circumference, triceps and subscapular skinfold measurements. For all anthropometric measurements the children wore light clothing and no shoes and the data were entered directly into the computer.
• Weight. This was measured to the nearest 0.1 kg. Scales were calibrated with a standard weight each day. Two measurements were taken and if these differed by more than 0.5 kg a third measurement was taken. The weight measurement for each child was the mean of the two closest measurements.
• Height. Measurements were made with a portable stadiometer. Two measurements were made to the nearest 0.1 cm. If these differed by more than 0.5 cm a third measurement was taken. The height measurement for each child was the mean of the two closest measurements.
• Circumferences. Waist circumference was measured at the highest point of the iliac crest and made at minimal respiration. The mid-upper arm circumference was taken at the midpoint in the length of the horizontal line between the acromion process and the tip of the olecranon. Two measurements were made to the nearest 0.1 cm at each site. If these differed by more than 0.5 cm a third measurement was taken. The measurement for each site was the mean of the two closest measurements.
• Skinfolds. Subcutaneous skinfolds were measured with Holtain skinfold callipers at two sites: triceps and subscapular. The triceps site was the midpoint in the length of the horizontal line between the acromion process and the tip of the olecranon. The subscapular site was on the inferior angle of the scapula. Two measurements were made to the nearest 0.1 mm at each site. If these differed by more than 0.5 mm a third measurement was taken. The measurement for each site was the mean of the two closest measurements.
NZ Food NZ Children 217
Blood Blood samples were collected at school by trained phlebotomists. After application of topical anaesthetic spray, venous blood was withdrawn from the antecubital fossa into a standard 4.5 ml EDTA vacutainer and a 7 ml trace element free vacutainer for plasma and serum samples, respectively. Samples were couriered overnight to Southern Community Laboratories (SCL), Dunedin, where samples were centrifuged and aliquoted within 24 hours of collection. SCL carried out all analyses except for serum zinc and free-erythrocyte protoporphyrin, which were or will be carried out by research staff in the research laboratories of the Departments of Human Nutrition and Biochemistry, University of Otago.
Iron status
The following methods were used to determine iron status:
• A complete blood cell count (CBC) was carried out, within 24 hours of collection, to provide values for haemoglobin and red cell distribution width. The CBC was analysed using an automated Coulter STKS (until July 2002) and a Sysmex XE 2100 cell counter (after July 2002). In house laboratory comparisons showed that the haemoglobin, red cell distribution width (RDW), and other red cell parameters measured, were highly correlated between the machines.
• Serum ferritin was measured using an immunoturbidometric (Roche Diagnostics) method on a Hitachi 917.
• Iron transferrin saturation was derived from serum iron and unsaturated iron binding capacity. Serum iron was analysed using the Ferrozine method without deproteinisation. The TIBC was measured using a modification of the Goodwin method (Goodwin et al, Clin Chem., 1966) on the Hitachi 917 (Roche Diagnostics).
• C-reactive protein was measured using an immunoturbidometric (Roche Diagnostics) method on a Hitachi #917 automated analyser.
Definition of iron deficiency There are three main iron ‘pools’ in the body: ‘storage’ iron, measured by serum ferritin; ‘transport’ iron, measured by serum transferrin saturation; and ‘red cell’ iron measured, in NHANES III, by free-erythrocyte protoporphyrin, and in the CNS by red cell distribution width. The basis for the use of multiple tests to define iron deficiency was that NHANES II found that populations with only one abnormal test of iron status had a prevalence of anaemia similar to those with normal values for all three tests. The prevalence of anaemia was significantly elevated only in those with two or three abnormal measures of iron status (Cook et al 1976).
218 NZ Food NZ Children
Alternative measures of red cell iron include free-erythrocyte protoporphyrin, red cell distribution width and mean cell volume. Due to the high prevalence of the alpha-thalassaemia trait in Polynesian New Zealanders which results in a decreased mean cell volume, mean cell volume is an inappropriate measure of iron status for the CNS. The selection of red cell distribution width as the alternative measure was supported by the observation in NHANES III that it was a promising test for detecting iron deficiency in women and young children (Dallman et al 1996). Age and gender specific cut-offs, described in previous US surveys, including NHANES III, were used to determine abnormal values for haemoglobin, ferritin, transferrin saturation and red cell distribution width (Looker et al 1997; Recommendations to prevent and control iron deficiency 1998). Iron deficiency was defined by the presence of an abnormal value for two of the following three measures of iron status: ferritin, transferrin saturation, and red cell distribution width. This definition is based on that used in NHANES II and NHANES III.
Total cholesterol and HDL-cholesterol
Blood lipids were measured using an enzymatic method for total cholesterol (Roche Diagnostics, on an Hitachi 917), and PEG modified enzymes (cholesterol esterase and cholesterol oxidase) linked to a peroxidase colorimetric reaction (Roche Diagnostics) for high density lipoprotein (HDL) cholesterol.
Zinc
Serum zinc was analysed via atomic absorption spectrophotometric procedures (Perkin Elmer AA800) in the trace element laboratory of the Department of Human Nutrition, University of Otago.
Definition of zinc deficiency
The following age and gender cut-off values, as defined by Hotz et al (2003) were used to determine the proportion of children with low serum zinc concentrations: for samples collected in the morning – <9.94 µmol/L for 3–9-year-old boys, <9.85 µmol/L for 3–9-year-old girls, <10.70 µmol/L for 10–14-year-old boys, and <10.09 µmol/L for 10–14-year-old girls. For serum samples collected in the afternoon they were <8.56 µmol/L for 3–9-year-old boys, <8.72 µmol/L for 3–9-year-old girls, <9.33 µmol/L for 10–14-year-old boys and <9.02 µmol/L for 10–14-year-old girls.
Feedback of blood results to participants
Each parent/caregiver of a child who provided a blood sample received a letter with the results of the haemoglobin concentration (test for anaemia) and other measures of iron status within two weeks of collection. This letter explained the results of their blood tests, in relation to cut-offs for abnormality used in US studies, including NHANES III (described above). For children with iron deficiency and/or anaemia their parents were advised to take their child to see a general practitioner.
NZ Food NZ Children 219
Urine The urine samples were collected by the phlebotomist and/or interviewers during the second interview at school. The samples were couriered to SCL in Dunedin in chilly bins with the blood samples, where they were aliquoted into storage tubes and frozen at –20oC. Associate Professor Christine Thomson, Department of Human Nutrition, University of Otago, was responsible for the measurement of urinary iodine and used a modification of the Sandell-Kolthoff reaction (1937) as discussed by Bourdoux (1988).
Iodine status
The International Council for Control of Iodine Deficiency Disorders (2001) suggest that not more than 20 percent of children should have a urinary iodine level of less than 5 µg/dL.
Explanatory notes for tables 1. All data have been weighted1 to compensate for sampling bias in a three-step
process:
i. Determination of each participant’s probability of selection into the survey sample.
ii. Adjustment to the response rate to correct for differences occurring between regions, gender, age and ethnic groups.
iii. Post-stratification by age, sex and ethnic group to the New Zealand population as at the 2001 Census. In addition, NZDep01 quintile data were post-stratified by age, sex and ethnic groups to the NZDep01 quintile as provided by Statistics New Zealand based on the 2001 Census. Further adjustment was needed because ethnicity and the index are not independent.
2. Cell sizes are included in Table VI for the different sections of the survey. For the nutrient data analysis an adequate number of repeat 24-hour diet recalls is needed to estimate the within individual variation. For subgroups where the number of repeats was less than 30 caution should be exercised in the interpretation of the results.
1 Weighting is based on participation in the 24-hour diet recall. Although individuals did not necessarily participate in all sections
of the survey, only one set of weights were used for all sections apart from Blood and Urine and Food Security. As only children from urban areas were sampled for blood and urine a separate weight was required. A separate household weight was required for the food security data. The weight for each household was calculated as the sum of the weights of the children within the household.
220 NZ Food NZ Children
3. Sampling error: The CNS02 used a complex sampling design, which involved clustering. It is therefore not appropriate to calculate the standard errors using formulas that assume simple random sampling. To assist readers a guide to the level of sampling error present in population proportions has been prepared (Table VII). These sampling errors have been calculated as:
(1 )1.96 deff p psampling errorn
× −=
where deff is the ratio of the variance calculated from the actual survey estimate, to the variance on the estimate had it been calculated assuming a simple random sample of the same size. Since deff varies for health characteristics and sub populations (age, sex, ethnic groups) within characteristics an average deff value calculated over several subpopulations over a wide selection of variables was used in the sampling error equation.
4. Age of the child was determined on the day of the interview. Nineteen children (11 males, eight females) had their 15th birthday between the date of registration and the date of the interview. The data from these children have been included in the 11–14 age group.
5. Derivation of ethnic group: Where only one ethnic group was given, that category was coded. In cases where the child stated that they belonged to more than one ethnic group, a single ethnic category was assigned to that child using a system of priority recording of ethnicity. The following hierarchical rules were applied:
i. If Mäori was one of the groups reported, the participant was assigned to Mäori.
ii. If any of the Pacific groups was one of the groups reported, the participant was assigned to Pacific.
iii. All remaining participants were assigned to New Zealand European and Others.
6. NZDep01: This is an index based on the individual’s residential address. The scale has been divided into quintiles, from quintile I to quintile V, where quintile I represents the least ‘deprived’ areas and quintile V the most. Nine percent of children were unable to be allocated a quintile rating because of insufficient information about their home address. Therefore, their data could not be included.
7. Urban/rural: The school type of an individual was classified as being Urban if the school was located in either a main urban or secondary urban area. All other schools located in either rural or minor urban areas were classified as Rural.
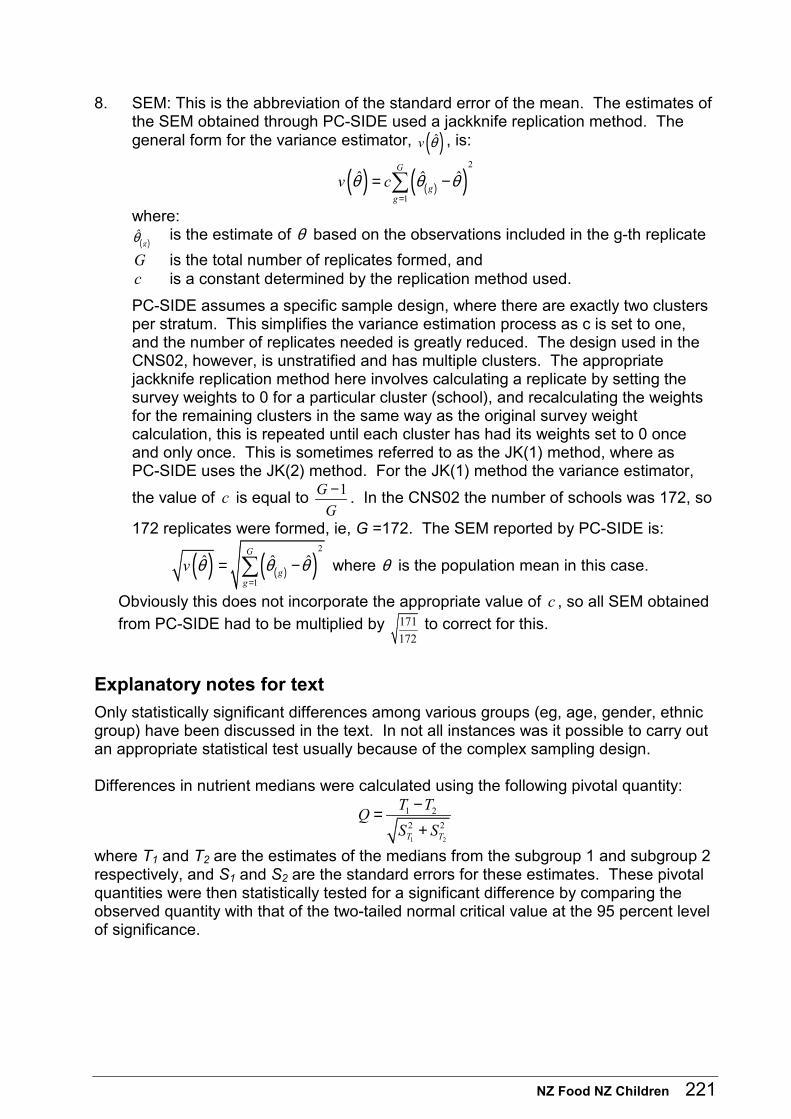
NZ Food NZ Children 221
8. SEM: This is the abbreviation of the standard error of the mean. The estimates of the SEM obtained through PC-SIDE used a jackknife replication method. The general form for the variance estimator, ( )ˆv θ , is:
( ) ( )( )2
1
ˆ ˆ ˆG
gg
v cθ θ θ=
= −�
where:
( )ˆgθ is the estimate of θ based on the observations included in the g-th replicate
G is the total number of replicates formed, and c is a constant determined by the replication method used.
PC-SIDE assumes a specific sample design, where there are exactly two clusters per stratum. This simplifies the variance estimation process as c is set to one, and the number of replicates needed is greatly reduced. The design used in the CNS02, however, is unstratified and has multiple clusters. The appropriate jackknife replication method here involves calculating a replicate by setting the survey weights to 0 for a particular cluster (school), and recalculating the weights for the remaining clusters in the same way as the original survey weight calculation, this is repeated until each cluster has had its weights set to 0 once and only once. This is sometimes referred to as the JK(1) method, where as PC-SIDE uses the JK(2) method. For the JK(1) method the variance estimator,
the value of c is equal to 1GG− . In the CNS02 the number of schools was 172, so
172 replicates were formed, ie, G =172. The SEM reported by PC-SIDE is:
( ) ( )( )2
1
ˆ ˆ ˆG
gg
v θ θ θ=
= −� where θ is the population mean in this case.
Obviously this does not incorporate the appropriate value of c , so all SEM obtained
from PC-SIDE had to be multiplied by 171172
to correct for this.
Explanatory notes for text
Only statistically significant differences among various groups (eg, age, gender, ethnic group) have been discussed in the text. In not all instances was it possible to carry out an appropriate statistical test usually because of the complex sampling design. Differences in nutrient medians were calculated using the following pivotal quantity:
1 2
1 22 2T T
T TQS S
−=+
where T1 and T2 are the estimates of the medians from the subgroup 1 and subgroup 2 respectively, and S1 and S2 are the standard errors for these estimates. These pivotal quantities were then statistically tested for a significant difference by comparing the observed quantity with that of the two-tailed normal critical value at the 95 percent level of significance.
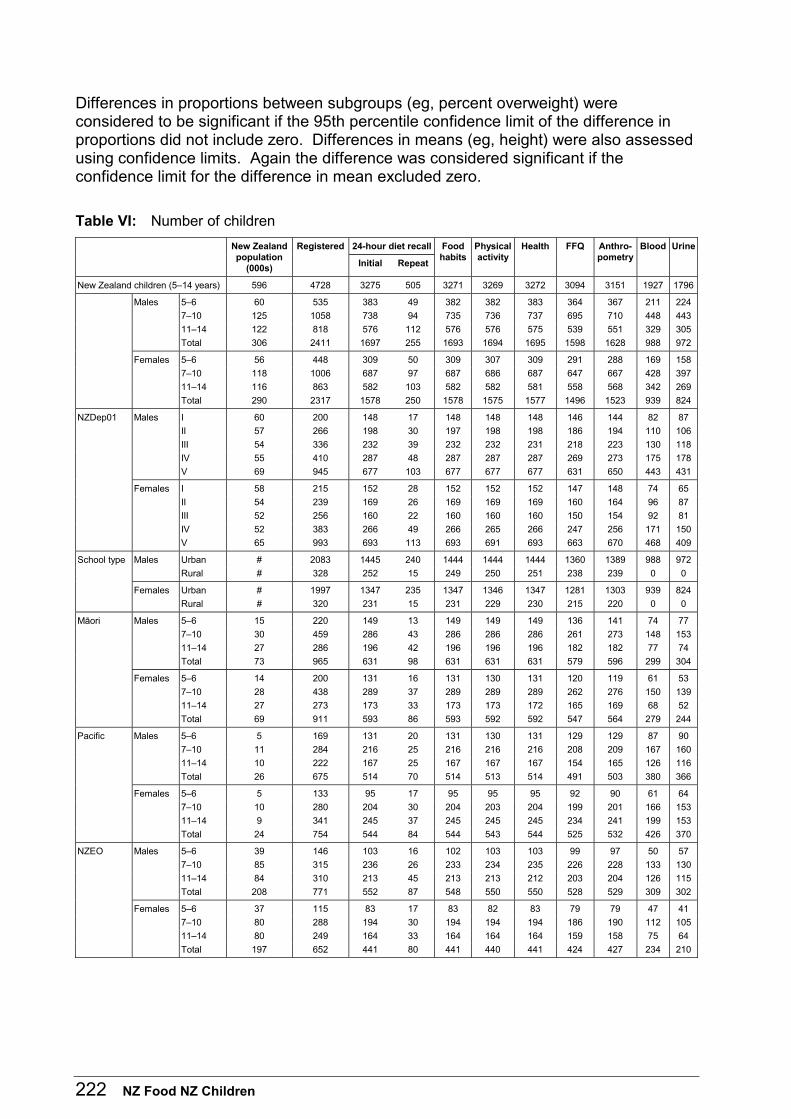
222 NZ Food NZ Children
Differences in proportions between subgroups (eg, percent overweight) were considered to be significant if the 95th percentile confidence limit of the difference in proportions did not include zero. Differences in means (eg, height) were also assessed using confidence limits. Again the difference was considered significant if the confidence limit for the difference in mean excluded zero.
Table VI: Number of children
24-hour diet recall New Zealand population
(000s)
Registered
Initial Repeat
Food habits
Physical activity
Health FFQ Anthro-pometry
Blood Urine
New Zealand children (5–14 years) 596 4728 3275 505 3271 3269 3272 3094 3151 1927 1796
Males 5–6 60 535 383 49 382 382 383 364 367 211 224
7–10 125 1058 738 94 735 736 737 695 710 448 443
11–14 122 818 576 112 576 576 575 539 551 329 305
Total 306 2411 1697 255 1693 1694 1695 1598 1628 988 972
Females 5–6 56 448 309 50 309 307 309 291 288 169 158
7–10 118 1006 687 97 687 686 687 647 667 428 397
11–14 116 863 582 103 582 582 581 558 568 342 269
Total 290 2317 1578 250 1578 1575 1577 1496 1523 939 824
NZDep01 Males I 60 200 148 17 148 148 148 146 144 82 87
II 57 266 198 30 197 198 198 186 194 110 106
III 54 336 232 39 232 232 231 218 223 130 118
IV 55 410 287 48 287 287 287 269 273 175 178
V 69 945 677 103 677 677 677 631 650 443 431
Females I 58 215 152 28 152 152 152 147 148 74 65
II 54 239 169 26 169 169 169 160 164 96 87
III 52 256 160 22 160 160 160 150 154 92 81
IV 52 383 266 49 266 265 266 247 256 171 150
V 65 993 693 113 693 691 693 663 670 468 409
School type Males Urban # 2083 1445 240 1444 1444 1444 1360 1389 988 972
Rural # 328 252 15 249 250 251 238 239 0 0
Females Urban # 1997 1347 235 1347 1346 1347 1281 1303 939 824
Rural # 320 231 15 231 229 230 215 220 0 0
Mäori Males 5–6 15 220 149 13 149 149 149 136 141 74 77
7–10 30 459 286 43 286 286 286 261 273 148 153
11–14 27 286 196 42 196 196 196 182 182 77 74
Total 73 965 631 98 631 631 631 579 596 299 304
Females 5–6 14 200 131 16 131 130 131 120 119 61 53
7–10 28 438 289 37 289 289 289 262 276 150 139
11–14 27 273 173 33 173 173 172 165 169 68 52
Total 69 911 593 86 593 592 592 547 564 279 244
Pacific Males 5–6 5 169 131 20 131 130 131 129 129 87 90
7–10 11 284 216 25 216 216 216 208 209 167 160
11–14 10 222 167 25 167 167 167 154 165 126 116
Total 26 675 514 70 514 513 514 491 503 380 366
Females 5–6 5 133 95 17 95 95 95 92 90 61 64
7–10 10 280 204 30 204 203 204 199 201 166 153
11–14 9 341 245 37 245 245 245 234 241 199 153
Total 24 754 544 84 544 543 544 525 532 426 370
NZEO Males 5–6 39 146 103 16 102 103 103 99 97 50 57
7–10 85 315 236 26 233 234 235 226 228 133 130
11–14 84 310 213 45 213 213 212 203 204 126 115
Total 208 771 552 87 548 550 550 528 529 309 302
Females 5–6 37 115 83 17 83 82 83 79 79 47 41
7–10 80 288 194 30 194 194 194 186 190 112 105
11–14 80 249 164 33 164 164 164 159 158 75 64
Total 197 652 441 80 441 440 441 424 427 234 210
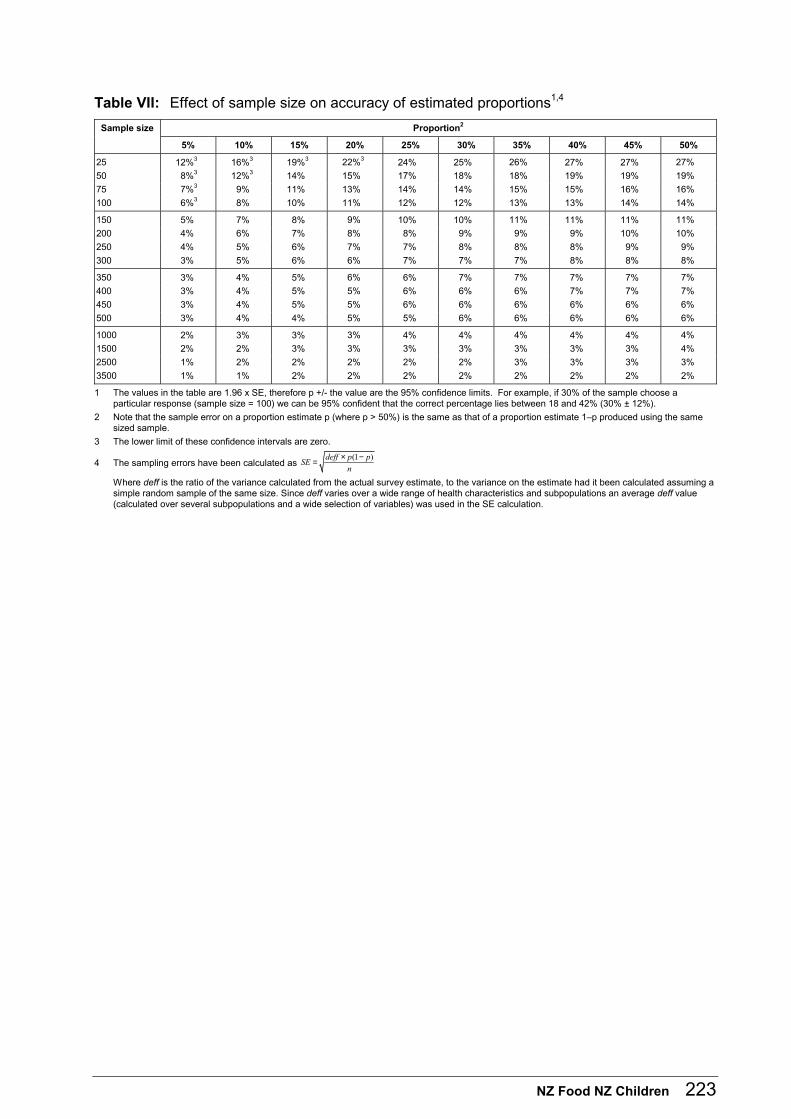
NZ Food NZ Children 223
Table VII: Effect of sample size on accuracy of estimated proportions1,4
Proportion2 Sample size
5% 10% 15% 20% 25% 30% 35% 40% 45% 50%
25 12%3 16%3 19%3 22%3 24% 25% 26% 27% 27% 27% 50 8%3 12%3 14% 15% 17% 18% 18% 19% 19% 19% 75 7%3 9% 11% 13% 14% 14% 15% 15% 16% 16% 100 6%3 8% 10% 11% 12% 12% 13% 13% 14% 14%
150 5% 7% 8% 9% 10% 10% 11% 11% 11% 11% 200 4% 6% 7% 8% 8% 9% 9% 9% 10% 10% 250 4% 5% 6% 7% 7% 8% 8% 8% 9% 9% 300 3% 5% 6% 6% 7% 7% 7% 8% 8% 8%
350 3% 4% 5% 6% 6% 7% 7% 7% 7% 7% 400 3% 4% 5% 5% 6% 6% 6% 7% 7% 7% 450 3% 4% 5% 5% 6% 6% 6% 6% 6% 6% 500 3% 4% 4% 5% 5% 6% 6% 6% 6% 6%
1000 2% 3% 3% 3% 4% 4% 4% 4% 4% 4% 1500 2% 2% 3% 3% 3% 3% 3% 3% 3% 4% 2500 1% 2% 2% 2% 2% 2% 3% 3% 3% 3% 3500 1% 1% 2% 2% 2% 2% 2% 2% 2% 2%
1 The values in the table are 1.96 x SE, therefore p +/- the value are the 95% confidence limits. For example, if 30% of the sample choose a particular response (sample size = 100) we can be 95% confident that the correct percentage lies between 18 and 42% (30% ± 12%).
2 Note that the sample error on a proportion estimate p (where p > 50%) is the same as that of a proportion estimate 1–p produced using the same sized sample.
3 The lower limit of these confidence intervals are zero.
4 The sampling errors have been calculated as (1 )deff p pSEn
× −=
Where deff is the ratio of the variance calculated from the actual survey estimate, to the variance on the estimate had it been calculated assuming a simple random sample of the same size. Since deff varies over a wide range of health characteristics and subpopulations an average deff value (calculated over several subpopulations and a wide selection of variables) was used in the SE calculation.
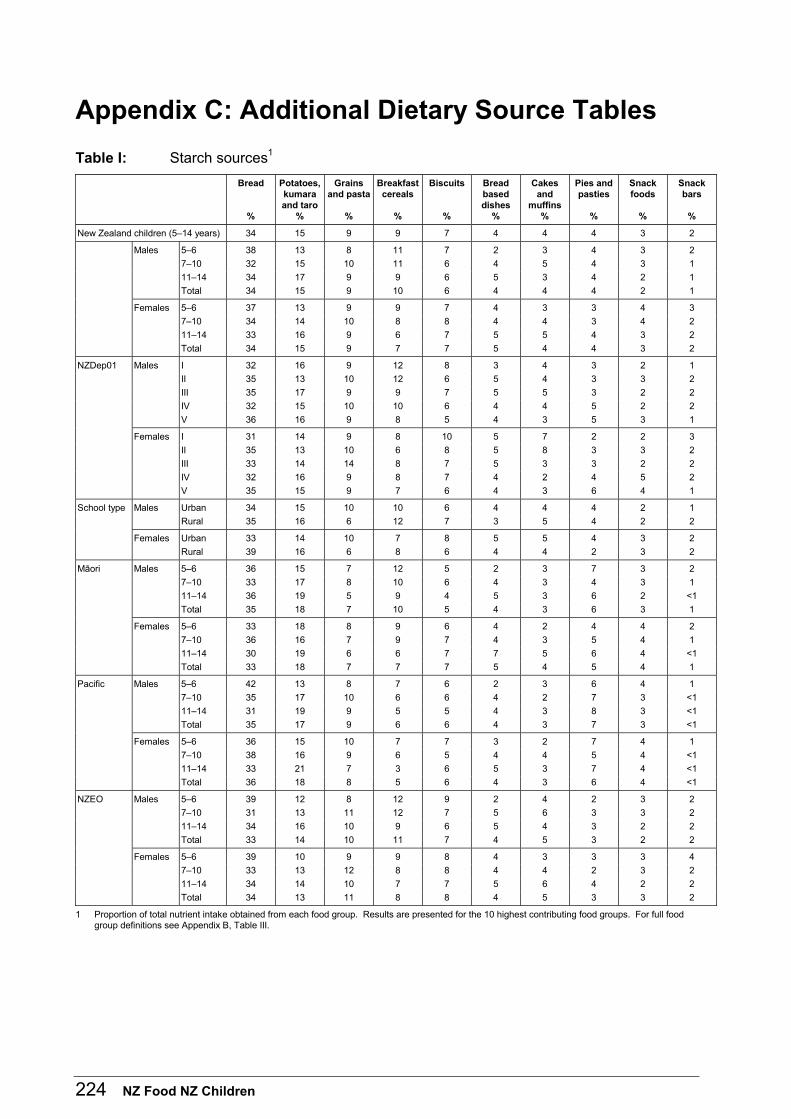
224 NZ Food NZ Children
Appendix C: Additional Dietary Source Tables
Table I: Starch sources1
Bread
%
Potatoes, kumara and taro
%
Grains and pasta
%
Breakfast cereals
%
Biscuits
%
Bread based dishes
%
Cakes and
muffins %
Pies and pasties
%
Snack foods
%
Snack bars
%
New Zealand children (5–14 years) 34 15 9 9 7 4 4 4 3 2
Males 5–6 38 13 8 11 7 2 3 4 3 2
7–10 32 15 10 11 6 4 5 4 3 1
11–14 34 17 9 9 6 5 3 4 2 1
Total 34 15 9 10 6 4 4 4 2 1
Females 5–6 37 13 9 9 7 4 3 3 4 3
7–10 34 14 10 8 8 4 4 3 4 2
11–14 33 16 9 6 7 5 5 4 3 2
Total 34 15 9 7 7 5 4 4 3 2
NZDep01 Males I 32 16 9 12 8 3 4 3 2 1
II 35 13 10 12 6 5 4 3 3 2
III 35 17 9 9 7 5 5 3 2 2
IV 32 15 10 10 6 4 4 5 2 2
V 36 16 9 8 5 4 3 5 3 1
Females I 31 14 9 8 10 5 7 2 2 3
II 35 13 10 6 8 5 8 3 3 2
III 33 14 14 8 7 5 3 3 2 2
IV 32 16 9 8 7 4 2 4 5 2
V 35 15 9 7 6 4 3 6 4 1
School type Males Urban 34 15 10 10 6 4 4 4 2 1
Rural 35 16 6 12 7 3 5 4 2 2
Females Urban 33 14 10 7 8 5 5 4 3 2
Rural 39 16 6 8 6 4 4 2 3 2
Mäori Males 5–6 36 15 7 12 5 2 3 7 3 2
7–10 33 17 8 10 6 4 3 4 3 1
11–14 36 19 5 9 4 5 3 6 2 <1
Total 35 18 7 10 5 4 3 6 3 1
Females 5–6 33 18 8 9 6 4 2 4 4 2
7–10 36 16 7 9 7 4 3 5 4 1
11–14 30 19 6 6 7 7 5 6 4 <1
Total 33 18 7 7 7 5 4 5 4 1
Pacific Males 5–6 42 13 8 7 6 2 3 6 4 1
7–10 35 17 10 6 6 4 2 7 3 <1
11–14 31 19 9 5 5 4 3 8 3 <1
Total 35 17 9 6 6 4 3 7 3 <1
Females 5–6 36 15 10 7 7 3 2 7 4 1
7–10 38 16 9 6 5 4 4 5 4 <1
11–14 33 21 7 3 6 5 3 7 4 <1
Total 36 18 8 5 6 4 3 6 4 <1
NZEO Males 5–6 39 12 8 12 9 2 4 2 3 2
7–10 31 13 11 12 7 5 6 3 3 2
11–14 34 16 10 9 6 5 4 3 2 2
Total 33 14 10 11 7 4 5 3 2 2
Females 5–6 39 10 9 9 8 4 3 3 3 4
7–10 33 13 12 8 8 4 4 2 3 2
11–14 34 14 10 7 7 5 6 4 2 2
Total 34 13 11 8 8 4 5 3 3 2
1 Proportion of total nutrient intake obtained from each food group. Results are presented for the 10 highest contributing food groups. For full food group definitions see Appendix B, Table III.
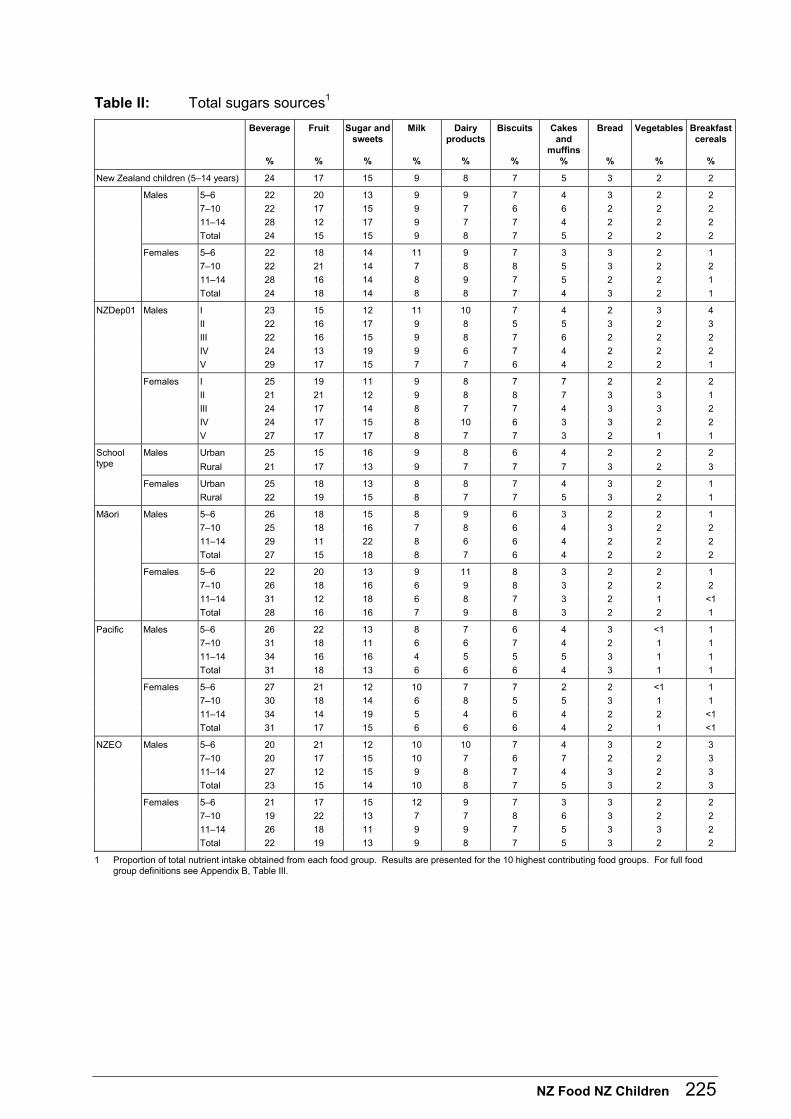
NZ Food NZ Children 225
Table II: Total sugars sources1
Beverage
%
Fruit
%
Sugar and sweets
%
Milk
%
Dairy products
%
Biscuits
%
Cakes and
muffins %
Bread
%
Vegetables
%
Breakfast cereals
%
New Zealand children (5–14 years) 24 17 15 9 8 7 5 3 2 2
Males 5–6 22 20 13 9 9 7 4 3 2 2
7–10 22 17 15 9 7 6 6 2 2 2
11–14 28 12 17 9 7 7 4 2 2 2
Total 24 15 15 9 8 7 5 2 2 2
Females 5–6 22 18 14 11 9 7 3 3 2 1
7–10 22 21 14 7 8 8 5 3 2 2
11–14 28 16 14 8 9 7 5 2 2 1
Total 24 18 14 8 8 7 4 3 2 1
NZDep01 Males I 23 15 12 11 10 7 4 2 3 4
II 22 16 17 9 8 5 5 3 2 3
III 22 16 15 9 8 7 6 2 2 2
IV 24 13 19 9 6 7 4 2 2 2
V 29 17 15 7 7 6 4 2 2 1
Females I 25 19 11 9 8 7 7 2 2 2
II 21 21 12 9 8 8 7 3 3 1
III 24 17 14 8 7 7 4 3 3 2
IV 24 17 15 8 10 6 3 3 2 2
V 27 17 17 8 7 7 3 2 1 1
Males Urban 25 15 16 9 8 6 4 2 2 2 School type Rural 21 17 13 9 7 7 7 3 2 3
Females Urban 25 18 13 8 8 7 4 3 2 1
Rural 22 19 15 8 7 7 5 3 2 1
Mäori Males 5–6 26 18 15 8 9 6 3 2 2 1
7–10 25 18 16 7 8 6 4 3 2 2
11–14 29 11 22 8 6 6 4 2 2 2
Total 27 15 18 8 7 6 4 2 2 2
Females 5–6 22 20 13 9 11 8 3 2 2 1
7–10 26 18 16 6 9 8 3 2 2 2
11–14 31 12 18 6 8 7 3 2 1 <1
Total 28 16 16 7 9 8 3 2 2 1
Pacific Males 5–6 26 22 13 8 7 6 4 3 <1 1
7–10 31 18 11 6 6 7 4 2 1 1
11–14 34 16 16 4 5 5 5 3 1 1
Total 31 18 13 6 6 6 4 3 1 1
Females 5–6 27 21 12 10 7 7 2 2 <1 1
7–10 30 18 14 6 8 5 5 3 1 1
11–14 34 14 19 5 4 6 4 2 2 <1
Total 31 17 15 6 6 6 4 2 1 <1
NZEO Males 5–6 20 21 12 10 10 7 4 3 2 3
7–10 20 17 15 10 7 6 7 2 2 3
11–14 27 12 15 9 8 7 4 3 2 3
Total 23 15 14 10 8 7 5 3 2 3
Females 5–6 21 17 15 12 9 7 3 3 2 2
7–10 19 22 13 7 7 8 6 3 2 2
11–14 26 18 11 9 9 7 5 3 3 2
Total 22 19 13 9 8 7 5 3 2 2
1 Proportion of total nutrient intake obtained from each food group. Results are presented for the 10 highest contributing food groups. For full food group definitions see Appendix B, Table III.
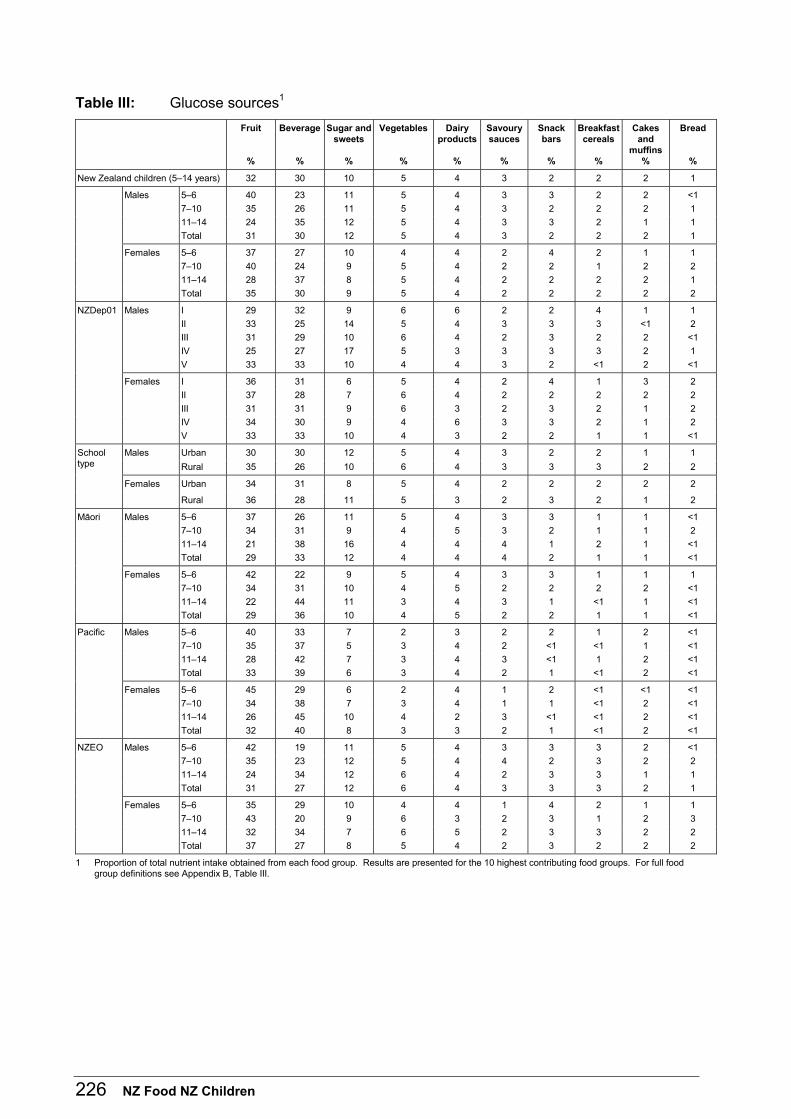
226 NZ Food NZ Children
Table III: Glucose sources1
Fruit
%
Beverage
%
Sugar and sweets
%
Vegetables
%
Dairy products
%
Savoury sauces
%
Snack bars
%
Breakfast cereals
%
Cakes and
muffins%
Bread
%
New Zealand children (5–14 years) 32 30 10 5 4 3 2 2 2 1
Males 5–6 40 23 11 5 4 3 3 2 2 <1
7–10 35 26 11 5 4 3 2 2 2 1
11–14 24 35 12 5 4 3 3 2 1 1
Total 31 30 12 5 4 3 2 2 2 1
Females 5–6 37 27 10 4 4 2 4 2 1 1
7–10 40 24 9 5 4 2 2 1 2 2
11–14 28 37 8 5 4 2 2 2 2 1
Total 35 30 9 5 4 2 2 2 2 2
NZDep01 Males I 29 32 9 6 6 2 2 4 1 1
II 33 25 14 5 4 3 3 3 <1 2
III 31 29 10 6 4 2 3 2 2 <1
IV 25 27 17 5 3 3 3 3 2 1
V 33 33 10 4 4 3 2 <1 2 <1
Females I 36 31 6 5 4 2 4 1 3 2
II 37 28 7 6 4 2 2 2 2 2
III 31 31 9 6 3 2 3 2 1 2
IV 34 30 9 4 6 3 3 2 1 2
V 33 33 10 4 3 2 2 1 1 <1
Males Urban 30 30 12 5 4 3 2 2 1 1 School type Rural 35 26 10 6 4 3 3 3 2 2
Females Urban 34 31 8 5 4 2 2 2 2 2
Rural 36 28 11 5 3 2 3 2 1 2
Mäori Males 5–6 37 26 11 5 4 3 3 1 1 <1
7–10 34 31 9 4 5 3 2 1 1 2
11–14 21 38 16 4 4 4 1 2 1 <1
Total 29 33 12 4 4 4 2 1 1 <1
Females 5–6 42 22 9 5 4 3 3 1 1 1
7–10 34 31 10 4 5 2 2 2 2 <1
11–14 22 44 11 3 4 3 1 <1 1 <1
Total 29 36 10 4 5 2 2 1 1 <1
Pacific Males 5–6 40 33 7 2 3 2 2 1 2 <1
7–10 35 37 5 3 4 2 <1 <1 1 <1
11–14 28 42 7 3 4 3 <1 1 2 <1
Total 33 39 6 3 4 2 1 <1 2 <1
Females 5–6 45 29 6 2 4 1 2 <1 <1 <1
7–10 34 38 7 3 4 1 1 <1 2 <1
11–14 26 45 10 4 2 3 <1 <1 2 <1
Total 32 40 8 3 3 2 1 <1 2 <1
NZEO Males 5–6 42 19 11 5 4 3 3 3 2 <1
7–10 35 23 12 5 4 4 2 3 2 2
11–14 24 34 12 6 4 2 3 3 1 1
Total 31 27 12 6 4 3 3 3 2 1
Females 5–6 35 29 10 4 4 1 4 2 1 1
7–10 43 20 9 6 3 2 3 1 2 3
11–14 32 34 7 6 5 2 3 3 2 2
Total 37 27 8 5 4 2 3 2 2 2
1 Proportion of total nutrient intake obtained from each food group. Results are presented for the 10 highest contributing food groups. For full food group definitions see Appendix B, Table III.
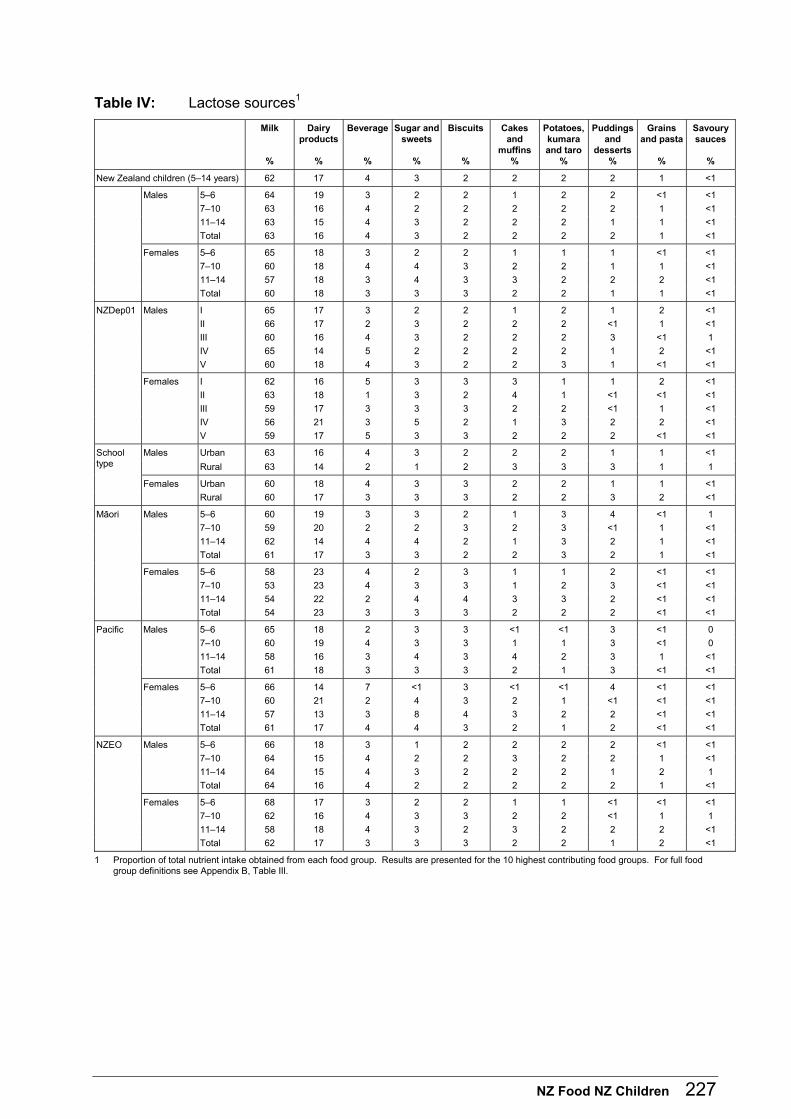
NZ Food NZ Children 227
Table IV: Lactose sources1
Milk
%
Dairy products
%
Beverage
%
Sugar and sweets
%
Biscuits
%
Cakes and
muffins%
Potatoes, kumara and taro
%
Puddings and
desserts %
Grains and pasta
%
Savoury sauces
%
New Zealand children (5–14 years) 62 17 4 3 2 2 2 2 1 <1
Males 5–6 64 19 3 2 2 1 2 2 <1 <1
7–10 63 16 4 2 2 2 2 2 1 <1
11–14 63 15 4 3 2 2 2 1 1 <1
Total 63 16 4 3 2 2 2 2 1 <1
Females 5–6 65 18 3 2 2 1 1 1 <1 <1
7–10 60 18 4 4 3 2 2 1 1 <1
11–14 57 18 3 4 3 3 2 2 2 <1
Total 60 18 3 3 3 2 2 1 1 <1
NZDep01 Males I 65 17 3 2 2 1 2 1 2 <1
II 66 17 2 3 2 2 2 <1 1 <1
III 60 16 4 3 2 2 2 3 <1 1
IV 65 14 5 2 2 2 2 1 2 <1
V 60 18 4 3 2 2 3 1 <1 <1
Females I 62 16 5 3 3 3 1 1 2 <1
II 63 18 1 3 2 4 1 <1 <1 <1
III 59 17 3 3 3 2 2 <1 1 <1
IV 56 21 3 5 2 1 3 2 2 <1
V 59 17 5 3 3 2 2 2 <1 <1
Males Urban 63 16 4 3 2 2 2 1 1 <1 School type Rural 63 14 2 1 2 3 3 3 1 1
Females Urban 60 18 4 3 3 2 2 1 1 <1
Rural 60 17 3 3 3 2 2 3 2 <1
Mäori Males 5–6 60 19 3 3 2 1 3 4 <1 1
7–10 59 20 2 2 3 2 3 <1 1 <1
11–14 62 14 4 4 2 1 3 2 1 <1
Total 61 17 3 3 2 2 3 2 1 <1
Females 5–6 58 23 4 2 3 1 1 2 <1 <1
7–10 53 23 4 3 3 1 2 3 <1 <1
11–14 54 22 2 4 4 3 3 2 <1 <1
Total 54 23 3 3 3 2 2 2 <1 <1
Pacific Males 5–6 65 18 2 3 3 <1 <1 3 <1 0
7–10 60 19 4 3 3 1 1 3 <1 0
11–14 58 16 3 4 3 4 2 3 1 <1
Total 61 18 3 3 3 2 1 3 <1 <1
Females 5–6 66 14 7 <1 3 <1 <1 4 <1 <1
7–10 60 21 2 4 3 2 1 <1 <1 <1
11–14 57 13 3 8 4 3 2 2 <1 <1
Total 61 17 4 4 3 2 1 2 <1 <1
NZEO Males 5–6 66 18 3 1 2 2 2 2 <1 <1
7–10 64 15 4 2 2 3 2 2 1 <1
11–14 64 15 4 3 2 2 2 1 2 1
Total 64 16 4 2 2 2 2 2 1 <1
Females 5–6 68 17 3 2 2 1 1 <1 <1 <1
7–10 62 16 4 3 3 2 2 <1 1 1
11–14 58 18 4 3 2 3 2 2 2 <1
Total 62 17 3 3 3 2 2 1 2 <1
1 Proportion of total nutrient intake obtained from each food group. Results are presented for the 10 highest contributing food groups. For full food group definitions see Appendix B, Table III.
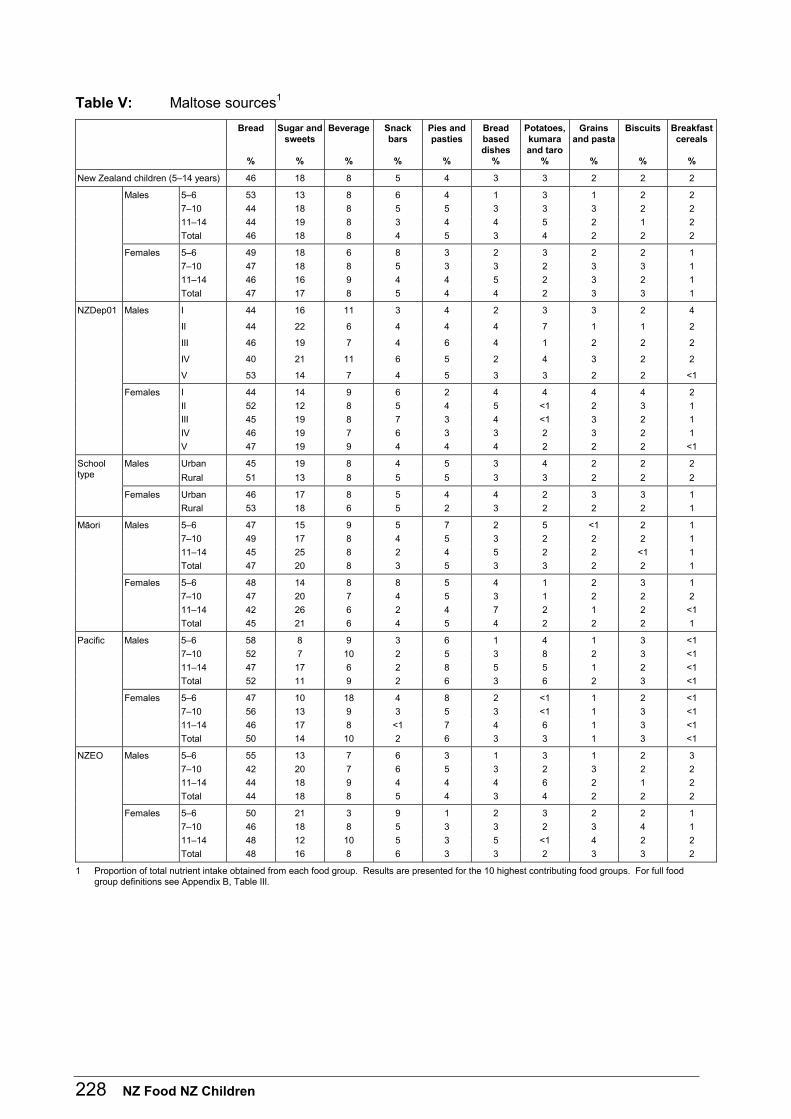
228 NZ Food NZ Children
Table V: Maltose sources1
Bread
%
Sugar and sweets
%
Beverage
%
Snack bars
%
Pies and pasties
%
Bread based dishes
%
Potatoes, kumara and taro
%
Grains and pasta
%
Biscuits
%
Breakfast cereals
%
New Zealand children (5–14 years) 46 18 8 5 4 3 3 2 2 2
Males 5–6 53 13 8 6 4 1 3 1 2 2
7–10 44 18 8 5 5 3 3 3 2 2
11–14 44 19 8 3 4 4 5 2 1 2
Total 46 18 8 4 5 3 4 2 2 2
Females 5–6 49 18 6 8 3 2 3 2 2 1
7–10 47 18 8 5 3 3 2 3 3 1
11–14 46 16 9 4 4 5 2 3 2 1
Total 47 17 8 5 4 4 2 3 3 1
NZDep01 Males I 44 16 11 3 4 2 3 3 2 4
II 44 22 6 4 4 4 7 1 1 2
III 46 19 7 4 6 4 1 2 2 2
IV 40 21 11 6 5 2 4 3 2 2
V 53 14 7 4 5 3 3 2 2 <1
Females I 44 14 9 6 2 4 4 4 4 2
II 52 12 8 5 4 5 <1 2 3 1
III 45 19 8 7 3 4 <1 3 2 1
IV 46 19 7 6 3 3 2 3 2 1
V 47 19 9 4 4 4 2 2 2 <1
Males Urban 45 19 8 4 5 3 4 2 2 2 School type Rural 51 13 8 5 5 3 3 2 2 2
Females Urban 46 17 8 5 4 4 2 3 3 1
Rural 53 18 6 5 2 3 2 2 2 1
Mäori Males 5–6 47 15 9 5 7 2 5 <1 2 1
7–10 49 17 8 4 5 3 2 2 2 1
11–14 45 25 8 2 4 5 2 2 <1 1
Total 47 20 8 3 5 3 3 2 2 1
Females 5–6 48 14 8 8 5 4 1 2 3 1
7–10 47 20 7 4 5 3 1 2 2 2
11–14 42 26 6 2 4 7 2 1 2 <1
Total 45 21 6 4 5 4 2 2 2 1
Pacific Males 5–6 58 8 9 3 6 1 4 1 3 <1
7–10 52 7 10 2 5 3 8 2 3 <1
11–14 47 17 6 2 8 5 5 1 2 <1
Total 52 11 9 2 6 3 6 2 3 <1
Females 5–6 47 10 18 4 8 2 <1 1 2 <1
7–10 56 13 9 3 5 3 <1 1 3 <1
11–14 46 17 8 <1 7 4 6 1 3 <1
Total 50 14 10 2 6 3 3 1 3 <1
NZEO Males 5–6 55 13 7 6 3 1 3 1 2 3
7–10 42 20 7 6 5 3 2 3 2 2
11–14 44 18 9 4 4 4 6 2 1 2
Total 44 18 8 5 4 3 4 2 2 2
Females 5–6 50 21 3 9 1 2 3 2 2 1
7–10 46 18 8 5 3 3 2 3 4 1
11–14 48 12 10 5 3 5 <1 4 2 2
Total 48 16 8 6 3 3 2 3 3 2
1 Proportion of total nutrient intake obtained from each food group. Results are presented for the 10 highest contributing food groups. For full food group definitions see Appendix B, Table III.
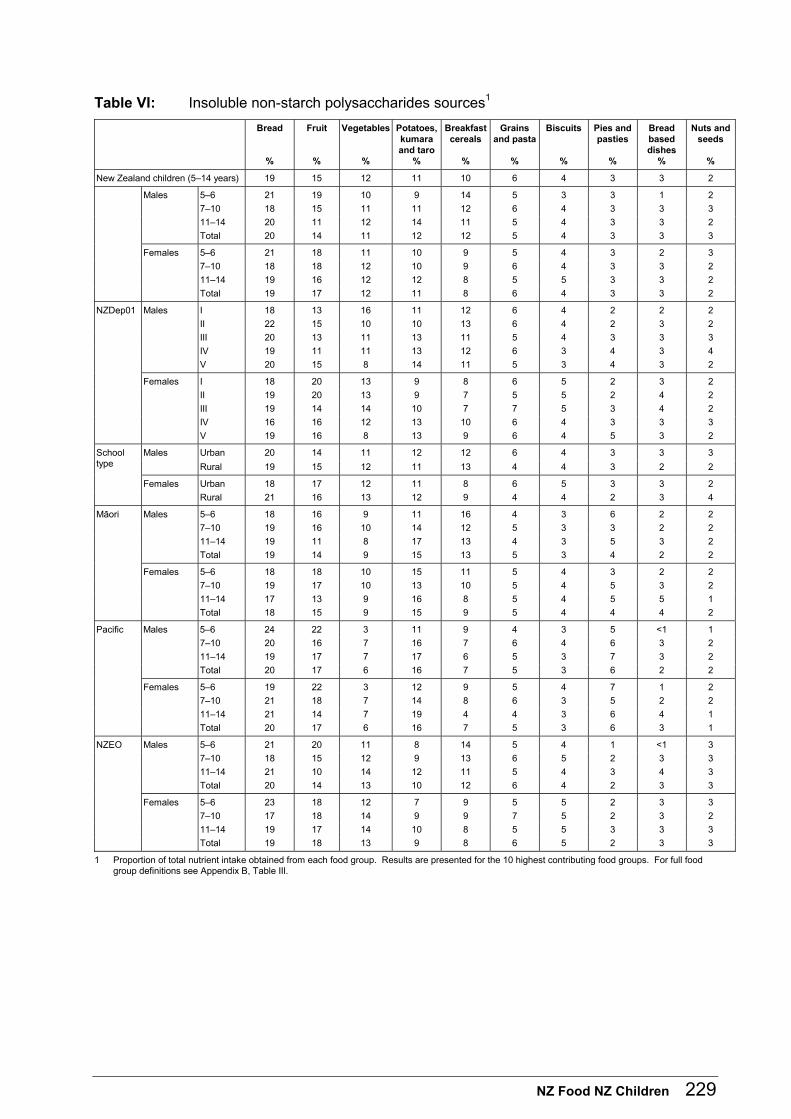
NZ Food NZ Children 229
Table VI: Insoluble non-starch polysaccharides sources1
Bread
%
Fruit
%
Vegetables
%
Potatoes, kumara and taro
%
Breakfast cereals
%
Grains and pasta
%
Biscuits
%
Pies and pasties
%
Bread based dishes
%
Nuts and seeds
%
New Zealand children (5–14 years) 19 15 12 11 10 6 4 3 3 2
Males 5–6 21 19 10 9 14 5 3 3 1 2
7–10 18 15 11 11 12 6 4 3 3 3
11–14 20 11 12 14 11 5 4 3 3 2
Total 20 14 11 12 12 5 4 3 3 3
Females 5–6 21 18 11 10 9 5 4 3 2 3
7–10 18 18 12 10 9 6 4 3 3 2
11–14 19 16 12 12 8 5 5 3 3 2
Total 19 17 12 11 8 6 4 3 3 2
NZDep01 Males I 18 13 16 11 12 6 4 2 2 2
II 22 15 10 10 13 6 4 2 3 2
III 20 13 11 13 11 5 4 3 3 3
IV 19 11 11 13 12 6 3 4 3 4
V 20 15 8 14 11 5 3 4 3 2
Females I 18 20 13 9 8 6 5 2 3 2
II 19 20 13 9 7 5 5 2 4 2
III 19 14 14 10 7 7 5 3 4 2
IV 16 16 12 13 10 6 4 3 3 3
V 19 16 8 13 9 6 4 5 3 2
Males Urban 20 14 11 12 12 6 4 3 3 3 School type Rural 19 15 12 11 13 4 4 3 2 2
Females Urban 18 17 12 11 8 6 5 3 3 2
Rural 21 16 13 12 9 4 4 2 3 4
Mäori Males 5–6 18 16 9 11 16 4 3 6 2 2
7–10 19 16 10 14 12 5 3 3 2 2
11–14 19 11 8 17 13 4 3 5 3 2
Total 19 14 9 15 13 5 3 4 2 2
Females 5–6 18 18 10 15 11 5 4 3 2 2
7–10 19 17 10 13 10 5 4 5 3 2
11–14 17 13 9 16 8 5 4 5 5 1
Total 18 15 9 15 9 5 4 4 4 2
Pacific Males 5–6 24 22 3 11 9 4 3 5 <1 1
7–10 20 16 7 16 7 6 4 6 3 2
11–14 19 17 7 17 6 5 3 7 3 2
Total 20 17 6 16 7 5 3 6 2 2
Females 5–6 19 22 3 12 9 5 4 7 1 2
7–10 21 18 7 14 8 6 3 5 2 2
11–14 21 14 7 19 4 4 3 6 4 1
Total 20 17 6 16 7 5 3 6 3 1
NZEO Males 5–6 21 20 11 8 14 5 4 1 <1 3
7–10 18 15 12 9 13 6 5 2 3 3
11–14 21 10 14 12 11 5 4 3 4 3
Total 20 14 13 10 12 6 4 2 3 3
Females 5–6 23 18 12 7 9 5 5 2 3 3
7–10 17 18 14 9 9 7 5 2 3 2
11–14 19 17 14 10 8 5 5 3 3 3
Total 19 18 13 9 8 6 5 2 3 3
1 Proportion of total nutrient intake obtained from each food group. Results are presented for the 10 highest contributing food groups. For full food group definitions see Appendix B, Table III.
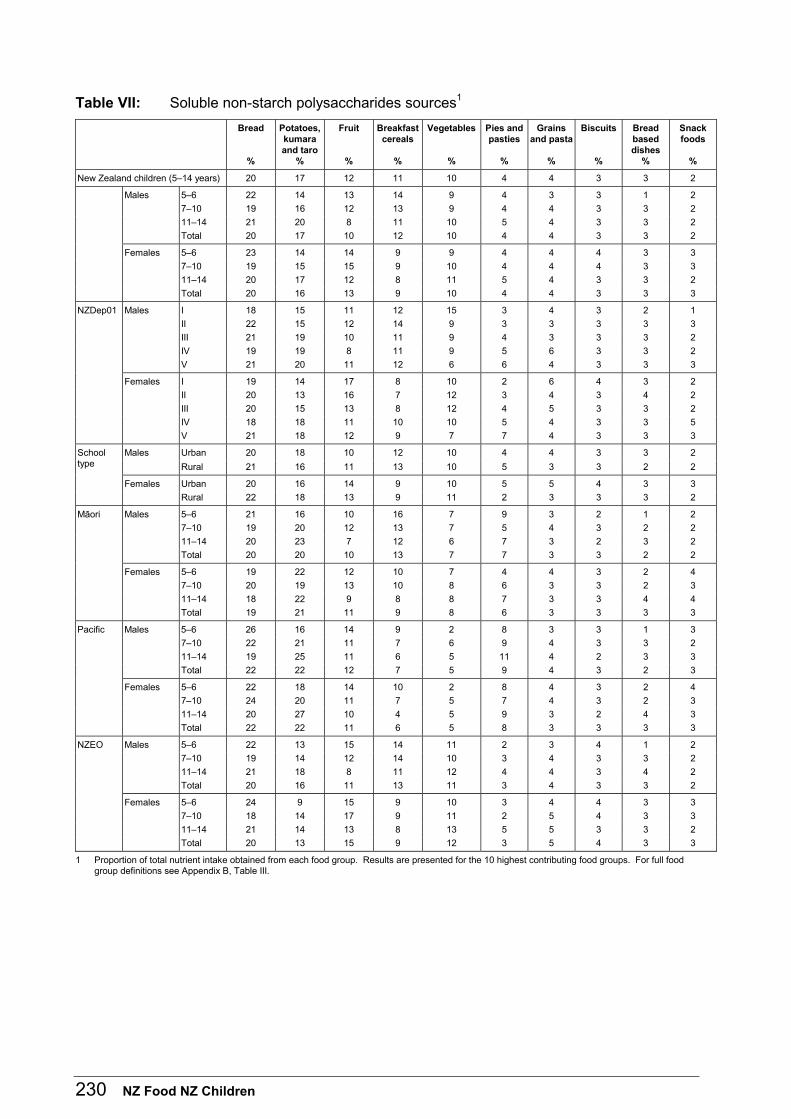
230 NZ Food NZ Children
Table VII: Soluble non-starch polysaccharides sources1
Bread
%
Potatoes, kumara and taro
%
Fruit
%
Breakfast cereals
%
Vegetables
%
Pies and pasties
%
Grains and pasta
%
Biscuits
%
Bread based dishes
%
Snack foods
%
New Zealand children (5–14 years) 20 17 12 11 10 4 4 3 3 2
Males 5–6 22 14 13 14 9 4 3 3 1 2
7–10 19 16 12 13 9 4 4 3 3 2
11–14 21 20 8 11 10 5 4 3 3 2
Total 20 17 10 12 10 4 4 3 3 2
Females 5–6 23 14 14 9 9 4 4 4 3 3
7–10 19 15 15 9 10 4 4 4 3 3
11–14 20 17 12 8 11 5 4 3 3 2
Total 20 16 13 9 10 4 4 3 3 3
NZDep01 Males I 18 15 11 12 15 3 4 3 2 1
II 22 15 12 14 9 3 3 3 3 3
III 21 19 10 11 9 4 3 3 3 2
IV 19 19 8 11 9 5 6 3 3 2
V 21 20 11 12 6 6 4 3 3 3
Females I 19 14 17 8 10 2 6 4 3 2
II 20 13 16 7 12 3 4 3 4 2
III 20 15 13 8 12 4 5 3 3 2
IV 18 18 11 10 10 5 4 3 3 5
V 21 18 12 9 7 7 4 3 3 3
Males Urban 20 18 10 12 10 4 4 3 3 2 School type Rural 21 16 11 13 10 5 3 3 2 2
Females Urban 20 16 14 9 10 5 5 4 3 3
Rural 22 18 13 9 11 2 3 3 3 2
Mäori Males 5–6 21 16 10 16 7 9 3 2 1 2
7–10 19 20 12 13 7 5 4 3 2 2
11–14 20 23 7 12 6 7 3 2 3 2
Total 20 20 10 13 7 7 3 3 2 2
Females 5–6 19 22 12 10 7 4 4 3 2 4
7–10 20 19 13 10 8 6 3 3 2 3
11–14 18 22 9 8 8 7 3 3 4 4
Total 19 21 11 9 8 6 3 3 3 3
Pacific Males 5–6 26 16 14 9 2 8 3 3 1 3
7–10 22 21 11 7 6 9 4 3 3 2
11–14 19 25 11 6 5 11 4 2 3 3
Total 22 22 12 7 5 9 4 3 2 3
Females 5–6 22 18 14 10 2 8 4 3 2 4
7–10 24 20 11 7 5 7 4 3 2 3
11–14 20 27 10 4 5 9 3 2 4 3
Total 22 22 11 6 5 8 3 3 3 3
NZEO Males 5–6 22 13 15 14 11 2 3 4 1 2
7–10 19 14 12 14 10 3 4 3 3 2
11–14 21 18 8 11 12 4 4 3 4 2
Total 20 16 11 13 11 3 4 3 3 2
Females 5–6 24 9 15 9 10 3 4 4 3 3
7–10 18 14 17 9 11 2 5 4 3 3
11–14 21 14 13 8 13 5 5 3 3 2
Total 20 13 15 9 12 3 5 4 3 3
1 Proportion of total nutrient intake obtained from each food group. Results are presented for the 10 highest contributing food groups. For full food group definitions see Appendix B, Table III.

NZ Food NZ Children 231
Table VIII: Vitamin A sources1
Vegetables
%
Milk
%
Butter and
margarine%
Dairy products
%
Fruit
%
Bread based dishes
%
Beverage
%
Eggs and egg
dishes %
Grains and pasta
%
Cheese
%
New Zealand children (5–14 years) 31 12 7 6 4 3 3 3 3 3
Males 5–6 31 15 7 6 5 1 3 4 2 2
7–10 33 14 6 5 4 3 3 3 3 2
11–14 30 11 7 6 3 4 3 3 3 3
Total 31 13 7 6 4 3 3 3 3 3
Females 5–6 29 17 7 6 4 3 4 3 2 2
7–10 32 12 6 5 5 3 3 3 3 3
11–14 31 10 6 6 3 4 3 3 4 4
Total 31 12 6 6 4 3 3 3 3 3
NZDep01 Males I 41 12 4 6 3 2 3 2 3 3
II 29 14 6 6 5 4 3 3 2 5
III 32 12 6 5 3 4 3 3 2 3
IV 25 15 8 5 3 4 4 3 5 2
V 27 11 10 6 4 3 3 5 2 2
Females I 40 12 3 5 4 3 3 2 2 3
II 30 11 6 5 5 5 3 3 3 4
III 36 9 5 4 4 3 3 3 4 3
IV 28 12 5 7 4 3 3 4 6 4
V 23 13 10 5 4 3 4 4 3 3
Males Urban 29 13 7 6 4 4 3 4 3 3 School type Rural 39 13 8 4 4 2 2 2 2 3
Females Urban 30 12 6 6 4 3 3 3 3 3
Rural 34 11 7 4 4 3 4 2 4 3
Mäori Males 5–6 28 14 9 7 4 1 3 6 2 1
7–10 27 13 9 7 5 3 2 6 3 2
11–14 23 13 12 6 3 4 3 4 3 2
Total 25 13 10 6 4 3 3 5 3 2
Females 5–6 30 15 8 8 5 3 3 5 2 2
7–10 27 11 8 7 5 3 3 4 3 2
11–14 27 10 8 7 3 5 3 2 2 4
Total 28 11 8 7 4 4 3 4 2 3
Pacific Males 5–6 11 18 12 7 6 2 5 7 1 2
7–10 16 12 11 6 6 3 4 8 2 2
11–14 21 8 11 4 5 5 2 8 3 2
Total 17 12 11 5 5 4 3 8 2 2
Females 5–6 9 20 14 6 4 2 8 10 2 <1
7–10 15 13 12 8 5 3 6 8 2 2
11–14 18 9 9 4 6 6 4 6 2 1
Total 15 12 11 6 5 4 5 7 2 2
NZEO Males 5–6 34 15 6 6 5 1 3 2 2 3
7–10 36 15 5 4 4 3 3 2 3 3
11–14 33 11 6 6 3 4 3 2 3 4
Total 34 13 6 5 4 3 3 2 3 3
Females 5–6 31 18 6 5 4 3 4 2 2 3
7–10 36 12 5 4 5 3 3 2 4 4
11–14 33 10 5 6 3 3 4 2 5 4
Total 34 12 5 5 4 3 3 2 4 4
1 Proportion of total nutrient intake obtained from each food group. Results are presented for the 10 highest contributing food groups. For full food group definitions see Appendix B, Table III.

232 NZ Food NZ Children
Table IX: Thiamin sources1
Breakfast cereals
%
Bread
%
Dietary supplements
%
Potatoes, kumara and taro
%
Savoury sauces
%
Milk
%
Beverage
%
Vegetables
%
Grains and
pasta%
Fruit
%
New Zealand children (5–14 years) 28 16 12 5 5 4 3 3 3 3
Males 5–6 34 16 9 4 5 4 3 2 2 2
7–10 35 15 6 5 4 4 3 3 3 3
11–14 29 18 10 6 4 4 4 3 2 2
Total 32 16 8 6 4 4 3 3 3 2
Females 5–6 28 18 6 5 6 6 3 3 3 3
7–10 26 18 5 6 6 4 3 3 4 4
11–14 17 14 28 5 4 3 3 3 2 2
Total 22 16 16 5 5 4 3 3 3 3
NZDep01 Males I 27 12 22 5 5 5 3 3 2 2
II 36 18 7 5 5 4 2 3 2 2
III 30 17 10 6 4 4 3 3 2 2
IV 33 16 3 6 5 5 5 3 3 2
V 34 19 3 6 3 3 3 2 3 3
Females I 22 15 13 5 6 5 4 3 4 4
II 25 19 3 6 4 5 4 4 2 4
III 21 18 10 6 5 4 4 4 4 4
IV 27 16 5 6 5 5 3 3 4 3
V 17 13 35 4 4 3 3 1 3 2
Males Urban 32 16 10 5 4 4 4 3 3 2 School type Rural 34 18 2 6 5 5 3 4 2 3
Females Urban 22 15 18 5 4 4 3 3 3 3
Rural 24 18 10 6 9 4 3 3 2 3
Mäori Males 5–6 44 16 <1 5 4 4 3 2 2 2
7–10 37 16 <1 6 3 4 3 2 3 3
11–14 33 16 10 7 3 4 4 1 2 2
Total 37 16 5 6 3 4 3 2 3 2
Females 5–6 33 17 <1 7 3 6 3 2 4 3
7–10 28 19 <1 7 6 4 3 3 4 3
11–14 22 17 5 8 7 4 3 2 3 3
Total 26 18 2 7 6 4 3 2 3 3
Pacific Males 5–6 28 26 0 6 3 5 5 <1 2 3
7–10 26 22 0 8 2 3 5 1 5 3
11–14 21 23 0 10 2 3 3 2 2 4
Total 25 23 0 8 2 3 4 2 3 4
Females 5–6 32 19 0 6 2 6 9 <1 3 3
7–10 26 25 <1 7 1 4 4 2 3 3
11–14 16 26 <1 11 2 3 4 2 3 3
Total 24 24 <1 8 2 4 5 2 3 3
NZEO Males 5–6 31 15 13 4 6 5 3 3 2 3
7–10 35 14 9 5 5 5 3 3 3 3
11–14 28 18 11 6 4 4 4 3 2 2
Total 31 16 11 5 5 4 3 3 3 2
Females 5–6 26 18 9 4 7 7 3 3 3 3
7–10 25 17 7 5 6 4 3 4 4 5
11–14 16 12 36 4 4 3 3 3 2 2
Total 21 15 22 5 5 4 3 3 3 3
1 Proportion of total nutrient intake obtained from each food group; Results are presented for the 10 highest contributing food groups. For full food group definitions see Appendix B, Table III.
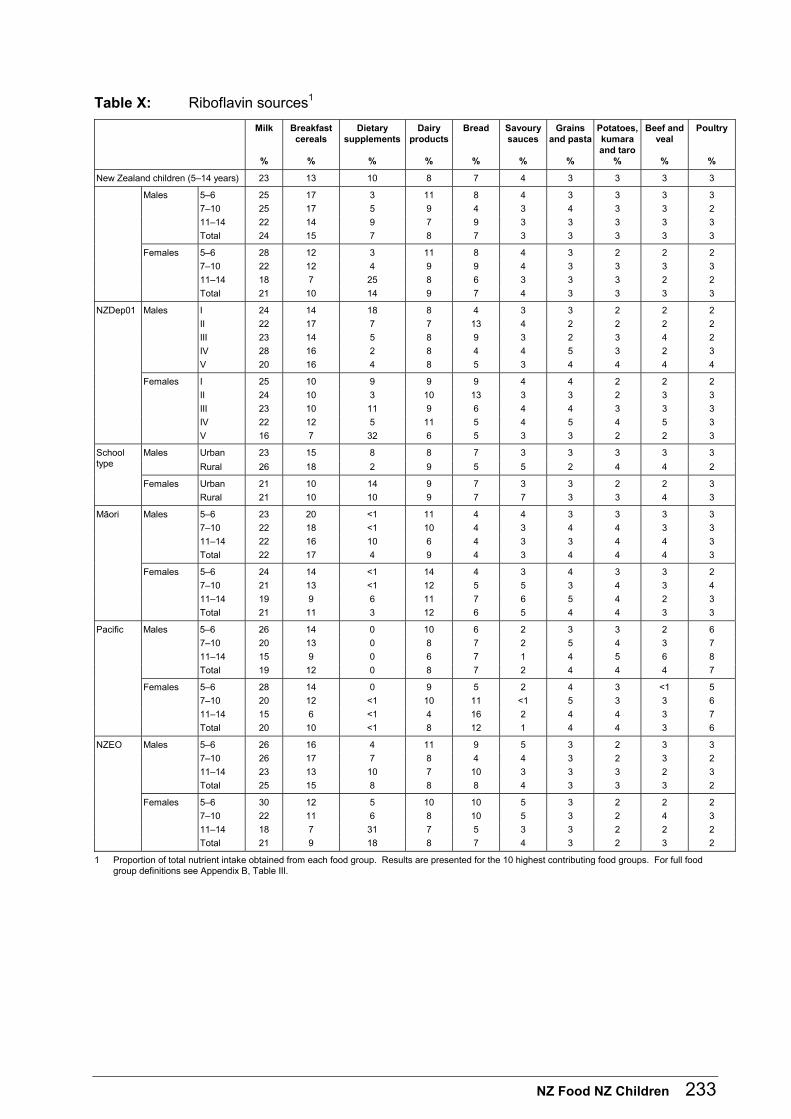
NZ Food NZ Children 233
Table X: Riboflavin sources1
Milk
%
Breakfast cereals
%
Dietary supplements
%
Dairy products
%
Bread
%
Savoury sauces
%
Grains and pasta
%
Potatoes, kumara and taro
%
Beef and veal
%
Poultry
%
New Zealand children (5–14 years) 23 13 10 8 7 4 3 3 3 3
Males 5–6 25 17 3 11 8 4 3 3 3 3
7–10 25 17 5 9 4 3 4 3 3 2
11–14 22 14 9 7 9 3 3 3 3 3
Total 24 15 7 8 7 3 3 3 3 3
Females 5–6 28 12 3 11 8 4 3 2 2 2
7–10 22 12 4 9 9 4 3 3 3 3
11–14 18 7 25 8 6 3 3 3 2 2
Total 21 10 14 9 7 4 3 3 3 3
NZDep01 Males I 24 14 18 8 4 3 3 2 2 2
II 22 17 7 7 13 4 2 2 2 2
III 23 14 5 8 9 3 2 3 4 2
IV 28 16 2 8 4 4 5 3 2 3
V 20 16 4 8 5 3 4 4 4 4
Females I 25 10 9 9 9 4 4 2 2 2
II 24 10 3 10 13 3 3 2 3 3
III 23 10 11 9 6 4 4 3 3 3
IV 22 12 5 11 5 4 5 4 5 3
V 16 7 32 6 5 3 3 2 2 3
Males Urban 23 15 8 8 7 3 3 3 3 3 School type Rural 26 18 2 9 5 5 2 4 4 2
Females Urban 21 10 14 9 7 3 3 2 2 3
Rural 21 10 10 9 7 7 3 3 4 3
Mäori Males 5–6 23 20 <1 11 4 4 3 3 3 3
7–10 22 18 <1 10 4 3 4 4 3 3
11–14 22 16 10 6 4 3 3 4 4 3
Total 22 17 4 9 4 3 4 4 4 3
Females 5–6 24 14 <1 14 4 3 4 3 3 2
7–10 21 13 <1 12 5 5 3 4 3 4
11–14 19 9 6 11 7 6 5 4 2 3
Total 21 11 3 12 6 5 4 4 3 3
Pacific Males 5–6 26 14 0 10 6 2 3 3 2 6
7–10 20 13 0 8 7 2 5 4 3 7
11–14 15 9 0 6 7 1 4 5 6 8
Total 19 12 0 8 7 2 4 4 4 7
Females 5–6 28 14 0 9 5 2 4 3 <1 5
7–10 20 12 <1 10 11 <1 5 3 3 6
11–14 15 6 <1 4 16 2 4 4 3 7
Total 20 10 <1 8 12 1 4 4 3 6
NZEO Males 5–6 26 16 4 11 9 5 3 2 3 3
7–10 26 17 7 8 4 4 3 2 3 2
11–14 23 13 10 7 10 3 3 3 2 3
Total 25 15 8 8 8 4 3 3 3 2
Females 5–6 30 12 5 10 10 5 3 2 2 2
7–10 22 11 6 8 10 5 3 2 4 3
11–14 18 7 31 7 5 3 3 2 2 2
Total 21 9 18 8 7 4 3 2 3 2
1 Proportion of total nutrient intake obtained from each food group. Results are presented for the 10 highest contributing food groups. For full food group definitions see Appendix B, Table III.
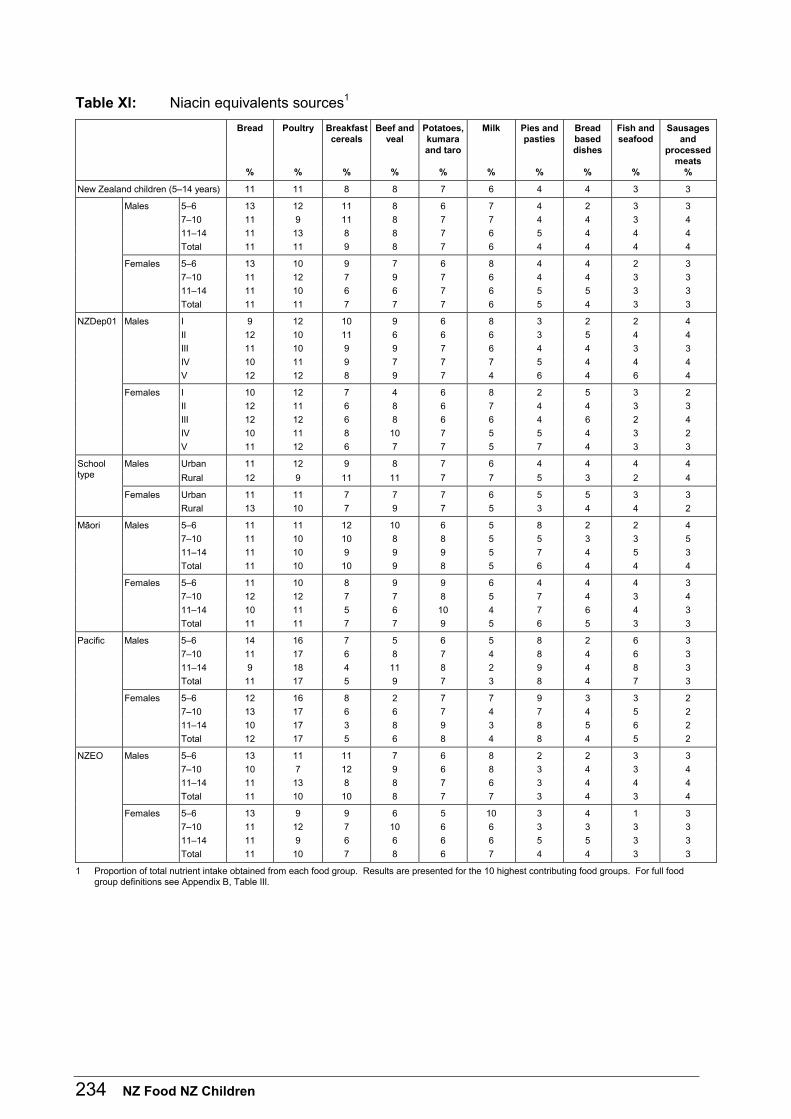
234 NZ Food NZ Children
Table Xl: Niacin equivalents sources1
Bread
%
Poultry
%
Breakfast cereals
%
Beef and veal
%
Potatoes, kumara and taro
%
Milk
%
Pies and pasties
%
Bread based dishes
%
Fish and seafood
%
Sausages and
processed meats
%
New Zealand children (5–14 years) 11 11 8 8 7 6 4 4 3 3
Males 5–6 13 12 11 8 6 7 4 2 3 3
7–10 11 9 11 8 7 7 4 4 3 4
11–14 11 13 8 8 7 6 5 4 4 4
Total 11 11 9 8 7 6 4 4 4 4
Females 5–6 13 10 9 7 6 8 4 4 2 3
7–10 11 12 7 9 7 6 4 4 3 3
11–14 11 10 6 6 7 6 5 5 3 3
Total 11 11 7 7 7 6 5 4 3 3
NZDep01 Males I 9 12 10 9 6 8 3 2 2 4
II 12 10 11 6 6 6 3 5 4 4
III 11 10 9 9 7 6 4 4 3 3
IV 10 11 9 7 7 7 5 4 4 4
V 12 12 8 9 7 4 6 4 6 4
Females I 10 12 7 4 6 8 2 5 3 2
II 12 11 6 8 6 7 4 4 3 3
III 12 12 6 8 6 6 4 6 2 4
IV 10 11 8 10 7 5 5 4 3 2
V 11 12 6 7 7 5 7 4 3 3
Males Urban 11 12 9 8 7 6 4 4 4 4 School type Rural 12 9 11 11 7 7 5 3 2 4
Females Urban 11 11 7 7 7 6 5 5 3 3
Rural 13 10 7 9 7 5 3 4 4 2
Mäori Males 5–6 11 11 12 10 6 5 8 2 2 4
7–10 11 10 10 8 8 5 5 3 3 5
11–14 11 10 9 9 9 5 7 4 5 3
Total 11 10 10 9 8 5 6 4 4 4
Females 5–6 11 10 8 9 9 6 4 4 4 3
7–10 12 12 7 7 8 5 7 4 3 4
11–14 10 11 5 6 10 4 7 6 4 3
Total 11 11 7 7 9 5 6 5 3 3
Pacific Males 5–6 14 16 7 5 6 5 8 2 6 3
7–10 11 17 6 8 7 4 8 4 6 3
11–14 9 18 4 11 8 2 9 4 8 3
Total 11 17 5 9 7 3 8 4 7 3
Females 5–6 12 16 8 2 7 7 9 3 3 2
7–10 13 17 6 6 7 4 7 4 5 2
11–14 10 17 3 8 9 3 8 5 6 2
Total 12 17 5 6 8 4 8 4 5 2
NZEO Males 5–6 13 11 11 7 6 8 2 2 3 3
7–10 10 7 12 9 6 8 3 4 3 4
11–14 11 13 8 8 7 6 3 4 4 4
Total 11 10 10 8 7 7 3 4 3 4
Females 5–6 13 9 9 6 5 10 3 4 1 3
7–10 11 12 7 10 6 6 3 3 3 3
11–14 11 9 6 6 6 6 5 5 3 3
Total 11 10 7 8 6 7 4 4 3 3
1 Proportion of total nutrient intake obtained from each food group. Results are presented for the 10 highest contributing food groups. For full food group definitions see Appendix B, Table III.
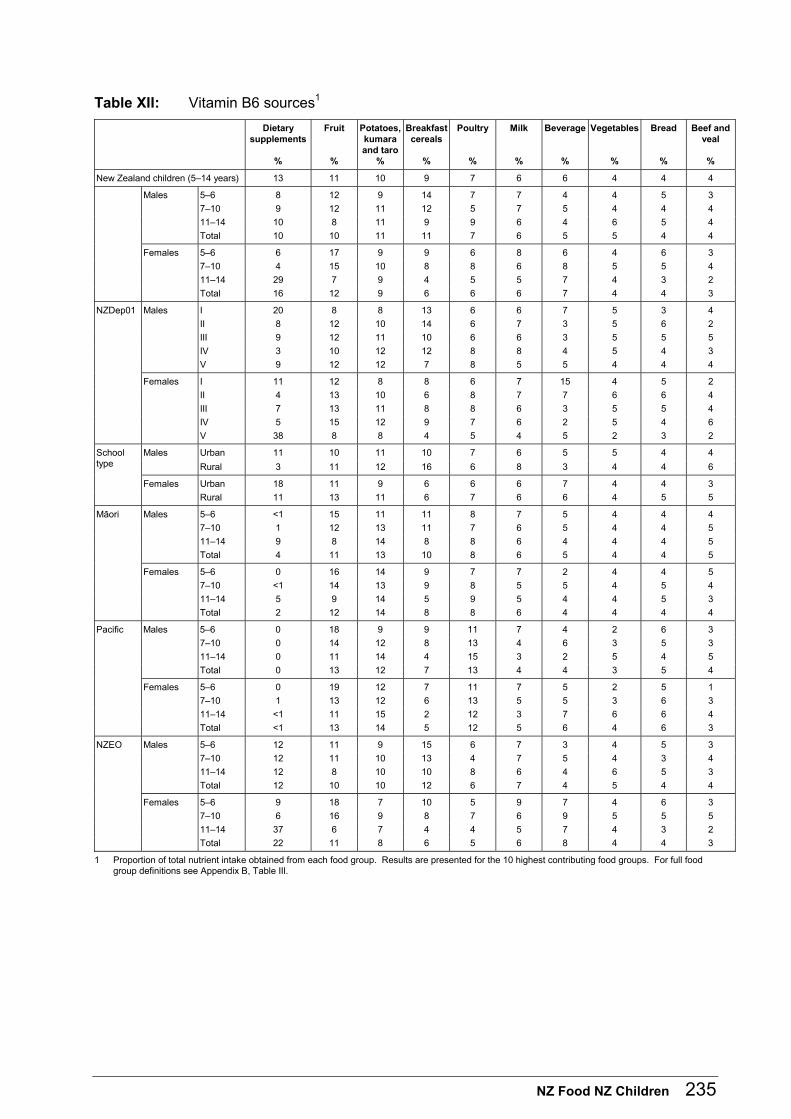
NZ Food NZ Children 235
Table XII: Vitamin B6 sources1
Dietary supplements
%
Fruit
%
Potatoes, kumara and taro
%
Breakfast cereals
%
Poultry
%
Milk
%
Beverage
%
Vegetables
%
Bread
%
Beef and veal
%
New Zealand children (5–14 years) 13 11 10 9 7 6 6 4 4 4
Males 5–6 8 12 9 14 7 7 4 4 5 3
7–10 9 12 11 12 5 7 5 4 4 4
11–14 10 8 11 9 9 6 4 6 5 4
Total 10 10 11 11 7 6 5 5 4 4
Females 5–6 6 17 9 9 6 8 6 4 6 3
7–10 4 15 10 8 8 6 8 5 5 4
11–14 29 7 9 4 5 5 7 4 3 2
Total 16 12 9 6 6 6 7 4 4 3
NZDep01 Males I 20 8 8 13 6 6 7 5 3 4
II 8 12 10 14 6 7 3 5 6 2
III 9 12 11 10 6 6 3 5 5 5
IV 3 10 12 12 8 8 4 5 4 3
V 9 12 12 7 8 5 5 4 4 4
Females I 11 12 8 8 6 7 15 4 5 2
II 4 13 10 6 8 7 7 6 6 4
III 7 13 11 8 8 6 3 5 5 4
IV 5 15 12 9 7 6 2 5 4 6
V 38 8 8 4 5 4 5 2 3 2
Males Urban 11 10 11 10 7 6 5 5 4 4 School type Rural 3 11 12 16 6 8 3 4 4 6
Females Urban 18 11 9 6 6 6 7 4 4 3
Rural 11 13 11 6 7 6 6 4 5 5
Mäori Males 5–6 <1 15 11 11 8 7 5 4 4 4
7–10 1 12 13 11 7 6 5 4 4 5
11–14 9 8 14 8 8 6 4 4 4 5
Total 4 11 13 10 8 6 5 4 4 5
Females 5–6 0 16 14 9 7 7 2 4 4 5
7–10 <1 14 13 9 8 5 5 4 5 4
11–14 5 9 14 5 9 5 4 4 5 3
Total 2 12 14 8 8 6 4 4 4 4
Pacific Males 5–6 0 18 9 9 11 7 4 2 6 3
7–10 0 14 12 8 13 4 6 3 5 3
11–14 0 11 14 4 15 3 2 5 4 5
Total 0 13 12 7 13 4 4 3 5 4
Females 5–6 0 19 12 7 11 7 5 2 5 1
7–10 1 13 12 6 13 5 5 3 6 3
11–14 <1 11 15 2 12 3 7 6 6 4
Total <1 13 14 5 12 5 6 4 6 3
NZEO Males 5–6 12 11 9 15 6 7 3 4 5 3
7–10 12 11 10 13 4 7 5 4 3 4
11–14 12 8 10 10 8 6 4 6 5 3
Total 12 10 10 12 6 7 4 5 4 4
Females 5–6 9 18 7 10 5 9 7 4 6 3
7–10 6 16 9 8 7 6 9 5 5 5
11–14 37 6 7 4 4 5 7 4 3 2
Total 22 11 8 6 5 6 8 4 4 3
1 Proportion of total nutrient intake obtained from each food group. Results are presented for the 10 highest contributing food groups. For full food group definitions see Appendix B, Table III.
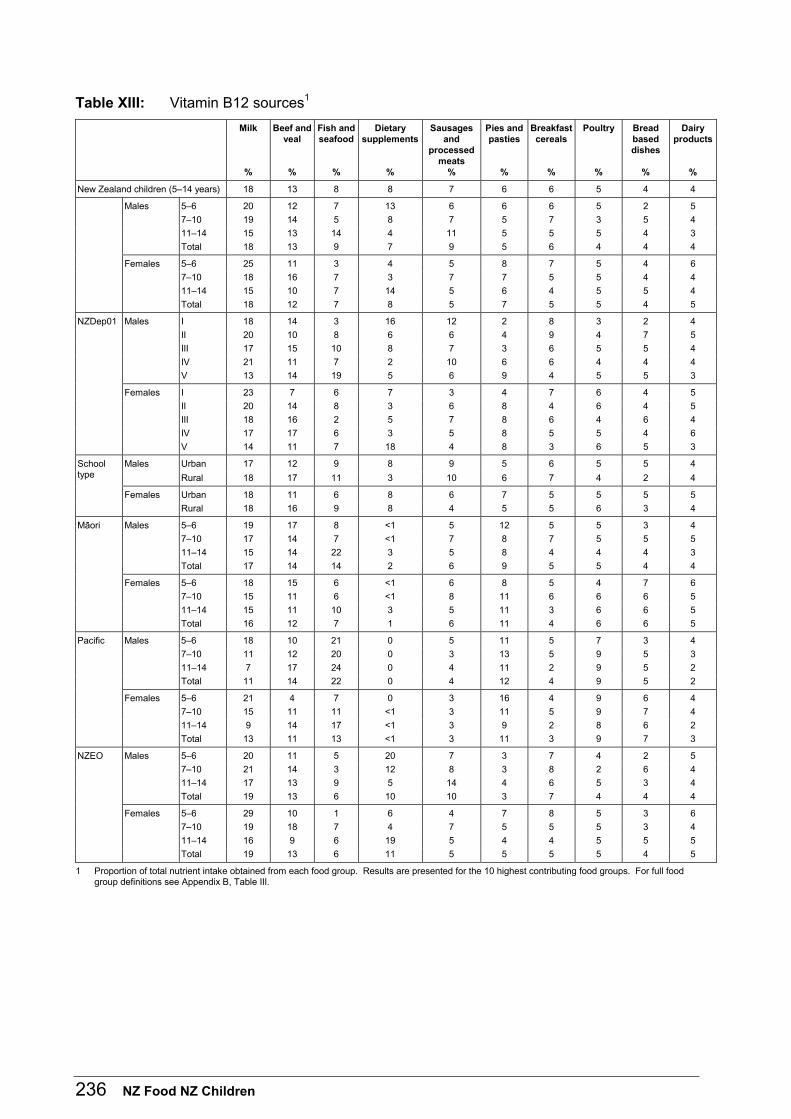
236 NZ Food NZ Children
Table XIII: Vitamin B12 sources1
Milk
%
Beef and veal
%
Fish and seafood
%
Dietary supplements
%
Sausages and
processed meats
%
Pies and pasties
%
Breakfast cereals
%
Poultry
%
Bread based dishes
%
Dairy products
%
New Zealand children (5–14 years) 18 13 8 8 7 6 6 5 4 4
Males 5–6 20 12 7 13 6 6 6 5 2 5
7–10 19 14 5 8 7 5 7 3 5 4
11–14 15 13 14 4 11 5 5 5 4 3
Total 18 13 9 7 9 5 6 4 4 4
Females 5–6 25 11 3 4 5 8 7 5 4 6
7–10 18 16 7 3 7 7 5 5 4 4
11–14 15 10 7 14 5 6 4 5 5 4
Total 18 12 7 8 5 7 5 5 4 5
NZDep01 Males I 18 14 3 16 12 2 8 3 2 4
II 20 10 8 6 6 4 9 4 7 5
III 17 15 10 8 7 3 6 5 5 4
IV 21 11 7 2 10 6 6 4 4 4
V 13 14 19 5 6 9 4 5 5 3
Females I 23 7 6 7 3 4 7 6 4 5
II 20 14 8 3 6 8 4 6 4 5
III 18 16 2 5 7 8 6 4 6 4
IV 17 17 6 3 5 8 5 5 4 6
V 14 11 7 18 4 8 3 6 5 3
Males Urban 17 12 9 8 9 5 6 5 5 4 School type Rural 18 17 11 3 10 6 7 4 2 4
Females Urban 18 11 6 8 6 7 5 5 5 5
Rural 18 16 9 8 4 5 5 6 3 4
Mäori Males 5–6 19 17 8 <1 5 12 5 5 3 4
7–10 17 14 7 <1 7 8 7 5 5 5
11–14 15 14 22 3 5 8 4 4 4 3
Total 17 14 14 2 6 9 5 5 4 4
Females 5–6 18 15 6 <1 6 8 5 4 7 6
7–10 15 11 6 <1 8 11 6 6 6 5
11–14 15 11 10 3 5 11 3 6 6 5
Total 16 12 7 1 6 11 4 6 6 5
Pacific Males 5–6 18 10 21 0 5 11 5 7 3 4
7–10 11 12 20 0 3 13 5 9 5 3
11–14 7 17 24 0 4 11 2 9 5 2
Total 11 14 22 0 4 12 4 9 5 2
Females 5–6 21 4 7 0 3 16 4 9 6 4
7–10 15 11 11 <1 3 11 5 9 7 4
11–14 9 14 17 <1 3 9 2 8 6 2
Total 13 11 13 <1 3 11 3 9 7 3
NZEO Males 5–6 20 11 5 20 7 3 7 4 2 5
7–10 21 14 3 12 8 3 8 2 6 4
11–14 17 13 9 5 14 4 6 5 3 4
Total 19 13 6 10 10 3 7 4 4 4
Females 5–6 29 10 1 6 4 7 8 5 3 6
7–10 19 18 7 4 7 5 5 5 3 4
11–14 16 9 6 19 5 4 4 5 5 5
Total 19 13 6 11 5 5 5 5 4 5
1 Proportion of total nutrient intake obtained from each food group. Results are presented for the 10 highest contributing food groups. For full food group definitions see Appendix B, Table III.
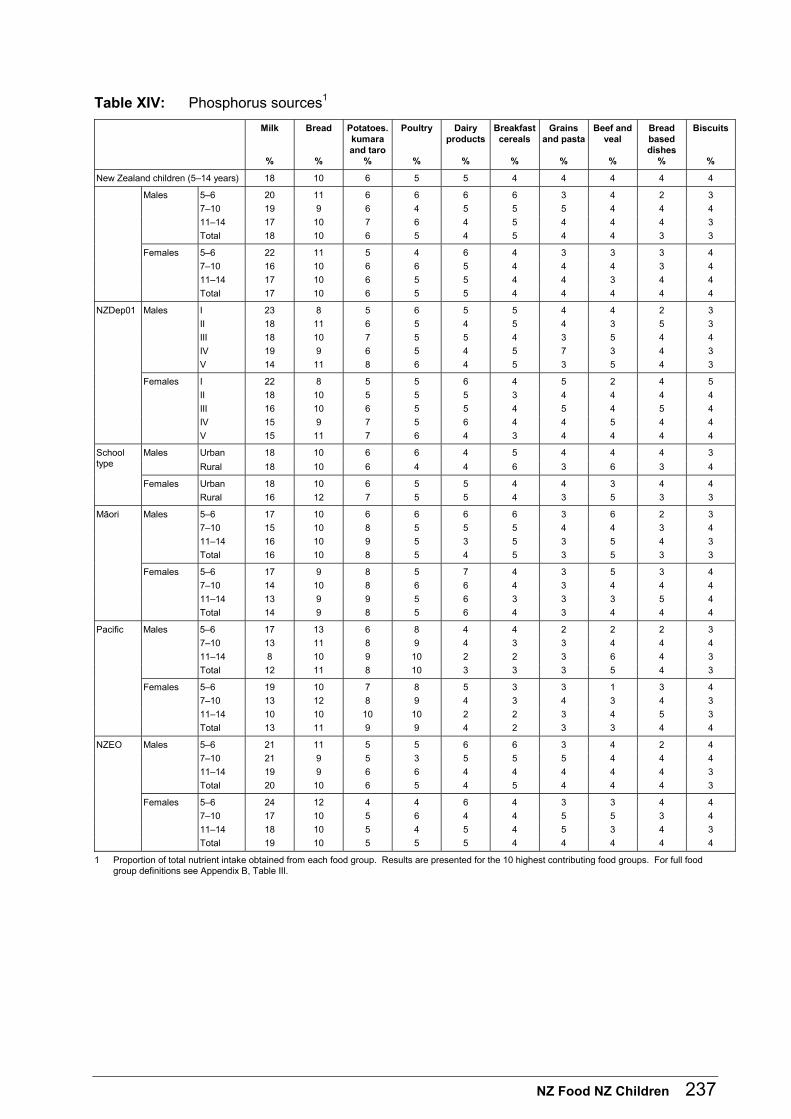
NZ Food NZ Children 237
Table XIV: Phosphorus sources1
Milk
%
Bread
%
Potatoes. kumara and taro
%
Poultry
%
Dairy products
%
Breakfast cereals
%
Grains and pasta
%
Beef and veal
%
Bread based dishes
%
Biscuits
%
New Zealand children (5–14 years) 18 10 6 5 5 4 4 4 4 4
Males 5–6 20 11 6 6 6 6 3 4 2 3
7–10 19 9 6 4 5 5 5 4 4 4
11–14 17 10 7 6 4 5 4 4 4 3
Total 18 10 6 5 4 5 4 4 3 3
Females 5–6 22 11 5 4 6 4 3 3 3 4
7–10 16 10 6 6 5 4 4 4 3 4
11–14 17 10 6 5 5 4 4 3 4 4
Total 17 10 6 5 5 4 4 4 4 4
NZDep01 Males I 23 8 5 6 5 5 4 4 2 3
II 18 11 6 5 4 5 4 3 5 3
III 18 10 7 5 5 4 3 5 4 4
IV 19 9 6 5 4 5 7 3 4 3
V 14 11 8 6 4 5 3 5 4 3
Females I 22 8 5 5 6 4 5 2 4 5
II 18 10 5 5 5 3 4 4 4 4
III 16 10 6 5 5 4 5 4 5 4
IV 15 9 7 5 6 4 4 5 4 4
V 15 11 7 6 4 3 4 4 4 4
Males Urban 18 10 6 6 4 5 4 4 4 3 School type Rural 18 10 6 4 4 6 3 6 3 4
Females Urban 18 10 6 5 5 4 4 3 4 4
Rural 16 12 7 5 5 4 3 5 3 3
Mäori Males 5–6 17 10 6 6 6 6 3 6 2 3
7–10 15 10 8 5 5 5 4 4 3 4
11–14 16 10 9 5 3 5 3 5 4 3
Total 16 10 8 5 4 5 3 5 3 3
Females 5–6 17 9 8 5 7 4 3 5 3 4
7–10 14 10 8 6 6 4 3 4 4 4
11–14 13 9 9 5 6 3 3 3 5 4
Total 14 9 8 5 6 4 3 4 4 4
Pacific Males 5–6 17 13 6 8 4 4 2 2 2 3
7–10 13 11 8 9 4 3 3 4 4 4
11–14 8 10 9 10 2 2 3 6 4 3
Total 12 11 8 10 3 3 3 5 4 3
Females 5–6 19 10 7 8 5 3 3 1 3 4
7–10 13 12 8 9 4 3 4 3 4 3
11–14 10 10 10 10 2 2 3 4 5 3
Total 13 11 9 9 4 2 3 3 4 4
NZEO Males 5–6 21 11 5 5 6 6 3 4 2 4
7–10 21 9 5 3 5 5 5 4 4 4
11–14 19 9 6 6 4 4 4 4 4 3
Total 20 10 6 5 4 5 4 4 4 3
Females 5–6 24 12 4 4 6 4 3 3 4 4
7–10 17 10 5 6 4 4 5 5 3 4
11–14 18 10 5 4 5 4 5 3 4 3
Total 19 10 5 5 5 4 4 4 4 4
1 Proportion of total nutrient intake obtained from each food group. Results are presented for the 10 highest contributing food groups. For full food group definitions see Appendix B, Table III.
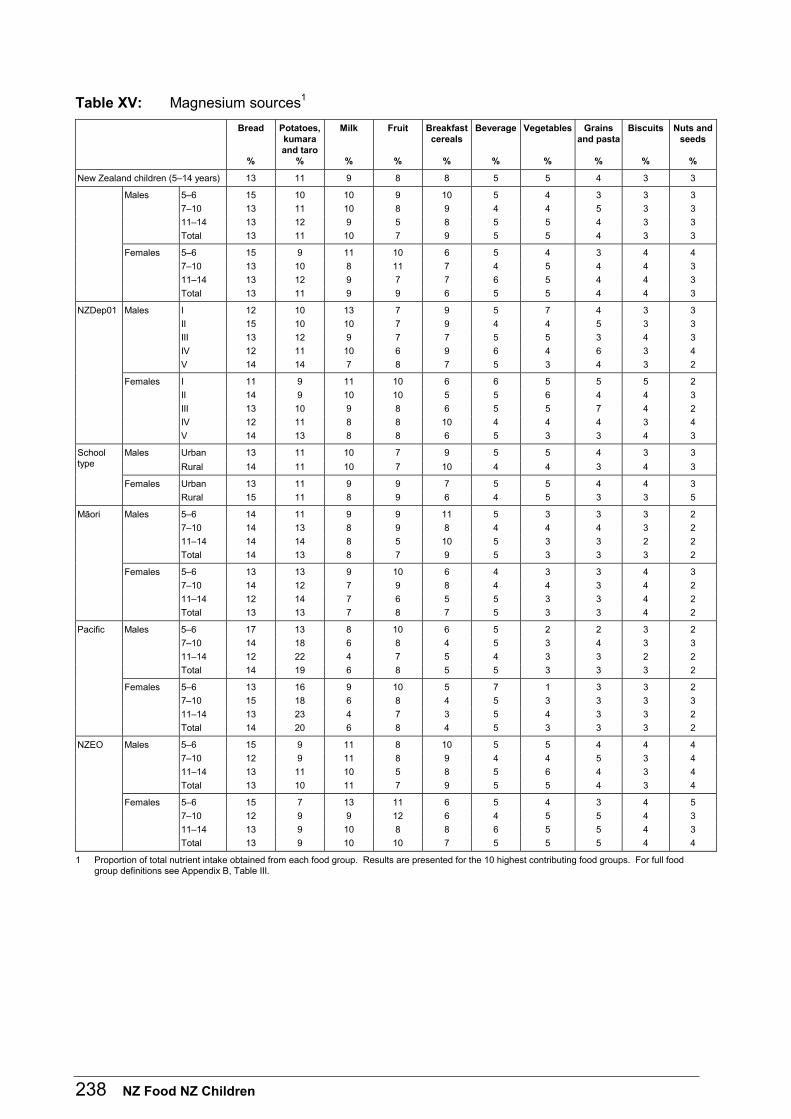
238 NZ Food NZ Children
Table XV: Magnesium sources1
Bread
%
Potatoes, kumara and taro
%
Milk
%
Fruit
%
Breakfast cereals
%
Beverage
%
Vegetables
%
Grains and pasta
%
Biscuits
%
Nuts and seeds
%
New Zealand children (5–14 years) 13 11 9 8 8 5 5 4 3 3
Males 5–6 15 10 10 9 10 5 4 3 3 3
7–10 13 11 10 8 9 4 4 5 3 3
11–14 13 12 9 5 8 5 5 4 3 3
Total 13 11 10 7 9 5 5 4 3 3
Females 5–6 15 9 11 10 6 5 4 3 4 4
7–10 13 10 8 11 7 4 5 4 4 3
11–14 13 12 9 7 7 6 5 4 4 3
Total 13 11 9 9 6 5 5 4 4 3
NZDep01 Males I 12 10 13 7 9 5 7 4 3 3
II 15 10 10 7 9 4 4 5 3 3
III 13 12 9 7 7 5 5 3 4 3
IV 12 11 10 6 9 6 4 6 3 4
V 14 14 7 8 7 5 3 4 3 2
Females I 11 9 11 10 6 6 5 5 5 2
II 14 9 10 10 5 5 6 4 4 3
III 13 10 9 8 6 5 5 7 4 2
IV 12 11 8 8 10 4 4 4 3 4
V 14 13 8 8 6 5 3 3 4 3
Males Urban 13 11 10 7 9 5 5 4 3 3 School type Rural 14 11 10 7 10 4 4 3 4 3
Females Urban 13 11 9 9 7 5 5 4 4 3
Rural 15 11 8 9 6 4 5 3 3 5
Mäori Males 5–6 14 11 9 9 11 5 3 3 3 2
7–10 14 13 8 9 8 4 4 4 3 2
11–14 14 14 8 5 10 5 3 3 2 2
Total 14 13 8 7 9 5 3 3 3 2
Females 5–6 13 13 9 10 6 4 3 3 4 3
7–10 14 12 7 9 8 4 4 3 4 2
11–14 12 14 7 6 5 5 3 3 4 2
Total 13 13 7 8 7 5 3 3 4 2
Pacific Males 5–6 17 13 8 10 6 5 2 2 3 2
7–10 14 18 6 8 4 5 3 4 3 3
11–14 12 22 4 7 5 4 3 3 2 2
Total 14 19 6 8 5 5 3 3 3 2
Females 5–6 13 16 9 10 5 7 1 3 3 2
7–10 15 18 6 8 4 5 3 3 3 3
11–14 13 23 4 7 3 5 4 3 3 2
Total 14 20 6 8 4 5 3 3 3 2
NZEO Males 5–6 15 9 11 8 10 5 5 4 4 4
7–10 12 9 11 8 9 4 4 5 3 4
11–14 13 11 10 5 8 5 6 4 3 4
Total 13 10 11 7 9 5 5 4 3 4
Females 5–6 15 7 13 11 6 5 4 3 4 5
7–10 12 9 9 12 6 4 5 5 4 3
11–14 13 9 10 8 8 6 5 5 4 3
Total 13 9 10 10 7 5 5 5 4 4
1 Proportion of total nutrient intake obtained from each food group. Results are presented for the 10 highest contributing food groups. For full food group definitions see Appendix B, Table III.
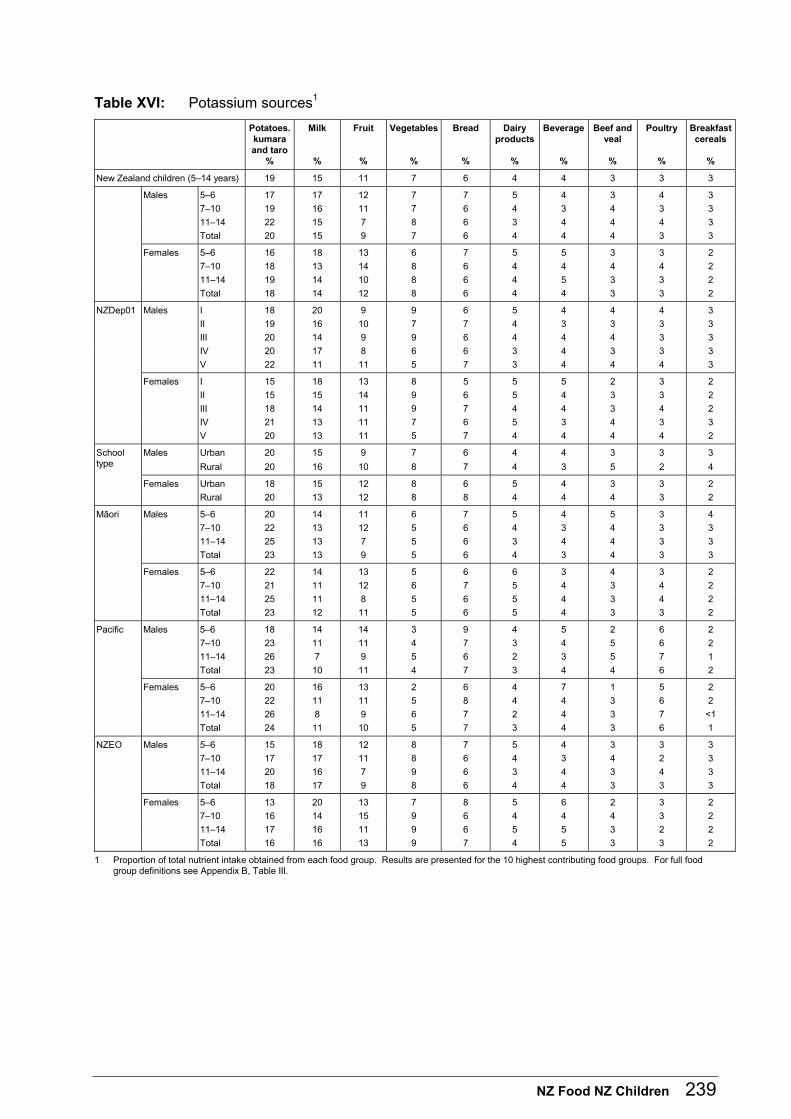
NZ Food NZ Children 239
Table XVI: Potassium sources1
Potatoes. kumara and taro
%
Milk
%
Fruit
%
Vegetables
%
Bread
%
Dairy products
%
Beverage
%
Beef and veal
%
Poultry
%
Breakfast cereals
%
New Zealand children (5–14 years) 19 15 11 7 6 4 4 3 3 3
Males 5–6 17 17 12 7 7 5 4 3 4 3
7–10 19 16 11 7 6 4 3 4 3 3
11–14 22 15 7 8 6 3 4 4 4 3
Total 20 15 9 7 6 4 4 4 3 3
Females 5–6 16 18 13 6 7 5 5 3 3 2
7–10 18 13 14 8 6 4 4 4 4 2
11–14 19 14 10 8 6 4 5 3 3 2
Total 18 14 12 8 6 4 4 3 3 2
NZDep01 Males I 18 20 9 9 6 5 4 4 4 3
II 19 16 10 7 7 4 3 3 3 3
III 20 14 9 9 6 4 4 4 3 3
IV 20 17 8 6 6 3 4 3 3 3
V 22 11 11 5 7 3 4 4 4 3
Females I 15 18 13 8 5 5 5 2 3 2
II 15 15 14 9 6 5 4 3 3 2
III 18 14 11 9 7 4 4 3 4 2
IV 21 13 11 7 6 5 3 4 3 3
V 20 13 11 5 7 4 4 4 4 2
Males Urban 20 15 9 7 6 4 4 3 3 3 School type Rural 20 16 10 8 7 4 3 5 2 4
Females Urban 18 15 12 8 6 5 4 3 3 2
Rural 20 13 12 8 8 4 4 4 3 2
Mäori Males 5–6 20 14 11 6 7 5 4 5 3 4
7–10 22 13 12 5 6 4 3 4 3 3
11–14 25 13 7 5 6 3 4 4 3 3
Total 23 13 9 5 6 4 3 4 3 3
Females 5–6 22 14 13 5 6 6 3 4 3 2
7–10 21 11 12 6 7 5 4 3 4 2
11–14 25 11 8 5 6 5 4 3 4 2
Total 23 12 11 5 6 5 4 3 3 2
Pacific Males 5–6 18 14 14 3 9 4 5 2 6 2
7–10 23 11 11 4 7 3 4 5 6 2
11–14 26 7 9 5 6 2 3 5 7 1
Total 23 10 11 4 7 3 4 4 6 2
Females 5–6 20 16 13 2 6 4 7 1 5 2
7–10 22 11 11 5 8 4 4 3 6 2
11–14 26 8 9 6 7 2 4 3 7 <1
Total 24 11 10 5 7 3 4 3 6 1
NZEO Males 5–6 15 18 12 8 7 5 4 3 3 3
7–10 17 17 11 8 6 4 3 4 2 3
11–14 20 16 7 9 6 3 4 3 4 3
Total 18 17 9 8 6 4 4 3 3 3
Females 5–6 13 20 13 7 8 5 6 2 3 2
7–10 16 14 15 9 6 4 4 4 3 2
11–14 17 16 11 9 6 5 5 3 2 2
Total 16 16 13 9 7 4 5 3 3 2
1 Proportion of total nutrient intake obtained from each food group. Results are presented for the 10 highest contributing food groups. For full food group definitions see Appendix B, Table III.
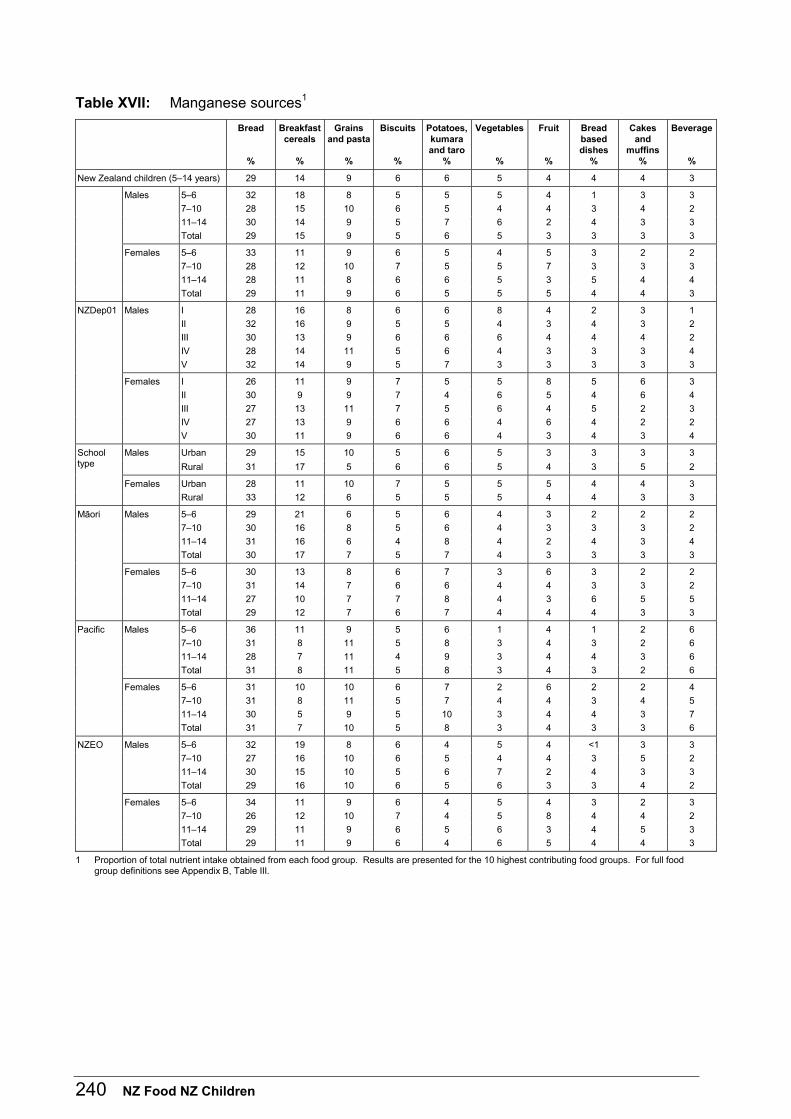
240 NZ Food NZ Children
Table XVII: Manganese sources1
Bread
%
Breakfast cereals
%
Grains and pasta
%
Biscuits
%
Potatoes, kumara and taro
%
Vegetables
%
Fruit
%
Bread based dishes
%
Cakes and
muffins%
Beverage
%
New Zealand children (5–14 years) 29 14 9 6 6 5 4 4 4 3
Males 5–6 32 18 8 5 5 5 4 1 3 3
7–10 28 15 10 6 5 4 4 3 4 2
11–14 30 14 9 5 7 6 2 4 3 3
Total 29 15 9 5 6 5 3 3 3 3
Females 5–6 33 11 9 6 5 4 5 3 2 2
7–10 28 12 10 7 5 5 7 3 3 3
11–14 28 11 8 6 6 5 3 5 4 4
Total 29 11 9 6 5 5 5 4 4 3
NZDep01 Males I 28 16 8 6 6 8 4 2 3 1
II 32 16 9 5 5 4 3 4 3 2
III 30 13 9 6 6 6 4 4 4 2
IV 28 14 11 5 6 4 3 3 3 4
V 32 14 9 5 7 3 3 3 3 3
Females I 26 11 9 7 5 5 8 5 6 3
II 30 9 9 7 4 6 5 4 6 4
III 27 13 11 7 5 6 4 5 2 3
IV 27 13 9 6 6 4 6 4 2 2
V 30 11 9 6 6 4 3 4 3 4
Males Urban 29 15 10 5 6 5 3 3 3 3 School type Rural 31 17 5 6 6 5 4 3 5 2
Females Urban 28 11 10 7 5 5 5 4 4 3
Rural 33 12 6 5 5 5 4 4 3 3
Mäori Males 5–6 29 21 6 5 6 4 3 2 2 2
7–10 30 16 8 5 6 4 3 3 3 2
11–14 31 16 6 4 8 4 2 4 3 4
Total 30 17 7 5 7 4 3 3 3 3
Females 5–6 30 13 8 6 7 3 6 3 2 2
7–10 31 14 7 6 6 4 4 3 3 2
11–14 27 10 7 7 8 4 3 6 5 5
Total 29 12 7 6 7 4 4 4 3 3
Pacific Males 5–6 36 11 9 5 6 1 4 1 2 6
7–10 31 8 11 5 8 3 4 3 2 6
11–14 28 7 11 4 9 3 4 4 3 6
Total 31 8 11 5 8 3 4 3 2 6
Females 5–6 31 10 10 6 7 2 6 2 2 4
7–10 31 8 11 5 7 4 4 3 4 5
11–14 30 5 9 5 10 3 4 4 3 7
Total 31 7 10 5 8 3 4 3 3 6
NZEO Males 5–6 32 19 8 6 4 5 4 <1 3 3
7–10 27 16 10 6 5 4 4 3 5 2
11–14 30 15 10 5 6 7 2 4 3 3
Total 29 16 10 6 5 6 3 3 4 2
Females 5–6 34 11 9 6 4 5 4 3 2 3
7–10 26 12 10 7 4 5 8 4 4 2
11–14 29 11 9 6 5 6 3 4 5 3
Total 29 11 9 6 4 6 5 4 4 3
1 Proportion of total nutrient intake obtained from each food group. Results are presented for the 10 highest contributing food groups. For full food group definitions see Appendix B, Table III.

NZ Food NZ Children 241
Table XVIII: Copper sources1
Bread
%
Potatoes, kumara and taro
%
Dietary supplements
%
Vegetables
%
Grains and
pasta %
Fruit
%
Breakfast cereals
%
Beverage
%
Biscuits
%
Bread based dishes
%
New Zealand children (5–14 years) 12 12 9 9 7 7 5 5 4 3
Males 5–6 14 11 5 10 7 8 7 4 4 2
7–10 12 12 5 7 9 7 7 5 4 4
11–14 12 14 7 10 7 5 5 6 4 4
Total 13 13 6 9 8 6 6 5 4 3
Females 5–6 13 9 21 7 6 7 4 4 4 3
7–10 11 10 18 8 7 8 4 4 4 2
11–14 13 13 2 10 7 7 4 7 4 5
Total 12 11 13 8 7 7 4 5 4 3
NZDep01 Males I 10 10 17 9 6 6 6 5 4 2
II 14 12 <1 8 8 7 8 6 3 4
III 12 13 6 13 6 6 5 5 4 3
IV 12 13 5 8 9 5 6 5 4 4
V 14 15 4 4 8 7 5 6 3 4
Females I 10 9 21 6 7 8 4 5 5 4
II 11 9 19 12 6 8 3 4 4 2
III 9 8 33 7 7 5 3 4 3 3
IV 14 15 <1 8 8 7 6 5 4 3
V 14 14 <1 6 9 7 5 6 4 5
Males Urban 13 13 6 8 8 6 6 5 4 3 School type Rural 13 13 7 11 5 7 7 4 4 2
Females Urban 13 12 3 9 9 8 4 6 5 4
Rural 9 9 36 8 4 5 3 3 2 3
Mäori Males 5–6 13 13 12 6 6 7 7 4 3 2
7–10 13 15 6 5 7 7 6 5 4 3
11–14 13 18 <1 7 6 5 6 7 3 3
Total 13 16 5 6 7 6 6 6 3 3
Females 5–6 13 17 <1 5 8 9 5 4 5 3
7–10 13 15 1 7 7 8 6 5 5 3
11–14 12 17 <1 7 6 5 4 8 5 7
Total 13 16 <1 7 7 7 5 6 5 4
Pacific Males 5–6 18 13 0 1 7 9 5 5 4 2
7–10 14 17 0 6 9 7 4 7 4 4
11–14 12 19 0 3 7 7 3 8 3 4
Total 14 17 0 4 7 7 4 7 4 3
Females 5–6 15 16 0 2 8 10 5 6 4 2
7–10 14 16 2 6 9 7 4 6 3 3
11–14 13 20 <1 4 6 6 2 9 4 5
Total 14 17 1 5 7 7 3 7 4 4
NZEO Males 5–6 15 10 3 14 7 8 8 4 4 1
7–10 12 10 5 7 9 7 7 4 4 4
11–14 12 12 9 11 7 4 5 6 4 4
Total 12 11 7 10 8 6 6 5 4 3
Females 5–6 12 6 29 8 6 6 4 3 3 3
7–10 10 8 24 8 7 8 3 3 4 2
11–14 14 11 3 11 8 7 5 6 5 4
Total 12 9 17 9 7 7 4 4 4 3
1 Proportion of total nutrient intake obtained from each food group. Results are presented for the 10 highest contributing food groups. For full food group definitions see Appendix B, Table III.
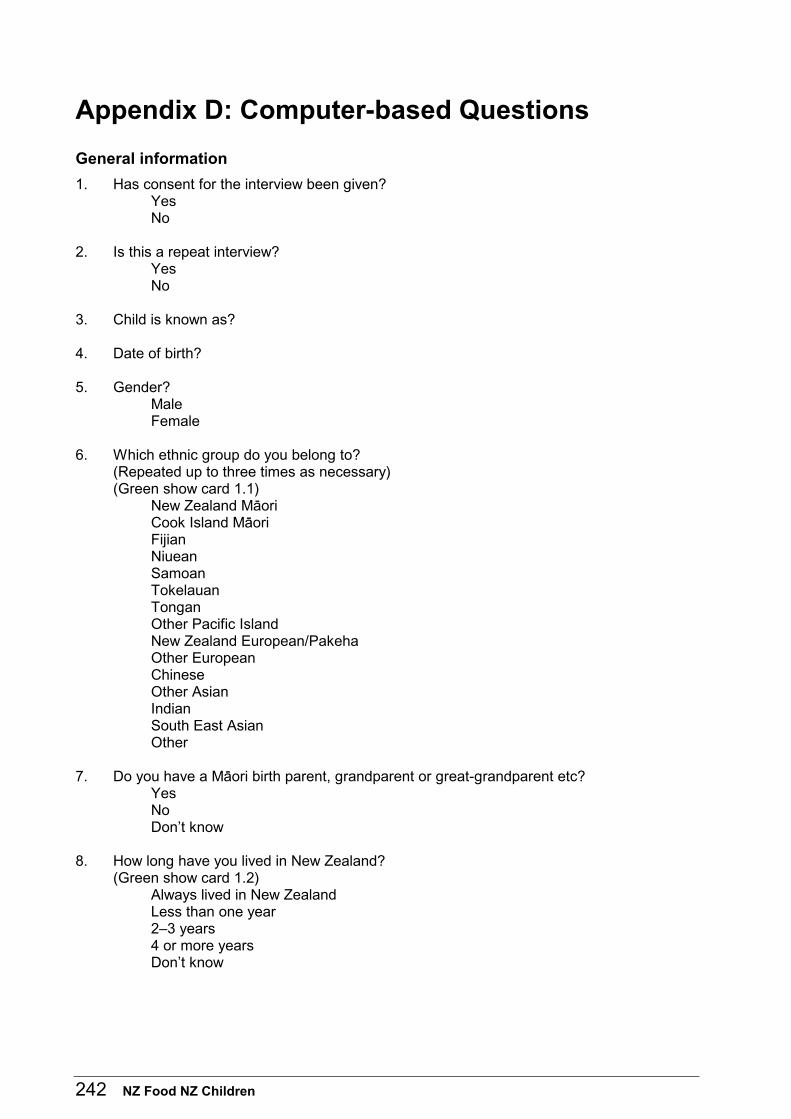
242 NZ Food NZ Children
Appendix D: Computer-based Questions
General information
1. Has consent for the interview been given? Yes No
2. Is this a repeat interview?
Yes No
3. Child is known as? 4. Date of birth? 5. Gender?
Male Female
6. Which ethnic group do you belong to?
(Repeated up to three times as necessary) (Green show card 1.1)
New Zealand Mäori Cook Island Mäori Fijian Niuean Samoan Tokelauan Tongan Other Pacific Island New Zealand European/Pakeha Other European Chinese Other Asian Indian South East Asian Other
7. Do you have a Mäori birth parent, grandparent or great-grandparent etc?
Yes No Don’t know
8. How long have you lived in New Zealand?
(Green show card 1.2) Always lived in New Zealand Less than one year 2–3 years 4 or more years Don’t know
NZ Food NZ Children 243
9. Would you be willing to complete a repeat interview? Yes No
Socio-economic
1. What type of place do you <<Name>> live in most of the time? Green Show Card 1.3
House / townhouse Flat / unit Hostel Garage Caravan Sleepout Other Don’t know
1_. We are now going to ask you some questions about where you (<<name>>) live most of
the time. 2. Is this place rented or owned?
Green Show Card 1.4 Rented privately Rented (Housing New Zealand / Council) Owned Living with relatives Other Don’t know
3. How many rooms are used for sleeping?
(Count all spaces used for sleeping including lounge, sleep-out, garage, caravan, tent). 1 2 3 4 5 6 7+ Don’t know
4_. In the last four weeks, we are interested to know how many people usually lived in your
dwelling, including yourself? 4a. How many adults (those who have left school) lived in your dwelling?
Enter 99 for don’t know 99
4b. How many school-age people (5+ years), including yourself, lived in your dwelling? 4c. How many under 5s lived in your dwelling?
244 NZ Food NZ Children
5. What is the combined yearly income before tax from all sources (including wages, benefits, accommodation supplement), of all your household members? Green Show Card 1.5
Loss $0–$5,000 $5,001–$10,000 $10,000–$20,000 $20,001–$30,000 $30,001–$40,000 $40,001–$50,000 $50,001 or more Don’t know
6. How much money does your household usually spend each week on food and beverages
(ie, at supermarket, dairy, takeaways, petrol station)? Green Show Card 1.6
$1–$50 $51–$100 $101–$150 $151–$200 $201+ Don’t know
24-hour diet recall – adult present
0. We need to ask you a few questions about who you are and whether you are the main food preparer for the child as we may need to ask for some further information later on.
1. Your name, first and last. 2. Sex
Male Female
3. Your relationship to <<Name>>
Orange Showcard 2.1 Parent Brother/sister Grandparent Uncle/auntie Other
4. Do you usually live at the same address as <<Name>>?
Yes No
5a. Your home phone number with area code. 5b. And your work phone number with area code.
NZ Food NZ Children 245
6. Are you mainly responsible for preparing <<Name>> food? Yes No
7. What is the name of the main food preparer 8. What is the relationship of the main food preparer to <<Name>>?
Orange Showcard 2.1 Parent Brother/sister Grandparent Uncle/auntie Other
9a. What is the home phone number of the main food preparer including area code? 9b. What is the work phone number of the main food preparer including area code?
Food habits
0. We are now going to ask you some questions about your food habits. 1. Are there any sorts of foods you do not eat?
Yes No Don’t know
2. Which of the following foods do you not eat?
Pink Showcard 3.1 All meats Red meat Chicken Fish Dairy products Eggs Other
3_. We are now going to ask you some questions about when you ate over the past week.
Pink Showcard 3.2 3a. Over the past week did you eat or drink something before you left home for school in the
morning? Yes usually Yes sometimes No Don’t know
3b. Over the past week did you eat or drink something on your way to school?
Yes usually Yes sometimes No Don’t know
246 NZ Food NZ Children
3c. Over the past week did you eat or drink something while you were at school? Yes usually Yes sometimes No Don’t know
3d. Over the past week did you eat or drink something on your way home from school?
Yes usually Yes sometimes No Don’t know
4_. These next few questions are about when you ate or drank at school over the past week. 4a. While at school over the past week did you eat or drink before school?
Yes usually Yes sometimes No Don’t know
4b. While at school over the past week did you eat or drink at morning break?
Yes usually Yes sometimes No Don’t know
4c. While at school over the past week did you eat or drink at lunchtime?
Yes usually Yes sometimes No Don’t know
4d. While at school over the past week did you eat or drink at afternoon break?
Yes usually Yes sometimes No Don’t know
4e. While at school over the past week did you eat or drink after school?
Yes usually Yes sometimes No Don’t know
5_. We would like to ask you now about the food or drink you have at school. 5a. Is the food or drink you have while you are at school brought from home?
Yes most of it Yes some of it None of it Don’t know
NZ Food NZ Children 247
5b. Is the food or drink you have while you are at school bought from a local shop/dairy/takeaway?
Yes most of it Yes some of it None of it Don’t know
5c. Is the food or drink you have while you are at school bought from the school canteen or
tuckshop? Yes most of it Yes some of it None of it Don’t know
6_. Finally, in this section we are going to ask you some questions about adding salt to your
food. 6a. Does the person who prepares your meals add salt when they are cooking?
Yes usually Yes sometimes No Don’t know
6b. Is it iodised (ie, contains iodine)?
Yes No Don’t know
7a. Do you add salt to your meals at the table?
Yes usually Yes sometimes No Don’t know
7b. Is it iodised (ie, contains iodine)?
Yes No Don’t know
Physical activity
0. We are first going to ask you questions about how often you watch tv or videos or play on a computer when you are not at school.
1. Have you watched TV or videos in the last seven days?
Yes No
2a. Did you watch TV or videos last Saturday?
Yes No

248 NZ Food NZ Children
2b. How many hours did you watch TV or videos last Saturday? Less than one hour 1–2 hours 2–4 hours 4+ hours Don’t know
2c. Did you watch TV or videos last Sunday?
Yes No
2d. How many hours did you watch TV or videos last Sunday?
Less than one hour 1–2 hours 2–4 hours 4+ hours Don’t know
2e. Did you watch TV or videos on school days in the last week?
Yes No
2f. On how many school days did you watch TV or videos?
5 days 4 days 3 days 2 days 1 day Don’t know
2g. How much time do you normally spend each day watching TV or videos on school days?
Less than one hour 1–2 hours 2–4 hours 4+ hours Don’t know
3. Have you played computer or video games in the last seven days?
Yes No
4a. Did you play computer or video games last Saturday?
Yes No
4b. How many hours did you play computer or video games last Saturday?
Less than one hour 1–2 hours 2–4 hours 4+ hours Don’t know
NZ Food NZ Children 249
4c. Did you play computer or video games last Sunday? Yes No
4d. How many hours did you play computer or video games last Sunday?
Less than one hour 1–2 hours 2–4 hours 4+ hours Don’t know
4e. Did you play computer or video games on school days?
Yes No
4f. On how many school days did you play computer or video games?
5 days 4 days 3 days 2 days 1 day Don’t know
4g. How much time do you normally spend playing computer or video games on a school
day? Less than one hour 1–2 hours 2–4 hours 4+ hours Don’t know
5_. We are now going to ask you questions about the physical activities you do in your spare
time. Physical activity is described as ‘sports, games, gym, dance or other activities that make you breathe harder, make your legs feel tired or make you sweat’. We are going to ask you how many times in the last seven days you have done each of the activities on the showcard. We will ask about each activity in turn.
5a. How many times have you played active games, eg, tag, bullrush or skipping in the last
seven days? None 1–2 times 3–4 times 5–6 times 7+ times
5b. How many times have you done athletics in the last seven days?
None 1–2 times 3–4 times 5–6 times 7+ times
250 NZ Food NZ Children
5c. How many times have you played basketball or volleyball in the last seven days? None 1–2 times 3–4 times 5–6 times 7+ times
5d. How many times have you gone biking or cycling in the last seven days?
None 1–2 times 3–4 times 5–6 times 7+ times
5e. How many times have you been climbing or tramping in the last seven days?
None 1–2 times 3–4 times 5–6 times 7+ times
5f. How many times have you played cricket in the last seven days?
None 1–2 times 3–4 times 5–6 times 7+ times
5g. How many times have you done dancing or ballet in the last seven days?
None 1–2 times 3–4 times 5–6 times 7+ times
5h. How many times have you played golf in the last seven days?
None 1–2 times 3–4 times 5–6 times 7+ times
5i. How many times have you done gymnastics or trampoline in the last seven days?
None 1–2 times 3–4 times 5–6 times 7+ times
NZ Food NZ Children 251
5j. How many times have you played hockey in the last seven days? None 1–2 times 3–4 times 5–6 times 7+ times
5k. How many times have you been jogging or running or doing cross country in the last
seven days? None 1–2 times 3–4 times 5–6 times 7+ times
5l. How many times have you done martial arts in the last seven days?
None 1–2 times 3–4 times 5–6 times 7+ times
5m. How many times have you played netball in the last seven days?
None 1–2 times 3–4 times 5–6 times 7+ times
5n. How many times have you played racquet sport, eg, tennis, badminton, squash in the last
seven days? None 1–2 times 3–4 times 5–6 times 7+ times
5o. How many times have you played rugby (union or league or touch) in the last seven
days? None 1–2 times 3–4 times 5–6 times 7+ times
5p. How many times have you been skate boarding or roller blading or speed skating or riding
a scooter in the last seven days? None 1–2 times 3–4 times 5–6 times 7+ times
252 NZ Food NZ Children
5q. How many times have you played soccer in the last seven days? None 1–2 times 3–4 times 5–6 times 7+ times
5r. How many times have you played softball or t-ball in the last seven days?
None 1–2 times 3–4 times 5–6 times 7+ times
5s. How many times have you been swimming or surfing in the last seven days?
None 1–2 times 3–4 times 5–6 times 7+ times
5t. How many times have you walked for at least a 15-minute period in the last seven days?
None 1–2 times 3–4 times 5–6 times 7+ times
5u. How many times have you been involved in a cultural group practice or performance in
the last seven days? None 1–2 times 3–4 times 5–6 times 7+ times
5v. Have you done any other physical activity in your spare time in the last seven days that
we have not mentioned? Yes No
5w. How many times have you done this activity in the last seven days?
1–2 times 3–4 times 5–6 times 7+ times
NZ Food NZ Children 253
6. How many times in the past week did you walk, bike, skate or scooter to or from school? Yellow Showcard 4.4
None 1–2 times 3–5 times 6–8 times 9–10 times Don’t know
7a. Over the last week did you go to a PE class?
Yes No
7b. How much of the time were you very active during your physical education class or
classes (eg, playing hard, running, jumping, throwing)? A little Quite a bit Most of the time All the time Don’t know
8. Over the last week what did you do most of the time at morning break on school days?
Sat down (talking, reading, doing school work) Stood around Walked around a little Ran around and played quite a bit Ran and played hard most of the time
9. Over the last week, what did you normally do at lunchtime (apart from eating lunch) on
school days? Sat down (talking, reading, doing school work) Stood around Walked around a little Ran around and played quite a bit Ran and played hard most of the time
10. In the last week, on how many days after school and before having a meal did you do
sports, dance or play games in which you were very active? None 1 day 2–3 days 4 days 5 days Don’t know
254 NZ Food NZ Children
11. In the last seven days, how many evenings (after a meal) did you play sports, dance or play games in which you were very active?
None 1 evening 2–3 evenings 4 evenings 5+ evenings Don’t know
12. Last Saturday and Sunday, how many times in total did you play sports or games or other
activities during the day in which you were very active? None 1 time 2–3 times 4–5 times 6 or more times Don’t know
13a. In the last seven days did sickness or injury prevent you from doing your normal physical
activity? Yes No
13b. How many days did sickness or injury stop you doing your normal activity?
1 day 2–3 days 4–5 days 6–7 days Don’t know
Health
1. Do you go to the school dental clinic or a dentist? Yes No Can’t remember Don’t know
2. <<Name>>, how many times did you brush your teeth yesterday?
(If <<Name>> and caregiver disagree please record the child’s first response.) None One time Two times Three or more times Don’t know
3. Have your teeth ever had a filling or dressing?
Yes No Can’t remember Don’t know

NZ Food NZ Children 255
4. Has pain in your teeth or mouth ever kept you awake at night? Yes No Can’t remember Don’t know
5. Have you ever had a tooth taken out early because of a hole (decay) or ‘gum boil’
(abscess) or infection? Yes No Can’t remember Don’t know
6. Have you ever been put to sleep in hospital to have dental treatment?
Yes No Can’t remember Don’t know
7a. Do you currently have a long-term (more than six months) medical condition or disability?
Yes No Don’t know
7b. Which of the following conditions do you have?
Asthma Eczema Hay fever Coeliac disease Other
7c. Please specify other conditions. 8a. Have you been admitted to hospital in the last 12 months?
Yes No Don’t know
8b. How often have you been admitted in the last 12 months?
One time 2–5 times 6 or more times Don’t know
9a. Have your periods started yet?
Yes No Don’t know
9b. How old were you when they started?
(Enter years and months, ie, 9.08 = 9 years and 8 months OR 99.99 for “Don’t know”)
256 NZ Food NZ Children
Food security
0. We would now like to ask you (the adult present) some questions if you live with <<Name>>.
1. Does <<Name>> live in your household most of the time?
Yes No
2. First of all, we know that some people can’t afford to eat properly and we are interested in
whether you think your household has enough money to eat properly. It’s what you think eating properly is – not what I think or anyone else thinks.
We can afford to eat properly. How often has this been true for your household over the past year? Always Sometimes Never Don’t know
2_. I now want to ask you some questions about particular foods you choose and the buying
of food or gifting of food. We are interested in whether you feel you always have sufficient resources to have the food you need for the people you live with. We are not concerned with your budget, or how you spend your money, but are more interested in finding out about how people get the food that they need for their household to eat and to share.
3. We are now interested in whether you run out of basics, like bread, potatoes, etc because
you do not have enough money. We are NOT referring to treats or special foods. Food runs out in our household due to lack of money. How often has this been true for your household over the past year?
Often Sometimes Never Don’t know
4. Now we are interested in whether a lack of money leads you to sometimes have smaller
meals than you would like or whether there isn’t enough food for seconds or you sometimes skip meals? We eat less because of lack of money. How often has this been true for your household over the past year?
Often Sometimes Never Don’t know
5. Now we are going to talk about the variety of foods you eat. By variety, we mean the
number of different kinds of food you have. The variety of foods we are able to eat is limited by lack of money. How often has this been true for your household over the past year?
Often Sometimes Never Don’t know
NZ Food NZ Children 257
6. Some people rely on support and assistance from others for supplying their regular food and we are interested in finding out how many people fall into this group. We rely on others to provide food and/or money for food for our household, when we don’t have enough money. How often has this been true for your household over the past year?
Often Sometimes Never Don’t know
7. Also, some people have to rely on other sources of help such as food grants or food
banks. We make use of special food grants or food banks when we don’t have enough money for food. How often has this been true for your household over the past year?
Often Sometimes Never Don’t know
8. We know that some people get quite stressed and worried about providing enough food
even though they don’t actually go without food. We feel stressed because of not having enough money for food. How often has this been true for your household over the past year?
Often Sometimes Never Don’t know
9. We recognise that for some people food and sharing with others is important, to the point
that they don’t have enough food for themselves. In this question we are only interested in social situations that are gatherings within, or outside, the household. As a result people may find themselves stressed/whakama (embarrassed) about their koha (gift) when providing food for others. It is stressful because we can’t provide the food we want, for social occasions. How often has this been true for your household over the past year?
Often Sometimes Never Don’t know
258 NZ Food NZ Children
Appendix E: Food Frequency Questionnaire The food questionnaire section of the CNS uses a 'qualitative food frequency questionnaire' or FFQ. It is used to gather information on eating patterns. It contains a long list of foods (including illustrations) and respondents are asked to indicate how often they have consumed eat of these foods in the past four weeks. For each item of food (ie bananas, raw) the respondent is asked to indicate the levels of consumption in the last four weeks by ticking one of the following boxes:
• never or less than once a month
• 1–3 times a month
• 1–2 times a week
• 3–4 times a week
• 5–6 times a week
• 2 or more times a day. Foods were grouped in the FFQ as follows:
• fruit
• vegetables
• mixed dishes
• eggs, meat, poultry, and fish
• pies, burgers, sausage meats
• bread and cereals
• spreads and sauces
• convenience meals/snacks
• dairy (excluding milk)
• biscuits/cakes
• snacks and sweets
• milks
• other (non-milk) drinks. From this questionnaire information has been extrapolated on weekly consumption of food. The full FFQ is available at the Ministry of Health website www.moh.govt.nz/phi
NZ Food NZ Children 259
References Athar A, Spriggs TW, Taptiklis E, et al. 2001. The Concise New Zealand Food Composition Tables. Palmerston North, New Zealand: New Zealand Institute for Crop & Food Research and the Ministry of Health.
Baranowski T. 1988. Validity and reliability of self report measures of physical activity: an information-processing perspective. Research Quarterly for Exercise and Sport 59: 314–27.
Beaton GH. 1994. Criteria of an adequate diet. In: M Shils, J Olson, M Shike (eds) Modern Nutrition in Health and Disease (8th Ed., Vol 4). Philadelphia, US: Lea and Feibiger. 1491–506.
Bourdoux P. 1988. Measurement of iodine in the assessment of iodine deficiency. Iodine Defic Disord Newsl 4: 8–12.
Carriquiry AL. 2003. Estimation of usual intake distributions of nutrients and foods. Journal of Nutrition 133: 601S–608S.
Cole TJ, Bellizzi MC, Flegal KM, et al. 2000. Establishing a standard definition for child overweight and obesity worldwide: international survey. British Medical Journal 320: 1240–3.
Cook JD, Finch CA, Smith NJ. 1976. Evaluation of the iron status of a population. Blood 48(3): 449–55.
Crocker PRE, Bailey DA, Faulkner RA, et al. 1997. Measuring general levels of physical activity: preliminary evidence for the Physical Activity Questionnaire for older children. Medicine and Science in Sports Exercise 29: 1344–1349.
Dallman PR, Looker AC, Johnson CL, et al. 1996. Influence of age on laboratory criteria for the diagnosis of iron deficiency anaemia and iron deficiency in infants and children. In: L Hallberg, N-G Asp (eds) Iron Nutrition in Health and Disease. London, England: John Libby Co. 65–74.
Department of Health. 1991. Food for Health. The Report of the Nutrition Taskforce to the Department of Health. Wellington, New Zealand: Department of Health.
Dodd KW. 1996. A Technical Guide to C-SIDE, Software for Intake Distribution Estimation. Technical Report 96-TR 32. Dietary Assessment Research Series Report 9. Ames, USA: Iowa State University.
Gibson RS. 1990. Principles of Nutrition Assessment. New York, US: Oxford University Press.
Goodwin JF, Murphy B, Guillemette M. 1966. Direct measurement of serum iron and binding capacity. Clinical Chemistry 12: 47–57.
Hamilton WL, Cook JT, Thompson WW, et al. 1997. Household Food Security in the United States 1995. USDA 1997 Technical Report of the Food Security Measurement Project. Prepared by ABT Associates Ltd.
Hotz C, Peerson JM, Brown KH. 2003. Suggested lower cut-offs of serum zinc concentration for assessing population zinc status: A reanalysis of the second USA National Health and Nutrition Examination Survey data (NHANES II: 1976-1980). American Journal of Clinical Nutrition 78: 756–64.
International Council for Control of Iodine Deficiency Disorders (ICCIDD), United Nations Children’s Fund and World Health Organization. 2001. Assessment of Iodine Deficiency
260 NZ Food NZ Children
Disorders and Monitoring their Elimination: A guide for programme managers. WHO/NHD/01.1. Geneva: World Health Organization.
Jamieson LM, Thomson WM, McGee R. In press. Validation of self-reported oral health among children. Paper submitted for publication to Community Dentistry & Oral Epidemiology.
Klensin JC, Feskanich D, Lin V, et al. 1989. Identification of Food Components for INFOODS Data Interchange. Tokyo, Japan: United Nations University Press.
Kowalski K, Crocker PRE, Faulkner RA. 1997a. Validation of the physical activity questionnaire for older children. Pediatric Exercise Sport Science 9: 174–86.
Kowalski K, Crocker PRE, Kowalski N. 1997b. Convergent validity of the physical activity questionnaire for adolescents. Pediatric Exercise Sport Science 9: 342–52.
Lake R, Baldwin S, Skarsholt G. 2001. Database of Supplements to Support the Child Nutrition Survey F110, ESR. Prepared by ESR as part of the Ministry of Health Contract for Scientific Services.
Lewis CJ, Crane NT, Wilson DB, et al. 1999. Estimated folate intakes: Data updated to reflect food fortification, increased bioavailability, and dietary supplement use. American Journal of Clinical Nutrition 70: 198–207.
Looker AC, Dallman PR, Carroll MD, et al. 1997. Prevalence of iron deficiency in the United States. Journal of the American Medical Association 277(12): 973–6.
Manufactured Food Database. 2002. Fortified Foods Available in New Zealand. Auckland, New Zealand: Manufactured Food Database.
Metcalf PA, Scragg RKR, Sharpe S, et al. In press. Short-term repeatability of a food frequency questionnaire in New Zealand children aged 1–14 years. European Journal of Clinical Nutrition.
Ministry of Health. 1999. New Zealand Food: New Zealand people: Key results of the 1997 National Nutrition Survey. Wellington: Ministry of Health.
National Research Council Subcommittee on Criteria for Dietary Evaluation. 1986. Nutrient Adequacy: Assessment using food consumption surveys. Washington DC, US: National Academy Press.
New Zealand Institute for Crop & Food Research Ltd. 2000. FOODfiles: Datafiles of the New Zealand Food Composition Database, OCNZ00. Palmerston North: New Zealand Institute for Crop and Food Research.
New Zealand Institute of Crop & Food Research Ltd. 2002. FOODfiles: Datafiles of the New Zealand Food Composition Database, OCNZ02. Palmerston North: New Zealand Institute for Crop and Food Research.
Nusser SM, Carriquiry AL, Dodd KW, et al. 1996. A semiparametric transformation approach to estimating usual daily intake distributions. Journal of American Statistical Association 91: 1440–9.
Parnell WR, Reid J, Wilson NC, et al. 2001a. Food security: is New Zealand a land of plenty? New Zealand Medical Journal 114: 141–5.
Parnell WR, Wilson NC, Russell DG. 2001b. Methodology of the 1997 New Zealand National Zealand National Nutrition Survey. New Zealand Medical Journal 114: 123–6.
NZ Food NZ Children 261
Recommendations to prevent and control iron deficiency in the United States. 1998. Centers for Disease Control and Prevention. MMWR-Morbidity & Mortality Weekly Report 47(RR-3): 1–29.
Rush EC, Puniani K, Valencia ME, et al. In press. Estimation of body mass index and bioelectrical impedance: comparison of New Zealand European, Mäori and Pacific Island children. European Journal of Clinical Nutrition.
Salmond C, Crampton R. 2002. NZDep2001 Index of Deprivation. Wellington, New Zealand: Department of Public Health, Wellington School of Medicine and Health Sciences, University of Otago.
Sandell EB, Kolthoff IM. 1937. Micro determination of iodine by a catalytic method. Mikrochemica Acta 1: 9–25.
Thomson CD, Paterson E. 2001. Australian and New Zealand Nutrient Reference Values for Selenium. A report prepared for the Ministry of Health. Dunedin, New Zealand: University of Otago.
Thomson WM, Drummond BK. 2001. Pretesting Dental Items for the Proposed National Child Nutrition Survey. A report to the Ministry of Health.
UK Department of Health. 1991. Dietary Reference Values for Food Energy and Nutrients for the United Kingdom. London: HMSO.
Watson P, Rush E, Wall C, et al. 2001. Development and Pretesting of Methodologies for the Children’s Nutrition Survey: Validation Report 3. UniServices Pilot CNS report to the Ministry of Health.
Watson P, Wall C, Scragg RKR, et al. 2000. Developing Questionnaire Methods for the Children’s Nutrition Survey: Report 1A. Wellington: Ministry of Health.
Welk GJ, Corbin CB, Dale D. 2000. Measurement issues in the assessment of physical activity in children. Research Quarterly for Exercise & Sport 71(Suppl 2): S59–73.
Whitney EN, Rolfes SR. 2002. Understanding Nutrition (9th Ed.) Belmont, US: Wadsworth.
Index (See the note under Demographic differences)
A Abbreviations xv–xvii Abstract of results xx–xxiii Age-related differences
see the note under Demographic differences
Anaemia 179, 186 tab. see also Iron – deficiency
Analytical techniques for nutrients 207–8 tab.
Anthropometric measurements 216 see also Body size
Apples & pears frequency of consumption 125
Authorship of survey v–vii
B Bacon & ham
frequency of consumption 129, 152 tab.
Bananas frequency of consumption 125–6 fig. cooked 127
β-carotene daily intake 33 fig. , 69 tab. dietary sources 33 fig., 88 tab.
Beef & veal as source of
cholesterol 20 fat 15 iron 51 niacin 40 protein 11–12 fig. saturated fat 16 vitamin B12 41 zinc 54–5 fig.
frequency of consumption 129–30 fig., 151 tab.
types of meat 206 tab. Beverages
as energy source 8–9 fig. as source of
calcium 46 carbohydrate 23 fructose 27–8 fig. iron 51 sucrose 26–7 fig. sugars 25 vitamin C 35–6 fig.
frequency of consumption 144–5 fig., 160 tab. for different types of beverage
144, 159 tab. key results 124
types of beverage 206 tab. Bibliography 259–61 Bicycling
see Physical activity Biscuits
as energy source 8–9 fig. as source of
carbohydrate 23 fat 14–15 fig.
iron 51 monounsaturated fat 17–18 fig. polyunsaturated fat 19 saturated fat 16 sucrose 26–7 fig.
frequency of consumption 138–9 fig., 157 tab. for different types of biscuit 138 key results 123
types of biscuit 206 tab. Blood sampling 217–8
cholesterol 218 iron 217–8 zinc 218
Body size 176–8, 185 tab. Body Mass Index (BMI) 176
girth 177 height 176, 176 key results 173 skinfold 177–8 weight 176–7 fig.
see also Obesity Boil-up, Meat & vegetable
frequency of consumption 131–2 fig., 153 tab.
Bread as energy source 8–9 fig. as source of
calcium 46 carbohydrate 23 copper 57 fibre 30 folate 43–4 fig. iron 51 manganese 56 niacin 40 phosphorus 48 polyunsaturated fat 19 protein 11–12 fig. selenium 59–60 fig. starch 23 thiamin 39 zinc 54–5 fig.
frequency of consumption 133, 154 tab. for different types of bread 133–4
fig. key results 123 with butter or margarine 133–4
fig., 154 tab. types of bread 206 tab.
Bread-based dishes see Bread
Breakfast cereals as source of
carbohydrate 23 fibre 30–1 fig. folate 43–4 fig. iron 51–2 fig. manganese 56 niacin 40 thiamin 39 vitamin B6 41
frequency of consumption 135–6 fig., 155 tab. added sweetener 135–6 fig., 155
tab. for different types of cereal 135 key results 123
types of cereal 206 tab.
Broccoli frequency of consumption 127
Butter & margarine as source of
fat 14–15 fig. monounsaturated fat 17 polyunsaturated fat 18–19 fig. retinol 34 saturated fat 16 vitamin E 37–8 fig.
types of butter/margarine 133, 206 tab.
use on bread 133–4 fig., 154 tab. cooked vegetables 146–7 fig., 161
tab.
C Cabbage & cauliflower
frequency of consumption 127 Cakes
as energy source 8 as source of
cholesterol 20 fat 14 monounsaturated fat 17–18 polyunsaturated fat 19 retinol 34 saturated fat 16 sucrose 26
frequency of consumption 138–9 fig., 157 tab. for different types of cake 138 key results 123
types of cake 206 tab. Calcium
daily intake 45–6 fig., 73 tab. nutritional adequacy 45–6 fig., 75
tab. dietary sources 46–7 fig., 92 tab. estimated requirements 213 tab. key results 6
Canteens see School tuckshops
Carbohydrate, Total see also Starch as energy source 22–3 fig. , 65 tab. daily intake 22, 65 tab.
nutritional adequacy 22 dietary sources 23 fig. , 83 tab. key results 4
Carotene, β- see β-carotene
Carrots frequency of consumption 127
Cassava frequency of consumption 127
Casseroles see Stews & casseroles
Cauliflower see Cabbage & cauliflower
Cereals see Breakfast cereals
Cheese see also Dairy products as source of
calcium 46–7 saturated fat 16
NZ Food NZ Children 262
frequency of consumption 140–1 fig. types of cheese 206 tab.
Chicken see Poultry
Children see also Female children; Maori
children; New Zealand European & Other children; Pacific children
number of participants in demographic subdivisions 222 different sections of survey 222
Chinese-type dishes frequency of consumption 131, 153
tab. Chocolate
see also Sugar & sweets frequency of consumption 140–1 fig.
Cholesterol daily intake 19–20 , 62 tab. dietary sources 20–1, 82 tab. serum levels 180–1 fig., 187 tab.
key results 174 Cleghorn, Christine vi Coffee
see Beverages Computer games
see Physical inactivity Convenience meals/snacks
frequency of consumption 131–2 fig., 153 tab. for different types of meal 131 key results 122
Cook Island Maori children see Pacific children
Cooking fat or oil frequency of consumption 146–7
fig., 161 tab. for different types of fat or oil 146 key results 124
types of fat or oil 206 tab. Cooking Oil
see Cooking fat or oil Copper
daily intake 57, 75 tab. nutritional adequacy 57
dietary sources 57, 241 tab. key results 6
Corn frequency of consumption 127
Corned beef see Beef & veal
Crisps see Snacks
Cycling see Physical activity
D Dairy products
see also Butter & margarine; Cheese; Milk
as source of calcium 46–7 retinol 34 saturated fat 16 sucrose 26–7 fig.
frequency of consumption 140, 158 tab. key results 123
types of dairy product 206 tab.
Dancing see Physical activity
Demographic differences The effects of age, sex, ethnicity,
socioeconomic deprivation and urban-rural differences have not been explicitly indexed since they are relevant to nearly all topics – the subheading demographic differences is implicit throughout the index
Dental health 175, 184 tab. attendance at dental clinic/dentist
175 incidence of fillings 175 fig. key results xxii, 173 teeth brushing 175 fig.
Deprivation, Effects of see the note under Demographic
differences Dietary supplements
as source of vitamin B12 41 vitamin B6 41 vitamin C 36 fig.
types of supplement 206 tab., 100–1 fig. 117 tab.
use of 100–1 fig., 117 tab. key results 96
Diets key results 96 types 116 tab.
avoid all meat 98 avoid dairy products 98–9 avoid eggs 98–9 fig. avoid red meat 98 omniverous 98–9 fig.
Dried fruit see Fruit – dried
Durie, Mason vi
E Eating patterns, School-day 102–3
fig., 118–9 tab. key results xxi, 96–7 source of food 104–5 fig., 119 tab. time/place of eating 102–3 fig., 105–6
fig., 118–9 tab. key results 97
Eggs as source of
cholesterol 20 retinol 34
frequency of consumption 129–30 fig., 151 tab. key results 122
types of egg dish 206 tab. Energy 3, 8–23
daily intake 8, 9 fig. , 61 tab. dietary sources 8–9 fig., 76 tab. key results 4
Ethnicity, Effects of see the note under Demographic
differences Exercise
see Physical activity
F Fat, Cooking
see Cooking fat or oil Fat, Monounsaturated
as energy source 17 fig. , 64 tab. daily intake 63 tab. dietary sources 17–18 fig., 81 tab. key results 4
Fat, Polyunsaturated as energy source 17 fig., 18–19 , 64
tab. daily intake 64 tab. dietary sources 18–19 fig., 80 tab. key results 4
Fat, Saturated as energy source 16–17 fig. , 64
tab. daily intake 16 , 63 tab. dietary sources 16, 79 tab. key results 4
Fat, Total as energy source 13–14 fig., 62 tab. daily intake 13, 62 tab.
nutritional adequacy 13–14 fig. dietary sources 14–15, 78 tab. key results 4
Female children see also Menstruation inadequate intake of
folate 42–3 fig. iron xxi, 50–1 fig.
Female–male differences see the note under Demographic
differences Ferguson, Elaine vi Fibre, Dietary
see also Polysaccharides, Non-starch
daily intake 29–30 fig., 68 tab. nutritional adequacy 29
dietary sources 30–1 fig., 86 tab. key results 5
Figures, List of xi–xv Fijian children
see Pacific children Fish & seafood
as source of protein 11–12 fig. selenium 59–60 fig. vitamin B12 41
frequency of consumption 129–30 fig., 152 tab. key results 122
types of seafood 206 tab. Fitzgerald, Eljon v–vii Folate
daily intake 42, 43 fig., 72 tab. nutritional adequacy 42–3 fig., 72
tab. dietary sources 43–4 fig., 91 tab. estimated requirements 213 tab. key results 6
Food banks see Food security, Household
Food consumption patterns see Eating patterns, School-day
Food groupings 206 tab. Food security
key results xxi–xxiii
NZ Food NZ Children 263
Food security, Household 109–15, 121 tab. can afford food 109–10 fig. key results 97 lack of money 110–5
dependence on others 112 food scarcity 111 fig. lack of food variety 112, 113 fig. stress 114–5 fig. use of food grants/banks 113–4
fig. Foods, Frequently eaten 122
see also subheading frequency of consumption under individual foods
key results 122 Fructose
daily intake 25 , 66 tab. dietary sources 27–8 fig., 85 tab.
Fruit as energy source 8 as source of β-carotene 33 carbohydrate 23 fibre 30 folate 43–4 fig. fructose 27–8 fig. iron 51 potassium 56 sucrose 26–7 fig. sugars 25 vitamin B6 41 vitamin C 35–6 fig. vitamin E 37–8 fig.
frequency of consumption 125–6 fig., 148 tab. canned 125 cooked 125 dried 125 key results 122
types of fruit 206 tab.
G Games, Active
see Physical activity Gender-related differences
see the note under Demographic differences
Gibson, Rosalind vi Girth
see Body size Glucose
daily intake 25, 66 tab. dietary sources 226 tab.
Grains as energy source 8 as source of
carbohydrate 23 manganese 56 selenium 59–60 fig. zinc 55 fig.
types of grain 206 tab. Grant, Cameron vi Gravy
see Sauces
H Ham
see Bacon & ham Height
see Body size Honey
see Spreads
I Ice cream
see Dairy products Internet
food frequency questionnaire www.moh.govt.nz/phi
“LINZ 24 Diet Recall” programme www.otago.ac.nz/LINZ
Interviewing 200–1 Iodine
daily intake augmentation needed xx
deficiency xxi, 181, 187 tab. key results 174
urinary concentration 181–2 fig., 187 tab.
urine sampling 219 Iron
blood sampling 217 daily intake 50–1 fig.., 74 tab.
nutritional adequacy 50, 74 tab. deficiency 179 fig., 186 tab.
definition 217–8 key results 173
dietary sources 51–2 fig., 93 tab. estimated requirements 213 tab. key results 6
J Jam
see Spreads
K Kiwifruit
frequency of consumption 125 Kumara
see Potatoes, kumara & taro
L Lactose
daily intake 25–6 fig., 67 tab. dietary sources 227 tab.
Lamb & mutton frequency of consumption 129, 151
tab. Lettuce & salad vegetables
frequency of consumption 127
M Magnesium
daily intake 48–9 fig., 73 tab. intake from water ignored 49 nutritional adequacy 49
dietary sources 238 tab. key results 6
Male-female differences see the note under Demographic
differences Maltose
daily intake 25, 67 tab. dietary sources 228 tab.
Mandarins see Oranges & mandarins
Manganese daily intake 56, 75 tab.
nutritional adequacy 57 dietary sources 56, 240 tab. key results 6
Maori children see also the note under
Demographic differences key results 188–9
Margarine see Butter & margarine
Marmite see Spreads
Meat see also Beef & veal; Lamb &
mutton; Pork; Poultry frequency of consumption 129–30
key results 122 Meat, Processed
as source of cholesterol 20 fat 14 monounsaturated fat 17–18 saturated fat 16
frequency of consumption 129, 152 tab.
types of processed meat 206 tab. Menstruation
iron intake needs 50–1 fig. age of onset 183 tab.
key results 174 Methodology 197–223
24-hour diet recall methodology 202–3 www.otago.ac.nz/LINZ
anthropometric measurements 216 blood samples 217–8
cholesterol 218 iron deficiency 217–8 zinc deficiency 218
dental health 215 dietary analysis 204 dietary sources 205 dietary supplements 205 eating patterns 215 ethical approval 198 explanatory notes for tables 219–21 explanatory notes for text 221–2 food frequency questionnaire 215–6 food groupings 206 tab. food security 211–3 estimated requirements of nutrients
213 tab. interviews 200–1 tab.
NZ Food NZ Children 264
Maori issues 198–9 consultation 199 cultural safety of samples 199 participation 199 publicity 199
number of children participating 222 tab.
Pacific issues 199–200 consultation 200 participation 199–200 publicity 200
physical activity 214 response rate 198 sample size & accuracy 197, 223
tab. sampling strategy 197 statistical methods 207–11
nutrient analysis 207–8 tab. nutritional adequacy estimates
209–11 PC-SIDE software use 207–9
urine samples 219 iodine status 219
Milk as energy source 8–9 fig. as source of
calcium 46–7 fig. cholesterol 20–1 fat 14–15 fig. monounsaturated fat 17–18 phosphorus 48 potassium 56 protein 11–12 fig. retinol 34 saturated fat 16 selenium 59–60 vitamin B12 41 zinc 54–5 fig.
frequency of consumption 142–3 fig., 159 tab. for different types of milk 142–3
fig., 159 tab. key results 124
types of milk 206 tab. Minerals 3, 45–60
daily intake 73–5 tab. see also subheading daily intake
under individual minerals dietary sources 92–95 tab., 237–44
tab. see also subheading dietary
sources under individual minerals
key results 6–7 Mixed dishes
frequency of consumption key results 122
Money, Effects of lack of see Food security, Household
Muffins see Cakes
Multivitamin tablets see Dietary supplements
Mutton see Lamb & mutton
N New Zealand European & Other
children key results 191
New Zealand European children see also the note under
Demographic differences Niacin
daily intake 40–1, 71 tab. nutritional adequacy 41
dietary sources 40, 234 tab. Niuean children
see Pacific children Noodles
frequency of consumption 131 Nutrients 3, 10–60
analytical techniques 207–8 tab. daily intake 61–75 tab.
see also subheading daily intake under individual nutrients or classes of nutrient
dietary sources 77–95 tab., 224–39 tab. see also subheading dietary
sources under individual nutrients or classes of nutrient
key results 4–7 Nuts & seeds
as source of monounsaturated fat 17 polyunsaturated fat 19
types of nuts or seeds 206 tab.
O Obesity 177 fig., 185 tab.
see also Body size key results xxii, 173
Oil, Cooking see Cooking fat or oil
Oranges & mandarins frequency of consumption 125
P Pacific children
see also the note under Demographic differences
inadequate intake of calcium 45
key results 190 Pakeha children
see New Zealand European children Parnell, Winsome v–vii Pasta
as energy source 8 as source of
carbohydrate 23 manganese 56 selenium 59–60 fig. zinc 55 fig.
frequency of consumption 131, 153 tab. key results 122
types of pasta dish 206 tab.
Pasta dishes see Pasta
Pasties see Pies & pasties
Peanut butter see Spreads
Pears see Apples & pears
Peas frequency of consumption 127
Phosphorus daily intake 48, 49 fig., 73 tab.
nutritional adequacy 48 dietary sources 48, 237 tab. key results 6
Physical activity key results xxii, 162–3 participation 166–7 fig., 171 tab. time of activity
after school 169, 172 tab. evenings 169, 172 tab. key results 163 lunch break 168–9 fig., 172 tab. morning break 168, 172 tab. physical education class 168, 172
tab. weekends 169 fig., 172 tab.
types of activity 166, 171 tab. Physical education classes
see Physical activity Physical inactivity
computer/video games 164–5 fig., 170 tab.
key results 162 television/video watching 164–5 fig.,
170 tab. Pies & pasties
as source of fat 14–15 fig. fibre 30–1 iron 51 monounsaturated fat 17–18 saturated fat 16
Pizza frequency of consumption 131
Polysaccharides, Non-starch insoluble
daily intake 29–30 fig. , 68 tab. dietary sources 229 tab.
soluble daily intake 29, 68 tab. dietary sources 230 tab.
Popcorn see Snacks
Pork frequency of consumption 129, 151
tab. Potassium
daily intake 56, 74 tab. nutritional adequacy 56
dietary sources 56, 239 tab. key results 6
Potatoes, kumara & taro as energy source 8–9 fig. as source of
carbohydrate 23 copper 57 fat 14–15 fig.
NZ Food NZ Children 265
fibre 30–1 folate 43–4 fig. iron 51 monounsaturated fat 17–18 fig. polyunsaturated fat 19 potassium 56 saturated fat 16 starch 23 vitamin B6 41 vitamin C 35–6 fig. vitamin E 37–8 fig.
frequency of consumption 127–8 fig. types of potato etc. meal 206 tab.
Poultry as source of
cholesterol 20–1 fat 15 monounsaturated fat 17–18 fig. niacin 40 polyunsaturated fat 19 protein 11–12 fig. selenium 59–60 fig. zinc 55
frequency of consumption 129–30 fig., 152 tab. key results 122
types of poultry 206 tab. Poverty
see Food security, Household Protein
as energy source 10–11 fig., 61 tab. daily intake 10–11 fig.
nutritional adequacy 10 dietary sources 11, 77 tab. key results 4
Puha see Silverbeet, spinach, puha &
watercress
Q Questionnaire, Computer-based
question development 24-hour diet recall 202–3 dental health 215 eating patterns 215 food security 211–2 physical activity 214
questions 242–57 24-hour diet recall 244–5 food habits 245–7 food security 256–7 general information 242–3 health 254–5 physical activity 247–54 socioeconomic 243–4
Questionnaire, Food frequency 258 question development 215–6 questions
www.moh.govt.nz/phi
R References 259–61 Retinol
daily intake 69 tab. dietary sources 34, 87 tab. estimated requirements 213 tab.
Riboflavin daily intake 40, 71 tab.
nutritional adequacy 40, 71 tab. dietary sources 233 tab. estimated requirements 213 tab.
Rice frequency of consumption 135, 155
tab. key results 123
Rugby see Physical activity
Running see Physical activity
Rural–urban differences see the note under Demographic
differences
S Salad dressing
see Sauces Salad vegetables
see Lettuce & salad vegetables Salt
use of 107–8, 120 tab. at meal time 107–8 fig. during meal preparation 107–8 fig. key results 97
Samoan children see Pacific children
Sauces as source of
folate 44 fig. frequency of consumption 135 fig.,
156 tab. for different types of sauce 135 key results 123
types of sauce 206 tab. Sausages
see Meat, Processed Schaaf, David v–vii School tuckshops
see also Eating patterns, School-day
use of 104–5 fig. School, Food eaten at
see Eating patterns, School-day Schools, Participating xvii–xx Scragg, Robert v–vii Seafood
see Fish & seafood Seeds
see Nuts & seeds
Selenium daily intake 58, 59 fig., 75 tab.
nutritional adequacy 58–9 fig. dietary sources 59–60 fig., 95 tab. key results 7
Sex-related differences see the note under Demographic
differences Sharpe, Sue vi Silverbeet, spinach, puha &
watercress frequency of consumption 127–8 fig.
Skating see Physical activity
Skeaff, Sheila vi Skinfold measurement
see Body size Smith, Claire vi Snacks
frequency of consumption 140, 158 tab.
types of snack 206 tab. Soft drinks
see Beverages Soup
frequency of consumption 131 Spaghetti with tomato sauce
frequency of consumption 131–2 fig. Spinach
see Silverbeet, spinach, puha & watercress
Sports drinks see Beverages
Spreads frequency of consumption 137 fig.,
156 tab. for different types of spread 137 key results 123
Starch daily intake 23–4 , 65 tab. dietary sources 23, 224 tab.
Statistical methods 207–11 explanatory notes for tables 219–21 explanatory notes for text 221–2 PC-SIDE software use 207–9
Stews & casseroles frequency of consumption 131
Sucrose daily intake 25–6 fig. , 67 tab. dietary sources 26–7 fig., 84 tab.
Sugar & sweets as energy source 8 as source of
carbohydrate 23 fructose 27–8 sucrose 26–7 fig. sugars 25
frequency of consumption 140, 158 tab. key results 123
types of sweet 206 tab.
NZ Food NZ Children 266
Sugars, Total see also Breakfast cereals – added
sweetener daily intake 25 , 66 tab. dietary sources 25, 225 tab. key results 5
Survey, 2002 National Children’s Nutrition background 1–2 executive summary xx–xxiii methodology 197–223
see also Methodology in main sequence
objectives 192–3 personnel 193–6
advisory groups 195 Board 196 consultants 194 field staff 195 investigators 193 Kaitiaki 196 Ministry of Health 194 Pacific 196 project offices 194
T Tables, Explanatory notes for 219–21 Tables, List of x–xii Taro
see Potatoes, kumara & taro Tea
see Beverages Teeth
see Dental health Television watching
see Physical inactivity Thiamin
daily intake 39 fig., 71 tab. nutritional adequacy 39
dietary sources 39, 232 tab. Thomson, Christine vi Time of food consumption
see Eating patterns, School-day Tokelauan children
see Pacific children Tomato sauce
see Sauces Tomatoes
frequency of consumption 127 Tongan children
see Pacific children Travel to/from school 167 fig., 171
tab. key results 163
Tuckshops, School see School tuckshops
U Urban-rural differences
see the note under Demographic differences
Urine sampling 219 iodine 219
V Veal
see Beef & veal Vegemite
see Spreads Vegetables
as source of β-carotene 33 copper 57 fibre 30–1 fig. folate 43–4 fig. fructose 27 iron 51 potassium 56 vitamin C 35–6 fig. vitamin E 37–8 fig.
frequency of consumption 127–8 fig., 149–50 tab. key results 122
types of vegetable 206 tab. Vegetables, Mixed
frequency of consumption 127 Video watching
see Physical inactivity Vitamin A
see also β-carotene; Retinol daily intake 32, 69 tab.
nutritional adequacy 32 dietary sources 231 tab. estimated requirements 213 tab. key results 5 nutritional adequacy 69 tab.
Vitamin B 39–45 see also Folate; Niacin; Riboflavin;
Thiamin; Vitamin B6; Vitamin B12 daily intake 71–2 tab. key results 5
Vitamin B12 daily intake 41, 72 tab.
nutritional adequacy 41 , 72 tab. dietary sources 41, 236 tab. estimated requirements 213 tab.
Vitamin B6 daily intake 41, 72 tab.
nutritional adequacy 41 dietary sources 41, 235 tab.
Vitamin C daily intake 35, 36 fig., 70 tab.
nutritional adequacy 35, 70 tab. dietary sources 35–6 fig., 89 tab. estimated requirements 213 tab. key results 5
Vitamin E daily intake 37, 38 fig., 70 tab.
nutritional adequacy 37 dietary sources 37–8 fig., 90 tab. key results 5
W Waist circumference
see Body size Walking
see Physical activity Watercress
see Silverbeet, spinach, puha & watercress
Weight see Body size see also Obesity
Wilson, Noela v–vii
Y Yoghurt
see Dairy products
Z Zinc
blood sampling 218 daily intake 53, 54 fig., 74 tab.
nutritional adequacy 53–4 fig. , 74 tab.
deficiency definition 218
dietary sources 54–5 fig., 94 tab. estimated requirements 213 tab. key results 6 serum levels 180, 181 fig., 187 tab.
key results 173
NZ Food NZ Children 267