oecd mcci project 2-d core concrete interaction (cci ... · cci-3 test data report-thermalhydraulic...
TRANSCRIPT
OECD/MCCI-2005-TR04
OECD MCCI Project
2-D Core Concrete Interaction (CCI) Tests:
CCI-3 Test Data Report-Thermalhydraulic Results
Rev. 0 October 15, 2005
by:
M. T. Farmer, S. Lomperski, D. J. Kilsdonk, and R. W. Aeschlimann Nuclear Engineering Division Argonne National Laboratory
9700 S. Cass Avenue Argonne, IL 60439 USA
S. Basu
Project Manager U.S. Nuclear Regulatory Commission
i
Table of Contents Page
1.0 INTRODUCTION..................................................................................................................1
2.0 FACILITY DESCRIPTION .................................................................................................3
2.1 Test Apparatus .............................................................................................................3
2.2 Water Supply System...................................................................................................12
2.3 Quench System ............................................................................................................13
2.4 Test Section Pressure Relief System............................................................................15
2.5 Off Gas System............................................................................................................15
2.6 Cover Gas System........................................................................................................16
2.7 Power Supply ...............................................................................................................18
2.8 Concrete Sidewalls and Basemat .................................................................................18
2.9 Corium Composition....................................................................................................19
2.10 Instrumentation and Data Acquisition .........................................................................20
3.0 TEST PROCEDURES...........................................................................................................28
3.1 Pretest Operations .........................................................................................................28
3.2 Test Operations .............................................................................................................30
4.0 TEST RESULTS ....................................................................................................................35
4.1 Electric Power...............................................................................................................35
4.2 Melt Temperatures ........................................................................................................37
4.3 Concrete Basemat and Sidewall Ablation Rates...........................................................41
4.4 Test Section Water Inlet Conditions .............................................................................45
4.5 Crust Lance Data............................................................................................................48
4.6 Corium Quench Rate......................................................................................................50
4.7 Electrode Current Monitoring System Data .................................................................51
5.0 REFERENCES.......................................................................................................................52
APPENDIX A: Data Acquisition System Channel Assignments.................................................53
APPENDIX B: Test Data ................................................................................................................66
ii
List of Figures Figure Page
2-1 Key Elements of the CCI-3 Test Apparatus ..........................................................................4
2-2 Overview Photograph of CCI Test Facility...........................................................................4
2-3 Details of the CCI-3 Test Section..........................................................................................5
2-4 Top View of Lower Test Section ..........................................................................................5
2-5 Side View of Lower Test Section Showing Inert MgO Sidewall Sections ...........................6
2-6 Side View of Lower Test Section Showing Concrete Sidewall Sections..............................6
2-7 Photograph Showing Lower Section Sidewall Components after Fabrication .....................7
2-8 Illustration of the CCI-3 Thermite Powder Loading Scheme................................................8
2-9 Photograph Showing Electrodes Installed in Clamps............................................................9
2-10 Details of the Top Test Section Showing Water Weirs.........................................................9
2-11 Illustration of CCI-3 Crust Lance Assembly Installed in Test Section .................................10
2-12 Details of Crust Lance Loading Device ................................................................................11
2-13 Illustration of CCI-3 Test Section Mounted on ZPR-9 Reactor Bed ....................................11
2-14 Illustration of Test Section Clamping Bars ...........................................................................12
2-15 Test Section Water Supply System .......................................................................................13
2-16 CCI-3 Quench and Overflow Tanks......................................................................................14
2-17 CCI-3 Spray Tank System.....................................................................................................14
2-18 CCI-3 Test Section Pressure Relief System ..........................................................................16
2-19 CCI-3 Off Gas System...........................................................................................................17
2-20 CCI-3 Cover Gas System ......................................................................................................17
2-21 Data Acquisition System Setup for CCI-3 ............................................................................21
2-22 Plan View of Basemat Instrumentation Layout (dimensions are in cm)...............................22
2-23 Elevation View of Basemat Type C Thermocouple Locations .............................................22
2-24 CCI-3 Test Section Sidewall Instrumentation (View from West).........................................23
2-25 Thermocouple Arrays Installed in Basemat Concrete Form .................................................24
2-26 CCI-3 Test Section Sidewall Instrumentation (View from South)........................................24
2-27 CCI-3 Test Section Pressure Transducer Layout ..................................................................25
2-28 Illustration of CCI-3 Electrode Current Monitoring System Layout ...................................27

iii
List of Figures (Contd.) Figure Page
3-1 Illustration of Thermite Sample Train Installed in Test Section ...........................................29
3-2 Voltage Reading across Thermite Igniter Shunt....................................................................33
3-3 Bulk Melt Temperature Data Over the First 5 Minutes of the Interaction ............................34
4-1 Power Supply Voltage ...........................................................................................................35
4-2 Power Supply Current ...........................................................................................................36
4-3 Total DEH Input Power.........................................................................................................36
4-4 Melt Temperature Data from Basemat Type C “WCL” Array .............................................37
4-5 Melt Temperature Data from Basemat Type C “WNW” Array............................................38
4-6 Melt Temperature Data from Basemat Type C “WNE” Array .............................................38
4-7 Melt Temperature Data from Basemat Type C “WSE” Array..............................................39
4-8 Melt Temperature Data from Basemat Type C “WSW” Array.............................................39
4-9 Melt Temperature Data from North Sidewall Type C “NW” Array .....................................40
4-10 Melt Temperature Data From North Sidewall Type C “SW” Array.....................................40
4-11 Data From Selected Melt Temperature Thermocouples........................................................41
4-12 Thermal Response of the Concrete Basemat at the Centerline (“A” Array) .........................42
4-13 North Concrete Sidewall Thermal Response at +10.0 cm (“SWI” Array)............................42
4-14 South Concrete Sidewall Thermal Response at +10.0 cm (“SWJ” Array) ...........................43
4-15 Basemat Axial Ablation Front Location................................................................................43
4-16 North Sidewall Lateral Ablation Front Location...................................................................44
4-17 South Sidewall Lateral Ablation Front Location...................................................................44
4-18 Maximum Axial and Lateral Ablation Depths Versus Time.................................................45
4-19 Cavity Erosion Profile Based on TC Data and Limited Posttest Exams ...............................46
4-20 Test Section Water Inlet and Quench Tank Coil Water Flow Rates .....................................47
4-21 Water Supply Tank Water Volume .......................................................................................47
4-22 Water Head Over Melt ..........................................................................................................48
4-23 Load Force Exerted on Crust vs. Time..................................................................................49
4-24 Lance Tip Elevation over Initial Concrete Surface ...............................................................49
4-25 Quench System Tank Water Volume Data............................................................................50
iv
List of Figures (Contd.) Figure Page
B-1 Compensator Temperature, Channels B01-B49 and B50-B99..............................................67
B-2 Basemat Type C “WCL” Array Data.....................................................................................67
B-3 Basemat Type C “WNW” Array Data ...................................................................................68
B-4 Basemat Type C “WNE” Array Data ....................................................................................68
B-5 Basemat Type C “WSE” Array Data .....................................................................................69
B-6 Basemat Type C “WSW” Array Data....................................................................................69
B-7 North Sidewall Type C “NW” Array Data ............................................................................70
B-8 South Sidewall Type C “WS” Array Data.............................................................................70
B-9 Basemat Type K “A” Array Data ..........................................................................................71
B-10 Basemat Type K “B” Array Data...........................................................................................71
B-11 Basemat Type K “C” Array Data...........................................................................................72
B-12 Basemat Type K “D” Array Data ..........................................................................................72
B-13 Basemat Type K “E” Array Data...........................................................................................73
B-14 North Sidewall Type K “SWA” Array Data..........................................................................73
B-15 South Sidewall Type K “SWB” Array Data ..........................................................................74
B-16 North Sidewall Type K “SWC” Array Data .........................................................................74
B-17 South Sidewall Type K “SWD” Array Data..........................................................................75
B-18 North Sidewall Type K “SWE” Array Data ..........................................................................75
B-19 South Sidewall Type K “SWF” Array Data ..........................................................................76
B-20 North Sidewall Type K “SWG” Array Data..........................................................................76
B-21 South Sidewall Type K “SWH” Array Data..........................................................................77
B-22 North Sidewall Type K “SWI” Array Data ...........................................................................77
B-23 South Sidewall Type K “SWJ” Array Data ...........................................................................78
B-24 North Sidewall Type K “SWK” Array Data..........................................................................78
B-25 South Sidewall Type K “SWL” Array Data ..........................................................................79
B-26 North Sidewall Type K “SWM” Array Data .........................................................................79
B-27 South Sidewall Type K “SWN” Array Data..........................................................................80
B-28 Thermocouple Compensator Data for Channels Q01-Q49 and Q50-Q99.............................80
v
List of Figures (Contd.) Figure Page
B-29 Test Section Sidewall Heat Loss Data at -15.0 cm Elevation................................................81
B-30 Test Section Sidewall Heat Loss Data at -5.0 cm Elevation..................................................81
B-31 Test Section Sidewall Heat Loss Data at +5.0 cm Elevation.................................................82
B-32 Test Section Sidewall Heat Loss Data at +15.0 cm Elevation...............................................82
B-33 Test Section Sidewall Heat Loss Data at +70.0 cm Elevation...............................................83
B-34 Test Section Sidewall Heat Loss Data at +84.1 cm Elevation...............................................83
B-35 Test Section Sidewall Heat Loss Data at +94.7 cm Elevation...............................................84
B-36 Test Section Sidewall Heat Loss Data at +124.9 cm Elevation.............................................84
B-37 Test Section Sidewall Heat Loss Data at +151.3 cm Elevation.............................................85
B-38 Test Section Mainline Thermocouple Data ...........................................................................85
B-39 Test Section Plenum and Insertable Water Level Probe Thermocouple Data.......................86
B-40 Quench Tank Water Volume, Coil Inlet, and Coil Outlet Temperature Data .......................86
B-41 Miscellaneous Temperatures in Water Supply, Quench, and Off Gas Systems....................87
B-42 Crust Lance Load Cell Data...................................................................................................87
B-43 Lance Position Indicator Data................................................................................................88
B-44 Total Power Supply Power ....................................................................................................88
B-45 Power Supply Voltage Data...................................................................................................89
B-46 Total Power Supply Current Data..........................................................................................89
B-47 Power Supply Current Transformer Data ..............................................................................90
B-48 Hall Effect Meter Data...........................................................................................................90
B-49 Voltage across Igniter Shunt..................................................................................................91
B-50 Pressure Transducer Power Supply Voltages ........................................................................91
B-51 Water Supply, Overflow, and Spray Tank Water Volume Data............................................92
B-52 Quench Tank Water Volume Data.........................................................................................92
B-53 Supply and Quench System Tank Head Data (Backup) ........................................................93
B-54 Water Head Over Melt...........................................................................................................93
B-55 Water Supply Tank Pressure..................................................................................................94
B-56 Test Section Pressure .............................................................................................................94
vi
List of Figures (Contd.) Figure Page
B-57 Quench/Overflow and Spray Tank Plenum Differential Pressures .......................................95
B-58 Water Flow Rates...................................................................................................................95
B-59 Test Section Helium Cover Gas Flow Rates..........................................................................96
B-60 Final Off Gas Flow Rate ........................................................................................................96
vii
List of Tables
Table Page
1-1 Specifications for CCI-3.........................................................................................................2
2-1 Chemical Composition of Castable MgO...............................................................................7
2-2 Engineering Composition of CCI-3 Siliceous Concrete Basemat and Sidewalls ..................18
2-3 Estimated Chemical Composition of Siliceous Concrete.......................................................19
2-4 Post-Reaction Bulk Composition for CCI-3 Thermite ...........................................................20
2-5 Detailed Pre- and Post-Reaction Compositions for CCI-3 Thermite .....................................20
3-1 CCI-3 Event Sequence (times relative to melt contact with basemat) ...................................32
A-1 "Basemat" DAS Channel Assignments for CCI-3 ...................................................................54
A-2 "Power" DAS Channel Assignments for CCI-3.......................................................................58
A-3 "Quench" DAS Channel Assignments for CCI-3 ....................................................................62
1
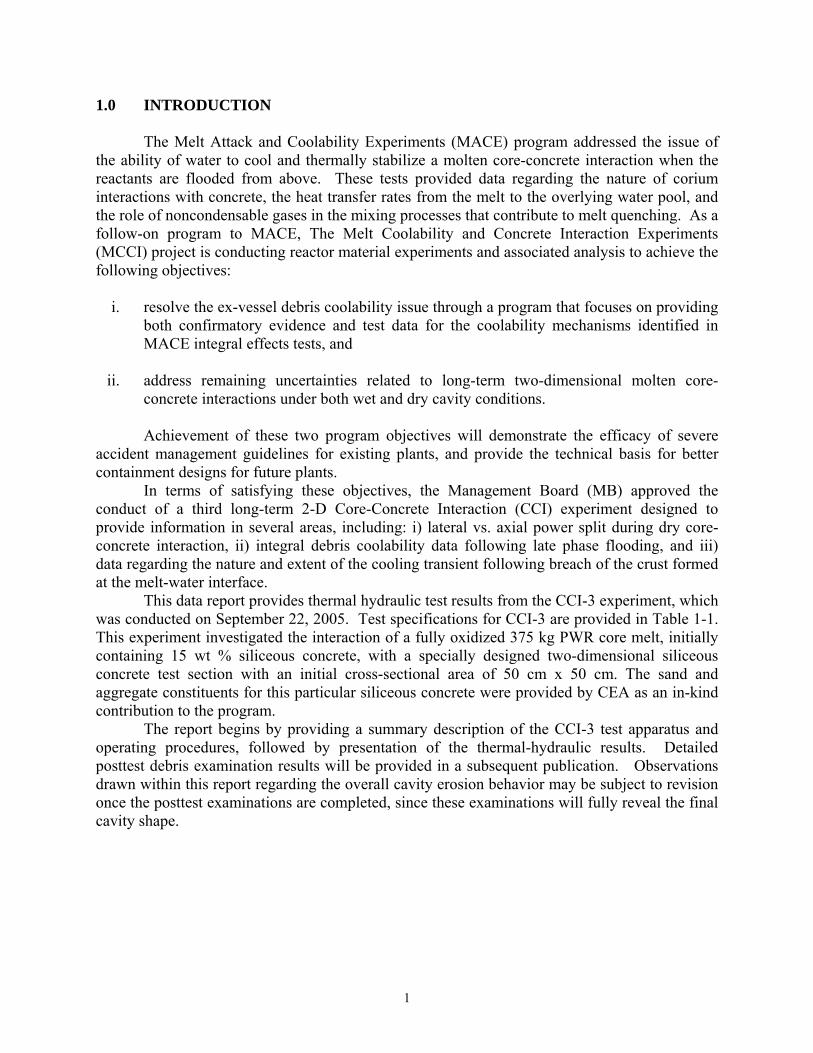
1.0 INTRODUCTION The Melt Attack and Coolability Experiments (MACE) program addressed the issue of the ability of water to cool and thermally stabilize a molten core-concrete interaction when the reactants are flooded from above. These tests provided data regarding the nature of corium interactions with concrete, the heat transfer rates from the melt to the overlying water pool, and the role of noncondensable gases in the mixing processes that contribute to melt quenching. As a follow-on program to MACE, The Melt Coolability and Concrete Interaction Experiments (MCCI) project is conducting reactor material experiments and associated analysis to achieve the following objectives:
i. resolve the ex-vessel debris coolability issue through a program that focuses on providing both confirmatory evidence and test data for the coolability mechanisms identified in MACE integral effects tests, and
ii. address remaining uncertainties related to long-term two-dimensional molten core-concrete interactions under both wet and dry cavity conditions. Achievement of these two program objectives will demonstrate the efficacy of severe
accident management guidelines for existing plants, and provide the technical basis for better containment designs for future plants.
In terms of satisfying these objectives, the Management Board (MB) approved the conduct of a third long-term 2-D Core-Concrete Interaction (CCI) experiment designed to provide information in several areas, including: i) lateral vs. axial power split during dry core-concrete interaction, ii) integral debris coolability data following late phase flooding, and iii) data regarding the nature and extent of the cooling transient following breach of the crust formed at the melt-water interface.
This data report provides thermal hydraulic test results from the CCI-3 experiment, which was conducted on September 22, 2005. Test specifications for CCI-3 are provided in Table 1-1. This experiment investigated the interaction of a fully oxidized 375 kg PWR core melt, initially containing 15 wt % siliceous concrete, with a specially designed two-dimensional siliceous concrete test section with an initial cross-sectional area of 50 cm x 50 cm. The sand and aggregate constituents for this particular siliceous concrete were provided by CEA as an in-kind contribution to the program.
The report begins by providing a summary description of the CCI-3 test apparatus and operating procedures, followed by presentation of the thermal-hydraulic results. Detailed posttest debris examination results will be provided in a subsequent publication. Observations drawn within this report regarding the overall cavity erosion behavior may be subject to revision once the posttest examinations are completed, since these examinations will fully reveal the final cavity shape.

2
Table 1-1. Specifications for CCI-3.
aBased on an assumed melt density of 6500 kg/m3
Parameter Specification Corium 100 % oxidized PWR with 15 wt % siliceous
concrete Concrete type Siliceous concrete Initial basemat dimension 50 cm x 50 cm Initial melt mass (deptha) 375 kg (25 cm) Test section sidewall construction Nonelectrode walls: concrete
Electrode walls: MgO protected by UO2 pellet layer. Lateral ablation limit 35 cm Axial ablation limit 35 cm System operating pressure Atmospheric Melt formation technique (timescale) Chemical reaction (~30 seconds) Initial melt temperature 1950 ºC Melt heating technique Direct Electrical (Joule) Heating Power supply operation prior to water addition
Constant power at 120 kW
Criteria for water addition 1) 5.5 hours of operation with DEH input, or 2) lateral or axial ablation reaches 30 cm
Inlet water temperature 20 ºC Inlet water flow rate (2 MW/m2 equivalent quench rate)
2 liters/second
Sustained water depth over melt 50 ± 5 cm Power supply operation after water addition
Constant voltage
Test termination criteria 1) Melt temperature falls below concrete solidus, 2) concrete ablation is arrested, or 3) maximum lateral/axial ablation limit of 35 cm is reached.

3
2.0 FACILITY DESCRIPTION
The CCI test facility consists of a test apparatus, a power supply for Direct Electrical Heating (DEH) of the corium, a water supply system, two steam condensation (quench) tanks, an off gas system to filter and vent the off-gases, and a Data Acquisition System (DAS). A schematic illustration of the facility is provided in Figure 2-1, while an overview photograph showing key elements of the facility is provided in Figure 2-2. Test specifications for CCI-3 are summarized in Table 1-1. With the exception of the DAS, the entire system is housed in an explosion-rated containment cell. DEH input power, water supply, and gas flows are remotely controlled from the experimenter’s console located outside the containment. The various elements of the facility are described in sequence below. 2.1 Test Apparatus
The apparatus for containment of the core material consists of a test section that is ~ 3.4 m tall with a square internal cross-section which initially measures 50 cm x 50 cm. The principal components of the apparatus, shown in Figure 2-3, consist of a bottom support plate, three sidewall sections, and an upper enclosure lid. The lower sidewall section contains the corium melt and structural concrete components that are intended to undergo ablation. A top view of the lower section is shown in Figure 2-4, while cross-sectional views of the electrode and non-electrode sidewalls are provided in Figures 2-5 and 2-6, respectively. The concrete basemat is initially 55 cm deep, so that up to 35 cm of axial ablation can safely be accommodated with this design. As shown in Figure 2-4, the electrode sidewalls of the lower section are fabricated from castable MgOa refractory, while the non-electrode sidewalls are fabricated from siliceous concrete. A photograph showing typical components after fabrication is provided in Figure 2-7. The middle sidewall section is fabricated from a locally obtained refractory concrete rated for service at up to 1400 °C. The upper section and lid are made from locally obtained limestone-common sand concrete. The chemical composition of the cast material used in the lower test section fabrication is shown in Table 2-1. The composition of the siliceous concrete basemat and sidewalls is provided later in this section. The concrete and MgO are contained within flanged 11 gauge steel forms that secure the lower section to the balance of the existing test section components with an aluminum transition plate. The lower section is fabricated with vertical, flanged casting seams between the MgO and concrete so that the sidewalls can be disassembled to reveal the solidified corium following the test. The MgO sections are intended to be reusable, while the concrete sidewall remnants are disposed of as radioactive waste.
A layer of crushed UO2 pellets is used to protect the interior surface of the MgO sidewalls against thermo-chemical attack by the corium. In the event that the UO2 layer does not provide adequate protection, 3.2 mm thick tungsten back-up plates are embedded in these sidewalls as a final barrier to terminate sidewall attack. The plates are instrumented to provide an indication of corium contact with either of these two surfaces during the test. As illustrated in Figure 2-5, multi-junction Type C thermocouple assemblies are also cast within the MgO sidewalls. These thermocouples allow the time-dependent heat loss from the melt to be estimated from the local temperature gradient and the thermal conductivity of the MgO through standard inverse heat conduction techniques. a Periclase Permanente 98-AF; from National Refractories and Minerals, Columbiana, OH.

4
P
DRAIN OR FILL
PUMP
TEST SECTION QUENCH TANK
FMTC
WATER IN WATEROUT
TC
CORIUM
CONCRETE
BY-PASS LINE
WATER SPRAY
BELLOWS
FILTERS
6 INCH LINE
175 GAL
320 GAL
(5)
BELLOWS
(2)
TC
FMCELLEXHAUST
TC
P
TC
TC
TC
LS
LS
DRAWING: CCI3 TEST APPARATUSDRAWING NO.: MCCI636DRAWN BY: D. KILSDONKDATE: 10/3/05FILE: CCI3_TA.DWG(AC112)
SPRAY TANK
Figure 2-1. Key Elements of the CCI-3 Test Apparatus.
Figure 2-2. Overview Photograph of CCI Test Facility.

5
47.0" [119.38 cm]
1.00" [2.54 cm]
8.0" [20.32 cm]
-50
-45
-35
-40
-30
-20
-25
-15
-5
-10
0
+ 10
+ 5
+ 15
+ 75
+ 45
+ 30
+ 20
+ 25
+ 40
+ 35
+ 60
+ 50
+ 55
+ 70
+ 65
+ 80
+ 85cm
-55
BASEMAT
55 cm
ALUMINUM TRANSITION PLATE (1" THICK)
NORTH SOUTHVIEW FORM WESTAT CENTER LINE
IBEAM
ELECTRODE CLAMP
TYPE C TC IN TUNGSTEN THERMOWELL
TYPE K TC'S
SWK
SWIWNSWG
SWE
SWC
SWA
SWL
SWJWSSWH
SWF
SWD
SWB
36.0" [91.44 cm]
10.0" [25.35 cm]
DRAWING: CCI3 TEST SECTIONVIDEO CAMERA (WEST VIEW) DRAWING NO.: MCCI637DRAWN BY: D. KILSDONK 2-4746DATE: 10/3/05 FILE: CCI3_TSVCWV.DWG(AC112)
TWO SPARKLERS
20.0" [50.78 cm]
36.0" [91.44 cm]
MELT SURFACEVIDEO CAMERA
12°
WATER WEIR
151.3SWHL-25 (0.0)SWHL-26 (2.0)
94.7SWHL-21 (0.0)SWHL-22 (2.0)
70.0SWHL-17 (0.0)SWHL-18 (2.0)
REFRACTORY CONCRETE50 cm X 50 cm TEST SECTION
TYPE K TC'S
NOTE:TC ELEVATIONS (DISTANCE FROM TOP OF BASEMAT) AND TC LOCATIONS (DISTANCE FROM INSIDE WALL) ARE IN CENTIMETERS.
ALL TC'S ARE LOCATED ON THE CENTERLINE OF THE SIDE.
SWM SWN
Figure 2-3. Details of the CCI-3 Test Section.
NORTH
A
TOP VIEW
DRAWING: CCI3 BOTTOM SECTION(TOP VIEW) DRAWING NO.: MCCI616DRAWN BY: D. KILSDONK 2-4746DATE: 4/18/05 FILE: CCI3_BSTV.DWG(AC110)
68.50" [174.0cm]
45.25" [114.9cm]
CRUSHED PELLETS
TUNGSTEN BACKUP PLATES
TUNGSTEN ELECTRODES(9.5 mm OD)
LIFTING LUGS
BASEMAT(50 cm X 50 cm)
CONCRETE SIDEWALLS (2)56.2 cm THICK, MAXIMUM ABLATIION DEPTH = 35 cm
MgO REFRACTORY SIDEWALLS
B
B
50 cm
50 cm
19.75" [50.2cm]
22.13" [56.2cm]
A
ELECTRODE SUPPORT ROD (9.5 mm OD TUNGSTEN)
Figure 2-4. Top View of Lower Test Section.

6
DRAWING: CCI3 BOTTOM SECTION(SOUTH VIEW) DRAWING NO.: MCCI617DRAWN BY: D. KILSDONK 2-4746DATE: 4/18/05 FILE: CCI3_BSSV.DWG(AC110)
VIEW FROM SOUTHWEST EAST
0
-30
-45-50
-40
-35
-15
-25
-20
-10
-5
+ 15
+ 5
+ 10
+ 25
+ 20
+ 35
cm
+ 30
+ 65
+ 60
+ 55
+ 50
+ 45
+ 40
+ 70
+ 75
+ 80
+ 85
AT CENTER LINE
INITIAL POWDER HEIGHT
COLLAPSED MELTHEIGHT
36.0" [91.4cm]
ALUMINUM TRANSITION PLATE (1" THICK)
EXISTING MACE 50 cm X 50 cm MgO TEST SECTION
TUNGSTEN ELECTRODES
47.0" [119.4cm]
MgO REFRACTORY SIDEWALLS
55 cm
25 cm
BASEMAT
TUNGSTEN BACKUP PLATES
SWHL 1-4
SWHL 9-12
SWHL 5-8
SWHL 13-16
MgO BRICKS
CRUSHED PELLETS
MgO BRICKS
Figure 2-5. Side View of Lower Test Section Showing Inert MgO Sidewall Sections.
DRAWING: CCI3 BOTTOM SECTION(WEST VIEW) DRAWING NO.: MCCI638DRAWN BY: D. KILSDONK 2-4746DATE: 10/3/05 FILE: CCI3_BSWVC.DWG(AC112)
47.0"
1.00"
8.0"
-50
-45
-35
-40
-30
-20
-25
-15
-5
-10
0
+ 10
+ 5
+ 15
+ 75
+ 45
+ 30
+ 20
+ 25
+ 40
+ 35
+ 60
+ 50
+ 55
+ 70
+ 65
+ 80
+ 85cm
-55
BASEMAT
55 cm
TUNGSTEN ELECTRODES
CONCRETE SIDEWALLS
INITIAL POWDER HEIGHT
ALUMINUM TRANSITION PLATE (1" THICK)
EXISTING MACE 50 cm X 50 cm MgO TEST SECTION
NORTH SOUTHVIEW FORM WESTAT CENTER LINE
IBEAM
ELECTRODE CLAMP
TYPE C TC IN TUNGSTEN THERMOWELL
TYPE K TC'S
MgO INSULATION
SWK
SWIWNSWG
SWE
SWC
SWA
SWL
SWJWSSWH
SWF
SWD
SWB
TYPE K TC'S
SWM SWN
Figure 2-6. Side View of Lower Test Section Showing Concrete Sidewall Sections.

7
Figure 2-7. Photograph Showing Lower Section Sidewall Components After Fabrication.
Table 2-1. Chemical Composition of Castable MgO.
Mass % Element (Oxide Form) Element Oxide
Al (Al2O3) 0.24 0.45 B (B2O3) 0.12 0.39 Ca (CaO) 0.58 0.81 Fe (Fe2O3) 0.14 0.20 Mg (MgO) 58.4 96.8 Mn (MnO) 0.038 0.049 Si (SiO2) 0.24 0.51 Ti (TiO2) 0.002 0.003 Zr (ZrO2) 0.038 0.023
Total 99.24
Melt pool generation in this test is achieved through an exothermic “thermite” chemical reaction that produces the target initial melt mass over a timescale of ~ 30 seconds. A depiction of the powder loading scheme is provided in Figure 2-8. As is evident from the figure, two iron/alumina sparklers, wrapped with nichrome starter wire, are positioned a few centimeters below the top of the corium charge near the centerline of the test section. One of these sparklers is used to initiate the thermite reaction by heating the neighboring powder to the ignition point. (The thermite composition is described in detail later in this section). The second sparkler is provided as a backup in case the first fails to ignite the material.
After the chemical reaction, DEH is supplied to the melt to simulate decay heat through two banks of tungsten electrodes that line the interior surfaces of the opposing MgO sidewalls. As illustrated in Figures 2-5 and 2-6, the copper electrode clamps are attached to a 2.5 cm thick
8
aluminum bottom support plate that forms the foundation for the apparatus. A total of sixty three 91 cm long, 0.95 cm diameter tungsten electrodes are attached to each electrode clamp at a pitch of 1.9 cm. A photograph showing the electrodes after installation in the clamps but prior to placement of the lower section sidewalls is provided in Figure 2-9. The clamps are attached with water-cooled buss bars to a 560 kW AC power supply. As shown in Figure 2-4, each electrode bank is vertically restrained by a horizontally mounted, 0.95 cm diameter tungsten rod which is recessed into the concrete sidewalls near the tops of the electrodes. These restraints are provided to prevent slumping of the electrodes away from the sidewalls, as occurred in the MACE Scoping Test1.
As illustrated in Figure 2-4, the electrodes span a total width of 120 cm on each sidewall of the lower section. At the start of the experiment, the electrical current is drawn through the center 50 cm lateral span of electrodes that are in direct contact with the melt. As the test progresses and the concrete sidewalls erode, additional electrodes are exposed to the corium. Electrical current is drawn through these newly exposed heating elements, thereby maintaining a uniform heating pattern in the melt over the course of the experiment. Given the overall electrode span of 120 cm, up to 35 cm of lateral ablation can be accommodated in this design while maintaining uniform heat input. As shown in Figure 2-4, the concrete sidewalls are 56 cm thick, which provides ~ 20 cm of remaining sidewall thickness once the 35 cm lateral ablation limit has been reached.
Water is introduced into the test section through weirs located in the upper sidewall section just beneath the lid of the apparatus. The layout for the weirs is shown in Figure 2-10. A total of nine penetrations are cast into the upper lid of the test section. Of these penetrations, six were utilized for Test CCI-3: one stationary lid video camera view port, a port for an insertable water level depth probe, a 15 cm main steam line to the quench system, two light ports, and a port for an insertable crust lance. An illustration of the stationary lid camera installed in the test section is shown in Figure 2-3.
55 cm
BASEMAT
VIEW FROM NORTHAT CENTER LINE
WESTEAST
TUNGSTEN ELECTRODESAT + 25 cm ELEVATION
CRUSHED PELLETS
MgO BRICKS
TUNGSTEN BACKUP PLATES
MgO REFRACTORY SIDEWALLS
MgO BRICKSALUMINUM TRANSITION PLATE (1" THICK)
DRAWING: CCI3 BOTTOM SECTIONINERTING SYSTEM (NORTH VIEW) DRAWING NO.: MCCI639DRAWN BY: D. KILSDONK 2-4746DATE: 10/03/05 FILE: CCI3_BSIS.DWG(AC112)
PT-6
PT-4
55 cm DEEP SILICEOUS BASEMAT.MAX ABLATION DEPTH = 35.5 cm.1/8" THICK (3 mm) ZrO2 FELT ON TOP SURFACEAl/SARAN FILM OVER TOP AND ALL EXPOSED SURFACES
INITIAL POWDER HEIGHTFOR 400 kg THERMITEIN A SINGLE Al/SARAN BAG
NICROME STARTER WIREWITH SPARKLER
ARGON
Figure 2-8. Illustration of the CCI-3 Thermite Powder Loading Scheme.
9
Figure 2-9. Photograph Showing Electrodes Installed in Clamps.
NORTH
TOP VIEW
5
NOTE: ALL DIMENSIONS ARE INCHES
4.875
40.0
CONTINUE 4.875 INCH SPACINGAS SHOWN ON EAST AND WESTSIDES ONLY
CL
CL
CL
20.0"
18.75"
A
VIEW A - A
5.0"
5.0"
11.25"
11.25"
10.0" 10.0"
UNISTRUT
36
APPROX. AMT. OF CONCRETE: 26.6 CU. FT.APPROX. WEIGHT: 4000 LBS. (@150 LBS./CU. FT.)
44.0
45.25
A
41.25
CONTINUE 5 INCH SPACINGAS SHOWN ON NORTH ANDSOUTH SIDES ONLY
STEEL ON OUTSIDE
WEIR
1 INCH PIPE
CONCRETE
DRAWING: CCI3 TOPSECTION FILLEDDRAWING NO.: MCCI640DRAWN BY: D. KILSDONKDATE: 10/3/05 FILE: CCI3_TSF.DWG(AC112)
Figure 2-10. Details of the Top Test Section Showing Water Weirs.

10
The insertable crust lance is designed to fail the crust formed at the melt/water interface in order to obtain data on the transient crust breach cooling mechanism. An illustration of the crust lance installed in the test section is shown in Figure 2-11, while details of the lance loading device are provided in Figure 2-12. The lance is made from 2.54 cm diameter, 304 stainless steel rod with a pointed tip. The lance contains an electrical isolation hub so that there is no need to terminate DEH power input during the crust loading procedure. As shown in Figure 2-12, the driving force for the lance is simply a 450 kg dead weight that is remotely lowered with the crane during the test. The lance assembly is equipped with a load cell and displacement transducer to record load vs. position data as the force is applied to the crust. The test section components are bolted together on the stationary half of the ZPR-9 reactor bed. Zirconia felt and silicon gasket material are used to seal the flanges. An illustration is provided in Figure 2-13. Installation and torquing of test section flange bolts is performed according to an approved procedure to ensure uniform preload on the flange surfaces. Additional reinforcement of each test section component is provided by clamping bars installed in both the North-South and East-West directions. A diagram illustrating the complete flange bolt and clamping bar layout is provided in Figure 2-14.
DRAWING: CCI3 IN-SITU CRUSTSTRENGTH MEASUREMENT (SOUTH VIEW) DRAWING NO.: MCCI641DRAWN BY: D. KILSDONK 2-4746DATE: 10/3/05 FILE: CCI3_ISCSM.DWG(AC112)
VIEW FROM SOUTHWEST EAST
0
-30
-45-50
-40
-35
-15
-25
-20
-10
-5
+ 15
+ 5
+ 10
+ 25
+ 20
+ 35
cm
+ 30
+ 65
+ 60
+ 55
+ 50
+ 45
+ 40
+ 70
+ 75
+ 80
+ 85
AT CENTER LINE
INITIAL POWDER HEIGHT
COLLAPSED MELTHEIGHT
36.0" [91.4cm]
ALUMINUM TRANSITION PLATE (1" THICK)
EXISTING MACE 50 cm X 50 cm MgO TEST SECTION
TUNGSTEN ELECTRODES
47.0" [119.4cm]
MgO REFRACTORY SIDEWALLS
55 cm
25 cm
BASEMAT
TUNGSTEN BACKUP PLATES
SWHL 1-4
SWHL 9-12
SWHL 5-8
SWHL 13-16
MgO BRICKS
CRUSHED PELLETS
MgO BRICKS
CCI3 IN-SITU CRUSTSTRENGTH MEASUREMENT
INSULATOR
PROBE SHIELD
SEAL
LOAD CELL
POSITIONFULL OUT
POSITIONFULL IN
38.25" [97.03 cm]
80.88" [205.44 cm]
38.25" [97.16 cm]
13.25" [33.66 cm]
51.50" [130.81 cm]
18.50" [47.03 cm]
32.00" [81.28 cm]
96.63" [245.51 cm]
40.00" [101.60 cm]
PROBE WEIGHTLOAD: 1000 lbs. (454.5 kg)
Figure 2-11. Illustration of CCI-3 Crust Lance Assembly Installed in Test Section.

11
DRAWING: CCI3 PROBE WEIGHT ASSEMBLYFOR CRUST STRENGTH MEASUREMENTS DRAWING NO.: MCCI642DRAWN BY: D. KILSDONK 2-4746DATE: 10/3/05 FILE: CCI3_PROBE_WEIGHT.DWG(AC112)
EYE NUT (REMOVEABLE)1"-8, 10,000 LBS, $23.36
1"-8 THREADED ROD
LOAD 1000 LBS.16 PIECES (12" OD X 2" THICK) = 1008 LBS
12" ROUND STEEL BAR = 380 LBS/FT.1000 LBS/380 LBS = 2.63 FT. = 32"380 LBS/12 INCHES = 31.66 LBS./INCH12" OD X 2" THICK = 63 LBS.
LOAD CELL10,000 LBS
FEET (4) 2" OD STEEL BAR
2.00"
2.00"
6.50"
38.50"
38.00"
Figure 2-12. Details of Crust Lance Loading Device.
(VIEW FROM NORTH)
SHROUD
ACCESS PORT
ML-2
ML-1
DRAWING: CCI3 MAIN STEAM LINETO QUENCH TANK - 6" LINEDRAWING NO.: MCCI643DRAWN BY: D. KILSDONK 2-4746DATE: 10/3/05 FILE: CCI3_MSL1.DWG(112)
PRESSURE RELIEF LINE TO LARGE QUENCH TANK
ML-3
ML-4
TO SPRAY TANK
QUENCH TANK
TEST SECTION
FLOOR
25 cmCOLLAPSED MELTHEIGHT
BASEMAT
WESTEAST
55 cm
Figure 2-13. Illustration of CCI-3 Test Section Mounted on ZPR-9 Reactor Bed.

12
DRAWING: CCI3 TEST SECTIONOUTSIDE W/ CLAMP BARS (SOUTH VIEW)DRAWING NO.: MCCI644DRAWN BY: D. KILSDONK 2-4746DATE: 10/3/05 FILE: CCI3_TSCBSV.DWG(AC112)
36.0"
36.0"
10.0"
BOTTOM SECTIONMgO10,000 lbs.4,545 kg.
MIDDLE SECTIONMgO5000 lbs.2275 kg.
TOP SECTIONCONCRETE4000 lbs.1820 kg.
LIDCONCRETE 1500 lbs.680 kg.
BASEMATCONCRETE736 lbs.335 kg.
CORIUM880 lbs.400 kg.
APPROX. TOTAL WT. OF TEST SECTION = 22,000 lbs.
VIEW FROM SOUTHWEST EAST
57.25"
139.3" [11.60 FT.]
Figure 2-14. Illustration of Test Section Clamping Bars.
2.2 Water Supply System The water supply system consists of a 1900 l capacity tank connected to the flooding weirs in the north and south sidewalls of the top test section through a valve-controlled supply line that provides water to the test section at a specified flow rate. A schematic illustration of the supply system is provided in Figure 2-15; details of the flooding weirs are shown in Figure 2-10. The supply system flowmeter, pressure transducer, level sensor, and thermocouple instrumentation locations are also shown in Figure 2-15. Water flow through the system is driven by an 80 kPa differential pressure in the supply tank at a nominal flow rate of 120 lpm (2 l/s). The inlet water flow rate of 120 lpm corresponds to a melt/water heat flux of approximately 20 MW/m2 based on a specific enthalpy of 2.6 MJ/kg for saturated steam at atmospheric pressure, assuming heat transfer occurs through boiling of the overlying coolant. The inlet water flow rate to the test section is monitored with a paddlewheel flowmeter. Both the initial water inventory (125 l) and makeup are provided through pneumatic ball valve RV-1, which is opened as needed at the control console to maintain the water volume inside the test section constant at a target level of 125 ± 13 l (50 ± 5 cm). A redundant supply line, activated by pneumatic ball valve RV-2, is provided in case RV-1 fails to open during the test. A third pneumatic valve, RV-3, is provided in case RV-1 or RV-2 fail in the open position. The test is initiated with valve RV-3 in the open position.
13
NORTH
TOP VIEW
INSIDE ENCLOSURE
TOP TEST SECTION
WATERSUPPLYTANK
500 G(2000 L)
WS-1TC
P
PUMP
LS-1
PRESSURE RELIEFVALVE
MAGNETICFLOAT
RECIRCULATION
DRAIN/FILL
PT-1
RP-1
MV-WS-4
MV-WS-1 MV-WS-2
TV-WS-3
MV-WS-3
PT-2
TRAP
MV-WS-7 MV-WS-8
RV-5
FM-1
MV-WS-9
RV-1
RV-2
TV-WS-1
2" LINE
RV-3TV-WS-2
TO WEIRS
COMPRESSEDAIR
RV-4MV-WS-5
MV-WS-6
TRAP
PRESSUREGAGE
COMPRESSOR(IN PIT)
R1PI-1
RV-14BACKUP SUPPLYLINE FROMOVERFLOW/ SPRAYTANKS
COMPRESSEDAIR (BACKUP)
R12
MV-WS-10
VENTMUFFLER
(UNDER PLATFORM)
MV-WS-11
LEAKAGECOLLECTION/DETECTIONLINE
DRAWING: CCI3 WATER SUPPLY SYSTEMDRAWING NO.: MCCI645DRAWN BY: D. KILSDONKDATE: 10/3/05 FILE: CCI3_WATER.DWG(AC112)
NOT USED
NOT USED
PROCEDURALLYCLOSED
PROCEDURALLYCLOSED
Figure 2-15. Test Section Water Supply System.
Note from Figure 2-15 that the supply line to the test section contains a manual bypass valve downstream of water injection valves RV-1 and RV-2. This valve is vented to a catch pan equipped with an alarmed water detector. During pretest procedures, this valve is left in the open position to divert any water leakage away from the test section. The alarm is intended to notify personnel that a leak is present so that corrective action can be taken. This valve is closed as one of the final steps of pretest operations just prior to evacuation of the cell. 2.3 Quench System The quench system, shown in Figure 2-16 and 2-17, consists of a primary quench tank, a secondary spray tank, and a condensate overflow tank. The quench system flowmeter, pressure transducer, level sensor, and thermocouple instrumentation locations are also shown in these two figures. Steam and concrete decomposition gases pass from the test section through a 16.1 cm ID stainless steel pipe into the 680 l capacity, 60 cm ID primary quench tank. This tank contains an initial water inventory of 250 l. With this amount of water, a pool void fraction of ~ 60% can initially be accommodated before the voided water height reaches the top of the tank. The quench tank is equipped with a 1.9 cm diameter cooling coil to remove heat from steam condensation, thereby maintaining a subcooled state. The water supply to the cooling coil is drawn from the building supply system. The coil water flow rate is throttled to 38 lpm, which corresponds to a heat removal rate of 210 kW assuming a heat capacity of 4200 J/kg•K for water and a temperature rise of 80 °C across the coil. Should the condensate level in the quench tank rise to a level of 560 l, spillover into the adjacent 930 l overflow tank will occur through a 2.5 cm ID pipe. The quench tank and interconnecting piping between the test section and quench tank are insulated to minimize heat losses.

14
QUENCHTANK
ML-4
CEL
L W
ALL
QT-4
QT-1
QT-2
QT-3
LS-2
TOSPRAYTANK
CCI3 QUENCH/ OVERFLOW SYSTEM
MV-QT-2
MV-QT-3MV-QT-1
FROMTESTSECTION
PTPT-8DRAIN/ FILL
930 LITERS(245 GAL)
PASSIVEOVERFLOWTO SPRAYTANK
LS-3
930 LITERS(245 GAL)
PTPT-10
107 CM(42")
107 CM(42")
OVERFLOWTANK # 1
OVERFLOWTANK # 2
MV-OT-2
MV-OT-4
MV-OT-1
MV-OT-5
MV-OT-3
FLOOR LEVEL
DRAWING NO.: MCCI646DRAWN BY: D. KILSDONK
FILE: CCI3_QOFS.DWG (AC112)
DRAWING: CCI3 QUENCH/ OVERFLOW SYSTEM
PUMP
FM
TV-OT-1 RV-6
RV-14CHECKVALVE
TO WATERSUPPLY TANK
TO H O SUPPLY2
RV-15
TO SPRAY TANKRECIRCULATION LINE
STANDPIPE
OT-1
FM-3RP-3
CHECKVALVE
COIL OUTLET
PUMP
QT-5COIL INLET
TV-QT-1
MV-QT-4
RP-2
THROTTLEVALVE
FM-2
FM
MV-QT-5
QT-7
QT-6
PT
PT-9
PRESS.RELIEFVALVENOTSHOWN
CHECKVALVE
LAB RETURN
LAB SUPPLY LINE TO TEST SECTIONMV-OT-6
DATE: 10/3/05
PRESSURE EQUILIBRATION
PRESSURE EQUILIBRATION
PROCEDURALLYCLOSED
NOT USED
QT-C-1
QT-C-2
SIGHTGAGE
OT-C-1
OT-C-2
SIGHTGAGE
NOT USED
QT-3 & QT-4 NOT RECORDED FOR CCI-2
Figure 2-16. CCI-3 Quench and Overflow Tanks.
PUMP
TO OVERFLOWTANK RECIRCULATIONLINE
MV-ST-1
COIL OUTLET
ST-4 ST-5
FMTV-ST-3 FM-4
PUMP
RP-4
MV-ST-7
MV-ST-6
COIL INLET
FROM QUENCHTANK
MV-ST-4
CEL
L W
ALL
RETURN
SUPPLY
MV-ST-5
MV-ST-2
RV-8 TV-ST-1ST-9
RECIRCULATION
RP-5
DRAIN/ FILL
MV-ST-3
SPRAYTANK
ST-1
PT
PT
PT-12
FRO
M P
ASSI
VEO
VERF
LOW
LIN
E O
NO
VERF
LOW
TAN
KS
LS-4
PT-11
FMCHECKVALVEFM-5 TV-ST-2 RV-7 MV-ST-8
MV-ST-9
SUPPLYTANK
DRAIN/ FILLFOR SUPPLY TANK
CK-2
ST-3
OFFGASSYSTEM
6" LINE
OG-1
PRESS.RELIEF
ST-C-1
ST-C-2
FROM FNGCHILLER
CCI3 SPRAY SYSTEM
PROCEDURALLYCLOSED
NOT USED
DRAWING: CCI3 SPRAY SYSTEMDRAWING NO.: MCCI647DRAWN BY: D. KILSDONK 2-4746DATE: 10/3/05FILE: CCI3_SPRAY.DWG(112)
TV-ST-10 TO SSWICS CONDENSATE COLLECTION TANK
Figure 2-17. CCI-3 Spray Tank System.

15
The secondary 1230 l capacity spray tank is connected to the quench tank by a 16.1 cm ID stainless steel pipe. In the event that the steam generation rate overwhelms the primary quench tank, the secondary spray tank serves to condense the remaining steam. This tank contains an initial water inventory of 375 l. With this amount of water, a pool void fraction in excess of 60% can be accommodated before the voided water height reaches the top of the tank. The spray tank and interconnecting piping between the spray and quench tanks is also insulated to minimize heat losses. 2.4 Test Section Pressure Relief System A pressure relief system is provided to prevent over-pressurization and possible failure of the test section. A schematic illustration of the system is shown in Figure 2-18. The system consists of a 16.1 cm vent line from the test section to an auxiliary tank containing a nominal initial water inventory of 400 l. The auxiliary tank has an inside diameter of 1.22 m and a capacity of 4100 l. The tank is open to the atmosphere. The pressure relief line to the tank is equipped with a passive, counter-weighted check valve set to open at a differential pressure of nominally 68 kPa. A rupture diaphragm (68 ± 13.4 kPa differential failure pressure) upstream from the check valve prevents any flow through the line unless the pressure in the test section exceeds the design value of 68 kPa differential. As shown in Figure 2-18, the relief line is also equipped with a 7.5 cm vacuum breaker valve. This valve is provided to prevent water hammer from occurring due to stream condensation should the pressure relief valve open and then reseat after water has been introduced into the test section. The initial 400 l water inventory in the auxiliary tank is provided to cool gases from the test section and to remove aerosols before any noncondensables present in the gas stream pass into the cell atmosphere. The tank is instrumented with a Type K thermocouple to measure water temperature and a differential pressure transducer to measure water depth. The instrumentation locations are shown in Figure 2-18. Water depth and temperature instruments are provided for the auxiliary tank so that the steam condensation rate can be determined should the pressure relief valve open during the test. In this manner, there is no loss of data should the pressure relief system activate. 2.5 Off Gas System An illustration of the off gas system is provided in Figure 2-19. Thermocouple and flowmeter instrumentation locations are also shown in this figure. This system filters and exhausts the noncondensable concrete decomposition gases to the cell exhaust. The decomposition gases (H2, CO, CO2 and the cover gas) exit the spray tank and pass through a flow separator. The cleanup efficiency of the separator is 99% of all entrained solid and liquid when the particle size exceeds 10 microns. After passing through the flow separator, the flow can potentially split into the two parallel off gas system lines. One line is constructed from 7.5 cm piping, while the second is made from 10.0 cm piping. The system was designed with the capacity to accommodate large-scale (up to 120 cm x 120 cm) tests. Since CCI-3 uses a reduced scale 50 cm x 50 cm test section, the 7.5 cm side of the parallel off gas system is taken out of service using a blank-off plate at the branch point in the system (see Figure 2-19). As a result, all gas flow is diverted through the 10 cm side of the off gas system. Reduction in available flow area is required to achieve a resolvable gas flow rate through the large capacity flowmeter at the

16
end of the off gas system train (the flowmeter used for CCI-3 had a capacity of 5660 slpm). The final filters in the system (4 individual filters per filter housing, yielding a total of 8 filters for each side of the off gas system) remove any remaining particulate before venting the off gases through the flowmeters to the cell atmosphere. The filters on the side of the off gas system used for CCI-3 (10 cm) are equipped with a passive counter-weighted check valve set to open at a nominal differential pressure of 7 kPa. The bypass valve is provided in the event that the filters become plugged during the experiment. 2.6 Cover Gas System During the test a uniform flow rate of helium is fed into the test section to suppress burning of combustible concrete decomposition gases (H2 and CO) and protect test section internals. An illustration of the cover gas system is shown in Figure 2-20. Cover gas flow is modulated by a total of three Hastings Flow Controllers (FC's). One 0-200 slpm FC provides cover gas to the lid camera and light port penetrations, while a second 0-350 slpm FC provides dedicated cover gas flow to the lid camera to prevent aerosol deposition on the camera quartz window through which the melt upper surface is viewed. A third 0-100 slpm FC is used to inert the apparatus on the evening prior to the test.
(VIEW FROM NORTH)
SHROUD
ACCESS PORT
RUPTURE DISKBURST PRESS.: 10 PSIG
6" ADJUSTABLE SWING CHECKPRESSURE RELIEF VALVE(10 PSIG NOMINAL)
3" VACUUM BREAKERVALVE
ML-1
DRAWING: CCI3 PRESSURE RELIEFSYSTEM (NORTH VIEW)DRAWING NO.: MCCI648DRAWN BY: D. KILSDONK 2-4746DATE: 10/3/05 FILE: CCI3_PRS1.DWG(112)
MAIN STEAM LINE OUTLETTO SMALL QUENCH TANK
AT-2
AT-1
MV-AT-1
PT-13
AUXILIARY TANK
ML-2
TEST SECTION
55 cm
COLLAPSED MELTHEIGHT 25 cm
EAST
BASEMAT
WEST
Figure 2-18. CCI-3 Test Section Pressure Relief System.
17
BYPASSLINE
METALFILTER
BYPASSLINE
3" LINE
3" VALVE
3" LINE
REMOTEOPERATED
SPRAYTANK
FROMQUENCHTANK
OG-1
SEPARATOR-TRAP
6" LINE
LAMINARELEMENTFLOWMETER
INLET (42" LONG)
LAMINARELEMENTFLOWMETER
INLET (42" LONG)
EXHAUST # 1
EXHAUST # 2
CCI3 OFFGAS SYSTEM
8 PSIG RUPTURE DISK
4" PVC PIPE
4" PVC PIPE
(FC-1A)
(FC-1B)
RV-9
5 GALJUG
MV-OG-1
MV-OG-2
4" CHECK VALVE (OPENS AT 1 PSIG)
BLANK-OFF
METALFILTER
FILTERMETAL METAL
FILTER
MASS SPEC SAMPLEPORT CAPPED OFF
DRAWING: CCI-3 OFFGASSYSTEMDRAWING NO.: MCCI649DRAWN BY: D. KILSDONKDATE: 10/3/05 FILE: CCI3_OGS.DWG(AC112)
NOT USED
Figure 2-19. CCI-3 Off Gas System.
DRAWN BY: D. KILSDONK
FC-2 RV-11RV-12
TEST SECTION
FC-7
FC-6LOW FLOW
MANIFOLD # 1 MANIFOLD # 2MANIFOLD # 3
LEVEL PROBE,LID CAMERA, ANDLIGHT PORTS
350 l/m
100 l/m
200 l/m
1 SIDE OFMIDDLE SECTION
LID CAMERA
R10
R6
DRAWING NO.: MCCI650
DATE: 10/3/05FILE: CCI3_CGAS.DWG (AC112)
DRAWING: CCI3 COVERGAS SYSTEM
COLLAPSED MELTHEIGHT
BASEMAT
MANIFOLD # 1 IS NOT USED IN CCI3
R8
CROSSCONNECT VALVE
Figure 2-20. CCI-3 Cover Gas System.
18
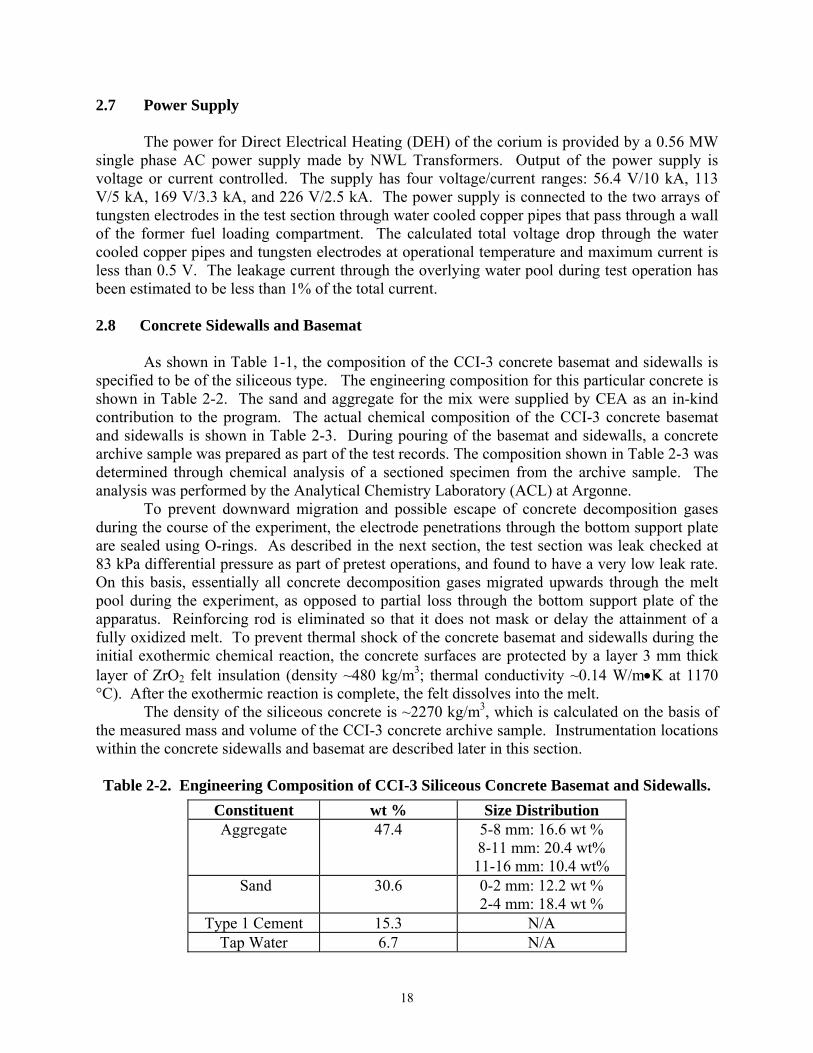
2.7 Power Supply The power for Direct Electrical Heating (DEH) of the corium is provided by a 0.56 MW single phase AC power supply made by NWL Transformers. Output of the power supply is voltage or current controlled. The supply has four voltage/current ranges: 56.4 V/10 kA, 113 V/5 kA, 169 V/3.3 kA, and 226 V/2.5 kA. The power supply is connected to the two arrays of tungsten electrodes in the test section through water cooled copper pipes that pass through a wall of the former fuel loading compartment. The calculated total voltage drop through the water cooled copper pipes and tungsten electrodes at operational temperature and maximum current is less than 0.5 V. The leakage current through the overlying water pool during test operation has been estimated to be less than 1% of the total current. 2.8 Concrete Sidewalls and Basemat
As shown in Table 1-1, the composition of the CCI-3 concrete basemat and sidewalls is specified to be of the siliceous type. The engineering composition for this particular concrete is shown in Table 2-2. The sand and aggregate for the mix were supplied by CEA as an in-kind contribution to the program. The actual chemical composition of the CCI-3 concrete basemat and sidewalls is shown in Table 2-3. During pouring of the basemat and sidewalls, a concrete archive sample was prepared as part of the test records. The composition shown in Table 2-3 was determined through chemical analysis of a sectioned specimen from the archive sample. The analysis was performed by the Analytical Chemistry Laboratory (ACL) at Argonne.
To prevent downward migration and possible escape of concrete decomposition gases during the course of the experiment, the electrode penetrations through the bottom support plate are sealed using O-rings. As described in the next section, the test section was leak checked at 83 kPa differential pressure as part of pretest operations, and found to have a very low leak rate. On this basis, essentially all concrete decomposition gases migrated upwards through the melt pool during the experiment, as opposed to partial loss through the bottom support plate of the apparatus. Reinforcing rod is eliminated so that it does not mask or delay the attainment of a fully oxidized melt. To prevent thermal shock of the concrete basemat and sidewalls during the initial exothermic chemical reaction, the concrete surfaces are protected by a layer 3 mm thick layer of ZrO2 felt insulation (density ~480 kg/m3; thermal conductivity ~0.14 W/m•K at 1170 °C). After the exothermic reaction is complete, the felt dissolves into the melt.
The density of the siliceous concrete is ~2270 kg/m3, which is calculated on the basis of the measured mass and volume of the CCI-3 concrete archive sample. Instrumentation locations within the concrete sidewalls and basemat are described later in this section. Table 2-2. Engineering Composition of CCI-3 Siliceous Concrete Basemat and Sidewalls.
Constituent wt % Size Distribution Aggregate 47.4 5-8 mm: 16.6 wt %
8-11 mm: 20.4 wt% 11-16 mm: 10.4 wt%
Sand 30.6 0-2 mm: 12.2 wt % 2-4 mm: 18.4 wt %
Type 1 Cement 15.3 N/A Tap Water 6.7 N/A
19
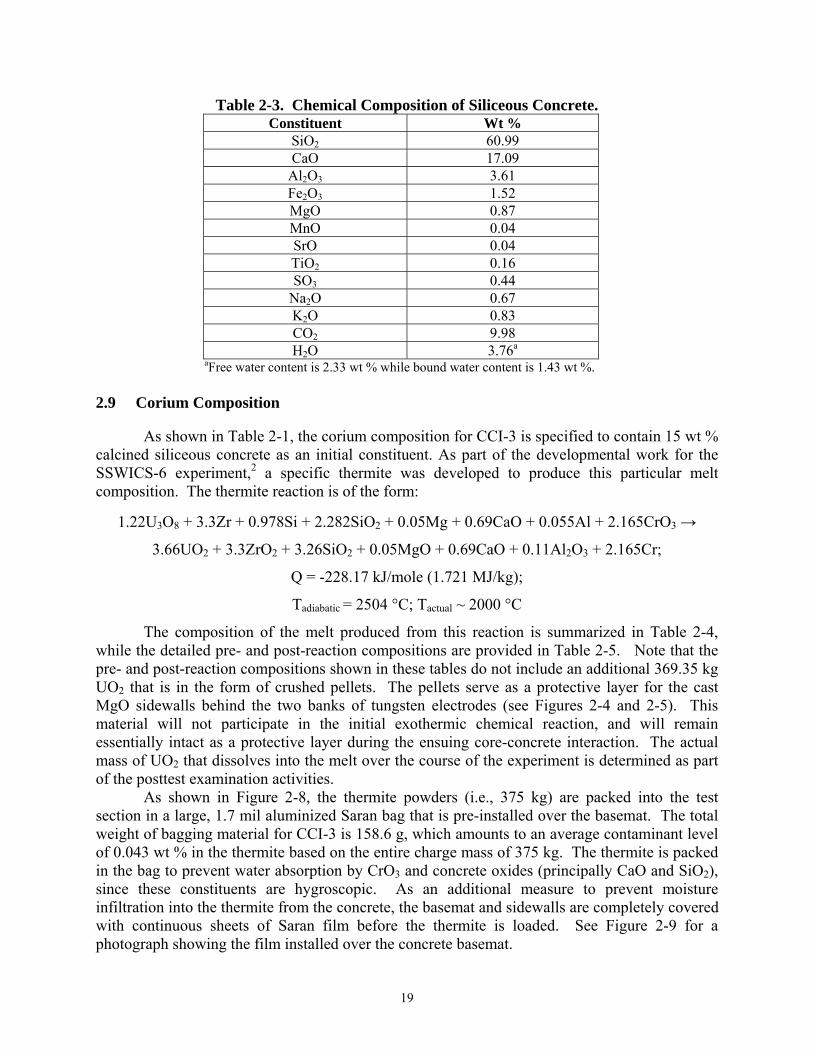
Table 2-3. Chemical Composition of Siliceous Concrete. Constituent Wt %
SiO2 60.99 CaO 17.09
Al2O3 3.61 Fe2O3 1.52 MgO 0.87 MnO 0.04 SrO 0.04 TiO2 0.16 SO3 0.44
Na2O 0.67 K2O 0.83 CO2 9.98 H2O 3.76a
aFree water content is 2.33 wt % while bound water content is 1.43 wt %. 2.9 Corium Composition
As shown in Table 2-1, the corium composition for CCI-3 is specified to contain 15 wt % calcined siliceous concrete as an initial constituent. As part of the developmental work for the SSWICS-6 experiment,2 a specific thermite was developed to produce this particular melt composition. The thermite reaction is of the form:
1.22U3O8 + 3.3Zr + 0.978Si + 2.282SiO2 + 0.05Mg + 0.69CaO + 0.055Al + 2.165CrO3 →
3.66UO2 + 3.3ZrO2 + 3.26SiO2 + 0.05MgO + 0.69CaO + 0.11Al2O3 + 2.165Cr;
Q = -228.17 kJ/mole (1.721 MJ/kg);
Tadiabatic = 2504 °C; Tactual ~ 2000 °C
The composition of the melt produced from this reaction is summarized in Table 2-4, while the detailed pre- and post-reaction compositions are provided in Table 2-5. Note that the pre- and post-reaction compositions shown in these tables do not include an additional 369.35 kg UO2 that is in the form of crushed pellets. The pellets serve as a protective layer for the cast MgO sidewalls behind the two banks of tungsten electrodes (see Figures 2-4 and 2-5). This material will not participate in the initial exothermic chemical reaction, and will remain essentially intact as a protective layer during the ensuing core-concrete interaction. The actual mass of UO2 that dissolves into the melt over the course of the experiment is determined as part of the posttest examination activities.
As shown in Figure 2-8, the thermite powders (i.e., 375 kg) are packed into the test section in a large, 1.7 mil aluminized Saran bag that is pre-installed over the basemat. The total weight of bagging material for CCI-3 is 158.6 g, which amounts to an average contaminant level of 0.043 wt % in the thermite based on the entire charge mass of 375 kg. The thermite is packed in the bag to prevent water absorption by CrO3 and concrete oxides (principally CaO and SiO2), since these constituents are hygroscopic. As an additional measure to prevent moisture infiltration into the thermite from the concrete, the basemat and sidewalls are completely covered with continuous sheets of Saran film before the thermite is loaded. See Figure 2-9 for a photograph showing the film installed over the concrete basemat.

20
Table 2-4. Post-Reaction Bulk Composition for CCI-3 Thermite. Constituent Wt%
UO2 56.32 ZrO2 23.13
Calcined Concrete 14.14a Cr 6.41
aCalcined siliceous concrete, consisting of 79.0/0.9/15.6/4.5 wt% SiO2/MgO/CaO/Al2O3
Table 2-5. Detailed Pre- and Post-Reaction Compositions for CCI-3 Thermite. Reactant Product Constituent
Wt % Mass, kg Wt % Mass, kg U3O8 58.70 220.34 - - UO2 - - 56.32 211.41 Zr 17.16 64.41 - -
ZrO2 - - 23.13 86.82 Si 1.57 5.89 - -
SiO2 7.84 29.42 11.17 41.92 Mg 0.07 0.26 - -
MgO - - 0.12 0.45 Al 0.09 0.34 - -
Al2O3 - - 0.64 2.40 CaO 2.21 8.31 2.21 8.31 CrO3 12.36 46.40 - -
Cr - - 6.41 24.06 Total 100.00 375.37 100.00 375.37
The powder composition shown in Table 2-5 packed to a height of ~55 cm above the surface of the concrete during loading for CCI-3. Thus, the average packing density is evaluated as ~2900 kg/m3, which yields an average void fraction of ~47% for the entire charge assuming a theoretical density of 5186 kg/m3. 2.10 Instrumentation and Data Acquisition
The CCI-3 facility is instrumented to monitor and guide experiment operation and to log data for subsequent evaluation. Principal parameters which are monitored during the course of the test include the power supply voltage, current, and gross input power to the melt; melt temperature and temperatures within the concrete basemat and sidewalls; crust lance position and applied load; supply water flow rate; water volume and temperature within the test apparatus, and water volume and temperature within the quench system tanks. Other key data recorded by the DAS includes temperatures within test section structural sidewalls, off gas temperature and flow rate, and pressures at various locations within the system.
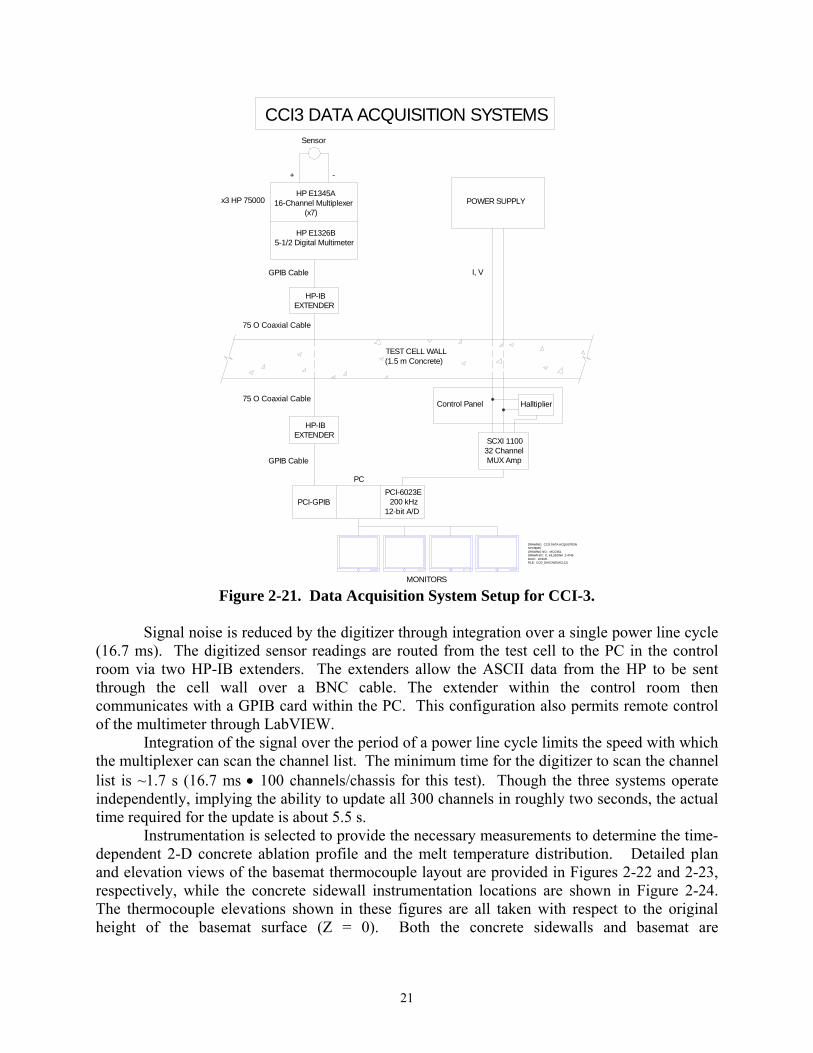
All data acquisition and process control tasks are managed by a PC executing LabVIEW 6.i under Windows XP. Sensor output terminals are connected inside the test cell to model HP E1345A 16-channel multiplexers, which are integrated into a mainframe chassis in groups of eight. An illustration of the DAS setup is provided in Figure 2-21. The multiplexers direct signals to an HP E1326B 5 ½ digit multimeter incorporated into each chassis. Three independent 128 channel systems are used for a total capacity of 384 channels. The detailed channel assignment lists for each of the three systems is provided in Appendix A.
21
DRAWING: CCI3 DATA ACQUISITIONSYSTEMSDRAWING NO.: MCCI651DRAWN BY: D. KILSDONK 2-4746DATE: 10/3/05 FILE: CCI3_DAS.DWG(AC112)
CCI3 DATA ACQUISITION SYSTEMS
MONITORS
PCI-GPIBPCI-6023E 200 kHz12-bit A/D
PC
HP-IBEXTENDER
GPIB Cable
TEST CELL WALL(1.5 m Concrete)
HP-IBEXTENDER
GPIB Cable
75 O Coaxial Cable
75 O Coaxial Cable
HP E1345A16-Channel Multiplexer (x7)
HP E1326B5-1/2 Digital Multimeter
x3 HP 75000
+ -
Sensor
POWER SUPPLY
HalltiplierControl Panel
SCXI 110032 Channel MUX Amp
I, V
Figure 2-21. Data Acquisition System Setup for CCI-3.
Signal noise is reduced by the digitizer through integration over a single power line cycle
(16.7 ms). The digitized sensor readings are routed from the test cell to the PC in the control room via two HP-IB extenders. The extenders allow the ASCII data from the HP to be sent through the cell wall over a BNC cable. The extender within the control room then communicates with a GPIB card within the PC. This configuration also permits remote control of the multimeter through LabVIEW.
Integration of the signal over the period of a power line cycle limits the speed with which the multiplexer can scan the channel list. The minimum time for the digitizer to scan the channel list is ~1.7 s (16.7 ms • 100 channels/chassis for this test). Though the three systems operate independently, implying the ability to update all 300 channels in roughly two seconds, the actual time required for the update is about 5.5 s.
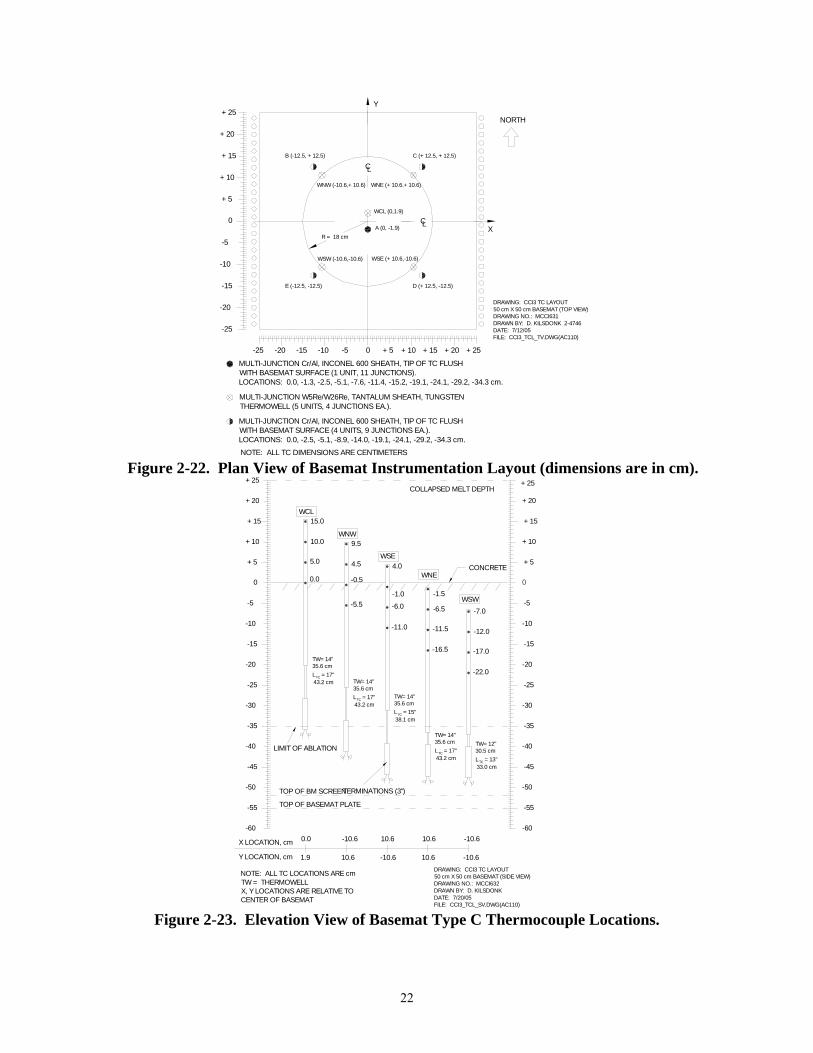
Instrumentation is selected to provide the necessary measurements to determine the time-dependent 2-D concrete ablation profile and the melt temperature distribution. Detailed plan and elevation views of the basemat thermocouple layout are provided in Figures 2-22 and 2-23, respectively, while the concrete sidewall instrumentation locations are shown in Figure 2-24. The thermocouple elevations shown in these figures are all taken with respect to the original height of the basemat surface (Z = 0). Both the concrete sidewalls and basemat are
22
NORTH
CL
CL
DRAWING: CCI3 TC LAYOUT50 cm X 50 cm BASEMAT (TOP VIEW)DRAWING NO.: MCCI631DRAWN BY: D. KILSDONK 2-4746DATE: 7/12/05 FILE: CCI3_TCL_TV.DWG(AC110)
-5
-25
-20
-25
-15
-10
+ 10
+ 5
0
+ 20
+ 15
+ 25
-20 -15 -10 -5 + 50 + 15+ 10 + 25+ 20
X
Y
MULTI-JUNCTION Cr/Al, INCONEL 600 SHEATH, TIP OF TC FLUSHWITH BASEMAT SURFACE (1 UNIT, 11 JUNCTIONS).LOCATIONS: 0.0, -1.3, -2.5, -5.1, -7.6, -11.4, -15.2, -19.1, -24.1, -29.2, -34.3 cm.
MULTI-JUNCTION W5Re/W26Re, TANTALUM SHEATH, TUNGSTENTHERMOWELL (5 UNITS, 4 JUNCTIONS EA.).
NOTE: ALL TC DIMENSIONS ARE CENTIMETERS
R = 18 cm
WNW (-10.6,+ 10.6)
B (-12.5, + 12.5)
A (0, -1.9)
WCL (0,1.9)
C (+ 12.5, + 12.5)
E (-12.5, -12.5) D (+ 12.5, -12.5)
WNE (+ 10.6,+ 10.6)
WSW (-10.6,-10.6) WSE (+ 10.6,-10.6)
MULTI-JUNCTION Cr/Al, INCONEL 600 SHEATH, TIP OF TC FLUSHWITH BASEMAT SURFACE (4 UNITS, 9 JUNCTIONS EA.).LOCATIONS: 0.0, -2.5, -5.1, -8.9, -14.0, -19.1, -24.1, -29.2, -34.3 cm.
Figure 2-22. Plan View of Basemat Instrumentation Layout (dimensions are in cm).
0
+ 5
+ 10
+ 15
+ 20
-5
-10
-15
-20
-25
-30
-35
-40
-45
-50
-5
-35
-50
-45
-40
-20
-30
-25
-15
-10
+ 10
+ 5
+ 20
+ 15
COLLAPSED MELT DEPTH
TERMINATIONS (3")
TW= 14"35.6 cmL = 17"TC43.2 cm
CONCRETE
DRAWING: CCI3 TC LAYOUT50 cm X 50 cm BASEMAT (SIDE VIEW)DRAWING NO.: MCCI632DRAWN BY: D. KILSDONKDATE: 7/20/05 FILE: CCI3_TCL_SV.DWG(AC110)
NOTE: ALL TC LOCATIONS ARE cmTW = THERMOWELLX, Y LOCATIONS ARE RELATIVE TOCENTER OF BASEMAT
TOP OF BM SCREEN
TOP OF BASEMAT PLATE
LIMIT OF ABLATION
X LOCATION, cm
Y LOCATION, cm
0.0
1.9
-10.6
10.6 -10.6
10.6
10.6
10.6
-10.6
-10.6
15.0
0.0
5.0
WCL
10.0
43.2 cmL = 17"35.6 cmTW= 14"
TC
9.5
4.5
-5.5
-0.5
WNW
38.1 cmL = 15"35.6 cmTW= 14"
TC
4.0
-1.0
-11.0
-6.0
WSE
43.2 cmL = 17"35.6 cmTW= 14"
TC
-1.5
-6.5
-16.5
-11.5
WNE
TW= 12"30.5 cmL = 13"33.0 cm
-12.0
-7.0
TC
-22.0
-17.0
WSW
-60
-55-55
-60
+ 25 + 25
Figure 2-23. Elevation View of Basemat Type C Thermocouple Locations.
23
47.0" [119.38 cm]
1.00" [2.54 cm]
8.0" [20.32 cm]
-50
-45
-35
-40
-30
-20
-25
-15
-5
-10
0
+ 10
+ 5
+ 15
+ 75
+ 45
+ 30
+ 20
+ 25
+ 40
+ 35
+ 60
+ 50
+ 55
+ 70
+ 65
+ 80
+ 85cm
-55
BASEMAT
55 cm
ALUMINUM TRANSITION PLATE (1" THICK)
NORTH SOUTHVIEW FORM WESTAT CENTER LINE
IBEAM
ELECTRODE CLAMP
TYPE C TC IN TUNGSTEN THERMOWELL
TYPE K TC'S
TYPE K TC'S
SWK
SWIWNSWG
SWE
SWC
SWA
SWL
SWJWSSWH
SWF
SWD
SWB
36.0" [91.44 cm]
10.0" [25.35 cm]
151.3SWHL-25 (0.0)SWHL-26 (2.0)
94.7SWHL-21 (0.0)SWHL-22 (2.0)
70.0SWHL-17 (0.0)SWHL-18 (2.0)
DRAWING: CCI3 TEST SECTIONTC LAYOUT (WEST VIEW) DRAWING NO.: MCCI629DRAWN BY: D. KILSDONK 2-4746DATE: 9/7/05 FILE: CCI3_TSTCWV.DWG(AC110)
TWO SPARKLERS
NOTE:TC ELEVATIONS (DISTANCE FROM TOP OF BASEMAT) AND TC LOCATIONS (DISTANCE FROM INSIDE WALL) ARE IN CENTIMETERS.
ALL TC'S ARE LOCATED ON THE CENTERLINE OF THE SIDE.
20.0" [50.78 cm]
36.0" [91.44 cm]
SWM SWN
REFRACTORY CONCRETE50 cm X 50 cm TEST SECTION
Figure 2-24. CCI-3 Test Section Sidewall Instrumentation (View From West).
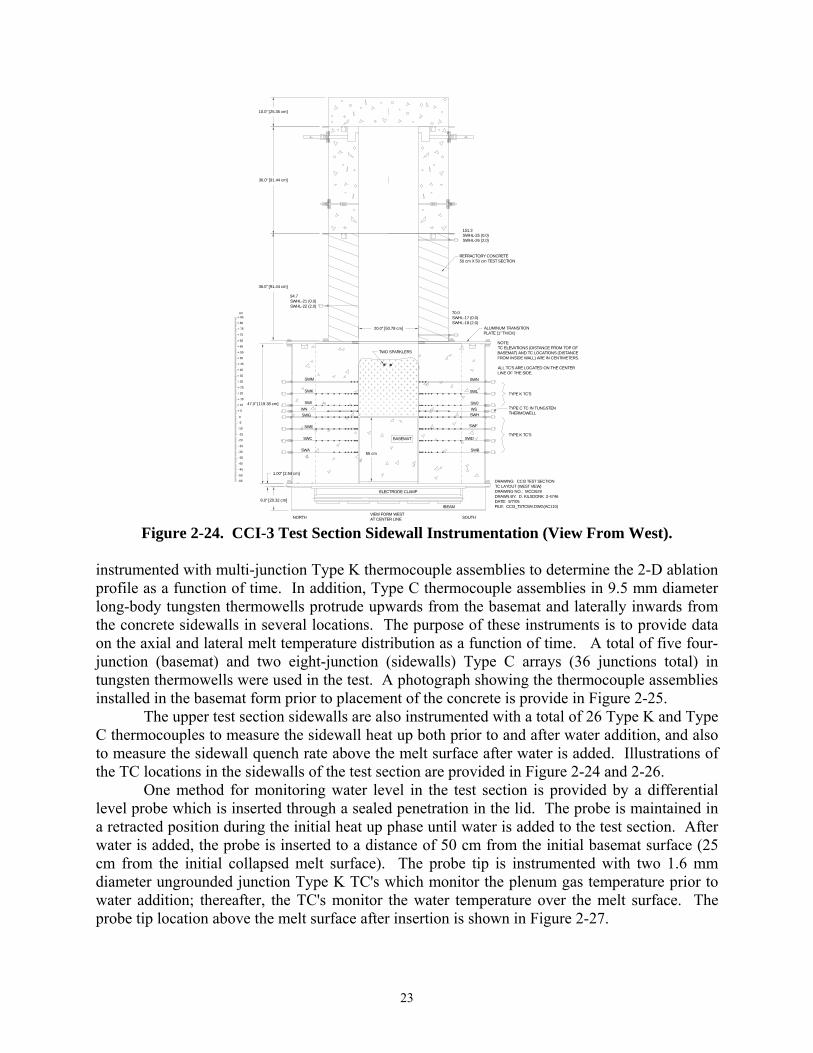
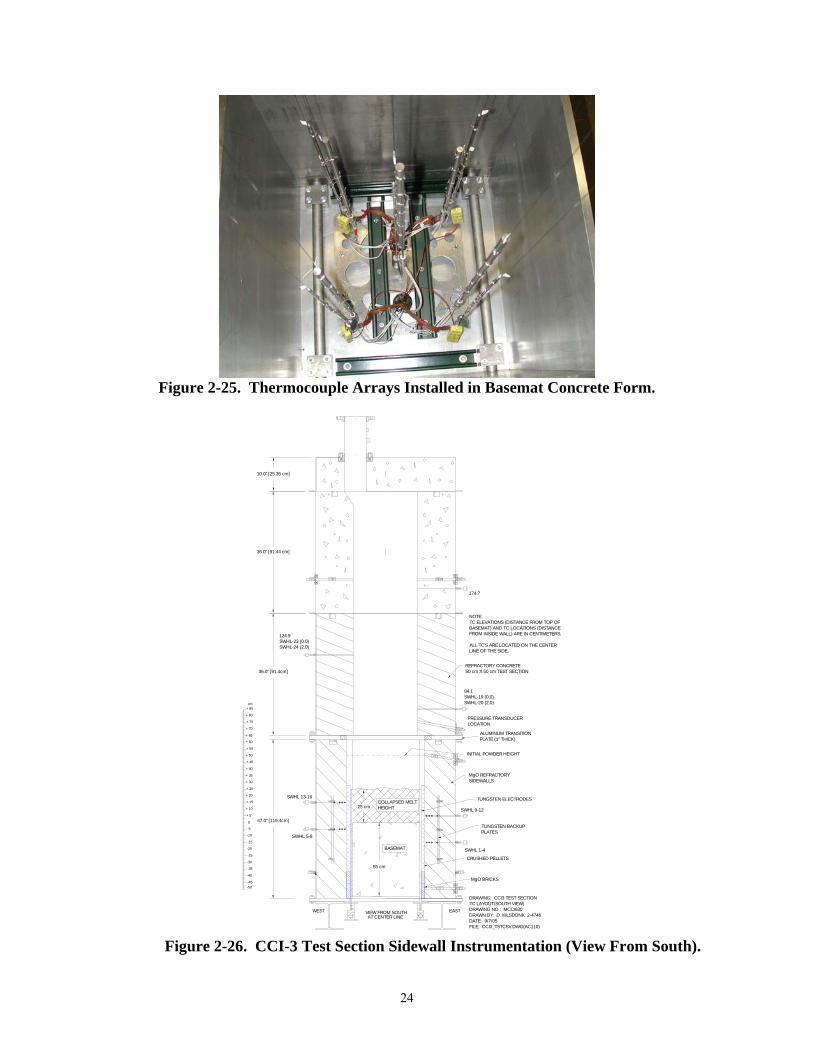
instrumented with multi-junction Type K thermocouple assemblies to determine the 2-D ablation profile as a function of time. In addition, Type C thermocouple assemblies in 9.5 mm diameter long-body tungsten thermowells protrude upwards from the basemat and laterally inwards from the concrete sidewalls in several locations. The purpose of these instruments is to provide data on the axial and lateral melt temperature distribution as a function of time. A total of five four-junction (basemat) and two eight-junction (sidewalls) Type C arrays (36 junctions total) in tungsten thermowells were used in the test. A photograph showing the thermocouple assemblies installed in the basemat form prior to placement of the concrete is provide in Figure 2-25. The upper test section sidewalls are also instrumented with a total of 26 Type K and Type C thermocouples to measure the sidewall heat up both prior to and after water addition, and also to measure the sidewall quench rate above the melt surface after water is added. Illustrations of the TC locations in the sidewalls of the test section are provided in Figure 2-24 and 2-26.
One method for monitoring water level in the test section is provided by a differential level probe which is inserted through a sealed penetration in the lid. The probe is maintained in a retracted position during the initial heat up phase until water is added to the test section. After water is added, the probe is inserted to a distance of 50 cm from the initial basemat surface (25 cm from the initial collapsed melt surface). The probe tip is instrumented with two 1.6 mm diameter ungrounded junction Type K TC's which monitor the plenum gas temperature prior to water addition; thereafter, the TC's monitor the water temperature over the melt surface. The probe tip location above the melt surface after insertion is shown in Figure 2-27.
24
Figure 2-25. Thermocouple Arrays Installed in Basemat Concrete Form.
DRAWING: CCI3 TEST SECTIONTC LAYOUT(SOUTH VIEW) DRAWING NO.: MCCI630DRAWN BY: D. KILSDONK 2-4746DATE: 9/7/05 FILE: CCI3_TSTCSV.DWG(AC110)
VIEW FROM SOUTHWEST EAST
0
-30
-45-50
-40
-35
-15
-25
-20
-10
-5
+ 15
+ 5
+ 10
+ 25
+ 20
+ 35
cm
+ 30
+ 65
+ 60
+ 55
+ 50
+ 45
+ 40
+ 70
+ 75
+ 80
+ 85
AT CENTER LINE
INITIAL POWDER HEIGHT
COLLAPSED MELTHEIGHT
36.0" [91.4cm]
ALUMINUM TRANSITION PLATE (1" THICK)
REFRACTORY CONCRETE50 cm X 50 cm TEST SECTION
TUNGSTEN ELECTRODES
47.0" [119.4cm]
MgO REFRACTORY SIDEWALLS
55 cm
25 cm
BASEMAT
TUNGSTEN BACKUP PLATES
SWHL 1-4
SWHL 9-12
SWHL 5-8
SWHL 13-16
MgO BRICKS
CRUSHED PELLETS
NOTE:TC ELEVATIONS (DISTANCE FROM TOP OF BASEMAT) AND TC LOCATIONS (DISTANCE FROM INSIDE WALL) ARE IN CENTIMETERS.
ALL TC'S ARE LOCATED ON THE CENTERLINE OF THE SIDE.
84.1SWHL-19 (0.0)SWHL-20 (2.0)
PRESSURE TRANSDUCER LOCATION
124.9SWHL-23 (0.0)SWHL-24 (2.0)
36.0" [91.44 cm]
174.7
10.0" [25.35 cm]
Figure 2-26. CCI-3 Test Section Sidewall Instrumentation (View From South).

25
DRAWING: CCI3 TEST SECTIONPRESSURE TRANSDUCERS (NORTH VIEW)DRAWING NO.: MCCI652DRAWN BY: D. KILSDONK 2-4746DATE: 10/3/05 FILE: CCI3_TSPTNV.DWG(AC112)VIEW FROM NORTH
EAST
25 cmCOLLAPSED MELTHEIGHT
55 cm
BASEMAT
WEST
LOCATEDIN LIGHTPORT
PT-5
LEVEL PROBE1.3 cm DIA. TUBE
PT-3
WATER
LP-1LP-2
PT-4
PT-6
75.0 cm
Figure 2-27. CCI-3 Test Section Pressure Transducer Layout.
Aside from the insertable water level probe, two additional methods are provided to monitor the water volume in the test section. The first is a static water level port located in the North sidewall 55 cm from the initial basemat surface (30 cm from the initial collapsed melt surface). The port location is shown in Figure 2-27. The second redundant method is provided by an on-line calculation of the water volume in the test section based on conservation of mass; i.e., the water volume in the test section at any time is equal to the initial volume in the supply/quench systems minus the volume in the supply/quench systems at the current time. The water supply tank is equipped with a magnetic float to measure the time-dependent water level. As a redundant level measurement technique, the supply tank is also equipped with a differential PT. Water flow rate to the test section is monitored by a paddlewheel flowmeter. The location of the supply system instrumentation is shown in Figure 2-15. The quench, overflow, and spray tanks are instrumented to measure the transient energy deposition due to steam generation from corium quenching in the test section. The quench and overflow tank instruments are shown in Figure 2-16, while the spray tank instrumentation is shown in Figure 2-17. Each tank is equipped with a magnetic float and (redundant) differential PT to measure the accumulated water volume due to steam condensation. Transient water

26
temperatures in all tanks are monitored using Type K TC's (two in the quench tank, and one each in the spray tank and overflow tanks). Water flow rate and temperature differential across the quench tank cooling coil are monitored with a paddlewheel flowmeter and Type K TC's, respectively, thus providing a measurement of the time-dependent energy extraction rate from the water mass in the tank. The main steamline between the test section and quench tank is instrumented with Type K TC's to measure the local gas and pipe structure temperatures. The steamline thermocouple locations are shown in Figure 2-13. The outlet noncondensable gas flow rate from the spray tank is monitored by a Hastings mass flow transducer. The location of the off gas system instrumentation is shown in Figure 2-19. Key system pressures are monitored with strain-gauge type pressure transducers manufactured by Sensym, Inc. As shown in Figures 2-15 through 2-17 and 2-27, the pressure in all system tanks is monitored, as is the test section plenum pressure. An Additional PT is located in the lower test section to monitor the pressure beneath the melt upper surface. This transducer is mounted on the east sidewall of the test section at an elevation of 45 cm beneath the initial concrete surface. The gap between the MgO sidewalls and the electrodes is packed with crushed UO2 pellets during loading of the corium charge. Thus, this PT will sense the pressure beneath the melt surface as long as the gap does not plug during the test. In terms of the power supply operating parameters, voltage drop across the tungsten electrode bank is monitored with the DAS voltmeter, while current input is monitored with two parallel 5000:1 current transformers. Power input to the melt is monitored with two Hall Effect meters. At the 5th PRG meeting, the PRG requested that the project attempt to devise a method for monitoring the current through selected tungsten electrodes to determine if non-uniformities in the DEH power input occurred during the test. Clearly, the optimal method for doing this would be to use small current transformers placed around the selected electrodes. However, there was insufficient space to incorporate these devices into the existing test section design. As a result, an attempt was made to monitor the voltage drop across the lower 15 cm of selected electrodes using lacquer-insulated 14 gauge wires that were passed through potted seals into the test section along the bottom support plate and clamped at the 15 cm elevation. Given the resistivity of tungsten, then a voltage drop of ~ 20 mV should develop over the 15 cm length for every 200 Amps of current drawn. Figure 2-28 provides a drawing that shows the electrodes that were wired for current monitoring in CCI-3. In addition to the above instrumentation, visual information regarding the core-concrete interaction and melt quenching behavior is provided by a video camera mounted on the upper lid of the apparatus. The camera location and field of view is shown in Figure 2-3. Five area video monitors are also used in the cell to monitor for leaks, and also to record any disruptive events (i.e., steam explosion) should one occur. Finally, the crust lance is equipped with load and displacement transducers to provide data on the crust load vs. time during the crust failure sequence.
.
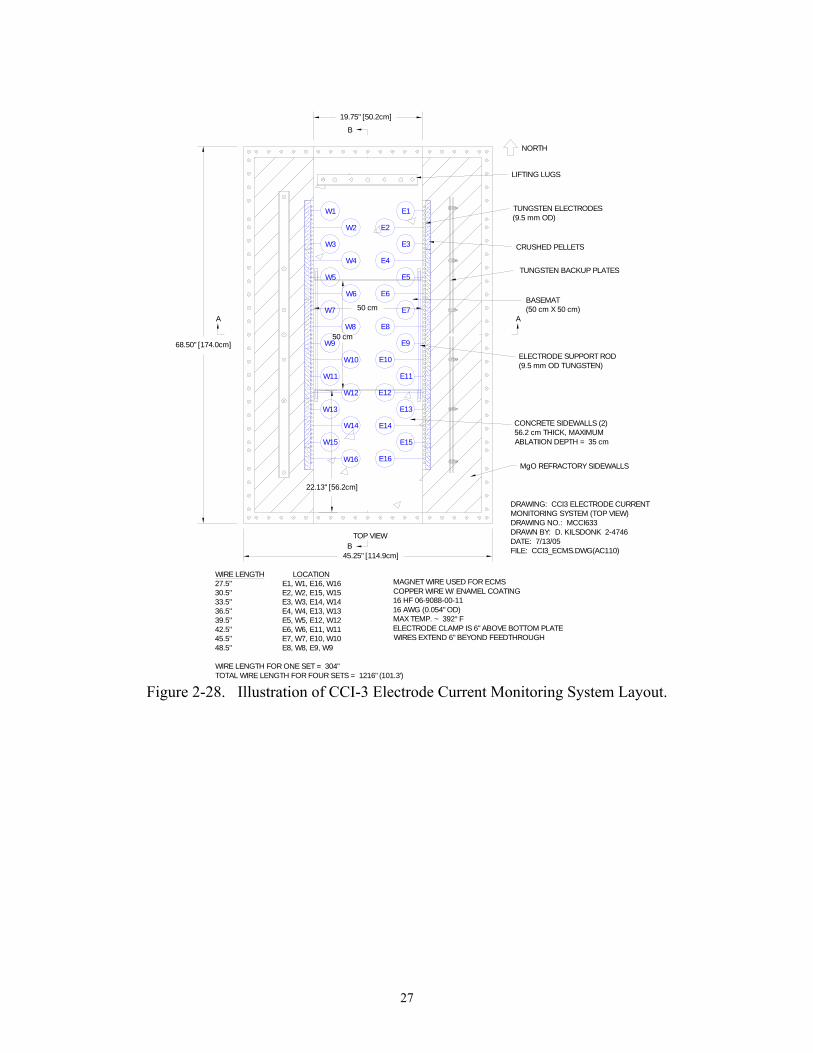
27
NORTH
A
TOP VIEW
DRAWING: CCI3 ELECTRODE CURRENTMONITORING SYSTEM (TOP VIEW) DRAWING NO.: MCCI633DRAWN BY: D. KILSDONK 2-4746DATE: 7/13/05 FILE: CCI3_ECMS.DWG(AC110)
68.50" [174.0cm]
45.25" [114.9cm]
CRUSHED PELLETS
TUNGSTEN BACKUP PLATES
TUNGSTEN ELECTRODES(9.5 mm OD)
LIFTING LUGS
BASEMAT(50 cm X 50 cm)
CONCRETE SIDEWALLS (2)56.2 cm THICK, MAXIMUM ABLATIION DEPTH = 35 cm
MgO REFRACTORY SIDEWALLS
B
B
50 cm
50 cm
19.75" [50.2cm]
22.13" [56.2cm]
A
ELECTRODE SUPPORT ROD (9.5 mm OD TUNGSTEN)
W1
W16
W2
W3
W4
W5
W6
W7
W8
W9
W10
W11
W12
W13
W14
W15
E1
E2
E3
E4
E5
E6
E7
E8
E9
E10
E11
E12
E13
E14
E15
E16
WIRE LENGTH LOCATION27.5" E1, W1, E16, W1630.5" E2, W2, E15, W1533.5" E3, W3, E14, W1436.5" E4, W4, E13, W1339.5" E5, W5, E12, W1242.5" E6, W6, E11, W1145.5" E7, W7, E10, W1048.5" E8, W8, E9, W9
WIRE LENGTH FOR ONE SET = 304"TOTAL WIRE LENGTH FOR FOUR SETS = 1216" (101.3')
MAGNET WIRE USED FOR ECMSCOPPER WIRE W/ ENAMEL COATING16 HF 06-9088-00-1116 AWG (0.054" OD)MAX TEMP. ~ 392° F ELECTRODE CLAMP IS 6" ABOVE BOTTOM PLATEWIRES EXTEND 6" BEYOND FEEDTHROUGH
Figure 2-28. Illustration of CCI-3 Electrode Current Monitoring System Layout.

28
3.0 TEST PROCEDURES 3.1 Pretest Operations Assembly of the apparatus began by installing the tungsten electrodes (126 total; 63 per side) into machined copper electrode clamps. The electrode clamps were then attached to the bottom of the 2.54 cm thick aluminum support plate which served as the foundation for the entire apparatus. With the electrode clamps installed, the support plate was moved into position on the ZPR-9 reactor bed. The concrete basemat was then placed atop the support plate. The top surface of the basemat was insulated with a 3 mm thick layer of low density ZrO2 felt. The basemat was then completely covered with a continuous sheet of 1.7 mil aluminized Saran film to prevent moisture contamination of the thermite powders from the basemat once the powders were loaded into the test section. The lower test section concrete and MgO sidewalls were then set in place. The concrete sidewalls were also covered with ZrO2 felt and aluminized Saran before placement to prevent moisture contamination of the thermite from these components once the powders were loaded. The lower section flange bolts and clamping bars were then installed and torqued according to an approved procedure. In parallel with test section assembly, the thermite powders were mixed in preparation for corium loading. As a precursor for initiating mixing, a gas sample testa was conducted to verify that the initial level of volatile impurities in a sample prepared from the CCI-3 thermite constituents was sufficiently low to preclude excessive gas release during the burn. The results of this test indicated moisture and nitrogen contents well within acceptable limits. On this basis, mixing was initiated. Once the lower section was assembled, preparations for loading of the corium charge began. A single, large 1.7 mil aluminized Saran bag was preinstalled over the basemat. During loading, the 375 kg thermite charge was placed within this bag in order to reduce the amount of bagging material present in the thermite. As the powders were placed in the test section, the basemat melt temperature thermocouples were monitored to detect any localized heating in the corium powders. If heating was observed, the cell was to be immediately evacuated. As the thermite was placed, the gap between the tungsten electrodes and MgO sidewalls was filled with crushed UO2 pellets. The crushed pellets served as a protective layer against excessive chemical/thermal attack by the corium during the test. Once loading was completed, two sparkler igniters were placed a few centimeters below the top of the powders near the center of the test section, and then the bag was folded and sealed. An illustration of the loading scheme is provided in Figure 2-8. As described in Section 2.9, the use of the single large bag for containment of the thermite resulted in a low bagging material contaminant level of 0.043 wt % present in the charge at the time of ignition. Once loading was completed, a removable train containing a 1.0 kg bagged sample of thermite was installed over the powder bed; an illustration is provided in Figure 3-1. The sample train was removed weekly and the sample weighed to monitor the moisture pickup by the thermite during the period between loading and test initiation. Note from Figure 3-1 that the top portion of the train also contained a 4.5 kg canister of desiccant. The desiccant was provided to
a The gas sample test procedure consists of igniting a representative sample of the thermite in a closed vessel. The amount of noncondensable gas produced is determined from the ideal gas law; the composition of the evolved gases is determined using gas mass spectroscopy.
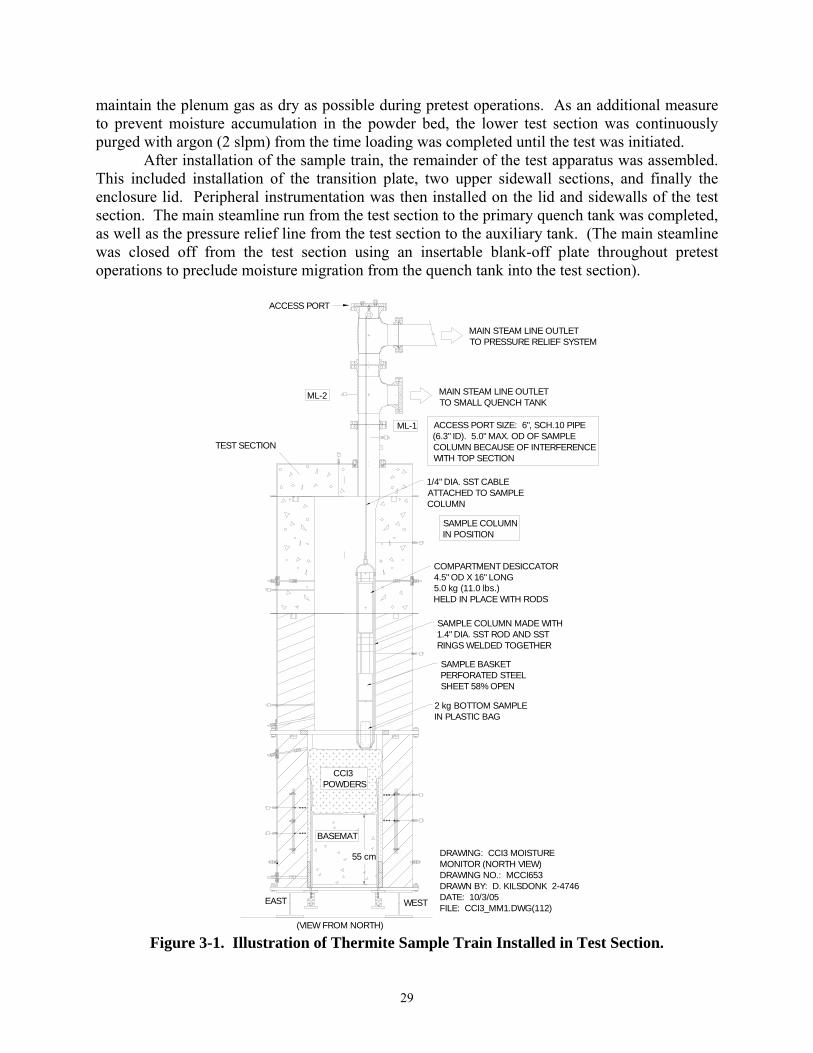
29
maintain the plenum gas as dry as possible during pretest operations. As an additional measure to prevent moisture accumulation in the powder bed, the lower test section was continuously purged with argon (2 slpm) from the time loading was completed until the test was initiated. After installation of the sample train, the remainder of the test apparatus was assembled. This included installation of the transition plate, two upper sidewall sections, and finally the enclosure lid. Peripheral instrumentation was then installed on the lid and sidewalls of the test section. The main steamline run from the test section to the primary quench tank was completed, as well as the pressure relief line from the test section to the auxiliary tank. (The main steamline was closed off from the test section using an insertable blank-off plate throughout pretest operations to preclude moisture migration from the quench tank into the test section).
(VIEW FROM NORTH)
ACCESS PORT
ML-1
DRAWING: CCI3 MOISTUREMONITOR (NORTH VIEW)DRAWING NO.: MCCI653DRAWN BY: D. KILSDONK 2-4746DATE: 10/3/05 FILE: CCI3_MM1.DWG(112)
MAIN STEAM LINE OUTLETTO SMALL QUENCH TANK
ML-2
TEST SECTION
55 cm
EAST WEST
SAMPLE COLUMN MADE WITH1.4" DIA. SST ROD AND SST RINGS WELDED TOGETHER
SAMPLE BASKETPERFORATED STEELSHEET 58% OPEN
2 kg BOTTOM SAMPLEIN PLASTIC BAG
SAMPLE COLUMNIN POSITION
COMPARTMENT DESICCATOR4.5" OD X 16" LONG5.0 kg (11.0 lbs.)HELD IN PLACE WITH RODS
ACCESS PORT SIZE: 6", SCH.10 PIPE (6.3" ID). 5.0" MAX. OD OF SAMPLECOLUMN BECAUSE OF INTERFERENCE WITH TOP SECTION
1/4" DIA. SST CABLEATTACHED TO SAMPLECOLUMN
MAIN STEAM LINE OUTLETTO PRESSURE RELIEF SYSTEM
CCI3POWDERS
BASEMAT
Figure 3-1. Illustration of Thermite Sample Train Installed in Test Section.
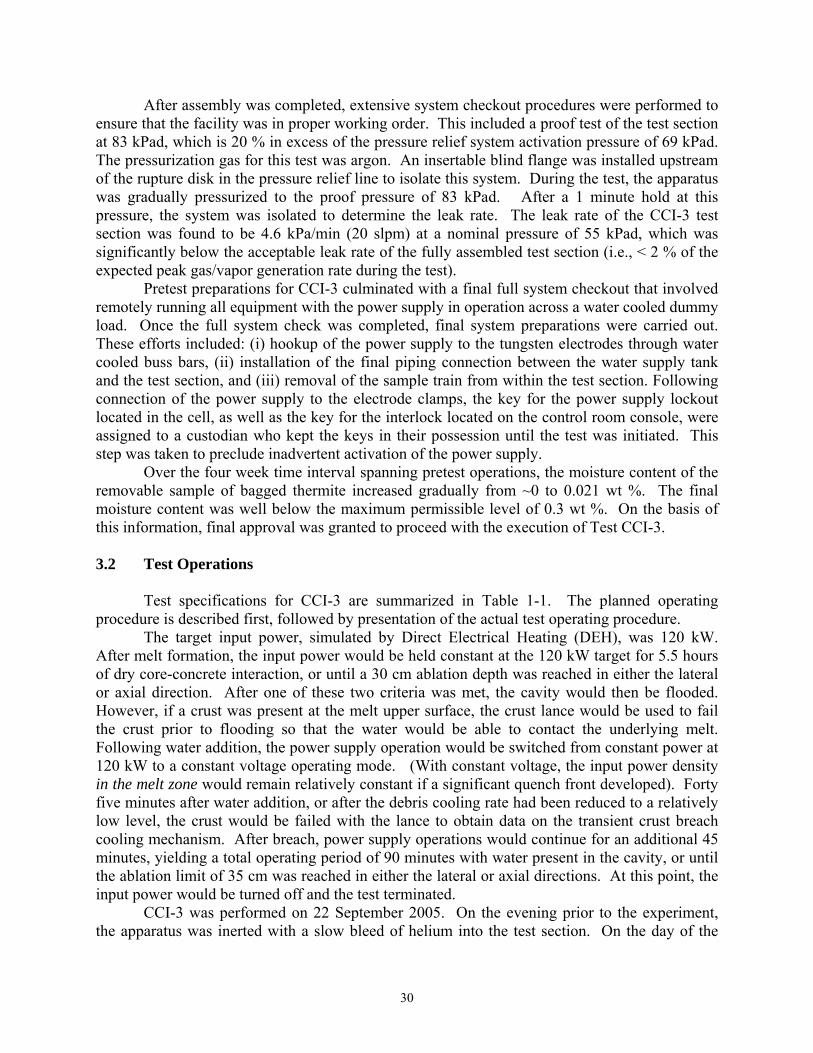
30
After assembly was completed, extensive system checkout procedures were performed to ensure that the facility was in proper working order. This included a proof test of the test section at 83 kPad, which is 20 % in excess of the pressure relief system activation pressure of 69 kPad. The pressurization gas for this test was argon. An insertable blind flange was installed upstream of the rupture disk in the pressure relief line to isolate this system. During the test, the apparatus was gradually pressurized to the proof pressure of 83 kPad. After a 1 minute hold at this pressure, the system was isolated to determine the leak rate. The leak rate of the CCI-3 test section was found to be 4.6 kPa/min (20 slpm) at a nominal pressure of 55 kPad, which was significantly below the acceptable leak rate of the fully assembled test section (i.e., < 2 % of the expected peak gas/vapor generation rate during the test). Pretest preparations for CCI-3 culminated with a final full system checkout that involved remotely running all equipment with the power supply in operation across a water cooled dummy load. Once the full system check was completed, final system preparations were carried out. These efforts included: (i) hookup of the power supply to the tungsten electrodes through water cooled buss bars, (ii) installation of the final piping connection between the water supply tank and the test section, and (iii) removal of the sample train from within the test section. Following connection of the power supply to the electrode clamps, the key for the power supply lockout located in the cell, as well as the key for the interlock located on the control room console, were assigned to a custodian who kept the keys in their possession until the test was initiated. This step was taken to preclude inadvertent activation of the power supply. Over the four week time interval spanning pretest operations, the moisture content of the removable sample of bagged thermite increased gradually from ~0 to 0.021 wt %. The final moisture content was well below the maximum permissible level of 0.3 wt %. On the basis of this information, final approval was granted to proceed with the execution of Test CCI-3.
3.2 Test Operations Test specifications for CCI-3 are summarized in Table 1-1. The planned operating procedure is described first, followed by presentation of the actual test operating procedure.
The target input power, simulated by Direct Electrical Heating (DEH), was 120 kW. After melt formation, the input power would be held constant at the 120 kW target for 5.5 hours of dry core-concrete interaction, or until a 30 cm ablation depth was reached in either the lateral or axial direction. After one of these two criteria was met, the cavity would then be flooded. However, if a crust was present at the melt upper surface, the crust lance would be used to fail the crust prior to flooding so that the water would be able to contact the underlying melt. Following water addition, the power supply operation would be switched from constant power at 120 kW to a constant voltage operating mode. (With constant voltage, the input power density in the melt zone would remain relatively constant if a significant quench front developed). Forty five minutes after water addition, or after the debris cooling rate had been reduced to a relatively low level, the crust would be failed with the lance to obtain data on the transient crust breach cooling mechanism. After breach, power supply operations would continue for an additional 45 minutes, yielding a total operating period of 90 minutes with water present in the cavity, or until the ablation limit of 35 cm was reached in either the lateral or axial directions. At this point, the input power would be turned off and the test terminated. CCI-3 was performed on 22 September 2005. On the evening prior to the experiment, the apparatus was inerted with a slow bleed of helium into the test section. On the day of the
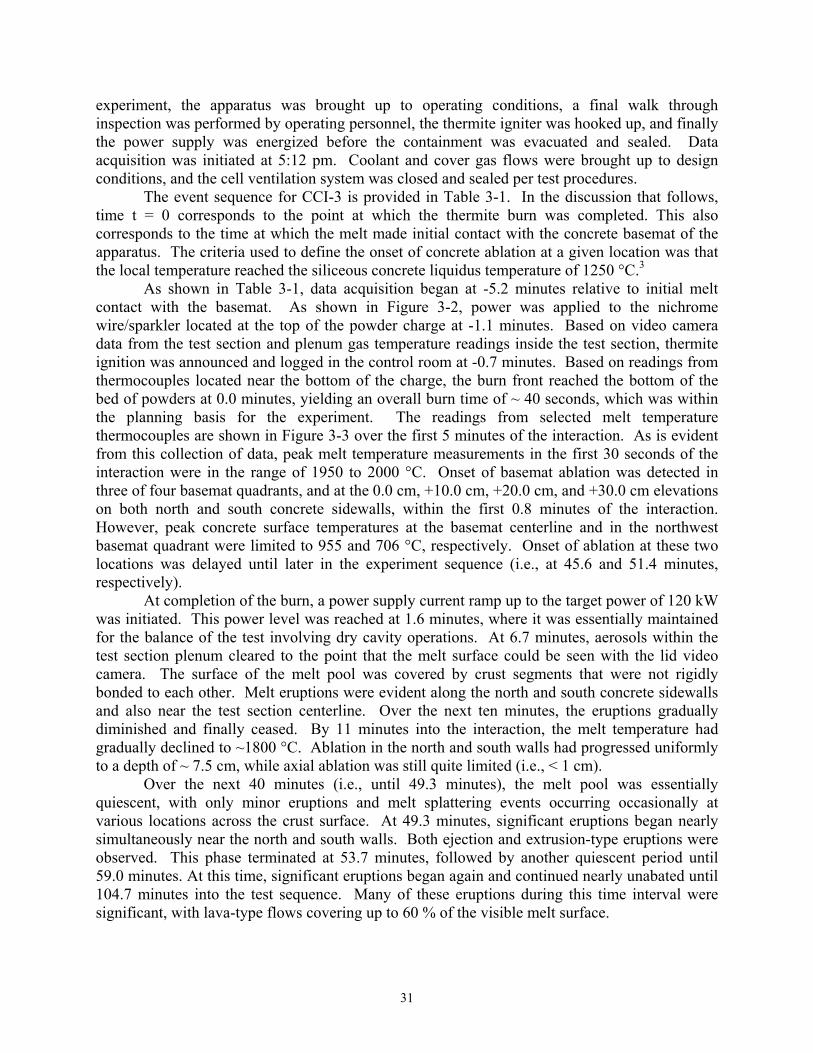
31
experiment, the apparatus was brought up to operating conditions, a final walk through inspection was performed by operating personnel, the thermite igniter was hooked up, and finally the power supply was energized before the containment was evacuated and sealed. Data acquisition was initiated at 5:12 pm. Coolant and cover gas flows were brought up to design conditions, and the cell ventilation system was closed and sealed per test procedures. The event sequence for CCI-3 is provided in Table 3-1. In the discussion that follows, time t = 0 corresponds to the point at which the thermite burn was completed. This also corresponds to the time at which the melt made initial contact with the concrete basemat of the apparatus. The criteria used to define the onset of concrete ablation at a given location was that the local temperature reached the siliceous concrete liquidus temperature of 1250 °C.3
As shown in Table 3-1, data acquisition began at -5.2 minutes relative to initial melt contact with the basemat. As shown in Figure 3-2, power was applied to the nichrome wire/sparkler located at the top of the powder charge at -1.1 minutes. Based on video camera data from the test section and plenum gas temperature readings inside the test section, thermite ignition was announced and logged in the control room at -0.7 minutes. Based on readings from thermocouples located near the bottom of the charge, the burn front reached the bottom of the bed of powders at 0.0 minutes, yielding an overall burn time of ~ 40 seconds, which was within the planning basis for the experiment. The readings from selected melt temperature thermocouples are shown in Figure 3-3 over the first 5 minutes of the interaction. As is evident from this collection of data, peak melt temperature measurements in the first 30 seconds of the interaction were in the range of 1950 to 2000 °C. Onset of basemat ablation was detected in three of four basemat quadrants, and at the 0.0 cm, +10.0 cm, +20.0 cm, and +30.0 cm elevations on both north and south concrete sidewalls, within the first 0.8 minutes of the interaction. However, peak concrete surface temperatures at the basemat centerline and in the northwest basemat quadrant were limited to 955 and 706 °C, respectively. Onset of ablation at these two locations was delayed until later in the experiment sequence (i.e., at 45.6 and 51.4 minutes, respectively).
At completion of the burn, a power supply current ramp up to the target power of 120 kW was initiated. This power level was reached at 1.6 minutes, where it was essentially maintained for the balance of the test involving dry cavity operations. At 6.7 minutes, aerosols within the test section plenum cleared to the point that the melt surface could be seen with the lid video camera. The surface of the melt pool was covered by crust segments that were not rigidly bonded to each other. Melt eruptions were evident along the north and south concrete sidewalls and also near the test section centerline. Over the next ten minutes, the eruptions gradually diminished and finally ceased. By 11 minutes into the interaction, the melt temperature had gradually declined to ~1800 °C. Ablation in the north and south walls had progressed uniformly to a depth of ~ 7.5 cm, while axial ablation was still quite limited (i.e., < 1 cm).
Over the next 40 minutes (i.e., until 49.3 minutes), the melt pool was essentially quiescent, with only minor eruptions and melt splattering events occurring occasionally at various locations across the crust surface. At 49.3 minutes, significant eruptions began nearly simultaneously near the north and south walls. Both ejection and extrusion-type eruptions were observed. This phase terminated at 53.7 minutes, followed by another quiescent period until 59.0 minutes. At this time, significant eruptions began again and continued nearly unabated until 104.7 minutes into the test sequence. Many of these eruptions during this time interval were significant, with lava-type flows covering up to 60 % of the visible melt surface.

32
Table 3-1. CCI-3 Event Sequence (times relative to melt contact with basemat). Time
(Minutes) Event
-5.2 DAS started. -1.1 Power applied to thermite igniter wire. -0.7 Thermite burn initiated; view of melt surface occluded by aerosol within 5 seconds. 0.0 Thermite burn completed (burn time ~ 40 seconds); melt temperature ~1950 °C
0.0 - 0.8 Onset of basemat ablation detected in three of four basemat quadrants (i.e., NE, SE, and SW quadrants), and at the 0.0 cm, +10.0 cm, +20.0 cm, and +30.0 cm elevations on both N and S concrete sidewalls. However, peak concrete surface temperatures measured at the basemat centerline and in the NW quadrant were limited to 955 and 706 °C, respectively.
1.6 Target input power of 120 kW reached. 4.1 Camera filter installed (No. 2). 6.3 Voltage limit of 56 volts reached on Tap 1 of the power supply; changed to Tap 2
(113 volt) voltage tap. 11.0 Average melt temperature has steadily declined to ~1800 °C; lateral ablation in N
and S walls ~ 7.5 cm; axial ablation < 1 cm. 6.7 - 17.7 Aerosol clears to reveal the crusted melt upper surface. The crust is perforated,
with melt eruptions occurring along the N and S concrete walls and near the test section centerline. As time progresses, eruptions near the center diminish and eventually cease at 9.7 minutes. Eruptions along the N wall eventually cease at 16.5 minutes, while eruptions along the S wall finally cease at 17.7 minutes.
17.7 - 41.2 Essentially quiescent period with minor eruption and melt splattering events occurring occasionally at various locations across the crust surface.
41.2 - 42.9 Eruption with lava flow near test section centerline. 45.6 Onset of basemat ablation detected in NW quadrant.
42.9 - 49.3 Quiescent period. 51.4 Onset of ablation at basemat centerline finally detected.
49.3 - 53.7 Eruptions begin nearly simultaneously near N and S walls. Both ejection and extrusion-type eruptions occur. Eruptions near the N wall eventually cease at 52.1 minutes, while eruptions near the S wall cease at 53.7 minutes.
53.7 - 59.0 Essentially quiescent period; minor eruption near S wall. 59.0 - 90.3 Nearly continuous eruptions with predominately extrusion-type eruption processes
periodically occurring along both walls and less frequently near the center of the crust. Several eruptions lead to flows that cover 50+ % of the crust surface.
91.4 - 97.5 Major eruptions begin again near S wall. Flows cover ~ 60 % of crust surface. Molten material that flows to the N side apparently melts through crust, leading to initiation of eruptions at that location too.
96.2 Voltage limit of 113 volts reached on Tap 2 of the power supply; changed to Tap 3 (169 volt) voltage tap.
97.5 - 104.7 Quiescent period. 104.7 Crust lance inserted to breach the crust prior to water injection; eruptions through
the opening ensue. Crust load force at breach: 1.66 kN; crust elevation: 25.2 cm. 107.6 Sidewall ablation reaches 29.2 cm in S sidewall at +10.0 cm elevation; water
injection initiated; average melt temperature ~1650 °C. Debris cooling rate constant at ~110 kW.
107.6-108.0 Melt water interaction through breach opening is evident. Surface eventually darkens. Power supply operation in constant voltage mode initiated at 108.0 minutes.

33
Table 3-1 (Contd.). CCI-3 Event Sequence (times relative to melt contact with basemat).
Time (Minutes)
Event
140.3 Ablation depth in S wall approaches the 34.3 cm limit. Lance used to breach the crust. Two load peaks observed: the first peak was 0.34 kN at +22.2 cm elevation, while the second was 0.67 kN at +20.0 cm elevation. Breach does not noticeably increase the debris cooling rate.
143.1 Ablation reaches the 34.3 cm limit at the +10.0 cm elevation in the S sidewall. 146.4 Power supply operation terminated. 173.3 Data logging terminated.
At ~ 100 minutes, it became apparent that the cavity would soon be flooded based on the
criterion of reaching the 30 cm ablation depth in the south sidewall. The view of the melt upper surface indicated the continued presence of a stable crust. On this basis, the crust lance was inserted and the crust was breached at 104.7 minutes. The crust upper surface elevation was detected at 25.2 cm, and the load force at breach was 1656 kN. The opening through the crust revealed an agitated melt pool beneath; eruptions through the opening in the crust began immediately and continued until the cavity was flooded. The official criterion for water addition was reached at 107.6 minutes, at which time the concrete liquidus temperature of 1250 °C was reached at the 29.2 cm ablation depth in the south sidewall at the +10.0 cm elevation. The cavity was flooded with water at this time and the level was brought up to ~ 50 cm. The peak debris cooling rate was limited to ~ 110 kW; the cooling rate remained nearly constant over the balance of the test. Makeup water was added periodically as time progressed to maintain the water level over the melt roughly in the range of 50 ± 10 cm. Following cavity flooding, water could be seen flooding through the hole in the crust created by the lance, and the melt surface eventually went black at 108.0 minutes. At this time, power supply operation was switched from constant power to constant voltage mode per the normal test operating procedure. Subsequently, the input power fell precipitously, which is consistent with substantial debris cooling. At ~ 140 minutes, it became apparent that the test would soon be terminated on the basis of reaching the 35 cm ablation depth in the south wall. On this basis, the lance was inserted a second time to provide data on the crust breach cooling mechanism. During this insertion sequence, two load peaks observed: the first peak was 0.34 kN at the +22.2 cm elevation, while the second was 0.67 kN at the +20.0 cm elevation. Crust breach did not noticeably increase the debris cooling rate for this test. This observation would be consistent with the formation of a pre-existing quenched debris layer at the corium upper surface at the time the lance was inserted.
Following the lance insertion sequence, power supply operation continued in a constant voltage operating mode. The official criterion for terminating the test was reached at 143.1 minutes, at which time the concrete liquidus temperature was reached at the 34.3 cm ablation depth in the south sidewall at the +10.0 cm elevation. On this basis, power supply operations were terminated at 146.4 minutes. The operators continued to log data until 173.2 minutes to provide additional information on the debris cooling rate as the melt cooled. At this point, the system was shutdown while following the normal test termination procedures. The DAS was restarted to record the long-term cool down data. The experiment was left unattended to cool down overnight.

34
0
10
20
30
40
50
-2.0 -1.5 -1.0 -0.5 0.0 0.5 1.0
Elapsed Time (Minutes)
Igni
tor V
olta
ge (A
rbita
ry U
nits
)
Figure 3-2. Voltage Reading Across Thermite Igniter Shunt.
Basemat Type C Array
0
500
1000
1500
2000
2500
-1 0 1 2 3 4 5
Elapsed Time (Minutes)
Tem
pera
ture
(˚C
)
WCL-1 (+15.0 cm)WCL-2 (+10.0 cm)WCL-3 (+5.0 cm)WNW-1 (+9.5 cm)WNW-2 (+4.5 cm)WSE-1 (+4.0 cm)
Figure 3-3. Bulk Melt Temperature Data Over the First 5 Minutes of the Interaction.

35
4.0 TEST RESULTS A summary description of the principal experiment results from CCI-3 is provided in this section. A complete list of instruments used in the test is provided in Appendix A, while plots of all test data are provided in Appendix B. 4.1.1 Electric Power
The DEH power supply voltage, current, and total input power for CCI-3 are shown in Figures 4-1 through 4-3, respectively. At completion of the thermite burn, the power supply voltage was steadily increased until the input power reached the target level of 120 kW at 1.6 minutes. Thereafter, input power was held constant in the range of 120 ± 5 kW over the balance of dry cavity operations. Two power supply range changes were made over the course of the test as the electric load provided by the melt evolved. The first change was made at 6.3 minutes when the 56 volt limit was reached on Tap 1 of the supply, while the second change was made at 96.2 minutes when the 113 volt limit on Tap 2 was reached. In general, the power supply voltage increased and total current decreased during the test. This trend was caused by the fact that the melt resistivity increased as concrete oxides from ablation were added to the melt.
Soon after cavity flooding at 107.6 minutes, power supply control was switched from constant power at the 120 kW level to a constant voltage operating mode. Operation in this manner maintains the power density constant in the molten (i.e., electrically conductive) region should a quench front develop. As is evident from Figure 4-3, input power dropped steadily after the cavity was flooded, which is indicative of debris cooling. Operations were terminated at 146.4 minutes on the basis of reaching the maximum permissible ablation depth of 34.3 cm in the south concrete sidewall.
0
20
40
60
80
100
120
140
-10 0 10 20 30 40 50 60 70 80 90 100 110 120 130 140 150 160 170 180
Elapsed Time (Minutes)
Pow
er S
uppl
y Vo
ltage
(Vol
ts)
Figure 4-1. Power Supply Voltage.

36
0
500
1000
1500
2000
2500
3000
3500
-10 0 10 20 30 40 50 60 70 80 90 100 110 120 130 140 150 160 170 180
Elapsed Time (Minutes)
Pow
er S
uppl
y C
urre
nt (A
mps
)
Figure 4-2. Power Supply Current.
0
20
40
60
80
100
120
140
-10 0 10 20 30 40 50 60 70 80 90 100 110 120 130 140 150 160 170 180
Elapsed Time (Minutes)
Gro
ss D
EH In
put P
ower
( kW
)
Figure 4-3. Total DEH Input Power.

37
4.2 Melt Temperatures A total of thirty six W5%Re/W26%Re (Type C) thermocouple junctions were used to monitor melt temperatures at various axial and lateral locations in CCI-3. The junction locations for these thermocouples are shown in Figures 2-6, 2-22, and 2-23. The thermocouples were configured within five four-junction and two eight-junction thermocouple arrays. The five four-junction units were all located in the concrete basemat; each of these arrays was protected by a 0.95 cm diameter tungsten thermowell. The two eight-junction arrays were laterally configured in the two concrete sidewalls; each of these units was protected by a 1.27 cm tungsten thermowell. Data from the five Type C arrays in the basemat are provided in Figures 4-4 through 4-8, while data from the two sidewall arrays are provided in Figures 4-9 and 4-10. To provide an indication of the overall melt temperature behavior during the course of the test, a graph including the readings from most of the thermocouples is provided in Figure 4-11. To improve the readability of this data, two steps have been taken: i) the data have been one-minute averaged, and ii) only data preceding the first off-scale reading by the thermocouples are shown.
Examination of the data in Figure 4-11 indicates that: i) the average melt temperature declined from ~1950 ˚C at the start of the interaction, to ~ 1650 ˚C at the time the cavity was flooded, and ii) during the last 90 minutes of operation with DEH present, melt temperatures are fairly uniform across the extent of the interaction, generally clustering within a band of approximately ± 50˚C of the average melt temperature at any given time. However, in the time interval from 10 to 60 minutes, significant temperature gradients of up to 200 ˚C are noted. Furthermore, unlike the results of test CCI-24, the data in Figures 4-9 and 4-10 indicate that water was not able to penetrate into the corium along the core-concrete interface as the interaction progressed.
Basemat Type C Array
0
200
400
600
800
1000
1200
1400
1600
1800
2000
2200
-10 0 10 20 30 40 50 60 70 80 90 100 110 120 130 140 150 160 170 180
Elapsed Time (Minutes)
Tem
pera
ture
(˚C
)
WCL-1 (+15.0 cm)WCL-2 (+10.0 cm)WCL-3 (+5.0 cm)WCL-4 (0.0 cm)
Figure 4-4. Melt Temperature Data From Basemat Type C “WCL” Array.

38
Basemat Type C Array
0
200
400
600
800
1000
1200
1400
1600
1800
2000
2200
-10 0 10 20 30 40 50 60 70 80 90 100 110 120 130 140 150 160 170 180
Elapsed Time (Minutes)
Tem
pera
ture
(˚C
)WNW-1 (+9.5 cm)WNW-2 (+4.5 cm)WNW-3 (-0.5 cm)WNW-4 (-5.5 cm)
Figure 4-5. Melt Temperature Data From Basemat Type C “WNW” Array.
Basemat Type C Array
0
200
400
600
800
1000
1200
1400
1600
1800
2000
2200
-10 0 10 20 30 40 50 60 70 80 90 100 110 120 130 140 150 160 170 180
Elapsed Time (Minutes)
Tem
pera
ture
(˚C
)
WNE-1 (-1.5 cm)WNE-2 (-6.5 cm)WNE-3 (-11.5 cm)WNE-4 (-16.5 cm)
Figure 4-6. Melt Temperature Data From Basemat Type C “WNE” Array.
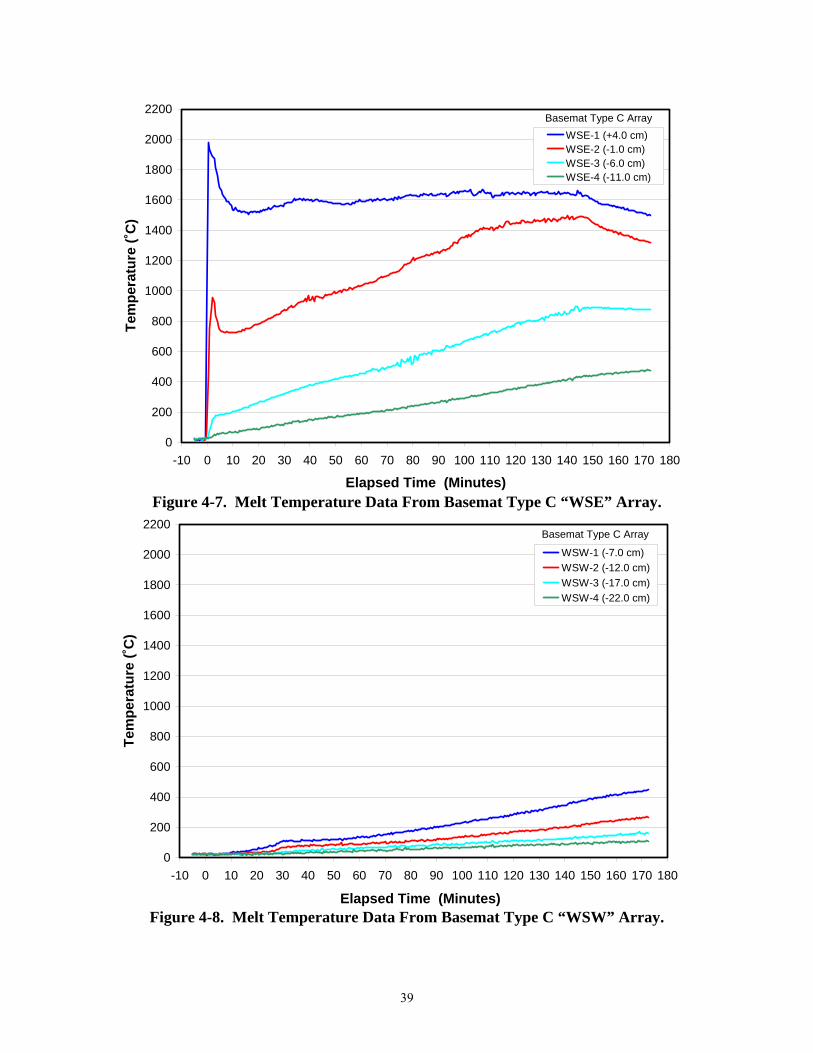
39
Basemat Type C Array
0
200
400
600
800
1000
1200
1400
1600
1800
2000
2200
-10 0 10 20 30 40 50 60 70 80 90 100 110 120 130 140 150 160 170 180
Elapsed Time (Minutes)
Tem
pera
ture
(˚C
)WSE-1 (+4.0 cm)WSE-2 (-1.0 cm)WSE-3 (-6.0 cm)WSE-4 (-11.0 cm)
Figure 4-7. Melt Temperature Data From Basemat Type C “WSE” Array.
Basemat Type C Array
0
200
400
600
800
1000
1200
1400
1600
1800
2000
2200
-10 0 10 20 30 40 50 60 70 80 90 100 110 120 130 140 150 160 170 180
Elapsed Time (Minutes)
Tem
pera
ture
(˚C
)
WSW-1 (-7.0 cm)WSW-2 (-12.0 cm)WSW-3 (-17.0 cm)WSW-4 (-22.0 cm)
Figure 4-8. Melt Temperature Data From Basemat Type C “WSW” Array.
40
N Sidewall Type C Array+5.0 cm Elevation
0
200
400
600
800
1000
1200
1400
1600
1800
2000
2200
-10 0 10 20 30 40 50 60 70 80 90 100 110 120 130 140 150 160 170 180
Elapsed Time (Minutes)
Tem
pera
ture
(˚C
)
WN-1 (0.0 cm) WN-2 (-2.5 cm)WN-3 (-5.1 cm) WN-4 (-7.6 cm)WN-5 (-10.2 cm) WN-6 (-15.2 cm)WN-7 (-20.3 cm) WN-8 (-25.4 cm)
Figure 4-9. Melt Temperature Data From North Sidewall Type C “WN” Array.
S Sidewall Type C Array+5.0 cm Elevation
0
200
400
600
800
1000
1200
1400
1600
1800
2000
2200
-10 0 10 20 30 40 50 60 70 80 90 100 110 120 130 140 150 160 170 180
Elapsed Time (Minutes)
Tem
pera
ture
(˚C
)
WS-1 (0.0 cm)WS-2 (-2.5 cm)WS-3 (-5.1 cm)WS-4 (-7.6 cm)WS-5 (-10.2 cm)WS-6 (-15.2 cm)WS-7 (-20.3 cm)WS-8 (-25.4 cm)
Figure 4-10. Melt Temperature Data From North Sidewall Type C “WS” Array.

41
Water Addition (107.4 Minutes)
0
200
400
600
800
1000
1200
1400
1600
1800
2000
2200
-10 0 10 20 30 40 50 60 70 80 90 100 110 120 130 140 150 160 170 180
Elapsed Time (Minutes)
Tem
pera
ture
(˚C
)DEH Terminated(146.4 Minutes)
Figure 4-11. Data From Selected Melt Temperature Thermocouples.
4.3 Concrete Basemat and Sidewall Ablation Rates
The basemat was instrumented with five multi-junction Type K thermocouple arrays to monitor the axial progression of the ablation front, while each concrete sidewall was instrumented with six arrays to monitor the lateral ablation front progression at six different elevations. The location and identification of these thermocouple assemblies are shown in Figures 2-6, 2-22, and 2-23. The first junction of each array was mounted flush with the concrete surface. When a thermocouple reached the siliceous concrete liquidus temperature of 1250 ºC,3 the melt was considered to be in contact with the thermocouple at the junction location. The sequential rise in signals from the basemat centerline array as the test progressed is shown in Figure 4-12. As noted earlier, only data preceding the first off-scale reading by the thermocouples are shown in this figure. The analogous plots showing the thermal response in the North and South concrete sidewalls at the +10.0 cm elevation location are provided in Figures 4-13 and 4-14, respectively. Plots of the thermal response at all basemat and sidewall array locations are provided in Appendix B.
Figure 4-15 provides the axial ablation depth versus time based on the signal responses from the Type K basemat arrays, while Figures 4-16 and 4-17 provide the analogous plots of the lateral ablation depth in the North and South sidewalls, respectively. Finally, Figure 4-18 provides a comparison of the peak ablation depths versus time recorded on all three concrete surfaces during the test. Examination of these figures indicates: i) there is no substantial incoherence between the lateral ablation rates observed on the North and South sidewalls, and ii) lateral ablation is substantially greater than axial for this particular concrete type.

42
Basemat Type K Array
0
250
500
750
1000
1250
1500
1750
-10 0 10 20 30 40 50 60 70 80 90 100 110 120 130 140 150 160 170 180
Elapsed Time (Minutes)
Tem
pera
ture
(˚C
)A-1 (0.0 cm) A-2 (-1.3 cm) A-3 (-2.5 cm) A-4 (-5.1 cm)A-5 (-7.6 cm) A-6 (-11.4 cm) A-7 (-15.2 cm) A-8 (-19.1 cm)A-9 (-24.1 cm) A-10 (-29.2 cm) A-11 (-34.3 cm)
Figure 4-12. Thermal Response of the Concrete Basemat at the Centerline (“A” Array).
N Sidewall Type K Array, +10 cm Elevation
0
200
400
600
800
1000
1200
1400
1600
1800
-10 0 10 20 30 40 50 60 70 80 90 100 110 120 130 140 150 160 170 180
Elapsed Time (Minutes)
Tem
pera
ture
(˚C
)
SWI-1 (0.0 cm) SWI-2 (-1.3 cm) SWI-3 (-2.5 cm) SWI-4 (-5.1 cm)SWI-5 (-7.6 cm) SWI-6 (-11.4 cm) SWI-7 (-15.2 cm) SWI-8 (-19.1 cm)SWI-9 (-24.1 cm) SWI-10 (-29.2 cm) SWI-11 (-34.3 cm)
Figure 4-13. North Concrete Sidewall Thermal Response at +10.0 cm ( “SWI” Array).
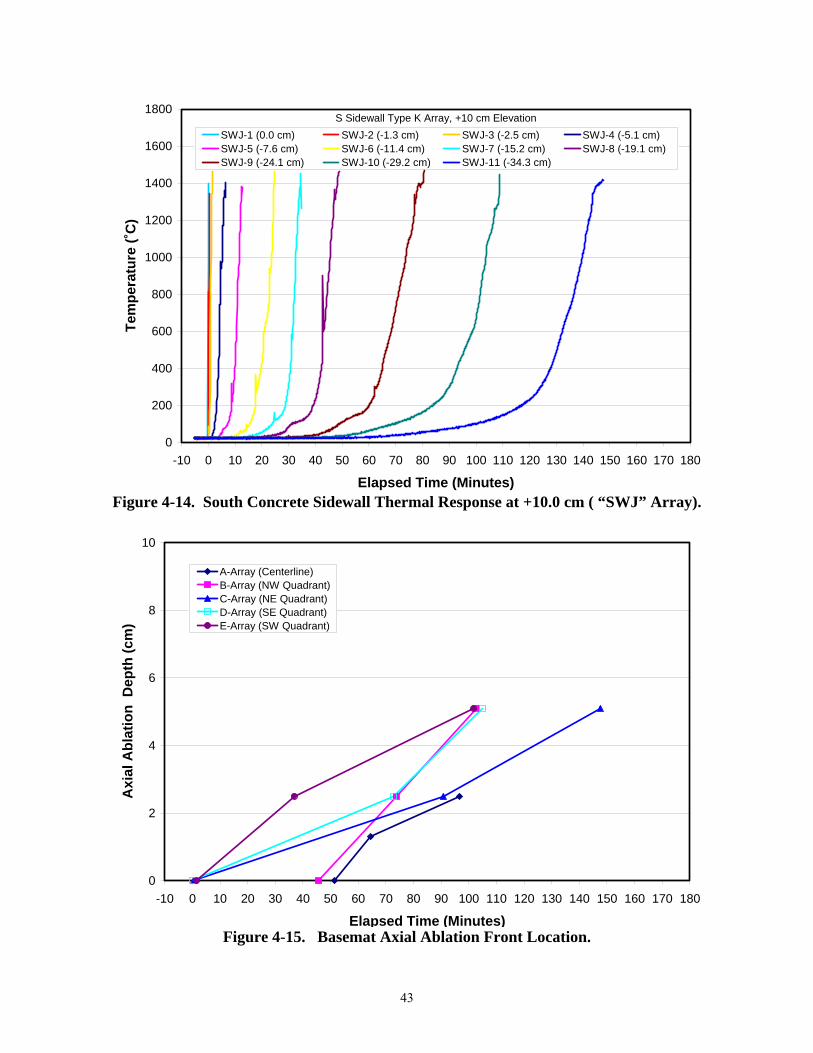
43
S Sidewall Type K Array, +10 cm Elevation
0
200
400
600
800
1000
1200
1400
1600
1800
-10 0 10 20 30 40 50 60 70 80 90 100 110 120 130 140 150 160 170 180
Elapsed Time (Minutes)
Tem
pera
ture
(˚C
)SWJ-1 (0.0 cm) SWJ-2 (-1.3 cm) SWJ-3 (-2.5 cm) SWJ-4 (-5.1 cm)SWJ-5 (-7.6 cm) SWJ-6 (-11.4 cm) SWJ-7 (-15.2 cm) SWJ-8 (-19.1 cm)SWJ-9 (-24.1 cm) SWJ-10 (-29.2 cm) SWJ-11 (-34.3 cm)
Figure 4-14. South Concrete Sidewall Thermal Response at +10.0 cm ( “SWJ” Array).
0
2
4
6
8
10
-10 0 10 20 30 40 50 60 70 80 90 100 110 120 130 140 150 160 170 180
Elapsed Time (Minutes)
Axi
al A
blat
ion
Dep
th (c
m)
A-Array (Centerline)B-Array (NW Quadrant)C-Array (NE Quadrant)D-Array (SE Quadrant)E-Array (SW Quadrant)
Figure 4-15. Basemat Axial Ablation Front Location.

44
North Sidewall Arrays
0
5
10
15
20
25
30
35
-10 0 10 20 30 40 50 60 70 80 90 100 110 120 130 140 150 160 170 180
Time (Minutes)
Nor
th S
idew
all A
blat
ion
Dep
th (c
m)
SWG (0.0 cm Elevation)SWI (+10.0 cm Elevation)SWK (+20.0 cm Elevation)SWM (+30.0 cm Elevation)
Figure 4-16. North Sidewall Lateral Ablation Front Location.
South Sidewall Arrays
0
5
10
15
20
25
30
35
-10 0 10 20 30 40 50 60 70 80 90 100 110 120 130 140 150 160 170 180
Time (Minutes)
Sout
h Si
dew
all A
blat
ion
Dep
th (c
m)
SWH (0.0 cm Elevation)SWJ (+10.0 cm Elevation)SWL (+20.0 cm Elevation)SWN (+30.0 cm Elevation)
Trigger for Water Addition
Trigger for Test Termination
Figure 4-17. South Sidewall Lateral Ablation Front Location.

45
0
5
10
15
20
25
30
35
-10 0 10 20 30 40 50 60 70 80 90 100 110 120 130 140 150 160 170 180
Time (Minutes)
Abl
atio
n D
epth
(cm
)
Basemat SW Quadrant E-ArrayNorth Sidewall SWI-Array (+10 cm Elevation)South Sidewall SWJ-Array (+10 cm Elevation)
Figure 4-18. Maximum Axial and Lateral Ablation Depths Versus Time.
To first order, the cavity shape can be estimated from the thermocouple data presented
above. This estimate is provided in Figure 4-19. This profile was developed by performing a spline curve fit to the local ablation depth data points recorded at each basemat and sidewall thermocouple array location. Above the layer of solidified melt, the ablation profile is based on direct measurement of the cavity profile during posttest debris examinations. The posttest cavity erosion profile will be refined once the posttest examinations are completed.
4.4 Test Section Water Inlet Conditions As summarized in Table 1-1, the water supply system was designed to provide an initial water inventory of 125 l to the test section at a flow rate of nominally 120 liters/minute (2 l/sec), with makeup to maintain a constant collapsed water level (volume) of 50 ± 5 cm (125 ± 13 l) over the melt. The actual water flow rate to the test section as measured by the paddlewheel flow meter in the supply line (see Figure 2-15) is shown in Figure 4-20. As shown in the Figure, the actual flow rate ranged from 100 to 190 liters/minute. The inlet water temperature was constant at ~25 ˚C over the course of the experiment (see Appendix B). The supply tank water inventory, as measured by the magnetic level float in this tank, is shown in Figure 4-21. The water head over the melt calculated based on conservation of mass (i.e., the water volume in the test section equals the initial supply/quench system water volumes minus the volumes in these tanks at the current time) is shown in Figure 4-22. The head measured by the two differential pressure transducers located in the test section to monitor water level (see Figure
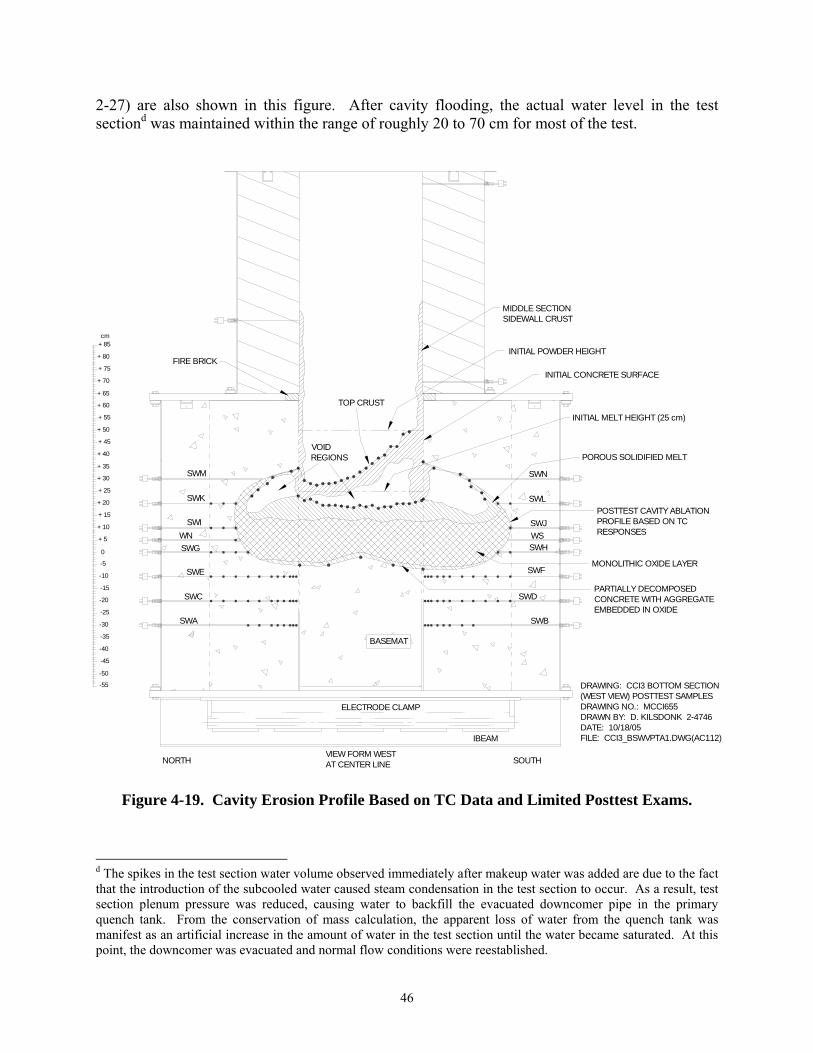
46
2-27) are also shown in this figure. After cavity flooding, the actual water level in the test sectiond was maintained within the range of roughly 20 to 70 cm for most of the test.
DRAWING: CCI3 BOTTOM SECTION(WEST VIEW) POSTTEST SAMPLES DRAWING NO.: MCCI655DRAWN BY: D. KILSDONK 2-4746DATE: 10/18/05 FILE: CCI3_BSWVPTA1.DWG(AC112)
-50
-45
-35
-40
-30
-20
-25
-15
-5
-10
0
+ 10
+ 5
+ 15
+ 75
+ 45
+ 30
+ 20
+ 25
+ 40
+ 35
+ 60
+ 50
+ 55
+ 70
+ 65
+ 80
+ 85cm
-55
BASEMAT
INITIAL POWDER HEIGHT
NORTH SOUTHVIEW FORM WESTAT CENTER LINE
IBEAM
ELECTRODE CLAMP
POSTTEST CAVITY ABLATION PROFILE BASED ON TC RESPONSES
MIDDLE SECTIONSIDEWALL CRUST
TOP CRUST
INITIAL MELT HEIGHT (25 cm)
INITIAL CONCRETE SURFACE
VOIDREGIONS
SWK
SWIWNSWG
SWE
SWC
SWA
SWM
SWL
SWJWSSWH
SWF
SWD
SWB
SWN
POROUS SOLIDIFIED MELT
MONOLITHIC OXIDE LAYER
FIRE BRICK
PARTIALLY DECOMPOSED CONCRETE WITH AGGREGATE EMBEDDED IN OXIDE
Figure 4-19. Cavity Erosion Profile Based on TC Data and Limited Posttest Exams.
d The spikes in the test section water volume observed immediately after makeup water was added are due to the fact that the introduction of the subcooled water caused steam condensation in the test section to occur. As a result, test section plenum pressure was reduced, causing water to backfill the evacuated downcomer pipe in the primary quench tank. From the conservation of mass calculation, the apparent loss of water from the quench tank was manifest as an artificial increase in the amount of water in the test section until the water became saturated. At this point, the downcomer was evacuated and normal flow conditions were reestablished.

47
0
20
40
60
80
100
120
140
160
180
200
-10 0 10 20 30 40 50 60 70 80 90 100 110 120 130 140 150 160 170 180
Elapsed Time (Minutes)
Flow
rate
(lite
rs/m
in)
FM-1: Water Flowrate to Test Section
FM-2: Quench Tank Coil Flowrate
Figure 4-20. Test Section Water Inlet and Quench Tank Coil Water Flow Rates.
650
700
750
800
850
900
950
1000
-10 0 10 20 30 40 50 60 70 80 90 100 110 120 130 140 150 160 170 180
Elapsed Time (Minutes)
Wat
er V
olum
e (L
iters
)
Figure 4-21. Water Supply Tank Water Volume.

48
0
10
20
30
40
50
60
70
80
90
100
-10 0 10 20 30 40 50 60 70 80 90 100 110 120 130 140 150 160 170 180
Elapsed Time (Minutes)
Wat
er H
ead
(cm
)PT-3: Insertion Probe HeadPT-4: Static Probe HeadCalculated Head
Figure 4-22. Water Head Over Melt.
4.5 Crust Lance Data Two key test objectives for CCI-3 were to: i) obtain in-situ crust strength data to supplement the room temperature strength database being assembled as part of the SSWICS program, and ii) provide information on the nature and the extent of the debris cooling that occurs after the crust fails. This subsection provides the results of the crust strength measurement, while the debris cooling data is provided in the next subsection.
As shown in Table 3-1, the lance was inserted both prior to and after water addition to the test section to break the crust, as specified in the test procedure. The output from the crust lance force transducer is shown in Figure 4-23, while the lance displacement transducer output is shown in Figure 4-24. During the insertion prior to water addition, the lance contacted the crust surface at an elevation of +25.2 cm above the initial concrete surface, which is virtually identical to the initial collapsed melt height of 25.0 cm. The lance failed the crust during this insertion; the measured load at failure was 1.66 kN.
As shown in Table 3-1, the lance was inserted a second time ~ 33 minutes after the cavity was flooded to obtain crust strength data under prototypic temperature boundary conditions. As is evident from Figures 4-23 and 4-24, two load peaks observed were observed during this insertion. The first peak was 0.34 kN, which was detected at a surface elevation of +22.2 cm, while the second load peak was 0.67 kN, which was detected at a +20.0 cm elevation. Unlike test CCI-15, crust breach caused no noticeable increase in the debris cooling rate. This observation may indicate that a pre-existing quenched debris layer had already formed at the corium upper surface at the time the lance was inserted.

49
-200
0
200
400
600
800
1000
1200
1400
1600
1800
-10 0 10 20 30 40 50 60 70 80 90 100 110 120 130 140 150 160 170 180
Elapsed Time (Minutes)
Lanc
e A
pplie
d Lo
ad (k
N)
Peak Load Recorded on DAS (~0.2 Hz)Peak Load From Transducer Power Supply Readout (~3 Hz)
Figure 4-23. Load Force Exerted on Crust vs. Time.
0
10
20
30
40
50
60
70
80
90
100
-10 0 10 20 30 40 50 60 70 80 90 100 110 120 130 140 150 160 170 180
Elapsed Time (Minutes)
Lanc
e Ti
p El
evat
ion
Abo
ve B
asem
at (c
m)
Loading Contact at +25.2 cm Elevation
Loading Contacts at +22.2 and +20.0 cm Elevations
Figure 4-24. Lance Tip Elevation Over Initial Concrete Surface.

50
4.6 Corium Quench Rate Another key test objective was to obtain data on the nature and extent of the corium quench process when flooding occurs late in the sequence. Given the system instrumentation layout described in Section 2, sufficient data is available to determine the corium/water heat transfer rate from the gross energy transport rate into the quench system, including the following energy source/sink terms: (i) water heat up and boil off in the test section, (ii) heat transfer from test section sidewalls, (iii) heat transfer from interconnecting piping between the test section and quench tank, (iv) sensible and latent heat transport into the quench tank (i.e., water inventory temperature change and water inventory mass), and (v) heat removal from the quench tank through the cooling coil. However, for the purposes of this data report, a first-order estimate of the heat flux is provided based on the steaming rate from the test section. The water levels in each of the three quench system tanks are shown in Figure 4-25.
Given this collection of information, the overall corium cooling rate can be estimated from the equation:
•
•= slv mhq
where hlv is the water latent heat of vaporization (2.256 MJ/kg), and •
sm is the steam mass flow rate. As shown in Figure 4-25, the steaming rate from the test section after the cavity was flooded was essentially constant at 2.91 liters/min, which is equivalent to a debris cooling rate of 109.4 kW based on the above equation. Based on the limited posttest examinations that had been conducted by the time this report was issued, the upper surface area of the solidified corium was < 0.5 m2 (see Figure 4-19). Thus, the heat flux from the corium surface was nearly constant at > 218 kW/m2.
250
275
300
325
350
375
400
425
450
475
500
-10 0 10 20 30 40 50 60 70 80 90 100 110 120 130 140 150 160 170 180
Elapsed Time (Minutes)
Wat
er V
olum
e (L
iters
)
Quench TankOverflow TankSpray Tank
Slope = 2.91 l/min, which is equivalent to 109.4 kW corium cooling rate.
Lance inserted to breach crust at 140.3 minutes
Figure 4-25. Quench System Tank Water Volume Data.

51
As shown in Table 3-1 and Figure 4-25, the crust lance was used to breach the bridge crust at 140.3 minutes. As noted previously, crust breach caused no noticeable increase in the debris cooling rate, which may indicate that a pre-existing quenched debris layer had already formed at the corium upper surface at the time the lance was inserted. 4.7 Electrode Current Monitoring System Data
During CCI-3, an attempt was made to monitor the voltage drop across the lower 15 cm of selected tungsten electrodes using lacquer-insulated 14 gauge wires that were passed through potted seals into the test section along the bottom support plate and clamped at the 15 cm elevation. Figure 2-28 provides a drawing that shows the electrodes that were wired for current monitoring. Unfortunately, the IEEE-488 buss extender on the data transmission line failed early in the experiment sequence for this test and so data from this instrument system was not obtained for CCI-3.

52
5.0 REFERENCES
1. B. W. Spencer, et al., “MACE Scoping Test Data Report,” ACE-TR-D03, June, 1991. 2. S. Lomperski, M. T. Farmer, D. J. Kilsdonk, and R. W. Aeschlimann, “SSWICS-6 Test
Data Report – Thermalhydraulic Results,” Rev. 0, OECD/MCCI-2004-TR03, March 19, 2004.
3. D. H. Thompson, M. T. Farmer, J. K. Fink, D. R. Armstrong, and B. W. Spencer, “ACE
Phase C Final Report: Volume I – MCCI Thermalhydraulic Results,” ACE-TR-C42 Volume I, September, 1997.
4. M. T. Farmer, S. Lomperski, D. J. Kilsdonk, and R. W. Aeschlimann, “2-D Core
Concrete Interaction (CCI) Tests: CCI-2 Test Data Report-Thermalhydraulic Results,” OECD/MCCI-2004-05, October 15, 2005.
5. M. T. Farmer, S. Lomperski, D. J. Kilsdonk, and R. W. Aeschlimann, “2-D Core
Concrete Interaction (CCI) Tests: CCI-1 Test Data Report-Thermalhydraulic Results,” OECD/MCCI-2004-01, January 31, 2004.

53
APPENDIX A Data Acquisition System Channel Assignments
This Appendix provides the channel assignments for the three independent DAS
systems that were used to record the data for CCI-2. For convenience, these three 128 channel systems were referred to the “Basemat”, “Power,” and “Quench” systems by operating personnel. The channel assignment lists for each of these three systems are provided in Tables A-1 through A-3. The data recorded on each of these channels is provided in Appendix B.
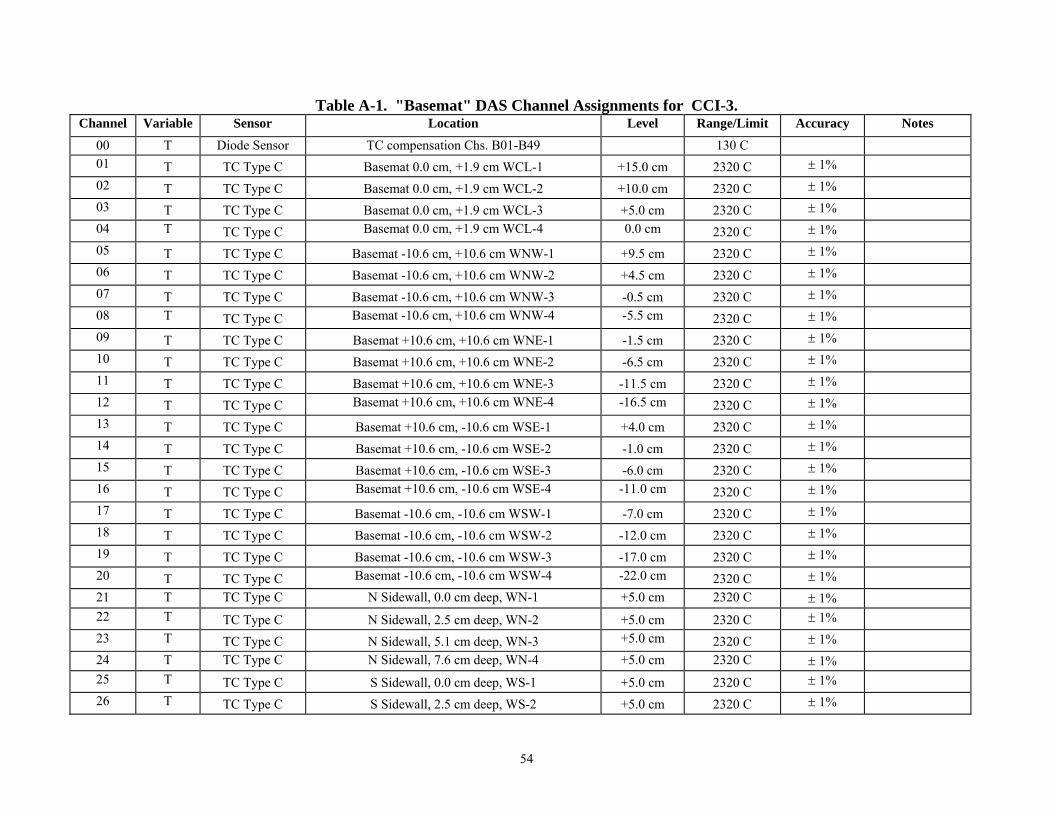
54
Table A-1. "Basemat" DAS Channel Assignments for CCI-3. Channel Variable Sensor Location Level Range/Limit Accuracy Notes
00 T Diode Sensor TC compensation Chs. B01-B49 130 C 01
T
TC Type C
Basemat 0.0 cm, +1.9 cm WCL-1
+15.0 cm
2320 C ± 1%
02
T
TC Type C
Basemat 0.0 cm, +1.9 cm WCL-2
+10.0 cm
2320 C ± 1% 03
T
TC Type C
Basemat 0.0 cm, +1.9 cm WCL-3
+5.0 cm
2320 C ± 1%
04 T
TC Type C Basemat 0.0 cm, +1.9 cm WCL-4 0.0 cm
2320 C ± 1% 05
T
TC Type C
Basemat -10.6 cm, +10.6 cm WNW-1
+9.5 cm
2320 C ± 1%
06
T
TC Type C
Basemat -10.6 cm, +10.6 cm WNW-2
+4.5 cm
2320 C ± 1% 07
T
TC Type C
Basemat -10.6 cm, +10.6 cm WNW-3
-0.5 cm
2320 C ± 1%
08 T
TC Type C Basemat -10.6 cm, +10.6 cm WNW-4 -5.5 cm
2320 C ± 1% 09
T
TC Type C
Basemat +10.6 cm, +10.6 cm WNE-1
-1.5 cm
2320 C ± 1%
10
T
TC Type C
Basemat +10.6 cm, +10.6 cm WNE-2
-6.5 cm
2320 C ± 1% 11
T
TC Type C
Basemat +10.6 cm, +10.6 cm WNE-3
-11.5 cm
2320 C ± 1%
12
T
TC Type C Basemat +10.6 cm, +10.6 cm WNE-4 -16.5 cm
2320 C ± 1% 13
T
TC Type C
Basemat +10.6 cm, -10.6 cm WSE-1
+4.0 cm
2320 C ± 1%
14
T
TC Type C
Basemat +10.6 cm, -10.6 cm WSE-2
-1.0 cm
2320 C ± 1% 15
T
TC Type C
Basemat +10.6 cm, -10.6 cm WSE-3
-6.0 cm
2320 C ± 1%
16
T
TC Type C Basemat +10.6 cm, -10.6 cm WSE-4 -11.0 cm
2320 C ± 1% 17
T
TC Type C
Basemat -10.6 cm, -10.6 cm WSW-1
-7.0 cm
2320 C ± 1%
18
T
TC Type C
Basemat -10.6 cm, -10.6 cm WSW-2
-12.0 cm
2320 C ± 1% 19
T
TC Type C
Basemat -10.6 cm, -10.6 cm WSW-3
-17.0 cm
2320 C ± 1%
20
T
TC Type C Basemat -10.6 cm, -10.6 cm WSW-4 -22.0 cm
2320 C ± 1% 21 T TC Type C N Sidewall, 0.0 cm deep, WN-1 +5.0 cm 2320 C ± 1% 22 T
TC Type C
N Sidewall, 2.5 cm deep, WN-2
+5.0 cm
2320 C ± 1%
23 T
TC Type C
N Sidewall, 5.1 cm deep, WN-3 +5.0 cm
2320 C ± 1% 24 T TC Type C N Sidewall, 7.6 cm deep, WN-4 +5.0 cm 2320 C ± 1% 25 T
TC Type C
S Sidewall, 0.0 cm deep, WS-1
+5.0 cm
2320 C ± 1%
26 T
TC Type C
S Sidewall, 2.5 cm deep, WS-2
+5.0 cm
2320 C ± 1%
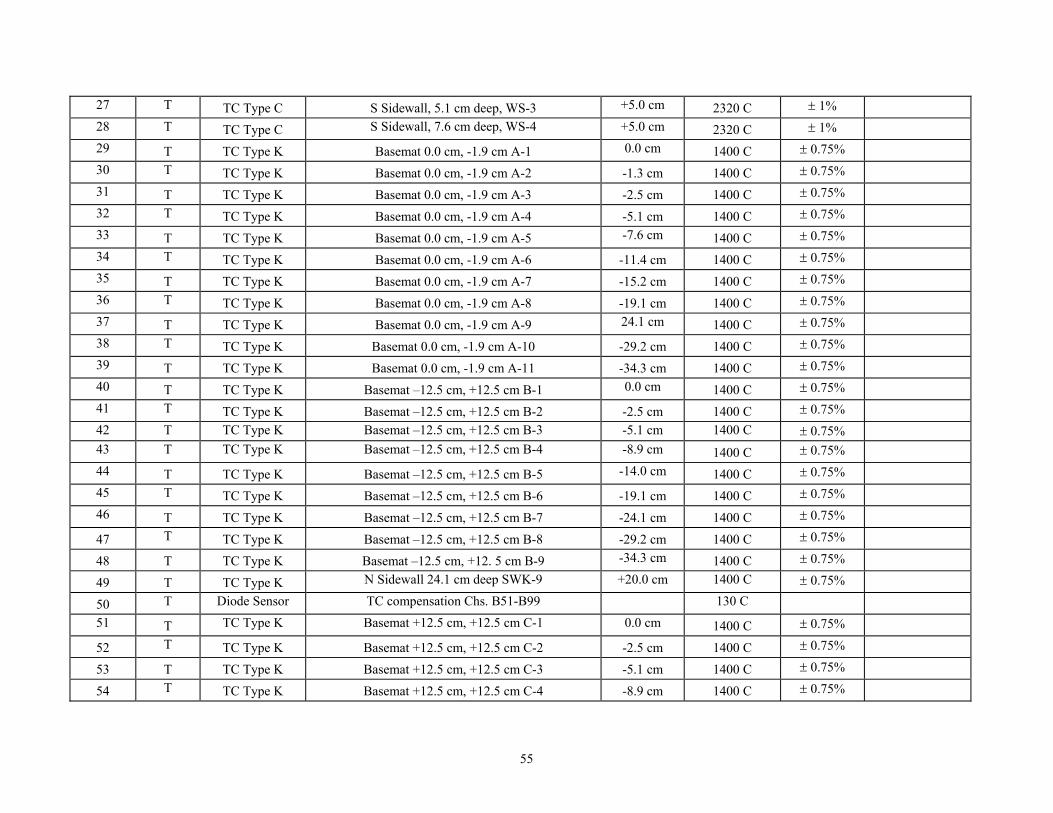
55
27 T
TC Type C
S Sidewall, 5.1 cm deep, WS-3 +5.0 cm
2320 C ± 1% 28 T
TC Type C S Sidewall, 7.6 cm deep, WS-4 +5.0 cm
2320 C ± 1%
29
T
TC Type K
Basemat 0.0 cm, -1.9 cm A-1 0.0 cm
1400 C ± 0.75% 30 T
TC Type K
Basemat 0.0 cm, -1.9 cm A-2
-1.3 cm
1400 C ± 0.75%
31
T
TC Type K
Basemat 0.0 cm, -1.9 cm A-3
-2.5 cm
1400 C ± 0.75% 32 T
TC Type K
Basemat 0.0 cm, -1.9 cm A-4
-5.1 cm
1400 C ± 0.75%
33
T
TC Type K
Basemat 0.0 cm, -1.9 cm A-5 -7.6 cm
1400 C ± 0.75% 34 T
TC Type K
Basemat 0.0 cm, -1.9 cm A-6
-11.4 cm
1400 C ± 0.75%
35
T
TC Type K
Basemat 0.0 cm, -1.9 cm A-7
-15.2 cm
1400 C ± 0.75% 36 T
TC Type K
Basemat 0.0 cm, -1.9 cm A-8
-19.1 cm
1400 C ± 0.75%
37
T
TC Type K
Basemat 0.0 cm, -1.9 cm A-9 24.1 cm
1400 C ± 0.75% 38 T
TC Type K
Basemat 0.0 cm, -1.9 cm A-10
-29.2 cm
1400 C ± 0.75%
39
T
TC Type K
Basemat 0.0 cm, -1.9 cm A-11
-34.3 cm
1400 C ± 0.75% 40
T
TC Type K
Basemat –12.5 cm, +12.5 cm B-1 0.0 cm
1400 C ± 0.75%
41 T
TC Type K
Basemat –12.5 cm, +12.5 cm B-2
-2.5 cm
1400 C ± 0.75% 42 T TC Type K Basemat –12.5 cm, +12.5 cm B-3 -5.1 cm 1400 C ± 0.75% 43 T TC Type K Basemat –12.5 cm, +12.5 cm B-4 -8.9 cm
1400 C ± 0.75%
44
T
TC Type K
Basemat –12.5 cm, +12.5 cm B-5 -14.0 cm
1400 C ± 0.75% 45 T
TC Type K
Basemat –12.5 cm, +12.5 cm B-6
-19.1 cm
1400 C ± 0.75%
46
T
TC Type K
Basemat –12.5 cm, +12.5 cm B-7
-24.1 cm
1400 C ± 0.75%
47 T
TC Type K
Basemat –12.5 cm, +12.5 cm B-8
-29.2 cm
1400 C ± 0.75%
48
T
TC Type K
Basemat –12.5 cm, +12. 5 cm B-9 -34.3 cm
1400 C ± 0.75%
49
T
TC Type K N Sidewall 24.1 cm deep SWK-9 +20.0 cm 1400 C ± 0.75%
50 T Diode Sensor TC compensation Chs. B51-B99 130 C 51
T TC Type K Basemat +12.5 cm, +12.5 cm C-1 0.0 cm
1400 C ± 0.75%
52 T
TC Type K
Basemat +12.5 cm, +12.5 cm C-2
-2.5 cm
1400 C ± 0.75%
53
T
TC Type K
Basemat +12.5 cm, +12.5 cm C-3
-5.1 cm
1400 C ± 0.75%
54 T
TC Type K
Basemat +12.5 cm, +12.5 cm C-4
-8.9 cm
1400 C ± 0.75%

56
55
T
TC Type K
Basemat +12.5 cm, +12.5 cm C-5 -14.0 cm
1400 C ± 0.75%
56 T
TC Type K
Basemat +12.5 cm, +12.5 cm C-6
-19.1 cm
1400 C ± 0.75%
57
T
TC Type K
Basemat +12.5 cm, +12.5 cm C-7
-24.1 cm
1400 C ± 0.75% 58 T
TC Type K
Basemat +12.5 cm, +12.5 cm C-8
-29.2 cm
1400 C ± 0.75%
59
T
TC Type K
Basemat +12.5 cm, +12. 5 cm C-9 -34.3 cm
1400 C ± 0.75%
60
T
TC Type K N Sidewall 29.2 cm deep SWK-10 +20.0 cm 1400 C ± 0.75%
61
T
TC Type K
Basemat +12.5 cm, -12.5 cm D-1 0.0 cm
1400 C ± 0.75%
62 T
TC Type K
Basemat +12.5 cm, -12.5 cm D-2
-2.5 cm
1400 C ± 0.75%
63
T
TC Type K
Basemat +12.5 cm, -12.5 cm D-3
-5.1 cm
1400 C ± 0.75%
64 T
TC Type K
Basemat +12.5 cm, -12.5 cm D-4
-8.9 cm
1400 C ± 0.75%
65
T
TC Type K
Basemat +12.5 cm, -12.5 cm D-5 -14.0 cm
1400 C ± 0.75%
66 T
TC Type K
Basemat +12.5 cm, -12.5 cm D-6
-19.1 cm
1400 C ± 0.75%
67
T
TC Type K
Basemat +12.5 cm, -12.5 cm D-7
-24.1 cm
1400 C ± 0.75%
68 T
TC Type K
Basemat +12.5 cm, -12.5 cm D-8
-29.2 cm
1400 C ± 0.75%
69
T
TC Type K
Basemat +12.5 cm, -12. 5 cm D-9 -34.3 cm
1400 C ± 0.75%
70
T
TC Type K N Sidewall 34.3 cm deep SWK-11 +20.0 cm 1400 C ± 0.75%
71
T
TC Type K
Basemat -12.5 cm, -12.5 cm E-1 0.0 cm
1400 C ± 0.75%
72 T
TC Type K
Basemat -12.5 cm, -12.5 cm E-2
-2.5 cm
1400 C ± 0.75%
73
T
TC Type K
Basemat -12.5 cm, -12.5 cm E-3
-5.1 cm
1400 C ± 0.75%
74 T
TC Type K
Basemat -12.5 cm, -12.5 cm E-4
-8.9 cm
1400 C ± 0.75%
75
T
TC Type K
Basemat -12.5 cm, -12.5 cm E-5 -14.0 cm
1400 C ± 0.75%
76 T TC Type K Basemat -12.5 cm, -12.5 cm E-6 -19.1 cm 1400 C ± 0.75% 77 T TC Type K Basemat -12.5 cm, -12.5 cm E-7 -24.1 cm 1400 C ± 0.75% 78 T
TC Type K
Basemat -12.5 cm, -12.5 cm E-8
-29.2 cm
1400 C ± 0.75%
79
T
TC Type K
Basemat -12.5 cm, -12. 5 cm E-9 -34.3 cm
1400 C ± 0.75%
80 T TC Type K S Sidewall 24.1 cm deep SWL-9 +20.0 cm 1400 C ± 0.75%
81 T
TC Type K N Sidewall 0.0 cm deep SWA-1 -30.0 cm 1400 C ± 0.75%
82
T
TC Type K N Sidewall 1.3 cm deep SWA-2 -30.0 cm
1400 C ± 0.75%
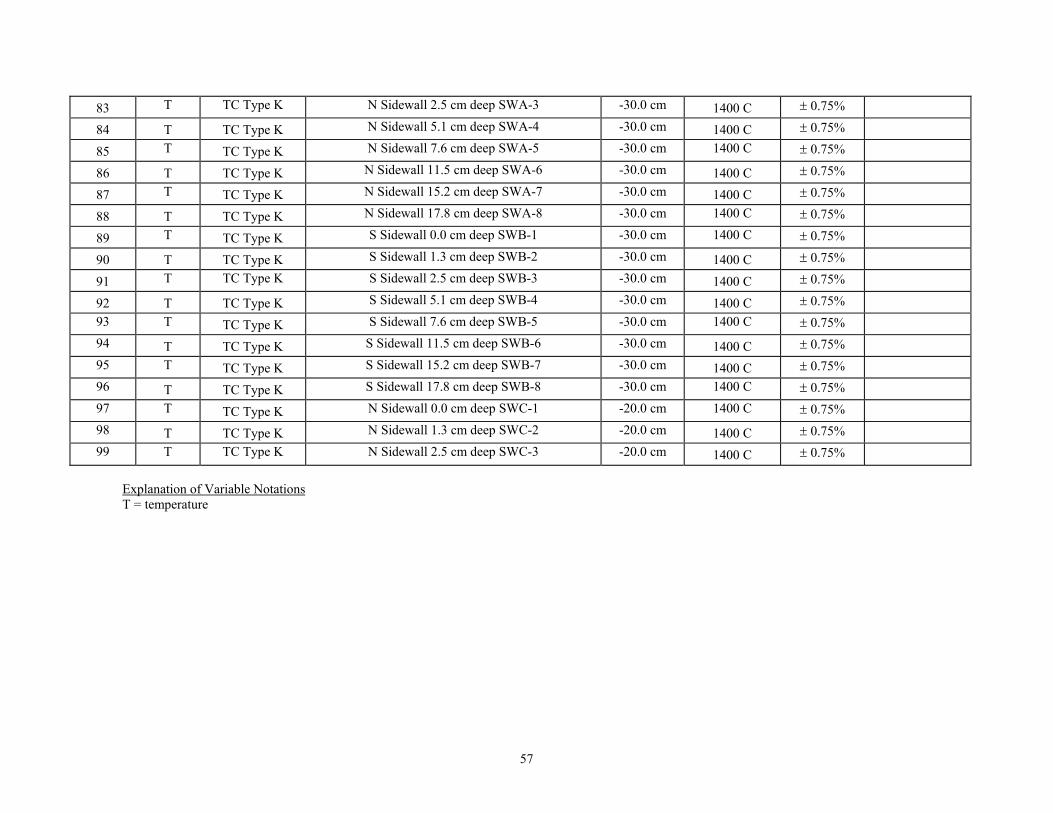
57
83 T TC Type K N Sidewall 2.5 cm deep SWA-3 -30.0 cm
1400 C ± 0.75%
84
T
TC Type K N Sidewall 5.1 cm deep SWA-4 -30.0 cm
1400 C ± 0.75%
85 T
TC Type K N Sidewall 7.6 cm deep SWA-5 -30.0 cm 1400 C ± 0.75%
86
T
TC Type K N Sidewall 11.5 cm deep SWA-6 -30.0 cm
1400 C ± 0.75%
87 T
TC Type K N Sidewall 15.2 cm deep SWA-7 -30.0 cm
1400 C ± 0.75%
88
T
TC Type K N Sidewall 17.8 cm deep SWA-8 -30.0 cm 1400 C ± 0.75%
89 T
TC Type K S Sidewall 0.0 cm deep SWB-1 -30.0 cm 1400 C ± 0.75%
90
T
TC Type K S Sidewall 1.3 cm deep SWB-2 -30.0 cm
1400 C ± 0.75%
91 T TC Type K S Sidewall 2.5 cm deep SWB-3 -30.0 cm
1400 C ± 0.75%
92
T
TC Type K S Sidewall 5.1 cm deep SWB-4 -30.0 cm
1400 C ± 0.75%
93 T
TC Type K S Sidewall 7.6 cm deep SWB-5 -30.0 cm 1400 C ± 0.75% 94
T
TC Type K S Sidewall 11.5 cm deep SWB-6 -30.0 cm
1400 C ± 0.75%
95 T
TC Type K S Sidewall 15.2 cm deep SWB-7 -30.0 cm
1400 C ± 0.75% 96
T
TC Type K S Sidewall 17.8 cm deep SWB-8 -30.0 cm 1400 C ± 0.75%
97 T
TC Type K N Sidewall 0.0 cm deep SWC-1 -20.0 cm 1400 C ± 0.75%
98
T
TC Type K N Sidewall 1.3 cm deep SWC-2 -20.0 cm
1400 C ± 0.75%
99 T TC Type K N Sidewall 2.5 cm deep SWC-3 -20.0 cm
1400 C ± 0.75%
Explanation of Variable Notations T = temperature

58
Table A-2. "Power" DAS Channel Assignments for CCI-3. Channel Variable Sensor Location Level Range/Limit Accuracy Notes
00 T TC Type K S Sidewall 29.2 cm deep SWL-10 +20.0 cm 1400 C ± 0.75% 01 T
TC Type K N Sidewall 5.1 cm deep SWC-4 -20.0 cm 1400 C ± 0.75%
02
T
TC Type K N Sidewall 7.6 cm deep SWC-5 -20.0 cm
1400 C ± 0.75% 03 T TC Type K N Sidewall 11.4 cm deep SWC-6 -20.0 cm
1400 C ± 0.75%
04 T
TC Type K N Sidewall 15.2 cm deep SWC-7 -20.0 cm 1400 C ± 0.75% 05
T
TC Type K N Sidewall 19.1 cm deep SWC-8 -20.0 cm
1400 C ± 0.75%
06 T TC Type K N Sidewall 24.1 cm deep SWC-9 -20.0 cm
1400 C ± 0.75% 07 T
TC Type K N Sidewall 29.2 cm deep SWC-10 -20.0 cm 1400 C ± 0.75%
08
T
TC Type K N Sidewall 34.3 cm deep SWC-11 -20.0 cm
1400 C ± 0.75% 09 T
TC Type K S Sidewall 0.0 cm deep SWD-1 -20.0 cm 1400 C ± 0.75%
10
T
TC Type K S Sidewall 1.3 cm deep SWD-2 -20.0 cm
1400 C ± 0.75% 11 T TC Type K S Sidewall 2.5 cm deep SWD-3 -20.0 cm
1400 C ± 0.75%
12 T
TC Type K S Sidewall 5.1 cm deep SWD-4 -20.0 cm 1400 C ± 0.75% 13
T
TC Type K S Sidewall 7.6 cm deep SWD-5 -20.0 cm
1400 C ± 0.75%
14 T TC Type K S Sidewall 11.4 cm deep SWD-6 -20.0 cm
1400 C ± 0.75% 15 T
TC Type K S Sidewall 15.2 cm deep SWD-7 -20.0 cm 1400 C ± 0.75%
16
T
TC Type K S Sidewall 19.1 cm deep SWD-8 -20.0 cm
1400 C ± 0.75% 17 T TC Type K S Sidewall 24.1 cm deep SWD-9 -20.0 cm
1400 C ± 0.75%
18 T
TC Type K S Sidewall 29.2 cm deep SWD-10 -20.0 cm 1400 C ± 0.75% 19
T
TC Type K S Sidewall 34.3 cm deep SWD-11 -20.0 cm
1400 C ± 0.75%
20 T
TC Type K N Sidewall 0.0 cm deep SWE-1 -10.0 cm 1400 C ± 0.75% 21
T
TC Type K N Sidewall 1.3 cm deep SWE-2 -10.0 cm
1400 C ± 0.75%
22 T TC Type K N Sidewall 2.5 cm deep SWE-3 -10.0 cm
1400 C ± 0.75% 23 T
TC Type K N Sidewall 5.1 cm deep SWE-4 -10.0 cm 1400 C ± 0.75%
24
T
TC Type K N Sidewall 7.6 cm deep SWE-5 -10.0 cm
1400 C ± 0.75% 25 T TC Type K N Sidewall 11.4 cm deep SWE-6 -10.0 cm
1400 C ± 0.75%
26 T TC Type K N Sidewall 15.2 cm deep SWE-7 -10.0 cm 1400 C ± 0.75%

59
27
T
TC Type K N Sidewall 19.1 cm deep SWE-8 -10.0 cm
1400 C ± 0.75% 28 T TC Type K N Sidewall 24.1 cm deep SWE-9 -10.0 cm
1400 C ± 0.75%
29 T
TC Type K N Sidewall 29.2 cm deep SWE-10 -10.0 cm 1400 C ± 0.75% 30
T
TC Type K N Sidewall 34.3 cm deep SWE-11 -10.0 cm
1400 C ± 0.75%
31 T
TC Type K S Sidewall 0.0 cm deep SWF-1 -10.0 cm 1400 C ± 0.75% 32
T
TC Type K S Sidewall 1.3 cm deep SWF-2 -10.0 cm
1400 C ± 0.75%
33 T TC Type K S Sidewall 2.5 cm deep SWF-3 -10.0 cm
1400 C ± 0.75% 34 T
TC Type K S Sidewall 5.1 cm deep SWF-4 -10.0 cm 1400 C ± 0.75%
35
T
TC Type K S Sidewall 7.6 cm deep SWF-5 -10.0 cm
1400 C ± 0.75% 36 T TC Type K S Sidewall 11.4 cm deep SWF-6 -10.0 cm
1400 C ± 0.75%
37 T
TC Type K S Sidewall 15.2 cm deep SWF-7 -10.0 cm 1400 C ± 0.75% 38
T
TC Type K S Sidewall 19.1 cm deep SWF-8 -10.0 cm
1400 C ± 0.75%
39 T TC Type K S Sidewall 24.1 cm deep SWF-9 -10.0 cm
1400 C ± 0.75% 40 T
TC Type K S Sidewall 29.2 cm deep SWF-10 -10.0 cm 1400 C ± 0.75%
41
T
TC Type K S Sidewall 34.3 cm deep SWF-11 -10.0 cm
1400 C ± 0.75% 42 T
TC Type K N Sidewall 0.0 cm deep SWG-1 0.0 cm 1400 C ± 0.75%
43
T
TC Type K N Sidewall 1.3 cm deep SWG-2 0.0 cm
1400 C ± 0.75% 44 T TC Type K N Sidewall 2.5 cm deep SWG-3 0.0 cm
1400 C ± 0.75%
45 T
TC Type K N Sidewall 5.1 cm deep SWG-4 0.0 cm 1400 C ± 0.75% 46
T
TC Type K N Sidewall 7.6 cm deep SWG-5 0.0 cm
1400 C ± 0.75%
47 T TC Type K N Sidewall 11.4 cm deep SWG-6 0.0 cm
1400 C ± 0.75%
48 T
TC Type K N Sidewall 15.2 cm deep SWG-7 0.0 cm 1400 C ± 0.75%
49
T
TC Type K N Sidewall 19.1 cm deep SWG-8 0.0 cm
1400 C ± 0.75%
50 T TC Type K S Sidewall 34.3 cm deep SWL-11 +20.0 cm 1400 C ± 0.75% 51 T TC Type K N Sidewall 24.1 cm deep SWG-9 0.0 cm
1400 C ± 0.75%
52 T
TC Type K N Sidewall 29.2 cm deep SWG-10 0.0 cm 1400 C ± 0.75%
53
T
TC Type K N Sidewall 34.3 cm deep SWG-11 0.0 cm
1400 C ± 0.75%
54 T TC Type K S Sidewall 0.0 cm deep SWH-1 0.0 cm 1400 C ± 0.75%

60
55
T
TC Type K S Sidewall 1.3 cm deep SWH-2 0.0 cm
1400 C ± 0.75%
56 T TC Type K S Sidewall 2.5 cm deep SWH-3 0.0 cm
1400 C ± 0.75%
57 T
TC Type K S Sidewall 5.1 cm deep SWH-4 0.0 cm 1400 C ± 0.75% 58
T
TC Type K S Sidewall 7.6 cm deep SWH-5 0.0 cm
1400 C ± 0.75%
59 T TC Type K S Sidewall 11.4 cm deep SWH-6 0.0 cm
1400 C ± 0.75%
60 T
TC Type K S Sidewall 15.2 cm deep SWH-7 0.0 cm 1400 C ± 0.75%
61
T
TC Type K S Sidewall 19.1 cm deep SWH-8 0.0 cm
1400 C ± 0.75%
62 T TC Type K S Sidewall 24.1 cm deep SWH-9 0.0 cm
1400 C ± 0.75%
63 T
TC Type K S Sidewall 29.2 cm deep SWH-10 0.0 cm 1400 C ± 0.75%
64
T
TC Type K S Sidewall 34.3 cm deep SWH-11 0.0 cm
1400 C ± 0.75%
65 T
TC Type K N Sidewall 0.0 cm deep SWI-1 +10.0 cm 1400 C ± 0.75%
66
T
TC Type K N Sidewall 1.3 cm deep SWI-2 +10.0 cm
1400 C ± 0.75%
67 T TC Type K N Sidewall 2.5 cm deep SWI-3 +10.0 cm
1400 C ± 0.75%
68 T
TC Type K N Sidewall 5.1 cm deep SWI-4 +10.0 cm 1400 C ± 0.75%
69
T
TC Type K N Sidewall 7.6 cm deep SWI-5 +10.0 cm
1400 C ± 0.75%
70 T TC Type K N Sidewall 11.4 cm deep SWI-6 +10.0 cm
1400 C ± 0.75%
71 T
TC Type K N Sidewall 15.2 cm deep SWI-7 +10.0 cm 1400 C ± 0.75% 72 T TC Type K N Sidewall 19.1 cm deep SWI-8 +10.0 cm 1400 C ± 0.75%
73 T TC Type K N Sidewall 24.1 cm deep SWI-9 +10.0 cm
1400 C ± 0.75%
74 T
TC Type K N Sidewall 29.2 cm deep SWI-10 +10.0 cm 1400 C ± 0.75%
75
T
TC Type K N Sidewall 34.3 cm deep SWI-11 +10.0 cm
1400 C ± 0.75%
76 T
TC Type K S Sidewall 0.0 cm deep SWJ-1 +10.0 cm 1400 C ± 0.75%
77
T
TC Type K S Sidewall 1.3 cm deep SWJ-2 +10.0 cm
1400 C ± 0.75% 78 T TC Type K S Sidewall 2.5 cm deep SWJ-3 +10.0 cm
1400 C ± 0.75%
79 T
TC Type K S Sidewall 5.1 cm deep SWJ-4 +10.0 cm 1400 C ± 0.75%
80
T
TC Type K S Sidewall 7.6 cm deep SWJ-5 +10.0 cm
1400 C ± 0.75%
81 T TC Type K S Sidewall 11.4 cm deep SWJ-6 +10.0 cm
1400 C ± 0.75%
82 T TC Type K S Sidewall 15.2 cm deep SWJ-7 +10.0 cm 1400 C ± 0.75%

61
83 T TC Type K S Sidewall 19.1 cm deep SWJ-8 +10.0 cm 1400 C ± 0.75%
84 T TC Type K S Sidewall 24.1 cm deep SWJ-9 +10.0 cm
1400 C ± 0.75%
85 T
TC Type K S Sidewall 29.2 cm deep SWJ-10 +10.0 cm 1400 C ± 0.75%
86
T
TC Type K S Sidewall 34.3 cm deep SWJ-11 +10.0 cm
1400 C ± 0.75%
87 T
TC Type K N Sidewall 0.0 cm deep SWK-1 +20.0 cm 1400 C ± 0.75%
88
T
TC Type K N Sidewall 1.3 cm deep SWK-2 +20.0 cm
1400 C ± 0.75%
89 T TC Type K N Sidewall 2.5 cm deep SWK-3 +20.0 cm
1400 C ± 0.75%
90
T
TC Type K N Sidewall 5.1 cm deep SWK-4 +20.0 cm
1400 C ± 0.75%
91 T
TC Type K N Sidewall 7.6 cm deep SWK-5 +20.0 cm 1400 C ± 0.75%
92
T
TC Type K N Sidewall 11.5 cm deep SWK-6 +20.0 cm
1400 C ± 0.75%
93 T
TC Type K N Sidewall 15.2 cm deep SWK-7 +20.0 cm
1400 C ± 0.75% 94
T
TC Type K N Sidewall 17.8 cm deep SWK-8 +20.0 cm 1400 C ± 0.75%
95 T
TC Type K S Sidewall 0.0 cm deep SWL-1 +20.0 cm 1400 C ± 0.75% 96
T
TC Type K S Sidewall 1.3 cm deep SWL-2 +20.0 cm
1400 C ± 0.75%
97 T TC Type K S Sidewall 2.5 cm deep SWL-3 +20.0 cm
1400 C ± 0.75%
98
T
TC Type K S Sidewall 5.1 cm deep SWL-4 +20.0 cm
1400 C ± 0.75%
99 T
TC Type K S Sidewall 7.6 cm deep SWL-5 +20.0 cm 1400 C ± 0.75%
Explanation of Variable Notations T = temperature

62
Table A-3. "Quench" DAS Channel Assignments for CCI-3. Channel Variable Sensor Location Level Range/Limit Accuracy Notes
00
T
Diode Sensor
TC Compensation CH Q00-Q49
130 C
01
T
TC Type K S Sidewall 11.5 cm deep SWL-6 +20.0 cm
1400 C ± 0.75% 02 T
TC Type K S Sidewall 15.2 cm deep SWL-7 +20.0 cm
1400 C ± 0.75%
03 T TC Type K S Sidewall 17.8 cm deep SWL-8 +20.0 cm 1400 C ± 0.75% 04
T
TC Type C
E Sidewall 1.0 cm deep SWHL-1
-15.0 cm
2320 C ± 1.0%
05
T
TC Type C
E Sidewall 2.0 cm deep SWHL-2
-15.0 cm
2320 C ± 1.0% 06
T
TC Type C
E Sidewall 4.0 cm deep SWHL-3
-15.0 cm
2320 C ± 1.0%
07
T
TC Type C
E Sidewall 8.0 cm deep SWHL-4
-15.0 cm
2320 C ± 1.0% 08
T
TC Type C
W Sidewall 1.0 cm deep SWHL-5
-5.0 cm
2320 C ± 1.0%
09
T
TC Type C
W Sidewall 2.0 cm deep SWHL-6
-5.0 cm
2320 C ± 1.0% 10
T
TC Type C
W Sidewall 4.0 cm deep SWHL-7
-5.0 cm
2320 C ± 1.0%
11
T
TC Type C
W Sidewall 8.0 cm deep SWHL-8
-5.0 cm
2320 C ± 1.0% 12
T
TC Type C
E Sidewall 1.0 cm deep SWHL-9
+5.0 cm
2320 C ± 1.0%
13
T
TC Type C
E Sidewall 2.0 cm deep SWHL-10
+5.0 cm
2320 C ± 1.0% 14
T
TC Type C
E Sidewall 4.0 cm deep SWHL-11
+5.0 cm
2320 C ± 1.0%
15
T
TC Type C
E Sidewall 8.0 cm deep SWHL-12
+5.0 cm
2320 C ± 1.0% 16
T
TC Type C
W Sidewall 1.0 cm deep SWHL-13
+15.0 cm
2320 C ± 1.0%
17
T
TC Type C
W Sidewall 2.0 cm deep SWHL-14
+15.0 cm
2320 C ± 1.0% 18
T
TC Type C
W Sidewall 4.0 cm deep SWHL-15
+15.0 cm
2320 C ± 1.0%
19
T
TC Type C
W Sidewall 8.0 cm deep SWHL-16
+15.0 cm
2320 C ± 1.0% 20 L Potentiometer Lance Position Indicator 0-127 cm 21
T
TC Type K
Steamline internal vertical run from vessel ML-1
1400 C ± 0.75%
22
T
TC Type K
Steamline external vertical run from vessel ML-2
1400 C ± 0.75% 23
T
TC Type K
Steamline external lateral run from vessel ML-3
1400 C ± 0.75%
24
T
TC Type K
Steamline external vertical run to quench tank ML-4
1400 C ± 0.75% 25 T
TC Type K S Sidewall 0.0 cm deep SWHL-17 +70.0 cm
1400 C ± 0.75%
26
T
TC Type K
S Sidewall 2.0 cm deep SWHL-18
+70.0 cm
1400 C ± 0.75%
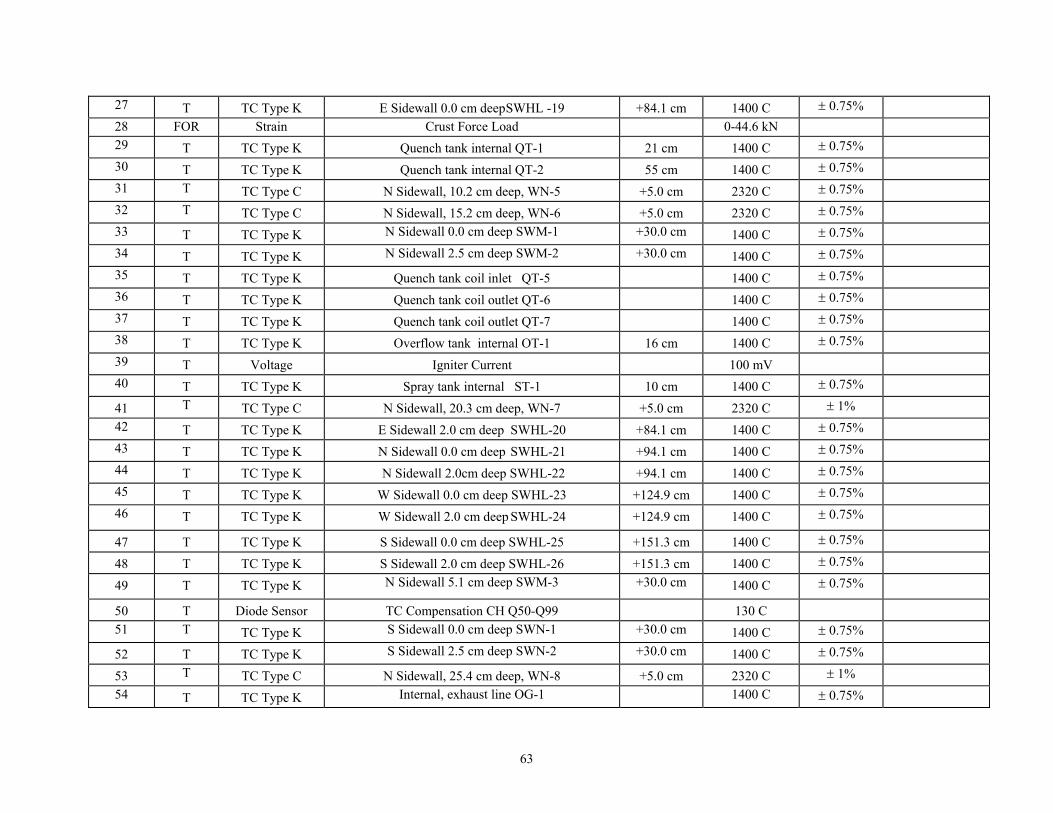
63
27
T
TC Type K
E Sidewall 0.0 cm deep SWHL -19
+84.1 cm
1400 C ± 0.75% 28 FOR Strain Crust Force Load 0-44.6 kN 29
T
TC Type K
Quench tank internal QT-1
21 cm
1400 C ± 0.75%
30
T
TC Type K
Quench tank internal QT-2
55 cm
1400 C ± 0.75% 31 T
TC Type C
N Sidewall, 10.2 cm deep, WN-5
+5.0 cm
2320 C ± 0.75%
32 T
TC Type C
N Sidewall, 15.2 cm deep, WN-6
+5.0 cm
2320 C ± 0.75% 33
T
TC Type K N Sidewall 0.0 cm deep SWM-1 +30.0 cm
1400 C ± 0.75%
34
T
TC Type K N Sidewall 2.5 cm deep SWM-2 +30.0 cm
1400 C ± 0.75% 35
T
TC Type K
Quench tank coil inlet QT-5
1400 C ± 0.75%
36
T
TC Type K
Quench tank coil outlet QT-6
1400 C ± 0.75% 37
T
TC Type K
Quench tank coil outlet QT-7
1400 C ± 0.75%
38
T
TC Type K
Overflow tank internal OT-1
16 cm
1400 C ± 0.75% 39
T
Voltage
Igniter Current
100 mV
40
T
TC Type K
Spray tank internal ST-1
10 cm
1400 C ± 0.75%
41 T
TC Type C
N Sidewall, 20.3 cm deep, WN-7
+5.0 cm
2320 C ± 1%
42
T
TC Type K
E Sidewall 2.0 cm deep SWHL-20
+84.1 cm
1400 C ± 0.75% 43
T
TC Type K
N Sidewall 0.0 cm deep SWHL-21
+94.1 cm
1400 C ± 0.75%
44
T
TC Type K
N Sidewall 2.0cm deep SWHL-22
+94.1 cm
1400 C ± 0.75% 45
T
TC Type K
W Sidewall 0.0 cm deep SWHL-23
+124.9 cm
1400 C ± 0.75%
46
T
TC Type K
W Sidewall 2.0 cm deep SWHL-24 +124.9 cm
1400 C ± 0.75%
47
T
TC Type K
S Sidewall 0.0 cm deep SWHL-25
+151.3 cm
1400 C ± 0.75%
48
T
TC Type K
S Sidewall 2.0 cm deep SWHL-26
+151.3 cm
1400 C ± 0.75%
49
T
TC Type K N Sidewall 5.1 cm deep SWM-3 +30.0 cm
1400 C ± 0.75%
50
T
Diode Sensor
TC Compensation CH Q50-Q99
130 C
51 T
TC Type K S Sidewall 0.0 cm deep SWN-1 +30.0 cm
1400 C ± 0.75%
52
T
TC Type K S Sidewall 2.5 cm deep SWN-2 +30.0 cm
1400 C ± 0.75%
53 T
TC Type C
N Sidewall, 25.4 cm deep, WN-8
+5.0 cm
2320 C ± 1% 54
T
TC Type K Internal, exhaust line OG-1 1400 C ± 0.75%
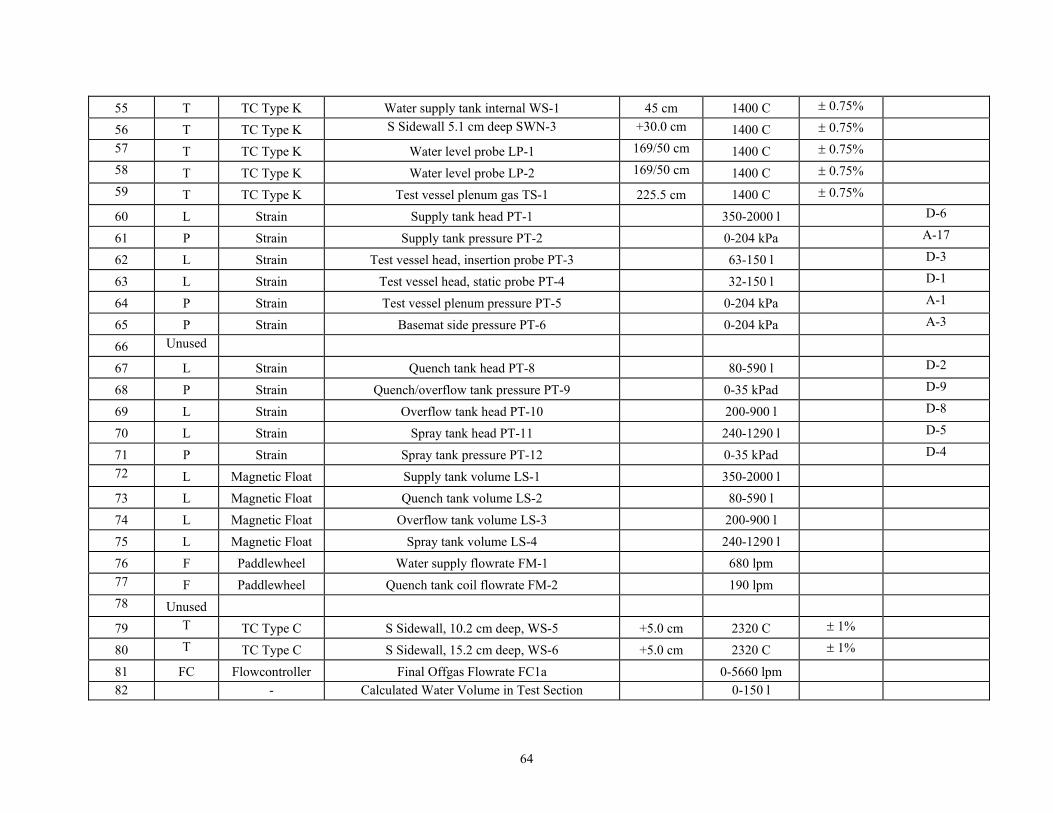
64
55
T
TC Type K
Water supply tank internal WS-1
45 cm
1400 C ± 0.75%
56
T
TC Type K S Sidewall 5.1 cm deep SWN-3 +30.0 cm
1400 C ± 0.75%
57
T
TC Type K
Water level probe LP-1 169/50 cm
1400 C ± 0.75% 58
T
TC Type K
Water level probe LP-2 169/50 cm
1400 C ± 0.75%
59
T
TC Type K
Test vessel plenum gas TS-1
225.5 cm
1400 C ± 0.75%
60
L
Strain
Supply tank head PT-1
350-2000 l D-6
61
P
Strain
Supply tank pressure PT-2
0-204 kPa A-17
62
L
Strain
Test vessel head, insertion probe PT-3
63-150 l D-3
63
L
Strain
Test vessel head, static probe PT-4
32-150 l D-1
64
P
Strain
Test vessel plenum pressure PT-5
0-204 kPa A-1
65
P
Strain
Basemat side pressure PT-6
0-204 kPa A-3
66 Unused
67
L
Strain
Quench tank head PT-8
80-590 l D-2
68
P
Strain
Quench/overflow tank pressure PT-9
0-35 kPad D-9
69
L
Strain
Overflow tank head PT-10
200-900 l D-8
70
L
Strain
Spray tank head PT-11
240-1290 l D-5
71
P
Strain
Spray tank pressure PT-12
0-35 kPad D-4
72
L Magnetic Float
Supply tank volume LS-1
350-2000 l
73
L
Magnetic Float
Quench tank volume LS-2
80-590 l
74
L
Magnetic Float
Overflow tank volume LS-3
200-900 l
75
L
Magnetic Float
Spray tank volume LS-4
240-1290 l
76
F
Paddlewheel
Water supply flowrate FM-1
680 lpm
77
F
Paddlewheel
Quench tank coil flowrate FM-2
190 lpm 78
Unused
79 T
TC Type C
S Sidewall, 10.2 cm deep, WS-5
+5.0 cm
2320 C ± 1%
80 T
TC Type C
S Sidewall, 15.2 cm deep, WS-6
+5.0 cm
2320 C ± 1%
81
FC Flowcontroller
Final Offgas Flowrate FC1a
0-5660 lpm
82 - Calculated Water Volume in Test Section 0-150 l

65
83
FC
Flowcontroller
Lid lights & camera covergas flowrate FC-2
0-200 lpm
84 Unused
85
-
Calculated Total Current (Q92+Q93)
0 -10,000 A
86 Unused - Calculated Total Power (Q94+Q95) 0-500 kW
87
FC Flowcontroller
Test vessel covergas flowrate FC-6
0-100 lpm
88
FC Flowcontroller
Lid camera covergas flowrate FC-7
0-350 lpm
89
V
Pressure transducer power supply #1 voltage
0-30 V
90
V
Pressure transducer power supply #2 voltage
0-30 V
91
V
Voltmeter
Power supply voltage
0-200 V
92
A
Transformer
Power supply current #2
5000 A 93
A
Transformer
Power supply current #1
5000 A
94
W
Hall Meter
Power supply power #2
1100 kW 95
W
Hall Meter
Power supply power #1
1100 kW
96
L
Strain
Auxiliary Tank Head PT-13
366-4080 D-10 97
T
TC Type K
Auxiliary Tank Internal AT-1
43 cm
1400 C ± 0.75%
98 T
TC Type C
S Sidewall, 20.3 cm deep, WS-7
+5.0 cm
2320 C ± 1%
99 T
TC Type C
S Sidewall, 25.4 cm deep, WS-8
+5.0 cm
2320 C ± 1%
Explanation of variable notations T = temperature P = Pressure FOR=Force L = Level V = Voltage F = Flowrate A = Current W = Power FC = Flow Controller

66
APPENDIX B Test Data
This Appendix provides plots of all data recorded during Test CCI-3. The complete channel
assignment list is provided in Appendix A. Time t = 0 in all plots is referenced to the time at which the melt made initial contact with the concrete basemat. This corresponds to 5.24 minutes after onset of data acquisition; see Table 3-1. All data was logged at ~ 5.5 second time intervals during the test. Selected channels have been averaged over 30 second time intervals to improve readability.

67
Basemat Type C Array
14
16
18
20
22
24
26
28
30
-10 0 10 20 30 40 50 60 70 80 90 100 110 120 130 140 150 160 170 180
Elapsed Time (Minutes)
Tem
pera
ture
(˚C
)
Channels B00-B49
Channels B50-B99
Figure B-1. Compensator Temperature, Channels B01-B49 and B50-B99.
Basemat Type C Array
0
500
1000
1500
2000
2500
-10 0 10 20 30 40 50 60 70 80 90 100 110 120 130 140 150 160 170 180
Elapsed Time (Minutes)
Tem
pera
ture
(˚C
)
WCL-1 (+15.0 cm)WCL-2 (+10.0 cm)WCL-3 (+5.0 cm)WCL-4 (0.0 cm)
Figure B-2. Basemat Type C “WCL” Array Data.

68
Basemat Type C Array
0
500
1000
1500
2000
2500
-10 0 10 20 30 40 50 60 70 80 90 100 110 120 130 140 150 160 170 180
Elapsed Time (Minutes)
Tem
pera
ture
(˚C
)WNW-1 (+9.5 cm)WNW-2 (+4.5 cm)WNW-3 (-0.5 cm)WNW-4 (-5.5 cm)
Figure B-3. Basemat Type C “WNW” Array Data.
Basemat Type C Array
0
500
1000
1500
2000
2500
-10 0 10 20 30 40 50 60 70 80 90 100 110 120 130 140 150 160 170 180
Elapsed Time (Minutes)
Tem
pera
ture
(˚C
)
WNE-1 (-1.5 cm)WNE-2 (-6.5 cm)WNE-3 (-11.5 cm)WNE-4 (-16.5 cm)
Figure B-4. Basemat Type C “WNE” Array Data.

69
Basemat Type C Array
0
500
1000
1500
2000
2500
-10 0 10 20 30 40 50 60 70 80 90 100 110 120 130 140 150 160 170 180
Elapsed Time (Minutes)
Tem
pera
ture
(˚C
)WSE-1 (+4.0 cm)WSE-2 (-1.0 cm)WSE-3 (-6.0 cm)WSE-4 (-11.0 cm)
Figure B-5. Basemat Type C “WSE” Array Data.
Basemat Type C Array
0
500
1000
1500
2000
2500
-10 0 10 20 30 40 50 60 70 80 90 100 110 120 130 140 150 160 170 180
Elapsed Time (Minutes)
Tem
pera
ture
(˚C
)
WSW-1 (-7.0 cm)WSW-2 (-12.0 cm)WSW-3 (-17.0 cm)WSW-4 (-22.0 cm)
Figure B-6. Basemat Type C “WSW” Array Data.

70
N Sidewall Type C Array
0
500
1000
1500
2000
2500
-10 0 10 20 30 40 50 60 70 80 90 100 110 120 130 140 150 160 170 180
Elapsed Time (Minutes)
Tem
pera
ture
(˚C
)WN-1 (0.0 cm) WN-2 (-2.5 cm)WN-3 (-5.1 cm) WN-4 (-7.6 cm)WN-5 (-10.2 cm) WN-6 (-15.2 cm)WN-7 (-20.3 cm) WN-8 (-25.4 cm)
Figure B-7. North Sidewall Type C “NW” Array Data.
S Sidewall Type C Array
0
500
1000
1500
2000
2500
-10 0 10 20 30 40 50 60 70 80 90 100 110 120 130 140 150 160 170 180
Elapsed Time (Minutes)
Tem
pera
ture
(˚C
)
WS-1 (0.0 cm)WS-2 (-2.5 cm)WS-3 (-5.1 cm)WS-4 (-7.6 cm)WS-5 (-10.2 cm)WS-6 (-15.2 cm)WS-7 (-20.3 cm)WS-8 (-25.4 cm)
Figure B-8. South Sidewall Type C “WS” Array Data.
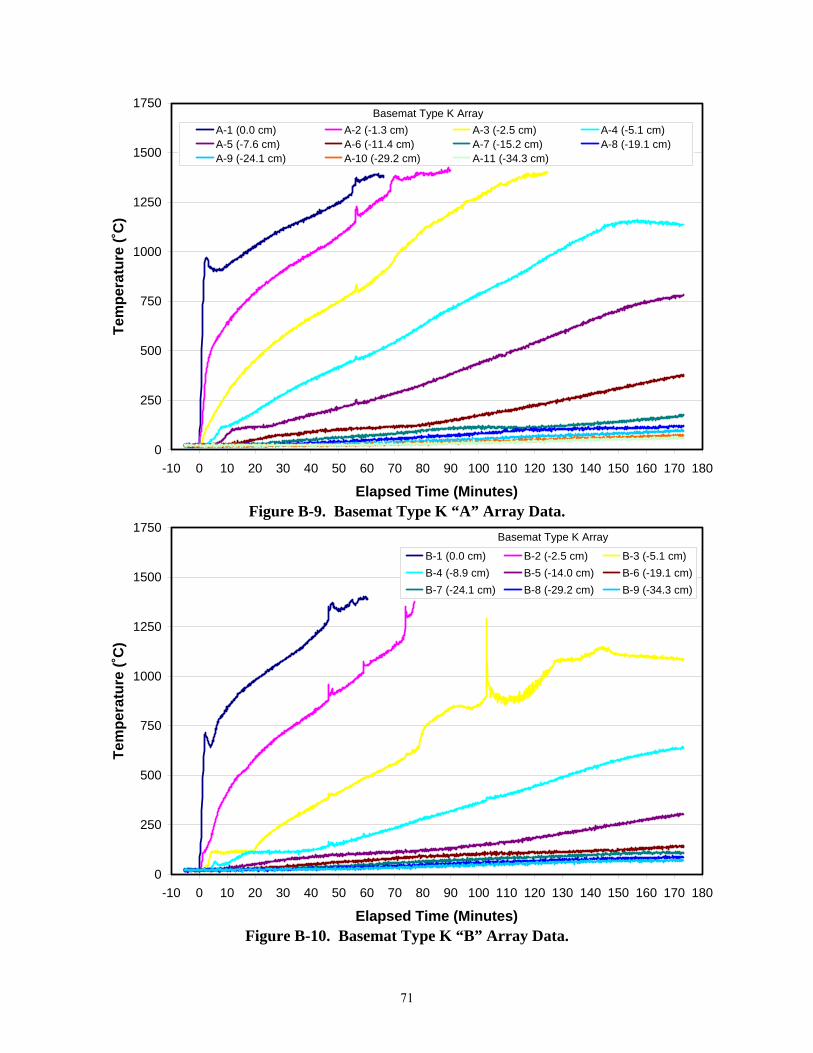
71
Basemat Type K Array
0
250
500
750
1000
1250
1500
1750
-10 0 10 20 30 40 50 60 70 80 90 100 110 120 130 140 150 160 170 180
Elapsed Time (Minutes)
Tem
pera
ture
(˚C
)A-1 (0.0 cm) A-2 (-1.3 cm) A-3 (-2.5 cm) A-4 (-5.1 cm)A-5 (-7.6 cm) A-6 (-11.4 cm) A-7 (-15.2 cm) A-8 (-19.1 cm)A-9 (-24.1 cm) A-10 (-29.2 cm) A-11 (-34.3 cm)
Figure B-9. Basemat Type K “A” Array Data.
Basemat Type K Array
0
250
500
750
1000
1250
1500
1750
-10 0 10 20 30 40 50 60 70 80 90 100 110 120 130 140 150 160 170 180
Elapsed Time (Minutes)
Tem
pera
ture
(˚C
)
B-1 (0.0 cm) B-2 (-2.5 cm) B-3 (-5.1 cm)B-4 (-8.9 cm) B-5 (-14.0 cm) B-6 (-19.1 cm)B-7 (-24.1 cm) B-8 (-29.2 cm) B-9 (-34.3 cm)
Figure B-10. Basemat Type K “B” Array Data.
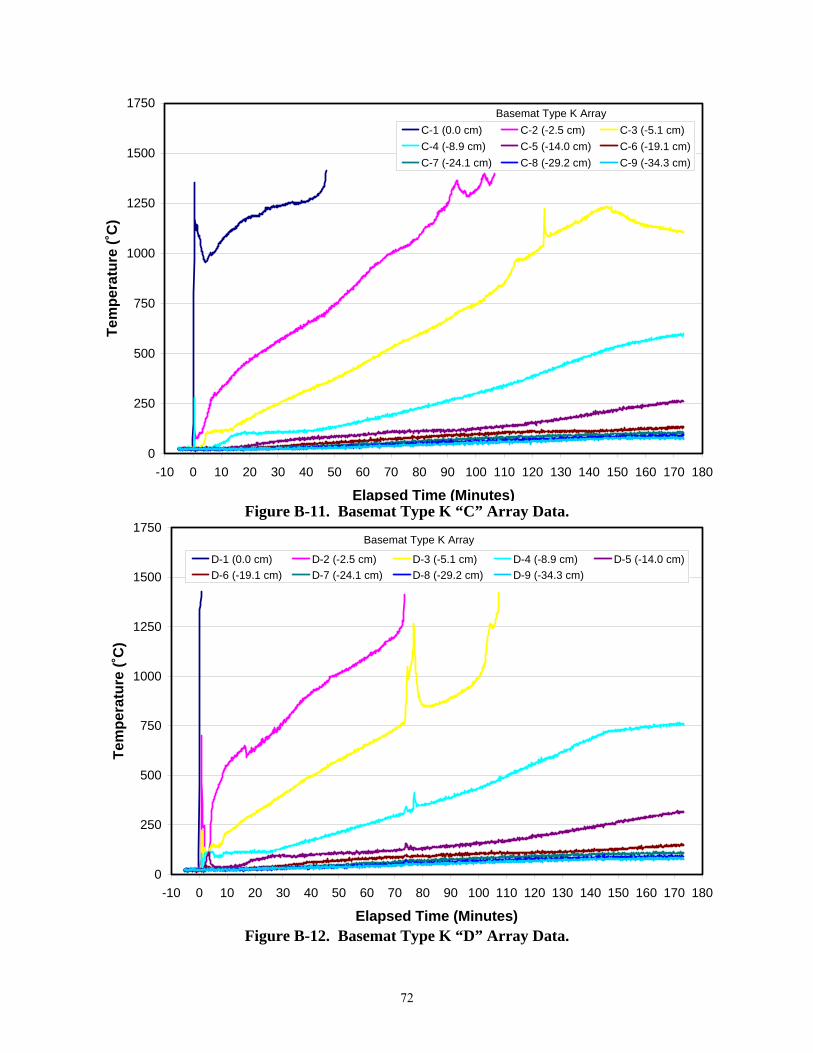
72
Basemat Type K Array
0
250
500
750
1000
1250
1500
1750
-10 0 10 20 30 40 50 60 70 80 90 100 110 120 130 140 150 160 170 180
Elapsed Time (Minutes)
Tem
pera
ture
(˚C
)C-1 (0.0 cm) C-2 (-2.5 cm) C-3 (-5.1 cm)C-4 (-8.9 cm) C-5 (-14.0 cm) C-6 (-19.1 cm)C-7 (-24.1 cm) C-8 (-29.2 cm) C-9 (-34.3 cm)
Figure B-11. Basemat Type K “C” Array Data.
Basemat Type K Array
0
250
500
750
1000
1250
1500
1750
-10 0 10 20 30 40 50 60 70 80 90 100 110 120 130 140 150 160 170 180
Elapsed Time (Minutes)
Tem
pera
ture
(˚C
)
D-1 (0.0 cm) D-2 (-2.5 cm) D-3 (-5.1 cm) D-4 (-8.9 cm) D-5 (-14.0 cm)D-6 (-19.1 cm) D-7 (-24.1 cm) D-8 (-29.2 cm) D-9 (-34.3 cm)
Figure B-12. Basemat Type K “D” Array Data.
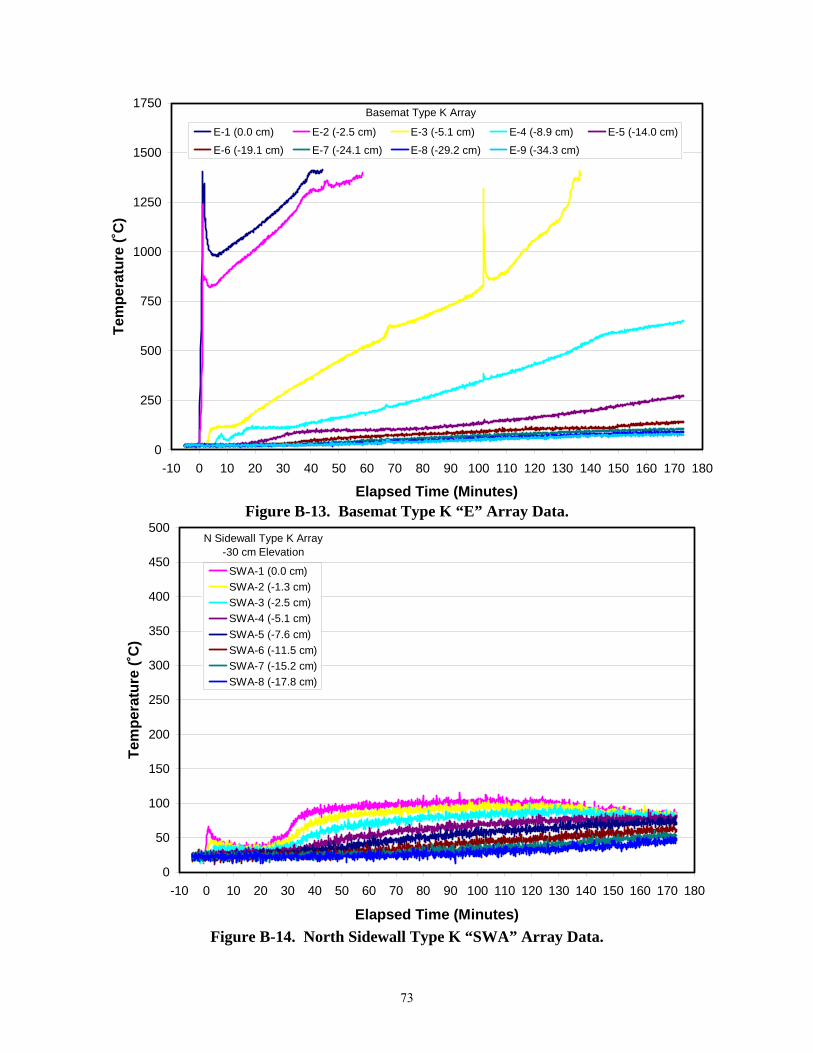
73
Basemat Type K Array
0
250
500
750
1000
1250
1500
1750
-10 0 10 20 30 40 50 60 70 80 90 100 110 120 130 140 150 160 170 180
Elapsed Time (Minutes)
Tem
pera
ture
(˚C
)E-1 (0.0 cm) E-2 (-2.5 cm) E-3 (-5.1 cm) E-4 (-8.9 cm) E-5 (-14.0 cm)E-6 (-19.1 cm) E-7 (-24.1 cm) E-8 (-29.2 cm) E-9 (-34.3 cm)
Figure B-13. Basemat Type K “E” Array Data.
N Sidewall Type K Array-30 cm Elevation
0
50
100
150
200
250
300
350
400
450
500
-10 0 10 20 30 40 50 60 70 80 90 100 110 120 130 140 150 160 170 180
Elapsed Time (Minutes)
Tem
pera
ture
(˚C
)
SWA-1 (0.0 cm)SWA-2 (-1.3 cm)SWA-3 (-2.5 cm)SWA-4 (-5.1 cm)SWA-5 (-7.6 cm)SWA-6 (-11.5 cm)SWA-7 (-15.2 cm)SWA-8 (-17.8 cm)
Figure B-14. North Sidewall Type K “SWA” Array Data.
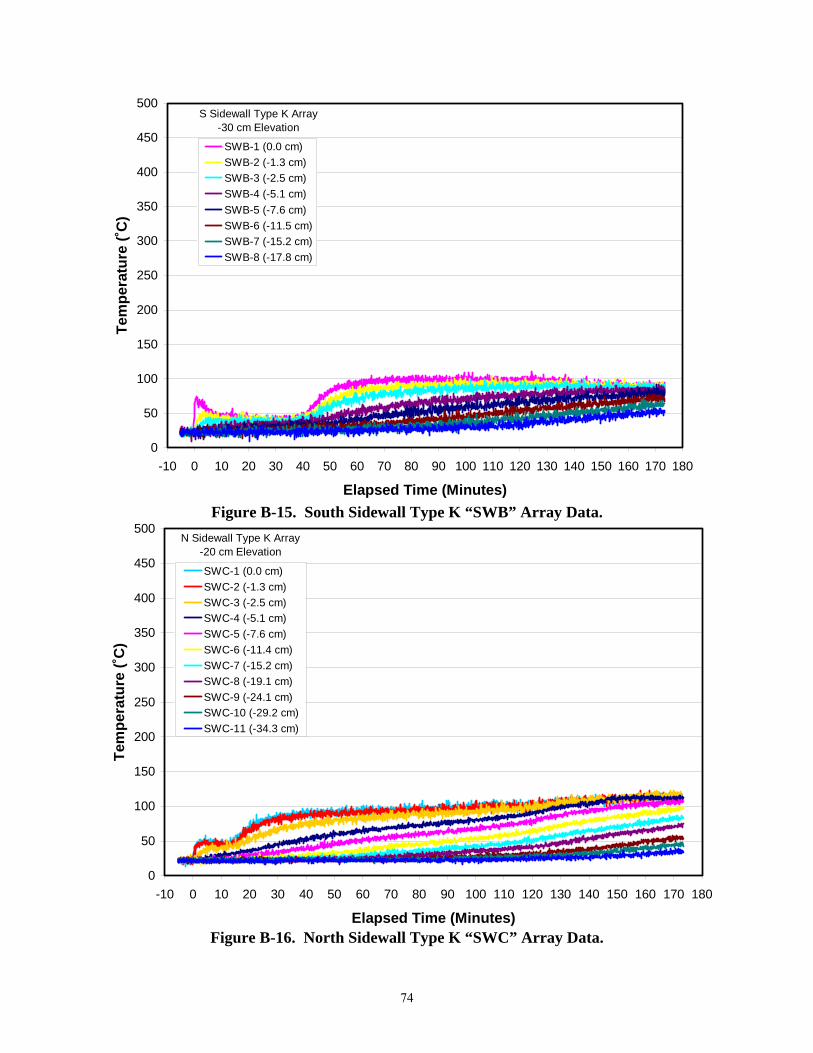
74
S Sidewall Type K Array-30 cm Elevation
0
50
100
150
200
250
300
350
400
450
500
-10 0 10 20 30 40 50 60 70 80 90 100 110 120 130 140 150 160 170 180
Elapsed Time (Minutes)
Tem
pera
ture
(˚C
)SWB-1 (0.0 cm)SWB-2 (-1.3 cm)SWB-3 (-2.5 cm)SWB-4 (-5.1 cm)SWB-5 (-7.6 cm)SWB-6 (-11.5 cm)SWB-7 (-15.2 cm)SWB-8 (-17.8 cm)
Figure B-15. South Sidewall Type K “SWB” Array Data.
N Sidewall Type K Array-20 cm Elevation
0
50
100
150
200
250
300
350
400
450
500
-10 0 10 20 30 40 50 60 70 80 90 100 110 120 130 140 150 160 170 180
Elapsed Time (Minutes)
Tem
pera
ture
(˚C
)
SWC-1 (0.0 cm)SWC-2 (-1.3 cm)SWC-3 (-2.5 cm)SWC-4 (-5.1 cm)SWC-5 (-7.6 cm)SWC-6 (-11.4 cm)SWC-7 (-15.2 cm)SWC-8 (-19.1 cm)SWC-9 (-24.1 cm)SWC-10 (-29.2 cm)SWC-11 (-34.3 cm)
Figure B-16. North Sidewall Type K “SWC” Array Data.
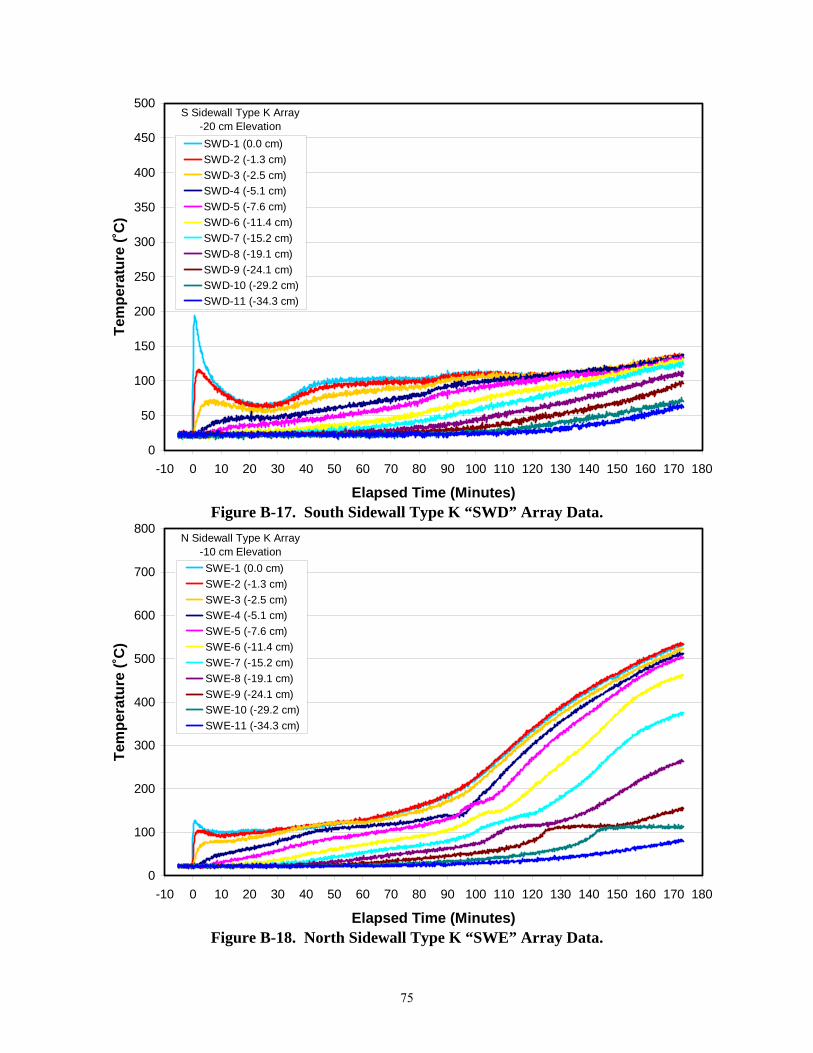
75
S Sidewall Type K Array-20 cm Elevation
0
50
100
150
200
250
300
350
400
450
500
-10 0 10 20 30 40 50 60 70 80 90 100 110 120 130 140 150 160 170 180
Elapsed Time (Minutes)
Tem
pera
ture
(˚C
)SWD-1 (0.0 cm)SWD-2 (-1.3 cm)SWD-3 (-2.5 cm)SWD-4 (-5.1 cm)SWD-5 (-7.6 cm)SWD-6 (-11.4 cm)SWD-7 (-15.2 cm)SWD-8 (-19.1 cm)SWD-9 (-24.1 cm)SWD-10 (-29.2 cm)SWD-11 (-34.3 cm)
Figure B-17. South Sidewall Type K “SWD” Array Data.
N Sidewall Type K Array-10 cm Elevation
0
100
200
300
400
500
600
700
800
-10 0 10 20 30 40 50 60 70 80 90 100 110 120 130 140 150 160 170 180
Elapsed Time (Minutes)
Tem
pera
ture
(˚C
)
SWE-1 (0.0 cm)SWE-2 (-1.3 cm)SWE-3 (-2.5 cm)SWE-4 (-5.1 cm)SWE-5 (-7.6 cm)SWE-6 (-11.4 cm)SWE-7 (-15.2 cm)SWE-8 (-19.1 cm)SWE-9 (-24.1 cm)SWE-10 (-29.2 cm)SWE-11 (-34.3 cm)
Figure B-18. North Sidewall Type K “SWE” Array Data.

76
S Sidewall Type K Array-10 cm Elevation
0
100
200
300
400
500
600
700
800
-10 0 10 20 30 40 50 60 70 80 90 100 110 120 130 140 150 160 170 180
Elapsed Time (Minutes)
Tem
pera
ture
(˚C
)SWF-1 (0.0 cm)SWF-2 (-1.3 cm)SWF-3 (-2.5 cm)SWF-4 (-5.1 cm)SWF-5 (-7.6 cm)SWF-6 (-11.4 cm)SWF-7 (-15.2 cm)SWF-8 (-19.1 cm)SWE-9 (-24.1 cm)SWF-10 (-29.2 cm)SWF-11 (-34.3 cm)
Figure B-19. South Sidewall Type K “SWF” Array Data.
N Sidewall Type K Array, 0 cm Elevation
0
200
400
600
800
1000
1200
1400
1600
1800
-10 0 10 20 30 40 50 60 70 80 90 100 110 120 130 140 150 160 170 180
Elapsed Time (Minutes)
Tem
pera
ture
(˚C
)
SWG-1 (0.0 cm) SWG-2 (-1.3 cm) SWG-3 (-2.5 cm) SWG-4 (-5.1 cm)SWG-5 (-7.6 cm) SWG-6 (-11.4 cm) SWG-7 (-15.2 cm) SWG-8 (-19.1 cm)SWG-9 (-24.1 cm) SWG-10 (-29.2 cm) SWG-11 (-34.3 cm)
Figure B-20. North Sidewall Type K “SWG” Array Data.
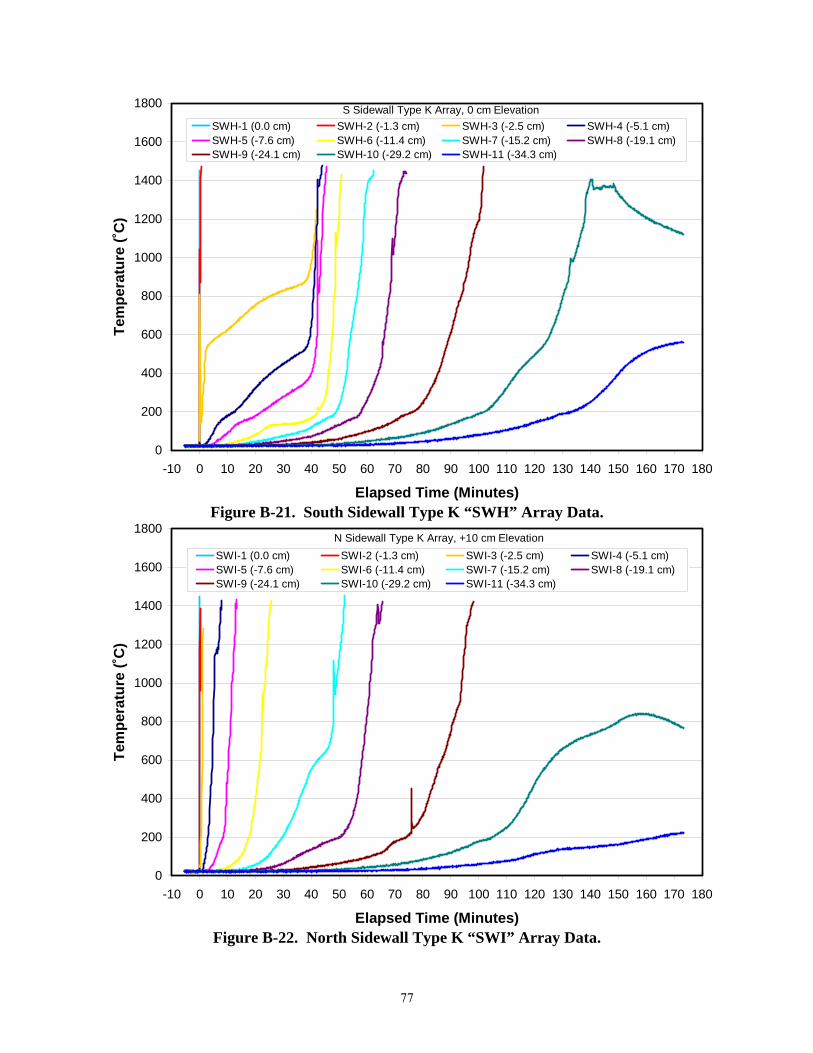
77
S Sidewall Type K Array, 0 cm Elevation
0
200
400
600
800
1000
1200
1400
1600
1800
-10 0 10 20 30 40 50 60 70 80 90 100 110 120 130 140 150 160 170 180
Elapsed Time (Minutes)
Tem
pera
ture
(˚C
)SWH-1 (0.0 cm) SWH-2 (-1.3 cm) SWH-3 (-2.5 cm) SWH-4 (-5.1 cm)SWH-5 (-7.6 cm) SWH-6 (-11.4 cm) SWH-7 (-15.2 cm) SWH-8 (-19.1 cm)SWH-9 (-24.1 cm) SWH-10 (-29.2 cm) SWH-11 (-34.3 cm)
Figure B-21. South Sidewall Type K “SWH” Array Data.
N Sidewall Type K Array, +10 cm Elevation
0
200
400
600
800
1000
1200
1400
1600
1800
-10 0 10 20 30 40 50 60 70 80 90 100 110 120 130 140 150 160 170 180
Elapsed Time (Minutes)
Tem
pera
ture
(˚C
)
SWI-1 (0.0 cm) SWI-2 (-1.3 cm) SWI-3 (-2.5 cm) SWI-4 (-5.1 cm)SWI-5 (-7.6 cm) SWI-6 (-11.4 cm) SWI-7 (-15.2 cm) SWI-8 (-19.1 cm)SWI-9 (-24.1 cm) SWI-10 (-29.2 cm) SWI-11 (-34.3 cm)
Figure B-22. North Sidewall Type K “SWI” Array Data.

78
S Sidewall Type K Array, +10 cm Elevation
0
200
400
600
800
1000
1200
1400
1600
1800
-10 0 10 20 30 40 50 60 70 80 90 100 110 120 130 140 150 160 170 180
Elapsed Time (Minutes)
Tem
pera
ture
(˚C
)SWJ-1 (0.0 cm) SWJ-2 (-1.3 cm) SWJ-3 (-2.5 cm) SWJ-4 (-5.1 cm)SWJ-5 (-7.6 cm) SWJ-6 (-11.4 cm) SWJ-7 (-15.2 cm) SWJ-8 (-19.1 cm)SWJ-9 (-24.1 cm) SWJ-10 (-29.2 cm) SWJ-11 (-34.3 cm)
Figure B-23. South Sidewall Type K “SWJ” Array Data.
N Sidewall Type K Array, +20 cm Elevation
0
200
400
600
800
1000
1200
1400
1600
1800
-10 0 10 20 30 40 50 60 70 80 90 100 110 120 130 140 150 160 170 180
Elapsed Time (Minutes)
Tem
pera
ture
(˚C
)
SWK-1 (0.0 cm) SWK-2 (-1.3 cm) SWK-3 (-2.5 cm) SWK-4 (-5.1 cm)SWK-5 (-7.6 cm) SWK-6 (-11.4 cm) SWK-7 (-15.2 cm) SWK-8 (-19.1 cm)SWK-9 (-24.1 cm) SWK-10 (-29.2 cm) SWK-11 (-34.3 cm)
Figure B-24. North Sidewall Type K “SWK” Array Data.

79
S Sidewall Type K Array, +20 cm Elevation
0
200
400
600
800
1000
1200
1400
1600
1800
-10 0 10 20 30 40 50 60 70 80 90 100 110 120 130 140 150 160 170 180
Elapsed Time (Minutes)
Tem
pera
ture
(˚C
)SWL-1 (0.0 cm) SWL-2 (-1.3 cm) SWL-3 (-2.5 cm) SWL-4 (-5.1 cm)SWL-5 (-7.6 cm) SWL-6 (-11.4 cm) SWL-7 (-15.2 cm) SWL-8 (-19.1 cm)SWL-9 (-24.1 cm) SWL-10 (-29.2 cm) SWL-11 (-34.3 cm)
Figure B-25. South Sidewall Type K “SWL” Array Data.
N Sidewall Type K Array+30 cm Elevation
0
200
400
600
800
1000
1200
1400
1600
1800
-10 0 10 20 30 40 50 60 70 80 90 100 110 120 130 140 150 160 170 180
Elapsed Time (Minutes)
Tem
pera
ture
(˚C
)
SWM-1 (0.0 cm)SWM-2 (-2.5 cm)SWM-3 (-5.1 cm)
Figure B-26. North Sidewall Type K “SWM” Array Data.
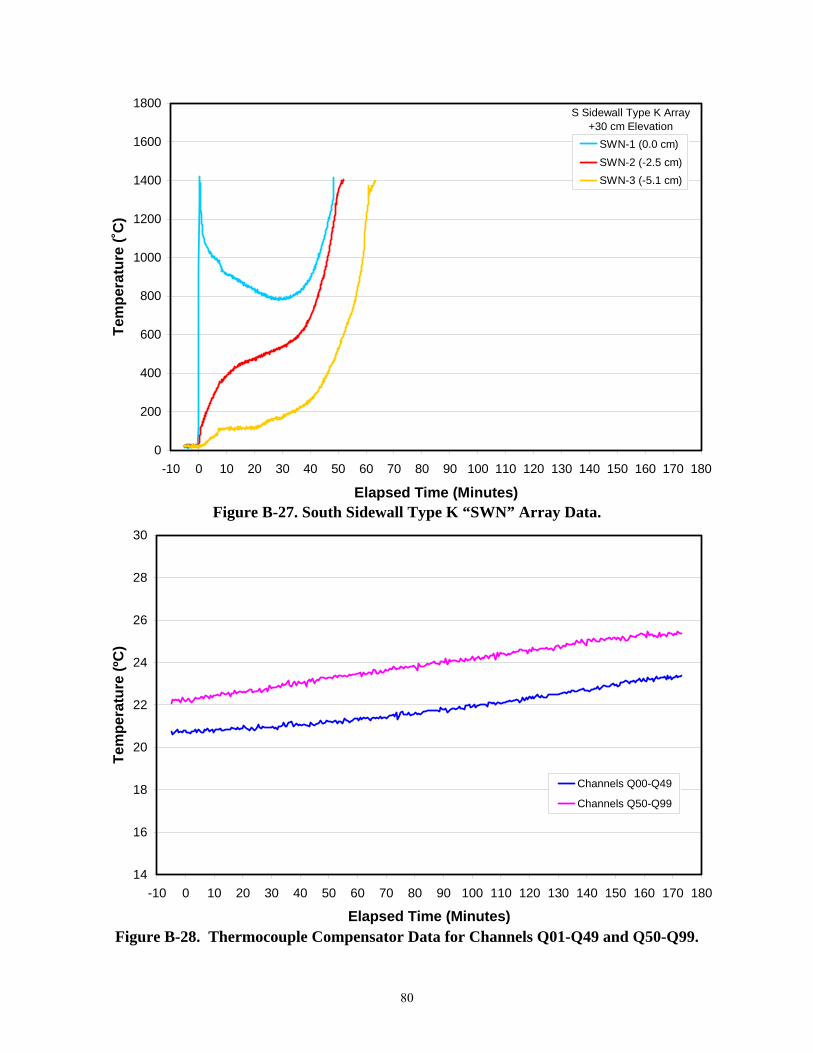
80
S Sidewall Type K Array+30 cm Elevation
0
200
400
600
800
1000
1200
1400
1600
1800
-10 0 10 20 30 40 50 60 70 80 90 100 110 120 130 140 150 160 170 180
Elapsed Time (Minutes)
Tem
pera
ture
(˚C
)SWN-1 (0.0 cm)SWN-2 (-2.5 cm)SWN-3 (-5.1 cm)
Figure B-27. South Sidewall Type K “SWN” Array Data.
14
16
18
20
22
24
26
28
30
-10 0 10 20 30 40 50 60 70 80 90 100 110 120 130 140 150 160 170 180
Elapsed Time (Minutes)
Tem
pera
ture
(ºC
)
Channels Q00-Q49
Channels Q50-Q99
Figure B-28. Thermocouple Compensator Data for Channels Q01-Q49 and Q50-Q99.
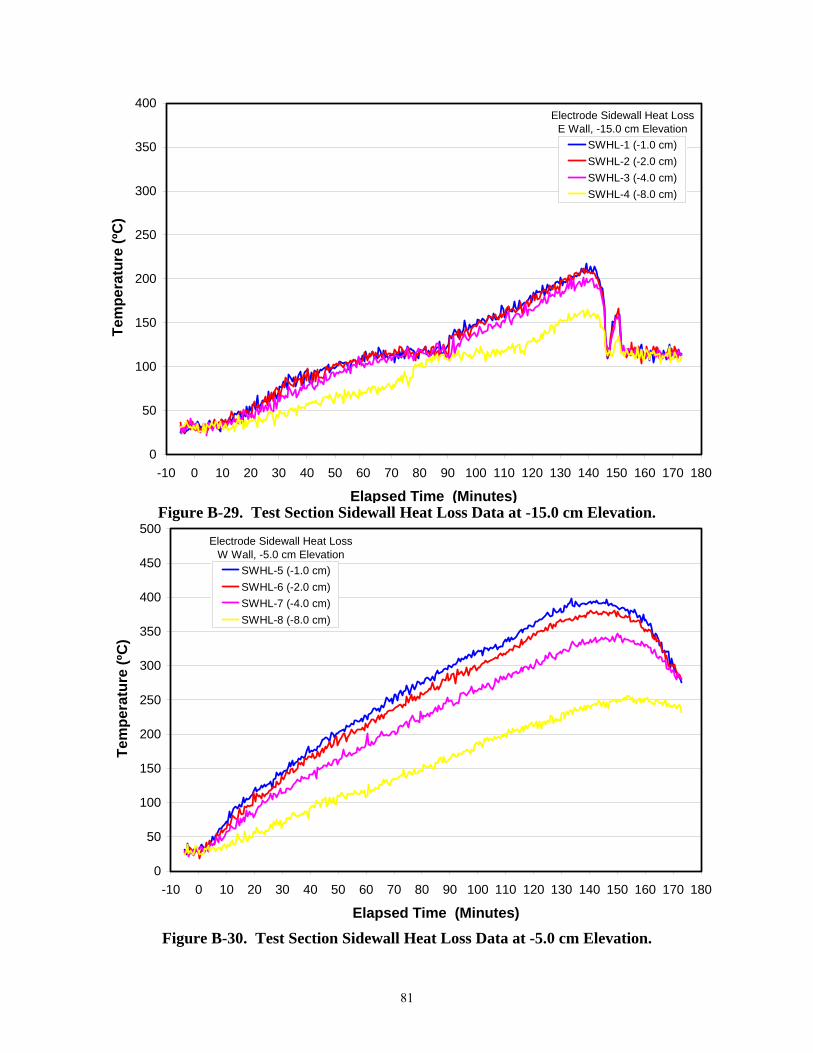
81
Electrode Sidewall Heat LossE Wall, -15.0 cm Elevation
0
50
100
150
200
250
300
350
400
-10 0 10 20 30 40 50 60 70 80 90 100 110 120 130 140 150 160 170 180
Elapsed Time (Minutes)
Tem
pera
ture
(ºC
)
SWHL-1 (-1.0 cm)SWHL-2 (-2.0 cm)SWHL-3 (-4.0 cm)SWHL-4 (-8.0 cm)
Figure B-29. Test Section Sidewall Heat Loss Data at -15.0 cm Elevation.
Electrode Sidewall Heat LossW Wall, -5.0 cm Elevation
0
50
100
150
200
250
300
350
400
450
500
-10 0 10 20 30 40 50 60 70 80 90 100 110 120 130 140 150 160 170 180
Elapsed Time (Minutes)
Tem
pera
ture
(ºC
)
SWHL-5 (-1.0 cm)SWHL-6 (-2.0 cm)SWHL-7 (-4.0 cm)SWHL-8 (-8.0 cm)
Figure B-30. Test Section Sidewall Heat Loss Data at -5.0 cm Elevation.
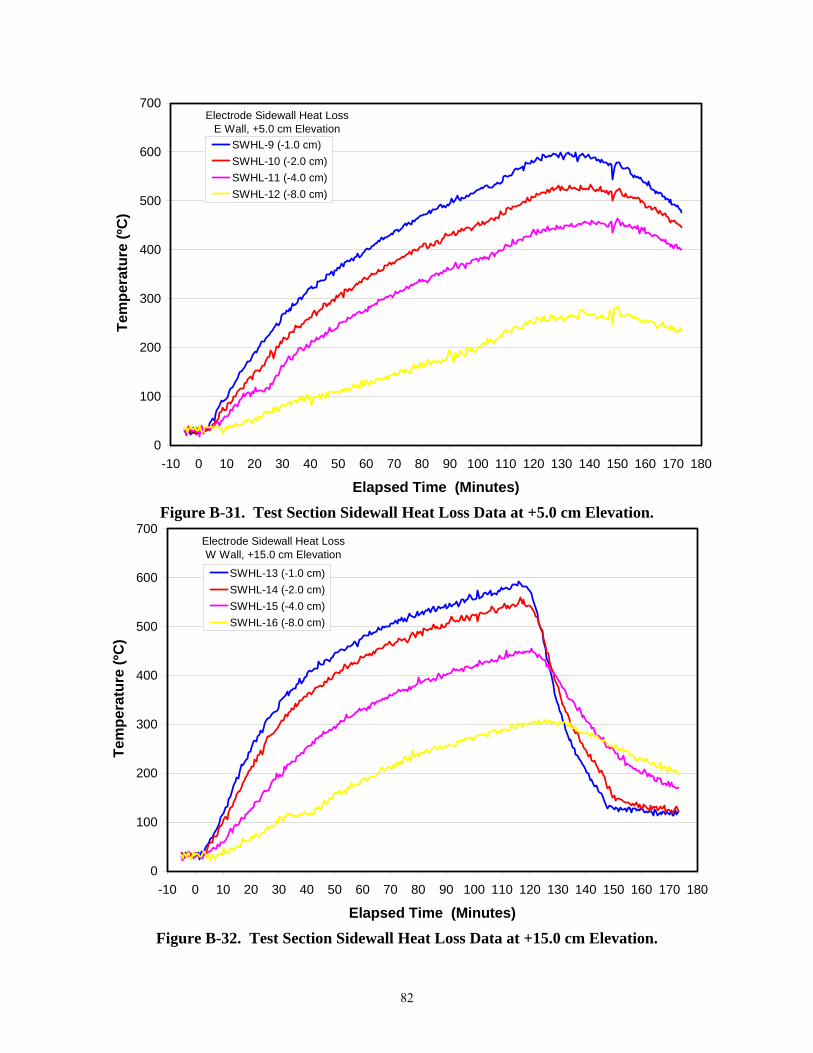
82
Electrode Sidewall Heat LossE Wall, +5.0 cm Elevation
0
100
200
300
400
500
600
700
-10 0 10 20 30 40 50 60 70 80 90 100 110 120 130 140 150 160 170 180
Elapsed Time (Minutes)
Tem
pera
ture
(ºC
)SWHL-9 (-1.0 cm)SWHL-10 (-2.0 cm)SWHL-11 (-4.0 cm)SWHL-12 (-8.0 cm)
Figure B-31. Test Section Sidewall Heat Loss Data at +5.0 cm Elevation.
Electrode Sidewall Heat LossW Wall, +15.0 cm Elevation
0
100
200
300
400
500
600
700
-10 0 10 20 30 40 50 60 70 80 90 100 110 120 130 140 150 160 170 180
Elapsed Time (Minutes)
Tem
pera
ture
(ºC
)
SWHL-13 (-1.0 cm)SWHL-14 (-2.0 cm)SWHL-15 (-4.0 cm)SWHL-16 (-8.0 cm)
Figure B-32. Test Section Sidewall Heat Loss Data at +15.0 cm Elevation.

83
Sidewall Heat LossS Wall, +70.0 cm Elevation
0
100
200
300
400
500
600
-10 0 10 20 30 40 50 60 70 80 90 100 110 120 130 140 150 160 170 180
Elapsed Time (Minutes)
Tem
pera
ture
(ºC
)SWHL-17 (0.0 cm)SWHL-18 (-2.0 cm)
Figure B-33. Test Section Sidewall Heat Loss Data at the +70.0 cm Elevation.
Sidewall Heat LossE Wall, +84.1 cm Elevation
0
100
200
300
400
500
600
-10 0 10 20 30 40 50 60 70 80 90 100 110 120 130 140 150 160 170 180
Elapsed Time (Minutes)
Tem
pera
ture
(ºC
)
SWHL-19 (0.0 cm)SWHL-20 (-2.0 cm)
Figure B-34. Test Section Sidewall Heat Loss Data at the +84.1 cm Elevation.
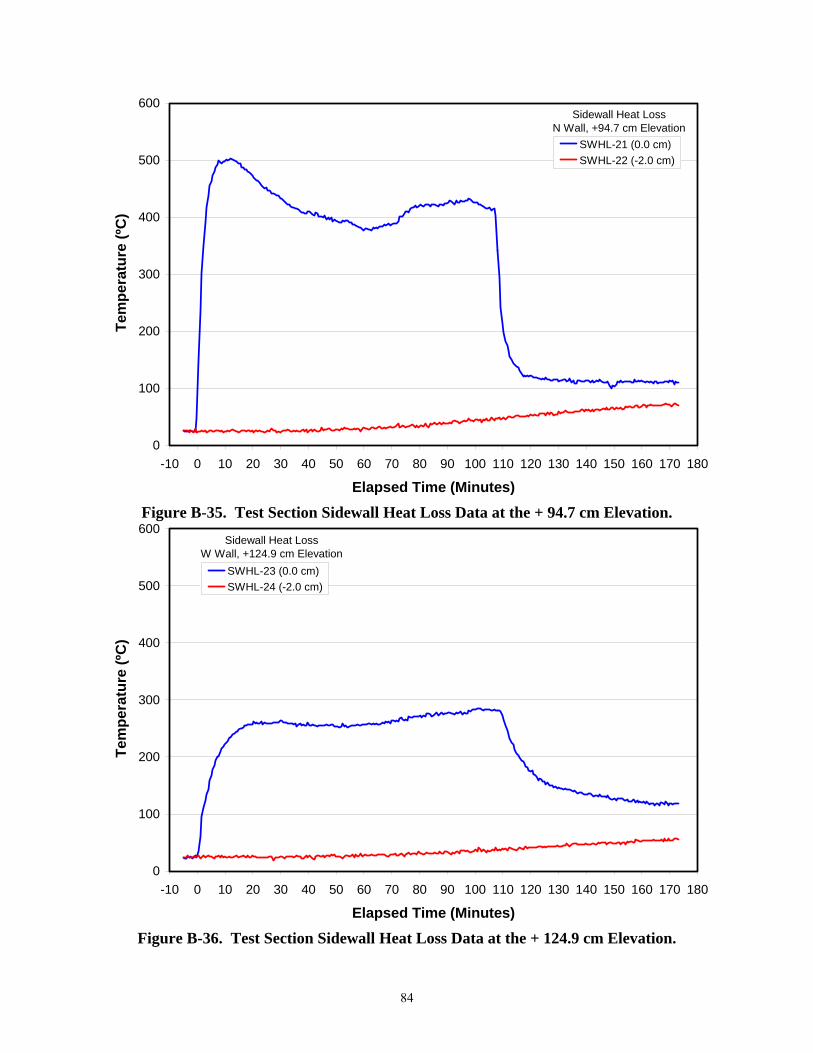
84
Sidewall Heat LossN Wall, +94.7 cm Elevation
0
100
200
300
400
500
600
-10 0 10 20 30 40 50 60 70 80 90 100 110 120 130 140 150 160 170 180
Elapsed Time (Minutes)
Tem
pera
ture
(ºC
)SWHL-21 (0.0 cm)SWHL-22 (-2.0 cm)
Figure B-35. Test Section Sidewall Heat Loss Data at the + 94.7 cm Elevation.
Sidewall Heat LossW Wall, +124.9 cm Elevation
0
100
200
300
400
500
600
-10 0 10 20 30 40 50 60 70 80 90 100 110 120 130 140 150 160 170 180
Elapsed Time (Minutes)
Tem
pera
ture
(ºC
)
SWHL-23 (0.0 cm)SWHL-24 (-2.0 cm)
Figure B-36. Test Section Sidewall Heat Loss Data at the + 124.9 cm Elevation.

85
Sidewall Heat LossS Wall, +151.3 cm Elevation
0
100
200
300
400
500
600
-10 0 10 20 30 40 50 60 70 80 90 100 110 120 130 140 150 160 170 180
Elapsed Time (Minutes)
Tem
pera
ture
(ºC
)SWHL-25 (0.0 cm)SWHL-26 (-2.0 cm)
Figure B-37. Test Section Sidewall Heat Loss Data at the + 151.3 cm Elevation.
0
100
200
300
400
500
600
700
800
900
1000
1100
1200
1300
-10 0 10 20 30 40 50 60 70 80 90 100 110 120 130 140 150 160 170 180
Elapsed Time (Minutes)
Tem
pera
ture
(ºC
)
ML-1: Main Line InternalML-2: External, Test Section TeeML-3: External, Pipe Lateral RunML-4: External, Vertical Run Into Quench Tank
Figure B-38. Test Section Mainline Thermocouple Data.
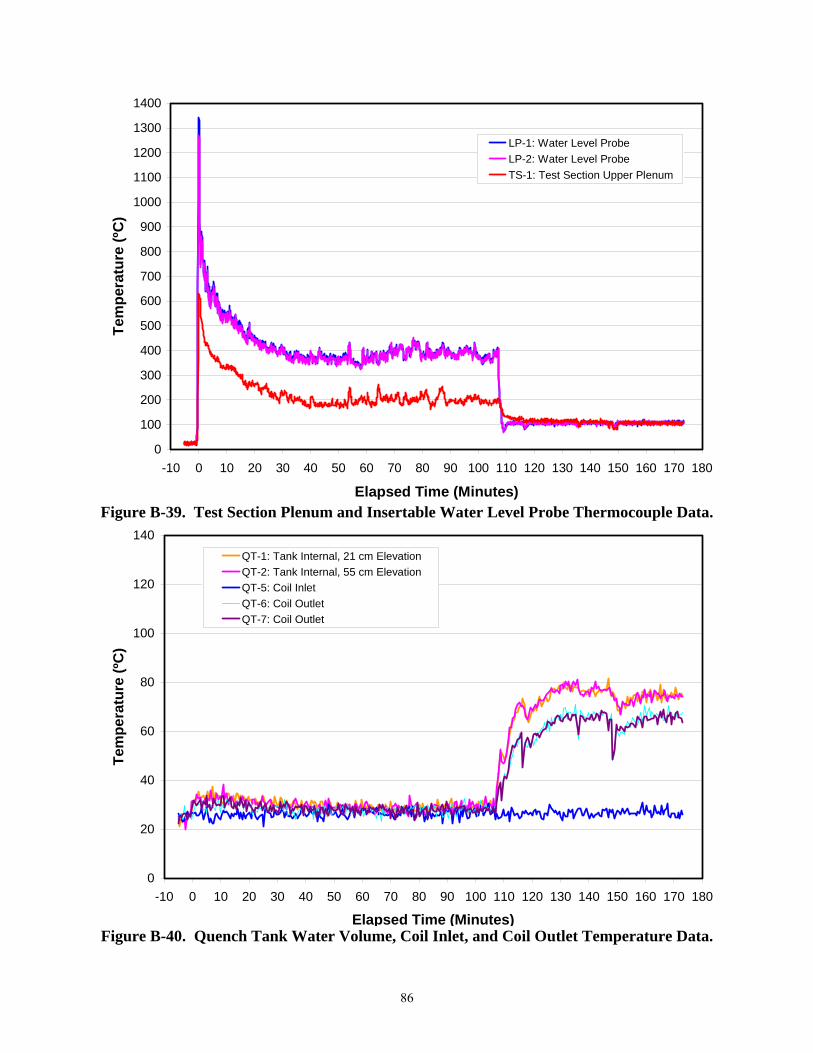
86
0
100
200
300
400
500
600
700
800
900
1000
1100
1200
1300
1400
-10 0 10 20 30 40 50 60 70 80 90 100 110 120 130 140 150 160 170 180
Elapsed Time (Minutes)
Tem
pera
ture
(ºC
)LP-1: Water Level ProbeLP-2: Water Level ProbeTS-1: Test Section Upper Plenum
Figure B-39. Test Section Plenum and Insertable Water Level Probe Thermocouple Data.
0
20
40
60
80
100
120
140
-10 0 10 20 30 40 50 60 70 80 90 100 110 120 130 140 150 160 170 180
Elapsed Time (Minutes)
Tem
pera
ture
(ºC
)
QT-1: Tank Internal, 21 cm ElevationQT-2: Tank Internal, 55 cm ElevationQT-5: Coil InletQT-6: Coil OutletQT-7: Coil Outlet
Figure B-40. Quench Tank Water Volume, Coil Inlet, and Coil Outlet Temperature Data.

87
0
20
40
60
80
100
120
140
-10 0 10 20 30 40 50 60 70 80 90 100 110 120 130 140 150 160 170 180
Elapsed Time (Minutes)
Tem
pera
ture
(ºC
)OT-1: Overflow Tank WaterST-1: Spray Tank WaterWS-1: Water Supply Tank WaterAT-1: Auxiliary Tank WaterOG-1: Final Offgas Temperature
Figure B-41. Miscellaneous Temperatures in Water Supply, Quench, and Off Gas Systems.
-200
0
200
400
600
800
1000
1200
1400
1600
1800
-10 0 10 20 30 40 50 60 70 80 90 100 110 120 130 140 150 160 170 180
Elapsed Time (Minutes)
Lanc
e A
pplie
d Lo
ad (k
N)
Peak Load Recorded on DAS (~0.2 Hz)Peak Load From Transducer Power Supply Readout (~3 Hz)
Figure B-42. Crust Lance Load Cell Data.
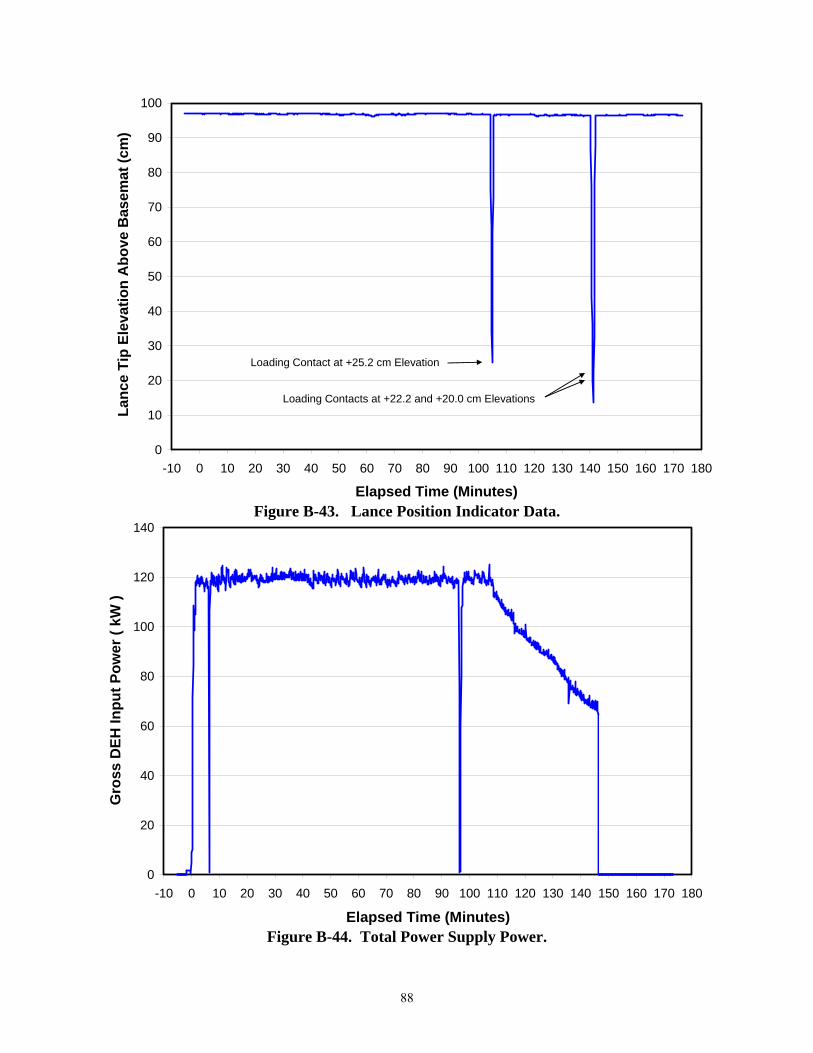
88
0
10
20
30
40
50
60
70
80
90
100
-10 0 10 20 30 40 50 60 70 80 90 100 110 120 130 140 150 160 170 180
Elapsed Time (Minutes)
Lanc
e Ti
p El
evat
ion
Abo
ve B
asem
at (c
m)
Loading Contact at +25.2 cm Elevation
Loading Contacts at +22.2 and +20.0 cm Elevations
Figure B-43. Lance Position Indicator Data.
0
20
40
60
80
100
120
140
-10 0 10 20 30 40 50 60 70 80 90 100 110 120 130 140 150 160 170 180
Elapsed Time (Minutes)
Gro
ss D
EH In
put P
ower
( kW
)
Figure B-44. Total Power Supply Power.
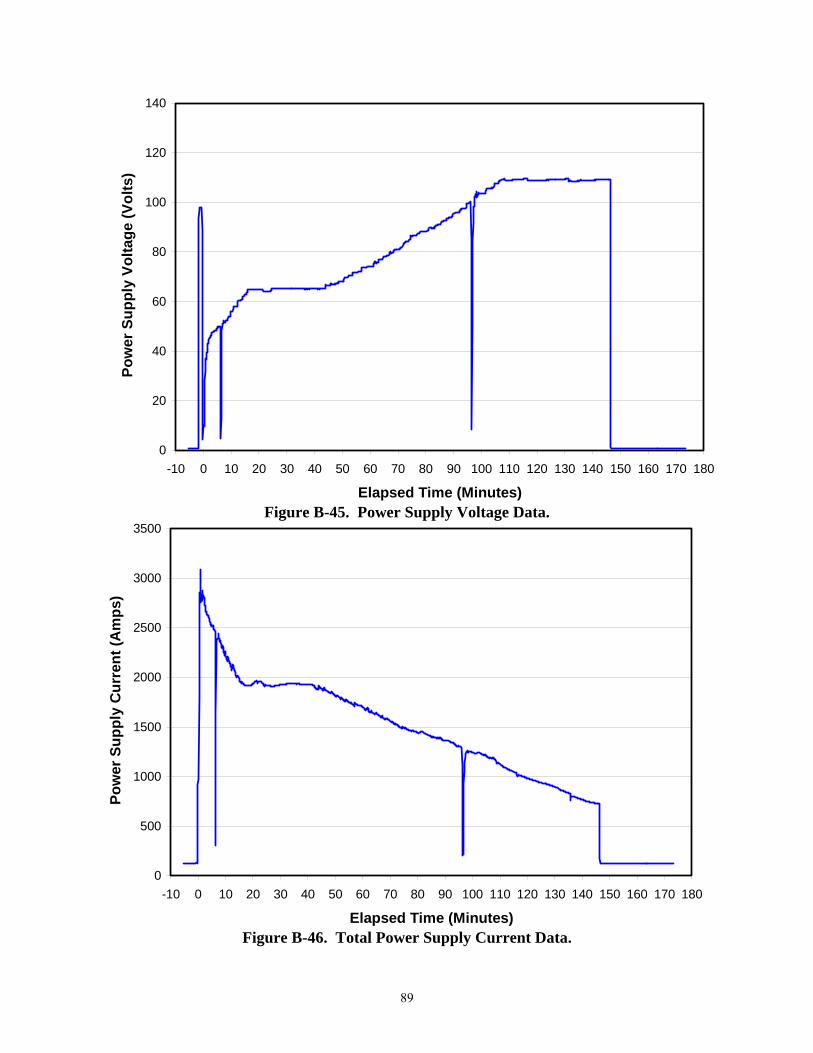
89
0
20
40
60
80
100
120
140
-10 0 10 20 30 40 50 60 70 80 90 100 110 120 130 140 150 160 170 180
Elapsed Time (Minutes)
Pow
er S
uppl
y Vo
ltage
(Vol
ts)
Figure B-45. Power Supply Voltage Data.
0
500
1000
1500
2000
2500
3000
3500
-10 0 10 20 30 40 50 60 70 80 90 100 110 120 130 140 150 160 170 180
Elapsed Time (Minutes)
Pow
er S
uppl
y C
urre
nt (A
mps
)
Figure B-46. Total Power Supply Current Data.

90
0
250
500
750
1000
1250
1500
1750
2000
-10 0 10 20 30 40 50 60 70 80 90 100 110 120 130 140 150 160 170 180
Elapsed Time (Minutes)
Pow
er S
uppl
y C
urre
nt (A
mps
)
Current Transformer # 1Current Transformer # 2
Figure B-47. Power Supply Current Transformer Data.
0
10
20
30
40
50
60
70
80
-10 0 10 20 30 40 50 60 70 80 90 100 110 120 130 140 150 160 170 180
Elapsed Time (Minutes)
Gro
ss D
EH In
put P
ower
( kW
)
Figure B-48. Hall Effect Meter Data.

91
0
10
20
30
40
50
-2.0 -1.5 -1.0 -0.5 0.0 0.5 1.0
Elapsed Time (Minutes)
Igni
tor V
olta
ge (A
rbita
ry U
nits
)
Figure B-49. Voltage across Igniter Shunt.
15.00
15.05
15.10
15.15
15.20
15.25
15.30
-10 0 10 20 30 40 50 60 70 80 90 100 110 120 130 140 150 160 170 180
Elapsed Time (Minutes)
Volta
ge (V
olts
)
PT Power Supply # 1PT Power Supply # 2
Figure B-50. Pressure Transducer Power Supply Voltages.

92
200
300
400
500
600
700
800
900
1000
-10 0 10 20 30 40 50 60 70 80 90 100 110 120 130 140 150 160 170 180
Elapsed Time (Minutes)
Wat
er V
olum
e (L
iters
)
LS-1: Water Supply Tank LevelLS-3: Overflow Tank LevelLS-4: Spray Tank Level
Figure B-51. Water Supply, Overflow, and Spray Tank Water Volume Data.
200
250
300
350
400
450
500
-10 0 10 20 30 40 50 60 70 80 90 100 110 120 130 140 150 160 170 180
Elapsed Time (Minutes)
Wat
er V
olum
e (L
iters
)
Figure B-52. Quench Tank Water Volume Data.
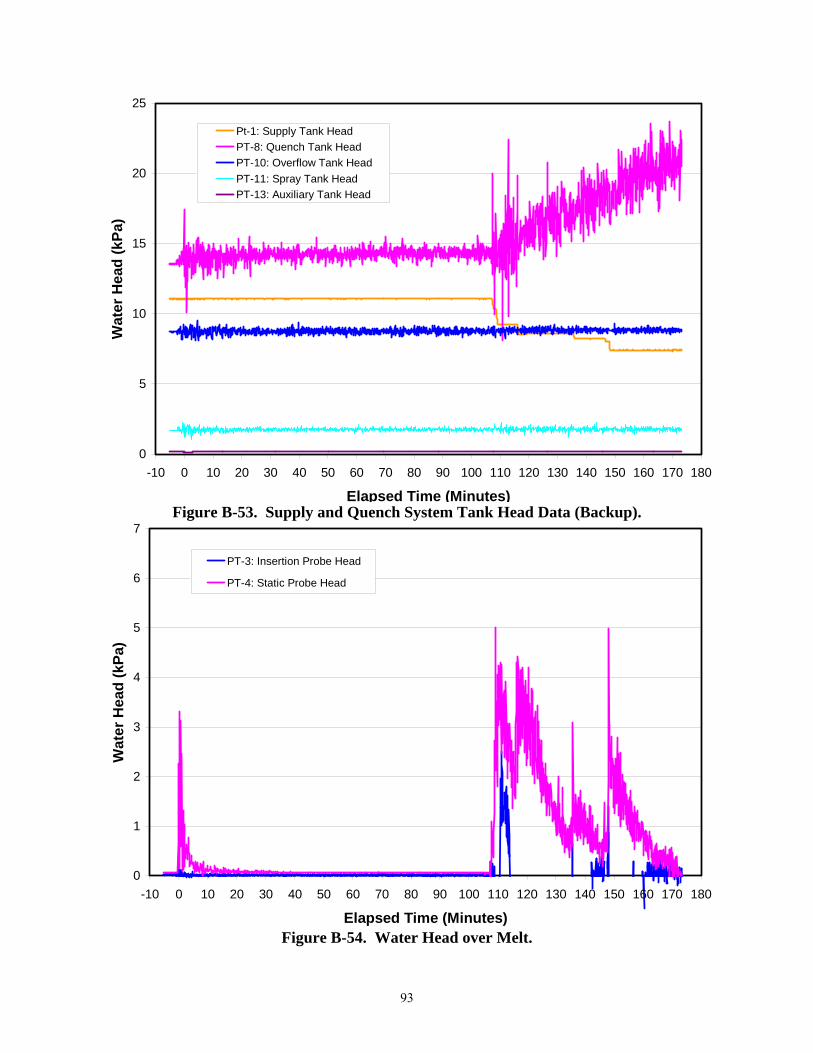
93
0
5
10
15
20
25
-10 0 10 20 30 40 50 60 70 80 90 100 110 120 130 140 150 160 170 180
Elapsed Time (Minutes)
Wat
er H
ead
(kPa
)Pt-1: Supply Tank HeadPT-8: Quench Tank HeadPT-10: Overflow Tank HeadPT-11: Spray Tank HeadPT-13: Auxiliary Tank Head
Figure B-53. Supply and Quench System Tank Head Data (Backup).
0
1
2
3
4
5
6
7
-10 0 10 20 30 40 50 60 70 80 90 100 110 120 130 140 150 160 170 180
Elapsed Time (Minutes)
Wat
er H
ead
(kPa
)
PT-3: Insertion Probe Head
PT-4: Static Probe Head
Figure B-54. Water Head over Melt.

94
1.0
1.1
1.2
1.3
1.4
1.5
1.6
1.7
1.8
1.9
2.0
-10 0 10 20 30 40 50 60 70 80 90 100 110 120 130 140 150 160 170 180
Elapsed Time (Minutes)
Abs
olut
e Pr
essu
re (B
ar)
PT-1: Supply Tank Pressure
Figure B-55. Water Supply Tank Pressure.
1.0
1.1
1.2
1.3
1.4
1.5
1.6
1.7
-10 0 10 20 30 40 50 60 70 80 90 100 110 120 130 140 150 160 170 180
Elapsed Time (Minutes)
Abs
olut
e Pr
essu
re (B
ar)
PT-5: Test Section Plenum
PT-6: Basemat Side Pressure
Figure B-56. Test Section Pressure.

95
0
5
10
15
20
25
30
35
40
45
50
-10 0 10 20 30 40 50 60 70 80 90 100 110 120 130 140 150 160 170 180
Elapsed Time (Minutes)
Diff
eren
tial P
ress
ure
(kPa
)PT-9: Quench/Overflow Tank Plenum
PT-12: Spray Tank Plenum
Figure B-57. Quench/Overflow and Spray Tank Plenum Differential Pressures.
0
20
40
60
80
100
120
140
160
180
200
-10 0 10 20 30 40 50 60 70 80 90 100 110 120 130 140 150 160 170 180
Elapsed Time (Minutes)
Flow
rate
(lite
rs/m
in)
FM-1: Water Flowrate to Test Section
FM-2: Quench Tank Coil Flowrate
Figure B-58. Water Flow Rates.
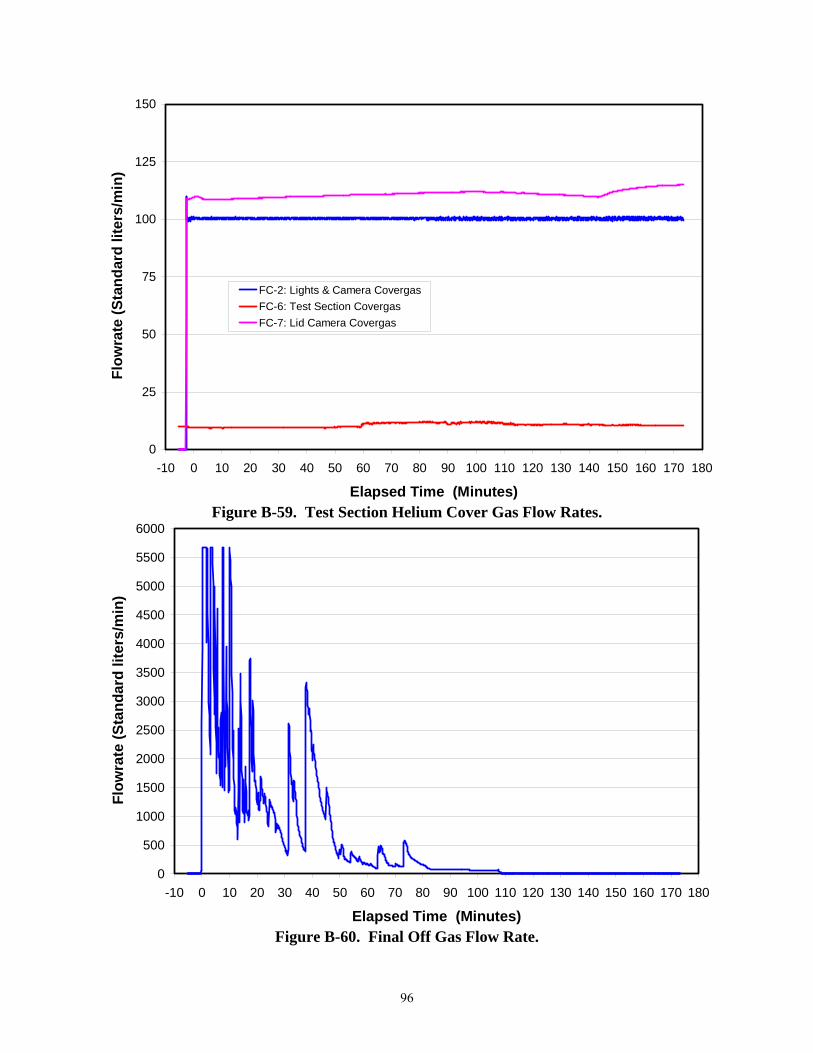
96
0
25
50
75
100
125
150
-10 0 10 20 30 40 50 60 70 80 90 100 110 120 130 140 150 160 170 180
Elapsed Time (Minutes)
Flow
rate
(Sta
ndar
d lit
ers/
min
)
FC-2: Lights & Camera CovergasFC-6: Test Section CovergasFC-7: Lid Camera Covergas
Figure B-59. Test Section Helium Cover Gas Flow Rates.
0
500
1000
1500
2000
2500
3000
3500
4000
4500
5000
5500
6000
-10 0 10 20 30 40 50 60 70 80 90 100 110 120 130 140 150 160 170 180
Elapsed Time (Minutes)
Flow
rate
(Sta
ndar
d lit
ers/
min
)
Figure B-60. Final Off Gas Flow Rate.