ocean shipping container availability · ocean shipping container availability report — july 11,...
TRANSCRIPT

Ocean Shipping Container Availability Report — July 11, 2012
Weekly Container Overview
July 11, 2012
Understanding this Report P.2
Na onal Overview Maps P. 3‐5
Container Availability by Loca on:
Charleston, SC P.6
Chicago, IL P.7
Cincinna , OH P.8
Columbus, OH P.9
Dallas, TX P.10
Denver, CO P.11
Houston, TX P.12
Kansas City, MO P.13
Long Beach, CA P.14
Memphis, TN P.15
Minneapolis, MN P.16
New Orleans, LA P.17
New York, NY P.18
Norfolk, VA P.19
Oakland, CA P.20
Savannah, GA P.21
Sea le, WA P.22
Tacoma, WA P.23
To subscribe to OSCAR, e‐mail: [email protected]
A weekly publica on of the Transporta on Services Division, AMS
United States Department of Agriculture
Ocean Shipping Container Availability Report
On average, over the next 3 weeks the Ports of Long Beach, New York, and Oakland
are expected to have the most containers available among the 18 loca ons
reported. Availability at Long Beach and New York is expected to increase during
the next 3 weeks.
Among the inland loca ons reported, Dallas and Chicago are expected to have the
most containers available over the next 3 weeks. Availability is es mated to
increase each week, par cularly for 20 containers in Chicago and 40 high‐cube
containers in Dallas.
At more than half of the loca ons reported, the increase in availability for 40 high
‐cube containers over the next 3 weeks was greater than each of the other 4
container types.
Refrigerated containers are in greatest supply in Long Beach, New York, Oakland,
and Sea le, and, to a lesser extent, in Savannah and Houston.
Dry 40 containers are in greatest supply in Long Beach, New York, Dallas, Chicago,
Oakland, and Memphis this week. Availability of 40 containers is reportedly the
lowest in Savannah, Houston, and Columbus.
The greatest increase in availability over the next 3 weeks is expected in Oakland
for 20 refrigerated containers and in Sea le for 20 dry containers. The greatest
decreases in availability were reported for 40 high cube containers in Savannah
and Oakland, as well as 40 standard containers in Sea le.
www.ams.usda.gov/oscar
United States
Department
of Agriculture
Agricultural
Marke ng Service

Ocean Shipping Container Availability Report — July 11, 2012 2
Understanding this Report The weekly Ocean Shipping Container Availability Report (OCSAR) provides a snapshot of container availability for westbound
transpacific trade lanes at select intermodal loca ons around the country. The data presented in this report are gathered from the 10
member carriers in the Westbound Transpacific Stabiliza on Agreement (WTSA). The WTSA carriers include APL, COSCO, Evergreen,
Hanjin Shipping, Hapag Lloyd, Yang Ming Transport Corpora on, OOCL, NYK Line, K Line, and Hyundai Merchant Marine.
The data are es mates of container availability per week by the par cipa ng carriers. The carriers determine container availability
by comparing current supplies at each of the 18 intermodal loca ons with the demand for these containers based on up‐to‐date
bookings or reserva on informa on in the westbound transpacific trade lane.
Each week, par cipa ng carriers report the es mated number of containers available for the current week (W1) as well as
es mates for the subsequent 2 weeks (W2 and W3).
Maps on pages 3–5 offer a na onal overview of weekly container availability, as well as an average of availability over the past 6
months. The weekly na onal data are derived from the sum of the individual carrier responses at each intermodal loca on.
Individual carrier responses are presented by loca on on pages 6–23 and have been sorted from largest to smallest. To maintain
carrier confiden ality, specific carrier iden fica on is not provided.
Carrier responses showing nega ve numbers, such as ‐29, should be interpreted as meaning that 29 containers are needed by
shippers but the carrier is not able to supply them. A posi ve number, such as 64, would mean 64 containers are available that are
not demanded. An indica on of 0 means the carriers have the exact amount of containers needed based on current supply and
demand es mates.
In addi on to the weekly container availability data, the par cipa ng carriers provide average weekly throughput data for the past
6 months. These data help readers understand the aggregate flow of containers that have moved through the 18 select loca ons
by the 10 par cipa ng carriers over the previous 6 months. These data will only be updated every 6 months.
Availability levels are subject to change, and may be affected by delays in return of equipment to carriers by shippers or consignees,
and by free me restric ons imposed by railroads. Due to the dynamic nature of the container industry, carriers cannot be held
responsible for the level of availability at the me of inquiry.
Data presented in the report do not imply availability of chassis.
Container availability es mates represent availability for all export cargo, not just agricultural products.
USDA collects these data on a voluntary basis and cannot be held responsible for the status of container availability when a reader
makes inquiry with an ocean carrier. USDA relies on the par cipa ng ocean carriers to ensure the data is accurate.
Terminology:
20 Dry Container (20 ): A standard shipping container that is 20 feet long.
40 Dry Container (40 ): A standard shipping container that is 40 feet long.
40 High‐Cube (HC): A shipping container which is 40 feet long and 9 feet, 6 inches tall (1 foot taller than a standard 40 dry
container).
40 reefer: A refrigerated shipping container which is 40 feet long.
20 reefer: A refrigerated shipping container which is 20 feet long.
Chassis: A wheeled frame to which a shipping container can be locked for storage or movement. (Plural chassis)
Ocean Shipping Con‐
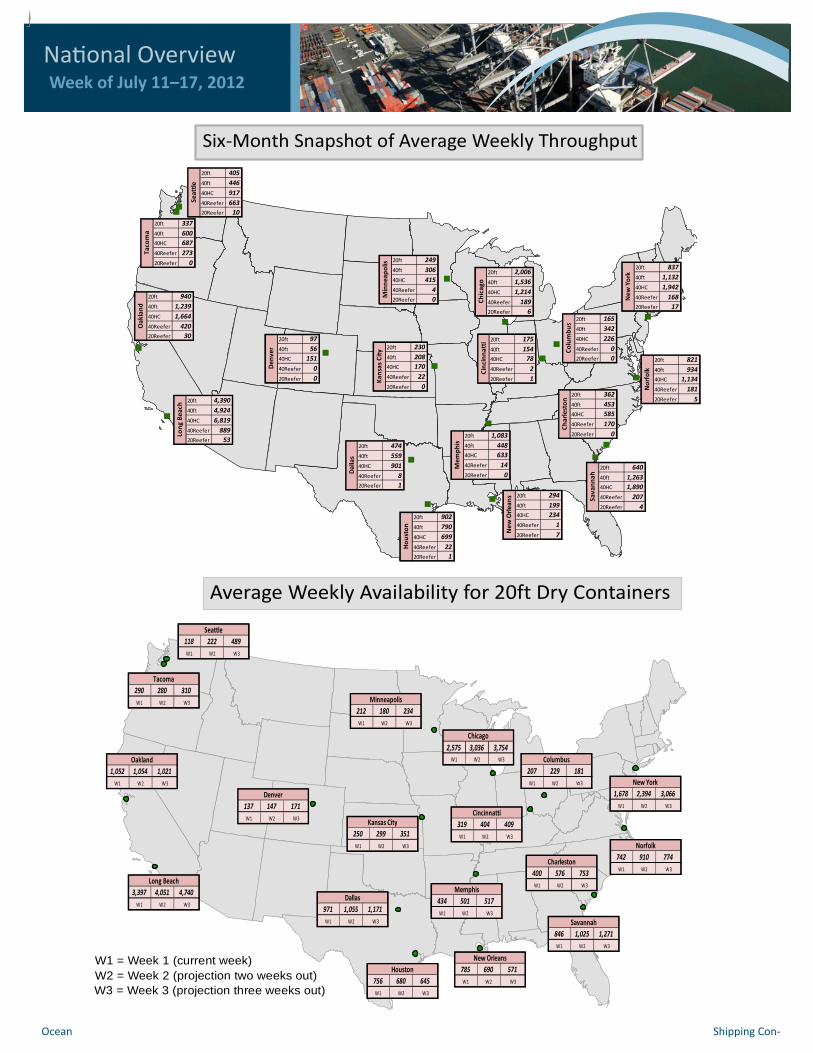
Na onal Overview Week of July 11–17, 2012
Average Weekly Availability for 20ft Dry Containers
W1 = Week 1 (current week)W2 = Week 2 (projection two weeks out)W3 = Week 3 (projection three weeks out)
400 576 753
W1 W2 W3
Charleston
2,575 3,036 3,754W1 W2 W3
Chicago
319 404 409
W1 W2 W3
Cincinnatti
207 229 181
W1 W2 W3
Columbus
971 1,055 1,171
W1 W2 W3
Dallas
137 147 171
W1 W2 W3
Denver
756 680 645
W1 W2 W3
Houston
250 299 351
W1 W2 W3
Kansas City
3,397 4,051 4,740
W1 W2 W3
Long Beach
434 501 517
W1 W2 W3
Memphis
212 180 234
W1 W2 W3
Minneapolis
785 690 571
W1 W2 W3
New Orleans
1,678 2,394 3,066
W1 W2 W3
New York
742 910 774
W1 W2 W3
Norfolk
1,052 1,054 1,021
W1 W2 W3
Oakland
846 1,025 1,271
W1 W2 W3
Savannah
118 222 489
W1 W2 W3
Seattle
290 280 310
W1 W2 W3
Tacoma
")")
")
")
")
")
")
")
")
")
")
")
")
")
")
")
")
")
Six‐Month Snapshot of Average Weekly Throughput
20ft 2,006
40ft 1,536
40HC 1,214
40Reefer 189
20Reefer 6
Chicago
20ft 175
40ft 154
40HC 78
40Reefer 2
20Reefer 1
Cincinnatti
20ft 165
40ft 342
40HC 226
40Reefer 0
20Reefer 0
Columbus
20ft 97
40ft 56
40HC 151
40Reefer 0
20Reefer 0
Den
ver
20ft 902
40ft 790
40HC 699
40Reefer 22
20Reefer 1
Houston
20ft 230
40ft 208
40HC 170
40Reefer 22
20Reefer 0Kansas City
20ft 474
40ft 559
40HC 901
40Reefer 8
20Reefer 1
Dallas
20ft 4,390
40ft 4,924
40HC 6,819
40Reefer 889
20Reefer 53
Long Beach
20ft 1,083
40ft 448
40HC 633
40Reefer 14
20Reefer 0
Mem
phis
20ft 249
40ft 306
40HC 415
40Reefer 4
20Reefer 0
Minneapolis
20ft 294
40ft 199
40HC 234
40Reefer 1
20Reefer 7
New
Orleans
20ft 837
40ft 1,132
40HC 1,942
40Reefer 168
20Reefer 17
New
York
20ft 821
40ft 934
40HC 1,134
40Reefer 181
20Reefer 5
Norfolk
20ft 940
40ft 1,239
40HC 1,664
40Reefer 420
20Reefer 30
Oakland
20ft 640
40ft 1,263
40HC 1,890
40Reefer 207
20Reefer 4
Savannah
20ft 405
40ft 446
40HC 917
40Reefer 663
20Reefer 10
Seattle
20ft 337
40ft 600
40HC 687
40Reefer 273
20Reefer 0
Tacoma
20ft 362
40ft 453
40HC 585
40Reefer 170
20Reefer 0
Charleston

Ocean Shipping Container Availability Report — July 11, 2012 4
Average Weekly Availability for 40ft High Cube Containers
W1 = Week 1 (current week)W2 = Week 2 (projection two weeks out)W3 = Week 3 (projection three weeks out)
Na onal Overview Week of July 11–17, 2012
Average Weekly Availability for 40ft Dry Containers
W1 = Week 1 (current week)W2 = Week 2 (projection two weeks out)W3 = Week 3 (projection three weeks out)
400 576 753
W1 W2 W3
Charleston
680 762 470
W1 W2 W3
Chicago
179 225 289
W1 W2 W3
Cincinnatti
‐33 ‐58 ‐31
W1 W2 W3
Columbus
1,019 1,001 1,116
W1 W2 W3
Dallas
164 148 132
W1 W2 W3
Denver
‐28 ‐231 ‐373
W1 W2 W3
Houston
199 236 242
W1 W2 W3
Kansas City
4,026 4,537 5,421
W1 W2 W3
Long Beach
568 553 577
W1 W2 W3
Memphis
256 330 438
W1 W2 W3
Minneapolis
246 170 118
W1 W2 W3
New Orleans
1,203 1,868 2,597
W1 W2 W3
New York
547 641 592
W1 W2 W3
Norfolk
679 492 263
W1 W2 W3
Oakland
‐42 ‐338 ‐617
W1 W2 W3
Savannah
168 89 31
W1 W2 W3
Seattle
460 362 417
W1 W2 W3
Tacoma
128 252 315
W1 W2 W3
Charleston
356 718 1,146
W1 W2 W3
Chicago
185 303 386
W1 W2 W3
Cincinnatti
249 345 338
W1 W2 W3
Columbus
1,711 1,949 2,165
W1 W2 W3
Dallas
284 315 423
W1 W2 W3
Denver
1,668 1,667 1,673
W1 W2 W3
Houston
107 150 172
W1 W2 W3
Kansas City
8,734 9,017 10,021
W1 W2 W3
Long Beach
1,307 1,587 1,842
W1 W2 W3
Memphis
151 116 143
W1 W2 W3
Minneapolis
1,096 1,060 989
W1 W2 W3
New Orleans
2,421 2,742 3,614
W1 W2 W3
New York
725 806 822
W1 W2 W3
Norfolk
1,067 633 144
W1 W2 W3
Oakland
114 ‐219 ‐565
W1 W2 W3
Savannah
539 443 305
W1 W2 W3
Seattle
‐364 ‐767 ‐815
W1 W2 W3
Tacoma
Ocean Shipping Container Availability Report — July 11, 2012 5
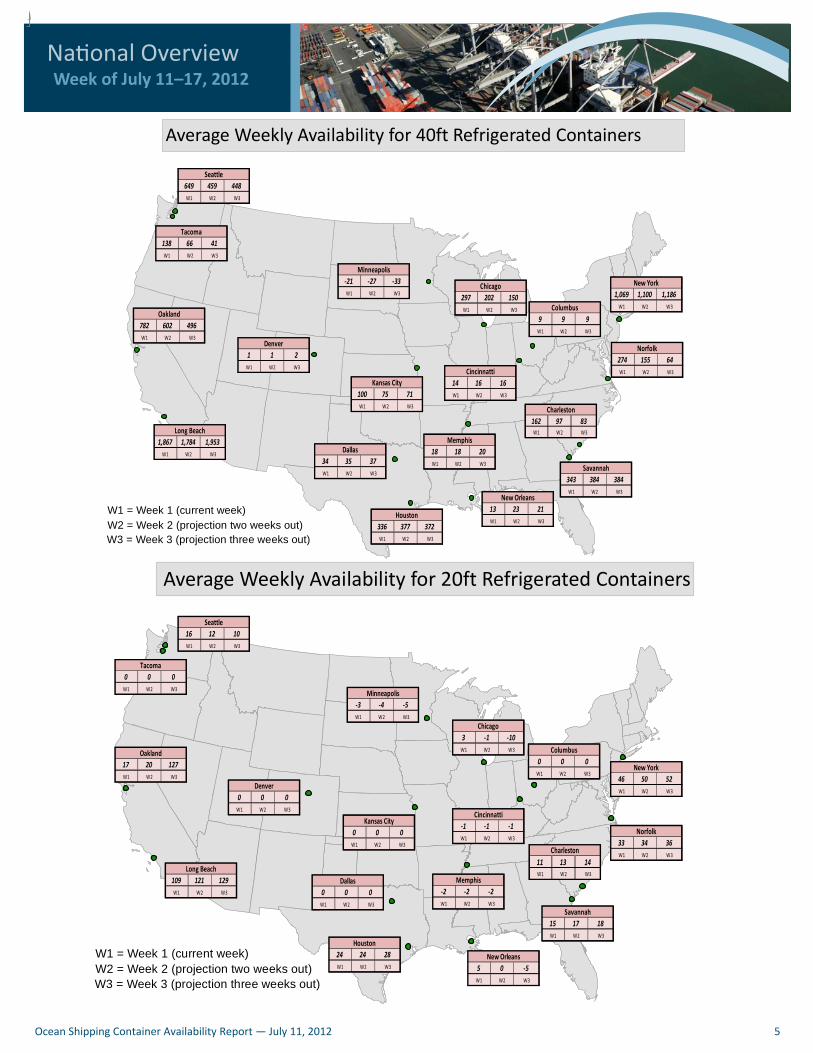
Na onal Overview Week of July 11–17, 2012
Average Weekly Availability for 20ft Refrigerated Containers
W1 = Week 1 (current week)W2 = Week 2 (projection two weeks out)W3 = Week 3 (projection three weeks out)
Average Weekly Availability for 40ft Refrigerated Containers
W1 = Week 1 (current week)W2 = Week 2 (projection two weeks out)W3 = Week 3 (projection three weeks out)
11 13 14W1 W2 W3
Charleston
3 ‐1 ‐10
W1 W2 W3
Chicago
‐1 ‐1 ‐1
W1 W2 W3
Cincinnatti
0 0 0
W1 W2 W3
Columbus
0 0 0
W1 W2 W3
Dallas
0 0 0
W1 W2 W3
Denver
24 24 28
W1 W2 W3
Houston
0 0 0
W1 W2 W3
Kansas City
109 121 129
W1 W2 W3
Long Beach
‐2 ‐2 ‐2
W1 W2 W3
Memphis
‐3 ‐4 ‐5
W1 W2 W3
Minneapolis
5 0 ‐5
W1 W2 W3
New Orleans
46 50 52
W1 W2 W3
New York
33 34 36
W1 W2 W3
Norfolk
17 20 127
W1 W2 W3
Oakland
15 17 18
W1 W2 W3
Savannah
16 12 10
W1 W2 W3
Seattle
0 0 0
W1 W2 W3
Tacoma
162 97 83W1 W2 W3
Charleston
297 202 150
W1 W2 W3
Chicago
14 16 16
W1 W2 W3
Cincinnatti
9 9 9
W1 W2 W3
Columbus
34 35 37
W1 W2 W3
Dallas
1 1 2
W1 W2 W3
Denver
336 377 372
W1 W2 W3
Houston
100 75 71
W1 W2 W3
Kansas City
1,867 1,784 1,953
W1 W2 W3
Long Beach
18 18 20
W1 W2 W3
Memphis
‐21 ‐27 ‐33
W1 W2 W3
Minneapolis
13 23 21
W1 W2 W3
New Orleans
1,069 1,100 1,186
W1 W2 W3
New York
274 155 64
W1 W2 W3
Norfolk
782 602 496
W1 W2 W3
Oakland
343 384 384
W1 W2 W3
Savannah
649 459 448
W1 W2 W3
Seattle
138 66 41
W1 W2 W3
Tacoma

Ocean Shipping Container Availability Report — July 11, 2012 6
Charleston, SC
Note: “.” denotes no response from carriers.
Total
Current Week July 11‐17 103 80 50 43 42 34 27 15 6 . 400
Week 2: July 18‐24 217 117 50 43 41 42 55 5 6 . 576
Week 3: July 25‐31 336 150 50 43 41 42 66 18 7 . 753
Total
Current Week July 11‐17 198 183 58 52 40 16 15 11 ‐366 . 207
Week 2: July 18‐24 191 232 77 56 46 16 15 10 ‐502 . 141
Week 3: July 25‐31 191 288 125 67 22 16 15 11 ‐646 . 89
Total
Current Week July 11‐17 122 101 40 15 11 10 10 3 ‐184 . 128
Week 2: July 18‐24 140 131 40 43 11 51 10 2 ‐176 . 252
Week 3: July 25‐31 156 181 40 43 11 37 8 ‐8 ‐153 . 315
Total
Current Week July 11‐17 105 44 28 5 4 2 ‐1 ‐25 . . 162
Week 2: July 18‐24 95 49 34 5 5 1 ‐1 ‐91 . . 97
Week 3: July 25‐31 85 50 40 5 5 1 ‐1 ‐102 . . 83
Total
Current Week July 11‐17 7 3 1 . . . . . . . 11
Week 2: July 18‐24 8 4 1 . . . . . . . 13
Week 3: July 25‐31 8 5 1 . . . . . . . 14
Carrier Availability Responses
Carrier Availability Responses
Carrier Availability Category Responses
Carrier Availability Category Responses
Carrier Availability Category Responses
40ft Dry
40ft High Cube
40ft Refrigerated
20ft Refrigerated
Charleston20ft Dry
Container TypesAverage Total
Weekly Throughput*
20ft 362
40ft 453
40ft High Cubes 585
40ft Refrigerated 170
20ft Refrigerated 0
Range of Individual
Carrier Responses
Six‐Month Snapshot of Average Weekly
Throughput
9…100
0…200
0…200
0…60
0…0
November 2011‐April 2012
*Data reflect the sum of the individual carriers' average weekly throughput over a 6‐
month timeframe

Ocean Shipping Container Availability Report — July 11, 2012 7
Chicago, IL
Note: “.” denotes no response from carriers.
Container TypesAverage Total
Weekly Throughput*
20ft 2,006
40ft 1,536
40ft High Cubes 1,214
40ft Refrigerated 189
20ft Refrigerated 6
100…343
0…460
0…67
0…4
*Data reflect the sum of the individual carriers' average weekly throughput over a 6‐
month timeframe
Six‐Month Snapshot of Average Weekly
Throughput
Range of Individual
Carrier Responses
0…700
November 2011‐April 2012
Total
Current Week July 11‐17 914 700 476 384 126 10 9 ‐5 ‐39 . 2,575
Week 2: July 18‐24 1,305 700 717 249 126 10 17 ‐64 ‐24 . 3,036
Week 3: July 25‐31 1,694 700 915 456 126 10 17 ‐6 ‐158 . 3,754
Total
Current Week July 11‐17 232 203 200 155 50 11 ‐2 ‐79 ‐90 . 680
Week 2: July 18‐24 450 ‐11 200 325 63 11 ‐2 ‐45 ‐229 . 762
Week 3: July 25‐31 577 ‐414 200 505 ‐141 11 ‐2 ‐45 ‐221 . 470
Total
Current Week July 11‐17 383 296 171 130 17 10 4 ‐155 ‐500 . 356
Week 2: July 18‐24 497 357 272 133 17 10 74 ‐142 ‐500 . 718
Week 3: July 25‐31 606 450 552 208 17 10 ‐55 ‐142 ‐500 . 1,146
Total
Current Week July 11‐17 235 75 1 0 0 ‐14 . . . . 297
Week 2: July 18‐24 205 74 4 0 0 ‐81 . . . . 202
Week 3: July 25‐31 200 78 5 0 0 ‐133 . . . . 150
Total
Current Week July 11‐17 4 ‐1 . . . . . . . . 3
Week 2: July 18‐24 1 ‐2 . . . . . . . . ‐1
Week 3: July 25‐31 ‐5 ‐5 . . . . . . . . ‐10
40ft High Cube
Carrier Availability Category Responses
Carrier Availability Category Responses
Carrier Availability Category Responses
Carrier Availability Category Responses
Carrier Availability Category Responses
40ft Refrigerated
20ft Refrigerated
Chicago20ft Dry
40ft Dry

Ocean Shipping Container Availability Report — July 11, 2012 8
Cincinna , OH
Note: “.” denotes no response from carriers.
Total
Current Week July 11‐17 78 64 60 46 21 20 20 7 3 . 319
Week 2: July 18‐24 80 79 78 93 21 20 20 9 4 . 404
Week 3: July 25‐31 85 90 106 48 21 20 20 9 10 . 409
Total
Current Week July 11‐17 47 43 30 30 18 7 5 1 ‐2 . 179
Week 2: July 18‐24 57 43 30 62 17 7 6 5 ‐2 . 225
Week 3: July 25‐31 74 59 30 68 17 15 23 5 ‐2 . 289
Total
Current Week July 11‐17 59 41 20 19 14 10 10 7 5 . 185
Week 2: July 18‐24 67 57 13 15 14 10 7 79 41 . 303
Week 3: July 25‐31 86 67 42 15 14 10 7 110 35 . 386
Total
Current Week July 11‐17 10 4 0 . . . . . . . 14
Week 2: July 18‐24 12 4 0 . . . . . . . 16
Week 3: July 25‐31 12 4 0 . . . . . . . 16
Total
Current Week July 11‐17 ‐1 . . . . . . . . . ‐1
Week 2: July 18‐24 ‐1 . . . . . . . . . ‐1
Week 3: July 25‐31 ‐1 . . . . . . . . . ‐1
Carrier Availability Category Responses
Carrier Availability Category Responses
Carrier Availability Category Responses
Carrier Availability Category Responses
Carrier Availability Category Responses
20ft Dry
40ft Dry
40ft High Cube
40ft Refrigerated
Cincinnatti
20ft Refrigerated
Container TypesAverage Total
Weekly Throughput*
20ft 175
40ft 154
40ft High Cubes 78
40ft Refrigerated 2
20ft Refrigerated 1
0…45
6…18
0…2
0…1
4…100
Range of Individual
Carrier Responses
November 2011‐April 2012
*Data reflect the sum of the individual carriers' average weekly throughput over a 6‐
month timeframe
Six‐Month Snapshot of Average Weekly
Throughput

Ocean Shipping Container Availability Report — July 11, 2012 9
Columbus, OH
Note: “.” denotes no response from carriers.
Total
Current Week July 11‐17 65 54 21 20 19 11 10 7 . . 207
Week 2: July 18‐24 71 59 21 18 16 28 10 6 . . 229
Week 3: July 25‐31 ‐47 81 21 19 44 47 10 6 . . 181
Total
Current Week July 11‐17 30 21 17 4 3 ‐2 ‐33 ‐73 . . ‐33
Week 2: July 18‐24 30 ‐13 15 4 4 ‐3 ‐44 ‐51 . . ‐58
Week 3: July 25‐31 30 7 17 4 4 1 ‐57 ‐37 . . ‐31
Total
Current Week July 11‐17 110 71 22 19 14 10 2 1 . . 249
Week 2: July 18‐24 121 115 14 16 14 10 1 54 . . 345
Week 3: July 25‐31 181 164 38 17 14 10 1 ‐87 . . 338
Total
Current Week July 11‐17 6 3 . . . . . . . . 9
Week 2: July 18‐24 6 3 . . . . . . . . 9
Week 3: July 25‐31 6 3 . . . . . . . . 9
Total
Current Week July 11‐17 . . . . . . . . . . 0
Week 2: July 18‐24 . . . . . . . . . . 0
Week 3: July 25‐31 . . . . . . . . . . 0
Carrier Availability Category Responses
Carrier Availability Category Responses
Carrier Availability Category Responses
40ft High Cube
40ft Refrigerated
20ft Refrigerated
Carrier Availability Category Responses
Carrier Availability Category Responses
20ft Dry
40ft Dry
Columbus
Container TypesAverage Total
Weekly Throughput*
20ft 165
40ft 342
40ft High Cubes 226
40ft Refrigerated 0
20ft Refrigerated 0
3…78
14…45
0…0
0…0
*Data reflect the sum of the individual carriers' average weekly throughput over a 6‐
month timeframe
0…51
Six‐Month Snapshot of Average Weekly
Throughput
Range of Individual
Carrier Responses
November 2011‐April 2012

Ocean Shipping Container Availability Report — July 11, 2012 10
Dallas, TX
Note: “.” denotes no response from carriers.
Total
Current Week July 11‐17 185 169 158 151 110 85 79 20 14 . 971
Week 2: July 18‐24 214 282 153 51 154 85 77 25 14 . 1,055
Week 3: July 25‐31 293 400 153 3 214 85 ‐16 25 14 . 1,171
Total
Current Week July 11‐17 263 206 140 129 115 82 49 22 13 . 1,019
Week 2: July 18‐24 242 186 140 173 ‐44 181 91 19 13 . 1,001
Week 3: July 25‐31 242 252 140 270 ‐102 278 ‐2 25 13 . 1,116
Total
Current Week July 11‐17 439 334 282 173 170 152 100 39 22 . 1,711
Week 2: July 18‐24 425 331 362 265 170 195 100 81 20 . 1,949
Week 3: July 25‐31 425 287 558 332 170 286 100 ‐18 25 . 2,165
Total
Current Week July 11‐17 29 10 0 ‐5 . . . . . . 34
Week 2: July 18‐24 34 8 0 ‐7 . . . . . . 35
Week 3: July 25‐31 39 7 0 ‐9 . . . . . . 37
Total
Current Week July 11‐17 . . . . . . . . . . 0
Week 2: July 18‐24 . . . . . . . . . . 0
Week 3: July 25‐31 . . . . . . . . . . 0
Carrier Availability Category Responses
Carrier Availability Category Responses
40ft Dry
Carrier Availability Category Responses
40ft High Cube
40ft Refrigerated
20ft Refrigerated
Carrier Availability Category Responses
Carrier Availability Category Responses
Dallas20ft Dry
Container TypesAverage Total
Weekly Throughput*
20ft 474
40ft 559
40ft High Cubes 901
40ft Refrigerated 8
20ft Refrigerated 1
16…250
16…250
0…4
0…1
4…140
November 2011‐April 2012
*Data reflect the sum of the individual carriers' average weekly throughput over a 6‐
month timeframe
Six‐Month Snapshot of Average Weekly
Throughput
Range of Individual
Carrier Responses

Ocean Shipping Container Availability Report — July 11, 2012 11
Denver, CO
Note: “.” denotes no response from carriers.
Total
Current Week July 11‐17 87 37 15 15 11 3 ‐5 ‐10 ‐16 . 137
Week 2: July 18‐24 95 39 15 18 14 ‐6 ‐11 ‐10 ‐7 . 147
Week 3: July 25‐31 106 61 15 12 18 ‐6 ‐10 ‐10 ‐15 . 171
Total
Current Week July 11‐17 93 29 15 14 11 5 3 1 ‐7 . 164
Week 2: July 18‐24 108 ‐9 17 18 11 5 ‐3 3 ‐2 . 148
Week 3: July 25‐31 123 ‐32 12 20 11 5 ‐3 ‐4 0 . 132
Total
Current Week July 11‐17 141 32 31 30 28 15 6 2 ‐1 . 284
Week 2: July 18‐24 159 39 40 30 28 17 4 ‐1 ‐1 . 315
Week 3: July 25‐31 177 43 122 30 28 17 4 2 0 . 423
Total
Current Week July 11‐17 1 0 0 . . . . . . . 1
Week 2: July 18‐24 1 0 0 . . . . . . . 1
Week 3: July 25‐31 2 0 0 . . . . . . . 2
Total
Current Week July 11‐17 . . . . . . . . . . 0
Week 2: July 18‐24 . . . . . . . . . . 0
Week 3: July 25‐31 . . . . . . . . . . 0
Carrier Availability Category Responses
20ft Refrigerated
Carrier Availability Category Responses
40ft Dry
40ft High Cube
40ft Refrigerated
20ft Dry
Carrier Availability Category Responses
Denver
Carrier Availability Category Responses
Carrier Availability Category Responses
Container TypesAverage Total
Weekly Throughput*
20ft 97
40ft 56
40ft High Cubes 151
40ft Refrigerated 0
20ft Refrigerated 0
1…20
0…65
0…0
0…0
*Data reflect the sum of the individual carriers' average weekly throughput over a 6‐
month timeframe
1…30
November 2011‐April 2012
Six‐Month Snapshot of Average Weekly
Throughput
Range of Individual
Carrier Responses

Ocean Shipping Container Availability Report — July 11, 2012 12
Houston, TX
Note: “.” denotes no response from carriers.
Total
Current Week July 11‐17 254 152 141 82 58 34 20 11 4 . 756
Week 2: July 18‐24 197 166 132 80 ‐15 86 20 10 4 . 680
Week 3: July 25‐31 76 247 146 80 ‐48 105 20 15 4 . 645
Total
Current Week July 11‐17 84 72 50 15 ‐13 ‐24 ‐41 ‐85 ‐86 . ‐28
Week 2: July 18‐24 ‐40 20 50 15 ‐13 ‐104 ‐65 ‐14 ‐80 . ‐231
Week 3: July 25‐31 ‐17 ‐26 50 15 ‐13 ‐171 ‐65 11 ‐157 . ‐373
Total
Current Week July 11‐17 971 300 157 132 130 20 15 ‐9 ‐48 . 1,668
Week 2: July 18‐24 899 300 176 177 125 20 8 10 ‐48 . 1,667
Week 3: July 25‐31 816 300 196 237 110 20 8 34 ‐48 . 1,673
Total
Current Week July 11‐17 229 57 40 10 0 . . . . . 336
Week 2: July 18‐24 262 70 35 10 0 . . . . . 377
Week 3: July 25‐31 258 79 25 10 0 . . . . . 372
Total
Current Week July 11‐17 21 3 . . . . . . . . 24
Week 2: July 18‐24 21 3 . . . . . . . . 24
Week 3: July 25‐31 21 7 . . . . . . . . 28
40ft High Cube
40ft Refrigerated
Houston20ft Dry
40ft Dry
20ft Refrigerated
Carrier Availability Category Responses
Carrier Availability Category Responses
Carrier Availability Category Responses
Carrier Availability Category Responses
Carrier Availability Category Responses
Container TypesAverage Total
Weekly Throughput*
20ft 902
40ft 790
40ft High Cubes 699
40ft Refrigerated 22
20ft Refrigerated 1
5…328
November 2011‐April 2012
*Data reflect the sum of the individual carriers' average weekly throughput over a 6‐
month timeframe
Six‐Month Snapshot of Average Weekly
Throughput
Range of Individual
Carrier Responses
20…269
21…347
0…16
0…1

Ocean Shipping Container Availability Report — July 11, 2012 13
Kansas City, MO
Note: “.” denotes no response from carriers.
Total
Current Week July 11‐17 51 50 47 44 35 28 10 ‐5 ‐10 . 250
Week 2: July 18‐24 80 50 35 64 24 49 10 ‐3 ‐10 . 299
Week 3: July 25‐31 103 50 34 77 26 64 10 ‐3 ‐10 . 351
Total
Current Week July 11‐17 43 40 35 24 23 16 15 11 ‐8 . 199
Week 2: July 18‐24 46 40 44 42 7 16 26 11 4 . 236
Week 3: July 25‐31 48 40 49 58 13 16 3 11 4 . 242
Total
Current Week July 11‐17 49 41 36 10 10 8 6 ‐3 ‐50 . 107
Week 2: July 18‐24 46 41 89 6 10 0 11 ‐3 ‐50 . 150
Week 3: July 25‐31 63 41 95 ‐1 10 1 16 ‐3 ‐50 . 172
Total
Current Week July 11‐17 85 15 0 0 . . . . . . 100
Week 2: July 18‐24 60 13 0 2 . . . . . . 75
Week 3: July 25‐31 60 8 0 3 . . . . . . 71
Total
Current Week July 11‐17 . . . . . . . . . . 0
Week 2: July 18‐24 . . . . . . . . . . 0
Week 3: July 25‐31 . . . . . . . . . . 0
20ft Refrigerated
20ft Dry
40ft Dry
Carrier Availability Category Responses
Carrier Availability Category Responses
Carrier Availability Category Responses
Carrier Availability Category Responses
40ft High Cube
40ft Refrigerated
Kansas City
Carrier Availability Category Responses
Container TypesAverage Total
Weekly Throughput*
20ft 230
40ft 208
40ft High Cubes 170
40ft Refrigerated 22
20ft Refrigerated 0
*Data reflect the sum of the individual carriers' average weekly throughput over a 6‐
month timeframe
15…100
6…75
0…45
0…17
0…0
November 2011‐April 2012
Six‐Month Snapshot of Average Weekly
Throughput
Range of Individual
Carrier Responses

Ocean Shipping Container Availability Report — July 11, 2012 14
Note: “.” denotes no response from carriers.
Long Beach, CA
Total
Current Week July 11‐17 1,000 512 491 367 272 265 232 223 35 . 3,397
Week 2: July 18‐24 1,000 574 615 454 447 265 248 414 34 . 4,051
Week 3: July 25‐31 1,000 574 726 944 609 265 ‐38 615 45 . 4,740
Total
Current Week July 11‐17 1,200 1,002 565 397 355 307 279 30 ‐109 . 4,026
Week 2: July 18‐24 1,200 888 610 533 355 284 569 38 60 . 4,537
Week 3: July 25‐31 1,200 888 570 1,297 355 ‐107 935 32 251 . 5,421
Total
Current Week July 11‐17 3,000 1,603 1,108 1,086 844 753 239 73 28 . 8,734
Week 2: July 18‐24 3,000 1,378 1,550 1,086 502 914 469 83 35 . 9,017
Week 3: July 25‐31 3,000 1,378 1,881 1,086 1,338 923 680 ‐302 37 . 10,021
Total
Current Week July 11‐17 500 482 325 300 126 102 42 ‐10 . . 1,867
Week 2: July 18‐24 400 542 300 300 150 124 ‐22 ‐10 . . 1,784
Week 3: July 25‐31 450 591 290 300 184 131 17 ‐10 . . 1,953
Total
Current Week July 11‐17 54 30 25 . . . . . . . 109
Week 2: July 18‐24 68 28 25 . . . . . . . 121
Week 3: July 25‐31 80 24 25 . . . . . . . 129
Carrier Availability Category Responses
Carrier Availability Category Responses
40ft Refrigerated
20ft Refrigerated
40ft High Cube
Carrier Availability Category Responses
Long Beach20ft Dry
Carrier Availability Category Responses
Carrier Availability Category Responses
40ft Dry
Container TypesAverage Total
Weekly Throughput*
20ft 4,390
40ft 4,924
40ft High Cubes 6,819
40ft Refrigerated 889
20ft Refrigerated 53
*Data reflect the sum of the individual carriers' average weekly throughput over a 6‐
month timeframe
November 2011‐April 2012
Six‐Month Snapshot of Average Weekly
Throughput
Range of Individual
Carrier Responses
30…3,000
50…3,040
40…2,700
0…300
0…40

Ocean Shipping Container Availability Report — July 11, 2012 15
Memphis, TN
Note: “.” denotes no response from carriers.
Total
Current Week July 11‐17 130 117 67 39 25 20 16 12 8 . 434
Week 2: July 18‐24 130 165 59 42 24 24 37 12 8 . 501
Week 3: July 25‐31 130 179 59 ‐1 40 28 62 12 8 . 517
Total
Current Week July 11‐17 191 103 94 67 60 44 10 2 ‐3 . 568
Week 2: July 18‐24 173 137 24 69 60 37 8 2 43 . 553
Week 3: July 25‐31 222 178 ‐37 69 60 ‐8 11 2 80 . 577
Total
Current Week July 11‐17 550 197 188 185 77 55 48 9 ‐2 . 1,307
Week 2: July 18‐24 550 272 357 247 72 51 29 11 ‐2 . 1,587
Week 3: July 25‐31 550 340 503 315 72 73 ‐15 6 ‐2 . 1,842
Total
Current Week July 11‐17 11 8 0 ‐1 . . . . . . 18
Week 2: July 18‐24 18 4 0 ‐4 . . . . . . 18
Week 3: July 25‐31 25 2 0 ‐7 . . . . . . 20
Total
Current Week July 11‐17 ‐2 . . . . . . . . . ‐2
Week 2: July 18‐24 ‐2 . . . . . . . . . ‐2
Week 3: July 25‐31 ‐2 . . . . . . . . . ‐2
Carrier Availability Category Responses
Carrier Availability Category Responses
Carrier Availability Category Responses
20ft Dry
40ft Dry
Memphis
Carrier Availability Category Responses
40ft High Cube
40ft Refrigerated
20ft Refrigerated
Carrier Availability Category Responses
Container TypesAverage Total
Weekly Throughput*
20ft 1,083
40ft 448
40ft High Cubes 633
40ft Refrigerated 14
20ft Refrigerated 0
*Data reflect the sum of the individual carriers' average weekly throughput over a 6‐
month timeframe
November 2011‐April 2012
Six‐Month Snapshot of Average Weekly
Throughput
Range of Individual
Carrier Responses
13…675
0…100
7…250
0…11
0…0

Ocean Shipping Container Availability Report — July 11, 2012 16
Minneapolis, MN
Note: “.” denotes no response from carriers.
Total
Current Week July 11‐17 143 54 35 23 14 ‐5 ‐8 ‐9 ‐35 . 212
Week 2: July 18‐24 159 19 ‐11 24 14 3 16 ‐9 ‐35 . 180
Week 3: July 25‐31 170 19 ‐4 25 14 11 42 ‐8 ‐35 . 234
Total
Current Week July 11‐17 251 26 15 13 11 2 ‐10 ‐17 ‐35 . 256
Week 2: July 18‐24 304 30 35 2 6 2 ‐10 ‐4 ‐35 . 330
Week 3: July 25‐31 349 44 47 41 4 2 ‐10 ‐4 ‐35 . 438
Total
Current Week July 11‐17 88 68 25 16 8 7 0 ‐10 ‐51 . 151
Week 2: July 18‐24 53 54 28 18 3 7 0 ‐10 ‐37 . 116
Week 3: July 25‐31 15 81 62 16 9 7 0 ‐10 ‐37 . 143
Total
Current Week July 11‐17 0 0 ‐21 . . . . . . . ‐21
Week 2: July 18‐24 0 0 ‐27 . . . . . . . ‐27
Week 3: July 25‐31 0 0 ‐33 . . . . . . . ‐33
Total
Current Week July 11‐17 ‐3 . . . . . . . . . ‐3
Week 2: July 18‐24 ‐4 . . . . . . . . . ‐4
Week 3: July 25‐31 ‐5 . . . . . . . . . ‐5
20ft Refrigerated
Carrier Availability Category Responses
Carrier Availability Category Responses
20ft Dry
40ft Dry
Carrier Availability Category Responses
40ft High Cube
40ft Refrigerated
Minneapolis
Carrier Availability Category Responses
Carrier Availability Category Responses
Container TypesAverage Total
Weekly Throughput*
20ft 249
40ft 306
40ft High Cubes 415
40ft Refrigerated 4
20ft Refrigerated 0
*Data reflect the sum of the individual carriers' average weekly throughput over a 6‐
month timeframe
November 2011‐April 2012
0…0
Six‐Month Snapshot of Average Weekly
Throughput
Range of Individual
Carrier Responses
2…109
1…119
0…169
0…4

Ocean Shipping Container Availability Report — July 11, 2012 17
New Orleans, LA
Note: “.” denotes no response from carriers.
Total
Current Week July 11‐17 613 93 34 15 13 12 5 0 0 . 785
Week 2: July 18‐24 510 76 47 18 19 16 5 0 ‐1 . 690
Week 3: July 25‐31 402 56 55 17 25 12 5 0 ‐1 . 571
Total
Current Week July 11‐17 251 16 10 10 9 4 0 0 ‐54 . 246
Week 2: July 18‐24 181 17 5 ‐3 ‐4 2 0 0 ‐28 . 170
Week 3: July 25‐31 124 17 2 ‐22 ‐16 2 0 0 11 . 118
Total
Current Week July 11‐17 936 58 39 35 15 13 1 0 ‐1 . 1,096
Week 2: July 18‐24 880 62 40 20 18 39 2 0 ‐1 . 1,060
Week 3: July 25‐31 799 85 42 21 17 24 2 0 ‐1 . 989
Total
Current Week July 11‐17 14 8 0 ‐9 . . . . . . 13
Week 2: July 18‐24 22 8 0 ‐7 . . . . . . 23
Week 3: July 25‐31 20 8 0 ‐7 . . . . . . 21
Total
Current Week July 11‐17 3 2 . . . . . . . . 5
Week 2: July 18‐24 3 ‐3 . . . . . . . . 0
Week 3: July 25‐31 3 ‐8 . . . . . . . . ‐5
20ft Dry
40ft Dry
40ft High Cube
Carrier Availability Category Responses
40ft Refrigerated
20ft Refrigerated
New Orleans
Carrier Availability Category Responses
Carrier Availability Category Responses
Carrier Availability Category Responses
Carrier Availability Category Responses
Container TypesAverage Total
Weekly Throughput*
20ft 294
40ft 199
40ft High Cubes 234
40ft Refrigerated 1
20ft Refrigerated 7
*Data reflect the sum of the individual carriers' average weekly throughput over a 6‐
month timeframe
November 2011‐April 2012
0…7
0…203
0…69
2…127
0…1
Six‐Month Snapshot of Average Weekly
Throughput
Range of Individual
Carrier Responses
Ocean Shipping Container Availability Report — July 11, 2012 18
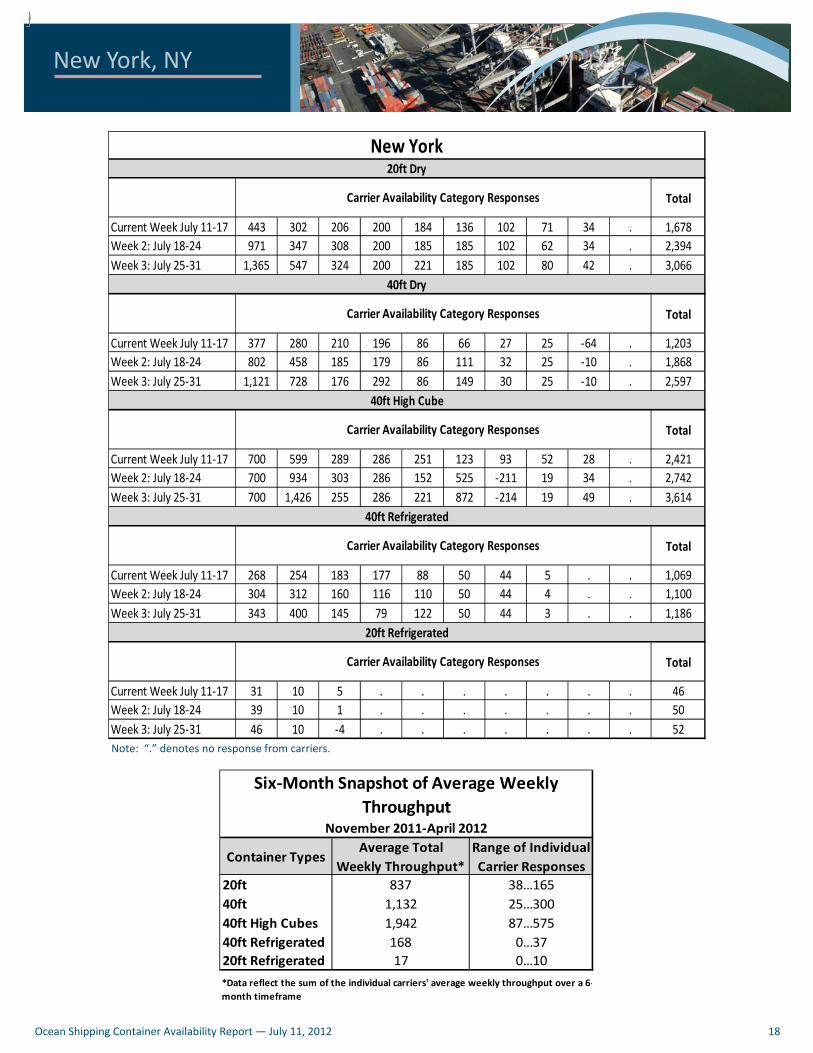
New York, NY
Note: “.” denotes no response from carriers.
Total
Current Week July 11‐17 443 302 206 200 184 136 102 71 34 . 1,678
Week 2: July 18‐24 971 347 308 200 185 185 102 62 34 . 2,394
Week 3: July 25‐31 1,365 547 324 200 221 185 102 80 42 . 3,066
Total
Current Week July 11‐17 377 280 210 196 86 66 27 25 ‐64 . 1,203
Week 2: July 18‐24 802 458 185 179 86 111 32 25 ‐10 . 1,868
Week 3: July 25‐31 1,121 728 176 292 86 149 30 25 ‐10 . 2,597
Total
Current Week July 11‐17 700 599 289 286 251 123 93 52 28 . 2,421
Week 2: July 18‐24 700 934 303 286 152 525 ‐211 19 34 . 2,742
Week 3: July 25‐31 700 1,426 255 286 221 872 ‐214 19 49 . 3,614
Total
Current Week July 11‐17 268 254 183 177 88 50 44 5 . . 1,069
Week 2: July 18‐24 304 312 160 116 110 50 44 4 . . 1,100
Week 3: July 25‐31 343 400 145 79 122 50 44 3 . . 1,186
Total
Current Week July 11‐17 31 10 5 . . . . . . . 46
Week 2: July 18‐24 39 10 1 . . . . . . . 50
Week 3: July 25‐31 46 10 ‐4 . . . . . . . 52
Carrier Availability Category Responses
20ft Dry
40ft Dry
40ft High Cube
40ft Refrigerated
20ft Refrigerated
Carrier Availability Category Responses
Carrier Availability Category Responses
Carrier Availability Category Responses
Carrier Availability Category Responses
New York
Container TypesAverage Total
Weekly Throughput*
20ft 837
40ft 1,132
40ft High Cubes 1,942
40ft Refrigerated 168
20ft Refrigerated 17
*Data reflect the sum of the individual carriers' average weekly throughput over a 6‐
month timeframe
November 2011‐April 2012
0…10
38…165
25…300
87…575
0…37
Six‐Month Snapshot of Average Weekly
Throughput
Range of Individual
Carrier Responses

Ocean Shipping Container Availability Report — July 11, 2012 19
Norfolk, VA
Note: “.” denotes no response from carriers.
Total
Current Week July 11‐17 290 214 66 59 50 32 16 10 5 . 742
Week 2: July 18‐24 458 155 76 74 50 48 34 10 5 . 910
Week 3: July 25‐31 521 ‐7 76 80 50 70 ‐31 10 5 . 774
Total
Current Week July 11‐17 183 110 109 100 53 21 11 5 ‐45 . 547
Week 2: July 18‐24 299 83 127 100 57 23 11 5 ‐64 . 641
Week 3: July 25‐31 279 99 117 100 50 ‐5 11 5 ‐64 . 592
Total
Current Week July 11‐17 261 212 175 110 71 45 10 ‐31 ‐128 . 725
Week 2: July 18‐24 223 299 175 96 71 41 10 ‐20 ‐89 . 806
Week 3: July 25‐31 295 343 175 32 71 21 10 ‐36 ‐89 . 822
Total
Current Week July 11‐17 95 88 67 12 10 3 0 ‐1 . . 274
Week 2: July 18‐24 66 75 9 ‐5 10 1 0 ‐1 . . 155
Week 3: July 25‐31 44 70 ‐54 ‐7 10 2 0 ‐1 . . 64
Total
Current Week July 11‐17 26 5 2 . . . . . . . 33
Week 2: July 18‐24 27 5 2 . . . . . . . 34
Week 3: July 25‐31 28 6 2 . . . . . . . 36
Carrier Availability Category Responses
Carrier Availability Category Responses
20ft Dry
40ft Dry
40ft High Cube
40ft Refrigerated
Carrier Availability Category Responses
Carrier Availability Category Responses
Norfolk
Carrier Availability Category Responses
20ft Refrigerated
Container TypesAverage Total
Weekly Throughput*
20ft 821
40ft 934
40ft High Cubes 1,134
40ft Refrigerated 181
20ft Refrigerated 5
*Data reflect the sum of the individual carriers' average weekly throughput over a 6‐
month timeframe
November 2011‐April 2012
0…5
6…300
28…225
10…375
0…76
Six‐Month Snapshot of Average Weekly
Throughput
Range of Individual
Carrier Responses

Ocean Shipping Container Availability Report — July 11, 2012 20
Oakland, CA
Note: “.” denotes no response from carriers.
Total
Current Week July 11‐17 330 254 201 192 54 21 18 12 ‐30 . 1,052
Week 2: July 18‐24 330 186 286 173 55 21 19 27 ‐43 . 1,054
Week 3: July 25‐31 330 192 219 288 55 21 18 ‐34 ‐68 . 1,021
Total
Current Week July 11‐17 403 200 118 27 25 20 ‐4 ‐33 ‐77 . 679
Week 2: July 18‐24 264 200 66 41 25 15 ‐36 ‐64 ‐19 . 492
Week 3: July 25‐31 175 200 46 41 25 16 ‐56 ‐89 ‐95 . 263
Total
Current Week July 11‐17 418 216 211 152 54 27 20 18 ‐49 . 1,067
Week 2: July 18‐24 ‐150 244 311 132 54 10 20 14 ‐2 . 633
Week 3: July 25‐31 ‐587 233 304 167 54 10 20 14 ‐71 . 144
Total
Current Week July 11‐17 603 255 150 57 30 ‐31 ‐52 ‐88 ‐142 . 782
Week 2: July 18‐24 539 230 78 60 30 ‐45 ‐52 ‐86 ‐152 . 602
Week 3: July 25‐31 536 215 59 60 30 ‐59 ‐52 ‐109 ‐184 . 496
Total
Current Week July 11‐17 16 5 0 ‐4 . . . . . . 17
Week 2: July 18‐24 26 5 0 ‐11 . . . . . . 20
Week 3: July 25‐31 36 5 0 ‐17 103 . . . . . 127
Carrier Availability Category Responses
Carrier Availability Category Responses
40ft Refrigerated
20ft Refrigerated
40ft Dry
40ft High Cube
Oakland
Carrier Availability Category Responses
Carrier Availability Category Responses
Carrier Availability Category Responses
20ft Dry
Container TypesAverage Total
Weekly Throughput*
20ft 940
40ft 1,239
40ft High Cubes 1,664
40ft Refrigerated 420
20ft Refrigerated 30
*Data reflect the sum of the individual carriers' average weekly throughput over a 6‐
month timeframe
November 2011‐April 2012
0…250
0…300
10…400
0…193
Six‐Month Snapshot of Average Weekly
Throughput
Range of Individual
Carrier Responses
0…15

Ocean Shipping Container Availability Report — July 11, 2012 21
Savannah, GA
Note: “.” denotes no response from carriers.
Total
Current Week July 11‐17 394 184 128 50 49 35 22 21 ‐37 . 846
Week 2: July 18‐24 433 299 147 50 55 31 22 19 ‐31 . 1,025
Week 3: July 25‐31 546 408 188 50 ‐5 31 22 20 11 . 1,271
Total
Current Week July 11‐17 277 120 89 12 ‐3 ‐8 ‐79 ‐92 ‐358 . ‐42
Week 2: July 18‐24 145 120 76 12 ‐110 ‐8 ‐18 ‐50 ‐505 . ‐338
Week 3: July 25‐31 170 120 86 16 ‐232 ‐8 ‐77 ‐50 ‐642 . ‐617
Total
Current Week July 11‐17 225 200 165 80 21 15 ‐39 ‐45 ‐508 . 114
Week 2: July 18‐24 225 185 179 34 21 20 ‐73 ‐86 ‐724 . ‐219
Week 3: July 25‐31 225 152 166 ‐66 21 19 ‐73 ‐73 ‐936 . ‐565
Total
Current Week July 11‐17 153 138 75 57 2 ‐5 ‐10 ‐67 . . 343
Week 2: July 18‐24 177 120 72 61 2 ‐5 ‐8 ‐35 . . 384
Week 3: July 25‐31 211 115 59 65 2 ‐5 ‐10 ‐53 . . 384
Total
Current Week July 11‐17 10 4 1 . . . . . . . 15
Week 2: July 18‐24 12 4 1 . . . . . . . 17
Week 3: July 25‐31 14 3 1 . . . . . . . 18
40ft High Cube
40ft Refrigerated
20ft Refrigerated
Carrier Availability Category Responses
Carrier Availability Category Responses
20ft Dry
40ft Dry
Savannah
Carrier Availability Category Responses
Carrier Availability Category Responses
Carrier Availability Category Responses
Container TypesAverage Total
Weekly Throughput*
20ft 640
40ft 1,263
40ft High Cubes 1,890
40ft Refrigerated 207
20ft Refrigerated 4
*Data reflect the sum of the individual carriers' average weekly throughput over a 6‐
month timeframe
November 2011‐April 2012
0…2
23…175
0…343
50…550
0…80
Six‐Month Snapshot of Average Weekly
Throughput
Range of Individual
Carrier Responses

Ocean Shipping Container Availability Report — July 11, 2012 22
Sea le, WA
Note: “.” denotes no response from carriers.
Total
Current Week July 11‐17 127 50 30 27 11 10 ‐7 ‐130 . . 118
Week 2: July 18‐24 187 82 42 27 1 10 3 ‐130 . . 222
Week 3: July 25‐31 480 84 42 27 ‐24 10 0 ‐130 . . 489
Total
Current Week July 11‐17 98 91 64 11 9 1 ‐6 ‐100 . . 168
Week 2: July 18‐24 97 79 28 11 9 1 ‐36 ‐100 . . 89
Week 3: July 25‐31 144 42 ‐3 11 9 ‐1 ‐71 ‐100 . . 31
Total
Current Week July 11‐17 366 154 51 21 15 10 ‐6 ‐72 . . 539
Week 2: July 18‐24 338 185 30 21 15 10 5 ‐161 . . 443
Week 3: July 25‐31 359 156 20 21 15 10 ‐2 ‐274 . . 305
Total
Current Week July 11‐17 250 162 150 88 15 4 ‐20 . . . 649
Week 2: July 18‐24 225 118 58 64 10 4 ‐20 . . . 459
Week 3: July 25‐31 225 81 84 62 12 4 ‐20 . . . 448
Total
Current Week July 11‐17 16 2 ‐2 . . . . . . . 16
Week 2: July 18‐24 17 2 ‐7 . . . . . . . 12
Week 3: July 25‐31 18 2 ‐10 . . . . . . . 10
Seattle20ft Dry
40ft Dry
40ft High Cube
40ft Refrigerated
20ft Refrigerated
Carrier Availability Category Responses
Carrier Availability Category Responses
Carrier Availability Category Responses
Carrier Availability Category Responses
Carrier Availability Category Responses
Container TypesAverage Total
Weekly Throughput*
20ft 405
40ft 446
40ft High Cubes 917
40ft Refrigerated 663
20ft Refrigerated 10
November 2011‐April 2012
0…5
*Data reflect the sum of the individual carriers' average weekly throughput over a 6‐
month timeframe
9…175
0…191
43…276
0…227
Six‐Month Snapshot of Average Weekly
Throughput
Range of Individual
Carrier Responses

Ocean Shipping Container Availability Report — July 11, 2012 23
Tacoma, WA
Note: “.” denotes no response from carriers.
Total
Current Week July 11‐17 228 50 43 10 7 2 ‐50 . . . 290
Week 2: July 18‐24 204 50 34 10 7 5 ‐30 . . . 280
Week 3: July 25‐31 210 50 34 10 7 19 ‐20 . . . 310
Total
Current Week July 11‐17 553 11 1 0 ‐20 ‐40 ‐45 . . . 460
Week 2: July 18‐24 613 11 ‐18 ‐1 ‐20 ‐40 ‐183 . . . 362
Week 3: July 25‐31 540 11 ‐18 ‐1 ‐20 ‐40 ‐55 . . . 417
Total
Current Week July 11‐17 80 10 4 ‐44 ‐75 ‐116 ‐223 . . . ‐364
Week 2: July 18‐24 ‐195 10 7 ‐44 ‐75 ‐201 ‐269 . . . ‐767
Week 3: July 25‐31 ‐326 10 18 ‐44 ‐75 ‐129 ‐269 . . . ‐815
Total
Current Week July 11‐17 361 30 1 0 ‐71 ‐86 ‐97 . . . 138
Week 2: July 18‐24 317 30 2 0 ‐71 ‐60 ‐152 . . . 66
Week 3: July 25‐31 331 30 1 0 ‐71 ‐91 ‐159 . . . 41
Total
Current Week July 11‐17 0 . . . . . . . . . 0
Week 2: July 18‐24 0 . . . . . . . . . 0
Week 3: July 25‐31 0 . . . . . . . . . 0
Tacoma
40ft Refrigerated
20ft Refrigerated
20ft Dry
40ft Dry
40ft High Cube
Carrier Availability Category Responses
Carrier Availability Category Responses
Carrier Availability Category Responses
Carrier Availability Category Responses
Carrier Availability Category Responses
Container TypesAverage Total
Weekly Throughput*
20ft 337
40ft 600
40ft High Cubes 687
40ft Refrigerated 273
20ft Refrigerated 0 0…0
1…300
0…500
5…600
0…200
Range of Individual
Carrier Responses
November 2011‐April 2012
*Data reflect the sum of the individual carriers' average weekly throughput over a 6‐
month timeframe
Six‐Month Snapshot of Average Weekly
Throughput
Ocean Shipping Container Availability Report — July 11, 2012 24
The U.S. Department of Agriculture (USDA) prohibits discrimina on in all of its programs and ac vi es on the basis of race, color,
na onal origin, age, disability, and where applicable, sex (including gender iden ty and expression), marital status, familial sta‐
tus, parental status, religion, sexual orienta on, poli cal beliefs, gene c informa on, reprisal, or because all or part of an individ‐
ual's income is derived from any public assistance program. (Not all prohibited bases apply to all programs.) Persons with disabil‐
i es who require alterna ve means for communica on of program informa on (Braille, large print, audiotape, etc.) should con‐
tact USDA's TARGET Center at (202) 720‐2600 (voice and TDD).