ocean optics sers user manualoceanoptics.com/wp-content/uploads/sersusermanual.pdfocean optics sers...
TRANSCRIPT

OCEAN OPTICS SERSUser Manual
For Products: RAM-SERS-AU; -AG; -SP
Document: RAM-SERS-01-201607

AMERICAS & WORLD HEADQUARTERSPhone: (+1) 727-733-2447Fax: (+1) 727-733-3962
Sales: [email protected] Orders:[email protected] Support:[email protected]
EUROPE, MIDDLE EAST & AFRICA
Phone: (+31) 26-319-0500Fax: (+31) 26-319-0505Email: [email protected]
Germany : (+49) 711-341696-0UK : (+44) 1865-811118France : (+33) 442-386-588
Ocean Optics, Inc.830 Douglas Ave.Dunedin, FL 34698USA
Manufacturing & Logistics4301 Metric Dr.Winter Park, FL 32792USA
Sales & SupportGeograaf 246921 EW DuivenThe Netherlands
Manufacturing & LogisticsMaybachstrasse 1173760 OstfildernGermany
ASIAPhone: +86 21-6295-6600Fax: +86 21-6295-6708Email: [email protected]
Japan & Korea: (+82) 10-8514-3797
Ocean Optics Asia666 Gubei RoadKirin Tower Suite 601BChangning DistrictShanghaiPRC, 200336

RAM-SERS-01-201607
Copyright © 2014 Ocean Optics, Inc.All rights reserved. No part of this publication may be reproduced, stored in a retrieval system, or transmitted, by any means, electronic,mechanical, photocopying, recording, or otherwise, without written permission from Ocean Optics, Inc.This manual is part of an order and subject to the condition that it shall not, by way of trade or otherwise, be lent, re-sold, hired out orotherwise circulated without the prior consent of Ocean Optics, Inc. in any form of binding or cover other than that in which it is published.TrademarksAll products and services herein are the trademarks, service marks, registered trademarks or registered service marks of their respective owners.Limit of LiabilityEvery effort has been made to make this manual as complete and as accurate as possible, but no warranty or fitness is implied. Theinformation provided is on an “as is” basis. Ocean Optics, Inc. shall have neither liability nor responsibility to any person or entity with respectto any loss or
damages arising from the information contained in this manual.
Table of ContentsAbout This Manual ............................................................................................................ ii
Document Purpose and Intended Audience .......................................................... iiDocument Summary.............................................................................................. iiProduct-Related Documentation............................................................................ ii
Chapter 1: Introduction.........................................................................................1
What Is SERS? ..................................................................................................... 1Typical Applications of SERS ................................................................................ 1What Is Raman Spectroscopy? ............................................................................. 2Ocean Optics’ SERS Key Features ....................................................................... 2Key Specifications ................................................................................................. 3Diagram................................................................................................................. 4Package Contents ................................................................................................. 4
Chapter 2: Using SERS.........................................................................................5
Usage Notes.......................................................................................................... 5Standard Measurement Protocol ........................................................................... 5
Best Practices............................................................................................ 6Storage.................................................................................................................. 6Frequently Asked Questions.................................................................................. 7
Appendix A: Specifications..................................................................................9
Overview ............................................................................................................... 9Performance Specifications ................................................................................... 10
Description of Tests Performed.................................................................. 10Substrate Repeatability .............................................................................. 10
RAM-SERS-AU .............................................................................. 10RAM-SERS-SP .............................................................................. 11
Laser Power Dependence.......................................................................... 13Concentration Dependence ....................................................................... 14Examples of Analytes ................................................................................ 15

RAM-SERS-01-201607
RAM-SERS-AU .............................................................................. 15RAM-SERS-SP .............................................................................. 16
Reusability ................................................................................................. 17Limits of Detection across Optical Benches for RAM-SERS-AU ............................ 18
QE Pro....................................................................................................... 18Maya Series............................................................................................... 19USB4000 ................................................................................................... 19IDRaman mini ............................................................................................ 20IDRaman reader ........................................................................................ 20
Lifetime of RAM-SERS-AG.................................................................................... 21
Index.......................................................................................................................22

RAM-SERS-01-201607
About This ManualDocument Purpose and Intended AudienceThis document provides instructions for using Ocean Optics’ Surface Enhanced RamanScattering (SERS) Substrates.
Document Summary
Chapter Description
Chapter 1: Introduction Contains descriptive information about SERS andRaman spectroscopy.
Chapter 2: Using SERS Provides use instructions.
Appendix A: Specifications Contains technical specifications for the SERS products.
Product-Related DocumentationYou can access documentation for Ocean Optics products by visiting our website athttp://www.oceanoptics.com. Select Support → Technical Documents, then choose theappropriate document from the available drop-down lists.
WarrantyOcean Optics SERS is protected by a limited warranty against faulty manufacturing of goods.This warranty will not cover misuse or misadventure. Users are reminded that SERS is atechnique that while suitable for many samples will not work for all. Ocean Optics takes noresponsibility for unsuccessful use or application of the SERS product. This also applies to anycustomized or OEM applications of Ocean Optics’ SERS substrates.
A 3-Year Warranty covers Ocean Optics miniature fiber optic spectrometers, light sources andsampling accessories – regardless of the application – from manufacturing defects. It alsocovers fibers and probes for a full 12 months. All OEM hardware is covered by a 12 monthwarranty. For more information about Ocean Optics Warranties, please see:http://www.oceanoptics.com/warranty.asp.

RAM-SERS-01-201607
Chapter 1
IntroductionWhat Is SERS?In Surface Enhanced Raman Spectroscopy (SERS), analytes (your sample) are absorbed ontoa noble metal (in this case either Au or Ag nanoparticles) surface prior to analysis in order topotentially enhance the Raman signal. By introducing the sample into a 3-Dimensional matrix,within which gold or silver nanoparticles have been deposited, and exciting with an excitationlaser, the interaction between the SERS substrate and the sample, plus the excitation energy ofthe laser creates a plasmon resonant effect that can potentially amplify the Raman effect bymany orders of magnitude. SERS enables ppb and even ppt-level detection of chemical andbiological materials quickly and easily in the field. It also has many applications forpharmaceuticals, explosives, and tags for anti-counterfeiting.
SERS substrates have traditionally been fabricated using expensive lithography techniques andare not reusable, making cost a deterrent to use in mainstream applications. Ocean Optics’substrates offer equivalent or better performance than the competitor SERS products at afraction of the price by using industrial deposition techniques to precisely deposit specialnanoparticle ink onto a flexible substrate. One of the advantages of our SERS technology is thatit is compatible with the Ocean Optics’ full range of Raman spectrometers, meaning thatportable measurement is possible with our IDRaman mini and IDRaman reader. Though peakintensity varies from substrate to substrate, peak ratio repeatability is very good, typically 5% orless. This provides for the substrates to be used both quantitatively and for simple identificationpurposes.
SERS sounds like the dream technique, so what’s the catch? Not all samples are SERS activeand users should be aware that SERS will not work out of the box for every sample. Because ofour special method for manufacturing we can work with you to develop customized recipes forspecific analytes, please contact us for more information. SERS can also shift the peaks relativeto standard Raman spectra, i.e., a sample measured at high concentration without SERS mayhave different peak shifts when looked at with SERS. However, any change is consistent andso, therefore, is easily characterized. It does mean, however, that users requiring librarymatching should develop the library with SERS rather than adopting existing libraries for SERSapplications.
Typical Applications of SERS Detection of Explosives: Explosives are clearly a big security threat. Being able to identify
trace levels allows us to better screen for threats at security checkpoints or on thebattlefield.
Detection of Narcotics: Fast identification of Drugs in the field is a real boon for thosecombating drug related crime. Often only small residues of a sample can be collected from acrime scene. SERS also opens up a potential route for fast roadside drug screening usingsaliva samples.

RAM-SERS-01-201607
Food Safety: Certain additives such as Melamine found in milk powder or green malachitecan be extremely harmful even at very low concentrations. Using SERS, we can qualify andquantify the level of dangerous trace elements in our food supply chain.
Anti-counterfeit tags: High value products that are subject to duties & taxes are often thetarget of piracy and fraud. Petrol is one example. By adding a small amount of a SERSactive taggant we can use this as an indicator of authenticity.
Biological Research: Can be used to identify and characterize biological samples includingidentifying proteins, DNA and bacteria.
What Is Raman Spectroscopy?Gold nanoparticles were mentioned above, and Raman spectroscopy really is like panning forgold! A wealth of information is there, if you can just sift through the rock, dirt, and sandobscuring it. The art to finding the gold in Raman spectra is the instrumentation, which mustcollect as many photons as possible while rejecting scattered laser light efficiently.
Raman spectra are generated when an incident photon from an excitation source interacts witha sample and rather than being simply (Raleigh) scattered it communes with the vibrationalenergy of the sample molecule and is reflected as Raman (stokes-shifted) light. By filtering outthe background and detecting just the shifted light we obtain a fingerprint spectrum, packed withinformation about the atoms and structure of the molecule.
A good way to visualize the Raman effect is to imagine a ball bearing being dropped onto adrum. The drum starts to vibrate at its own frequency, and the ball bearing bounces off withslightly less energy (analogous to Stokes radiation). If the drum is already vibrating and the ballbearing hits at just the right time, the drum acts like a catapult to give energy to the ball bearingand it bounces off with even more energy (analogous to anti-Stokes radiation). The energydifference before and after the ball bearing strikes the drum provides information about thevibrational mode of the drum. [Fundamentals of Molecular Spectroscopy, Banwell and McCash,John Wiley & Sons, Inc., New York, 1988]
Ocean Optics’ SERS Key Features High sensitivity. Substrates deliver great results and have demonstrated superior
sensitivity for a range of analytes when tested against competitor substrates, all for anunbeatable price.
Great stability. Highly stable substrates require no special handling and can be stored atroom temperature.
Reliable reproducibility. Highly reproducible and easily scaled manufacturing methodsenable sensitive measurements at an affordable price. Our testing has shown reliable peakratio reproducibility within 5%.
Customization. Unique production techniques can be tailored to impart specificity toparticular analytes (on demand) and custom form factors such as swabs and coatings.
Easy to use. For great flexibility, substrates work reliably with the complete range of OceanOptics Raman instruments. Simply drop your analyte onto the slide and use with a 532, 638or 785 nm Raman setup.

RAM-SERS-01-201607
Key Specifications
Table 1: SERS Substrate Product DetailsSpecification RAM-SERS-AU RAM-SERS-AG RAM-SERS-SP
SERS Slide Dimensions 25.4 x 76.2 x 1 mm 25.4 x 76.2 x 1 mm 25.4 x 76.2 x 1 mm
SERS Active Area 5.5 mm diametercircle
5.5 mm diametercircle 4 x 4 mm square
SERS Active Chemistry Gold (Au)Nanoparticles
Silver (Ag)Nanoparticles Gold/Silver Film
Slide Material Borosilicate Glass Borosilicate Glass Borosilicate GlassRaman ExcitationWavelength 785 nm 532 nm 638 nm
Storage Lifetime 1.5 months 1 month 6 months
Reusable No No Yes
Laser power ≤20 mW ≤20 mW ≤100 mW
Volume of analyte 15 µL 15 µL 10 µL
Table 2: Limit of Detection (LOD) for Some Commonly Used Analytes
Material Why Do I Want to Detect Trace Levels? LOD with QE-Pro*RAM-SERS-AU RAM-SERS-SP
BPE BPE can be used as a taggant in fuel aswell as in biological samples. 0.1 fg 30 fg
TNTThe threat of terrorism means the needfor quick screening for trace levels ofexplosions is greater than ever.
5 ng 30 pg
Melamine Poisonous to humans, especially babiesand children at very low levels (<1 ppm). 5 pg 0.1 pg
*Please note that the LOD will depend on the sample and spectrometer used and that these are provided asguidelines only.

RAM-SERS-01-201607
Diagram
RAM-SERS-AURAM-SERS-AG
RAM-SERS-SP
Package ContentsEach pack of RAM-SERS-AU-5, RAM-SERS-AG-5, and RAM-SERS-SP-5 comes with 5individual substrates. Simply remove from the packaging and you’re ready to get going.

RAM-SERS-01-201607
Chapter 2
Using SERSUsage NotesThe following instructions are for RAM-SERS-AU (paper-based), RAM-SERS-AG (paper-based) and RAM-SERS-SP (glass-based) products. Instructions that are unique to each
substrate will be indicated as needed.
Use gloves during handling and ensure you are working in a clean environment. Nevertouch the active SERS area. As these are highly sensitive, any contamination has thepotential to show up on your analytical spectra.
Do not touch or apply pressure to the active SERS area as this may damage thenanoparticles or gold-silver film surface.
For best results, use 15 µL of your analyte dissolved in the appropriate solvent for RAM-SERS-AU/RAM-SERS-AG and 10 µL for RAM-SERS-SP.
Using a known reference solution is a good way to optimize your measurement andsoftware settings. The RAM-SERS-AU/RAM-SERS-AG slides are one-time use, and shouldbe discarded after the spectrum has been acquired. Reuse is not possible as once thesample has been absorbed onto the active area it is not possible to cleanse/remove it.However, RAM-SERS-SP slides can be reused one or two times after adequate rinsing. SeeReusability for more details.
____________________________________________________________________________Solvent-Compatible Substrate and Adhesive
Some competitor products use plastics as the base material, which greatly limits the types ofcarrier solvents that can be used with those SERS products. Our use of optical-grade
borosilicate glass allows for even the harshest of solvents to be used on the SERS chemistry.The adhesive that holds the chemistry to the plate is a high-performance silicone-based
adhesive compatible with a wide range of solvents.____________________________________________________________________________
Standard Measurement ProtocolUse clean gloves at all times when handling the SERS substrates. Remember SERS amplifiesthe Raman signal from trace levels and even small amounts of interfering samples may affectyour measurement.
The measurement parameters can greatly affect the overall performance of the SERS substrateand these should be optimized carefully. Once optimized, this setup can be used for subsequentmeasurements with the same spectrometer type, laser and integration time enabling consistentand comparative data to be collected (see Best Practices).
► Procedure1. Open the foil shipping bag. The substrates are contained within the plastic slide holder
for their protection.

RAM-SERS-01-201607
2. Do not to touch the SERS active region on the slide. Also do not to allow the active areato come into contact with any other surface. This will help to avoid contamination.
3. It is important to keep the SERS substrates clean. Care should be taken in high humidityatmospheres as this may increase the chances of a non-analyte molecule beingabsorbed onto the substrate. Note also that the substrates should not be exposed tovapors or other potential contaminants that can adsorb onto the surface.
4. Introduce the analyte of interest directly onto the active area. We recommend dropcasting or pipetting microliter amounts of testing analyte directly onto the SERS activearea. If pipetting, your sample should be prepared using an appropriate solvent.
5. After the analyte has been deposited onto the SERS surface, the measurement can beobtained immediately. You may observe some time-dependent effects as the solventevaporates. The rate of evaporation can be accelerated by the application of the laserenergy. Allow the response to stabilize before recording the measurement results.
Slides should be disposed in standard glass waste containers. Please note that disposalprotocol will be analyte dependent. Be sure to use an appropriate disposal method.
Best PracticesTo ensure the best signal enhancement from the SERS substrate, we recommend that youobserve the following parameters:
Focal distance -- Ensure that the laser is focused on the sample and that the correct focaldistance for the Raman system/probe is used. An X-Y stage can be used to adjust the focaldistance to ensure that maximum response from the substrate is achieved. Once you havedetermined an appropriate distance you can fix the stage in position to maintain that focusfor repeated measurements.
Laser power -- The Raman response will also depend on the laser power. Too little andthere will be no discernable signal, too much and you may damage the sample. The correctpower depends on the substrate and spot size of the laser. For best results with RAM-SERS-AU/RAM-SERS-AG, use ≤ 102 W/cm2, which is equivalent to, for example, 20 mWfor a 785 nm laser with a spot size of 158 µm. Lower laser power densities are required forthe paper-based substrates because they will burn at higher powers densities. On the otherhand, the RAM-SERS-SP substrates can withstand higher power densities without damagebecause they are made of out of glass. For these, we recommend 5 x10³ W/cm2, which isequivalent to 25 mW of 638 nm laser radiation over a 25 µm laser spot.
Integration time -- As with the laser power, the integration time will depend on themeasurement sample and conditions, the requirements of the application and thespectrometer used. Increasing integration time allows the collection of more Ramanphotons, thus increasing the signal. However, it can also increase background orfluorescence effects.
StorageEach bag contains a box of 5 SERS substrates and a desiccant pouch to minimize humidity.While Ocean Optics SERS can be stored in normal conditions, we recommend the following tomaximize shelf life and performance:
Open the bag only when you are ready to use the first substrate. Ideal storage temperature is room temperature (15-25°C). If not using all 5 substrates
within 24 hours, keep the remaining substrates in a dry environment such as adesiccator. A moisture-resistant Ziploc bag with the included desiccant pouch is alsosuitable.

RAM-SERS-01-201607
Use these in a clean environment and wear gloves during handling, ensuring never totouch the active SERS circle. As the SERS slides are highly sensitive, anycontamination has the potential to show up in your results.
Use all substrates before the published use by date. The products may continue to showresults after this time but the sensitivity will be diminished.
Frequently Asked QuestionsWhat kind of Raman equipment do I need to use with SERS substrates?
Ocean Optics SERS substrates are designed to work with all Ocean Optics Raman equipment.This includes a range of modular solutions where a spectrometer can be combined with amodular laser and a probe. It also includes a range of integrated solutions for handheld,benchtop and microscope applications.
How do I get my sample onto the active area of the SERS substrate?
If not already in solution, we recommend preparing your sample in solution with an appropriatesolvent. SERS will work with dry powders or other trace amounts of solid samples but solutionwill generate the most reliable results as it allows the analyte to be absorbed uniformlythroughout the SERS active area. Once in solution, we recommend adding 15 µL to the RAM-SERS-AU/RAM-SERS-AG substrates and 10 µL to the RAM-SERS-SP for best results.
How do I know if my sample will be SERS active?
You don’t! It’s difficult to know ahead of time whether your sample will work with standardSERS. It all depends on the relationship between the gold nanoparticles and your analyte. Byadjusting the size and density of the nanoparticles it is possible to tune SERS to workbetter/worse for particular analytes. It is also possible to dope the substrate with linkingmolecules that help bind the analyte to the nanoparticles. It is important to recall, however, thatSERS will not make a non-active Raman sample active. This means no metals, salts ormolecules which do not meet the rules of symmetry that make a molecule Raman active.
Which excitation laser wavelength should I use for gold SERS (RAM-SERS-AU)?
While there is no fixed rule, in general the gold-based SERS have shown best results using785nm lasers.
Many applications of SERS mention silver, do you have silver SERS and which laserwavelength should I use?
Yes, we offer a silver nanoparticle version of the paper substrate. However, these substratestend to oxidize when exposed to the environment much faster than the gold substrates. Hence,the SERS performance of the silver substrates begins to degrade 2-3 weeks after receivingthem. While gold is generally used with 785 nm excitation lasers, silver generally works bestwith 532 nm. However, like with the gold, there is no firm rule here.
What does “…particles will oxidize and this causes a reduction in the performance of thesubstrate as it ages,” mean? Do they just lose effectiveness (sensitivity)? How can I tellwhen this has happened?
RAM-SERS-01-201607
All pure metals will oxidize eventually – but some are worse than others while others such asgold are quite slow. The oxide layer is very stable (molecules like settling in that state). Thistough oxide layer on top of your nanoparticles destroys the resonance SERS effect because theanalyte cannot interact with the pure metal nanostructures. You can’t tell by looking at it which iswhy we have a use by date on the slide.
Is there any way to slow the aging process caused by oxidation?
We continue to investigate ways to improve lifetime without dramatically increasing cost.Minimizing the conditions that increase the rate of oxidation can help prolong the lifetime of yoursubstrates. This includes minimizing humidity (which also ups the chance of contamination) andkeeping at a stable temperature.
I’ve opened the bag and done some measurements but still have some substrates left.How should I store these?
After you’ve opened the bag you can protect remaining substrates by storing them withdesiccant in a resealable bag. We also recommend keeping them in a sealed container to avoidrisk of contamination.
Can I reuse my Substrates?
For the gold and silver paper substrates: no they cannot be reused, once you have made yourmeasurement it is close to impossible to remove the analyte from the substrate. Luckily, unlikemany other SERS products, you won’t damage your bank account buying more. However, forthe RAM-SERS-SP glass-based substrates, they can be washed once and reused before thesignal begins to diminish.
RAM-SERS-01-201607
Appendix A
SpecificationsOverviewThis appendix contains specification information for the SERS product, including the following:
Performance Specifications Substrate Repeatability Laser Power Dependence Concentration Dependence Examples of Analytes Reusability
Limits of Detection Across Optical Benches (QE Pro, Maya Series and USB4000spectrometer benches, as well as the IDRaman mini and the IDRaman reader)
Also see Key Specifications.

RAM-SERS-01-201607
Performance SpecificationsDescription of Tests PerformedSpecification tests were carried out using our gold nanoparticle paper-based SERS substrates(RAM-SERS-AU) and glass-based gold/silver alloy nanosponge SERS substrates (RAM-SERS-SP) across a range of production batches. The QE Pro bench and 785nm laser were used forthe performance characterization of RAM-SERS-AU, whereas the IDRaman reader with 638 nmexcitation was used for RAM-SERS-SP. The integration times and laser powers used areindicated in the text and figures as needed. Please note that different analyte scenarios mayhave more optimal settings. All raw data can be made available upon request.
Substrate RepeatabilityIn order to demonstrate the reproducibility of SERS measurements for each substrate, spectrawere collected on five different spots within one substrate and then one spot on six differentsubstrates. The fuel marker 1,2-bis(4-pyridyl)ethylene (BPE) was used for RAM-SERS-AU, andthe antifungal dye crystal violet (CV) was used for RAM-SERS-SP.
While the presence of peaks is critical in determining whether a species is or isn’t present, therelative ratios of those peaks are also important for verification, and can even be used as ameans of determining approximate concentration in some cases. The ratio between the peaksat 1605 and 1632 cm-1 were used for BPE and the ratio between the peaks at 915 and 1376 cm-
1 were used for crystal violet. The percent relative standard deviation (standarddeviation/average x 100) was calculated for the peak intensity ratio and raw peak intensity forthe different substrates.
RAM-SERS-AU
-2000
2000
6000
10000
14000
18000
22000
600 800 1000 1200 1400 1600 1800
Inte
nsity
(cou
nts)
Raman shift (cm-1)
Repeatability of one RAM-SERS-AU substrate785 nm, 3 s, 15 mW, 0.1 ppm BPE
spot 1
spot 2
spot 3
spot 4
spot 5

RAM-SERS-01-201607
RAM-SERS-SP
-2000
2000
6000
10000
14000
18000
22000
600 800 1000 1200 1400 1600 1800
Inte
nsity
(cou
nts)
Raman shift (cm-1)
Repeatability between RAM-SERS-AU substrates785 nm, 3s, 15 mW, 0.1 ppm BPE
S1
S2
S3
S4
S5
S6
-1000
0
1000
2000
3000
4000
5000
6000
7000
8000
375 575 775 975 1175 1375 1575
Inte
nsity
(cou
nts)
Raman shift (cm-1)
Repeatability of one RAM-SERS-SP substrate638 nm, 1s, 21.2 mW, 1 ppm Crystal Violet
Spot 1
Spot 2
Spot 3
Spot 4
Spot 5

RAM-SERS-01-201607
Table 3: Percent Relative Standard Deviaton (% RSD) Values for SERS Substrates
Substrate Peak Intensity Ratio Repeatability Raw Peak IntensityRepeatability
One RAM-SERS-AU BPE (1605 cm-1/1632 cm-1): 2.5% RSD BPE (1605 cm-1): 13% RSD
6 RAM-SERS-AU BPE (1605 cm-1/1632 cm-1): 1% RSD BPE (1605 cm-1): 7% RSD
One RAM-SERS-SP CV (915 cm-1/1376 cm-1): 4% RSD CV (1175 cm-1): 13% RSD
6 RAM-SERS-SP CV (915 cm-1/1376 cm-1): 7% RSD CV (1175 cm-1): 8% RSD
-1000
0
1000
2000
3000
4000
5000
6000
7000
375 575 775 975 1175 1375 1575
Inte
nsity
(cou
nts)
Raman shift (cm-1)
Repeatability between RAM-SERS-SP substrates638 nm, 1s, 21.2 mW, 1 ppm Crystal Violet
S1
S2
S3
S4
S5
S3
S4
S5
S6
S10

RAM-SERS-01-201607
Laser Power Dependence
The intensity of the Raman signal should scale linearly with laser power. Hence, a laser powerstudy was conducted on both substrates using BPE for RAM-SERS-AU and crystal violet forRAM-SERS-SP.
RAM-SERS-AU
RAM-SERS-SP

RAM-SERS-01-201607

RAM-SERS-01-201607
Concentration DependenceThe Raman peak intensity should also be concentration dependent. Various concentrations ofBPE ranging from 10-9 M to 10-4 M (0.0002 to 18 ppm) were used for the RAM-SERS-AUsubstrate. Crystal violet having concentrations of 0.01 to 10 ppm were used for RAM-SERS-SP.
RAM-SERS-AU
RAM-SERS-SP

RAM-SERS-01-201607

RAM-SERS-01-201607
Examples of AnalytesThe following figures show a few examples of different analytes that can be used with either of the SERSsubstrates. The table below categorizes these analytes.
Table 4: Types of analytes for Raman analysisMarkers/Taggants BPEPesticides, antifungal dyes Phosmet, malathion, thiram, imidacloprid, crystal violet,
malachite greenExplosives/precursors to make explosives TNT, RDX, PETN, KMnO4, NaClO3, KClO3, NH4NO3Dyes Rhodamine 6G, rhodamine B
RAM-SERS-AU

RAM-SERS-01-201607

RAM-SERS-01-201607
RAM-SERS-SP

RAM-SERS-01-201607
ReusabilityRAM-SERS-SP substrates can be reused after sufficient washing with appropriate solvents. Inthe following example, 10 µL of 1 ppm Rhodamine 6G (Rh6G) in acetone was added to thesubstrate, and the SERS spectrum was collected using 1 second integration time, 21.2 mW ofpower, and 3 averages. To clean the substrate for reuse, it was placed in a vial with isopropylalcohol and sonicated for 15 minutes, followed by sonicating in acetone for 15 minutes. Inbetween each rinse cycle, the SERS signal was checked using the same conditions notedabove to ensure no analyte remained on the surface. After one washing cycle, the intensity ofthe SERS signal decreases slightly. After 2 or 3 wash cycles, the SERS signal intensitysignificantly decreases, and after the third wash the deterioration of the gold/silver film is clearlyvisible. Rh6G was selected for the reusability study instead of crystal violet because it does notbind as strongly to the substrate, making the rinsing process easier.
Hence, the RAM-SERS-SP substrates can be reused up to one time. Please note that this isanalyte dependent, where strongly bound analytes may require more rigorous washingtechniques which could compromise the structure of the gold/silver film.
-1000
0
1000
2000
3000
4000
5000
6000
7000
8000
400 600 800 1000 1200 1400 1600
Inte
nsity
(cou
nts)
Raman Shift (cm-1)
1 ppm Rhodamine-6G on RAM-SERS-SP after washing638 nm, 1 s, 21.2 mW
Before Washing
Wash 1
Wash 2
Wash 3
RAM-SERS-01-201607
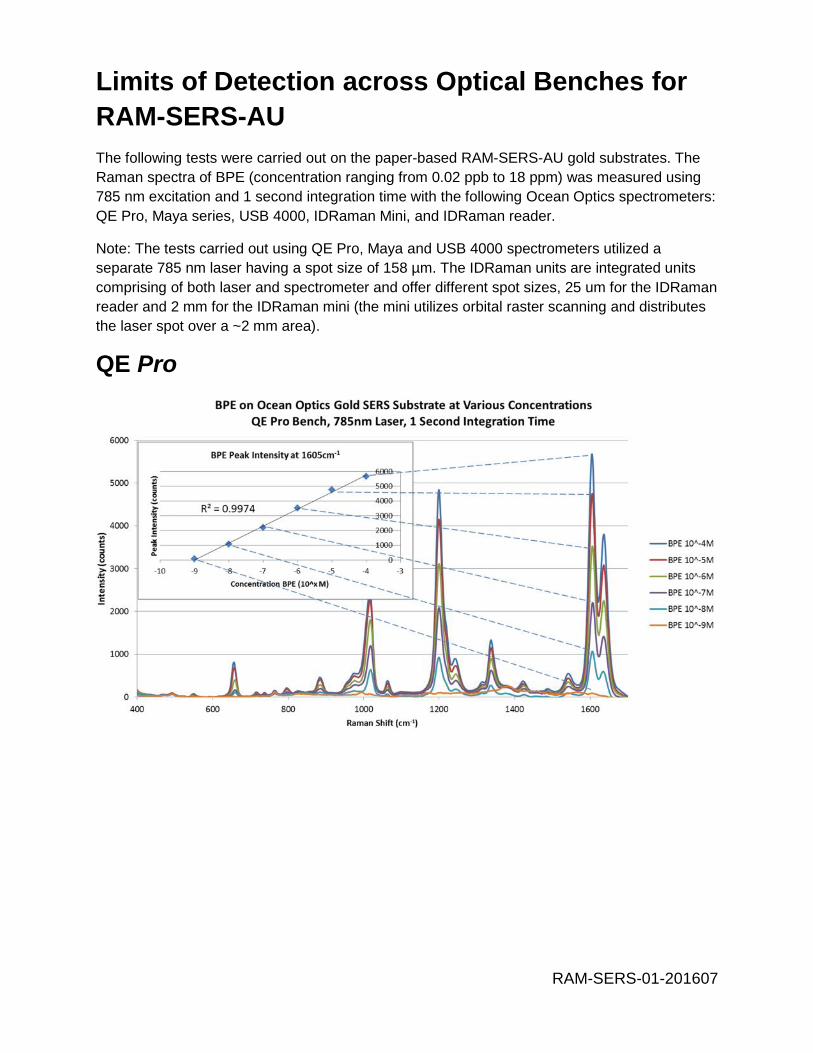
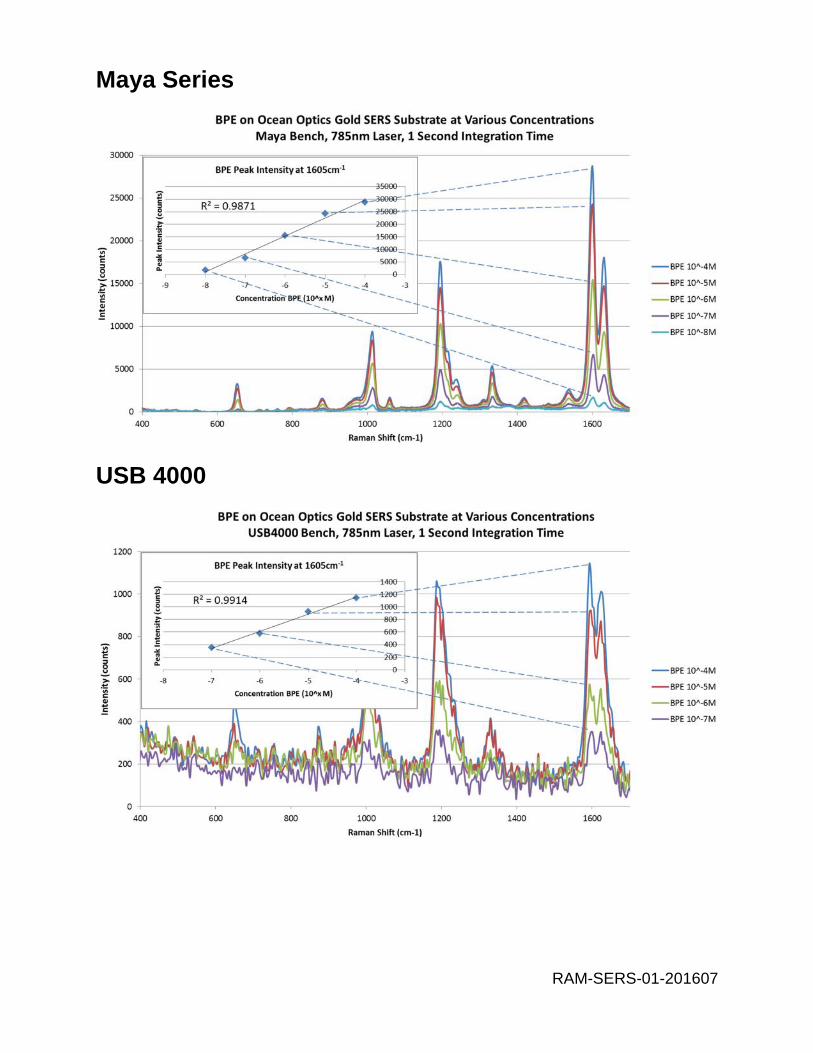
Limits of Detection across Optical Benches forRAM-SERS-AUThe following tests were carried out on the paper-based RAM-SERS-AU gold substrates. TheRaman spectra of BPE (concentration ranging from 0.02 ppb to 18 ppm) was measured using785 nm excitation and 1 second integration time with the following Ocean Optics spectrometers:QE Pro, Maya series, USB 4000, IDRaman Mini, and IDRaman reader.
Note: The tests carried out using QE Pro, Maya and USB 4000 spectrometers utilized aseparate 785 nm laser having a spot size of 158 µm. The IDRaman units are integrated unitscomprising of both laser and spectrometer and offer different spot sizes, 25 um for the IDRamanreader and 2 mm for the IDRaman mini (the mini utilizes orbital raster scanning and distributesthe laser spot over a ~2 mm area).
QE Pro
RAM-SERS-01-201607
Maya Series
USB 4000

RAM-SERS-01-201607
IDRaman mini
IDRaman reader

RAM-SERS-01-201607
Table 5: Wavelength and SERS substrate dependence of some common analytesLaser wavelength (nm) RAM-SERS-AU RAM-SERS-AG RAM-SERS-SP
532 -- Rhodamine 6G --
638 Malachite green,crystal violet Rhodamine B Explosives
785 BPE, E. coli,pesticides Melamine --
Note: This table shows which analytes have the strongest SERS signal when combined with aspecific laser and SERS substrate, although most of these analytes will still give decent SERSsignal with different combinations of the laser and SERS substrate. For example, 785 nmexcitation with the silver substrate gives the highest SERS signal for melamine, but there is alsosufficient SERS signal with 785 nm and the gold substrate or 638 nm and the nanospongesubstrate.
Lifetime of Silver SubstratesThe silver SERS substrates, which consist of silver nanoparticles (50-100 nm diameter)embedded in a quartz paper matrix, tend to oxidize when exposed to ambient conditions muchfaster than the gold substrates. The figure below shows that the SERS performance of the silversubstrates markedly declines 30 days after the production date due to this oxidation.

RAM-SERS-01-201607
Index
A Rapplications, 1 Raman spectroscopy, 2
raw peak intensity reproducibility, 12D
diagram, 4document
audience, iipurpose, iisummary, ii
F
Sspecifications, 10
key, 3standard measurement protocol, 5storage, 6
frequently asked questions, 7 Uusage notes, 5
Wwarranty, ii
Kkey features, 2key specifications, 3
Llaser power dependence, 13limits of detection across optical benches, 18
Ppeak intensity ratio repeatability, 12performance specifications, 10product-related documentation, ii