observational studies and bias in epidemiology...observational studies and bias in epidemiology...
TRANSCRIPT

Observational Studies and Bias in Epidemiology
Manuel BayonaDepartment of Epidemiology
School of Public HealthUniversity of North Texas
Fort Worth, Texas
and
Chris OlsenMathematics Department
George Washington High SchoolCedar Rapids, Iowa
The Young Epidemiology Scholars Program (YES) is supported byThe Robert Wood Johnson Foundation and administered by the College Board.

ContentsLesson Plan . . . . . . . . . . . . . . . . . . . . . . . . . . . . . . . . . . . . . . . . . . . 3
The Logic of Inference in Science . . . . . . . . . . . . . . . . . . . . . . . . . . . . . 8
The Logic of Observational Studies and the Problem of Bias . . . . . . . . . . . . 15
Characteristics of the Relative Risk When Random Sampling . . . and Not . . . 19
Types of Bias . . . . . . . . . . . . . . . . . . . . . . . . . . . . . . . . . . . . . . . . . . 20
Selection Bias . . . . . . . . . . . . . . . . . . . . . . . . . . . . . . . . . . . . . . . . . . 21
Information Bias . . . . . . . . . . . . . . . . . . . . . . . . . . . . . . . . . . . . . . . . 23
Conclusion . . . . . . . . . . . . . . . . . . . . . . . . . . . . . . . . . . . . . . . . . . . . 24
Take-Home, Open-Book Quiz (Student Version) . . . . . . . . . . . . . . . . . . . . 25
Take-Home, Open-Book Quiz (Teacher’s Answer Key) . . . . . . . . . . . . . . . . . 27
In-Class Exercise (Student Version) . . . . . . . . . . . . . . . . . . . . . . . . . . . . 30
In-Class Exercise (Teacher’s Answer Key) . . . . . . . . . . . . . . . . . . . . . . . . 32
Bias in Epidemiologic Research (Examination) (Student Version) . . . . . . . . . 33
Bias in Epidemiologic Research (Examination with Answers) (Teacher’s Answer Key) . . . . . . . . . . . . . . . . . . . . . . . . . . . . . . . . . 35
Observational Studies and Bias in Epidemiology
2Copyright © 2004. All rights reserved.
Copyright © 2004 by College Entrance Examination Board. All rights reserved.College Board, SAT and the acorn logo are registered trademarks of the CollegeEntrance Examination Board. Other products and services may be trademarks oftheir respective owners. Visit College Board on the Web: www.collegeboard.com.

Lesson Plan
TITLE: Observational Studies and Bias in Epidemiology
SUBJECT AREA: Biology, mathematics, statistics, environmental and health sciences
GOAL: To identify and appreciate the effects of bias in epidemiologic research
OBJECTIVES:
1. Introduce students to the principles and methods for interpreting the results of epidemio-logic research and bias
2. Apply basic knowledge of biology and mathematics to the study of the causes of diseasethrough epidemiologic research
3. Apply descriptive and analytical techniques in epidemiology, including the interpretation ofepidemiologic research in the presence of possible bias
4. Understand the design methods used in epidemiology to avoid or minimize bias
5. Identify the circumstances in which the results of an epidemiologic study may be biased
TIME FRAME: Two to three days.
PREREQUISITE KNOWLEDGE:
1. Basic knowledge of algebra, biology and health sciences
2. An understanding of elementary measures of disease frequency and association used inepidemiology
3. Familiarity with elementary research designs in epidemiology
EPIDEMIOLOGIC PRINCIPLES COVERED: Bias, confounding, relative risk, population
MATERIALS NEEDED: Handouts included in this instructional unit and hand calculator
PROCEDURE: The student notes are for discussing the basic concepts and procedures related toepidemiologic study designs and their potential for bias with emphasis oncase–control studies. This information could be presented to students in a lectureformat, but copies should be given to them. The in-class exercise is designed toelicit classroom discussion about the presence of bias in practical examples ofepidemiologic research.
3
Observational Studies and Bias in Epidemiology
Copyright © 2004. All rights reserved.

Recommended References
Friis RH, Sellers TA. Epidemiology for Public Health Practice. Gaithersburg, MD: Aspen Publishers; 1996.
Kelsey LJ et al., ed.: Methods in Observational Epidemiology. 2nd ed. Monographs in Epidemiology and Biostatistics.New York: Oxford University Press; 1996.
Kleinbaum DG, Kupper LL, Morgenstern H: Epidemiologic Research. New York: John Wiley & Sons; 1982.
Lilienfeld DE, Stolley PD. Foundations of Epidemiology. 3rd ed. New York: Oxford University Press; 1994.
NATIONAL SCIENCE EDUCATION STANDARDS:
Science as Inquiry
• Abilities necessary to do scientific inquiry
• Understanding about scientific inquiry
Science in Personal and Social Perspectives
• Personal and community health
• Natural and human induced hazards
Unifying Concepts and Processes
• Systems, order, and organization
• Evidence, models, and measurement
National Science Education Standards, Chapter 6, available at: http://www.nap.edu/html/6a.html
NATIONAL STANDARDS FOR SCHOOL HEALTH EDUCATION:
• Students will comprehend concepts related to health promotion and disease prevention.
• Students will demonstrate the ability to access valid health information and health promotingproducts and services.
• Students will analyze the influence of culture, media, technology and other factors onhealth.
• Students will demonstrate the ability to use goal-setting and decision-making skills toenhance health.
National Health Education Standards available at: http://www.aahperd.org/aahe/pdf_files/standards.pdf
4
Observational Studies and Bias in Epidemiology
Copyright © 2004. All rights reserved.

NATIONAL STANDARDS FOR MATHEMATICS:
5
Observational Studies and Bias in Epidemiology
Copyright © 2004. All rights reserved.
Algebra
Instructional programs from prekindergarten through grade 12 should enable all students to—
• Identify essential quantitative relationships in a situation and determine the class or classes offunctions that might model the relationships; use symbolic expressions, including iterative and recursive forms, to represent relationships arisingfrom various contexts; draw reasonable conclusionsabout a situation being modeled.
• Use mathematical modelsto represent and under-stand quantitative relationships;
Measurement
Instructional programs from prekindergarten through grade 12 should enable all students to—
• Analyze precision, accuracy, and approximate error inmeasurement situations.
• Apply appropriatetechniques, tools, andformulas to determinemeasurements.
• Make decisions about units and scales that areappropriate for problem situations involvingmeasurement.
• Understand measurableattributes of objects andthe units, systems, andprocesses of measurement;
The Standard The Grades 9–12 Expectations
(Continued)

6
Observational Studies and Bias in Epidemiology
Copyright © 2004. All rights reserved.
Data Analysis and Probability
Instructional programs from prekindergarten through grade 12 should enable all students to—
• Understand how sample statistics reflect the valuesof population parameters and use sampling distribu-tions as the basis for informal inference; evaluatepublished reports that are based on data by examin-ing the design of the study, the appropriateness ofthe data analysis, and the validity of conclusions.
• Develop and evaluateinferences and predictionsthat are based on data.
• Understand the differences among various kinds ofstudies and which types of inferences can legitimatelybe drawn from each; know the characteristics ofwell-designed studies, including the role of random-ization in surveys and experiments; understand themeaning of measurement data and categorical data;compute basic statistics and understand thedistinction between a statistic and a parameter.
• Formulate questions thatcan be addressed with dataand collect, organize, anddisplay relevant data toanswer them;
The Standard The Grades 9–12 Expectations
Problem Solving
Instructional programs from prekindergarten through grade 12 should enable all students to—
• Build new mathematical knowledge through problem solving;
• Solve problems that arise in mathematics and in other contexts;
• Apply and adapt a variety of appropriate strategies to solve problems;
• Monitor and reflect on the process of mathematical problem solving.
Communication
Instructional programs from prekindergarten through grade 12 should enable all students to—
• Organize and consolidate their mathematical thinking through communication;
• Communicate their mathematical thinking coherently and clearly to peers, teachers, and others;
• Analyze and evaluate the mathematical thinking and strategies of others;
• Use the language of mathematics to express mathematical ideas precisely.
(Continued)

7
Observational Studies and Bias in Epidemiology
Copyright © 2004. All rights reserved.
Connections
Instructional programs from prekindergarten through grade 12 should enable all students to—
• Recognize and use connections among mathematical ideas;
• Understand how mathematical ideas interconnect and build on one another to produce acoherent whole;
• Recognize and apply mathematics in contexts outside of mathematics
Representation
Instructional programs from prekindergarten through grade 12 should enable all students to—
• Create and use representations to organize, record, and communicate mathematical ideas;
• Select, apply, and translate among mathematical representations to solve problems;
• Use representations to model and interpret physical, social, and mathematical phenomena.
Math Standards available at: http://standards.nctm.org/document/chapter7/index.htm

The Logic of Inference in Science
Epidemiology is the science of studying health-related events that affect populations. Likeall science, it is built on the fundamental belief that precise observation and measurement, com-bined with careful reasoning in the light of existing knowledge, is the most effective way to pro-ceed with that study. Epidemiologists are concerned with the origins of health problems and inparticular problems related to nutrition, environmental dangers and risky behaviors of humans.Generally the epidemiologist gathers information in a community and through analysis of thedata seeks to uncover risk factors for health problems, especially those risk factors that could bealtered by governmental, medical or educational intervention in the population.
From the traditional scientific point of view the questions epidemiologists ask are elemen-tary: Given that some individuals in a population will come down with a cold and some won’t,why is this so? Is catching the common cold a completely random event, or might this maladybe prevented or at least minimized by some sort of intervention, such as drinking orange juice?In the customary language of the community, one might ask: Does drinking orange juice preventor at least minimize the likelihood of catching a cold? In epidemiologic science-speak, the ques-tion might be formed like this: Does drinking orange juice protect one from catching a cold?And in the formal logic of science, the question would be as follows: Is the ingestion of orangejuice one possible cause of a failure to catch a cold?
In modern science such a question might be answered by performing an experiment. Thelogic of experimentation is fairly clear, and we will summarize it here. Generally, to determinethat X causes Y—in this case that drinking orange juice causes a lack of cold—one would haveto demonstrate the following important statements:
1. Drinking orange juice is associated with not getting a cold.
2. Drinking orange juice precedes exposure to the cold-causing virus.
3. The more orange juice one drinks, the less likely one is to get a cold.
4. There is no other variable that is associated with drinking orange juice that could explainthe protection against a cold.
5. The mechanism of causation can be explained consistently with accepted science.
The logic of demonstrating causation with an experiment is tied to the above requirements,and there are necessary steps involved in the construction of an experiment. These steps—andtheir reasons—are diagrammed below.
8
Observational Studies and Bias in Epidemiology
Copyright © 2004. All rights reserved.

9
Observational Studies and Bias in Epidemiology
Copyright © 2004. All rights reserved.
A Schematic Diagram of theRandomized Controlled Experiment
Defining the population of interestcommunicates to other scientistswhat population you are studying.Perhaps orange juice (OJ) doesn’tguard against colds for all people.
Sampling randomly is the only waywe have for logically asserting thatthe individuals in our sample arerepresentative of the individuals inthe population. Because of this ran-dom sampling we can generalize theresults from the sample back to thepopulation of interest.
The random sample of individuals isusually a small fraction of the popu-lation that will be studied. The ran-domness of the sampling procedurewill tend to make the sample similarto the population and its individualcharacteristics such as proportion ofhealthy people, average height andweight, etc. This characteristic isusually termed representativeness.
The purpose of random assignment totreatments is perhaps the leastunderstood aspect of doing an exper-iment. It is usually thought that ran-dom assignment to treatments pre-serves the representativeness of thesample in each of the treatmentgroups. This is true, but there isanother important aspect of randomlyassigning subjects to treatments—the destruction of an association
TTherandomsample
Define the populatip p on of interest
TreatmentA
TreatmentB
Sample rand fromthe population of interest
Randomlyassign individuals
to treatments
Observe andmeasure theresponse toTreatment A
Observe andmeasure theresponse toTreatment B

10
Observational Studies and Bias in Epidemiology
Copyright © 2004. All rights reserved.
between treatment membership and any other potential cause of protection against getting a cold.That is, there is no other known or unknown factor (for example, risk of exposure to the cold virus)that “rides along” with the OJ. Thus the OJ must be the cause of any observed protective factor.
If there is an effect caused by the OJ, it should show up as a difference in the averageresponse, or the proportion of individuals getting a cold in the two treatments.
Unfortunately for the epidemiologist—and for all of us who would like to lead healthy lives ifwe only knew how—the complete logical requirements for an experiment are often impossiblefor the epidemiologist. As can be imagined, this presents extra challenges for them when theytry to make sense of observational data with about a hand and a half tied behind their backs.Let’s consider some of the limitations imposed on the epidemiologist that are not particularproblems in other scientific endeavors.
Ethical Standards Severely Limit Random Assignment to Treatments
Recall that the concern of the epidemiologist is isolating causes of illness or even death inhuman populations. As an example suppose that legislation were being considered to requiregraduated drivers’ licenses among teenage drivers. Drivers at age 16 might be allowed to driveonly during the day and alone. Not until drivers were 17 would they be allowed to drive atnight, and not until 18 would they be able to drive anyone other than parents or siblings. Froman epidemiologic standpoint, one question might be, is driving at night (as opposed to duringthe day) a risk factor for death due to traffic accidents? It is clearly not ethical to assign teensto drive at night if that is felt to be a risk to health and life. It would be like assigning somepeople to smoke two packs of cigarettes every day!
Are high-power lines implicated in causing cancer? Are oral contraceptives causing anincreased risk of heart disease? These are questions that cannot be addressed in an experimentalsituation because of ethical concerns.
This limitation alone is incredibly crippling to the logic of establishing causation. Withoutrandom assignment to treatments there is no easy logical way to establish the unlikelihood ofcompeting causes. For example, one might argue that smoking isn’t really what causes cancer.It’s the pressure of work. People under pressure tend to smoke, but it’s the pressure thatdegrades their nervous system and makes them at increased risk of all sorts of health problems,including cancer. If we were able to randomly assign people to treatments, there would be justas many nervous people in the two-pack-per-day group as in the zero-pack-per-day group, andthen nervousness would be eliminated as an alternative explanation for cancer, because it wouldnot be associated, could not be associated, with the smoking variable.

Random Sampling Is Very Difficult in the Epidemiologic World
Strictly speaking, random sampling from existing populations is very difficult in the realworld and is a goal often not fully complied with. Usually a sample is taken in a manner thatcan be argued is morally equivalent to random sampling. For the epidemiologist there are addedproblems that sometimes make it difficult to fully comprehend what population is being studied.It may be relatively easy to study the population of teenage drivers in a particular state. Theyare required to have and carry driver’s licenses, and theoretically at least a list could be made ofthese young people and their driving habits studied. However, suppose there is an outbreak of asevere skin rash of some sort, one that has not before been identified. Is the cause possiblynutritional? Then perhaps the population of concern—called the target population—is thatgroup of individuals who have eaten a specific food. Or might it be the population of individualswho shopped at a certain store? Or might it be those who did not prepare the food according toinstructions? Possibly the rash is the result of a bug bite. Is, then, the target population peoplewho live in or near woods? Or is it those individuals who own pets? Are all individuals in aneighborhood exposed to these bugs? Are all individuals susceptible to these rashes or onlythose who eat lots of carbohydrates? Without knowing what the at-risk population is, it is notvery easy to take a sample, and without that sampling strategy, it is very difficult to know towhom the results of an epidemiologic study can be generalized.
Information May Be FaultyAs we shall see below, epidemiologists have basically two observational problems if they
wish to show that exposure to a risk factor (X) in some sense causes the impact of interest (Y).Those observational problems are:
1. Was an individual in fact exposed to the risk factor?
2. Has the impact occurred or not?
At first blush these observations would seem to be relatively easy. Such is not necessarily thecase. Exposure to a risk factor is frequently ascertained only through surveying individuals, indi-viduals with possibly good reasons to provide faulty information (Are you using illegal drugs?) orshade the truth a bit (Are you flossing every day?) about the nature or amount of their expo-sure. Also in some cases the information sought is in the past, and human memory, always aproblem, is the only source of information.
And what about impact? Suppose that we have perfectly reliable information about the useof oral contraceptives by a sample of individuals. We suspect that using oral contraceptives is arisk factor for breast cancer, but how do we know that an individual has breast cancer?
11
Observational Studies and Bias in Epidemiology
Copyright © 2004. All rights reserved.

Mammograms are notoriously unreliable in young women, and breast cancer may existundetected for some time. If a young woman has breast cancer, unknown to anyone, but dies ina traffic accident, her cancer status would be recorded incorrectly as cancer free.
Stripped of the capability of intervention by the investigator and specifically randomassignment of subjects to treatments (i.e., the capability to assign exposure), a study is knownas an observational study. As the name implies, the investigator is on the sidelines, observingevents as they unfold. The logic and methods of an observational study are somewhat differentfrom those of an experiment. A diagram of this logic appears below.
12
Observational Studies and Bias in Epidemiology
Copyright © 2004. All rights reserved.

A Schematic Diagram of the Remainsof a Randomized Controlled Experiment
(An Observational Study!)
The population of interest may bewell defined, such as young bicycleriders, but rarely is there a reliablelist of individuals in the population.When investigating an outbreak of adisease in search of a cause, thepopulation of interest is unclear, atleast in the beginning.
Deciding who and where to sampleis a serious problem. Epidemiologistsmust infer a population from study-ing who is affected and then try tosample from that ill-defined popula-tion. Often they do not formallychoose a random sample.
Therefore if the sample is not ran-domly chosen, it is not possible togeneralize results to any recogniza-ble population, and if a randomsample is chosen, it may not be rep-resentative of the appropriate popu-lation.
Individuals may be identified asexposed or not and then followed upto observe their future disease sta-tus. Or individuals with a diseasemay be identified, and their priorexposure to possible risk factors issought.
13
Observational Studies and Bias in Epidemiology
Copyright © 2004. All rights reserved.
Define the populationof interest
Unexposed(to ?)
Identify health event
status
Identify health event
status
Evaluate theassociation betweenexposure and disease
Exposed (to ?)
Sample randomly fromthe population of
interest?
??? ???
Individualsare presented
to the observer
Therandomsample

14
Observational Studies and Bias in Epidemiology
Copyright © 2004. All rights reserved.
Diagnoses may be difficult to determine and may possibly be in error, or patient records may beincomplete.
Association alone does not imply cause.

The Logic of Observational Studies andthe Problem of Bias
As we have already seen, capitalizing on the logic of experimentation will not be possiblein most epidemiologic studies. Nevertheless it is still possible to make an argument for causeand effect, though the usual procedures of statistics and laws of probability conferred by ran-domization cannot be depended on. In the face of a lack of random sampling and randomassignment to treatments, epidemiologists must be very careful in interpreting the results oftheir study, recognizing the potential for error. This means that epidemiologists (as well as allwho engage in observational studies) must be on the lookout for problems that lurk in thedesign and execution of a study and must recognize the great potential for error. One significantclass of errors is known as bias. Bias, as defined in epidemiology, is an error in design or execu-tion of a study, which produces results that are consistently distorted in one direction becauseof nonrandom factors. Bias can occur in randomized controlled trials but tends to be a muchgreater problem in observational studies.
So that we can better understand the nature of bias, recall that the goal of the epidemiolo-gist is to establish that exposure to a particular risk factor is responsible for causing or partiallycausing a health problem. Greatly simplifying the analytical work of the epidemiologist, we willsuggest that observational studies as performed in epidemiology reduce to the followingproblems:
1. Estimate the proportion of people in a population who are exposed (E) to a risk factor
2. Estimate the proportions of people in a population who, having been exposed to a riskfactor or not, subsequently develop a health problem or disease (D).
3. Estimate the association between the risk factor and the disease.
Estimating these proportions in a population is essentially a statistical problem of sampling anda methodologic problem of correct classification of both exposure and disease status. A bias inthis context would be any procedure that leads to a systematic over- or underestimation of theassociation between the risk factor and the disease. Because the association between risk factorand disease is calculated from the proportions, distortion of either of the proportions may leadto a distortion of the estimate of the association.
In the schematic diagram (above) of the observational study, we can see some aspects thatare present in a randomized experiment. First, an epidemiologist will have to be concernedabout sampling, so that his or her results can be generalized to a target population. Second,correctly ascertaining the exposure status of an individual is analogous to an individual’s beingin one of two treatment groups: the exposed (E) and the unexposed (not E) treatments.
15
Observational Studies and Bias in Epidemiology
Copyright © 2004. All rights reserved.

Third, the effects of being in the exposed or not exposed groups will be compared to assess theeffect of being exposed to the risk factor. Epidemiologists are confronted with complex healthsituations, and therefore their mathematical procedures can be complicated. A wide variety ofmeasures and calculations are used in actual practice, in response to the wide variety of individ-ual situations that may be studied. However, to focus on the logic of observational studies andsources of bias, we will use some elementary formulas. We will suppose that in a target popula-tion there are individuals who are exposed to a risk factor and that of those individuals a certainnumber will subsequently develop the health problem of interest, disease D. In the followingtables we distinguish the target population, the sampling frame and the actual sample. The tar-get population is the “real” population, those individuals who are in a population and may be atrisk for exposure to a risk factor. The sampling frame is a statistical term and conceptuallydenotes those individuals who are available for sampling.
The target population and the sampling frame really should be in good agreement, but thissituation is not necessarily so. One of the most famous polling fiascos in history is thought tohave been the result of a sampling frame that differed from the target population. In the 1936presidential election, a magazine called the Literary Digest decided to sample voters to see whomthey were supporting. The target population, then, was those 1936 voters. The Digest used asampling frame composed of telephone books and automobile registrations. In 1936 those whoowned cars and had telephones were not just different from the population of voters—they werevery different! By far a larger proportion of Republicans owned cars and had telephones. Thusthe proportion in the sample who reported they were supporting the Republican candidate wasseriously distorted from the true value in the target population.
We will conceptualize the target population as consisting of combinations of folks who areexposed or not exposed, and diseased or not diseased. (Remember, epidemiologists are not onlyconcerned with infectious disease but also with health risks in general. The term disease isshorthand for the health risk of interest.) The sampling frame and the actual sample areanalogous.
The target population consists of individuals classified according to the following table. Thevariables a, b, g and d denote the proportions of the population that are in each group.
The Target Population
Exposure Developed Did Not Develop theStatus Disease Disease
Exposed a b
Not Exposed g d
16
Observational Studies and Bias in Epidemiology
Copyright © 2004. All rights reserved.

The sampling frame consists of accessible individuals classified according to the followingtable. The variables a�, b�, g � and d� denote the proportions of the accessible population thatare in each group.
The Sampling Frame
Exposure Developed Did Not Develop theStatus Disease Disease
Exposed a� b�
Not Exposed g � d�
The actual sample results in a certain number of individuals who have been surveyed,examined and diagnosed. The variables, a, b, c and d denote the sample results.
The Sample
Exposure Developed Did Not Develop theStatus Disease Disease Total
Exposed a b a + b
Not Exposed c d c + d
The measure we will use for our discussion of association of exposure to disease is knownas the relative risk. In some studies other calculations are used to estimate the relative risk—recall that we are keeping the mathematics simple. Essentially the relative risk is a number thatcompares the risk of disease for an exposed group with the risk of disease for an unexposedgroup, using a ratio:
The relative risk is an easy statistic to interpret. If exposure to the risk factor elevates the prob-ability of getting the disease, the proportion of exposed people who subsequently develop thedisease should be greater than the proportion of unexposed people who subsequently develop
Relative riskproportion of those exposed who develop the disease
proportion of those unexposed who develop the disease
=
= +
+
aa b
cc d
( )
( )
17
Observational Studies and Bias in Epidemiology
Copyright © 2004. All rights reserved.

18
the disease. If that is so, the numerator of the relative risk should be greater than the denomi-nator, and the relative risk is therefore greater than 1.0. There is also the possibility that expo-sure to a factor, such as a vaccination, will decrease the risk. In that case the relative risk wouldbe less than 1.0.
In summary:
1. If the relative risk is equal to 1.0, no association is indicated.
2. If the relative risk is less than 1.0, a risk factor is indicated.
3. If the relative risk is greater than 1.0, a protective factor is indicated.
The relative risk is a sample statistic and is used to estimate the corresponding population rela-tive risk:
Relative risk =
a(a � b)
g(g � d )
Observational Studies and Bias in Epidemiology
Copyright © 2004. All rights reserved.
Characteristics of the Relative RiskWhen Random Sampling . . . and Not
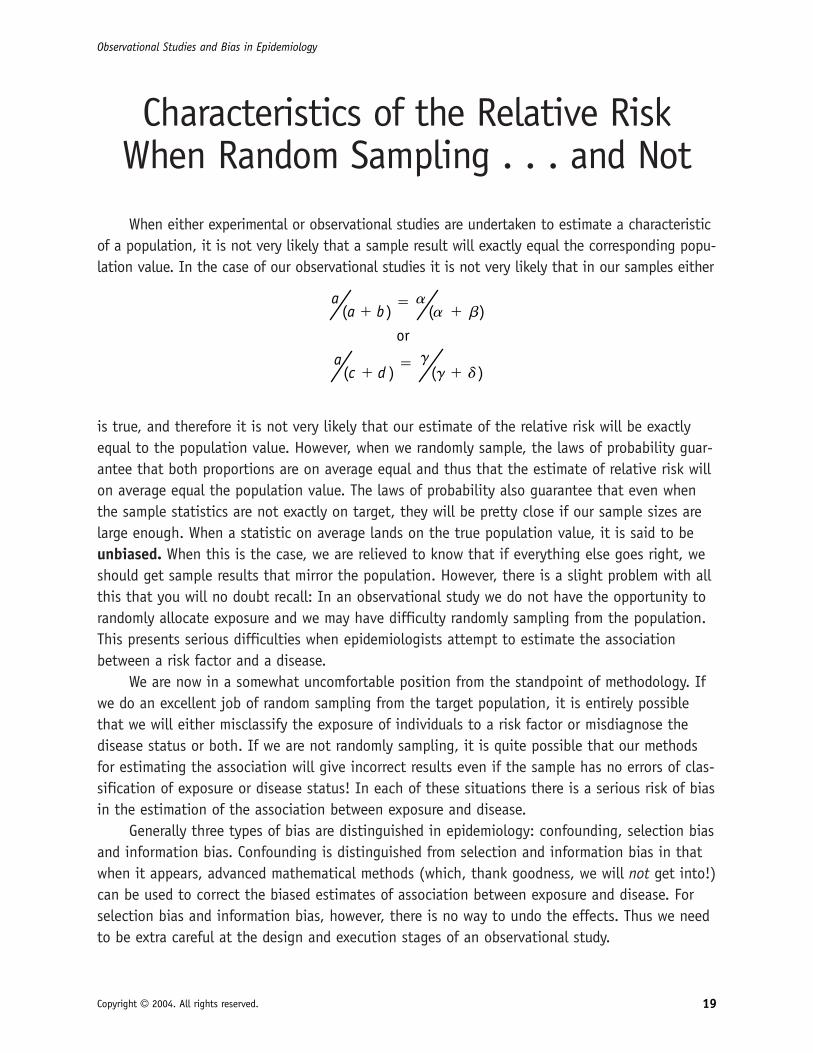
When either experimental or observational studies are undertaken to estimate a characteristicof a population, it is not very likely that a sample result will exactly equal the corresponding popu-lation value. In the case of our observational studies it is not very likely that in our samples either
is true, and therefore it is not very likely that our estimate of the relative risk will be exactlyequal to the population value. However, when we randomly sample, the laws of probability guar-antee that both proportions are on average equal and thus that the estimate of relative risk willon average equal the population value. The laws of probability also guarantee that even whenthe sample statistics are not exactly on target, they will be pretty close if our sample sizes arelarge enough. When a statistic on average lands on the true population value, it is said to beunbiased. When this is the case, we are relieved to know that if everything else goes right, weshould get sample results that mirror the population. However, there is a slight problem with allthis that you will no doubt recall: In an observational study we do not have the opportunity torandomly allocate exposure and we may have difficulty randomly sampling from the population.This presents serious difficulties when epidemiologists attempt to estimate the associationbetween a risk factor and a disease.
We are now in a somewhat uncomfortable position from the standpoint of methodology. Ifwe do an excellent job of random sampling from the target population, it is entirely possiblethat we will either misclassify the exposure of individuals to a risk factor or misdiagnose thedisease status or both. If we are not randomly sampling, it is quite possible that our methodsfor estimating the association will give incorrect results even if the sample has no errors of clas-sification of exposure or disease status! In each of these situations there is a serious risk of biasin the estimation of the association between exposure and disease.
Generally three types of bias are distinguished in epidemiology: confounding, selection biasand information bias. Confounding is distinguished from selection and information bias in thatwhen it appears, advanced mathematical methods (which, thank goodness, we will not get into!)can be used to correct the biased estimates of association between exposure and disease. Forselection bias and information bias, however, there is no way to undo the effects. Thus we needto be extra careful at the design and execution stages of an observational study.
a(a � b) � a
(a � b)
or
a(c � d ) � g
(g � d )
19
Observational Studies and Bias in Epidemiology
Copyright © 2004. All rights reserved.

Types of Bias
Confounding is a bias that results when the risk factor being studied is so mixed up withother possible risk factors that its single effect is very difficult to distinguish. For example, itmight be thought that smoking is a risk factor for heart disease, because people who areexposed to smoking have a higher occurrence of heart disease. However, the case is not quite soclear as it might appear. It turns out that people who smoke also drink alcohol—so is it thesmoking, the alcohol or both that are responsible for heart disease? Unless these tangled effectsare untangled with advanced mathematical methods (which, remember, we are not getting into),the association between smoking and heart disease, as measured using the relative risk formulawe have, is probably too high or too low—that is, it is biased.
Selection bias is a distortion in the estimate of association between risk factor and dis-ease that results from how the subjects are selected for the study. Selection bias could occurbecause the sampling frame is sufficiently different from the target population or because thesampling procedure cannot be expected to deliver a sample that is a mirror image of the sam-pling frame.
Information bias is a distortion in the estimate of association between risk factor and dis-ease that is due to systematic measurement error or misclassification of subjects on one or morevariables, either risk factor or disease status. It is important to realize that these errors are partof being human and they are not occurring because the physicians or researchers are not beingsufficiently careful. It is not so much the random mismeasure or misdiagnosis of an individualthat is problematic (although random errors in diagnosis will tend to bias the association towarda relative risk of 1.0, because the true association is diluted with noise). It is the method ofmeasurement or classification that is the greater problem, because it systematically exerts aneffect on each of the individual measurements in the sample.
Our discussion up to now has been somewhat abstract and a little mathematical. Let’s seeif we can fill out the discussion with some examples from out in the field of epidemiology.
20
Observational Studies and Bias in Epidemiology
Copyright © 2004. All rights reserved.

Selection Bias
Recall that selection bias occurs whenever the manner of selection of study participants createsa deviation between the measurement of the association in the study and the real magnitude ofthe association between factor and disease in the population.
Nonresponse bias occurs because individuals who do not respond to a call to participate inresearch studies are generally different from those who do respond. For example, respondentstend to have healthier lifestyle habits, with lower smoking and mortality rates. Because of thisthey tend to be different from the target population. To illustrate, suppose we would like toconduct a case–control study of the association between liver cancer and smoking. Cases (thoseidentified as having liver cancer) could be all available individuals in all the hospitals in townduring the year of the study. Controls (individuals without history of liver cancer) would berecruited by local mass media advertisements—hence they would be volunteers. The studyresults would most probably show a strong association between smoking and liver cancer, notnecessarily because smoking and liver cancer are related, but because the selection process wasdifferent for cases and controls. Although the cases were arguably sampled from the populationat large, the controls were sampled from a population of volunteers! Several studies have shownthat volunteers have lower mortality rates and are less likely to engage in high-risk behaviorssuch as smoking, when compared with nonvolunteers. The effect in this situation would be tooverestimate the numerator and underestimate the denominator in the formula for relative riskbecause volunteers will have a lower proportion of smokers compared with nonvolunteers, thusbiasing the estimate of the relative risk to the high side. (Readers who may be familiar with themethods of epidemiology may question the calculation of the relative risk rather than the oddsratio from a case–control study. However, in this example the total population of the town isknown, so the relative risk can be estimated.) Notice that in this example there are two poten-tial sampling biases. First, the target population (everybody in the communities) has beenreplaced by the sampling frame of those who are reachable by mass media. Second, the twoactual samples of cases and controls differ in significant ways, so comparing them leads to com-plications in the interpretation of relative risk.
Hospital admission rate bias is a selection bias that rears its head when hospital-based stud-ies, especially case–control studies, are undertaken. In Berkson’s bias, one form of hospitaladmission bias, the problem is that hospitalized individuals are more likely to suffer from manyillnesses, as well as more severe illnesses, and engage in less than healthy behaviors. Thus theyare probably not representative of the target population, i.e., the potential patients in the com-munity served by the hospital. In case–control studies, controls are often selected from thesame hospital where cases were found. Such controls are conveniently accessible for purposes ofthe study. To illustrate another form of hospital admission bias, suppose that we would like toassess the association between low socioeconomic status and asthma by using a hospital-based
21
Observational Studies and Bias in Epidemiology
Copyright © 2004. All rights reserved.

case–control study. Suppose further that this hospital is located in a low-income area of the cityand is famous for its expertise in asthma. Because of that expertise individuals with asthma(cases) from all over the state and region elect to go to that hospital to get care. If the hospitalis not as well known for other medical conditions and specialties, and controls are chosen fromthat hospital, there would be a difference between the two populations sampled. Cases wouldcome from all over the region, and controls would be mostly local low-income individuals. Thisdiscrepancy would result in an underestimate of the true association between low income andasthma.
Exclusion bias occurs when in certain circumstances epidemiologic studies exclude participantsto prevent confounding. If the exclusion criteria are different for cases and controls or differentfor the exposed and nonexposed, an exclusion bias may be introduced. In 1974 researchers pub-lished the results of a case–control hospital-based study in which breast cancer was associatedwith the use of reserpine, at that time a popular treatment for high blood pressure. To make thecontrols more closely resemble the study population, women who had medical conditions thatwould lead to the prescribed use of reserpine were excluded from the control group. However,the same exclusion criteria were not used for the cases. Therefore, an overestimation of theassociation between breast cancer and reserpine was found. Investigators replicated the study in1985 and performed two different analyses of their data. First, they included all women in theiranalysis. Then they reanalyzed the data after excluding controls with cardiovascular disease.Their findings showed no association when all women were included, but when they excludedthe women with cardiovascular diseases from the control group, their data showed a strongassociation.
Publicity bias (also called awareness bias) occurs when media attention is drawn to a particu-lar illness. Thus if a government official or movie star is widely reported to have a particular ill-ness, this stimulates individuals to wonder if they might have the same illness, resulting in anincrease in the reporting of the disease. Publicity bias can also occur from news reports notrelated to individuals. In a 1981–1982 survey of individuals near two hazardous waste disposalsites in Louisiana, people were asked about various symptoms. Air and water quality datashowed little evidence of hazardous concentrations of chemicals, but there had been extensivemedia coverage at the time of the survey. Respondents living near the sites were two to threetimes as likely to report symptoms as respondents in an unexposed community because of theinfluence of the publicity at that moment in time.
22
Observational Studies and Bias in Epidemiology
Copyright © 2004. All rights reserved.

Information Bias
When the information obtained from study participants is systematically inaccurate regard-ing the disease or exposure under study, information bias may occur. Whenever the accuracy ofthe information about exposure is different in cases and controls, a differential information biasoccurs. Such bias could result in an over- or underestimate of the real association depending onthe circumstances. For example, if exposure is underrecognized in cases, an underestimation of apositive association will occur, but if exposure is underrecognized in controls, an overestimationof a positive association will occur. There are several forms of information bias; we will presentthe most common ones.
Medical records are often used in epidemiologic studies to abstract data. However, carefulconsideration should be given to the quality of the data because medical records are made fordiagnostic and treatment purposes, not for research. For example, data are usually more com-plete when a clear diagnosis has been established. Better quality on the diagnosis is usuallyachieved in patients with severe disease. Therefore more complete information about exposureswould be more frequently found in patients with severe disease. This difference in the accuracyof medical records will tend to produce an overestimation of the association under study.
Biases also occur when interviewing. Interviewers tend to be more accurate when inter-viewing cases than when interviewing controls. When interviewers have knowledge that arespondent is a “case,” they will tend to assertively find exposure, as well as classify vague orindeterminate responses as indicating exposure. This more precise questioning improves thequality of the data from cases. However, since the precise questioning tends not to happen witha control respondent, the information about exposure in controls will tend to be underestimated.Thus an overestimation of the association will be the consequence. (Note: This also happenswith abstracting bias if one thinks of the records as analogous to respondents.)
Recall bias is one very common form of information bias. Cases (individuals identified ashaving the disease under study) tend to better recall past exposures than controls. For example,women who have had a baby with a malformation will remember better any events during preg-nancy than mothers of infants with no malformations. It seems probable that this is truebecause individuals with a disease are more concerned about remembering potential causes.Therefore recall bias will tend to overestimate the association of the outcome with exposure to arisk factor.
Reporting bias occurs when a case emphasizes the importance of exposures that he or shebelieves to be important. Sometimes this report bias may be related to occupational exposuresthat the patient wants to underscore as a result of worker’s compensation or any other benefit,thus producing an overestimation of the association under study as it does not occur in controls.
23
Observational Studies and Bias in Epidemiology
Copyright © 2004. All rights reserved.

Conclusion
Our discussion and examples above have shown that there are many possible sources forerror that can result in systematic distortions of study results. These distortions are a problemespecially when the epidemiologist is estimating the association between a risk factor and ahealth problem. Whether a risk factor or a protective factor goes undetected, or a behavior orcondition is misidentified as a risk or protective factor, the implications can be serious for thepublic. A risk factor that goes unidentified is one about which information cannot be used toalter the public’s behavior and will result in sickness or death for individuals. An erroneouslyidentified risk factor may cause unneeded pain and worry among the public or perhaps anunnecessary diversion of research funds. Epidemiologists conducting observational studies(cohort, cross-sectional and especially case–control) need to be aware of the potential for biasesand exert extra care to eliminate or lessen their effect. As interpreters of studies we members ofthe public need to be aware of the possible biases in such studies when we evaluate their con-clusions as reported by the mass media.
24
Observational Studies and Bias in Epidemiology
Copyright © 2004. All rights reserved.

Take-Home, Open-Book Quiz (Student Version)
Part I: Short Answer1. In a few sentences please define and contrast bias and sampling error.
2. Please define and contrast selection and information bias.
Part II: Tanning and Skin CancerAn investigator would like to assess the association of melanoma (skin cancer) and exposure toinfrared skin tanning services by using a hospital-based case–control study. Hospitalizedindividuals with melanoma will be compared with hospitalized patients without melanoma(controls). This hospital, located in a low-income area of the city, is famous nationwide for itsexpertise in melanoma. Individuals with melanoma (cases) from all over the country go to thathospital to get the highest quality care that can be provided. However, this hospital is not aswell known for any other medical conditions as it is for melanoma. Therefore, cases would comefrom all over the country, and controls will be mostly local low-income individuals. The investi-gator predicts that an overestimation of the association between melanoma and skin tan serv-ices may occur.
3. Do you agree or disagree with the investigator? Explain your answer in a few sentences.
4. Please explain in a few words what type of bias may be present?
Part III: Smoking and DiabetesA study to assess the association of diabetes and smoking compared a group of hospitalizedindividuals with diabetes (cases) with a group of volunteer individuals without diabetes(controls) who were full-time employees of the same hospital where the cases were identified.The results from this study reported, for the first time in the literature, a strong associationbetween diabetes and smoking.
5. What type of bias may be present? Why do you suspect the presence of the bias you haveidentified?
6. The magnitude of this association is likely to be either over- or underestimated. Which doyou think is the case, and what makes you think so?
25
Observational Studies and Bias in Epidemiology
Copyright © 2004. All rights reserved.

Part IV: Passive Smoking and AsthmaA case–control study was conducted to assess the association of passive smoking and asthma.Newly diagnosed asthmatic individuals (cases) were compared with a random sample of individu-als without asthma (controls) in regard to exposure to smoke from smokers at home or in theworkplace for the previous 10 years.
7. Which type and mode of bias could be introduced into this study?
26
Observational Studies and Bias in Epidemiology
Copyright © 2004. All rights reserved.

Take-Home, Open-Book Quiz (Teacher’s Answer Key)
Part I: Short Answer1. In a few sentences please define and contrast selection bias and sampling error.
Sampling error is the part of the estimation error of a parameter from a sample causedby the random nature of the sample. Random error can be reduced by increasing thesample size (Last, 2001).
Selection bias is a systematic error that causes a distortion in the estimate of aparameter and is caused by the manner in which the subjects are selected from thetotal population into the sample. Bias cannot be reduced by increasing the samplesize.
2. Please define and contrast selection and information bias.
Selection bias is a distortion in the estimate of association between risk factor anddisease that results from how the subjects are selected for the study. Selection biascould occur because the sampling frame is sufficiently different from the target popu-lation, or it could occur because the sampling procedure cannot be expected to delivera sample that is a mirror image of the sampling frame.
Information bias occurs when the information obtained from study subjects is system-atically inaccurate regarding the disease or exposure under study.
Part II: Tanning and Skin CancerAn investigator would like to assess the association of melanoma (skin cancer) and exposure toinfrared skin tanning services by using a hospital-based case–control study. Hospitalized individ-uals with melanoma will be compared with hospitalized patients without melanoma (controls).This hospital, located in a low-income area of the city, is famous nationwide for its expertise inmelanoma; individuals with melanoma (cases) from all over the country go to that hospital toget the highest quality care that can be provided. However, this hospital is not as well knownfor any other medical conditions as it is for melanoma. Therefore, cases would come from allover the country, and controls will be mostly local low-income individuals. The investigatorpredicts that an overestimation of the association between melanoma and skin tan services may occur.
27
Observational Studies and Bias in Epidemiology
Copyright © 2004. All rights reserved.

3. Do you agree or disagree with the investigator? Explain your answer in a few sentences.
The investigator may be correct because infrared skin tanning services in low-incomeareas are not as popular as they are in more affluent areas. Therefore, independentlyfrom disease causality, it is likely that the cases will be more frequently exposed toinfrared skin tanning services as they will have higher income than controls.
4. Please explain in a few words what type of bias may be present?
Selection bias
Part III: Smoking and DiabetesA study to assess the association of diabetes and smoking compared a group of hospitalizedindividuals with diabetes (cases) with a group of volunteer individuals without diabetes(controls) who were full-time employees of the same hospital where the cases were identified.The results from this study reported, for the first time in the literature, a strong associationbetween diabetes and smoking.
5. What type of bias may be present? Why do you suspect the presence of the bias you haveidentified?
Selection bias. There is evidence in many studies showing that responders, especiallyvolunteer individuals, usually are healthier and are less exposed to risk factors such assmoking (response bias). Smoking increases the chances to be hospitalized forreasons other than diabetes. When hospitalized, it is more likely to be detected ashaving diabetes (detection bias) and more likely to be included in the study(Berkson’s bias).
6. The magnitude of this association is likely to be either over- or underestimated. Which doyou think is the case, and what makes you think so?
The magnitude of the association is likely to be overestimated because smokers willbe overrepresented among cases and underrepresented among controls as compared tothe total population.
Part IV: Passive Smoking and AsthmaA case–control study was conducted to assess the association of passive smoking and asthma.Newly diagnosed asthmatic individuals (cases) were compared with a random sample of individu-als without asthma (controls) in regard to exposure to smoke from smokers at home or in theworkplace for the previous 10 years.
28
Observational Studies and Bias in Epidemiology
Copyright © 2004. All rights reserved.

7. Which type and mode of bias could be introduced into this study?
Recall bias may occur. Passive smoking is not a factor important enough for asthmafree individuals (controls) to remember as accurately (10 years recall) as cases may.Most asthmatics (cases) find troublesome to be exposed to smoking smoke and for alarge proportion of them it may even be a trigger of asthmatic exacerbations.
29
Observational Studies and Bias in Epidemiology
Copyright © 2004. All rights reserved.

In-Class Exercise (Student Version)
Each of the following studies identifies a risk factor and a health consequence. Supposethat an epidemiologist desires to study the association between the risk factor and healthconsequence. For each scenario identify the form(s) of bias that might be present.
1. A case–control study of fatal automobile crashes will compare fatalities (cases) with livingcontrols, assessing alcohol use and driving practices. Blood samples are always taken fromcases (fatalities) by the forensic service in order to chemically ascertain the blood-alcoholcontent. However, data will be gathered from controls via interview.
3. A case–control study of Alzheimer’s disease and exposure within the past five years tohomecare products that contain aluminum will be conducted. Information about the use ofproducts will be gathered via an in-home survey.
4. A prospective cohort study of illegal drug use and tuberculosis will follow a group of drugusers and nonusers among the homeless in a shelter for two years and compare their inci-dence rates of tuberculosis infection. (Hint: To be accepted in some shelters on a regularbasis, clients must declare that they are not using illegal drugs.)
30
Observational Studies and Bias in Epidemiology
Copyright © 2004. All rights reserved.
5. In a cross-sectional study, a survey of health concerns will be taken. In the communitiessurveyed, approximately half of the citizens live near sites of heavy industry.
31
Observational Studies and Bias in Epidemiology
Copyright © 2004. All rights reserved.

In-Class Exercise (Teacher’s Answer Key)
Each of the following studies identifies a risk factor and a health consequence. Supposethat an epidemiologist desires to study the association between the risk factor and healthconsequence. For each scenario identify the form(s) of bias that might be present.
1. A case–control study of fatal automobile crashes will compare fatalities (cases) with livingcontrols, assessing alcohol use and driving practices. Blood samples are always taken fromcases (fatalities) by the forensic service in order to chemically ascertain the blood-alcoholcontent. However, data will be gathered from controls via interview.
Most likely the controls will underreport alcohol use, because drinking and driving isillegal (information bias.) Thus an overestimation of the association between alcoholuse and fatal crashes is likely to occur.
3. A case–control study of Alzheimer’s disease and exposure within the past five years tohomecare products that contain aluminum will be conducted. Information about the use ofproducts will be gathered via an in-home survey.
Individuals with Alzheimer’s disease (cases) have memory problems and may not beable to remember past events, especially recent past events (recall bias). Thereforecontrols will better report past events than will cases, resulting in an underestimationof association with use of aluminum products.
4. A prospective cohort study of illegal drug use and tuberculosis will follow a group of drugusers and nonusers among the homeless in a shelter for two years and compare their inci-dence rates of tuberculosis infection. (Hint: To be accepted in some shelters on a regularbasis, clients must declare that they are not using illegal drugs.)
Because clients must declare that they are not using illegal drugs in order to beaccepted in some shelters on a regular basis, a proportion of clients will probablyunderreport drug use, an information bias. Therefore, a proportion of the unexposedcohorts may in fact be exposed. This will produce an underestimation of the associa-tion between illegal drug use and tuberculosis.
5. In a cross-sectional study, a survey of health concerns will be taken. In the communitiessurveyed, approximately half of the citizens live near sites of heavy industry.
Because of some citizens’ proximity to heavy industry, they may be sensitive to noxiousemissions and either overreport or misreport symptoms. This is an awareness bias.
32
Observational Studies and Bias in Epidemiology
Copyright © 2004. All rights reserved.

Bias in Epidemiologic Research(Examination) (Student Version)
Name _______________________________
1. Please label the following statements as true (T) or false (F) regarding bias in epidemio-logic research.
( ) Bias is an error in design or execution of a study that produces results that are consistentlydistorted in one direction and lead to an incorrect assessment of the association betweenthe factor and the disease under study.
( ) Bias could be due to problems in the selection of the population to be studied.
( ) Bias can be prevented or minimized by taking a larger sample.
( ) Bias can be classified in two major types: selection bias and information bias.
2. A study to assess the association of diabetes and smoking compares a group of hospitalizedindividuals with diabetes and a group of volunteer individuals without diabetes that areemployees of the same hospital where the cases were identified. The results from this studyreported, for the first time in the literature, a strong association between diabetes andsmoking. The magnitude of this association is likely to be due to (Check all that apply):
a. Recall bias
b. Berkson’s bias
c. Publicity bias
d. Nonresponse bias
e. Interviewer bias
3. An investigator would like to assess the association of melanoma (skin cancer) andexposure to infrared skin tanning services by using a hospital-based case-control study.Hospitalized individuals with melanoma will be compared to hospitalized patients withoutmelanoma (controls). This hospital is located in a low-income area of the city and isfamous nationwide for its expertise in melanoma; individuals with melanoma (cases) fromall over the country go to that hospital to get the highest quality care that can be provid-ed. However, this hospital is not as well known for other medical conditions. Therefore,cases would come from all over the country and controls will be mostly local low-incomeindividuals. The investigator predicts that an overestimation of the association betweenmelanoma and skin tan services may occur.
33
Observational Studies and Bias in Epidemiology
Copyright © 2004. All rights reserved.

Please label the following statements as true (T) or false (F) regarding this study.
( ) The investigator is wrong, an underestimation of the association is more likely to occur.
( ) The results of this study is likely to be influenced by nonresponse bias.
( ) The results of this study is likely to be influenced by Berkson’s bias.
( ) Recall bias is likely to be present in this study.
( ) Bias caused by misclassification of the outcome (namely melanoma) is likely to be a majorproblem.
34
Observational Studies and Bias in Epidemiology
Copyright © 2004. All rights reserved.

Bias in Epidemiologic Research(Examination with Answers)
(Teacher’s Answer Key)
Name _______________________________
1. Please label the following statements as true (T) or false (F) regarding bias inepidemiologic research.
(T) Bias is an error in design or execution of a study that produces results that are consistentlydistorted in one direction and lead to an incorrect assessment of the association betweenthe factor and the disease under study.
(T) Bias could be due to problems in the selection of the population to be studied.
(F) Bias can be prevented or minimized by taking a larger sample.
(T) Bias can be classified in two major types: selection bias and information bias.
2. A study to assess the association of diabetes and smoking compares a group of hospitalizedindividuals with diabetes and a group of volunteer individuals without diabetes that areemployees of the same hospital where the cases were identified. The results from this studyreported, for the first time in the literature, a strong association between diabetes andsmoking. The magnitude of this association is likely to be due to (Check all that apply):
a. Recall bias
b. Berkson’s bias (X)
c. Publicity bias
d. Nonresponse bias (X)
e. Interviewer bias
3. An investigator would like to assess the association of melanoma (skin cancer) and expo-sure to infrared skin tanning services by using a hospital-based case-control study.Hospitalized individuals with melanoma will be compared to hospitalized patients withoutmelanoma (controls). This hospital is located in a low-income area of the city and isfamous nationwide for its expertise in melanoma; individuals with melanoma (cases) fromall over the country go to that hospital to get the highest quality care that can be provid-ed. However, this hospital is not as well known for other medical conditions. Therefore,
35
Observational Studies and Bias in Epidemiology
Copyright © 2004. All rights reserved.

cases would come from all over the country and controls will be mostly local low-incomeindividuals. The investigator predicts that an overestimation of the association betweenmelanoma and skin tan services may occur.
Please label the following statements as true (T) or false (F) regarding this study.
(F) The investigator is wrong, an underestimation of the association is more likely to occur.
(F) The results of this study is likely to be influenced by nonresponse bias.
(T) The results of this study is likely to be influenced by Berkson’s bias.
(F) Recall bias is likely to be present in this study.
(F) Bias caused by misclassification of the outcome (namely melanoma) is likely to be a majorproblem.
36
Observational Studies and Bias in Epidemiology
Copyright © 2004. All rights reserved.