observational data and clinical trials - the university of ...colesr/epidemiology.nurses.pdf ·...
TRANSCRIPT
EDITORIAL
Observational Data and Clinical TrialsNarrowing the Gap?
Allen Wilcox and Sholom Wacholder
One of the signal events in epidemiology in the last decade is a mammoth randomizedtrial that failed to confirm an established epidemiologic finding. The observational
finding was the protection provided by hormone replacement therapy against cardiovas-cular disease, and the trial was of course the Women’s Health Initiative.1 A protectiveeffect had been consistently observed in cohort studies, supported by clinical evidence,and trusted by physicians and millions of their patients. According to the clinical trial,mortality from cardiovascular disease among the treated was, in fact, worse.
In this issue of Epidemiology we publish an ambitious paper by Hernan (who alsoserves as one of our editors) et al,2 in which a new analysis of the Nurses’ Health Studyprovides results consistent with the randomized trial. This paper is followed by 3commentaries (by Hoover,3 Stampfer,4 and Prentice5) and responses from the authors.6,7
The questions raised are fundamental, and the stakes are high. Do the methods ofHernan et al narrow the gap between cohort studies and clinical trials? Have moreconventional analyses of cohort studies been misleading? How much of the discrepancybetween the trial and the cohort results is due to differences in study setting andpopulations, to differences in handling discontinuation of replacement hormones, or todifferences in the scientific and clinical questions being asked?
Readers be forewarned: these papers lay open a controversy that will not quickly beresolved. The fact that the authors chose to respond in 2 separate rejoinders shows howdeeply the controversy extends. The relation of randomized trials and observationalstudies has long been fertile territory for methodologic discussion. Is this new reanalysisa distracting detour, or does it augur a change in the way we do our work?
REFERENCES1. Writing Group for the Women’s Health Initiative Investigators.Risks and benefits of estrogen plus progestin
in healthy postmenopausal women. Principal results from the Women’s Health Initiative randomizedcontrolled trial. JAMA. 2002;288:321–333.
2. Hernan MA, Alonso A, Logan R, et al. Observational studies analyzed like randomized experiments: anapplication to postmenopausal hormone therapy and coronary heart disease. Epidemiology. 2008;19:766–779.
3. Hoover R. The sound and the fury: was it all worth it? Epidemiology. 2008;19:780–782.4. Stampfer MA. “Intention to treat” for observational data—worst of both worlds? Epidemiology. 2008;19:
783–784.5. Prentice R. Data analysis methods and the reliability of analytic epidemiologic research. Epidemiology.
2008;19:785–788.6. Hernan MA, Robins JM. Author response part 1: observational studies analyzed like randomized experi-
ments–Best of both worlds. Epidemiology. 2008;19:789–792.7. Willett WC. Author response part 2. Epidemiology. 2008;19:793.
Epidemiology • Volume 19, Number 6, November 2008 765

ORIGINAL ARTICLE
Observational Studies Analyzed LikeRandomized Experiments
An Application to Postmenopausal Hormone Therapyand Coronary Heart Disease
Miguel A. Hernan,a,b Alvaro Alonso,c Roger Logan,a Francine Grodstein,a,d Karin B. Michels,a,d,e
Walter C. Willett,a,d,f JoAnn E. Manson,a,d,g and James M. Robinsa,h
Background: The Women’s Health Initiative randomized trialfound greater coronary heart disease (CHD) risk in women assignedto estrogen/progestin therapy than in those assigned to placebo.Observational studies had previously suggested reduced CHD risk inhormone users.Methods: Using data from the observational Nurses’ Health Study,we emulated the design and intention-to-treat (ITT) analysis of therandomized trial. The observational study was conceptualized as asequence of “trials,” in which eligible women were classified asinitiators or noninitiators of estrogen/progestin therapy.Results: The ITT hazard ratios (HRs) (95% confidence intervals) ofCHD for initiators versus noninitiators were 1.42 (0.92–2.20) for thefirst 2 years, and 0.96 (0.78–1.18) for the entire follow-up. The ITTHRs were 0.84 (0.61–1.14) in women within 10 years of menopause,and 1.12 (0.84–1.48) in the others (P value for interaction � 0.08).These ITT estimates are similar to those from the Women’s HealthInitiative. Because the ITT approach causes severe treatment mis-classification, we also estimated adherence-adjusted effects by in-verse probability weighting. The HRs were 1.61 (0.97–2.66) for thefirst 2 years, and 0.98 (0.66–1.49) for the entire follow-up. The HRswere 0.54 (0.19–1.51) in women within 10 years after menopause,and 1.20 (0.78–1.84) in others (P value for interaction � 0.01). We
also present comparisons between these estimates and previouslyreported Nurses’ Health Study estimates.Conclusions: Our findings suggest that the discrepancies betweenthe Women’s Health Initiative and Nurses’ Health Study ITT esti-mates could be largely explained by differences in the distribution oftime since menopause and length of follow-up.
(Epidemiology 2008;19: 766–779)
Causal inferences are drawn from both randomized exper-iments and observational studies. When estimates from
both types of studies are available, it is reassuring to find thatthey are often similar.1–3 On the other hand, when random-ized and observational estimates disagree, it is tempting toattribute the differences to the lack of random treatmentassignment in observational studies.
This lack of randomization makes observational effectestimates vulnerable to confounding bias due to the differentprognosis of individuals between treatment groups. The po-tential for confounding may diminish the enthusiasm forother desirable features of observational studies comparedwith randomized experiments–greater timeliness, less restric-tive eligibility criteria, longer follow-up, and lower cost.However, even though randomization is the defining differencebetween randomized experiments and observational studies,further differences in both design and analysis are common-place. As a consequence, observational-randomized discrepan-cies cannot be automatically attributed to randomization itself.
In this paper we assess the extent to which differencesother than randomization contribute to discrepant observationalversus randomized effect estimates in the well-known exampleof postmenopausal estrogen plus progestin therapy and the riskof coronary heart disease (CHD). Specifically, we explore dis-crepancies attributable to different distributions of time sincemenopause, length of follow-up, and analytic approach.
The published findings on this topic can be briefly sum-marized as follows. Large observational studies suggested areduced risk of CHD among postmenopausal hormone users.
Submitted 11 January 2008; accepted 30 May 2008.From the aDepartment of Epidemiology, Harvard School of Public Health,
Boston, Massachusetts; bHarvard-MIT Division of Health Sciences andTechnology, Boston Massachusetts; cDivision of Epidemiology andCommunity Health, School of Public Health, University of Minnesota,Minneapolis, Minnesota; dChanning Laboratory, Department of Medi-cine and eObstetrics and Gynecology Epidemiology Center, Brigham andWomen’s Hospital, Harvard Medical School, Boston, Massachusetts;fDepartment of Nutrition, Harvard School of Public Health, Boston,Massachusetts; gDivision of Preventive Medicine, Brigham andWomen’s Hospital, Harvard Medical School, Boston, Massachusetts; andhDepartment of Biostatistics, Harvard School of Public Health, Boston,Massachusetts.
This work was supported by National Institutes of Health grants HL080644and CA87969.
Editors’ note: Commentaries on this article appear on pages xxx, xxx, xxx.Correspondence: Miguel Hernan, Department of Epidemiology, Harvard
School of Public Health, 677 Huntington Avenue, Boston, MA. E-mail:[email protected].
Copyright © 2008 by Lippincott Williams & WilkinsISSN: 1044-3983/08/1906-0766DOI: 10.1097/EDE.0b013e3181875e61
Epidemiology • Volume 19, Number 6, November 2008766
Two of the largest observational studies were based on theNurses’ Health Study (NHS)4,5 in the United States and on theGeneral Practice Research Database6 in the United Kingdom.More recently, the Women’s Health Initiative (WHI) random-ized trial7 found a greater incidence of coronary heart diseaseamong postmenopausal women in the estrogen plus progestinarm than in the placebo arm (68% greater in the first 2 years afterinitiation, 24% greater after an average of 5.6 years).8,9
The present paper does not address the complex clinicaland public health issues related to hormone therapy, includ-ing risk-benefit considerations. Rather, we focus on method-ologic issues in the analysis of observational cohort studies.Specifically, we reanalyze the NHS observational data toyield effect estimates of hormone therapy that are directlycomparable with those of the randomized WHI trial exceptfor the fact that hormone therapy was not randomly assignedin the NHS. We do this by mimicking the design of therandomized trial as closely as possible in the NHS. Asexplained below, our approach requires conceptualizing theobservational NHS cohort as if it were a sequence of nonran-domized trials. Because the randomized trial data were analyzedunder the intention-to-treat (ITT) principle, we analyze our NHStrials using an observational analog of ITT (see below).
A recent reanalysis of the General Practice ResearchDatabase using this strategy could not adjust for lifestylefactors and it yielded wide confidence intervals (CI).10 Fur-ther, the estrogen used by women in that study was not theconjugated equine estrogen used by the women in the NHSand WHI studies. Our analysis of the NHS data incorporateslifestyle factors and includes women using the same type ofestrogen as in the WHI randomized trial.
METHODS
The Observational Cohort as aNonrandomized “Trial”
The NHS cohort was established in 1976 and com-prised 121,700 female registered nurses from 11 US states,aged 30 to 55 years. Participants have received biennialquestionnaires to update information on use, duration (1–4,5–9, 10–14, 15–19, 20–24 months), and type of hormonetherapy during the 2-year interval. Common use of oralestrogen plus progestin therapy among NHS participantsbegan in the period between the 1982 and the 1984 question-naires. The questionnaires also record information on poten-tial risk factors for and occurrence of major medical events,including CHD (nonfatal myocardial infarction or fatal cor-onary disease). The process for confirming CHD endpointshas been described in detail elsewhere.4
We mimicked the WHI trial by restricting the studypopulation to postmenopausal women who in the 1982 ques-tionnaire had reported no use of any hormone therapy duringthe prior 2-year period (“washout” period), and in the 1984questionnaire reported either use of oral estrogen plus progestin
therapy (“initiators”) or no use of any hormone therapy (“non-initiators”) during the prior 2-year period. Thus, as in the WHI,the initiator group includes both first-time users of hormonetherapy and reinitiators (who stopped hormone therapy in 1980or earlier and then reinitiated use in the period 1982–1984).
Women were followed from the start of follow-up todiagnosis of CHD, death, loss to follow-up, or June 2000,whichever occurred first. Unlike in the randomized WHI andthe observational General Practice Research Database, thetime of therapy initiation–and thus the most appropriate timeof start of follow-up for initiators–was not known withprecision in the NHS, and so we needed to estimate it. Forwomen who reported hormone therapy initiation during the2-year period before the 1984 questionnaire and were stillusing it at the time they completed this questionnaire, the startof follow-up was estimated as the month of return of thebaseline questionnaire minus the duration of hormone therapyuse (duration is reported as an interval, eg, 20–24 months; weused the upper limit of the interval, eg, 24 months). Forwomen who reported starting hormone therapy during thesame 2-year period but had stopped using it by the time theyreturned the 1984 questionnaire, the start of follow-up wasestimated as the first month of the 2-year period (the earliestpossible month of initiation). The start of follow-up fornoninitiators was estimated as the average month of start offollow-up among initiators (stratified by age and past use ofhormone therapy). Alternative methods to estimate the startof follow-up had little effect on our estimates (Appendix A1).
To further mimic the WHI, we restricted the studypopulation to women who, before the start of follow-up, hada uterus, no past diagnosis of cancer (except nonmelanomaskin cancer) or acute myocardial infarction, and no diagnosisof stroke since the return of the previous questionnaire. Toenable adjustment for dietary factors, we restricted the pop-ulation to women who had reported plausible energy intakes(2510–14,640 kJ/d) and had left fewer than 10 of 61 fooditems blank on the most recent food frequency questionnairebefore the 1984 questionnaire.
The NHS cohort study can now be viewed as a non-randomized, nonblinded “trial” that mimics the eligibilitycriteria, definition of start of follow-up, and treatment arms(initiators vs. noninitiators) of the WHI randomized trial, butwith a different distribution of baseline risk factors (eg, lowerage and shorter time since menopause in the NHS comparedwith the WHI). We analyzed the NHS nonrandomized “trial”by comparing the CHD risk of initiators and noninitiatorsregardless of whether these women subsequently stopped orinitiated therapy. Thus our analytic approach is the observa-tional equivalent of the ITT principle that guided the mainanalysis of the WHI trial. Specifically, we estimated the averagehazard (rate) ratio (HR) of CHD in initiators versus noninitiators,and its 95% CI, by fitting a Cox proportional hazards model,with “time since beginning of follow-up” as the time variable,
Epidemiology • Volume 19, Number 6, November 2008 Observational Studies Analyzed Like Randomized Experiments
© 2008 Lippincott Williams & Wilkins 767
that included a non time-varying indicator for hormone therapyinitiation. The Cox model was stratified on age (in 5-yearintervals) and history of use of hormone therapy (yes, no).
To obtain valid effect estimates in a nonrandomizedtrial, all baseline confounders have to be appropriately mea-sured and adjusted for in the analysis. We proceeded as if thiscondition was at least approximately true in the NHS non-randomized “trial” once we added the following covariates tothe Cox model: parental history of myocardial infarctionbefore age 60 (yes, no), education (graduate degree: yes, no),husband’s education (less than high school, high schoolgraduate, college, graduate school), ethnicity (non-Hispanicwhite, other), age at menopause (�50, 50–53, �53), calendartime, high cholesterol (yes, no), high blood pressure (yes, no),diabetes (yes, no), angina (yes, no), stroke (yes, no), coronaryrevascularization (yes, no), osteoporosis (yes, no), body massindex (�23, 23-�25, 25-�30, �30), cigarette smoking(never, past, current 1–14 cigarettes per day, current 15–24cigarettes per day, current �25 cigarettes per day), aspirinuse (nonuse, 1–4 years, 5–10 years, �10 years), alcoholintake (0, �0-�5, 5-�10, 10-�15, �15 g/d), physical activ-ity (6 categories), diet score (quintiles),11 multivitamin use(yes, no), and fruit and vegetable intake (�3, 3-�5, 5-�10,�10 servings/d). When available, we simultaneously ad-justed for the reported value of each variable on both the 1982and 1980 questionnaires.
The Observational Cohort as a Sequence ofNonrandomized Nested “Trials”
The approach described above would produce veryimprecise ITT estimates if (as was the case) few women wereinitiators during the 1982–1984 period. However, our choiceof this period was arbitrary. The approach described abovecan produce an additional NHS nonrandomized “trial” whenapplied to each of the 8 2-year periods between 1982–1984and 1996–1998. Thus, as a strategy to increase the efficiencyof our ITT estimate, we conducted 7 additional nonrandom-ized “trials” each subsequent questionnaire (1986, 1988, . . .1998), and pooled all 8 “trials” into a single analysis. Becausesome women participated in more than one of these NHS“trials” (up to a maximum of 8), we used a robust varianceestimator to account for within-person correlation. We as-sessed the potential heterogeneity of the ITT effect estimatesacross “trials” by 2 Wald tests: first, we estimated a separateparameter for therapy initiation in each “trial” and tested forheterogeneity of the parameters (�2; 6 df), and then wecalculated a product term (for the indicators of “trial” andtherapy initiation), testing for whether the product term wasdifferent from 0 (�2; 1 df).
In each “trial,” we used the corresponding question-naire information to apply the eligibility criteria at the start offollow-up, and to define initiators and noninitiators. We thenestimated the CHD average HR in initiators versus nonini-tiators (adjusted for the values of covariates reported in the 2
previous questionnaires), regardless of whether these womensubsequently stopped or initiated therapy. To allow for thepossibility that the HR varied with time since baseline, weadded product terms between time of follow-up (linear andquadratic terms) and initiation status to a pooled logisticmodel that approximated our previous Cox model. We thenused the fitted model to estimate CHD-free survival curvesfor initiators and noninitiators.
The subset of women considered for eligibility in each“trial” is approximately nested in the subset of women whowere considered for eligibility in the prior “trial.” Our con-ceptualization of an observational study with a time-varyingtreatment as a sequence of nested “trials,” each with nontime-varying treatment, is a special case of g-estimation of nestedstructural models.12
Several lines of evidence suggest a modification of theeffect of hormone therapy by time of initiation.13 We there-fore conducted stratified analyses by time since menopause(�10, �10 years) and age (�60, �60 years). We computedP values for “interaction” between hormone therapy andyears since menopause by adding a single product term(indicator for hormone therapy times indicator for �10 yearssince menopause) to the model for the overall HR, and thentesting the hypothesis that its coefficient was equal to zero. Aless powerful alternative strategy, testing for heterogenity ofthe HR estimated from separate models for women �10 yearsand for women �10 years since menopause, resulted in P �0.15 in all analyses.
Adherence-Adjusted Effect EstimatesBecause the primary analysis of the WHI randomized
trial was conducted under the ITT principle, we analyzed ourNHS “trials” using an observational analog of ITT to com-pare the NHS with the WHI estimates. However, ITT esti-mates are problematic because the magnitude of the ITTeffect varies with the proportion of subjects who adhere to theassigned treatment, and thus ITT comparisons can underes-timate the effect that would have been observed if everyonehad adhered to the assigned treatment. Thus, ITT effectestimates may be unsatisfactory when studying the efficacy,and inappropriate when studying the safety, of an activetreatment compared with no treatment. An alternative to theITT effect is the effect that would have been observed ifeveryone had remained on her initial treatment throughout thefollow-up, which we refer to as an adherence-adjusted effect.Under additional assumptions, consistent adherence-adjustedeffect estimates can be obtained in both randomized experi-ments and observational studies by using g-estimation14,15 orinverse probability weighting.
We used inverse probability weighting to estimate theadherence-adjusted HR of CHD. In each NHS “trial” wecensored women when they discontinued their baseline treat-ment (either hormone therapy or no hormone therapy), andthen weighted the uncensored women months by the inverse
Hernan et al Epidemiology • Volume 19, Number 6, November 2008
© 2008 Lippincott Williams & Wilkins768

of their estimated probability of remaining uncensored untilthat month.16 To estimate “trial”-specific probabilities foreach woman, we fit a pooled logistic model for the probabil-ity of remaining on the baseline treatment through a givenmonth. The model included the baseline covariates used inthe “trial”-specific Cox models described previously, and themost recent postbaseline values of the same covariates. In-clusion of time-dependent covariates is necessary to adjustfor any dependence between noncompliance and CHD withinlevels of baseline covariates. We fit separate models forinitiators and noninitiators. In each “trial,” each womancontributed as many observations to the model as the numberof months she was on her baseline therapy.
To stabilize the inverse probability weights, we multi-plied the weights by the probability of censoring given thetrial-specific baseline values of the covariates. Weight stabi-lization improves precision by helping to reduce randomvariability. If the true adherence-adjusted HR is constant overtime, this method produces valid estimates provided thatdiscontinuing the baseline treatment is unrelated to unmea-sured risk factors for CHD incidence within levels of thecovariates, and that the logistic model used to estimate theinverse probability weights is correctly specified. Whenthe adherence-adjusted HR changes with time since baseline,this method estimates a weighted average adherence-adjustedHR with time-specific weights proportional to the number ofuncensored CHD events occurring at each time. Thus, withheavy censoring due to lack of adherence, the early years offollow-up contribute relatively more weight than would be thecase without censoring. To more appropriately adjust for atime-varying HR, we also fit an inverse probability weightedCox model (approximated through a weighted pooled logisticmodel) that included product terms between time of follow-up(linear and quadratic terms) and initiation status. We then usedthe weighted model to estimate adherence-adjusted CHD-freesurvival curves for initiators and noninitiators.
We also present additional subsidiary analyses to ex-plain the relation between our estimates and previously re-ported NHS estimates, which can be regarded as estimates ofthe adherence-adjusted HR using an alternative to our inverseprobability weighting approach.
RESULTS
The NHS Nonrandomized “Trials”Of the 101,819 NHS participants alive and without a
history of cancer, heart disease, or stroke in 1984, 81,073 haddiet information and, of these, 77,794 were postmenopausalat some time during the follow-up. We excluded 14,764women who received a form of hormone therapy other thanoral estrogen plus progestin in all of the NHS “trials,” or didnot provide information on the type of hormone therapy inany of the “trials.” Of the remaining 63,030 women, weexcluded 17,146 who received hormone therapy in the 2
years before the baseline of all the “trials.” Of the remaining45,884 women, we excluded 11,309 who did not have anintact uterus in 1984. Thus 34,575 women met our eligibilitycriteria for at least one NHS “trial.” Of these women, 1035 hada CHD event, 2596 died of other causes or were lost to follow-up, and 30,944 reached June 2000 free of CHD. Figure 1 showsthe distribution of women by number of “trials” in which theyparticipated. Table 1 shows the number of participants, initiators,and CHD events per “trial.” Table 2 shows the distribution ofbaseline characteristics in initiators and noninitiators.
ITT Estimates of the Effect of HormoneTherapy on CHD
The estimated average HR of CHD for initiators versusnoninitiators was 0.96 (95% CI � 0.78–1.18) when the entirefollow-up time was included in the analysis (Table 3). TheHR was 1.83 (1.05–3.17) when the analysis was restricted tothe first year of follow-up, 1.42 (0.92–2.20) for the first 2years, 1.11 (0.84–1.47) for the first 5 years, and 1.00 (0.78–1.28) for the first 8 years. Equivalently, the HR was 0.96(0.66–1.39) during years 2–5, 0.81 (0.51–1.28) during years5–8, and 0.87 (0.58–1.30) after year 8. We did not find astrong indication of heterogeneity across trials (Wald tests Pvalues 0.24 and 0.15 for the overall HR). Figure 2A shows thatthe estimated proportion of women free of CHD during the first5 years of follow-up was lower in initiators of estrogen plusprogestin therapy than in noninitiators of hormone therapy. Byyear 8, however, this proportion was greater in initiators.
We next examined effect modification, stratifying ourITT estimates by age and time since menopause (Table 3). TheHR was 0.84 (CI � 0.61–1.14) in women within 10 years ofmenopause at baseline, and 1.12 (0.84–1.48) in the others (86%of initiators in this latter group initiated therapy 10 to 20 yearsafter menopause). Similarly, the HRs were 0.86 (0.65–1.14) inwomen under age 60 at baseline, and 1.15 (0.85–1.57) in theothers. Figure 2B, C shows the estimated proportion of womenfree of CHD by initiator status and time since menopause. TheP value from a log-rank test for the equality of the survivalcurves was 0.70 for the entire population, 0.27 for women within10 years of menopause, and 0.43 for the others.
When we repeated the analyses with no past use ofhormone therapy as an additional eligibility criterion (26,797
FIGURE 1. Distribution of eligible women by number ofNurses’ Health Study “trials” of hormone therapy initiation inwhich they participated.
Epidemiology • Volume 19, Number 6, November 2008 Observational Studies Analyzed Like Randomized Experiments
© 2008 Lippincott Williams & Wilkins 769
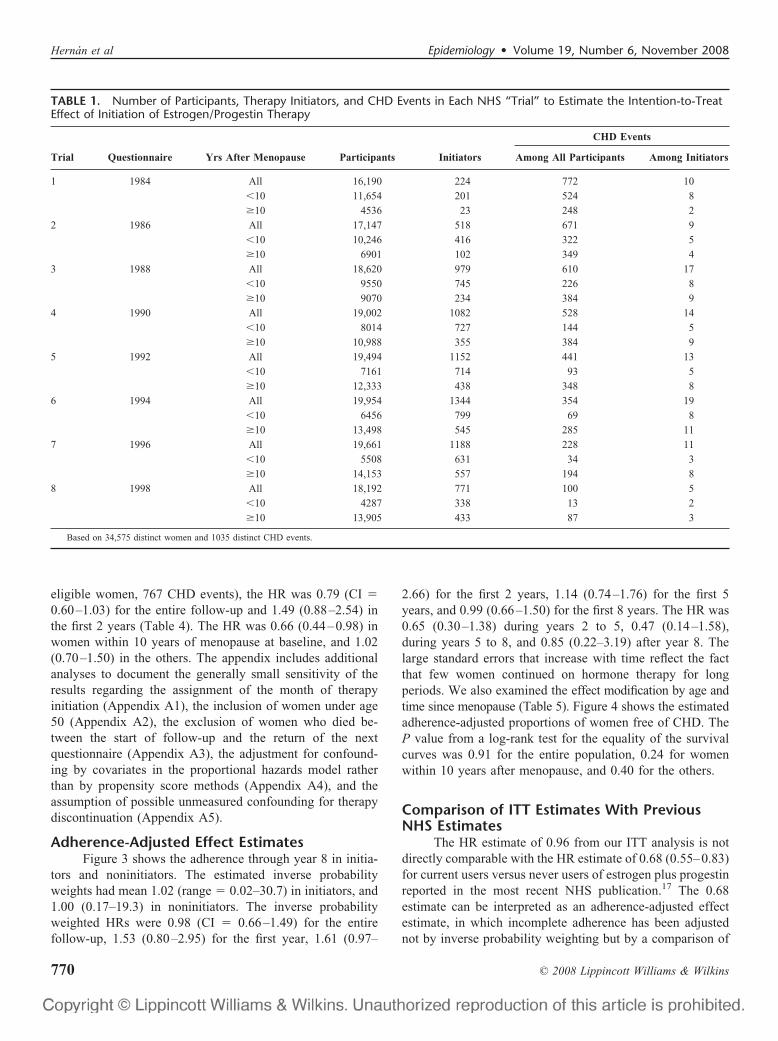
eligible women, 767 CHD events), the HR was 0.79 (CI �0.60–1.03) for the entire follow-up and 1.49 (0.88–2.54) inthe first 2 years (Table 4). The HR was 0.66 (0.44–0.98) inwomen within 10 years of menopause at baseline, and 1.02(0.70–1.50) in the others. The appendix includes additionalanalyses to document the generally small sensitivity of theresults regarding the assignment of the month of therapyinitiation (Appendix A1), the inclusion of women under age50 (Appendix A2), the exclusion of women who died be-tween the start of follow-up and the return of the nextquestionnaire (Appendix A3), the adjustment for confound-ing by covariates in the proportional hazards model ratherthan by propensity score methods (Appendix A4), and theassumption of possible unmeasured confounding for therapydiscontinuation (Appendix A5).
Adherence-Adjusted Effect EstimatesFigure 3 shows the adherence through year 8 in initia-
tors and noninitiators. The estimated inverse probabilityweights had mean 1.02 (range � 0.02–30.7) in initiators, and1.00 (0.17–19.3) in noninitiators. The inverse probabilityweighted HRs were 0.98 (CI � 0.66–1.49) for the entirefollow-up, 1.53 (0.80–2.95) for the first year, 1.61 (0.97–
2.66) for the first 2 years, 1.14 (0.74–1.76) for the first 5years, and 0.99 (0.66–1.50) for the first 8 years. The HR was0.65 (0.30–1.38) during years 2 to 5, 0.47 (0.14–1.58),during years 5 to 8, and 0.85 (0.22–3.19) after year 8. Thelarge standard errors that increase with time reflect the factthat few women continued on hormone therapy for longperiods. We also examined the effect modification by age andtime since menopause (Table 5). Figure 4 shows the estimatedadherence-adjusted proportions of women free of CHD. TheP value from a log-rank test for the equality of the survivalcurves was 0.91 for the entire population, 0.24 for womenwithin 10 years after menopause, and 0.40 for the others.
Comparison of ITT Estimates With PreviousNHS Estimates
The HR estimate of 0.96 from our ITT analysis is notdirectly comparable with the HR estimate of 0.68 (0.55–0.83)for current users versus never users of estrogen plus progestinreported in the most recent NHS publication.17 The 0.68estimate can be interpreted as an adherence-adjusted effectestimate, in which incomplete adherence has been adjustednot by inverse probability weighting but by a comparison of
TABLE 1. Number of Participants, Therapy Initiators, and CHD Events in Each NHS “Trial” to Estimate the Intention-to-TreatEffect of Initiation of Estrogen/Progestin Therapy
Trial Questionnaire Yrs After Menopause Participants Initiators
CHD Events
Among All Participants Among Initiators
1 1984 All 16,190 224 772 10
�10 11,654 201 524 8
�10 4536 23 248 2
2 1986 All 17,147 518 671 9
�10 10,246 416 322 5
�10 6901 102 349 4
3 1988 All 18,620 979 610 17
�10 9550 745 226 8
�10 9070 234 384 9
4 1990 All 19,002 1082 528 14
�10 8014 727 144 5
�10 10,988 355 384 9
5 1992 All 19,494 1152 441 13
�10 7161 714 93 5
�10 12,333 438 348 8
6 1994 All 19,954 1344 354 19
�10 6456 799 69 8
�10 13,498 545 285 11
7 1996 All 19,661 1188 228 11
�10 5508 631 34 3
�10 14,153 557 194 8
8 1998 All 18,192 771 100 5
�10 4287 338 13 2
�10 13,905 433 87 3
Based on 34,575 distinct women and 1035 distinct CHD events.
Hernan et al Epidemiology • Volume 19, Number 6, November 2008
© 2008 Lippincott Williams & Wilkins770

current versus never users. This approach is used in manylarge observational cohorts, including the NHS (see “Discus-sion” for details). Table 6 shows the cumulative steps that linkour estimates in Table 3 with the previously reported NHSestimate. These steps involve changes in the start of follow-up,the definition of the exposed and unexposed group, the covari-ates used for adjustment, and eligibility criteria.
Column i of Table 6 shows the estimates when (as inprevious NHS analyses) the start of follow-up, and thus the“baseline,” of each trial was redefined as the date of return of thequestionnaire. When “baseline” is modified in this way, theselected group of initiators differs from the initiator group inTable 3 because it does not include women who, during the2-year interval before “baseline,” either initiated and stoppedhormone therapy or survived a CHD event occurring afterinitiation. As in Table 3, we provide separate HR estimatesfor the entire follow-up (0.84), the first 2 years of follow-up(0.98), and the period after the first 2 years (0.80).
Second, we varied the definition of the user and non-user groups in 3 steps as shown in the next 3 columns ofTable 6. In column ii we eliminated our “trial”-specificcriterion of no therapy in the 2 years before “baseline” forinitiators; that is, we compared current users with noninitia-
TABLE 2. Baseline Characteristics of Initiators andNoninitiators of Estrogen/Progestin Therapy in theNHS “Trials”
Initiators(n � 7258)
Noninitiators(n � 141,002)
Age (y); mean (SD) 59.0 (5.8) 61.9 (6.0)Age at menopause (y)
�50 39.2 40.050–53 46.6 46.7�53 14.3 13.4
Years since menopause; mean (SD) 9.0 (5.8) 12.2 (6.3)�10 y since menopause 63.0 41.4Past use of hormone therapy 32.0 22.6Non-Hispanic white 94.6 94.0Graduate degree 11.7 7.5Husband’s education
Less than high school 4.8 8.5High school graduate 36.4 42.8College 29.9 27.3Graduate school 29.0 21.4
Parental history of MI before age 60 18.5 17.1High cholesterol 35.6 32.1High blood pressure 27.3 33.3Diabetes 3.5 5.3Angina 2.1 2.6Stroke 0.3 0.7Coronary revascularization 0.7 0.7Osteoporosis 6.8 6.2Multivitamin use 44.7 41.8Cigarette smoking
Never 41.8 42.0Past 42.0 36.1Current 16.2 22.0
Alcohol intake (g/d)0 31.7 38.10.1–4.9 33.7 31.05.0–9.9 12.0 9.910.0–14.9 9.9 9.3�15 12.7 11.7
Diet score in the 2 upper quintiles 41.6 35.3Fruit and vegetable intake (servings/d)
�3 57.9 57.83–4.9 29.0 29.05–9.9 12.5 12.3�10 0.5 0.8
Body mass index (kg/m2)�25 56.2 49.325–29.9 29.9 32.1�30 13.8 18.7
Aspirin useNonuse 21.9 26.71–4 y 18.1 18.95–10 y 19.5 15.9�10 y 40.6 38.5
Physical activity (h/wk)�1 43.2 47.11–1.9 15.4 15.32–3.9 19.8 18.94–5.9 10.6 9.46–9.9 7.4 6.6�10 3.6 3.0
Results are expressed as percentages unless otherwise indicated.
TABLE 3. Estimates of the Intention-to-Treat Effect ofInitiation of Estrogen/Progestin Therapy on the Incidence ofCHD Events in the NHS “Trials”
All
Follow-Up Period
0–24 Mo >24 Mo
Initiators
Total no. 7258 7258 7221
No. CHD events 98 22 76
Noninitiators
Total no. 141,002 141,002 139,599
No. CHD events 3606 512 3094
HR (95% CI) HR (95% CI) HR (95% CI)
All women 0.96 (0.78–1.18) 1.42 (0.92–2.20) 0.88 (0.69–1.12)
By time aftermenopause (y)
�10 0.84 (0.61–1.14) 1.33 (0.66–2.64) 0.77 (0.54–1.09)
�10 1.12 (0.84–1.48) 1.48 (0.83–2.64) 1.05 (0.77–1.43)
P for interaction 0.08 0.90 0.07
By age (y)
�60 0.86 (0.65–1.14) 1.36 (0.73–2.52) 0.78 (0.57–1.07)
�60 1.15 (0.85–1.57) 1.49 (0.79–2.80) 1.08 (0.76–1.54)
P for interaction 0.05 0.72 0.06
Adjusted for the following baseline variables: age, parental history of myocardialinfarction before age 60, education, husband’s education, ethnicity, age at menopause,calendar month, high cholesterol, high blood pressure, diabetes, angina, stroke, coronaryrevascularization, osteoporosis, body mass index, cigarette smoking, aspirin use, alcoholintake, physical activity, diet score, multivitamin use, fruits and vegetables intake, andprevious use of hormone therapy. The last column is restricted to women who were stillat risk after the first 2 years of follow-up of the corresponding trial.
Epidemiology • Volume 19, Number 6, November 2008 Observational Studies Analyzed Like Randomized Experiments
© 2008 Lippincott Williams & Wilkins 771

tors. In column iii we eliminated our “trial”-specific criterionof no therapy in the 2 years before “baseline” for all women;that is, we compared current users with current nonusers. Incolumn iv we used as the comparison group the subset ofnonusers with no history of hormone therapy use; that is, wecompared current users with never users as in previous NHSanalyses. The HR estimates for columns ii, iii, iv were,respectively, 0.84, 0.86, 0.85 for the entire follow-up, 0.77,0.77, 0.74 for 0 to 24 months, and 0.87, 0.90, 0.90 for �24months.
To explain why the number of exposed cases (n � 319)in columns ii to iv far exceeds the number (n � 66) in columni, consider a woman who is continuously on hormone therapyfrom 1982–1984 until she dies of CHD just before the end offollow-up in 2000. In the analysis of column i, this womanparticipates as an exposed CHD case in the first (1984) “trial”only. In contrast, in the analyses of columns ii to iv, the samewoman participates as an exposed CHD case in each of the 8“trials” 1984–1998. Furthermore, in the analysis of column i,the woman would contribute 0 to the 0- to 24-month exposedcase stratum and 1 to the �24-month exposed case stratum.In contrast, the same woman in the analyses of columns ii to
iv would contribute 1 to the 0- to 24-month exposed casestratum (corresponding to the 1998 “trial”) and 7 to the�24-month exposed case stratum (corresponding to each ofthe other 7 “trials”).
Third, we repeated the analysis in column iv afteradjusting for the set of covariate values used in the mostrecent NHS publication. Thus, the estimates in columnv—0.81 for the entire follow-up, 0.71 for 0 to 24 months, and0.85 for �24 months—were adjusted for the most recentvalues available at the time of return of the “baseline”questionnaire, rather than the most recent values available atthe 2 previous questionnaires.
FIGURE 2. Proportion of women free of CHD by baselinetreatment group in the Nurses’ Health Study “trials.”
TABLE 4. Estimates of the Intention-to-Treat Effect ofInitiation of Estrogen/Progestin Therapy on the Incidence ofCHD Events Among Women With No History of HormoneUse in the NHS “Trials”
All
Follow-Up Period
0–24 Mo >24 Mo
Initiators
Total no. 4939 4939 4914
No. CHD events 55 15 40
Noninitiators
Total 109,205 109,205 108,108
No. CHD events 2723 379 2344
HR (95% CI) HR (95% CI) HR (95% CI)
All women 0.79 (0.60–1.03) 1.49 (0.88–2.54) 0.68 (0.49–0.93)
By time aftermenopause (y)
�10 0.66 (0.44–0.98) 1.32 (0.58–3.03) 0.58 (0.37–0.90)
�10 1.02 (0.70–1.50) 1.71 (0.85–3.45) 0.88 (0.56–1.38)
P for interaction 0.09 0.51 0.15
By age (y)
�60 0.68 (0.48–0.97) 1.38 (0.66–2.88) 0.59 (0.39–0.88)
�60 1.06 (0.69–1.64) 1.64 (0.73–3.69) 0.93 (0.56–1.56)
P for interaction 0.10 0.69 0.13
Adjusted for same baseline variables as in Table 3.
FIGURE 3. Proportion of women who adhered to their baselinetreatment in the Nurses’ Health Study “trials.”
Hernan et al Epidemiology • Volume 19, Number 6, November 2008
© 2008 Lippincott Williams & Wilkins772

Fourth, we repeated the analysis in column v afterdropping the requirement of an intact uterus, which was notused in previous NHS analyses. The estimates in column viwere 0.82 for the entire follow-up, 0.67 for 0 to 24 months,and 0.87 for �24 months. The estimate 0.67 in the row 0 to24 months corresponds almost exactly to the analytic ap-proach used in the most recent NHS publication,17 which
estimated the HR over the 2-year period after the reclassifi-cation (ie, updating) of treatment status at the return of eachquestionnaire.
DISCUSSIONWe used the NHS observational data to emulate the
design and analysis of the WHI randomized trial. The ITTHRs of CHD for therapy initiation were 1.42 (95% CI �0.92–2.20) in the NHS vs. 1.68 (95% CI � 1.15–2.45) in theWHI9 during the first 2 years, and 1.00 (0.78–1.28) in theNHS versus approximately 1.24 (0.97–1.60) in the WHI8
during the first 8 years. However, much of the apparentWHI-NHS difference disappeared after stratification by timesince menopause at hormone therapy initiation. The ITT HRswere 0.84 (0.61–1.14) in the NHS versus 0.88 (0.54–1.43) inthe WHI8,18 for women within 10 years after menopause, andapproximately 1.12 (0.84–1.48) in the NHS versus 1.23(0.85–1.77) in the WHI8,18 for women between 10 and 20years after menopause.
These findings provide additional support to the hy-pothesis that hormone therapy may increase the long-termCHD risk only in women who were 10 or more years aftermenopause at initiation,17,19 and to the rationale for anongoing randomized clinical trial to determine the effect ofestrogen plus progestin on coronary calcification inyounger women.20 When the analyses were limited to womenwith no history of hormone use, the ITT HR was 0.79 (0.60–1.03) for the entire follow-up and 0.66 (0.44–0.98) for womenwho initiated hormone use within 10 years of menopause.
We computed average ITT HRs in the NHS for com-parison with the main result of the WHI. Our ITT estimatessuggest that any remaining differences between NHS andWHI estimates are not explained by unmeasured joint riskfactors for CHD and therapy discontinuation. However, theaverage ITT HR is not the ideal effect measure because thesurvival curves crossed during the follow-up in both the WHItrial and the NHS trials, and also because ITT estimates likethe ones shown here are generally attenuated toward the nulldue to misclassification of actual treatment. We addressed thefirst problem by estimating survival curves to first CHDevent, and the second problem by estimating these curvesunder full adherence (via inverse probability weighting).Therefore the adherence-adjusted survival curves of Figure 4provide the most appropriate summary of our results. It willbe of interest to compare these results with adherence-ad-justed curves (via inverse probability weighting) from theWHI when they become available. The curves suggest thatcontinuous hormone therapy causes a net reduction in CHDamong women starting therapy within 10 years of menopause,and a net increase among those starting later. However, either ofthese effects could be due to sampling variability.
Previously published NHS estimates17 compared thehazards of current versus never users over the 2-year period
TABLE 5. Estimates of the (Adherence-Adjusted) Effect ofContinuous Estrogen/Progestin Therapy Versus No HormoneTherapy on the Incidence of CHD Events in the NHS “Trials”
AllHR (95% CI)
Follow-Up Period
0–24 MoHR (95% CI)
>24 MoHR (95% CI)
All women 0.98 (0.66–1.45) 1.61 (0.97–2.66) 0.64 (0.35–1.15)
By time after menopause (y)
�10 0.54 (0.19–1.51) 1.21 (0.40–3.61) 0.14 (0.02–1.16)
�10 1.20 (0.78–1.84) 1.92 (1.09–3.39) 0.84 (0.45–1.56)
P for interaction 0.01 0.18 0.11
By age (y)
�60 0.78 (0.44–1.40) 1.65 (0.81–3.37) 0.45 (0.19–1.09)
�60 1.36 (0.81–2.29) 1.69 (0.86–3.32) 1.08 (0.50–2.36)
P for interaction 0.06 0.74 0.09
Adjusted for same baseline variables as in Table 3. In each “trial,” women werecensored when they discontinued their baseline treatment (either hormone therapy or nohormone therapy), and the uncensored women months were weighted by the inverse oftheir estimated probability of remaining uncensored until that month.
FIGURE 4. Proportion of women free of CHD under full adher-ence with the baseline treatment in the Nurses’ Health Study“trials.”
Epidemiology • Volume 19, Number 6, November 2008 Observational Studies Analyzed Like Randomized Experiments
© 2008 Lippincott Williams & Wilkins 773

after the updating of treatment status at the return of eachquestionnaire, and could thus be viewed as a form of adher-ence adjustment. In Table 6 we described the steps from our2-year ITT estimate to the previously published adherence-adjusted estimate. Below we discuss the 2 key steps: thechange of start of follow-up (time of therapy initiation vs.time of questionnaire return), and the change of the exposedgroup (selected initiators vs. current users).
The 2-year HR estimate changed from 1.42 (Table 3) to0.98 (Table 6, column i) during the first 2 years, and from0.96 (Table 3) to 0.84 (Table 6, column i) for the entirefollow-up when the definition of start of follow-up waschanged from the estimated time of therapy initiation to thetime of return of the next questionnaire (the latter definitionis commonly used in observational studies that collect treat-ment information at regular intervals). This latter definitionexcludes women who initiated treatment and then suffered anonfatal myocardial infarction during the interval between
treatment initiation and treatment ascertainment (up to 2years in the NHS). If hormone therapy increases the short-term risk of CHD, this exclusion will result in an underesti-mate of the early increase in risk and may result in selectionbias,16 which may explain part of the change from 1.42 to0.98. The impact of this exclusion bias, however, will bediluted over the entire follow-up, as previously suggestedin a sensitivity analysis,17 which may explain the smallerchange from 0.96 to 0.84. This exclusion bias may bequantified through simulations,21 reduced by stratificationof the analysis on duration of therapy at baseline,21 andeliminated by making the start of follow-up coincident with thetime of treatment initiation, as discussed by Robins22,23 andRay.24 The approach we present here and elsewhere10,25 gener-alizes Ray’s “new-users design” to the case of time-varyingtreatments.
The point estimate further changed from 0.98 (Table 6,column i) to 0.77 (column ii) when the definition of exposure
TABLE 6. Comparison of Several Alternative Hazard Ratio Estimates With the Previously Reported Estimate From the NHS(Column vi, Row 0–24 Mo)
Initiators vs.Noninitiatorsa
Selectedb
Initiators vs.Noninitiators
(i)
CurrentUsers vs.
Noninitiators(ii)
Current Usersvs. Nonusers
(iii)
Current Users vs. Never Users
(iv)
Covariates ofPrevious NHS
Analyses(v)
Not RequiringPresence of
Uterus(vi)
Entire Follow-upUsers
Total no. 7258 6400 41,441 41,441 41,441 41,441 45,793
No. CHD events 98 66 319 319 319 319 398
Nonusers
Total no. 141,002 141,316 141,316 173,094 126,235 126,235 147,045
No. CHD events 3606 3271 3271 3764 2778 2778 3404
All women 0.96 (0.78–1.18) 0.84 (0.64–1.09) 0.84 (0.67–1.06) 0.86 (0.70–1.06) 0.85 (0.68–1.07) 0.81 (0.65–1.01) 0.82 (0.68–0.99)
Time from menopause
�10 y 0.84 (0.61–1.14) 0.66 (0.45–0.98) 0.76 (0.57–1.02) 0.79 (0.60–1.03) 0.76 (0.57–1.01) 0.74 (0.56–0.98) 0.77 (0.59–1.00)
�10 y 1.12 (0.84–1.48) 1.05 (0.75–1.47) 0.95 (0.72–1.27) 0.95 (0.72–1.25) 0.92 (0.68–1.25) 0.90 (0.68–1.20) 0.89 (0.70–1.13)
P interaction 0.08 0.03 0.05 0.09 0.08 0.08 0.12
Age
�60 y 0.86 (0.61–1.14) 0.67 (0.47–0.97) 0.80 (0.61–1.05) 0.82 (0.64–1.06) 0.79 (0.60–1.03) 0.79 (0.60–1.05) 0.79 (0.62–1.01)
�60 y 1.15 (0.85–1.57) 1.14 (0.80–1.63) 0.92 (0.67–1.26) 0.94 (0.69–1.27) 0.93 (0.67–1.29) 0.83 (0.63–1.10) 0.86 (0.68–1.10)
P interaction 0.05 0.01 0.14 0.20 0.17 0.49 0.24
0–24 moCHD events
No. users 22 17 80 80 80 80 90
No. nonusers 512 660 660 755 542 542 666
HR (95% CI) 1.42 (0.92–2.20) 0.98 (0.60–1.60) 0.77 (0.60–0.99) 0.77 (0.60–0.98) 0.74 (0.57–0.95) 0.71 (0.55–0.91) 0.67 (0.54–0.85)
>24 moCHD events
No. users 76 49 239 239 239 239 308
No. nonusers 3094 2611 2611 3008 2236 2236 2738
HR (95% CI) 0.88 (0.69–1.12) 0.80 (0.60–1.08) 0.87 (0.68–1.12) 0.90 (0.72–1.14) 0.90 (0.70–1.15) 0.85 (0.67–1.08) 0.87 (0.71–1.07)
aFrom Table 3. Follow-up starts at time of therapy initiation. In all other columns follow starts at time of questionnaire return.bWomen who initiated and stopped therapy, or who survived a CHD event, between the time of therapy initiation and the time of questionnaire return are excluded.See main text for a description of each estimate.
Hernan et al Epidemiology • Volume 19, Number 6, November 2008
© 2008 Lippincott Williams & Wilkins774

changed from selected initiators to current users. These areestimates for different contrasts. The estimate in column i isbased on the exposed person-time during the 2-year periodimmediately after the return of the questionnaire in whichtherapy initiation was reported, and thus can be viewed as aflawed attempt to estimate the early effect of therapy initia-tion (see previous paragraph). The estimate in column ii,however, is based on the exposed person-time pooled over all2-year periods after the return of any questionnaire, and thuscan be interpreted as an attempt to estimate the effect oftherapy use during any 2-year period (that excludes theinterval between therapy initiation and return of the nextquestionnaire, as discussed in the previous paragraph). Morespecifically, the approach in column ii can be understood asan attempt to estimate adherence-adjusted effects by enteringthe current value of exposure and the joint predictors ofadherence and CHD as time-varying covariates in the modelfor CHD risk. Unlike inverse probability weighting, thisapproach to adherence adjustment requires that the time-dependent covariates not be strongly affected by prior treat-ment. This may be a reasonable assumption in the NHS. Thusthe estimates in column ii may be more usefully comparedwith a weighted average of our interval-specific adherenceadjusted estimates of 1.61 (0–2 years), 0.65 (2–5 years), 0.47(5–8 years), and 0.85 (�8 years) than to the estimate incolumn i.
In summary, our findings suggest that the discrepanciesbetween the WHI and NHS ITT estimates could be largelyexplained by differences in the distribution of time sincemenopause and length of follow-up. Residual confoundingfor the effect of therapy initiation in the NHS seems to playlittle role.
ACKNOWLEDGMENTSWe thank Murray Mittleman, Javier Nieto, Meir
Stampfer, and Alexander Walker for their comments on anearlier version of the manuscript.
REFERENCES1. Ioannidis JP, Haidich AB, Pappa M, et al. Comparison of evidence of
treatment effects in randomized and nonrandomized studies. JAMA.2001;286:821–830.
2. Benson K, Hartz AJ. A comparison of observational studies and ran-domized, controlled trials. N Engl J Med. 2000;342:1878–1886.
3. Concato J, Shah N, Horwitz RI. Randomized, controlled trials, obser-vational studies, and the hierarchy of research designs. N Engl J Med.2000;342:1887–1892.
4. Grodstein F, Stampfer M, Manson J, et al. Postmenopausal estrogen andprogestin use and the risk of cardiovascular disease �Erratum in: N EnglJ Med. 1996;335:1406�. N Engl J Med. 1996;335:453–461.
5. Grodstein F, Manson JE, Colditz GA, et al. A prospective, observationalstudy of postmenopausal hormone therapy and primary prevention ofcardiovascular disease. Ann Intern Med. 2000;133:933–941.
6. Varas-Lorenzo C, García-Rodríguez LA, Perez-Gutthann S, et al.Hormone replacement therapy and incidence of acute myocardial infarc-tion. Circulation. 2000;101:2572–2578.
7. The Women’s Health Initiative Study Group.Design of the women’shealth initiative clinical trial and observational study. Control ClinTrials. 1998;19:61–109.
8. Manson JE, Hsia J, Johnson KC, et al. Estrogen plus progestin and therisk of coronary heart disease. N Engl J Med. 2003;349:523–534.
9. Prentice RL, Pettinger M, Anderson GL. Statistical issues arising in theWomen’s Health Initiative. Biometrics. 2005;61:899–911.
10. Hernan MA, Robins JM, García Rodríguez LA. In discussion of:Prentice RL, Pettinger M, Anderson GL. Statistical issues arising in theWomen’s Health Initiative. Biometrics. 2005;61:922–930.
11. Stampfer MJ, Hu FB, Manson JE, et al. Primary prevention of coronaryheart disease in women through diet and lifestyle. N Engl J Med.2000;343:16–22.
12. Robins JM. The analysis of randomized and non-randomized AIDStreatment trials using a new approach to causal inference in longitudinalstudies. In: Sechrest L, Freeman H, Mulley A, eds. Health ServicesResearch Methodology: A Focus on AIDS: NCHRS, US. Washington,DC: Public Health Service;1989:113-159.
13. Mendelsohn ME, Karas RH. Hormone replacement therapy and theyoung at heart. N Engl J Med. 2007;356:2639–2641.
14. Mark SD, Robins JM. A method for the analysis of randomized trialswith compliance information: an application to the Multiple Risk FactorIntervention Trial. Control Clin Trials. 1993;14:79–97.
15. Cole SR, Chu H. Effect of acyclovir on herpetic ocular recurrence usinga structural nested model. Comtemp Clin Trials. 2005;26:300–310.
16. Hernan MA, Hernandez-Díaz S, Robins JM. A structural approach toselection bias. Epidemiology. 2004;15:615–625.
17. Grodstein F, Manson JE, Stampfer MJ. Hormone therapy and coronaryheart disease: the role of time since menopause and age at hormoneinitiation. J Women’s Health. 2006;15:35–44.
18. Manson JE, Bassuk SS. Invited commentary: hormone therapy and riskof coronary heart disease why renew the focus on the early years ofmenopause? Am J Epidemiol. 2007;166:511–517.
19. Grodstein F, Clarkson TB, Manson JE. Understanding the divergent dataon postmenopausal hormone therapy. N Engl J Med. 2003;348:645–650.
20. Harman SM, Brinton EA, Cedars M, et al. KEEPS: The Kronos EarlyEstrogen Prevention Study. Climacteric. 2005;8:3–12.
21. Prentice RL, Langer RD, Stefanick ML, et al. Combined postmeno-pausal hormone therapy and cardiovascular disease: toward resolvingthe discrepancy between observational studies and the women’s healthinitiative clinical trial. Am J Epidemiol. 2005;162:404–414.
22. Robins JM. A new approach to causal inference in mortality studies witha sustained exposure period — Application to the healthy workersurvivor effect �published errata appear in Math Model. 1987;14:917-921�. Math Model. 1986;7:1393–1512.
23. Robins JM. Addendum to “A new approach to causal inference inmortality studies with a sustained exposure period—application to thehealthy worker survivor effect” �published errata appear in ComputMath Appl. 1989:18;477�. Comput Math Appl. 1987;14:923–945.
24. Ray WA. Evaluating medication effects outside of clinical trials: new-user designs. Am J Epidemiol. 2003;158:915–920.
25. Alonso A, García Rodríguez LA, Logroscino G, et al. Gout and risk ofParkinson’s disease: a prospective study. Neurology. 2007;69:1696–1970.
26. Connely M, Richardson M, Platt R. Prevalence and duration of post-menopausal hormone replacement therapy use in a managed care orga-nization. J Gen Intern Med. 2000;15:542–50.
27. Robins JM, Rotnitzky A, Vansteelandt S. In discussion of: FrangakisCE, Rubin DB, An M, MacKenzie E. “Principal stratification designsto estimate input data missing due to death”. Biometrics. 2007;63:650-662.
28. Robins JM. Structural nested failure time models. In: Armitage P, ColtonT, eds. Survival Analysis. The Encyclopedia of Biostatistics. Chichester,UK: John Wiley and Sons; 1998:4372–4389.
29. Hernan MA, Cole SR, Margolick J, et al. Structural accelerated failuretime models for survival analysis in studies with time-varying treat-ments. Pharmacoepidemiol Drug Saf. 2005;14:477–491.
30. Robins JM, Blevins D, Ritter G, et al. G-estimation of the effect ofprophylaxis therapy for Pneumocystis carinii pneumonia on the survivalof AIDS patients �published errata appear in Epidemiology. 1993:4;189�.Epidemiology. 1992;3:319–336.
Epidemiology • Volume 19, Number 6, November 2008 Observational Studies Analyzed Like Randomized Experiments
© 2008 Lippincott Williams & Wilkins 775

APPENDIX: SENSITIVITY TO OUR ANALYTICCHOICES FOR THE NHS NONRANDOMIZED
TRIALSWe now describe the estimates from sensitivity analyses thatalter some of the decisions we made for the analyses shownin Table 3. The results from these sensitivity analyses indi-cate that these decisions had only a moderate influence on ourestimates.
Appendix A1: The Determination of Month ofTherapy Initiation
The duration of use of hormone therapy during a given2-year period is ascertained as a categorical variable with 5levels in the NHS questionnaires. Therefore any decisionsregarding the exact month of therapy initiation will result insome error. We explored the sensitivity of our estimates tothis error by conducting separate analyses in which we variedthe decisions used to obtain the estimates in Table 3. In theanalyses shown in Appendix Table 1, we used the latestpossible month of initiation as the month of therapy initiation.For example, if a woman on hormone therapy reported 15–19months of use during the 2-year period before the return ofthe baseline questionnaire, we calculated the month of initi-ation as the month of questionnaire return minus 19 in Table3, and minus 15 in Appendix Table 1.
Appendix A2: The Inclusion of Women OverAge 50
The WHI trial excluded women younger than 50 yearsat baseline. Appendix Tables 2 and 3 show, respectively, theITT and adherence-adjusted estimates when we added thisexclusion criterion to the eligibility criteria of our NHS “trials.”The ITT HRs (95% CIs) of CHD for initiators versus non-initiators were 0.99 (0.80–1.22) for the entire follow-up, 1.80(1.01–3.19) for the first year, 1.43 (0.92–2.23) for the first 2years, 1.13 (0.85–1.50) for the first 5 years, and 1.05 (0.82–1.34) for the first 8 years. The adherence-adjusted HRs (95%CIs) were 1.30 (0.76–2.21) for the entire follow-up, 1.61(0.84–3.08) for the first year, 1.71 (1.03–2.83) for the first 2years, 1.22 (0.80–1.88) for the first 5 years, and 1.35 (0.78–2.35) for the first 8 years. The HR (95% CI) was 0.69(0.32–1.48) during years 2–5, 1.73 (0.41–2.11) during years5–8, and 0.91 (0.17–4.83) after year 8.
Appendix A3: The Exclusion of Women WhoDied Between the Start of Follow-Up and theReturn of the Next Questionnaire
There are 2 reasons why the initiators in our analysiswere actually a selected group of all initiators. First, it ispossible that some short-term users of hormone therapy werenot detected in the NHS. Of note, the adherence of NHSwomen during the first year after initiation was higher thanthat previously found in other US26 and UK10 women, whichmight reflect a truly greater adherence of NHS women or the
APPENDIX TABLE 1. Estimates of the Intention-to-TreatEffect of Initiation of Estrogen/Progestin Therapy on theIncidence of CHD Events When Using the Latest PossibleMonth of Therapy Initiation in the NHS “Trials”
All
Follow-up Period
0–24 Mo >24 Mo
Initiators
Total no. 7245 7245 7165
No. CHD events 90 24 66
Noninitiators
Total no. 140,881 140,881 139,331
No. CHD events 3533 545 2988
HR (95% CI) HR (95% CI) HR (95% CI)
All women 0.92 (0.74–1.15) 1.49 (0.97–2.27) 0.81 (0.63–1.05)
By time after menopause (y)
�10 0.81 (0.59–1.12) 0.99 (0.44–2.20) 0.79 (0.55–1.12)
�10 1.06 (0.79–1.43) 1.84 (1.11–3.05) 0.88 (0.62–1.26)
P for interaction 0.11 0.20 0.35
By age (y)
�60 0.81 (0.60–1.09) 1.04 (0.51–2.10) 0.76 (0.55–1.07)
�60 1.13 (0.82–1.56) 1.98 (1.16–3.40) 0.93 (0.63–1.38)
P for interaction 0.04 0.11 0.22
Adjusted for same baseline variables as in Table 3.
APPENDIX TABLE 2. Estimates of the Intention-to-TreatEffect of Initiation of Estrogen/Progestin Therapy on theIncidence of CHD Events Among Women Aged 50 orMore at Baseline in the NHS “Trials”
All
Follow-up Period
0–24 Mo >24 Mo
Initiators
Total no. 6602 6602 6566
No. CHD events 94 21 73
Noninitiators
Total no. 135,877 135,887 134,491
No. CHD events 3503 503 3000
HR (95% CI) HR (95% CI) HR (95% CI)
All women 0.99 (0.80–1.22) 1.43 (0.92–2.23) 0.91 (0.72–1.16)
By time after menopause (y)
�10 0.88 (0.63–1.21) 1.28 (0.62–2.64) 0.81 (0.56–1.17)
�10 1.13 (0.85–1.49) 1.50 (0.84–2.68) 1.06 (0.77–1.44)
P for interaction 0.12 0.85 0.11
By age (y)
�60 0.89 (0.67–1.19) 1.36 (0.71–2.57) 0.82 (0.59–1.14)
�60 1.15 (0.85–1.57) 1.49 (0.79–2.80) 1.08 (0.77–1.53)
P for interaction 0.08 0.73 0.09
Adjusted for same baseline variables as in Table 3.
Hernan et al Epidemiology • Volume 19, Number 6, November 2008
© 2008 Lippincott Williams & Wilkins776

questionnaires’ inability to identify all short-term users. Sec-ond, both the initiators (and noninitiators) in our analysis didnot include women who died before returning the question-naire. The month of therapy initiation, if any, for women whodied between the start of follow-up and the return of the nextquestionnaire is unknown. As a result, these women were notincluded in our analyses in Table 3, which might have resultedin selection bias if the women who had a CHD event and diedbefore returning the questionnaire were more (or less) likely tohave initiated therapy than those who did not die. As an aside,because the analyses presented in columns i–vi of Table 6 usedthe date of return of the questionnaire as the start of follow-up,the number of women excluded for this reason is lower in Table6 than in Table 3. This explains why the number of CHD casesduring the first 2 years of follow-up is 534 in Table 3 and 677 incolumn i of Table 6.
We used inverse probability weighting16 to adjust forthe potential selection bias due to death before questionnairereturn. Specifically, we estimated the conditional probabilityof surviving until the return of the questionnaire for everywoman who, having had a CHD event during the 2-yearinterval prior to the baseline questionnaire, survived to returnthe questionnaire. We then upweighted these survivors by theinverse of their estimated conditional probability of survival.This approach implicitly assumes that there exists a hypo-thetical intervention to prevent death before returning thequestionnaire among women who had a CHD event.
To estimate the probability of survival, we fit a logisticmodel among women who had a CHD event in the 2-yearinterval before the return of the questionnaire. The outcomeof the model was the probability of survival until question-naire return, and the covariates were those used in our Table3 analyses to adjust for confounding. This approach adjustsonly for the selection bias that can be explained by these
covariates. Appendix Table 4 shows the inverse probabilityweighted ITT HRs and their 95% CIs, which are similar to thosein Table 3—although the HR for initiators versus noninitiatorsduring the first 2 years of follow-up was closer to the null inAppendix Table 4 (1.30) than in Table 3 (1.48).
However, our inverse probability weighted analysiscould not adjust for treatment status because it is unknownwhether women who died before returning their questionnairewere initiators. Thus, if the probability of dying after or froma CHD event was affected by treatment, our inverse proba-bility weighted analysis would not appropriately adjust forthe selection bias. We conducted a sensitivity analysis todetermine whether lack of adjustment for treatment statuscould explain the increased CHD incidence observed ininitiators during the first 2 years of follow-up. The method-ology for this sensitivity analysis has been recently de-scribed.27 Appendix Figure 1 summarizes the results.
The ITT HR of CHD varies from 1.42 for � � �1 to1.24 for � � 1, where � is the log odds ratio for thehypothesized association between treatment arm and deathbefore returning the questionnaire, conditional on the othercovariates. Our analysis in Appendix Table 4 corresponds to� � 0. These results suggest that the potential selection biasdue to lack of adjustment for treatment arm in the inverseprobability-weighted analysis does not fully explain the in-creased CHD incidence rate during the first 2 years offollow-up in initiators versus noninitiators.
APPENDIX TABLE 3. Estimates of the (Adherence-Adjusted)Effect of Continuous Estrogen/Progestin Therapy Versus NoHormone Therapy on the Incidence of CHD Events AmongWomen Aged 50 or More at Baseline in the NHS “Trials”
AllHR (95% CI)
0–24 MoHR (95% CI)
>24 MoHR (95% CI)
All women 1.30 (0.76–2.21) 1.71 (1.03–2.83) 1.07 (0.44–2.63)
By time after menopause (y)
�10 y 0.68 (0.24–1.91) 1.28 (0.43–3.86) 0.20 (0.03–1.54)
�10 y 1.57 (0.86–2.85) 1.97 (1.11–3.47) 1.37 (0.54–3.45)
P for interaction 0.03 0.37 0.06
By age (y)
�60 0.91 (0.49–1.69) 1.80 (0.83–3.87) 0.54 (0.20–1.49)
�60 1.92 (0.90–4.10) 1.69 (0.87–3.32) 2.10 (0.68–6.50)
P for interaction 0.06 0.94 0.09
Adjusted for same baseline variables as in Table 3. In each “trial,” women werecensored when they discontinued their baseline treatment (either hormone therapy or nohormone therapy), and the uncensored women-months were weighted by the inverse oftheir estimated probability of remaining uncensored until that month.
APPENDIX TABLE 4. Estimates of the Intention-to-TreatEffect of Initiation of Estrogen/Progestin Therapy on theIncidence of CHD Events in the NHS “Trials,” After Adjust-ment for Exclusion of Women Who Died Between the Startof Follow-Up and the Return of the Next Questionnaire
All
Follow-up Period
0–24 Mo >24 Mo
Initiators
Total no. 7258 7258 7221
No. CHD events 98 22 76
Noninitiators
Total no. 141,002 141,002 139,599
No. CHD events 3606 512 3094
HR (95% CI) HR (95% CI) HR (95% CI)
All women 0.96 (0.77–1.18) 1.30 (0.83–2.05) 0.88 (0.69–1.12)
By time after menopause (y)
�10 0.85 (0.62–1.16) 1.37 (0.69–2.73) 0.77 (0.54–1.09)
�10 1.09 (0.82–1.46) 1.27 (0.69–2.34) 1.05 (0.77–1.43)
P for interaction 0.12 0.82 0.07
By age (y)
� 60 0.86 (0.65–1.14) 1.33 (0.71–2.47) 0.78 (0.57–1.07)
�60 1.14 (0.83–1.55) 1.31 (0.68–2.53) 1.08 (0.76–1.54)
P for interaction 0.07 0.93 0.06
Adjustment does not affect to estimates for �24 mo. HR adjusted for same baselinevariables as in Table 3.
Epidemiology • Volume 19, Number 6, November 2008 Observational Studies Analyzed Like Randomized Experiments
© 2008 Lippincott Williams & Wilkins 777

Appendix A4: The Use of Propensity ScoresTo assess whether our results were affected by the
choice of the effect measure (ie, HR) or by the method ofadjustment for confounding, we also conducted the analysesby g-estimation of a nested, trial-specific, time-independentaccelerated failure time model,10,28 which estimates the me-dian survival time ratio of noninitiators versus initiators andadjusts for confounding by combining a model for the pro-pensity score with a model for the effect of the covariates ontime to CHD.29 G-estimation of nested structural models is aparticularly robust way of utilizing propensity scores as it isminimally affected by poor overlap in the propensity scoresof the treated and untreated.29,30 The estimates, shown inAppendix Table 5, are qualitatively similar to those in Table3, which suggests that our conclusions are not sensitive to themethod used for confounding adjustment.
Appendix A5: The Assumption of NoUnmeasured Confounding
To examine the amount of confounding by measuredlifestyle and socioeconomic compared with other risk factors,we first repeated the analysis in Table 3 without adjusting formeasured lifestyle factors (alcohol intake, physical activity,aspirin use, diet score, multivitamin use, fruit and vegetableintake). The HR was 0.94 (95% CI � 0.76–1.16). When wealso omitted adjustment for our measures of socioeconomicstatus (education, ethnicity, husband’s education), the HRwas 0.92 (0.75–1.14). We repeated the analyses withoutadjusting for any of the potential confounders except age; theage-adjusted HR was 0.67 (0.54–0.83) for CHD. Finer strat-ification by age (in 2-year intervals) and adjustment for age asa continuous covariate did not materially affect the results.
It is suspected that important confounders of the effectof hormone therapy on CHD risk also confound its effect onstroke risk. Thus we estimated the ITT effect of hormonetherapy on stroke under the hypothesis that, in the presence ofsubstantial unmeasured confounding for the effect on CHDrisk, the effect estimates for stroke would also be biased.There were 574 cases of stroke among eligible women.Applying the same analytic strategy as in Table 3, the overallHR for stroke was 1.39 (CI � 1.09–1.77), which is similar tothe estimate found in the WHI randomized trial.
We also repeated the analysis in column vi of Table 6without adjustment for measured lifestyle factors other thansmoking (alcohol intake, physical activity, aspirin use, mul-tivitamin use, vitamin E intake). The HR was 0.67 (CI �0.53–0.85). When we also omitted adjustment for our mea-sures of socioeconomic status (husband’s education), the HRwas 0.65 (0.52–0.82). We repeated the analyses withoutadjusting for any of the potential confounders except age; theage-adjusted HR was 0.48 (0.38–0.60).
To further evaluate whether our decision not to assumecomparability on unmeasured factors between those continu-ing versus discontinuing therapy had an important effect onour adherence-adjusted estimates, we compared our esti-mated ITT effect of hormone initiation with an estimate of theITT effect of discontinuation under the assumption of nounmeasured confounders for discontinuation. To calculatethis latter effect we recreated a set of NHS “trials” with thesame protocol and analytic approach described above exceptthat we restricted participation in each “trial” to women who
APPENDIX TABLE 5. Estimates of the Intention-to-TreatEffect of Initiation of Estrogen/Progestin Therapy on theIncidence of CHD Events in the NHS “Trials” (Effect Mea-sured as Median Survival Time Ratio)
Entire Follow-upInitiators
Total no. 7258
No. CHD events 98
Noninitiators
Total no. 141,002
No. CHD events 3,606
STR (95% CI) 0.87 (0.62–1.08)
By time after menopause (y)
�10 0.71 (0.43–1.03)
�10 1.04 (0.70–1.36)
By age (y)
�60 y 0.66 (0.47–1.03)
�60 y 1.11 (0.72–1.50)
0–24 moCHD events no.
Initiators 22
Noninitiators 512
STR (95% CI) 1.82 (0.50–3.70)
Survival time ratios (STRS) adjusted for same baseline variables as in Table 3.
APPENDIX FIGURE 1. Sensitivity analysis for lack of adjustmentfor treatment arm in the inverse probability weighted analysisthat adjusts for selection bias due to death between the start offollow-up and the return of questionnaire in the Nurses’ HealthStudy “trials.” The parameter alpha is the log odds ratio for thehypothesized association between treatment arm and death be-fore returning the questionnaire. Log HR is the log HR of CHD forinitiators versus noninitiators during the first 2 years of follow-up.
Hernan et al Epidemiology • Volume 19, Number 6, November 2008
© 2008 Lippincott Williams & Wilkins778
reported use of hormone therapy in the questionnaire beforebaseline.
We implemented the ITT approach by considering thetreatment variable to be either 1 or 0 depending on whetherthe woman reported herself to be off versus on hormonetherapy at the baseline questionnaire (regardless of futurehormone history), and fit the Cox models described above.Under the assumption of no unmeasured confounders fortreatment discontinuation given the variables used in ouranalysis, the estimates of effect so obtained are comparablewith those from a randomized trial among hormone users inwhich treatment discontinuation is assigned at random.
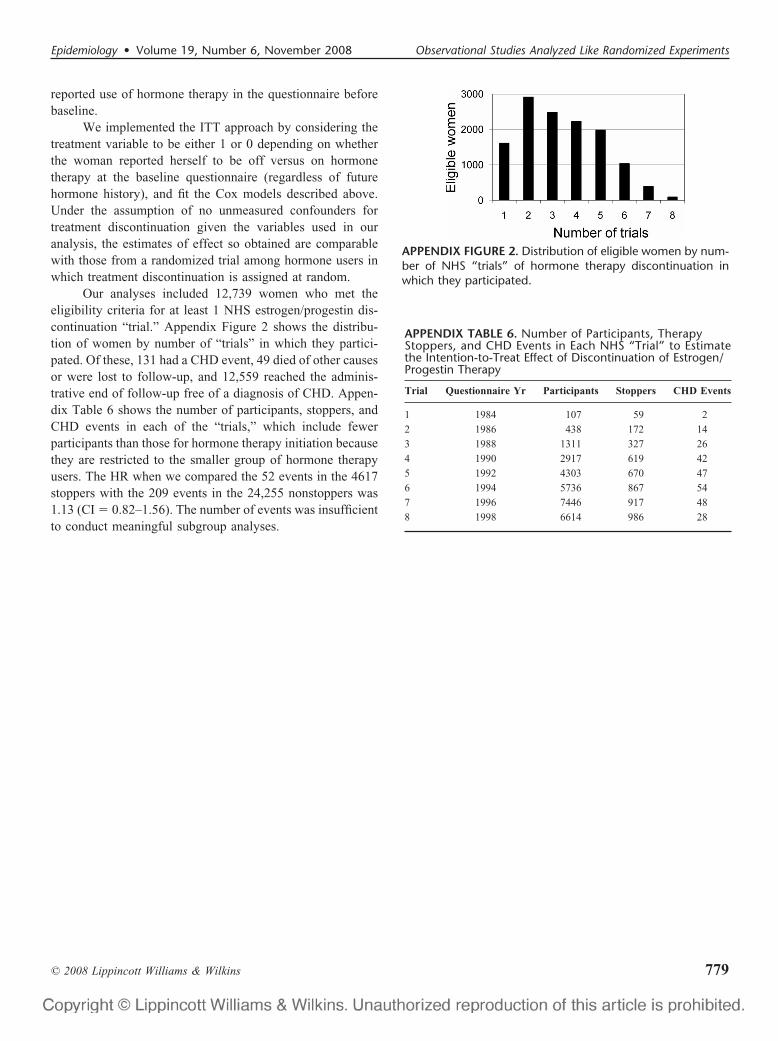
Our analyses included 12,739 women who met theeligibility criteria for at least 1 NHS estrogen/progestin dis-continuation “trial.” Appendix Figure 2 shows the distribu-tion of women by number of “trials” in which they partici-pated. Of these, 131 had a CHD event, 49 died of other causesor were lost to follow-up, and 12,559 reached the adminis-trative end of follow-up free of a diagnosis of CHD. Appen-dix Table 6 shows the number of participants, stoppers, andCHD events in each of the “trials,” which include fewerparticipants than those for hormone therapy initiation becausethey are restricted to the smaller group of hormone therapyusers. The HR when we compared the 52 events in the 4617stoppers with the 209 events in the 24,255 nonstoppers was1.13 (CI � 0.82–1.56). The number of events was insufficientto conduct meaningful subgroup analyses.
APPENDIX TABLE 6. Number of Participants, TherapyStoppers, and CHD Events in Each NHS “Trial” to Estimatethe Intention-to-Treat Effect of Discontinuation of Estrogen/Progestin Therapy
Trial Questionnaire Yr Participants Stoppers CHD Events
1 1984 107 59 2
2 1986 438 172 14
3 1988 1311 327 26
4 1990 2917 619 42
5 1992 4303 670 47
6 1994 5736 867 54
7 1996 7446 917 48
8 1998 6614 986 28
APPENDIX FIGURE 2. Distribution of eligible women by num-ber of NHS “trials” of hormone therapy discontinuation inwhich they participated.
Epidemiology • Volume 19, Number 6, November 2008 Observational Studies Analyzed Like Randomized Experiments
© 2008 Lippincott Williams & Wilkins 779
COMMENTARY
The Sound and the FuryWas It All Worth It?
Robert N. Hoover, MD, ScD
Abstract: The initial report of coronary heart disease (CHD) resultsfrom the trial of menopausal hormone therapy within the Women’sHealth Initiative precipitated substantial surprise and concern in theepidemiology research community over the apparent differencesbetween the trial results and those of observational studies. Whatfollowed was 6 years of discussion and debate, frequently acrimo-nious, along with intense methodologic and substantive researchattempting to reconcile or explain the apparent differences. Theresults have been an impressive improvement in methods to contrastand combine studies of differing designs, dramatic illustrations ofsome central epidemiologic principles, insights into likely mecha-nisms of CHD, and increasing clarity of the public health messageabout menopausal hormone therapy.
(Epidemiology 2008;19: 780–782)
The early termination of the Women’s Health Initiative(WHI) trial of combined estrogen/progestin menopausal
hormone therapy precipitated a profound reaction by themedia, among menopausal women, and in the clinical com-munity.1 The trial result, that cumulative risks outweighedbenefits, overturned conventional wisdom and decades ofclinical practice. Particularly disturbing was the increasedrisk of coronary heart disease (CHD) in the face of widelyaccepted results from epidemiologic and clinical investiga-tions suggesting protective effects of hormone therapy. Pro-found angst ensued for many epidemiologists and biostatis-ticians, leading to years of attempts to reconcile or explain theapparent differences between the trial results and those of theobservational studies.2–5 The intensity of this reaction wassurprising, because epidemiologists spend years learning, andcareers teaching, the litany of relative strengths and weak-nesses of different study designs, and the distinct possibilityof differing results because of differing designs. That said, themethodologic advances and enhanced understanding of the
effects of hormone therapy resulting from this level of con-cern have been major contributions to our discipline.
From the methodologic perspective, investigators fromthe WHI4 and Nurses’ Health Study (NHS)5 have proposedinnovative methods for analyzing data from clinical trials andobservational cohort studies in a comparable manner. Thisnot only allows assessment of similarities and differences infindings, but more importantly, these approaches provideways to combine data coherently from different designs. Suchpooled analyses not only increase power but also can leveragethe distinct strengths of each design. The result is a whole thatis truly greater than the sum of its parts.
The paper by Hernan et al5 in this issue of the journalconfirms previous analyses and speculations that many of theapparent differences in overall CHD risk between the 2studies lie not in classic confounding by other causal vari-ables, but in differing risks by duration of follow-up, and ingroups of women defined by duration of interval betweenmenopause and initiation of hormone therapy, along withdiffering distributions in these variables between the 2 studypopulations. Because the strongest evidence for an adverseeffect occurs in the years immediately following the initiationof hormone therapy, correcting for the misclassification biasin this time interval within previous NHS analyses (associ-ated with counting exposure from the date of return of thefirst questionnaire after initiation of MHT rather than anestimated time of initiation itself) further narrows apparentdifferences in this interval. As might be expected whensubgroups of 2 studies are compared, confidence intervals arewide. Thus, comparability is hard to assess quantitatively;qualitatively, both the WHI and the NHS appear to showexcess risk of heart disease immediately following initiationof hormones. Furthermore, this risk is, more pronounced amongthose who initiate such therapy more than a decade after meno-pause than in those who initiate it earlier. The cumulative excessrisk dissipates with time within both studies, perhaps progress-ing to a decreased risk with long-term use.
Hernan et al believe that the aforementioned differ-ences largely explain any discrepancies between the WHI andNHS results, and that residual confounding for the initiationof therapy in the NHS plays small role. The major suspectwhen observational study results and trial results disagreeis unknown risk factors that could be controlled only by
From the Epidemiology and Biostatistics Program, Division of Epidemiol-ogy and Genetics, National Cancer Institute, Bethesda, Maryland.
Correspondence: Robert Hoover, MD, Epidemiology and Biostatistics Pro-gram, Division of Epidemiology and Genetics, National Cancer Institute,6120 Executive Blvd., EPS/8094, Bethesda, MD 20892. E-mail:[email protected].
Copyright © 2008 by Lippincott Williams & WilkinsISSN: 1044-3983/08/1906-0780DOI: 10.1097/EDE.0b013e318188e21d
Epidemiology • Volume 19, Number 6, November 2008780

randomization. With regard to hormone therapy, this con-cern has focused primarily on potential compliance andsurvivor biases for longer-term users (a healthy persistent-medication-user effect).6,7 As Hernan et al point out, it isharder to assess the consistency of results with an assumptionof no unmeasured confounders for treatment discontinuationthan for initiation. If some of the remaining discrepancies(magnitude of the initial excess risk, slope of the decline inexcess risk with duration of use, and the magnitude ofprotection, if any, with long-term use) are not simply becauseof chance, the possibility of unrecognized confounding re-mains. The plausibility of this could be contested but willprobably not be resolved by further methodologic work, nowthat the trial is over.
Other important methodologic observations haveemerged from the comparisons and contrasts associated withthese reconciliation processes. Few have been new method-ologic insights per se, but several are compelling examplesand illustrations of established epidemiologic principles,namely the relative strengths and weaknesses of various studydesigns alluded to in the first paragraph. These illustrations ofcentral principles have the potential to become particularlyeffective didactic tools in educating epidemiology students andcolleagues from other disciplines about the richness of ourdiscipline’s strategies to contribute to understanding health anddisease. For example, one weakness of a trial typically lies in thearea of its generalizability. In MacMahon’s words of almost 50years ago, “the interpretation of results in terms of generalapplicability may be limited.”8 Examples of this abound fortherapeutic effects, which can vary by characteristics of popu-lations chosen for study (eg, age, sex, race, and general healthstatus). Now we have an example of an etiologic factor the effectof which apparently varies substantially with only a 10-yeardifference in time of exposure. Not only does this point out thepotential limitations of generalizability of a trial, and the need todefine from its outset the population to which you wish it torelate, but also the implications for statistical power. Trialistsunderstandably are excited to explore subgroup effects but rarelypower their studies with this in mind. This can work for atherapy trial, because another trial to explore an interestingsubgroup observation can often be launched. For preventiontrials, which are larger and more complex to start with, and entailadded ethical issues, further trails are rarely feasible.
Interestingly, the current circumstance points out thatthis “weakness” may be turned to an advantage. This canhappen when important biologic insights result from assess-ing the effect of an exposure in an understudied group.Indeed, the nonrepresentative nature of the WHI study groupwas recognized at the start of the trial, and a review of itsprotocol by a National Academy of Sciences committeesuggested that the inclusion of women a decade after meno-pause was one of the strengths of the study design forprecisely this reason.9 This turned out to be the case. The
differences in risk of clinical CHD by timing of exposure inthe trial, and the subsequent exploration of this in the limitedobservational data available, has contributed directly to spec-ulation about a mechanism that would involve increasedclotting risk in women with preexisting subclinical CHD anddifferent effects and mechanisms in those without.
Another key design effect is illustrated by the difficultyin unbiased assessment of the risks of hormone therapyshortly after beginning use (exposures beginning betweenfollow-up efforts) in the NHS. Although a general strength ofthe cohort design is in unbiased exposure assessment, itfrequently presents challenges in assessment of the details oftiming of exposure and risk. The multiple endpoints understudy, multiple risk factors being assessed, time intervalsbetween exposure assessments, and deaths and losses tofollow-up within these intervals (the probability of whichmay relate to exposure), all conspire to obscure detailedtemporal relations between exposure and disease. This con-trasts with the relative ease of collecting data in a case-controldesign, with its focus on 1 disease and a limited set ofpotential risk factors, with total exposure histories for thesefactors up to diagnosis. If these potential misclassificationbiases are an issue in even the NHS, with its compliantpopulation and 2-year follow-up intervals, the hormone ther-apy story must be a cautionary tale for epidemiologistsworking with cohort studies that have higher drop-out ratesand longer intervals between exposure updates.
When differing results emanate from different disci-plines—or from different high-quality studies within thesame discipline—good public health practice can be hard todefine. Fortunately in this instance, the public health mes-sage for menopausal women is quite clear, despite anyresidual methodologic questions or differences of opinion.In addition to the patterns of risk of CHD, hormonetherapy increases the risk of breast cancer, with a patternof risk a mirror image of that for CHD— high levels of riskemerging with longer-term use, and in those initiatingtherapy near the time of menopause.10 Hormone therapy isalso associated with increased risks of stroke,11 blood clots,12
dementia,13 gall bladder disease,14 and urinary incontinence15
and shows no clinically significant benefit for health-relatedquality of life.16 These cumulative risks so overwhelm theprotective effects for osteoporosis that a clear consensus ofepidemiologists and trialists has emerged. Hormonal therapymay be appropriate for the short-term treatment of moderate-to-severe vasomotor symptoms in recently menopausalwomen, but it should not be used long-term for the preventionof chronic disease.
In the immediate aftermath of the controversy 6 yearsago, the editors of Epidemiology called on our community toaddress the issues raised by the WHI results, arguing thatsuch an effort “cannot help but sharpen the peculiar andrigorous qualities of thinking demanded by observational
Epidemiology • Volume 19, Number 6, November 2008 Women’s Health Initiative Trial
© 2008 Lippincott Williams & Wilkins 781

data.”17 Many of our best epidemiologists and biostatisticianshave responded, and the intensity with which they havecontemplated the navel of our discipline since that time hasclearly achieved this goal.
ABOUT THE AUTHORROBERT HOOVER is Director of the intramural
Epidemiology and Biostatistics Program at the NationalCancer Institute. He published the first epidemiologicstudy suggesting menopausal hormone therapy as a causeof breast cancer. He is continually humbled by how muchhe still has to learn about the epidemiologic method afternearly 40 years of trying to practice it.
REFERENCES1. Kolata G. Hormone studies: what went wrong? The New York Times.
April 22, 2003.2. Grodstein F, Manson JE, Stampfer MJ. Hormone therapy and coronary
heart disease: the role of time since menopause and age at hormoneinitiation. J Women’s Health. 2006;15:1, 35–44.
3. Rossouw JE. Postmenopausal hormone therapy for disease prevention:have we learned any lessons from the past? Nature. 2008;83:14–16.
4. Prentice RL, Langer R, Stefanick ML, et al. Combined postmenopausalhormone therapy and cardiovascular disease: toward resolving the dis-crepancy between observational studies and the women’s health initia-tive clinical trial. Am J Epidemiol. 2005;162:404–414.
5. Hernan MA, Alonso A, Logan R, et al. Observational studies analyzedlike randomized experiments: an application to postmenopausal hormonetherapy and coronary heart disease. Epidemiology. 2008;19:766–779.
6. Sturgeon SR, Schairer C, Brinton LA, et al. Evidence of a healthyestrogen user survivor effect. Epidemiology. 1995;6:227–231.
7. Egeland GM, Kuller LH, Mathews KA, et al. Premenopausal determi-nants of menopausal estrogen use. Prev Med. 1991;20:343–349.
8. MacMahon B. Experimental epidemiology. In: MacMahon, Pugh, Ipsen,eds. Epidemiologic Methods. Boston, MA: Little Brown and Co; 1960.
9. Thaul S, Hotra D, eds. An Assessment of the NIH Women’s HealthInitiative. Washington, DC: National Academy Press; 1993.
10. Prentice RL, Chlebowski RT, Stefanick ML, et al. Estrogen plus pro-gestin therapy and breast cancer in recently postmenopausal women.Am J Epidemiol. 2008;167:1207–1216.
11. Wassertheil-Smoller S, Hendrix SL, Limacher M, et al. Effect ofestrogen plus progestin on stroke in postmenopausal women. JAMA.2003;289:2673–2684.
12. Cushman M, Kuller LH, Prentice R, et al. Estrogen plus progestin andrisk of venous thrombosis. JAMA. 2004;292:1573–1580.
13. Shumaker SA, Legault C, Rapp SR, et al. Estrogen plus progestin andthe incidence of dementia and mild cognitive impairment in postmeno-pausal women. JAMA. 2003;289:2651–2662.
14. Cirillo DJ, Wallace RB, Rodabough RJ, et al. Effect of estrogen therapyon gallbladder disease. JAMA. 2005;293:330–339.
15. Hendrix SL, Cochrane BB, Nygaard IE, et al. Effects of estrogen with andwithout progestin on urinary incontinence. JAMA. 2005;293:935–948.
16. Hays J, Ockene JK, Brunner RL, et al. Effects of estrogen plus progestinon health-related quality of life. N Engl J Med. 2003;348:1839–1854.
17. Editors. Epidemiology and randomized clinical trials. Epidemiology.2003;14:2.
Hoover Epidemiology • Volume 19, Number 6, November 2008
© 2008 Lippincott Williams & Wilkins782

COMMENTARY
ITT for Observational DataWorst of Both Worlds?
Meir J. Stampfer
Abstract: Hernán et al reanalyzed Nurses’ Health Study Data onhormone therapy and heart disease, to explore further the apparentdiscrepancy for those results compared with findings from the Wom-en’s Health Initiative Trial. Hernán et al concludes that differences intime since menopause remains the most plausible explanation for thedifferent findings. Part of the analysis employs application of the“intention-to treat” principle to analyze the observational data. Thiscommentary points out some of the weaknesses inherent in thatapproach, which combines a major limitation of observational stud-ies—lack of randomization—with a common limitation of trials,imperfect adherence to the assigned treatment.
(Epidemiology 2008;19: 783–784)
In this issue, Hernán et al provide a reanalysis of Nurses’Health Study (NHS) data to explore reasons for the appar-
ent discrepancy in results for use of estrogen plus progestinpostmenopausal hormones and heart disease, which wereassociated with lower risk, in contrast to the positive associ-ation in the Women’s Health Initiative (WHI) randomizedtrial. Their main conclusion was that most of the differencecould be attributed to the difference in age distribution at thetime of initiation of hormone therapy in these 2 studies.Consistent with prevailing clinical practice, most hormoneusers in NHS began around menopause, whereas in the WHI,two thirds of the participants were aged 60 years or older atthe start. The hypothesis that the time of initiation of hormonetherapy affects risk of coronary disease—the timing hypoth-esis—was explored by Grodstein et al1 soon after publicationof the initial WHI findings. Since then, considerable addi-tional evidence, based on animal and human studies, hasaccumulated to support this hypothesis, as reviewed by Man-son and Bassuk2 and Mendelsohn and Karas.3
The NHS and WHI results have been remarkably con-cordant for all other clinical outcomes examined, including
stroke, pulmonary embolism, breast cancer, and colorectalcancer. In particular, the virtually identical results for stroke,as confirmed by the most recent NHS analysis4 argue againstsubstantial confounding by lifestyle factors or other variablesin NHS analyses. Hernán et al came to a similar conclusion,which is that residual confounding is unlikely to explain theapparent divergent findings.
Consistent evidence suggests a transient increase in riskamong women who start hormone therapy years after meno-pause, in the presence of preexisting atherosclerosis, but notin women who start earlier. Further evidence suggests sub-sequent protection, reflected by the finding that in the WHIthe cumulative incidence curves converged by 8 years. Using theretrospective data in the NHS, Hernán et al show this transientincrease in risk among women who started hormone therapymore than 10 years after menopause but not in those whostarted earlier. This was also examined in a sensitivity anal-ysis in our earlier publication; in agreement with Hernán et al,this transient increase in risk did not have a substantial impacton the overall findings in NHS.
In a novel approach to considering this issue, Hernán et alapply the intention-to-treat (ITT) principle in analyzing the NHSdata, to “mimic the design of the randomized trial as closely aspossible in the NHS.” The main advantage of a randomized trialis, of course, that potential confounding factors, both known andunknown, will tend to be evenly distributed across groups. Thisadvantage is lost if only adherent individuals are considered inthe analysis, so the ITT principle is appropriately typicallyapplied to analyze all data regardless of adherence to random-ized treatment assignment. However, as a consequence, pooradherence in a randomized trial will tend to yield inaccurateestimates of the efficacy of the treatment under study due tomisclassification of exposure. In observational data, there isconcern about the potential for confounding, but with repeatedassessments, the actual exposure of the individuals can beidentified, reducing misclassification. In applying the ITT prin-ciple to observational data, those who initiate the exposure (inthe present example, hormone use) are treated as though theywere in that exposure group, regardless of their actual laterbehavior—that is, if they stopped such use. Thus, application ofthe intention-to-treat principle to observational data essentiallycombines the most important limitations of each study design.
From the aDepartment of Epidemiology, Harvard School of Public Healthand bChanning Laboratory, Department of Medicine, Brigham and Wom-en’s Hospital and Harvard Medical School, Boston, MA.
Supported by NIH grants HL080644 and CA87969.Correspondence: Meir J. Stampfer, Channing Laboratory, 181 Longwood
Avenue, Boston, MA 02115. E-mail: [email protected] © 2008 by Lippincott Williams & WilkinsISSN: 1044-3983/08/1906-0783DOI: 10.1097/EDE.0b013e318188442e
Epidemiology • Volume 19, Number 6, November 2008 783

With the resulting misclassification of exposure, it is nosurprise that essentially null results emerge from the presentITT analysis. This does not “explain” the apparent discrep-ancy, it just tells us that substantially misclassified exposuredata will tend to yield null results. It is a kind of magicalthinking that by using the terminology of randomized trialsand calling the 2-year intervals of observation “trials,” theadvantages of randomization are achieved. To the contrary,the worst features of both designs emerge.
Hernán et al attempt to deal with this misclassificationby adjusting the results for adherence by using inverse prob-ability weighting. This makes an analysis that is alreadycomplex and difficult to follow even more complicated byrequiring additional assumptions and models. The magnitudeof this problem is apparent by the finding that the relative riskfor 8� years was 0.87 in Hernán’s unadjusted analysis andonly changed to 0.85 in the adherence-adjusted analysis,despite the fact that over half of the women were misclassi-fied by that time in the ITT analysis.
One potential use of an ITT analysis might be toevaluate whether the women who discontinue their hormoneuse are at elevated risk, which could lead to an apparent lowerrisk for those who continue. However, this can also beevaluated using conventional methods by examining risk in
those who discontinue their exposure. This is an interestingattempt to use a novel method for analysis, but one that adds nonew insights on the relation of hormone therapy to chronic heartdisease. Because of its far greater complexity and “black box”nature, which make it difficult even to track numbers of subjects,it should not be recommended for routine use.
ABOUT THE AUTHORMEIR STAMPFER is Professor of Epidemiology and
Nutrition at Harvard School of Public Health, where heserved as chair of the Department of Epidemiology, from2000 to 2007. He is also Professor of Medicine, and serves asAssociate Director of Channing Laboratory at Brigham andWomen’s Hospital. In addition to his research in chronicdisease epidemiology, he also directs 2 training grants.
REFERENCES1. Grodstein F, Clarkson TB, Manson JE. Understanding the divergent data
on postmenopausal hormone therapy. N Engl J Med. 2003;348:645–650.2. Manson JE, Bassuk SS. Invited commentary: hormone therapy and risk of
coronary heart disease—why renew the focus on the early years ofmenopause? Am J Epidemiol. 2007;166:511–517.
3. Mendelsohn ME, Karas RH. HRT and the young at heart. N Engl J Med.2007;356:2639–2641.
4. Grodstein F, Manson JE, Stampfer MJ, Rexrode K. Postmenopausalhormone therapy and stroke: role of time since menopause and age atinitiation of hormone therapy. Arch Intern Med. 2008;168:861–866.
Stampfer Epidemiology • Volume 19, Number 6, November 2008
© 2008 Lippincott Williams & Wilkins784

COMMENTARY
Data Analysis Methods and the Reliability of AnalyticEpidemiologic Research
Ross L. Prentice
Abstract: Publications that compare randomized controlled trial andcohort study results on the effects of postmenopausal estrogen-plus-progestin therapy are reviewed. The 2 types of studies agree inidentifying an early elevation in coronary heart disease risk, and alater developing elevation in breast cancer risk. Effects amongwomen who begin hormone therapy within a few years after themenopause may be comparatively more favorable for coronary heartdisease and less favorable for breast cancer. These analyses illustratethe potential of modern data analysis methods to enhance thereliability and interpretation of epidemiologic data.
(Epidemiology 2008;19: 785–788)
There is a pressing need to assess and enhance the reliabil-ity of findings from observational studies. Available
methods for controlling confounding, measurement error andother biases can provide adjustments in the desired direction,but objective means of assessing bias avoidance are generallylacking. Randomized controlled trials include an objectiveassignment of a study treatment or intervention and avoidconfounding by prerandomization factors. However, trials areexpensive, and typically cannot be conducted in a mannerthat powerfully addresses subset hypotheses or treatmenteffects over long periods of exposure. Hence, the populationscience research agenda must rely heavily on observationalstudies for the development and initial testing of diseaseprevention hypotheses, with trials typically conducted onlyfor well established hypotheses that have strong public healthpotential.
Settings in which both trials and observations studiesare available provide a particular opportunity to examineconsistency of results from the 2 types of studies, and toidentify improvements in study design, conduct, or analysisthat may help to explain any discrepancy in results. Such data
exist for postmenopausal hormone therapy in relation toseveral important clinical outcomes. Few topics have gener-ated more interest and controversy in recent years, in partbecause findings from a clinical trial and observation studiesseemed to be strongly discrepant.
Benefits and Risks of PostmenopausalHormone Therapy
A substantial body of cohort and case-control studieshas suggested that postmenopausal hormone therapy reducescoronary heart disease (CHD) risk by about 40% to 50%,with little indication for a difference in effects betweenestrogen-alone or estrogen-plus-progestin.1,2 A subsequentand extensive observational literature has also suggestedelevations in breast cancer risk, by about 30% for estrogenand 50% to 100% for estrogen-plus-progestin.3,4 Reportsavailable by the early 1990s informed the design of theWomen’s Health Initiative (WHI) clinical trial, which ran-domized 10,739 posthysterectomy women to 0.625 mg dailyconjugated equine estrogen, and 16,608 women with intactuterus to this same estrogen regimen plus 2.5 mg/d medroxy-progesterone acetate. CHD was the designated primary out-come with breast cancer as the primary “safety” outcome inboth trials. A recruitment age range of 50 to 79 years wasspecified to examine whether health benefits and risk wouldapply broadly to postmenopausal women. At the time thesetrials were initiated the estrogen and estrogen-plus-progest-erone regimens under study were used by about 8 and 6million women, respectively, in the United States.
With this background it came as quite a surprise whenthe estrogen-plus-progesterone trial was stopped prematurelyin 2002. Health risks were judged to exceed benefits over its5.6-year average follow-up period. The health risks includedelevations in breast cancer, stroke, venous thromboembolism,and CHD, which were only partially offset by reductions infractures and colorectal cancer.5 Although breast cancer wasa trigger for early stopping, the hazard ratio (HR) estimatewas a moderate 1.24 with 95% confidence interval (CI) �1.01–1.54.6 More surprising was the HR of 1.24 (95% CIfrom 1.00–1.54) for CHD, with an HR of 1.81 (95% CI �1.09–3.01) during the first year of combined-hormone use.7
WHI investigators undertook joint analyses of datafrom the clinical trial with data from a corresponding subset
From the Fred Hutchinson Cancer Research Center, Seattle, WA.Supported by NCI grant P01 CA53996. The WHI Clinical Coordinating
Center is funded by the National Heart, Lung, and Blood Institute,National Institutes of Health, US Department of Health and HumanServices through Contract N01WH22110.
Correspondence: Ross L. Prentice, Fred Hutchinson Cancer Research Center,1100 Fairview Avenue North, M3-A410, POB 19024, Seattle, WA98109-1024. E-mail: [email protected].
Copyright © 2008 by Lippincott Williams & WilkinsISSN: 1044-3983/08/1906-0785DOI: 10.1097/EDE.0b013e318188e83b
Epidemiology • Volume 19, Number 6, November 2008 785
of the WHI observational study, which was composed ofwomen recruited from the same population as the trail, withmuch commonality in eligibility criteria, baseline data col-lection, and outcome ascertainment. HRs from the observa-tional study alone were considerably lower than for the trialand similar to those from other cohort studies followingconfounding control, for each of CHD, stroke, and thrombo-embolism.8 However, HRs for CHD agreed closely followingcontrol for time from hormone therapy initiation (duration ofuse among adherent women). The same analytic techniquesdid not seem to explain fully the lower risk of stroke in theobservational study compared with the trial.
The WHI estrogen trial was also ended early (in 2004),based on an elevation in stroke risk similar to that forestrogen-plus-progesterone (HR �1.3), and a limited powerto establish a CHD effect before the trial’s planned termina-tion.9 The HR (95% CI) for CHD was 0.95 (0.79–1.15),whereas that for breast cancer was a rather surprising 0.80(0.62–1.04) over the trial’s follow-up period that averaged7.1 year.10,11
Comparative analyses of WHI trial and observationalstudy data for CHD, stroke, and thromboembolism yieldedalmost identical results for estrogen as for estrogen-plus-progesterone. HRs from the 2 sources agreed closely forCHD and thromboembolism, and not so closely for stroke,after confounding control on allowing the HR to depend ontime from estrogen initiation.12 In fact, the ratio of HRs fromthe trial and the observational study was about 0.9 for CHDand thromboembolism, and about 0.7 for stroke for bothhormone regimens, presumably suggesting some residualbias for stroke.
Comparatively analyses of this type were recently pre-sented for breast cancer.13,14 HRs from the observationalstudy were somewhat higher than those from the trial for bothhormone regimens, even after control confounding and ac-commodating time since initiation of hormone therapy. TheseHRs, however, were higher among women who first initiatedhormones within a few years after menopause compared withwomen having larger gap times. The HRs agreed closelybetween the 2 data sources after allowing effect modificationby this gap time variable. Among women having gap times ofless than 5 years the breast cancer HR increased to about 2.0following 2 or more years of estrogen-plus-progesterone,whereas that for estrogen alone was about 1.0.
The types of modeling and comparative analyses justdescribed achieve some robustness by virtue of similar find-ings between the 2 hormone regimens, but it is also of greatinterest to compare the clinical trial results with results fromother observational studies, including the Nurses HealthStudy (NHS), which played an important role in the genera-tion and initial testing of hypotheses related to hormonetreatment effects.
Estrogen-Plus-Progesterone Therapy and CHDin the NHS
In this issue Hernan et al15 provide a reanalysis of theassociation between estrogen-plus-progesterone and CHD inthe NHS. These authors are to be congratulated on a carefulmatching of the NHS subset used (34,575 women) to the setof women enrolled in the WHI trial of combined hormones,and for a series of analyses that elucidate the impact ofvarious analytic definitions and estimation procedures on theresulting HRs. Also, the participating NHS coauthors are tobe congratulated for allowing their data to be subjected tothese novel analytic approaches. Compared with the WHIobservational study, the NHS has the distinct advantage thatmuch of the hormone use was initiated after cohort enroll-ment, potentially allowing precise assessment of benefits andrisks during the early months after hormone initiation. Pre-vious analyses of NHS data relied on a biennial snapshot ofcurrent hormone user status. This was evidently an importantanalytic limitation for estimation of an early HR increase thatsubstantially dissipated within a year or 2 after initiation ofhormone therapy. For example, women who initiate hor-mones would be classified based on this snapshot as nonusersuntil their biennial data collection time, and permanently asnonusers if they stopped usage before such collection.16 Inthe present analysis, the authors recover “estimates” of thedate of hormone initiation to the extent possible through afuller use of available data, presumably substantially mitigat-ing this source of bias. They also attempt to emulate a clinicaltrial by defining a multivariate response for each woman.Each woman is classified as an initiator or noninitiator ineach 2-year follow-up interval. An initiator versus nonini-tiator HR is then estimated from the follow-up of eachsuch “stratum” with appropriate provision for dependen-cies that arise from an individual woman contributing toseveral (up to 8) HR estimates. There was little evidencethat such HR estimates differed among strata, and theresulting common HR estimates agreed closely with cor-responding estimates from the WHI trial with HR estimate(95% CI) of 1.42 (0.92–2.20) for the first 2 years of use,and 0.96 (0.78 –1.18) over the entire follow-up period.Note that this type of methodology for emulating clinicaltrials was not needed for analysis of the WHI observationalstudy because there were few hormone initiators aftercohort enrollment.
Hernan et al go on to describe a possible interaction(P � 0.08) of HR with years from menopause to initiation ofhormone therapy. Among women having fewer than 10 yearsfrom menopause to initiation of hormones, the HR (95% CI)was 1.28 (0.62–0.84) in the first 2 years of follow-up, and0.81 (0.56–1.17) thereafter. Such an interaction was notevident in the WHI trial and would benefit from study in othersettings.
Prentice Epidemiology • Volume 19, Number 6, November 2008
© 2008 Lippincott Williams & Wilkins786
Intention-to-Treat and Adherence AdjustmentHernan et al include some rather harsh criticisms of
intention-to-treat (ITT) analyses, indicating that ITT esti-mates “may be unsatisfactory when studying efficacy, andinappropriate when studying the safety, of an active treatmentcompared with no treatment.” It seems worth reiterating thatof the various analyses discussed here, it is only for the ITTcomparisons in the clinical trial that we can be sure thetreated and untreated groups were fully comparable at enroll-ment. Hence, if the clinical outcomes are equally ascertainedbetween the active and placebo groups, a causal interpretationfor the treatment and its sequelae is justified for any differ-ences that emerge. By comparison, what Hernan et al refer toas an ITT analysis of the NHS data attempts to argue towarda causal interpretation by virtue of careful confounding con-trol, and accommodation of time of hormone initiation, andtime since hormone initiation. There is limited ability in theabsence of corresponding clinical trial data to assess thesuccess of these efforts.
However, there are important questions to answer be-yond ITT comparisons. One is the magnitude of treatmenteffects among study subjects who adhere to the treatmentregimen. Even the clinical trial setting does not allow anestimate of risk for adherent women without making addi-tional assumptions. Women who adhere to treatment ornontreatment status may have many biobehavioral differ-ences from those who do not, and these characteristics maydiffer between treated and nontreated groups. A trial that isable to maintain an effective blinding of active versus placebostatus may yield fairly comparable groups of adherent women.5
Nevertheless, WHI investigators describe comparisons be-tween women adherent to active and placebo pill-taking as“sensitivity analysis,” to alert the reader to possible noncom-parability between these groups.
Some adherence-adjusted analyses in WHI have simplycensored the follow-up of women soon after they becomenonadherent. Including inverse censoring probability weight-ing as in Hernan et al, could presumably enhance thesecomparisons by restoring a contrast that is theoretically ap-plicable to the entire randomized group. Although thismethod is a useful step forward, the justification for theadherence-adjusted HRs that emerge depends directly on theability to model the nonadherence process. Doing so isanalogous to modeling for control of confounding. The fac-tors that determine adherence to each treatment group in thestudy population must be accurately measured and correctlymodeled. It would seem that the knowledge base for this typeof analysis is still limited, arguing for a suitably circumspectinterpretation of resulting HR estimates. HRs among adherentwomen tend to be more extreme in their departure from thenull than do ITT analyses for both the cardiovascular diseaseand breast cancer outcomes for each of the data sourcesconsidered here.
Excellent progress has been made in recent decades onthe development of data analytic methods for trials andobservational studies emanating, in part, from the Cox17 HRregression model and its multivariate extensions. The reanal-ysis by Hernan et al strongly suggests that the use of thesemethods can strengthen the analysis and interpretation ofobservational studies. Still, it seems evident that clinical trialsare needed when preventive interventions are widely used orwhen the public health implications are sufficiently large. Inthe special case of postmenopausal hormone therapy, thestate of knowledge of health benefits and risks is quitedifferent following the WHI trials than had been assumed inadvance. It is interesting to question whether an early eleva-tion in CHD risk, or a more sustained elevation in stroke anddementia risk,18–20 would have been identified in the absenceof clinical trial data.
REFERENCES1. Stampfer MJ, Colditz GA. Estrogen replacement therapy and coronary
heart disease: a quantitative assessment of the epidemiologic evidence.Prev Med. 1991;20:47–63.
2. Grady D, Rubin SM, Petitti DB, et al. Hormone therapy to preventdisease and prolong life in postmenopausal women. Ann Intern Med.1992;117:1016–1036.
3. Beral V, Million Women Study Collaborators. Breast cancer and hor-mone-replacement therapy in the Million Women Study. Lancet. 2003;362:419–427.
4. Collaborative Group on Hormonal Factors in Breast Cancer. Breastcancer and hormone replacement therapy: collaborative reanalysis ofdata from 51 epidemiological studies of 52,705 women with breastcancer and 108,411 women without breast cancer. Lancet. 1997;350:1047–1059.
5. Rossouw JE, Anderson GL, Prentice RL, et al. Risks and benefits ofestrogen plus progestin in healthy postmenopausal women: principalresults from the Women’s Health Initiative randomized controlled trial.JAMA. 2002;288:321–333.
6. Chlebowski RT, Hendrix SL, Langer RD, et al. Influence of estrogenplus progestin on breast cancer and mammography in healthy postmeno-pausal women: the Women’s Health Initiative randomized trial. JAMA.2003;289:3243–3253.
7. Manson JE, Hsia J, Johnson KC, et al. Estrogen plus progestin and therisk of coronary heart disease. N Engl J Med. 2003;349:523–534.
8. Prentice RL, Langer R, Stefanick ML, et al. Combined postmenopausalhormone therapy and cardiovascular disease: toward resolving the dis-crepancy between observational studies and the Women’s Health Initia-tive clinical trial. Am J Epidemiol. 2005;162:404–414.
9. Anderson GL, Limacher M, Assaf AR, et al. Effects of conjugatedequine estrogen in postmenopausal women with hysterectomy: theWomen’s Health Initiative randomized controlled trial. JAMA. 2004;291:1701–1712.
10. Hsia J, Langer RD, Manson JE, et al. Conjugated equine estrogens andcoronary heart disease: the Women’s Health Initiative. Arch Intern Med.2006;166:357–365.
11. Stefanick ML, Anderson GL, Margolis KL, et al. Effects of conjugatedequine estrogens on breast cancer and mammography screening inpostmenopausal women with hysterectomy. JAMA. 2006;295:1647–1657.
12. Prentice RL, Langer RD, Stefanick ML, et al. Combined analysis ofWomen’s Health Initiative observational and clinical trial data onpostmenopausal hormone treatment and cardiovascular disease. Am JEpidemiol. 2006;163:589–599.
13. Prentice RL, Chlebowski RT, Stefanick ML, et al. Estrogen plus pro-gestin therapy and breast cancer in recently postmenopausal women.Am J Epidemiol. 2008;167:1207–1216.
14. Prentice RL, Chlebowski RT, Stefanick ML, et al. Conjugated equine
Epidemiology • Volume 19, Number 6, November 2008 Analytic Epidemiology Reliability
© 2008 Lippincott Williams & Wilkins 787
estrogens and breast cancer risk in the Women’s Health Initiative clinicaltrial and observational study. Am J Epidemiol. 2008;167:1407–1415.
15. Hernan MA, Alonso A, Logan R, et al. Observational studies analyzed likerandomized experiments: an application to postmenopausal hormone ther-apy and coronary heart disease. Epidemiology. 2008;19:766–779.
16. Prentice RL, Pettinger M, Anderson GL. Statistical issues arising inthe Women’s Health Initiative (with discussion). Biometrics. 2005;61:899 –941.
17. Cox DR. Regression models and life tables (with discussion). J R StatSoc B. 1972;34:187–220.
18. Wassertheil-Smoller S, Hendrix SL, Limacher M, et al. Effect of estrogenplus progestin on stroke in postmenopausal women: the Women’s HealthInitiative: a randomized trial. JAMA. 2003;289:2673–2684.
19. Hendrix SL, Wassertheil-Smoller S, Johnson KC, et al. Effects ofconjugated equine estrogen on stroke in the Women’s Health Initiative.Circulation. 2006;113:2425–2434.
20. Shumaker SA, Legault C, Rapp SR, et al. Estrogen plus progestin andthe incidence of dementia and mild cognitive impairment in postmeno-pausal women: the Women’s Health Initiative Memory Study: a ran-domized controlled trial. JAMA. 2003;289:2651–2662.
A Call for Nominations:The 2009 Rothman EPIDEMIOLOGY Prize
EPIDEMIOLOGY presents an annual award for the best paper published by the ournal during the previous year. The prize of$3,000 and a plaque goes to the author whose paper is selected by the Editors and the Editorial Board for its originality,importnace, clarity of thought, and excellence in writing.
With this issue, we close our 2008 volume. We invite our readers to nominate papers published during the past year. Pleaseemail your nominations to Allen Wilcox, Editor-in-Chief: [email protected].
Nominations must be received no later than 31 December 2008. The winner will be announced in our September 2009 issueand at the annual meeting of the American College of Epidemiology.
This award is made possible by an endowment from Hoffman-LaRoche Ltd., managed by the American College of Epidemiology.
Prentice Epidemiology • Volume 19, Number 6, November 2008
© 2008 Lippincott Williams & Wilkins788
REJOINDER
Authors’ Response, Part I: Observational Studies AnalyzedLike Randomized Experiments
Best of Both Worlds
Miguel A. Hernána and James M. Robinsb
W e thank the 3 discussants for their contributions. The Women’ Health Initiative (WHI)investigators found a greater CHD risk in the estrogen plus progestin (ie, combined
hormone) therapy arm than in the placebo arm of the trial (hazard ratio �HR�: 1.24, 95%confidence interval �CI�: 1.00–1.54).1 In contrast, the Nurses’ Health Study (NHS)investigators found a lower CHD risk in current users of combined hormone therapy thanin never users (HR: 0.68, 95% CI: 0.55–0.83, in their most recent publication).2 Weinvestigated possible reasons for this discrepancy by reanalyzing the NHS data; we useda novel approach that conceptualizes a follow-up observational study as a sequence of“trials.”3 The discussants disagree sharply in their assessments of the value of this analyticstrategy. Prentice4 and Hoover5 are positive, whereas Stampfer6 finds that our approachcombines the limitations of both observational studies and randomized trials, gives biasedadherence-adjusted HR estimates, and “adds no new insights on the relation of hormonetherapy to CHD.” He criticizes our approach for its complexity, its need for additionalassumptions, and its “black box” nature, and argues for the continued use of theconventional methods routinely employed in NHS publications, owing to their transpar-ency and validity. We now address each of these criticisms.
New InsightsConsider the question of “new insights.” Our reanalysis suggests there is a
short-term increase in CHD incidence after initiation of combined hormone therapyamong all NHS women. Furthermore, our reanalysis suggests effect modification of theHR for combined hormone therapy by years since menopause (P value: intention-to-treat0.08, adherence-adjusted 0.01). Neither of these results is found in any previous NHSanalyses. On the other hand, these results are consistent with the WHI estimates1 although,as pointed out by Prentice4 the P value for interaction is �0.05 in the WHI only when timesince menopause is coded as an ordered categorical variable.7
Thus our analyses contain 3 new insights. First, discrepancies between previousNHS and WHI results in regard to the 2 results above appear to be due to the NHS analyticapproach and not to any inherent problems in the NHS data. Second, these discrepanciesdisappear when our approach is used to analyze the NHS data. Third, our results areconsistent with the so-called “timing hypothesis,” which states that the increased CHDrisk is concentrated in women who start combined hormone therapy many years aftermenopause. It is perplexing that, in his discussion of the timing hypothesis, Stampfer doesnot mention either the evidence provided by our paper, or the relative lack of evidence in
From the aDepartment of Epidemiology, Harvard School of Public Health, Boston, Massachusetts, Harvard-MIT Division of Health Sciences and Technology,Boston, Massachusetts; bDepartments of Epidemiology and Biostatistics, Harvard School of Public Health, Boston, Massachusetts.
Supported by National Institutes of Health grant HL080644.Supplemental material for this article is available with the online version of the journal at www.epidem.com; click on “Article Plus.”
Copyright © 2008 by Lippincott Williams & WilkinsISSN: 1044-3983/08/1906-0789DOI: 10.1097/EDE.0b013e318188e85f
Epidemiology • Volume 19, Number 6, November 2008 789

a recent NHS paper2 he coauthored, in which the HR esti-mates were �1 both in women near menopause and �10years from menopause.
Our reanalysis of the NHS reconciles these previouslydiscrepant results, but leaves important questions unan-swered: the effect modification by time-since-menopause wasfound in both the WHI and the NHS, but was not found by usin a British population in which a different type of combinedhormone therapy was used.8 Also, our reanalysis, but not theWHI, suggested effect modification by age.3 Finally, theapparent discrepancies between WHI estimates and previousNHS estimates were most noticeable for CHD and overallmortality; our reanalysis has focused only on CHD.
Bias RebuttalConsider next Stampfer’s claim that there is empirical
evidence of bias in our adherence-adjusted HR estimates. Heargues that the adherence-adjusted HR estimate of 0.85 in the8� years stratum must be wrong, because it differs onlynegligibly from the unadjusted (ie, intention to treat �ITT�)estimate of 0.87, and yet most stratum members were non-adherent. We make 2 points in rebuttal: the first a bit subtleand the other not. The adherence-adjusted effect will be lessthan the unadjusted effect only under the hypothesis that com-bined hormone therapy is protective. Thus, Stampfer’s claimrequires that one already accept as true the very hypothesis beingexamined. Second, Stampfer considers only the point estimateof the adherence-adjusted effect, and not the very wideassociated 95% CI (0.22–3.19). The lower confidence limit of0.22 is clearly less than the unadjusted estimate of 0.87. Infact, it is because of the large degree of uncertainty in the 8�year stratum that we restricted the survival curves in Figures1 and 3 to the first 8 years of follow-up.
Whose Black BoxTo align our discussion with Stampfer’s concerns, we
henceforth take as our inferential goal the estimation of theeffect of continuous combined hormone therapy on CHD riskin postmenopausal NHS women. The conventional NHSanalytic method compares, at each time, the 2-year risk ofCHD among currently exposed women with that of womennever exposed, adjusting for the current (updated) values ofthe potential confounders. In our view, it is the conventionalmethod, not ours, that is the black box and potentially biased.To justify our claim, we first describe the considerations thatled us to our chosen analytic strategy. We then compare ouradherence-adjusted HR estimate of the effect of continuoushormone therapy with conventional NHS estimates.
Possible ExplanationsA number of different biologic and methodologic ex-
planations for the difference between the WHI and NHSestimates have been proposed. The leading biologic explana-tion is the timing hypothesis. The most common method-
ologic explanations9 are that the NHS observational estimatesare biased for one or more of the following reasons:
a. Healthy initiator bias: women initiating combined hor-mone therapy are at lower risk of CHD than noninitiators(and thus not comparable with the noninitiators), evenwithin levels of the covariates being adjusted for.
b. Healthy continuer bias: among women using combinedhormone therapy, those who continue therapy are at lowerrisk of CHD than those who stop therapy (and thus notcomparable with those who stop), even within levels of thecovariates being adjusted for.
c. Misclassification of the hormone exposure of initiators.The NHS analyses updated hormone status at the time ofquestionnaire return, resulting in misclassification of ex-posure during the period from initiation of therapy toquestionnaire return, a period of up to 2 years.
To assess the importance of these 3 explanations, weused the NHS data and the published data on ITT from theWHI. First, we eliminated, to the extent possible, the mis-classification bias (c) by beginning follow-up at the estimateddate of therapy initiation, as described in the paper.
Consider next the bias due to explanations (a) and (b).Because the noncomparability in those explanations repre-sents confounding by unmeasured factors, one might guessthat the bias in the adherence-adjusted HR attributable to thisnoncomparability would not be empirically estimable. Sur-prisingly, as described next, the bias can be empiricallyestimated with (and essentially only with) an ITT analysisunder some often reasonable additional assumptions.
ITT Estimates of BiasWe set out to quantify the degree of healthy initiator bias
(a) in the NHS by conceptualizing the NHS as a sequence of“trials” of therapy initiation. Specifically, if the healthy initiatorbias is small, then within strata of those baseline risk factors withdifferent distributions in the WHI and NHS (eg, years frommenopause), the ITT effect of therapy initiation on CHD shouldbe similar in the WHI and NHS trials, provided that the 2 studiesalso have similar rates of (and reasons for) nonadherence. Therate of noncompliance at 6 years was 42% (WHI) versus 55%(NHS) in initiators and 11% (WHI) versus 13% (NHS) in thenoninitiators.10 The relatively close agreement between the ITTresults in the NHS and WHI reported in our paper is consistentwith minimal healthy initiator bias (a) and with success ineliminating most misclassification (c) in the NHS. However, theevidence just cited is not as strong as it might appear, becausethe definitions of nonadherence in the WHI and in our paper arenot the same. We hope to apply a single definition of nonadher-ence to both the NHS and WHI in the future.
We next set out to quantify the healthy continuer bias(b) in the NHS by conceptualizing the NHS as a sequence oftrials of therapy discontinuation (this is described in Appen-dix A5 of our paper3). Specifically, the ITT HR estimate of
Hernán and Robins Epidemiology • Volume 19, Number 6, November 2008
© 2008 Lippincott Williams & Wilkins790
1.13 (95% CI � 0.82–1.56) for discontinuers versus continuerscan be used to estimate an upper bound on the healthy continuerbias: the difference of 0.13 by which the ITT HR exceeds 1estimates an approximate upper bound on the relative bias in theadherence-adjusted HR attributable to healthy continuer bias,except when the true effect of therapy on CHD is both delete-rious and of substantive importance.
When as in the NHS, few subjects continue on therapyfor prolonged periods, the difference between the approxi-mate bound and the actual bias will be small, even whentherapy is either moderately deleterious or moderately bene-ficial. As a result, the worse the adherence, the better our ITTestimate of the healthy continuer bias!
Thus, under the assumption encoded in explanation (b)that women continuing therapy are healthier than those dis-continuing, our ITT analysis succeeded in (approximately)bounding the healthy continuer bias without requiring arandomized trial of hormone discontinuation for comparison.By an analogous argument, an approximate upper bound onthe healthy initiator bias could be derived from our ITTanalysis of therapy initiation in the NHS, even without theWHI trial of hormone initiation for comparison. The criticalrole of these ITT analyses in producing evidence againstexplanations (a), (b), and (c) is not addressed by Stampfer inhis discussion.
Estimates of the Effect of ContinuousTreatment
As discussed above, when follow-up begins at theestimated date of therapy initiation, any bias attributable toexplanations (a), (b), and (c) is likely small. We thereforeused our adherence-adjusted HR estimator to estimate theeffect of continuous combined hormone therapy on CHDunder the assumption that all 3 explanations are false. Thisassumption implies that confounding by unmeasured factorsand misclassification of therapy are both absent. Furthermorethis assumption guarantees that our adherence-adjustedHR estimator is unbiased for the causal effect of continu-ous therapy, provided our models for CHD and hormoneinitiation/discontinuation (used in estimation of the inverseprobability weights) are correctly specified.
In contrast, even in the absence of model misspecifica-tion, this assumption does not suffice to ensure that theconventional NHS analytic approach is unbiased. In fact, asdiscussed in our paper, conventional NHS estimates areguaranteed to be unbiased only when the measured time-dependent confounders for therapy initiation and discontinu-ation are not themselves affected by hormone use. Otherwise,the conventional NHS estimates may be biased in any direc-tion, either toward or away from the null. In the electronicAppendix we provide both a heuristic explanation and a graph-ical proof of the bias. Thus our approach requires fewer priorassumptions for its validity than the conventional NHS ap-proach, despite Stampfer’s statement to the contrary. In fact,
even Stampfer’s statement that our approach uses more model-ing assumptions is inaccurate. The sole non-conventional as-sumption we use is the (empirically testable) assumption that ourmodel for hormone initiation/discontinuation is nearly correct;symmetrically, as documented below, the conventional NHSanalysis uses modeling assumptions that we do not.
It follows that if past use of combined hormone therapyaffects some current (updated) covariate, the only strictlyvalid approach to determining whether a conventional NHSeffect estimate is biased (and, if so, the direction and mag-nitude of that bias) is by comparing the NHS estimate to someknown unbiased estimate of the effect of continuous exposure(ie, our adherence-adjusted HR estimate or another of theso-called g-method estimates listed in the Appendix).
We have made a large number of such comparisons. Wefind that, in the absence of model misspecification, conventionalestimates are generally only slightly biased except when (eg, inobservational studies of the effect of antiretroviral therapy ontime to AIDS or death) there is strong confounding by time-dependent covariates (eg, CD4 cell count) and past treatment hasa sizable effect on the covariates.
Turn now to precision. All CHD events in current userscontribute to the conventional NHS estimates. In contrast,only CHD events in continuous users contribute to ouradherence-adjusted estimates. Therefore, our adherence-ad-justed estimates are less precise than conventional NHSestimates (compare the standard errors in Table 5 of our paperwith those in the last 5 columns of the 0–24 months row inTable 6). However, with regard to the effect of continuoustreatment, the greater precision of the NHS analysis comes atthe price of an additional modeling assumption–the assump-tion that the HR among all current users is equal to the HRamong the continuous users.
We therefore expected that, unless this additional model-ing assumption was grossly wrong, conclusions concerning thelong-term effect of continuous therapy based on a conventionalNHS analysis would be consistent with, but more precise than,those based on our adherence-adjusted analysis. Although thisexpectation was largely fulfilled, there is an apparent exceptionregarding effect modification by years since menopause. Spe-cifically, we obtained an HR of 1.20 (0.78–1.84) in women �10years from menopause, an HR of 0.54 (0.19–1.51) in women�10 years from menopause, and an interaction P value of 0.15when we fit separate models to women �10 years and to women�10 years from menopause. To increase the power to detect aninteraction, we also added a single product term (the indicatorfor combined hormone therapy times the indicator for �10 yearsfrom menopause) to the model for the overall HR, and tested thehypothesis that the coefficient of this product term was zero. Theinteraction P value from this more powerful test was 0.01. Incontrast, the conventional NHS analysis reported by Stampfer etal found HRs of 0.90 (0.62–1.29) in women �10 years and 0.71(0.56–0.89) in women �4 years from menopause with an
Epidemiology • Volume 19, Number 6, November 2008 Rejoinder
© 2008 Lippincott Williams & Wilkins 791

interaction P value of 0.28 (calculated from the authors’ table 2in reference 2) based on separate models in women �4 and �10years from menopause. Interaction P values from a more pow-erful test were neither reported nor calculable. The authors chose�4 years to define a woman “near menopause” becausethey “believed a 6 years cut-off was too long;” they did notindicate if this belief was based on empirical evidence in theNHS data. At present, we do not know whether this apparentexception is a consequence of a larger than expected bias inthe conventional estimate of the interaction, other unexploreddifference in analytic detail, or sampling variability. Regard-less, the fact remains that conventional estimates requirevetting by comparison with g-method estimates before theycan be trusted.
Hazard Ratio versus Survival CurvesA particular example of selection bias due to condition-
ing on variables affected by treatment can occur when thehazard ratio is chosen as the effect measure. As an example,suppose combined hormone therapy causes a CHD eventwithin 2 years among a substantial fraction of the womenwho have underlying undiagnosed coronary atherosclerosis atthe time of therapy initiation, and has no effect among otherwomen. Thus combined hormone therapy benefits no one.The average HR will be greater than 1 during the first 2 yearsafter initiation, and less than 1 after the first 2 years. This is sobecause most of the hormone-exposed susceptible women willhave developed CHD within 2 years of initiation and thus areremoved from the calculation of the hazard ratio after year 2. Incontrast, many unexposed susceptible women will surviveCHD-free for 2 years; their later CHD events will contribute tothe post year-2 HR. However, the survival (or, symmetrically,the cumulative incidence) curves for treated and untreatedwomen would separate at the start of follow-up and slowlyconverge over time but never cross.11,12
Whenever the survival curves fail to cross, it is alwayspossible that therapy benefits no one, even if the time-specificHR is less than 1 for most of the follow-up period. ThusStampfer is incorrect in saying that convergence of theWHI curves (1) suggests protection, unless there were clearstatistical evidence that the curves actually crossed. Suchevidence is lacking in the WHI publications.
Next consider an analysis that excludes the first 2 yearsof follow-up. Such an analysis implicitly conditions on sur-viving without CHD for 2 years, an event affected by priortherapy. It follows that one would estimate an average HR�1 and could erroneously conclude that therapy is beneficial.
This discussion is directly relevant to the interpretation ofNHS data. As discussed in our paper, previous NHS analysesbegin follow-up at the time of questionnaire return, whichexcludes from the analyzed person-time of hormone users aninitial post initiation period of up to 2 years. Hence, the previousNHS analyses implicitly condition on surviving without CHD tothe next questionnaire, an event affected by treatment.
In fact, the single most important difference between ouradherence-adjustment approach and the conventional approachmay be that we formulated the question of interest explicitly“what would be the relative risk of CHD comparing hormonetherapy initiators and non initiators had they adhered to theirinitial treatment status during the entire follow-up?” Our meth-odology, including our attempts to start follow-up at the time oftherapy initiation rather than at the time of questionnaire return,follows naturally from asking this question. Thus, contrary toStampfer’s assertion that our approach combines the worstlimitations of both randomized trials and observational studies,in fact our analysis combines the strengths of one of the bestavailable observational studies–large sample size, long follow-up, multiple longitudinal measurements—with a major strengthof randomized trials–a well defined scientific question.
REFERENCES1. Manson JE, Hsia J, Johnson KC, et al. Estrogen plus progestin and the risk of
coronary heart disease. N Engl J Med. 2003;349:523–534.2. Grodstein F, Manson JE, Stampfer MJ. Hormone therapy and coronary heart
disease: the role of time since menopause and age at hormone initiation. JWomens Health (Larchmt). 2006;15:35–44.
3. Hernan MA, Alonso A, Logan R, et al. Observational studies analyzed likerandomized experiments: an application to postmenopausal hormone ther-apy and coronary heart disease. Epidemiology. 2008;19:766–779.
4. Prentice R. Data analysis methods and the reliability of analytic epide-miologic research. Epidemiology. 2008;19:785–788.
5. Hoover RN. The Sound and the Fury: Was It All Worth It? Epidemiol-ogy. 2008;19:780–782.
6. Stampfer MJ. ITT for observational data - worst of both worlds?Epidemiology. 2008;19:783–784.
7. Manson JE, Bassuk SS. Invited commentary: hormone therapy and riskof coronary heart disease—why renew the focus on the early years ofMenopause? Am J Epidemiol. 2007;166:511–517.
8. Prentice RL, Pettinger M, Anderson GL. Statistical issues arising in theWomen’s Health Initiative. Biometrics. 2005;61:922–930.
9. Grodstein F, Clarkson TB, Manson JE. Understanding the divergent data onpostmenopausal hormone therapy. N Engl J Med. 2003;348:645–650.
10. Rossouw JE, Anderson GL, Prentice RL, et al. Risks and benefits ofestrogen plus progestin in healthy postmenopausal women: principalresults from the Women’s Health Initiative randomized controlled trial.JAMA. 2002;288:321–333.
11. Hernan MA, Hernandez-Díaz S, Robins JM. A structural approach toselection bias. Epidemiology. 2004;15:615–625.
12. Flanders WD, Klein M. Properties of 2 counterfactual effect definitions of apoint exposure �Erratum in: Epidemiology 2008;19:168�. Epidemiology. 2007;18:453–460.
13. Robins JM. A new approach to causal inference in mortality studies withsustained exposure periods–Application to control of the healthy workersurvivor effect. Mathematical Modelling. 1986;7:1393–1512. �Errata inComputers and Mathematics with Applications 1987;14:917–921. Adden-dum in Computers and Mathematics with Applications 1987;14:923–945.Errata to addendum in Computers and Mathematics with Applications.1987;18:477�.
14. Robins JM, Hernan MA. Estimation of the causal effects of time-varyingexposures. In: Fitzmaurice G, Davidian M, Verbeke G, et al. eds.Advances in Longitudinal Data Analysis. New York: Chapman andHall/CRC Press; 2009.
15. van der Laan MJ, Petersen ML, Joffe MM. History-adjusted marginalstructural models and statically-optimal dynamic treatment regimens. IntJ Biostat. 2005;1:article 4. (Electronic article). Available at: http://www.be-press.com/ijb/vol1/iss1/4.
16. Robins JM, Hernan MA, Rotnitzky A. Invited commentary: effectmodification by time-varying covariates. Am J Epidemiol. 2007;166:994–1002.
Hernán and Robins Epidemiology • Volume 19, Number 6, November 2008
© 2008 Lippincott Williams & Wilkins792
REJOINDER
Author’s Response, Part IIWalter C. Willett,a JoAnn E. Manson,b Francine Grodsteinc
We encourage new ways of evaluating data, and for this reason the analysis led byHernan et al of estrogen plus progestin menopausal hormone therapy1 was a useful
exercise. At the same time, we agree, however, with the comments of Stampfer2 andPrentice3 regarding the simulated “intention to treat” analysis of epidemiologic data. Inthis application, and perhaps others, this methodology does not seem to provide insightsthat cannot be obtained with existing approaches, and it can add great obscurity andcomplexity; therefore, we do not recommend its routine use.
Regarding other comments by Prentice3 and Hoover,4 the inclusion by Hernan et alof cases of coronary heart disease (CHD) occurring between the onset of hormone use andthe first follow-up questionnaire, which were not included in the previous, traditionalstrictly prospective analysis, had only a very small effect on the overall associationbetween hormone use and CHD. We had included these cases in an earlier sensitivityanalysis,5 and the CHD risk reduction among recently menopausal women who usedhormones remained strong and statistically significant. More important, to simulate theWHI trial in the analysis by Hernan et al, the majority of CHD cases occurring within 10years of menopause (in which hormone use was inversely related to risk of CHD) waseliminated. This gave more weight to hormone use starting more than 10 years aftermenopause (where hormone use was not associated with lower risk of CHD), which doesnot represent actual practice or the previous results from the NHS.
From these and other analyses comparing the results for CHD from therandomized trial and observational studies, it is apparent that the differences areprimarily due to different distributions in time since menopause before startinghormones. Thus, as emphasized by Hoover4 and Mendelsohn and Karas,6 the overallWomen’s Health Initiative results for CHD should not be generalized to the majorityof women who start hormone therapy near the time of menopause, and correspond-ingly the overall results of the NHS and other observational results should not begeneralized to women starting hormone use many years after menopause. As noted byHoover, we have learned much about the complexities surrounding time of initiatinghormone use, which will need to be considered in future studies of various formula-tions, doses, and durations.
REFERENCES1. Hernan MA, Alonso A, Logan R, et al. Observational studies analyzed like randomized experiments: an
application to postmenopausal hormone therapy and coronary heart disease. Epidemiology. 2008;19:766–779.
2. Stampfer MJ. ITT for observational data–worst of both worlds? Epidemiology. 2008;19:783–784.3. Prentice RL. Data analysis methods and the reliability of analytic epidemiologic research. Epidemiology.
2008;19:785–788.4. Hoover RN. The sound and the fury: was it all worth it? Epidemiology. 2008;19:780–782.5. Grodstein F, Manson JE, Stampfer MJ. Hormone therapy and coronary heart disease: the role of time since
menopause and age at hormone initiation. J Womens Health (Larchmt). 2006;15:35–44.6. Mendelsohn ME, Karas RH. HRT and the young at heart. N Engl J Med. 2007;356:2639–2641.
From the aDepartment of Nutrition, Harvard School of Public Health, and Department of Medicine, Channing Laboratory, Brigham and Women’s Hospital,Boston, Massachusetts; bBrigham and Women’s Hospital, Division of Preventive Medicine, Boston, Massachusetts; and cDepartment of Medicine,Channing Laboratory, Brigham and Women’s Hospital, Boston, Massachusetts.
Copyright © 2008 by Lippincott Williams & WilkinsISSN: 1044-3983/08/1906-0793DOI: 10.1097/EDE.0b013e318188e84e
Epidemiology • Volume 19, Number 6, November 2008 793