o 001 wider transport connectivity assessment trans ... · report no 001 wider transport...
TRANSCRIPT
REPORT NO 001
WIDER TRANSPORT CONNECTIVITY ASSESSMENT TRANS-PENNINE TUNNEL STUDY STAGE 1 REPORT
MARCH 2017
Project no: 70026162 Date: March 2017
– WSP | Parsons Brinckerhoff Newcastle (Amber Court) Amber Court William Armstrong Drive Newcastle NE4 7YQ Tel: 01904 615 227 www.wsp-pb.com
WIDER TRANSPORT CONNECTIVITY ASSESSMENT TRANS-PENNINE TUNNEL STUDY
STAGE 1 REPORT
Transport for the North (TfN), Department for Transport (DfT), Highways England

Q U A L I T Y M A N A G E M E N T
ISSUE/REVISION FIRST ISSUE REVISION 1 REVISION 2 REVISION 3
Remarks Final
Date 21/03/2017
Prepared by
WSP|PB
SDG
Volterra
Checked by WSP|PB
Authorised by Nasar Malik
Project number 70026162
Report number 001
File reference 70026162
ii
Trans-Pennine Tunnel Wider Connectivity Study: Stage 1 Report WSP | Parsons Brinckerhoff Transport for the North, Department for Transport, Highways England Project No 70026162 March 2017
P R O D U C T I O N T E A M
CLIENT
TfN Project Sponsor Peter Molyneux
HE Project Manager Kevin Harvey
DfT Representative Karen Wilkinson
WSP | PARSONS BRINCKERHOFF
Project Director Nasar Malik
Project Manager and Transport Planning Lead
Richard Jones
Freight and Ports Lead Ian Brooker
Stakeholder Engagement Lead Carole Lehman
Environmental Lead Kevin Stubbs
Highways Lead Anthony Stalker
SUBCONSULTANTS
SDG Project Director Neil Chadwick
Volterra Wider Economics Lead Paul Buchanan
iii
Trans-Pennine Tunnel Wider Connectivity Study: Stage 1 Report WSP | Parsons Brinckerhoff Transport for the North, Department for Transport, Highways England Project No 70026162 March 2017
C O N T E N T S
INTRODUCTION ...........................................................................1 1
1.1 PURPOSE OF THE REPORT ............................................................................ 1
1.2 INTRODUCTION ................................................................................................ 1
1.3 STUDY OBJECTIVES ........................................................................................ 2
1.4 STAGE 1 OBJECTIVES ..................................................................................... 3
1.5 STUDY AREA..................................................................................................... 3
1.6 STAGE 1 REPORT STRUCTURE ..................................................................... 4
ECONOMIC CONTEXT ................................................................5 2
2.1 INTRODUCTION ................................................................................................ 5
2.2 RELEVANT STRATEGIES AND POLICIES ...................................................... 5
2.3 NORTHERN POWERHOUSE INDEPENDENT ECONOMIC REVIEW (NPIER) ............................................................................................................... 6
2.4 WIDER ECONOMIC BENEFITS ...................................................................... 11
2.5 DISTRIBUTION OF NEW EMPLOYMENT GROWTH ..................................... 14
2.6 KEY FREIGHT INDUSTRIES ........................................................................... 18
2.7 ECONOMIC CONTEXT SUMMARY ................................................................ 20
LOCAL AND REGIONAL CONTEXT ......................................... 21 3
3.1 INTRODUCTION .............................................................................................. 21
3.2 AREA OF INTERVENTION .............................................................................. 21
3.3 AREA OF IMPACT ........................................................................................... 37
3.4 LOCAL AND REGIONAL CONTEXT SUMMARY ........................................... 46
TRANSPORT CONTEXT ............................................................ 47 4
4.1 INTRODUCTION .............................................................................................. 47
4.2 HIGHWAY TRANSPORT CONTEXT ............................................................... 48
4.3 ROAD SAFETY ................................................................................................ 56
iv
Trans-Pennine Tunnel Wider Connectivity Study: Stage 1 Report WSP | Parsons Brinckerhoff Transport for the North, Department for Transport, Highways England Project No 70026162 March 2017
4.4 TRANS-PENNINE ROAD IMPROVEMENTS .................................................. 58
4.5 PUBLIC TRANSPORT CONTEXT ................................................................... 62
4.6 AIRPORT CONNECTIVITY .............................................................................. 65
4.7 FREIGHT .......................................................................................................... 66
4.8 FUTURE DEMAND AND AREA OF INFLUENCE ........................................... 67
4.9 FUTURE TRAFFIC FLOWS AND IMPACT OF A NEW TUNNEL .................. 68
4.10 TUNNEL IMPACT ON FREIGHT ..................................................................... 69
4.11 TRANSPORT CONTEXT SUMMARY ............................................................. 72
ENVIRONMENTAL EVIDENCE .................................................. 74 5
5.1 INTRODUCTION .............................................................................................. 74
5.2 AREA UNDER ANALYSIS ............................................................................... 75
5.3 NATIONAL, NATIONAL PARK AND HIGHWAYS ENGLAND POLICY ........ 75
5.4 REVIEW OF EXISTING CONDITIONS AND CONSTRAINTS ........................ 79
5.5 ENVIRONMENTAL EVIDENCE SUMMARY ................................................... 83
NEED FOR INTERVENTION ...................................................... 85 6
6.1 INTRODUCTION .............................................................................................. 85
6.2 SUMMARY OF EVIDENCE AND INFORMATION OBTAINED ...................... 85
PRELIMINARY VIEW OF INTERVENTIONS ............................. 94 7
7.1 DISTRIBUTION OF TRANS-PENNINE TUNNEL TRAFFIC ........................... 94
7.2 PRELIMINARY VIEW ON INTERVENTIONS .................................................. 95
7.3 INITIAL ASSESSMENT OF DELIVERABILITY ............................................. 101
7.4 NEXT STEPS.................................................................................................. 105
GLOSSARY OF TERMS ......................................................................... 106
BIBLIOGRAPHY ..................................................................................... 109

v
Trans-Pennine Tunnel Wider Connectivity Study: Stage 1 Report WSP | Parsons Brinckerhoff Transport for the North, Department for Transport, Highways England Project No 70026162 March 2017
T A B L E S
TABLE 1-1 SUMMARY OF PROJECT STAGES AND TARGET DELIVERY DATES ....... 1
TABLE 1-2 STUDY OBJECTIVES ...................................................................................... 2
TABLE 2-1 KEY CHAPTER AREAS AND RELEVANCE TO STUDY ................................ 5
TABLE 2-2 REVIEWED STRATEGY AND POLICY DOCUMENTS ................................... 6
TABLE 2-3 ALIGNMENT AND CAPABILITY SCORE FOR NORTHERN REGIONS ........ 8
TABLE 2-4 PROJECTED EMPLOYMENT GROWTH PER ANNUM IN PRIME AND ENABLING CAPABILITIES (NPIER, 2016) ...................................... 9
TABLE 2-5 GVA OUTLOOK PERCENTAGE GROWTH 2017-19 .................................... 10
TABLE 2-6 PROJECTED GVA GROWTH PER ANNUM IN NPIER PRIME AND ENABLING CAPABILITIES ............................................................. 11
TABLE 2-7 AIRPORT PASSENGERS AND FREIGHT INFORMATION (CAA, OCTOBER 2016) ............................................................................................... 13
TABLE 2-8 SUMMARY OF EMPLOYMENT GROWTH DEALS ....................................... 14
TABLE 2-9 AVERAGE FORECAST GDP PER WORKER BY CITY REGION - % GROWTH 2016-51 (DFT, 2016) ..................................................... 15
TABLE 2-10 AVERAGE FORECAST GDP PER WORKER BY CITY REGION 2051 ...... 15
TABLE 3-1 KEY CHAPTER AREAS AND RELEVANCE TO STUDY .............................. 21
TABLE 3-2 COMMUTING FLOWS BETWEEN LOCAL AUTHORITIES WITHIN THE AREA OF INTERVENTION, % BY ORIGIN, 2011 CENSUS ......... 27
TABLE 3-3 COMMUTING FLOWS BETWEEN LOCAL AUTHORITIES WITHIN THE AREA OF INTERVENTION, % BY DESTINATION, 2011 CENSUS27
TABLE 3-4 SUMMARY OF KEY GROWTH SECTORS ................................................... 31
TABLE 4-1 KEY CHAPTER AREAS AND RELEVANCE TO STUDY .............................. 47
TABLE 4-2 SUMMARY OF ROAD BASED JOURNEY TIMES (PEAK TIMES) ............... 52
TABLE 4-3 SUMMARY OF EURORAP RISK RATINGS (COLOUR KEY IN FIGURE 4-9)56
TABLE 4-4 SUMMARY OF PLANNED IMPROVEMENT SCHEMES .............................. 61
TABLE 4-5 SUMMARY OF TRAIN JOURNEY TIMES ..................................................... 62
TABLE 4-6 SUMMARY OF KEY COACH SERVICES ...................................................... 64
TABLE 5-1 KEY CHAPTER AREAS AND RELEVANCE TO STUDY .............................. 74
TABLE 6-1 SUMMARY OF EVIDENCE ECONOMIC CONTEXT ..................................... 85
TABLE 6-2 SUMMARY OF EVIDENCE – LOCAL AND REGIONAL CONTEXT ............. 88
TABLE 6-3 SUMMARY OF EVIDENCE - TRANSPORT CONTEXT ................................ 90
TABLE 6-4 SUMMARY OF EVIDENCE - ENVIRONMENTAL EVIDENCE ...................... 93
TABLE 7-1 INTERVENTION CATEGORIES .................................................................... 95
TABLE 7-2 PROPOSED INTERVENTIONS (EAST OF PDNP) ....................................... 97
TABLE 7-3 PROPOSED INTERVENTIONS (WEST OF PDNP) ...................................... 98
TABLE 7-4 SUMMARY OF HIGHWAYS ISSUES/CONSTRAINTS ............................... 101
vi
Trans-Pennine Tunnel Wider Connectivity Study: Stage 1 Report WSP | Parsons Brinckerhoff Transport for the North, Department for Transport, Highways England Project No 70026162 March 2017
F I G U R E S
FIGURE 1-1 MAP SHOWING COVERAGE OF WIDER AREA OF IMPACT ..................... 4
FIGURE 2-1 WORKERS EMPLOYED IN THE CAPABILITIES BY CITY REGION AND GB AVERAGES (NPIER, 2016) ........................................................ 8
FIGURE 2-2 CAPABILITIES AND ENABLERS BY DISTRICT (CUSTOM HOUSE, 2016) 9
FIGURE 2-3 SECTORAL SPLIT OF EMPLOYMENT (NPIER & VOLTERRA, 2016) ........ 9
FIGURE 2-4 GROWTH OF GDP IN CONSTRUCTION 2016-51 (DFT, 2016) ................. 16
FIGURE 2-5 GROWTH OF GDP IN MANUFACTURING 2016-51 (DFT, 2016) .............. 16
FIGURE 2-6 GROWTH OF GDP IN CONSUMER SERVICES 2016-51 (DFT, 2016) ..... 17
FIGURE 2-7 GROWTH OF GDP IN PRODUCER SERVICES 2016-51 (DFT, 2016) ...... 17
FIGURE 2-8 ASSET MAP OF NORTH'S ADVANCED MANUFACTURING PRIME CAPABILITIES (NPIER, 2016) ....................................................... 18
FIGURE 2-9 MAP SHOWING KEY LOCATIONS FOR LOGISTICS SECTOR IN THE NORTH (NPIER, 2016) ................................................................... 19
FIGURE 3-1 TPT AREA OF INTERVENTION .................................................................. 22
FIGURE 3-2 WORKING-AGE POPULATION AND TOTAL JOBS BY LOCAL AUTHORITY DISTRICT, ONS LOCAL LABOUR MARKET INDICATORS, 2014 ........................................................................ 23
FIGURE 3-3 JOB DENSITY BY LOCAL AUTHORITY DISTRICT, ONS LOCAL LABOUR MARKET INDICATORS, 2014 ........................................................ 23
FIGURE 3-4 POPULATION DENSITY AT MSOA LEVEL (ONS, 2015) ........................... 24
FIGURE 3-5 EMPLOYMENT DENSITY AT MOSA LEVEL (BUSINESS REGISTER AND EMPLOYMENT SURVEY, 2014) .................................................... 25
FIGURE 3-6 PERCENTAGE OF JOBS WITHIN EACH CAPABILITY BY LA DISTRICT 25
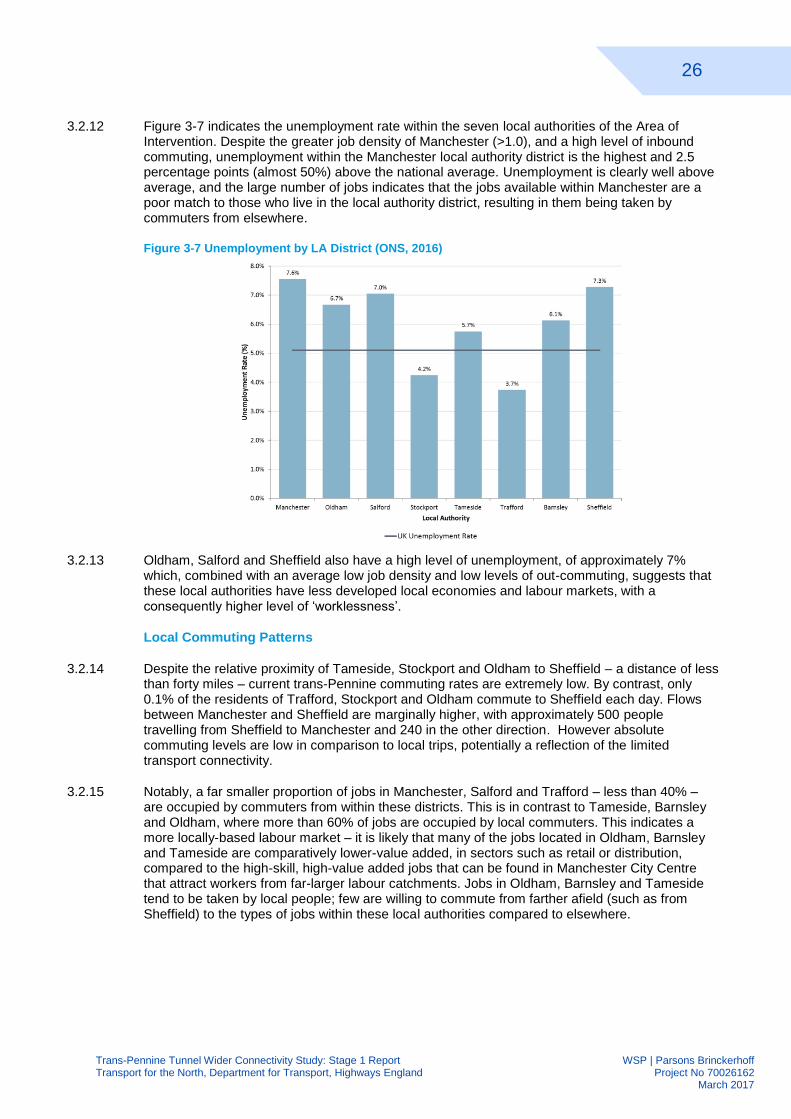
FIGURE 3-7 UNEMPLOYMENT BY LA DISTRICT (ONS, 2016) ..................................... 26
FIGURE 3-8 EXISTING COMMUTING PATTERNS TO MANCHESTER (CENSUS, 2011)28
FIGURE 3-9 EXISTING COMMUTING PATTERNS TO SHEFFIELD (CENSUS, 2011) . 28
FIGURE 3-10 POPULATION AND EMPLOYMENT GROWTH 2016-41 (NTEM, 2016) .. 30
FIGURE 3-11 CHANGE IN JOB DENSITY 2016-41 (NTEM, 2016) ................................. 30
FIGURE 3-12 ENTERPRISE ZONE LOCATIONS (MANCHESTER) ............................... 32
FIGURE 3-13 ENTERPRISE ZONE LOCATIONS (SHEFFIELD) .................................... 33
FIGURE 3-14 EMPLOYMENT/UNEMPLOYMENT RATE (ONS LABOUR FORCE SURVEY, 2016) .............................................................................. 37
FIGURE 3-15 EMPLOYMENT GROWTH BY DISTRICT 2009-15 (ONS, 2016) .............. 38
FIGURE 3-16 EMPLOYMENT GROWTH OF CITIES 2009-15 (ONS, 2016) .................. 39
FIGURE 3-17 (DRAFT) MAJOR ROAD NETWORK FOR THE NORTH MAP AND KEY ECONOMIC NODES (TFN, 2017) .................................................. 40
FIGURE 3-18 HOUSEHOLD GROWTH DISTRIBUTION 2016-41 (TEMPRO, 2016) ..... 41
FIGURE 3-19 EMPLOYMENT GROWTH DISTRIBUTION 2016-41 (TEMPRO, 2016) ... 42
FIGURE 3-20 FORECAST POPULATION GROWTH 2016-39 (ONS, 2014) .................. 43
FIGURE 3-21 FORECAST WORKING AGE POPULATION INDEX 2016-39 (ONS, 2014)43
FIGURE 3-22 JOB DENSITY CHANGES 2016-41 (TEMPRO, 2016) .............................. 44
FIGURE 3-23 JOB DENSITY CHANGE 2016-41 (TEMPRO, 2016) ................................ 45
FIGURE 3-24 WORKING AGE POPULATION AND JOBS GROWTH BY AREA 2016-41 (TEMPRO, 2016) ............................................................................ 45
vii
Trans-Pennine Tunnel Wider Connectivity Study: Stage 1 Report WSP | Parsons Brinckerhoff Transport for the North, Department for Transport, Highways England Project No 70026162 March 2017
FIGURE 4-1 KEY ROUTES ON NETWORK MANAGEMENT MAP (HIGHWAYS ENGLAND, 2017) ............................................................................ 48
FIGURE 4-2 KEY TRAFFIC FLOWS ON SRN AND OTHER ROUTES IN STUDY AREA49
FIGURE 4-3 TRANS-PENNINE AADT AND HGVS (HIGHWAYS ENGLAND, 2015) ...... 50
FIGURE 4-4 TRANS-PENNINE CRF (HIGHWAYS ENGLAND, 2015) ............................ 50
FIGURE 4-5 ROAD BASED JOURNEYS - KEY ROUTES ............................................... 51
FIGURE 4-6 AVERAGE SPEEDS IN STUDY AREA AND POTENTIAL CORRIDOR OPTIONS ........................................................................................ 53
FIGURE 4-7 AVERAGE SPEEDS AT PEAK TIMES ON KEY ROUTES ......................... 54
FIGURE 4-8 VEHICLE HOUR DELAY ON KEY ROUTES ............................................... 55
FIGURE 4-9 EURORAP MAP RISK RATING OF KEY ROUTES .................................... 56
FIGURE 4-10 COLLISION CLUSTER MAP ...................................................................... 57
FIGURE 4-11 MAP SHOWING ROUTES IN SOUTH PENNINES AREA ........................ 58
FIGURE 4-12 SOUTH PENNINES ROUTE STRATEGY INVESTMENT PRIORITIES ... 59
FIGURE 4-13 SOUTH PENNINES ROUTE STRATEGY INVESTMENT PRIORITIES ... 59
FIGURE 4-14 HIGHWAY IMPROVEMENTS AND STUDIES IN NORTH OF ENGLAND 60
FIGURE 4-15 MAP SHOWING HOPE VALLEY LINE ...................................................... 63
FIGURE 4-16 PERCENTAGE GROWTH 2016-41 CAR DRIVER AM AND PM PEAKS . 67
FIGURE 4-17 PERCENTAGE GROWTH 2016-41 BUS AND COACH AM AND PM ...... 67
FIGURE 4-18 PERCENTAGE GROWTH 2016-41 RAIL/METRO AM AND PM .............. 68
FIGURE 4-19 MAP SHOWING FUTURE TRAFFIC FLOW IMPACT WITHIN AREA OF INTERVENTION ............................................................................. 69
FIGURE 5-1 GEOGRAPHIC COVERAGE OF CORE AND WIDER STUDY AREA (ENVIRONMENTAL EVIDENCE) ................................................... 75
FIGURE 7-1 TRAFFIC DISTRIBUTION AM PEAK PERIOD (2041) ................................ 94
FIGURE 7-2 ILLUSTRATIVE PRELIMINARY INTERVENTIONS MAP............................ 96
FIGURE 7-3 M60 NORTH WEST QUADRANT STUDY STAGE 3 PACKAGE OF INTERVENTIONS (2016).............................................................. 100
1
Trans-Pennine Tunnel Wider Connectivity Study: Stage 1 Report WSP | Parsons Brinckerhoff Transport for the North, Department for Transport, Highways England Project No 70026162 March 2017
INTRODUCTION 1
1.1 PURPOSE OF THE REPORT
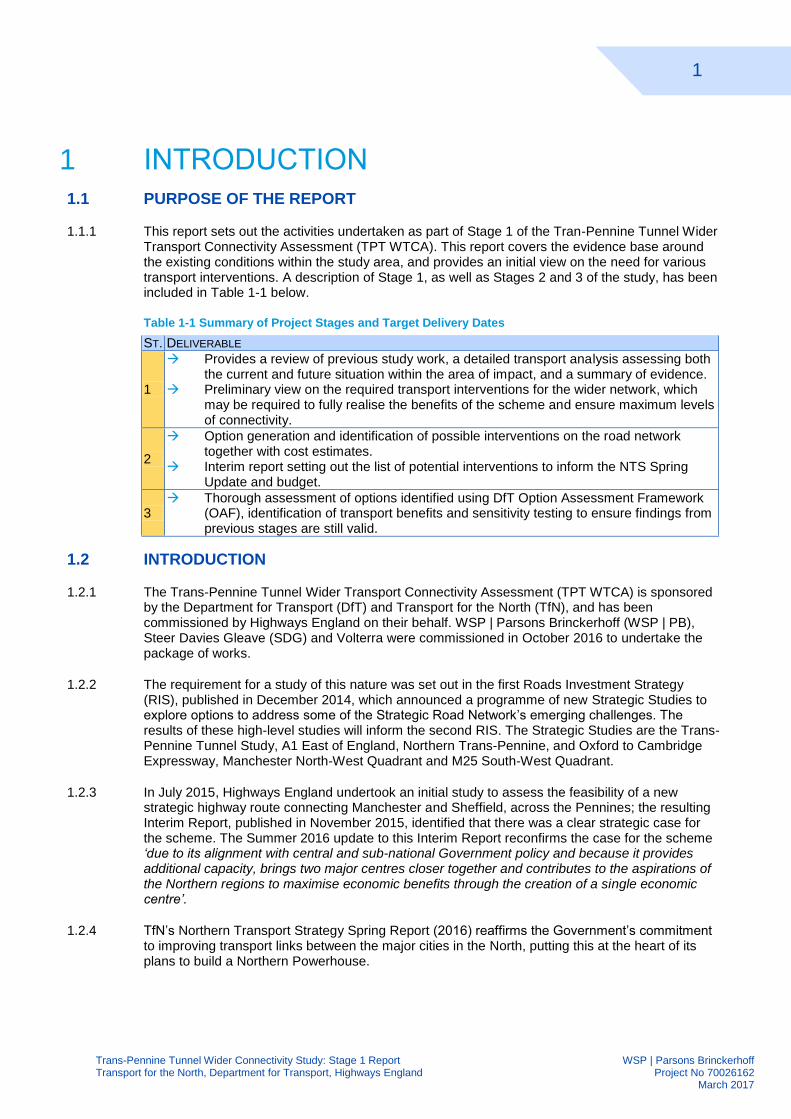
This report sets out the activities undertaken as part of Stage 1 of the Tran-Pennine Tunnel Wider 1.1.1Transport Connectivity Assessment (TPT WTCA). This report covers the evidence base around the existing conditions within the study area, and provides an initial view on the need for various transport interventions. A description of Stage 1, as well as Stages 2 and 3 of the study, has been included in Table 1-1 below.
Table 1-1 Summary of Project Stages and Target Delivery Dates
ST. DELIVERABLE
1
Provides a review of previous study work, a detailed transport analysis assessing both the current and future situation within the area of impact, and a summary of evidence.
Preliminary view on the required transport interventions for the wider network, which may be required to fully realise the benefits of the scheme and ensure maximum levels of connectivity.
2
Option generation and identification of possible interventions on the road network together with cost estimates.
Interim report setting out the list of potential interventions to inform the NTS Spring Update and budget.
3 Thorough assessment of options identified using DfT Option Assessment Framework
(OAF), identification of transport benefits and sensitivity testing to ensure findings from previous stages are still valid.
1.2 INTRODUCTION
The Trans-Pennine Tunnel Wider Transport Connectivity Assessment (TPT WTCA) is sponsored 1.2.1by the Department for Transport (DfT) and Transport for the North (TfN), and has been commissioned by Highways England on their behalf. WSP | Parsons Brinckerhoff (WSP | PB), Steer Davies Gleave (SDG) and Volterra were commissioned in October 2016 to undertake the package of works.
The requirement for a study of this nature was set out in the first Roads Investment Strategy 1.2.2(RIS), published in December 2014, which announced a programme of new Strategic Studies to explore options to address some of the Strategic Road Network’s emerging challenges. The results of these high-level studies will inform the second RIS. The Strategic Studies are the Trans-Pennine Tunnel Study, A1 East of England, Northern Trans-Pennine, and Oxford to Cambridge Expressway, Manchester North-West Quadrant and M25 South-West Quadrant.
In July 2015, Highways England undertook an initial study to assess the feasibility of a new 1.2.3strategic highway route connecting Manchester and Sheffield, across the Pennines; the resulting Interim Report, published in November 2015, identified that there was a clear strategic case for the scheme. The Summer 2016 update to this Interim Report reconfirms the case for the scheme ‘due to its alignment with central and sub-national Government policy and because it provides additional capacity, brings two major centres closer together and contributes to the aspirations of the Northern regions to maximise economic benefits through the creation of a single economic centre’.
TfN’s Northern Transport Strategy Spring Report (2016) reaffirms the Government’s commitment 1.2.4to improving transport links between the major cities in the North, putting this at the heart of its plans to build a Northern Powerhouse.
2
Trans-Pennine Tunnel Wider Connectivity Study: Stage 1 Report WSP | Parsons Brinckerhoff Transport for the North, Department for Transport, Highways England Project No 70026162 March 2017
1.3 STUDY OBJECTIVES
The aim of the TPT Strategic WTCA study is to explore the impact of the shortlisted corridors for a 1.3.1Trans-Pennine Tunnel (TPT) on the wider road network. While Stage 1 of the study is examining the ability of a tunnel to improve regional connectivity this study will enable TfN to better understand the broader impact of the scheme on the wider road and transport network. Key to forming a judgement will be the wider economic costs and benefits of the proposed options, in particular, their impacts on local labour/product markets and the economic geography of the Northern area, allowing an understanding to be formed relating to how the options can act as an enabler of growth. Although outside the area of intervention, the impact of any intervention has the potential to extend from Liverpool City Region to the west and Humberside to the east.
The study objectives are identified in Table 1-2. It is intended that intervention-specific objectives 1.3.2will be developed as the evidence base is complete, and the key problems and issues associated with the area under analysis are identified.
Table 1-2 Study Objectives
STUDY OBJECTIVES
1
Build on the current Trans Pennine Tunnel Study, current investment plans, existing traffic models and other reports in order to:
Identify the impact of each of the shortlisted tunnel options on connectivity to key strategic locations and transport hubs on either side of the Pennines; and
Identify options for improving or modifying strategic transport routes on the wider road network to mitigate impacts and maximise the connectivity benefits of the shortlisted corridors. This could include identification of new routes or links as well as improving existing links to key strategic locations.
2 Consider both Highways England strategic road and local highway authority key strategic route networks as well as key strategic centres including locations such as Manchester Airport, Port of Immingham, Regional / City Centres, urban centres and other major growth areas.
3 Fully understand the likely onward distribution of traffic from the shortlisted tunnel routes.
4
Identify appropriate interventions on the non-Strategic Road Network, including, where appropriate, the Key Route Network, to mitigate impacts and maximise opportunities to create connectivity benefits for each of the shortlisted corridors taking due account of the potential impacts on local communities including issues of severance, air quality and noise.
5 Identify options for potential modifications to known proposed schemes which may be affected by the shortlisted corridors.
6 Consider the impacts of the proposed shortlisted corridors on proposed or programmed schemes outside of the area of intervention.
7 Consider the impacts on the wider public transport network and active modes of each of the shortlisted tunnel options and interventions identified under Objective 4, above.
8
Incorporate the findings of the Manchester M60 North West Quadrant study, in particular assessing the wider impacts and inter-dependencies between the shortlisted corridors and other studies. This will include the implications on the timing and phasing of the potential schemes to minimise their impact on, and risks to, the performance of the network during construction.
9 Understand what the impacts of the tunnel options, and any highway interventions identified, will have on public transport demand within the study area.
3
Trans-Pennine Tunnel Wider Connectivity Study: Stage 1 Report WSP | Parsons Brinckerhoff Transport for the North, Department for Transport, Highways England Project No 70026162 March 2017
In addressing these objectives the study will: 1.3.3
Take due regard of the wider TfN Transport Strategy, local transport and spatial strategies such as those being progressed in Greater Manchester, and where possible the outcomes of other local studies in progress or likely to be undertaken in areas on or adjacent to the proposed scheme.
Incorporate the findings of the DfT’s Land Use / Transport Interaction (LUMIT) modelling that will demonstrate how transport infrastructure may change land use in the future, and what impact this has on productivity and economic growth across the North.
The outputs from the study will be used to inform the second Roads Investment Strategy with the 1.3.4overall programme for constructing ‘RIS 2’ upgrades being 2020 and beyond. It will also be used to inform TfN’s transport policy from 2016 onwards.
1.4 STAGE 1 OBJECTIVES
Stage 1 of the overall TPT WTCA study looks to outline and present the available evidence that 1.4.1will be used to underpin the identification of future infrastructure, which may be needed to fully realise the benefits of a new TPT. The analysis will seek to:
Understand the current and future context and conditions within the area of impact including a review of previous studies, current policy, travel patterns, road congestion and capacity, safety, journey times, bus/rail, environmental constraints, future development, topology, community amenity, socio economics and labour markets.
Examine if there is a case for intervention through the preparation of a sound body of evidence to demonstrate the need for an appropriate improvement scheme.
The overall objective of this Stage 1 report is to review the range of relevant previous study work 1.4.2and policies, and carry out further transport analysis, in order to reach a preliminary view on the required transport interventions for the wider network.
The study links with a range of other on-going TfN multi-modal studies, such as Northern 1.4.3Powerhouse Rail (NPR), and the range of different studies will be considered together in order to provide a multi-modal package of measures.
1.5 STUDY AREA
For the purposes of clarification, the report refers to two study areas throughout: 1.5.1
Area of Intervention – This is the immediate area where various interventions on the transport network are being considered, it is also the area where many benefits may be fully realised such as agglomeration.
Area of Impact – This refers to the wider study area under analysis and is coast to coast. The nature of impact here is largely focused around B2B journeys, freight and port and airport accessibility.
The area of intervention considered as part of the Trans-Pennine Tunnel (TPT) studies extends 1.5.2from Manchester to Sheffield, and is bounded to the West by the M60 Manchester orbital motorway and to the East by the M1 motorway. It is bounded to the North by the town of Holmfirth and extends south to Chapel-en-le-Frith.
4
Trans-Pennine Tunnel Wider Connectivity Study: Stage 1 Report WSP | Parsons Brinckerhoff Transport for the North, Department for Transport, Highways England Project No 70026162 March 2017
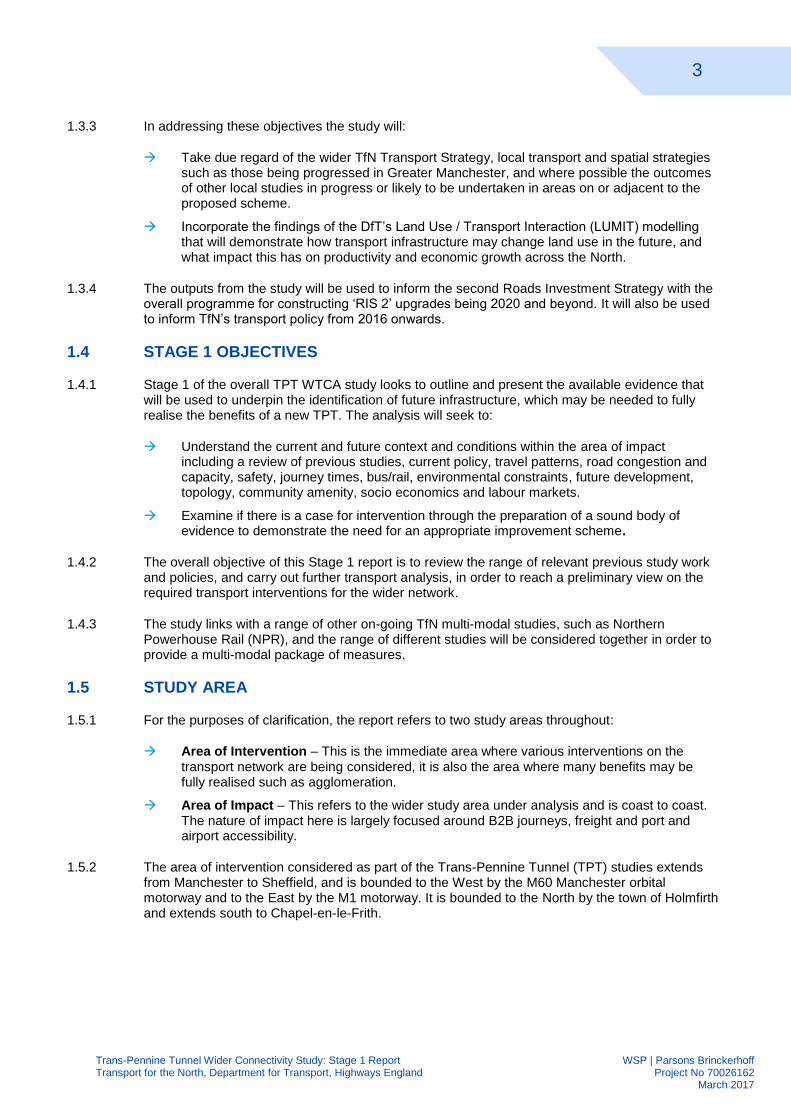
It is important to consider the wider area of impact in order to fully assess the impacts of the 1.5.3shortlisted corridors. Figure 1-1 shows the geographic coverage of the immediate area of intervention and the wider area of impact. In terms of specific routes for the proposed tunnel connection, the immediate study area under analysis comprises of three main tunnel corridors; corridor A, B and C.
Figure 1-1 Map showing Coverage of Wider Area of Impact
1.6 STAGE 1 REPORT STRUCTURE
The remainder of the TPT WTCA Stage 1 Report is structured as follows: 1.6.1
Chapter 2 (Economic Context) – Establishes economic context of northern regions which will be impacted by improved trans-Pennine road links.
Chapter 3 (Local and Regional Context) - Outlines socioeconomic characteristics and describes importance in light of economic context and future forecasts.
Chapter 4 (Transport Context) – Presents current and future transport context as well as analysis carried out in areas such as traffic flows, journey times and reliability.
Chapter 5 (Environmental Evidence) – Provides insight into current environmental context and, in particular, areas either side of the shortlisted TPT corridors.
Chapter 6 (Need for Intervention) – Establishes case for intervention from the body of evidence gathered and highlights key findings of relevance to the study.
Chapter 7 (Preliminary View of Interventions) – Provides an initial view of the range of transport interventions which may be required on the network.
5
Trans-Pennine Tunnel Wider Connectivity Study: Stage 1 Report WSP | Parsons Brinckerhoff Transport for the North, Department for Transport, Highways England Project No 70026162 March 2017
ECONOMIC CONTEXT 2
2.1 INTRODUCTION
This section of the report establishes the economic context of the northern regions which will be 2.1.1impacted by improvements to trans-Pennine road links. It identifies the policies and strategies of relevance and describes the findings and aspirations of the Northern Powerhouse Independent Economic Review (NPIER). The importance of freight and the connectivity offered by airports and ports in the North is explained in the context of their existing and future contribution to economic growth in the North.
Table 2-1 shows the key areas outlined within this chapter of the report and provides a brief 2.1.2description of the relevance of the chapter in the context of the study.
Table 2-1 Key Chapter Areas and Relevance to Study
CHAPTER SECTION RELEVANCE TO STUDY
2.2 Relevant Strategies and Policies
Provides the baseline strategy and policy context to the proposed TPT. Any proposed improvements to transport infrastructure should be planned in accordance with these policies in order to ensure that deliverables are consistent with the wider national framework, and with other infrastructure and development initiatives.
2.3 Northern Powerhouse Independent Economic Review
The NPIER provides insight into the economy of the North, key economic capabilities and enablers, and future growth; this feeds into establishing the case for intervention as well as connectivity and accessibility improvements which will be delivered by the proposed TPT.
2.4 Wider Economic Benefits
Highlights the economic under-performance of the North and need for investment in infrastructure to support the TPT and ensure adequate connections to the SRN which, in turn, will maximise economic benefits.
2.5 Distribution of New Employment Growth
Outlines how new employment growth will be distributed, growth deals and worker productivity across different industries. This sets the context of the current situation with regards to employment growth, and outlines areas of growth which may benefit from the provision of a TPT.
2.6 Key Freight Industries
Shows the location of freight industry concentrations across the North, highlights the strategic importance of the North in terms of freight, and outlines possible future improvements for the northern freight industry. This evidence in this section further supports the need for intervention and sets the context for the impact of the TPT on the freight industry.
2.2 RELEVANT STRATEGIES AND POLICIES
Table 2-2 summarises the range of strategies and policies deemed to be of relevance to the 2.2.1study, which consists of national policy, sub-national policy and previous study work.
It should be noted that the table provides a broad high level summary of the range of strategies 2.2.2and policies which have been considered as part of this Stage 1 report. Full information on each of the respective documents can be found in Appendix A.
6
Trans-Pennine Tunnel Wider Connectivity Study: Stage 1 Report WSP | Parsons Brinckerhoff Transport for the North, Department for Transport, Highways England Project No 70026162 March 2017
Table 2-2 Reviewed Strategy and Policy Documents
CATEGORY POLICY/STRATEGY
National Policy
DfT Local Transport White Paper: Creating Growth, Cutting Carbon: Making Sustainable Local Transport Happen
National Planning Policy Framework
Road Investment Strategy
National Infrastructure Plan 2014
Road Investment Strategy 2015-2020
Fixing the Foundations: Creating a more prosperous nation
Highways England: Strategic Business Plan 2015-2020
Highways England: Delivery Plan 2015-2020
National Infrastructure Delivery Plan
Building our Industrial Strategy Green Paper January 2017
Sub-National Policy
One North: A Proposition for an Interconnected North
The Northern Powerhouse: One Agenda, One Economy, One North
The Northern Transport Strategy: Spring 2016 Report
Independent International Connectivity Commission Report February 2017
Previous Study Work
Trans-Pennine Tunnel Study
Integrated Roads Report (Pending)
Integrated Rail Report (Pending)
Northern Powerhouse Independent Economic Review (NPIER)
Economic Growth & Transport Demand Scenarios
Strategic Local Connectivity
Northern Freight and Logistics Report
Northern Trans-Pennine Routes Strategic Study
M60 North West Quadrant Study
Trans-Pennine Tunnel Report
High Speed North
2.3 NORTHERN POWERHOUSE INDEPENDENT ECONOMIC REVIEW (NPIER)
INTRODUCTION
The NPIER (2016) identified a persistent performance gap between the North and the rest of the 2.3.1country with the North’s output per capita consistently lying 10-15% below the rest of England (excluding London), and larger still when London is included in the comparison. While the performance gap narrowed over the decade from 1999-2009, there are emerging signs that the gap is beginning to widen again. When London is included within the comparison, the performance gap is more persistent, and indicative of London’s economic resilience following the 2008 financial crisis and subsequent Great Recession. The NPIER attributed this performance gap to two features of the Northern economy:
The relatively low proportion of working-age residents in work (economic activity rate); and
The relatively low productivity of those employees.
To close this gap, the NPIER pointed towards two actions. Firstly, the workforce in the North must 2.3.2become more productive and secondly, there needs to be a greater participation rate in the economy, and a greater proportion of the working age population must be in productive work.
While there is a range of factors that lead to lower productivity and economic activity rates in the 2.3.3North, many of these can be affected either directly or indirectly by transport connectivity. For example, people of working-age may not be in employment since they cannot find work that matches their skills and pay expectations within their search horizon. Improving transport connectivity will reduce barriers to searching for employment over a larger geographical area and, once active in the labour market, will allow individuals to make longer-distance commuting trips.
7
Trans-Pennine Tunnel Wider Connectivity Study: Stage 1 Report WSP | Parsons Brinckerhoff Transport for the North, Department for Transport, Highways England Project No 70026162 March 2017
Connectivity improvements can also lead to improvements in productivity through: 2.3.4
Better-matching people and their skills/experience to jobs;
Attracting highly-skilled workers who value the ability to access a range of work and leisure opportunities across the North;
Facilitating opportunities for collaboration on research and development projects;
Attracting footloose Foreign Direct Investment (FDI) capital; and
Knowledge spill-over effects from proximity to competitors and collaborators.
The NPIER goes on to state that greater productivity in the North will be led by businesses in four 2.3.5world-class prime capabilities (advanced manufacturing, health innovation, energy, and digital), supported by three enabling capabilities (financial and professional services, logistics, and education). While the NPIER identifies these seven capabilities as having the strongest potential to grow, together the prime and enabling capabilities account for around only a third of the North’s economy overall. For the productivity gap to be closed, other sectors and industries must also grow and the conditions need to be created that will support and facilitate this growth.
The NPIER sets out a number of barriers to growth that need to be overcome to create the 2.3.6conditions for transformational growth, both in the prime and enabling capabilities and in the wider economy. These are:
The North’s transport connectivity, which falls short of what the North’s economy needs:
The North’s skill base, with the North having a higher share of people with lower skills, and a lower share of people with higher skills; and
The approach to innovation and to inward investment.
NPIER CAPABILITIES IN THE NORTH
The IER highlighted seven existing capabilities in which the North is particularly well positioned to 2.3.7develop, resulting in greater future productivity. These capabilities were determined by aggregating 2-digit Standard Industrial Classification codes into the seven core capabilities:
Advanced Manufacturing
Financial/Professional Services
Health Innovation
Digital
Energy Education Logistics
Data from the latest Business Register and Employment Survey (BRES) has been aggregated to 2.3.8these capabilities using the methodology outlined within the NPIER report. This data has been analysed to understand how these capabilities are currently represented within the City Regions which are most likely to be affected by the improvement of trans-Pennine roads.
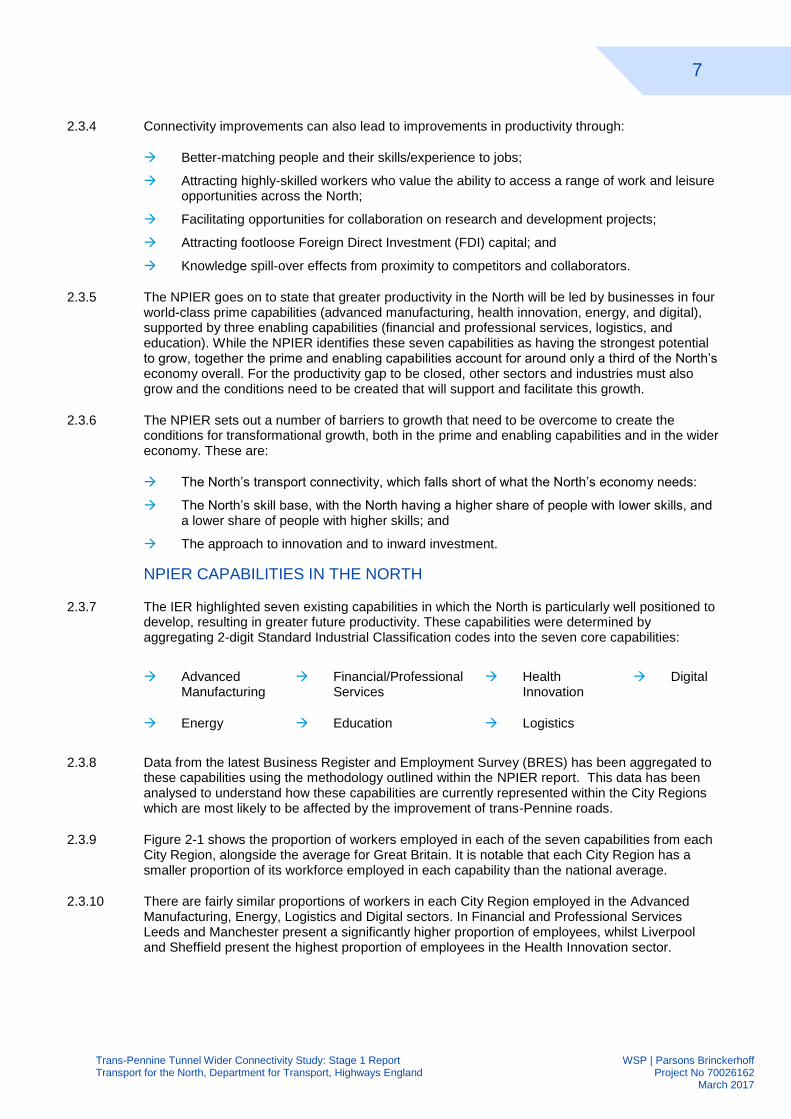
Figure 2-1 shows the proportion of workers employed in each of the seven capabilities from each 2.3.9City Region, alongside the average for Great Britain. It is notable that each City Region has a smaller proportion of its workforce employed in each capability than the national average.
There are fairly similar proportions of workers in each City Region employed in the Advanced 2.3.10Manufacturing, Energy, Logistics and Digital sectors. In Financial and Professional Services Leeds and Manchester present a significantly higher proportion of employees, whilst Liverpool and Sheffield present the highest proportion of employees in the Health Innovation sector.
8
Trans-Pennine Tunnel Wider Connectivity Study: Stage 1 Report WSP | Parsons Brinckerhoff Transport for the North, Department for Transport, Highways England Project No 70026162 March 2017
Figure 2-1 Workers Employed in the Capabilities by City Region and GB Averages (NPIER, 2016)
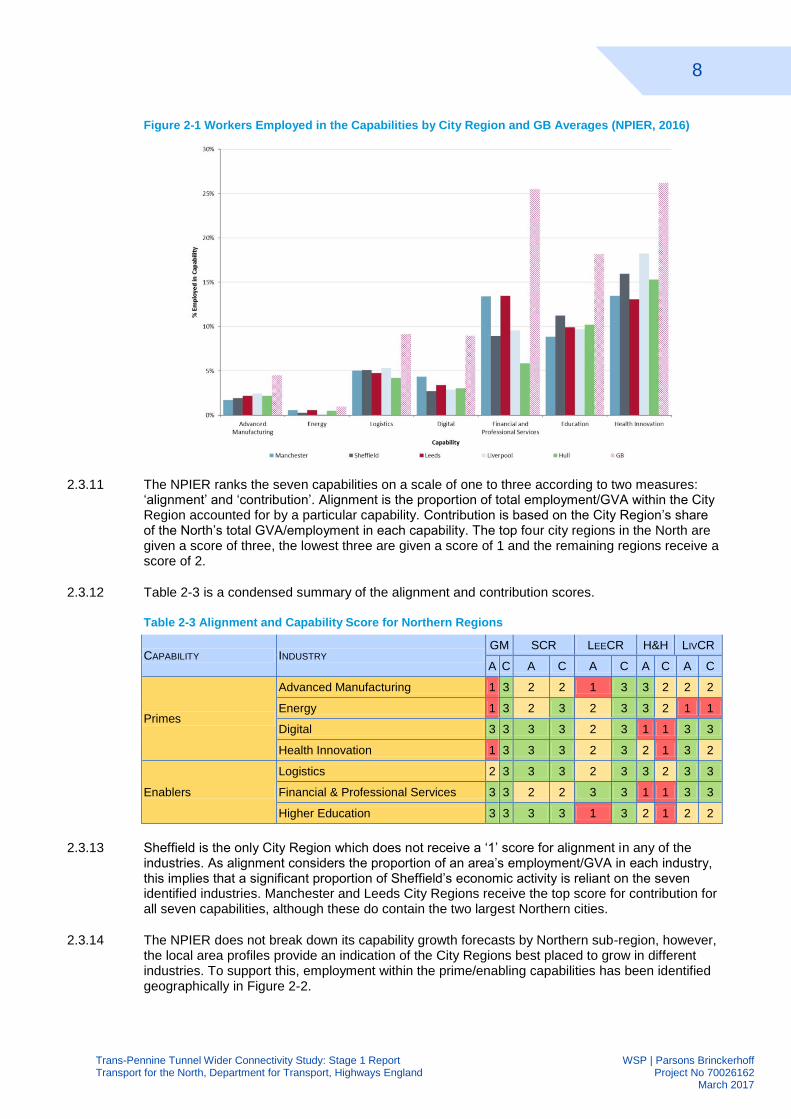
The NPIER ranks the seven capabilities on a scale of one to three according to two measures: 2.3.11‘alignment’ and ‘contribution’. Alignment is the proportion of total employment/GVA within the City Region accounted for by a particular capability. Contribution is based on the City Region’s share of the North’s total GVA/employment in each capability. The top four city regions in the North are given a score of three, the lowest three are given a score of 1 and the remaining regions receive a score of 2.
Table 2-3 is a condensed summary of the alignment and contribution scores. 2.3.12
Table 2-3 Alignment and Capability Score for Northern Regions
CAPABILITY INDUSTRY GM SCR LEECR H&H LIVCR
A C A C A C A C A C
Primes
Advanced Manufacturing 1 3 2 2 1 3 3 2 2 2
Energy 1 3 2 3 2 3 3 2 1 1
Digital 3 3 3 3 2 3 1 1 3 3
Health Innovation 1 3 3 3 2 3 2 1 3 2
Enablers
Logistics 2 3 3 3 2 3 3 2 3 3
Financial & Professional Services 3 3 2 2 3 3 1 1 3 3
Higher Education 3 3 3 3 1 3 2 1 2 2
Sheffield is the only City Region which does not receive a ‘1’ score for alignment in any of the 2.3.13industries. As alignment considers the proportion of an area’s employment/GVA in each industry, this implies that a significant proportion of Sheffield’s economic activity is reliant on the seven identified industries. Manchester and Leeds City Regions receive the top score for contribution for all seven capabilities, although these do contain the two largest Northern cities.
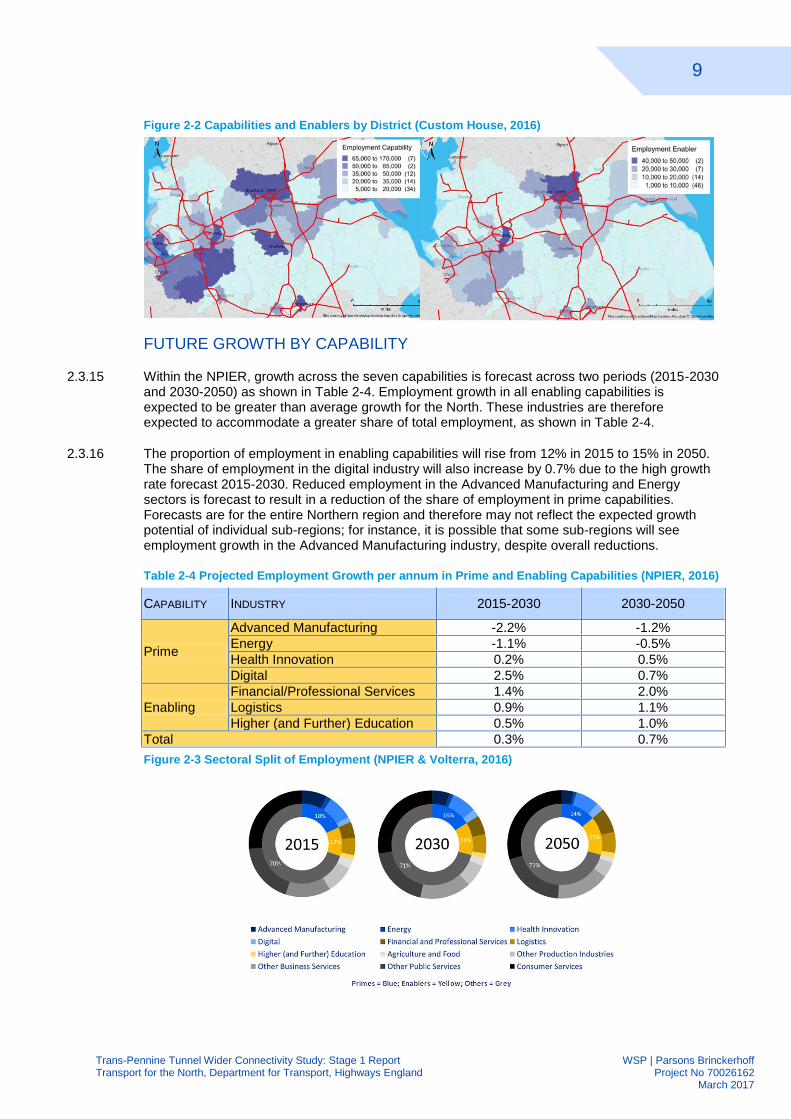
The NPIER does not break down its capability growth forecasts by Northern sub-region, however, 2.3.14the local area profiles provide an indication of the City Regions best placed to grow in different industries. To support this, employment within the prime/enabling capabilities has been identified geographically in Figure 2-2.
9
Trans-Pennine Tunnel Wider Connectivity Study: Stage 1 Report WSP | Parsons Brinckerhoff Transport for the North, Department for Transport, Highways England Project No 70026162 March 2017
Figure 2-2 Capabilities and Enablers by District (Custom House, 2016)
FUTURE GROWTH BY CAPABILITY
Within the NPIER, growth across the seven capabilities is forecast across two periods (2015-2030 2.3.15and 2030-2050) as shown in Table 2-4. Employment growth in all enabling capabilities is expected to be greater than average growth for the North. These industries are therefore expected to accommodate a greater share of total employment, as shown in Table 2-4.
The proportion of employment in enabling capabilities will rise from 12% in 2015 to 15% in 2050. 2.3.16The share of employment in the digital industry will also increase by 0.7% due to the high growth rate forecast 2015-2030. Reduced employment in the Advanced Manufacturing and Energy sectors is forecast to result in a reduction of the share of employment in prime capabilities. Forecasts are for the entire Northern region and therefore may not reflect the expected growth potential of individual sub-regions; for instance, it is possible that some sub-regions will see employment growth in the Advanced Manufacturing industry, despite overall reductions.
Table 2-4 Projected Employment Growth per annum in Prime and Enabling Capabilities (NPIER, 2016)
CAPABILITY INDUSTRY 2015-2030 2030-2050
Prime
Advanced Manufacturing -2.2% -1.2%
Energy -1.1% -0.5%
Health Innovation 0.2% 0.5%
Digital 2.5% 0.7%
Enabling
Financial/Professional Services 1.4% 2.0%
Logistics 0.9% 1.1%
Higher (and Further) Education 0.5% 1.0%
Total 0.3% 0.7%
Figure 2-3 Sectoral Split of Employment (NPIER & Volterra, 2016)
10
Trans-Pennine Tunnel Wider Connectivity Study: Stage 1 Report WSP | Parsons Brinckerhoff Transport for the North, Department for Transport, Highways England Project No 70026162 March 2017
REGIONAL SHARES OF GVA
The NPIER forecasts long term productivity growth for the North. In its transformational scenario it 2.3.17is assumed that productivity growth will be above that of the UK average for all prime capabilities. Enabling capabilities are expected to grow at a rate equal to or above that of the UK as a whole. The North’s share of GVA is therefore expected to grow over time.
EY produce short-term forecasts1 of GVA over the next three years at a regional level
2. EY predict 2.3.18
that in 2016 Yorkshire and the Humber Region will outperform UK average GVA growth; this is due to sectors such as professional services, manufacturing and real estate growing faster than the UK average (excluding London). Percentage growth in GVA is expected to be greater than percentage growth in employment.
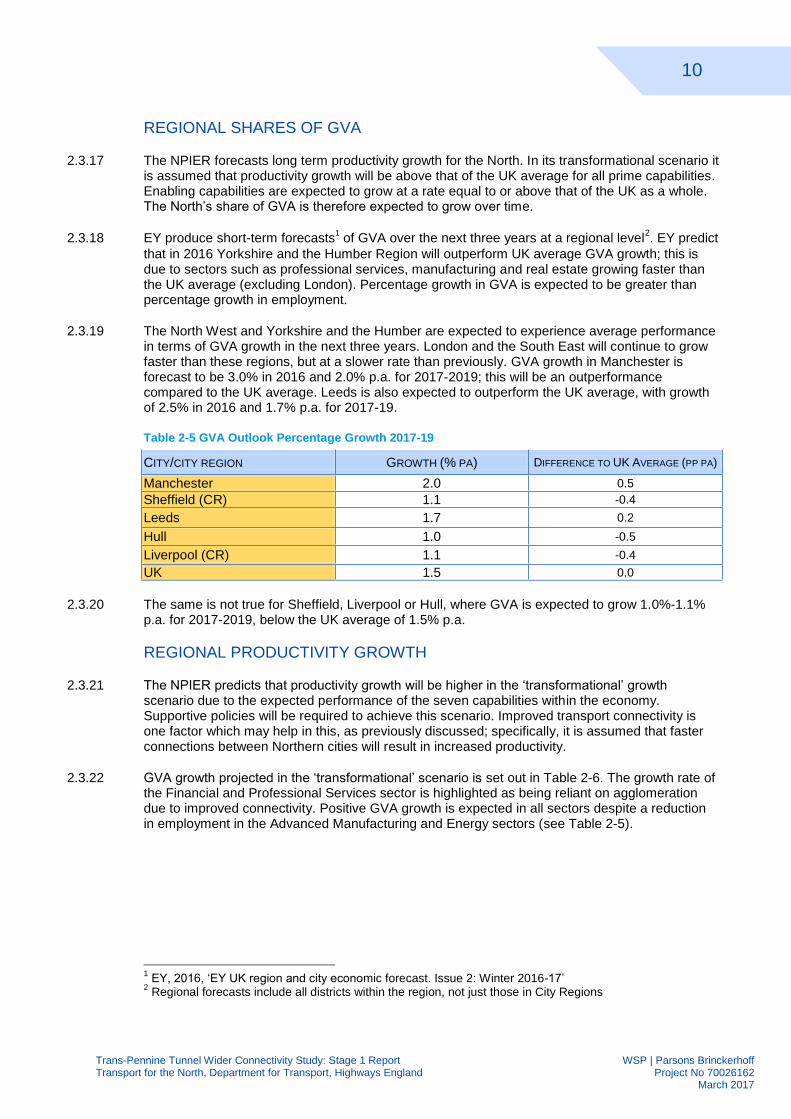
The North West and Yorkshire and the Humber are expected to experience average performance 2.3.19in terms of GVA growth in the next three years. London and the South East will continue to grow faster than these regions, but at a slower rate than previously. GVA growth in Manchester is forecast to be 3.0% in 2016 and 2.0% p.a. for 2017-2019; this will be an outperformance compared to the UK average. Leeds is also expected to outperform the UK average, with growth of 2.5% in 2016 and 1.7% p.a. for 2017-19.
Table 2-5 GVA Outlook Percentage Growth 2017-19
CITY/CITY REGION GROWTH (% PA) DIFFERENCE TO UK AVERAGE (PP PA)
Manchester 2.0 0.5
Sheffield (CR) 1.1 -0.4
Leeds 1.7 0.2
Hull 1.0 -0.5
Liverpool (CR) 1.1 -0.4
UK 1.5 0.0
The same is not true for Sheffield, Liverpool or Hull, where GVA is expected to grow 1.0%-1.1% 2.3.20p.a. for 2017-2019, below the UK average of 1.5% p.a.
REGIONAL PRODUCTIVITY GROWTH
The NPIER predicts that productivity growth will be higher in the ‘transformational’ growth 2.3.21scenario due to the expected performance of the seven capabilities within the economy. Supportive policies will be required to achieve this scenario. Improved transport connectivity is one factor which may help in this, as previously discussed; specifically, it is assumed that faster connections between Northern cities will result in increased productivity.
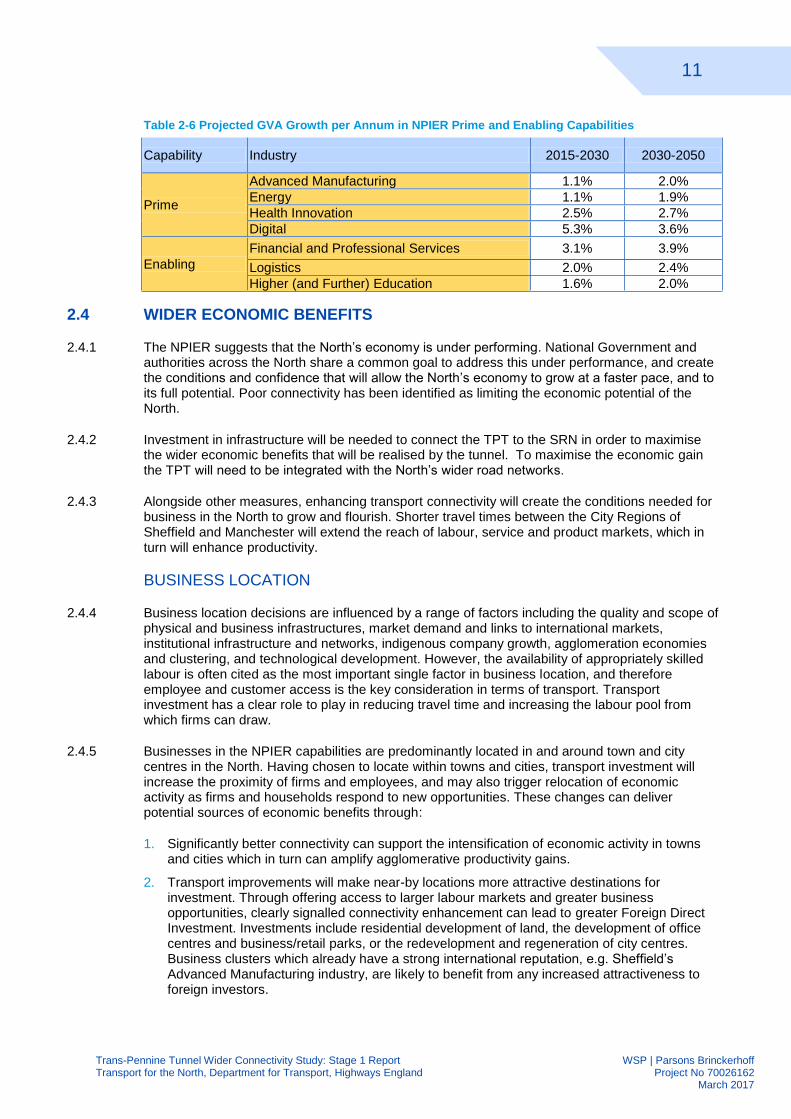
GVA growth projected in the ‘transformational’ scenario is set out in Table 2-6. The growth rate of 2.3.22the Financial and Professional Services sector is highlighted as being reliant on agglomeration due to improved connectivity. Positive GVA growth is expected in all sectors despite a reduction in employment in the Advanced Manufacturing and Energy sectors (see Table 2-5).
1 EY, 2016, ‘EY UK region and city economic forecast. Issue 2: Winter 2016-17’
2 Regional forecasts include all districts within the region, not just those in City Regions
11
Trans-Pennine Tunnel Wider Connectivity Study: Stage 1 Report WSP | Parsons Brinckerhoff Transport for the North, Department for Transport, Highways England Project No 70026162 March 2017
Table 2-6 Projected GVA Growth per Annum in NPIER Prime and Enabling Capabilities
Capability Industry 2015-2030 2030-2050
Prime
Advanced Manufacturing 1.1% 2.0%
Energy 1.1% 1.9%
Health Innovation 2.5% 2.7%
Digital 5.3% 3.6%
Enabling
Financial and Professional Services 3.1% 3.9%
Logistics 2.0% 2.4%
Higher (and Further) Education 1.6% 2.0%
2.4 WIDER ECONOMIC BENEFITS
The NPIER suggests that the North’s economy is under performing. National Government and 2.4.1authorities across the North share a common goal to address this under performance, and create the conditions and confidence that will allow the North’s economy to grow at a faster pace, and to its full potential. Poor connectivity has been identified as limiting the economic potential of the North.
Investment in infrastructure will be needed to connect the TPT to the SRN in order to maximise 2.4.2the wider economic benefits that will be realised by the tunnel. To maximise the economic gain the TPT will need to be integrated with the North’s wider road networks.
Alongside other measures, enhancing transport connectivity will create the conditions needed for 2.4.3business in the North to grow and flourish. Shorter travel times between the City Regions of Sheffield and Manchester will extend the reach of labour, service and product markets, which in turn will enhance productivity.
BUSINESS LOCATION
Business location decisions are influenced by a range of factors including the quality and scope of 2.4.4physical and business infrastructures, market demand and links to international markets, institutional infrastructure and networks, indigenous company growth, agglomeration economies and clustering, and technological development. However, the availability of appropriately skilled labour is often cited as the most important single factor in business location, and therefore employee and customer access is the key consideration in terms of transport. Transport investment has a clear role to play in reducing travel time and increasing the labour pool from which firms can draw.
Businesses in the NPIER capabilities are predominantly located in and around town and city 2.4.5centres in the North. Having chosen to locate within towns and cities, transport investment will increase the proximity of firms and employees, and may also trigger relocation of economic activity as firms and households respond to new opportunities. These changes can deliver potential sources of economic benefits through:
1. Significantly better connectivity can support the intensification of economic activity in towns and cities which in turn can amplify agglomerative productivity gains.
2. Transport improvements will make near-by locations more attractive destinations for investment. Through offering access to larger labour markets and greater business opportunities, clearly signalled connectivity enhancement can lead to greater Foreign Direct Investment. Investments include residential development of land, the development of office centres and business/retail parks, or the redevelopment and regeneration of city centres. Business clusters which already have a strong international reputation, e.g. Sheffield’s Advanced Manufacturing industry, are likely to benefit from any increased attractiveness to foreign investors.
12
Trans-Pennine Tunnel Wider Connectivity Study: Stage 1 Report WSP | Parsons Brinckerhoff Transport for the North, Department for Transport, Highways England Project No 70026162 March 2017
3. Labour market impacts may occur. Transport investment will allow workers to be able to access a greater number and range of employers and conversely, employers will be able to take advantage of a larger potential labour force from which to recruit.
There is a significant body of evidence which shows that more closely connecting people, firms 2.4.6and places generates benefits through agglomeration. Through sharing common resources, increased specialisation, better matching of firms and employees, and knowledge spill-overs, productivity benefits are generated. Over time, improvements to the transport system and the resulting productivity gains can produce second-order benefits by attracting high-skilled workers, incentivising local people to invest in education and skills, and stimulating business investment.
INTERNATIONAL CONNECTIVITY & VISITOR ECONOMY
International connectivity to global markets and gateways and inward investment are important 2.4.7components for a dynamic, productive Northern economy. Strong international accessibility improves the ability of businesses to access, trade and exploit growing markets abroad, as well as increasing the attractiveness of the North to Foreign Direct Investment (FDI). The importance of international connectivity is only likely to increase as the North’s economy becomes more globalised. International passenger connectivity (in the North) directly contributes £5.5 billion GVA; and an additional £1.33 billion through employment (30,000 jobs). Under the transformational economic scenario, the contribution of international passenger connectivity needs to reach £13 billion by 2050.
TfN established an Independent International Connectivity Commission to examine the economic 2.4.8role of international connectivity for the North of England. The Independent Commission’s report highlighted the need for commitment to building strong global trade links and maximising opportunities through improved international access. Having easy access to airports regionally is important for businesses across the North, enabling them to trade more easily and open up new markets.
Increasing the range of destinations and frequency of direct international services to and from the 2.4.9North will boost business efficiency, encourage entrepreneurship, enhance employment opportunities and increase Foreign Direct Investment, inward investment and exportation opportunities. It will also create conditions which attract and retain top talent and skills.
The Commission reported that international connectivity starts on the ground. Reducing the real 2.4.10cost and time of passengers and freight using the North’s airports and ports will increase demand for services, meaning that if supported by the right infrastructure, the airports and ports can make an increased material contribution to international connectivity and economic growth.
Many Northern businesses have significant scope to expand into emerging markets overseas. 2.4.11Businesses within the seven NPIER capabilities rely heavily on international connectivity to compete effectively for investment. Much advanced manufacturing, for example, is reliant on air freight for the export of low-volume, high-value products. Moreover, continued success in higher education will be dependent, in part, on the ability for students and researchers from across the world to easily access the North’s world-class universities.
Additionally, the Peak District, at the centre of a study area, is a major tourist attraction attracting 2.4.12more than 10 million visitors a year – Peak District National Park (2017). Ensuring good accessibility and connectivity to this key attraction for visitors is of significant importance to the local economy; improved Trans-Pennine road links would enhance accessibility to the Peak District. It is noted that there are challenges which must be considered in the context of the study, primarily pertaining to the need to improve road capacity whilst minimising environmental impacts; this is explored in more detail within the environmental evidence chapter of the report.
13
Trans-Pennine Tunnel Wider Connectivity Study: Stage 1 Report WSP | Parsons Brinckerhoff Transport for the North, Department for Transport, Highways England Project No 70026162 March 2017
The Peak District core strategy (2011) outlines the need to ensure sufficient accessibility and 2.4.13allow visitor enjoyment of the park’s natural assets. This links with the need to enhance accessibility of the park.
AIRPORTS
Analysis has been undertaken in terms of location and accessibility, passenger services and the 2.4.14movement of freight, at the following key airports located within the study area:
Liverpool John Lennon
Leeds Bradford International
Manchester Airport
Doncaster Sheffield Airport
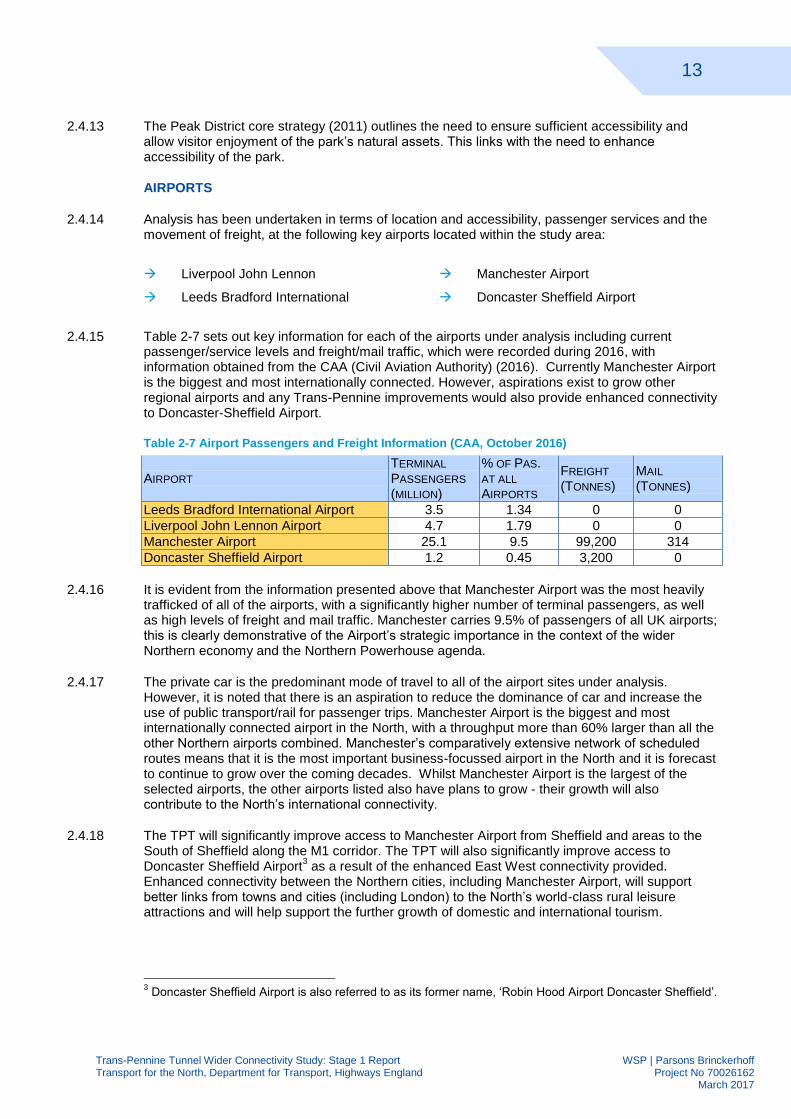
Table 2-7 sets out key information for each of the airports under analysis including current 2.4.15passenger/service levels and freight/mail traffic, which were recorded during 2016, with information obtained from the CAA (Civil Aviation Authority) (2016). Currently Manchester Airport is the biggest and most internationally connected. However, aspirations exist to grow other regional airports and any Trans-Pennine improvements would also provide enhanced connectivity to Doncaster-Sheffield Airport.
Table 2-7 Airport Passengers and Freight Information (CAA, October 2016)
AIRPORT TERMINAL
PASSENGERS
(MILLION)
% OF PAS. AT ALL
AIRPORTS
FREIGHT
(TONNES) MAIL
(TONNES)
Leeds Bradford International Airport 3.5 1.34 0 0
Liverpool John Lennon Airport 4.7 1.79 0 0
Manchester Airport 25.1 9.5 99,200 314
Doncaster Sheffield Airport 1.2 0.45 3,200 0
It is evident from the information presented above that Manchester Airport was the most heavily 2.4.16trafficked of all of the airports, with a significantly higher number of terminal passengers, as well as high levels of freight and mail traffic. Manchester carries 9.5% of passengers of all UK airports; this is clearly demonstrative of the Airport’s strategic importance in the context of the wider Northern economy and the Northern Powerhouse agenda.
The private car is the predominant mode of travel to all of the airport sites under analysis. 2.4.17However, it is noted that there is an aspiration to reduce the dominance of car and increase the use of public transport/rail for passenger trips. Manchester Airport is the biggest and most internationally connected airport in the North, with a throughput more than 60% larger than all the other Northern airports combined. Manchester’s comparatively extensive network of scheduled routes means that it is the most important business-focussed airport in the North and it is forecast to continue to grow over the coming decades. Whilst Manchester Airport is the largest of the selected airports, the other airports listed also have plans to grow - their growth will also contribute to the North’s international connectivity.
The TPT will significantly improve access to Manchester Airport from Sheffield and areas to the 2.4.18South of Sheffield along the M1 corridor. The TPT will also significantly improve access to Doncaster Sheffield Airport
3 as a result of the enhanced East West connectivity provided.
Enhanced connectivity between the Northern cities, including Manchester Airport, will support better links from towns and cities (including London) to the North’s world-class rural leisure attractions and will help support the further growth of domestic and international tourism.
3 Doncaster Sheffield Airport is also referred to as its former name, ‘Robin Hood Airport Doncaster Sheffield’.
14
Trans-Pennine Tunnel Wider Connectivity Study: Stage 1 Report WSP | Parsons Brinckerhoff Transport for the North, Department for Transport, Highways England Project No 70026162 March 2017
PORTS
For the purposes of the wider connectivity study, the key port locations of Hull, Manchester (Port 2.4.19Salford), Liverpool and Immingham have been identified.
Port Salford in Greater Manchester is a new port which will provide the first tri-modal UK inland 2.4.20port facility, serving road, rail and short-sea shipping. The port provides a central North West distribution base to improve supply chains for businesses across the North West region. Other recent developments of interest in the study area include ‘Liverpool2’, a new £400million investment to create a deep-water container terminal at the Port of Liverpool, enabling the largest vessels to call directly in the heart of the UK (Peel Ports Group, 2017).
2.5 DISTRIBUTION OF NEW EMPLOYMENT GROWTH
GROWTH DEALS
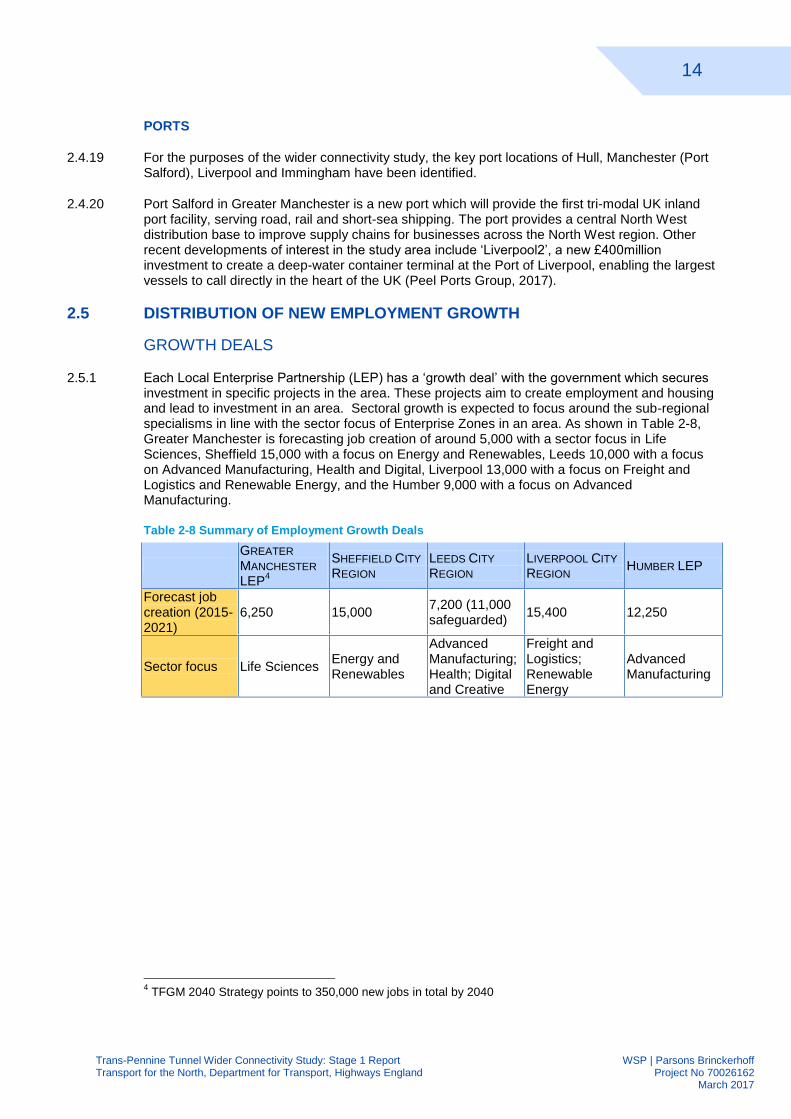
Each Local Enterprise Partnership (LEP) has a ‘growth deal’ with the government which secures 2.5.1investment in specific projects in the area. These projects aim to create employment and housing and lead to investment in an area. Sectoral growth is expected to focus around the sub-regional specialisms in line with the sector focus of Enterprise Zones in an area. As shown in Table 2-8, Greater Manchester is forecasting job creation of around 5,000 with a sector focus in Life Sciences, Sheffield 15,000 with a focus on Energy and Renewables, Leeds 10,000 with a focus on Advanced Manufacturing, Health and Digital, Liverpool 13,000 with a focus on Freight and Logistics and Renewable Energy, and the Humber 9,000 with a focus on Advanced Manufacturing.
Table 2-8 Summary of Employment Growth Deals
GREATER
MANCHESTER
LEP4
SHEFFIELD CITY
REGION LEEDS CITY
REGION LIVERPOOL CITY
REGION HUMBER LEP
Forecast job creation (2015-2021)
6,250 15,000 7,200 (11,000 safeguarded)
15,400 12,250
Sector focus Life Sciences Energy and Renewables
Advanced Manufacturing; Health; Digital and Creative
Freight and Logistics; Renewable Energy
Advanced Manufacturing
4 TFGM 2040 Strategy points to 350,000 new jobs in total by 2040
15
Trans-Pennine Tunnel Wider Connectivity Study: Stage 1 Report WSP | Parsons Brinckerhoff Transport for the North, Department for Transport, Highways England Project No 70026162 March 2017
SUB-REGIONAL GDP
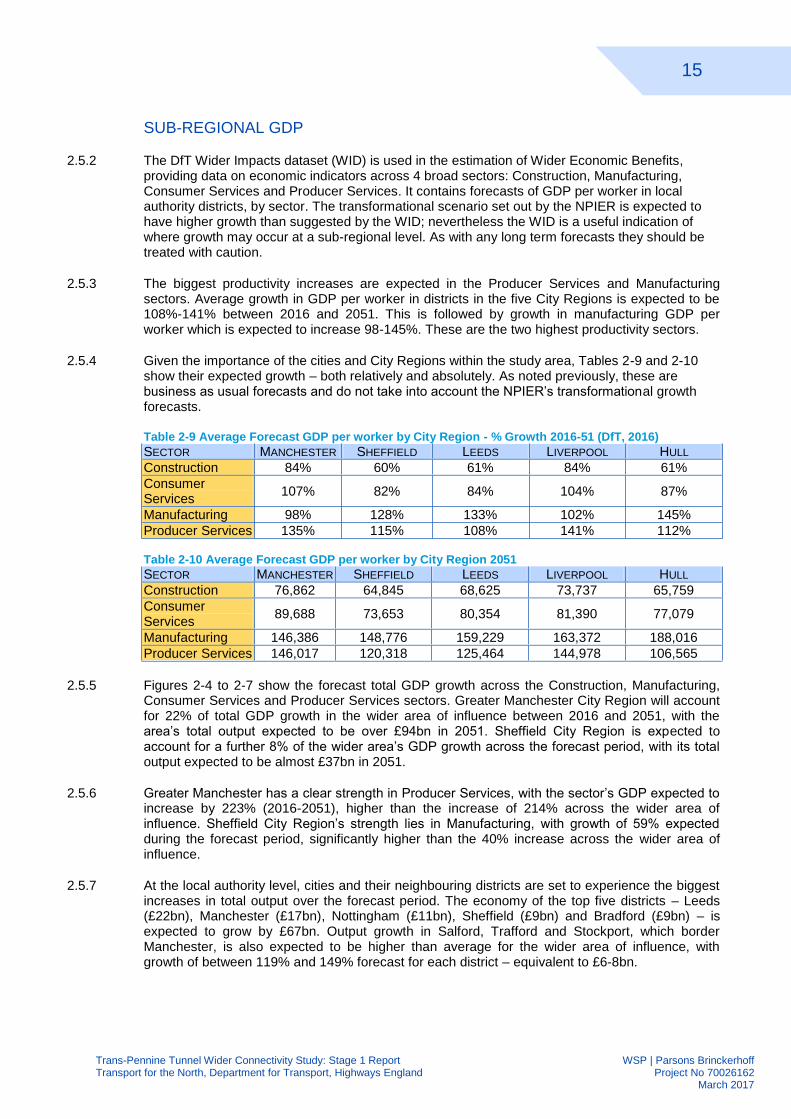
The DfT Wider Impacts dataset (WID) is used in the estimation of Wider Economic Benefits, 2.5.2providing data on economic indicators across 4 broad sectors: Construction, Manufacturing, Consumer Services and Producer Services. It contains forecasts of GDP per worker in local authority districts, by sector. The transformational scenario set out by the NPIER is expected to have higher growth than suggested by the WID; nevertheless the WID is a useful indication of where growth may occur at a sub-regional level. As with any long term forecasts they should be treated with caution.
The biggest productivity increases are expected in the Producer Services and Manufacturing 2.5.3sectors. Average growth in GDP per worker in districts in the five City Regions is expected to be 108%-141% between 2016 and 2051. This is followed by growth in manufacturing GDP per worker which is expected to increase 98-145%. These are the two highest productivity sectors.
Given the importance of the cities and City Regions within the study area, Tables 2-9 and 2-10 2.5.4show their expected growth – both relatively and absolutely. As noted previously, these are business as usual forecasts and do not take into account the NPIER’s transformational growth forecasts.
Table 2-9 Average Forecast GDP per worker by City Region - % Growth 2016-51 (DfT, 2016)
SECTOR MANCHESTER SHEFFIELD LEEDS LIVERPOOL HULL
Construction 84% 60% 61% 84% 61%
Consumer Services
107% 82% 84% 104% 87%
Manufacturing 98% 128% 133% 102% 145%
Producer Services 135% 115% 108% 141% 112% Table 2-10 Average Forecast GDP per worker by City Region 2051
SECTOR MANCHESTER SHEFFIELD LEEDS LIVERPOOL HULL
Construction 76,862 64,845 68,625 73,737 65,759
Consumer Services
89,688 73,653 80,354 81,390 77,079
Manufacturing 146,386 148,776 159,229 163,372 188,016
Producer Services 146,017 120,318 125,464 144,978 106,565
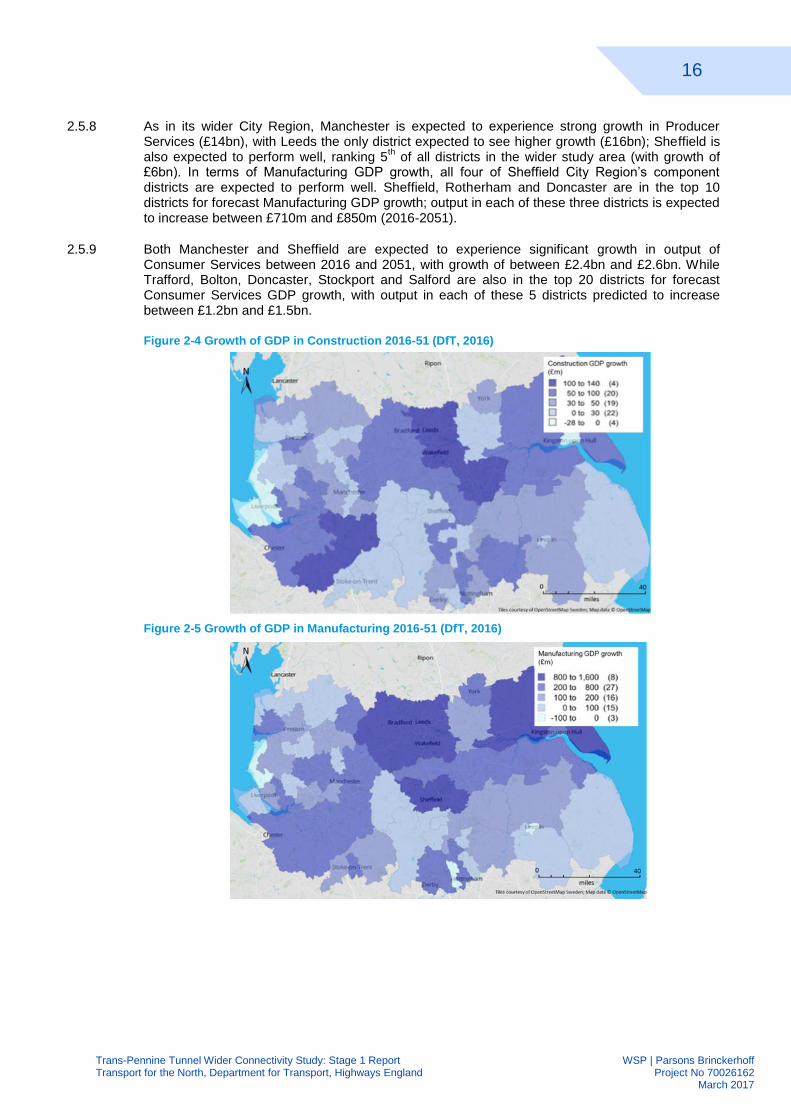
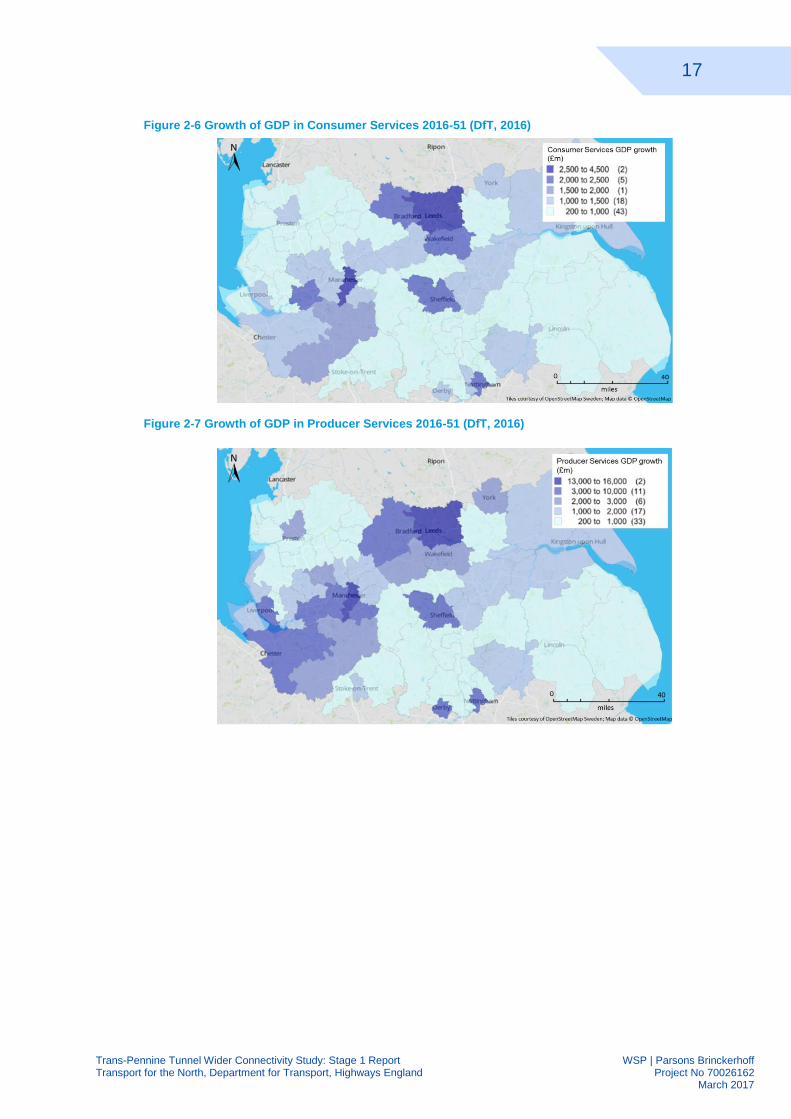
Figures 2-4 to 2-7 show the forecast total GDP growth across the Construction, Manufacturing, 2.5.5Consumer Services and Producer Services sectors. Greater Manchester City Region will account for 22% of total GDP growth in the wider area of influence between 2016 and 2051, with the area’s total output expected to be over £94bn in 2051. Sheffield City Region is expected to account for a further 8% of the wider area’s GDP growth across the forecast period, with its total output expected to be almost £37bn in 2051.
Greater Manchester has a clear strength in Producer Services, with the sector’s GDP expected to 2.5.6increase by 223% (2016-2051), higher than the increase of 214% across the wider area of influence. Sheffield City Region’s strength lies in Manufacturing, with growth of 59% expected during the forecast period, significantly higher than the 40% increase across the wider area of influence.
At the local authority level, cities and their neighbouring districts are set to experience the biggest 2.5.7increases in total output over the forecast period. The economy of the top five districts – Leeds (£22bn), Manchester (£17bn), Nottingham (£11bn), Sheffield (£9bn) and Bradford (£9bn) – is expected to grow by £67bn. Output growth in Salford, Trafford and Stockport, which border Manchester, is also expected to be higher than average for the wider area of influence, with growth of between 119% and 149% forecast for each district – equivalent to £6-8bn.
16
Trans-Pennine Tunnel Wider Connectivity Study: Stage 1 Report WSP | Parsons Brinckerhoff Transport for the North, Department for Transport, Highways England Project No 70026162 March 2017
As in its wider City Region, Manchester is expected to experience strong growth in Producer 2.5.8Services (£14bn), with Leeds the only district expected to see higher growth (£16bn); Sheffield is also expected to perform well, ranking 5
th of all districts in the wider study area (with growth of
£6bn). In terms of Manufacturing GDP growth, all four of Sheffield City Region’s component districts are expected to perform well. Sheffield, Rotherham and Doncaster are in the top 10 districts for forecast Manufacturing GDP growth; output in each of these three districts is expected to increase between £710m and £850m (2016-2051).
Both Manchester and Sheffield are expected to experience significant growth in output of 2.5.9Consumer Services between 2016 and 2051, with growth of between £2.4bn and £2.6bn. While Trafford, Bolton, Doncaster, Stockport and Salford are also in the top 20 districts for forecast Consumer Services GDP growth, with output in each of these 5 districts predicted to increase between £1.2bn and £1.5bn.
Figure 2-4 Growth of GDP in Construction 2016-51 (DfT, 2016)
Figure 2-5 Growth of GDP in Manufacturing 2016-51 (DfT, 2016)
17
Trans-Pennine Tunnel Wider Connectivity Study: Stage 1 Report WSP | Parsons Brinckerhoff Transport for the North, Department for Transport, Highways England Project No 70026162 March 2017
Figure 2-6 Growth of GDP in Consumer Services 2016-51 (DfT, 2016)
Figure 2-7 Growth of GDP in Producer Services 2016-51 (DfT, 2016)
18
Trans-Pennine Tunnel Wider Connectivity Study: Stage 1 Report WSP | Parsons Brinckerhoff Transport for the North, Department for Transport, Highways England Project No 70026162 March 2017
2.6 KEY FREIGHT INDUSTRIES
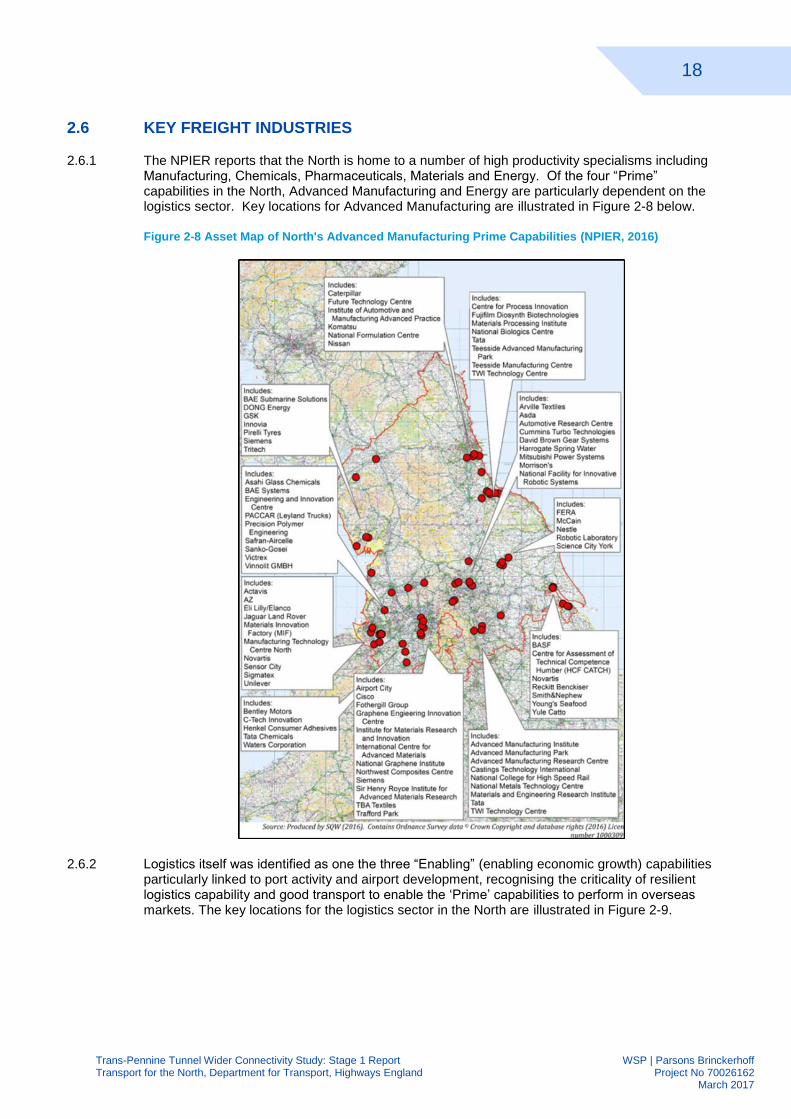
The NPIER reports that the North is home to a number of high productivity specialisms including 2.6.1Manufacturing, Chemicals, Pharmaceuticals, Materials and Energy. Of the four “Prime” capabilities in the North, Advanced Manufacturing and Energy are particularly dependent on the logistics sector. Key locations for Advanced Manufacturing are illustrated in Figure 2-8 below.
Figure 2-8 Asset Map of North's Advanced Manufacturing Prime Capabilities (NPIER, 2016)
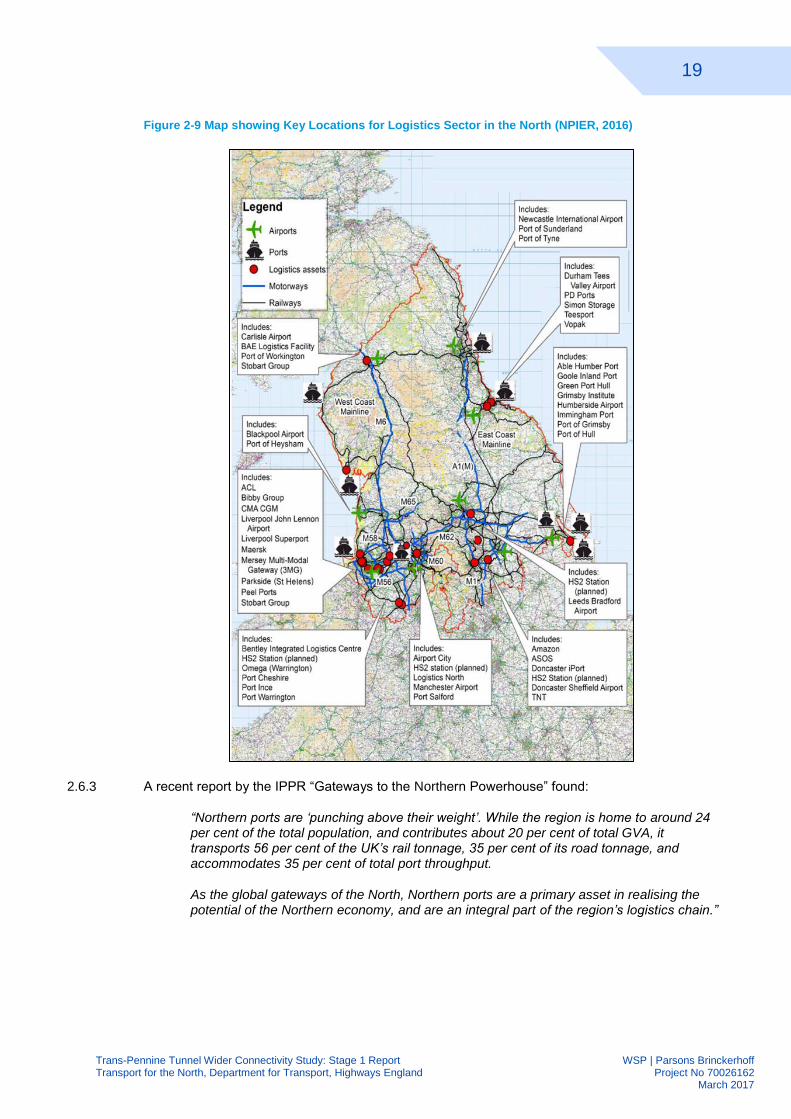
Logistics itself was identified as one the three “Enabling” (enabling economic growth) capabilities 2.6.2particularly linked to port activity and airport development, recognising the criticality of resilient logistics capability and good transport to enable the ‘Prime’ capabilities to perform in overseas markets. The key locations for the logistics sector in the North are illustrated in Figure 2-9.
19
Trans-Pennine Tunnel Wider Connectivity Study: Stage 1 Report WSP | Parsons Brinckerhoff Transport for the North, Department for Transport, Highways England Project No 70026162 March 2017
Figure 2-9 Map showing Key Locations for Logistics Sector in the North (NPIER, 2016)
A recent report by the IPPR “Gateways to the Northern Powerhouse” found: 2.6.3
“Northern ports are ‘punching above their weight’. While the region is home to around 24 per cent of the total population, and contributes about 20 per cent of total GVA, it transports 56 per cent of the UK’s rail tonnage, 35 per cent of its road tonnage, and accommodates 35 per cent of total port throughput.
As the global gateways of the North, Northern ports are a primary asset in realising the potential of the Northern economy, and are an integral part of the region’s logistics chain.”
20
Trans-Pennine Tunnel Wider Connectivity Study: Stage 1 Report WSP | Parsons Brinckerhoff Transport for the North, Department for Transport, Highways England Project No 70026162 March 2017
The report concluded that: 2.6.4
“One of the most significant opportunities and challenges concerns the role of ports within the wider freight and logistics chain. As logistics processes become ever more automated and sophisticated there is a massive opportunity for the North of England to be at the cutting edge of new patterns of freight distribution through a series of multimodal distribution parks and strategic rail freight interchanges and an East–West freight super corridor linking Atlantic traffic with the European mainland.”
THE TFN FREIGHT REPORT
Another recently published report, the “TfN Northern Freight and Logistics Report” (2016) 2.6.5presents a series of recommendations intended to radically transform the logistics sector in Northern England.
The report recommends significant improvements in rail freight capacity and capability to improve 2.6.6links with other regions and with the Southern UK ports. This, in combination with the use of short sea shipping and a focus on the North’s own ports, will improve links to the North and thereby encourage the growth of a new generation of multi modal distribution centres. The key proposals in the report include:
Additional Trans-Pennine rail freight capacity (3 paths per hour).
Additional North–South rail freight capacity.
An increase in capacity and resilience on key parts of the highway network.
2.7 ECONOMIC CONTEXT SUMMARY
Transport Accessibility Improvements in transport accessibility can improve access to jobs, and 2.7.1boost productivity through increasing the concentration of high-value business activity, better matching people with their skills and experience to jobs, and stimulating investment by making the North a more attractive place to do business. It also improves ease / expense of access for businesses to locations across the North. i.e. if it is quicker, easier and more direct for a business to access a certain location, they are more likely to do it.
International Accessibility International accessibility is also important for supporting a dynamic 2.7.2Northern economy, and providing region-wide access to Northern Airports is reliant on good surface access by road.
Leisure and Tourism Leisure and tourism make a significant contribution to the North’s 2.7.3economy, and enhanced connectivity between Northern cities and Manchester Airport will support the continued growth in domestic and international tourism and provide more direct access.
Transport Connectivity Enhanced transport connectivity, including a fast, safe and reliable road 2.7.4link across the Pennines, is an integral part of transforming the prospects for economic growth in the region.
Economic Benefits This section has identified how a range of different economic benefits can 2.7.5materialise; the findings have been used to inform further analysis, particularly in terms of the local and regional socio-economic context described in the next chapter.
21
Trans-Pennine Tunnel Wider Connectivity Study: Stage 1 Report WSP | Parsons Brinckerhoff Transport for the North, Department for Transport, Highways England Project No 70026162 March 2017
LOCAL AND REGIONAL CONTEXT 3
3.1 INTRODUCTION
As explained in Chapter 1, the report refers to two study areas, the Area of Intervention and the 3.1.1Area of Impact.
The socio-economic characteristics, their importance in light of the economic context described in 3.1.2the previous chapter and future forecasts are described in turn for each defined area. Table 3-1 shows the key areas outlined within this chapter of the report and provides a brief description of their relevance in the context of the study.
Table 3-1 Key Chapter Areas and Relevance to Study
CHAPTER SECTION RELEVANCE TO STUDY
3.2 Area of Intervention
Outlines the extent of impact to the area of intervention associated with the TPT, and describes commuting patterns which highlight the need to improve connectivity within the area. Provides analysis of population densities which shows how improved routes across the Pennines would improve the accessibility of these population concentrations. Highlights currently low commuting rates across the Pennines which is reflective of connectivity gaps; this further establishes the need for intervention in terms of the provision of a new high performance road link in the form of the proposed TPT.
3.3 Area of Impact
Outlines the area of impact and provides an analysis of current levels of economic activity and employment. Highlights that productivity levels are below the UK average across the area of impact, and that workers generally have lower pay and lower GVA per hour worked than the UK average. This supports the need for intervention and highlights how areas such as economic activity and productivity could benefit from the enhanced connectivity provided by the TPT.
3.2 AREA OF INTERVENTION
CURRENT SITUATION
The economic impacts of any tunnel option are likely to be focused in the areas in the immediate 3.2.1vicinity of the Trans-Pennine Tunnel portals. This ‘Area of Intervention’ is expected to be most affected by variations in traffic volumes and reduced travel times resulting from an improved road link across the Pennines and to benefit the most from time savings and agglomeration effects. In addition, this area is the most likely to experience land use change as a result of the intervention.
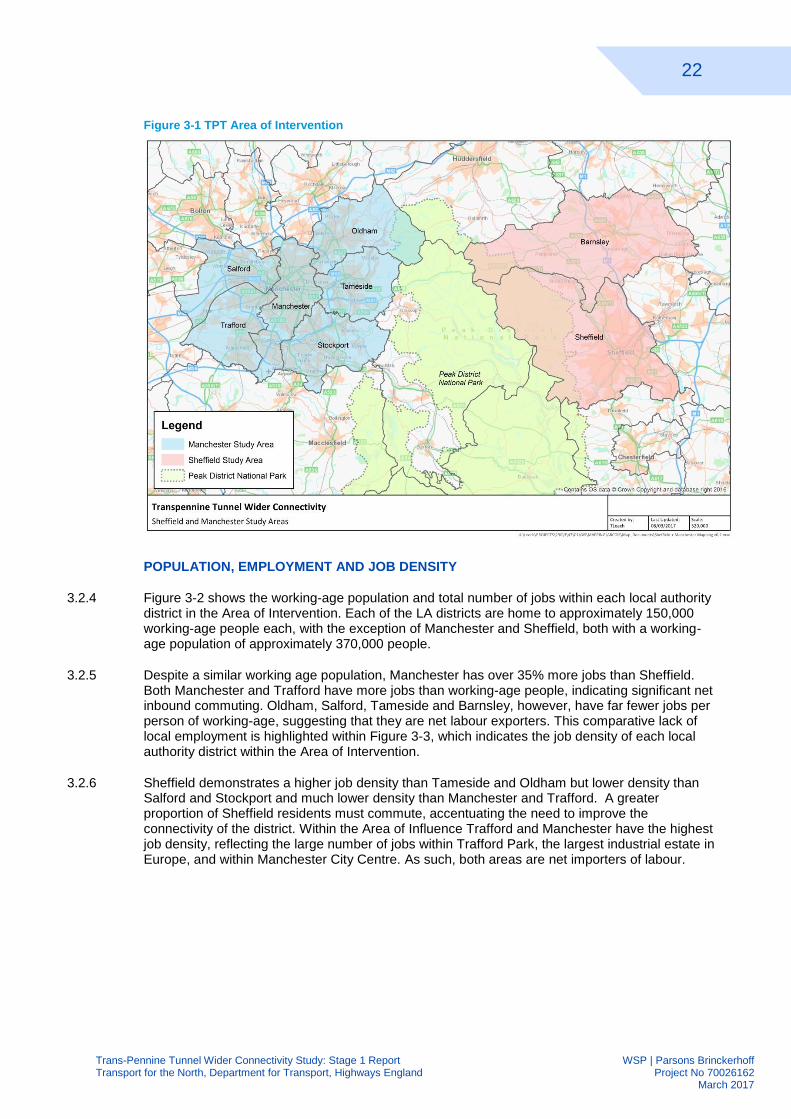
Figure 3-1 outlines the local authority districts within the Area of Intervention, which consists of 3.2.2Sheffield and Barnsley, together with the six districts within Greater Manchester that would be expected to experience the largest accessibility impact of improved trans-Pennine connectivity. These include Oldham, Tameside, Stockport, Trafford and Stockport, which are connected via the M60 motorway to existing and potential trans-Pennine routes, together with Manchester, which, due to a strong city centre economy exerts a significant influence on the wider region and would be expected to benefit from any future intervention. Rochdale was not initially included in the Area of Intervention but will be included in subsequent reports if the focus of the work is extended to northern trans-Pennine routes.
The current socio-economic context of the Area of Intervention has been explored to better 3.2.3understand the potential benefits that an improved trans-Pennine road link could facilitate.
22
Trans-Pennine Tunnel Wider Connectivity Study: Stage 1 Report WSP | Parsons Brinckerhoff Transport for the North, Department for Transport, Highways England Project No 70026162 March 2017
Figure 3-1 TPT Area of Intervention
POPULATION, EMPLOYMENT AND JOB DENSITY
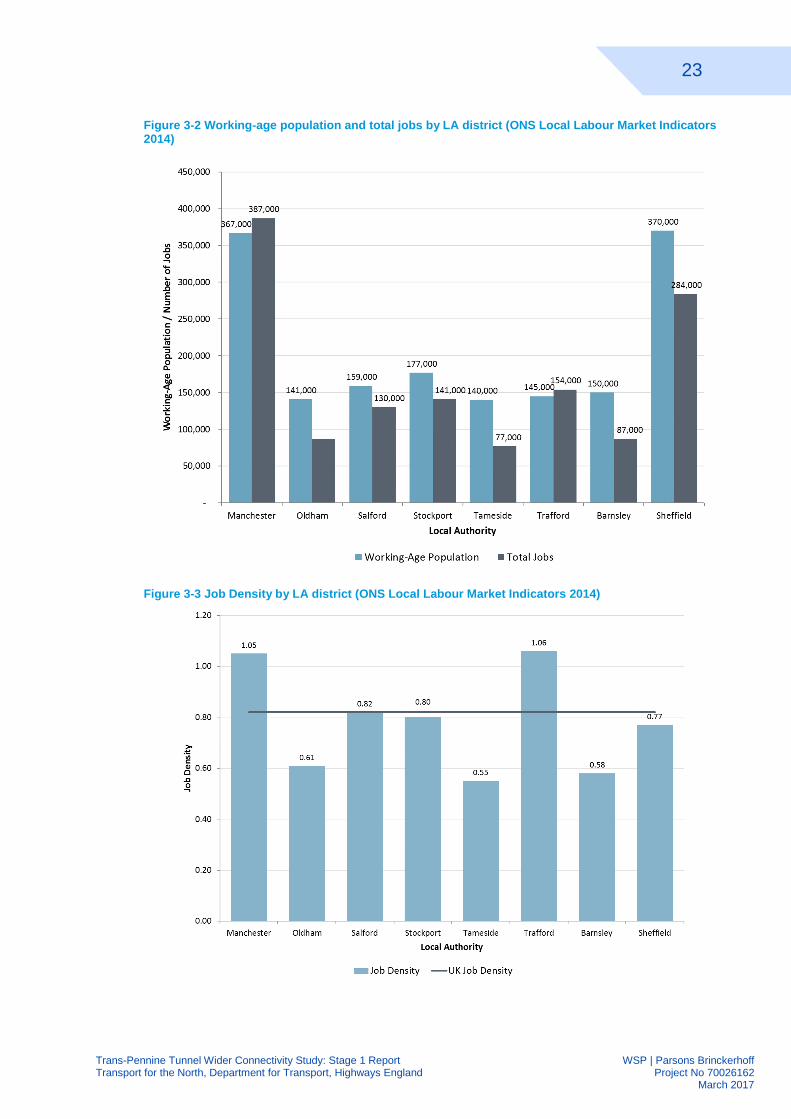
Figure 3-2 shows the working-age population and total number of jobs within each local authority 3.2.4district in the Area of Intervention. Each of the LA districts are home to approximately 150,000 working-age people each, with the exception of Manchester and Sheffield, both with a working-age population of approximately 370,000 people.
Despite a similar working age population, Manchester has over 35% more jobs than Sheffield. 3.2.5Both Manchester and Trafford have more jobs than working-age people, indicating significant net inbound commuting. Oldham, Salford, Tameside and Barnsley, however, have far fewer jobs per person of working-age, suggesting that they are net labour exporters. This comparative lack of local employment is highlighted within Figure 3-3, which indicates the job density of each local authority district within the Area of Intervention.
Sheffield demonstrates a higher job density than Tameside and Oldham but lower density than 3.2.6Salford and Stockport and much lower density than Manchester and Trafford. A greater proportion of Sheffield residents must commute, accentuating the need to improve the connectivity of the district. Within the Area of Influence Trafford and Manchester have the highest job density, reflecting the large number of jobs within Trafford Park, the largest industrial estate in Europe, and within Manchester City Centre. As such, both areas are net importers of labour.
23
Trans-Pennine Tunnel Wider Connectivity Study: Stage 1 Report WSP | Parsons Brinckerhoff Transport for the North, Department for Transport, Highways England Project No 70026162 March 2017
Figure 3-2 Working-age population and total jobs by LA district (ONS Local Labour Market Indicators 2014)
Figure 3-3 Job Density by LA district (ONS Local Labour Market Indicators 2014)
24
Trans-Pennine Tunnel Wider Connectivity Study: Stage 1 Report WSP | Parsons Brinckerhoff Transport for the North, Department for Transport, Highways England Project No 70026162 March 2017
DISTRIBUTION OF POPULATION AND EMPLOYMENT
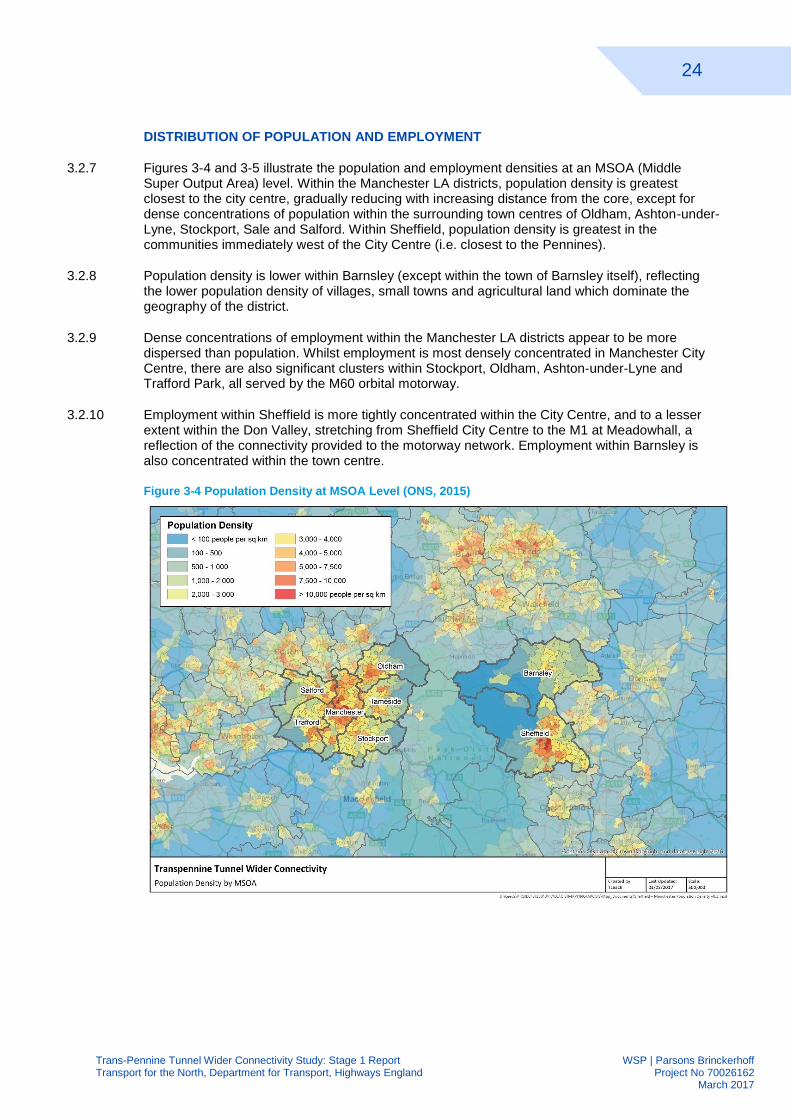
Figures 3-4 and 3-5 illustrate the population and employment densities at an MSOA (Middle 3.2.7Super Output Area) level. Within the Manchester LA districts, population density is greatest closest to the city centre, gradually reducing with increasing distance from the core, except for dense concentrations of population within the surrounding town centres of Oldham, Ashton-under-Lyne, Stockport, Sale and Salford. Within Sheffield, population density is greatest in the communities immediately west of the City Centre (i.e. closest to the Pennines).
Population density is lower within Barnsley (except within the town of Barnsley itself), reflecting 3.2.8the lower population density of villages, small towns and agricultural land which dominate the geography of the district.
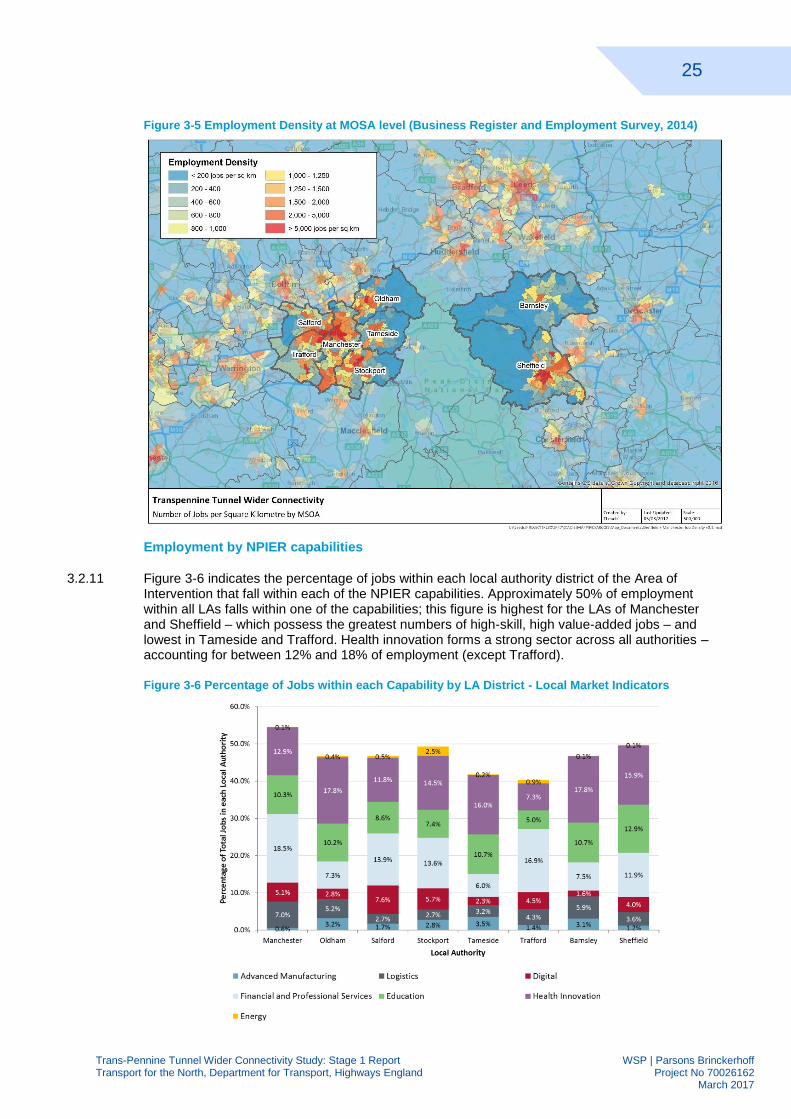
Dense concentrations of employment within the Manchester LA districts appear to be more 3.2.9dispersed than population. Whilst employment is most densely concentrated in Manchester City Centre, there are also significant clusters within Stockport, Oldham, Ashton-under-Lyne and Trafford Park, all served by the M60 orbital motorway.
Employment within Sheffield is more tightly concentrated within the City Centre, and to a lesser 3.2.10extent within the Don Valley, stretching from Sheffield City Centre to the M1 at Meadowhall, a reflection of the connectivity provided to the motorway network. Employment within Barnsley is also concentrated within the town centre.
Figure 3-4 Population Density at MSOA Level (ONS, 2015)
25
Trans-Pennine Tunnel Wider Connectivity Study: Stage 1 Report WSP | Parsons Brinckerhoff Transport for the North, Department for Transport, Highways England Project No 70026162 March 2017
Figure 3-5 Employment Density at MOSA level (Business Register and Employment Survey, 2014)
Employment by NPIER capabilities
Figure 3-6 indicates the percentage of jobs within each local authority district of the Area of 3.2.11Intervention that fall within each of the NPIER capabilities. Approximately 50% of employment within all LAs falls within one of the capabilities; this figure is highest for the LAs of Manchester and Sheffield – which possess the greatest numbers of high-skill, high value-added jobs – and lowest in Tameside and Trafford. Health innovation forms a strong sector across all authorities – accounting for between 12% and 18% of employment (except Trafford).
Figure 3-6 Percentage of Jobs within each Capability by LA District - Local Market Indicators
26
Trans-Pennine Tunnel Wider Connectivity Study: Stage 1 Report WSP | Parsons Brinckerhoff Transport for the North, Department for Transport, Highways England Project No 70026162 March 2017
Figure 3-7 indicates the unemployment rate within the seven local authorities of the Area of 3.2.12Intervention. Despite the greater job density of Manchester (>1.0), and a high level of inbound commuting, unemployment within the Manchester local authority district is the highest and 2.5 percentage points (almost 50%) above the national average. Unemployment is clearly well above average, and the large number of jobs indicates that the jobs available within Manchester are a poor match to those who live in the local authority district, resulting in them being taken by commuters from elsewhere.
Figure 3-7 Unemployment by LA District (ONS, 2016)
Oldham, Salford and Sheffield also have a high level of unemployment, of approximately 7% 3.2.13which, combined with an average low job density and low levels of out-commuting, suggests that these local authorities have less developed local economies and labour markets, with a consequently higher level of ‘worklessness’.
Local Commuting Patterns
Despite the relative proximity of Tameside, Stockport and Oldham to Sheffield – a distance of less 3.2.14than forty miles – current trans-Pennine commuting rates are extremely low. By contrast, only 0.1% of the residents of Trafford, Stockport and Oldham commute to Sheffield each day. Flows between Manchester and Sheffield are marginally higher, with approximately 500 people travelling from Sheffield to Manchester and 240 in the other direction. However absolute commuting levels are low in comparison to local trips, potentially a reflection of the limited transport connectivity.
Notably, a far smaller proportion of jobs in Manchester, Salford and Trafford – less than 40% – 3.2.15are occupied by commuters from within these districts. This is in contrast to Tameside, Barnsley and Oldham, where more than 60% of jobs are occupied by local commuters. This indicates a more locally-based labour market – it is likely that many of the jobs located in Oldham, Barnsley and Tameside are comparatively lower-value added, in sectors such as retail or distribution, compared to the high-skill, high-value added jobs that can be found in Manchester City Centre that attract workers from far-larger labour catchments. Jobs in Oldham, Barnsley and Tameside tend to be taken by local people; few are willing to commute from farther afield (such as from Sheffield) to the types of jobs within these local authorities compared to elsewhere.
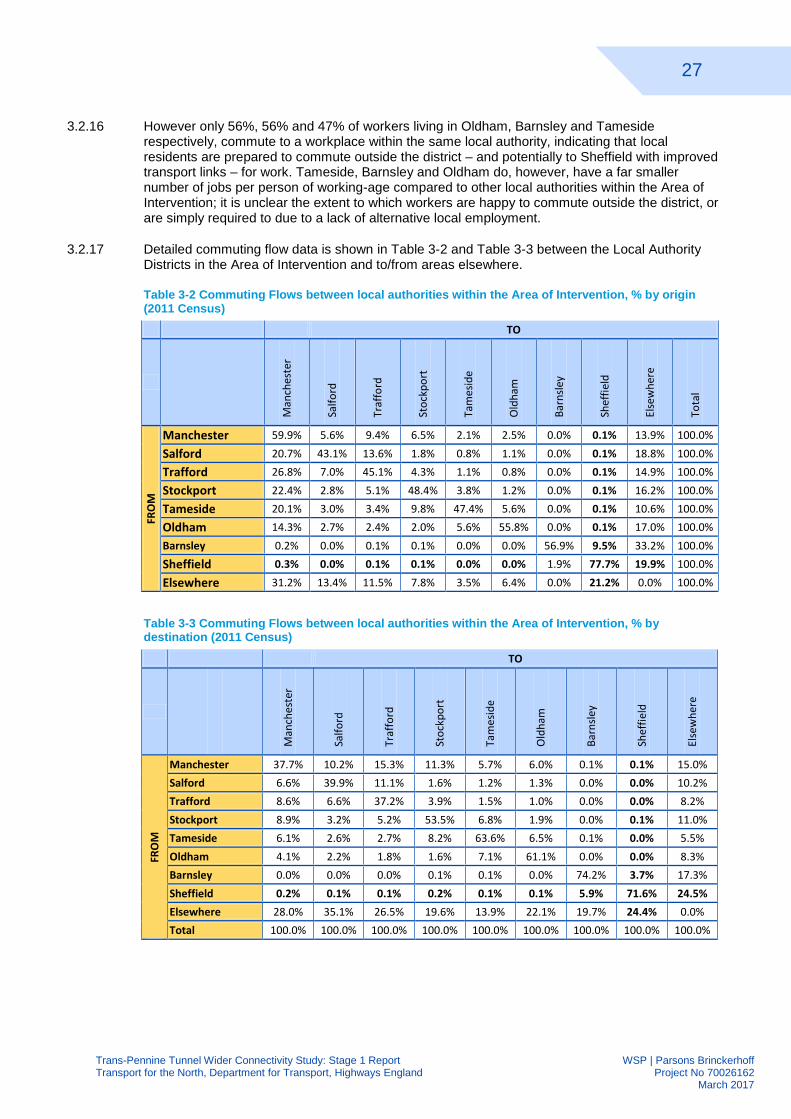
27
Trans-Pennine Tunnel Wider Connectivity Study: Stage 1 Report WSP | Parsons Brinckerhoff Transport for the North, Department for Transport, Highways England Project No 70026162 March 2017
However only 56%, 56% and 47% of workers living in Oldham, Barnsley and Tameside 3.2.16respectively, commute to a workplace within the same local authority, indicating that local residents are prepared to commute outside the district – and potentially to Sheffield with improved transport links – for work. Tameside, Barnsley and Oldham do, however, have a far smaller number of jobs per person of working-age compared to other local authorities within the Area of Intervention; it is unclear the extent to which workers are happy to commute outside the district, or are simply required to due to a lack of alternative local employment.
Detailed commuting flow data is shown in Table 3-2 and Table 3-3 between the Local Authority 3.2.17Districts in the Area of Intervention and to/from areas elsewhere.
Table 3-2 Commuting Flows between local authorities within the Area of Intervention, % by origin (2011 Census)
TO
Man
ches
ter
Salf
ord
Traf
ford
Sto
ckp
ort
Tam
esid
e
Old
ham
Bar
nsl
ey
Shef
fiel
d
Else
wh
ere
Tota
l
FRO
M
Manchester 59.9% 5.6% 9.4% 6.5% 2.1% 2.5% 0.0% 0.1% 13.9% 100.0%
Salford 20.7% 43.1% 13.6% 1.8% 0.8% 1.1% 0.0% 0.1% 18.8% 100.0%
Trafford 26.8% 7.0% 45.1% 4.3% 1.1% 0.8% 0.0% 0.1% 14.9% 100.0%
Stockport 22.4% 2.8% 5.1% 48.4% 3.8% 1.2% 0.0% 0.1% 16.2% 100.0%
Tameside 20.1% 3.0% 3.4% 9.8% 47.4% 5.6% 0.0% 0.1% 10.6% 100.0%
Oldham 14.3% 2.7% 2.4% 2.0% 5.6% 55.8% 0.0% 0.1% 17.0% 100.0%
Barnsley 0.2% 0.0% 0.1% 0.1% 0.0% 0.0% 56.9% 9.5% 33.2% 100.0%
Sheffield 0.3% 0.0% 0.1% 0.1% 0.0% 0.0% 1.9% 77.7% 19.9% 100.0%
Elsewhere 31.2% 13.4% 11.5% 7.8% 3.5% 6.4% 0.0% 21.2% 0.0% 100.0%
Table 3-3 Commuting Flows between local authorities within the Area of Intervention, % by destination (2011 Census)
TO
Man
ches
ter
Salf
ord
Traf
ford
Sto
ckp
ort
Tam
esid
e
Old
ham
Bar
nsl
ey
Shef
fiel
d
Else
wh
ere
FRO
M
Manchester 37.7% 10.2% 15.3% 11.3% 5.7% 6.0% 0.1% 0.1% 15.0%
Salford 6.6% 39.9% 11.1% 1.6% 1.2% 1.3% 0.0% 0.0% 10.2%
Trafford 8.6% 6.6% 37.2% 3.9% 1.5% 1.0% 0.0% 0.0% 8.2%
Stockport 8.9% 3.2% 5.2% 53.5% 6.8% 1.9% 0.0% 0.1% 11.0%
Tameside 6.1% 2.6% 2.7% 8.2% 63.6% 6.5% 0.1% 0.0% 5.5%
Oldham 4.1% 2.2% 1.8% 1.6% 7.1% 61.1% 0.0% 0.0% 8.3%
Barnsley 0.0% 0.0% 0.0% 0.1% 0.1% 0.0% 74.2% 3.7% 17.3%
Sheffield 0.2% 0.1% 0.1% 0.2% 0.1% 0.1% 5.9% 71.6% 24.5%
Elsewhere 28.0% 35.1% 26.5% 19.6% 13.9% 22.1% 19.7% 24.4% 0.0%
Total 100.0% 100.0% 100.0% 100.0% 100.0% 100.0% 100.0% 100.0% 100.0%
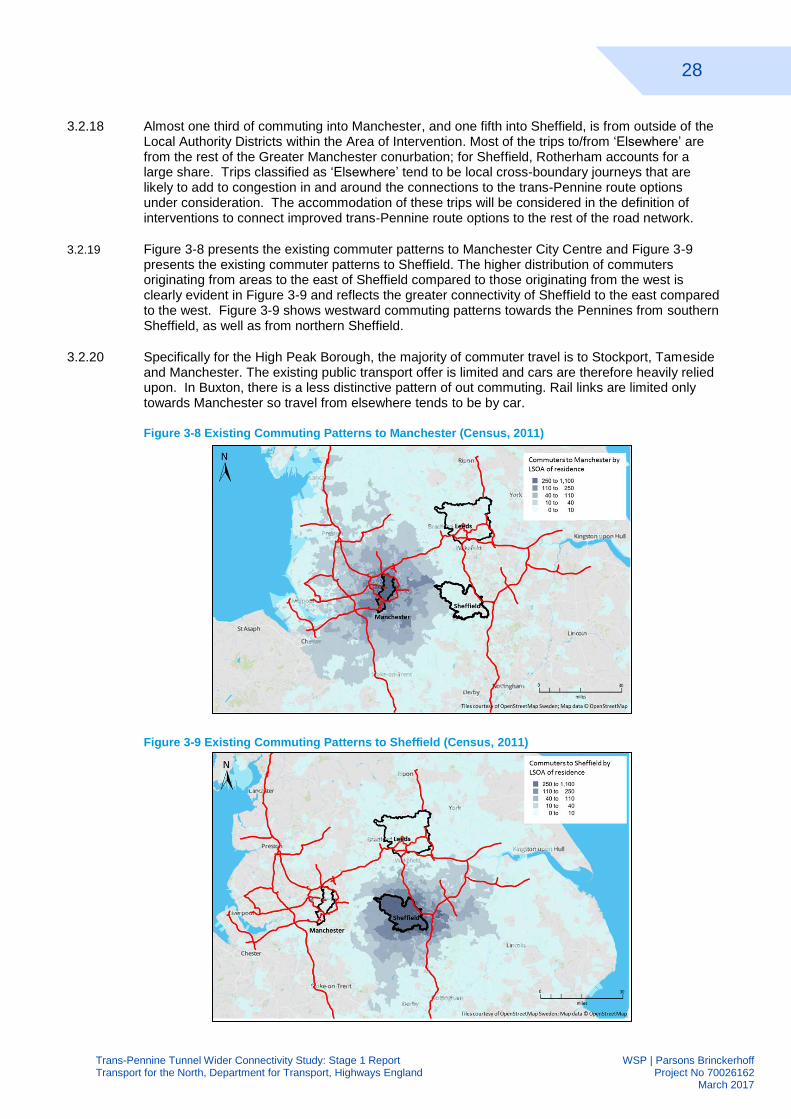
28
Trans-Pennine Tunnel Wider Connectivity Study: Stage 1 Report WSP | Parsons Brinckerhoff Transport for the North, Department for Transport, Highways England Project No 70026162 March 2017
Almost one third of commuting into Manchester, and one fifth into Sheffield, is from outside of the 3.2.18Local Authority Districts within the Area of Intervention. Most of the trips to/from ‘Elsewhere’ are from the rest of the Greater Manchester conurbation; for Sheffield, Rotherham accounts for a large share. Trips classified as ‘Elsewhere’ tend to be local cross-boundary journeys that are likely to add to congestion in and around the connections to the trans-Pennine route options under consideration. The accommodation of these trips will be considered in the definition of interventions to connect improved trans-Pennine route options to the rest of the road network.
Figure 3-8 presents the existing commuter patterns to Manchester City Centre and Figure 3-9 3.2.19
presents the existing commuter patterns to Sheffield. The higher distribution of commuters originating from areas to the east of Sheffield compared to those originating from the west is clearly evident in Figure 3-9 and reflects the greater connectivity of Sheffield to the east compared to the west. Figure 3-9 shows westward commuting patterns towards the Pennines from southern Sheffield, as well as from northern Sheffield.
Specifically for the High Peak Borough, the majority of commuter travel is to Stockport, Tameside 3.2.20and Manchester. The existing public transport offer is limited and cars are therefore heavily relied upon. In Buxton, there is a less distinctive pattern of out commuting. Rail links are limited only towards Manchester so travel from elsewhere tends to be by car.
Figure 3-8 Existing Commuting Patterns to Manchester (Census, 2011)
Figure 3-9 Existing Commuting Patterns to Sheffield (Census, 2011)
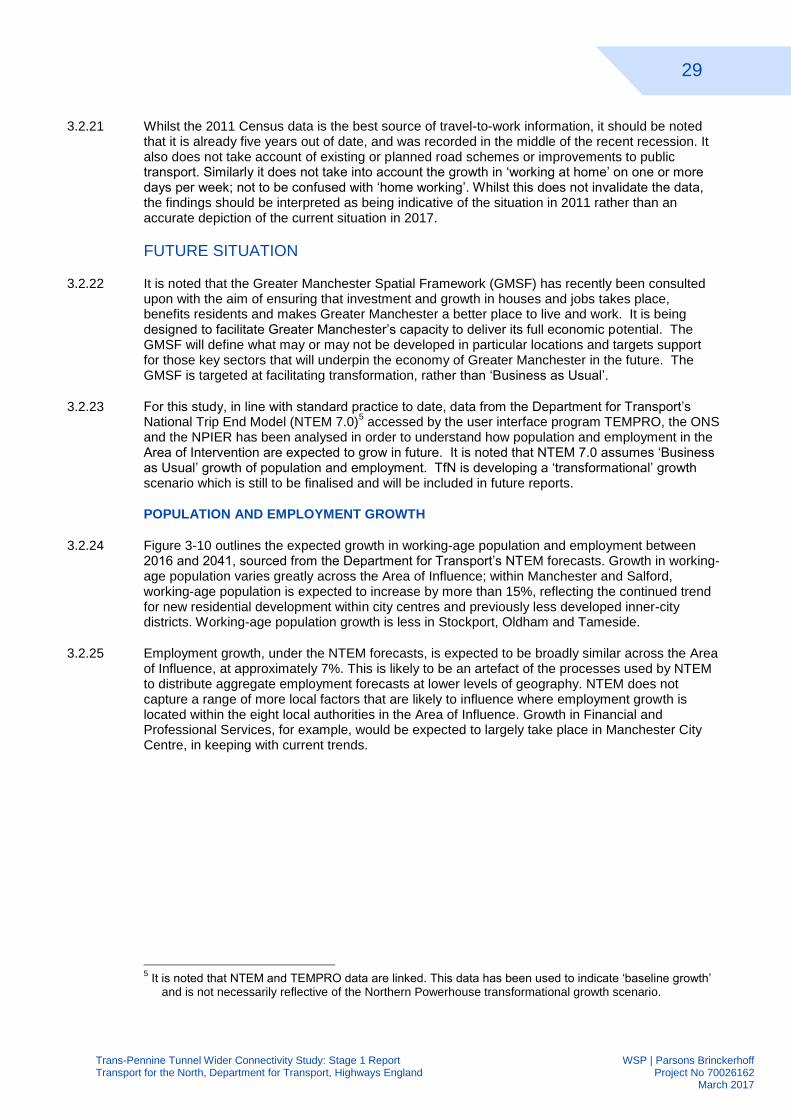
29
Trans-Pennine Tunnel Wider Connectivity Study: Stage 1 Report WSP | Parsons Brinckerhoff Transport for the North, Department for Transport, Highways England Project No 70026162 March 2017
Whilst the 2011 Census data is the best source of travel-to-work information, it should be noted 3.2.21that it is already five years out of date, and was recorded in the middle of the recent recession. It also does not take account of existing or planned road schemes or improvements to public transport. Similarly it does not take into account the growth in ‘working at home’ on one or more days per week; not to be confused with ‘home working’. Whilst this does not invalidate the data, the findings should be interpreted as being indicative of the situation in 2011 rather than an accurate depiction of the current situation in 2017.
FUTURE SITUATION
It is noted that the Greater Manchester Spatial Framework (GMSF) has recently been consulted 3.2.22upon with the aim of ensuring that investment and growth in houses and jobs takes place, benefits residents and makes Greater Manchester a better place to live and work. It is being designed to facilitate Greater Manchester’s capacity to deliver its full economic potential. The GMSF will define what may or may not be developed in particular locations and targets support for those key sectors that will underpin the economy of Greater Manchester in the future. The GMSF is targeted at facilitating transformation, rather than ‘Business as Usual’.
For this study, in line with standard practice to date, data from the Department for Transport’s 3.2.23National Trip End Model (NTEM 7.0)
5 accessed by the user interface program TEMPRO, the ONS
and the NPIER has been analysed in order to understand how population and employment in the Area of Intervention are expected to grow in future. It is noted that NTEM 7.0 assumes ‘Business as Usual’ growth of population and employment. TfN is developing a ‘transformational’ growth scenario which is still to be finalised and will be included in future reports.
POPULATION AND EMPLOYMENT GROWTH
Figure 3-10 outlines the expected growth in working-age population and employment between 3.2.242016 and 2041, sourced from the Department for Transport’s NTEM forecasts. Growth in working-age population varies greatly across the Area of Influence; within Manchester and Salford, working-age population is expected to increase by more than 15%, reflecting the continued trend for new residential development within city centres and previously less developed inner-city districts. Working-age population growth is less in Stockport, Oldham and Tameside.
Employment growth, under the NTEM forecasts, is expected to be broadly similar across the Area 3.2.25of Influence, at approximately 7%. This is likely to be an artefact of the processes used by NTEM to distribute aggregate employment forecasts at lower levels of geography. NTEM does not capture a range of more local factors that are likely to influence where employment growth is located within the eight local authorities in the Area of Influence. Growth in Financial and Professional Services, for example, would be expected to largely take place in Manchester City Centre, in keeping with current trends.
5 It is noted that NTEM and TEMPRO data are linked. This data has been used to indicate ‘baseline growth’
and is not necessarily reflective of the Northern Powerhouse transformational growth scenario.
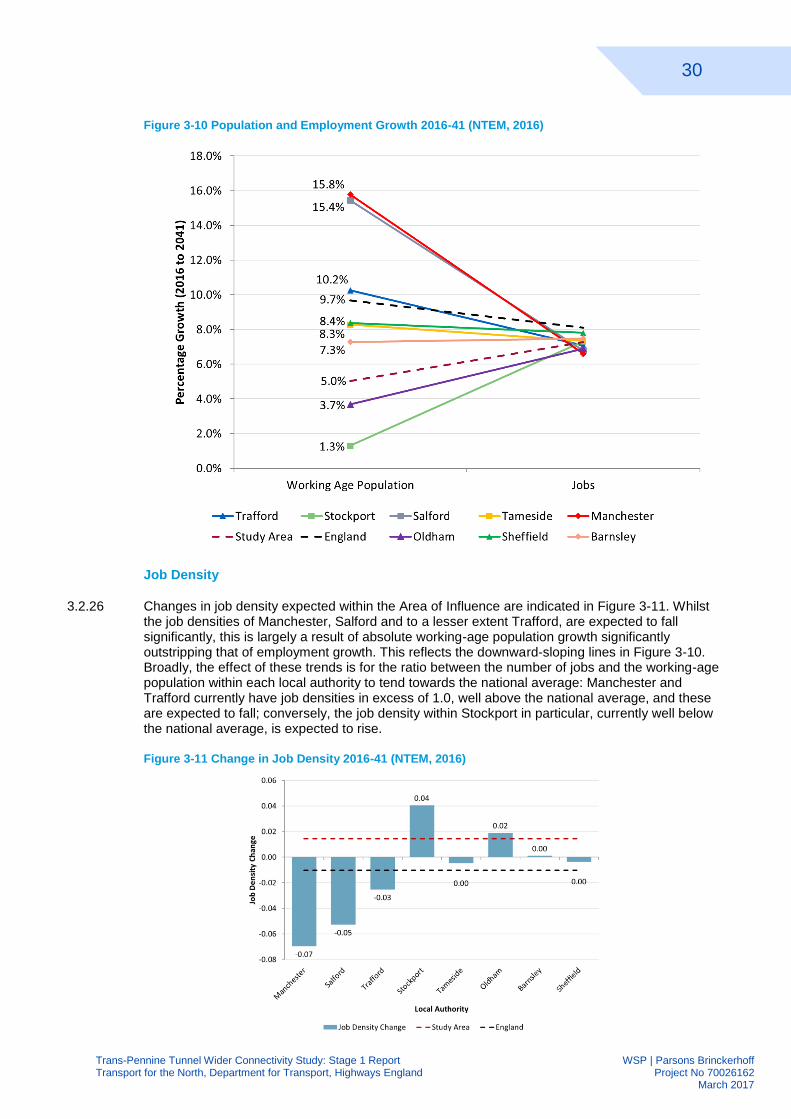
30
Trans-Pennine Tunnel Wider Connectivity Study: Stage 1 Report WSP | Parsons Brinckerhoff Transport for the North, Department for Transport, Highways England Project No 70026162 March 2017
Figure 3-10 Population and Employment Growth 2016-41 (NTEM, 2016)
Job Density
Changes in job density expected within the Area of Influence are indicated in Figure 3-11. Whilst 3.2.26the job densities of Manchester, Salford and to a lesser extent Trafford, are expected to fall significantly, this is largely a result of absolute working-age population growth significantly outstripping that of employment growth. This reflects the downward-sloping lines in Figure 3-10. Broadly, the effect of these trends is for the ratio between the number of jobs and the working-age population within each local authority to tend towards the national average: Manchester and Trafford currently have job densities in excess of 1.0, well above the national average, and these are expected to fall; conversely, the job density within Stockport in particular, currently well below the national average, is expected to rise.
Figure 3-11 Change in Job Density 2016-41 (NTEM, 2016)
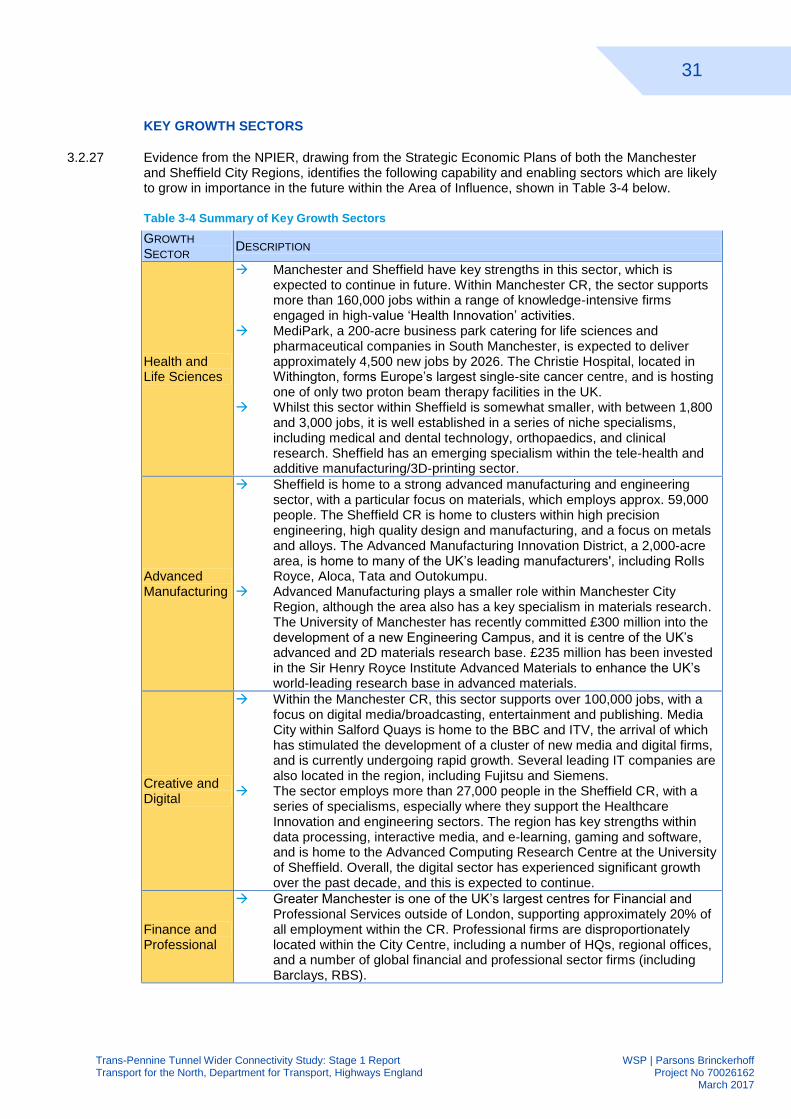
31
Trans-Pennine Tunnel Wider Connectivity Study: Stage 1 Report WSP | Parsons Brinckerhoff Transport for the North, Department for Transport, Highways England Project No 70026162 March 2017
KEY GROWTH SECTORS
Evidence from the NPIER, drawing from the Strategic Economic Plans of both the Manchester 3.2.27and Sheffield City Regions, identifies the following capability and enabling sectors which are likely to grow in importance in the future within the Area of Influence, shown in Table 3-4 below.
Table 3-4 Summary of Key Growth Sectors
GROWTH
SECTOR DESCRIPTION
Health and Life Sciences
Manchester and Sheffield have key strengths in this sector, which is expected to continue in future. Within Manchester CR, the sector supports more than 160,000 jobs within a range of knowledge-intensive firms engaged in high-value ‘Health Innovation’ activities.
MediPark, a 200-acre business park catering for life sciences and pharmaceutical companies in South Manchester, is expected to deliver approximately 4,500 new jobs by 2026. The Christie Hospital, located in Withington, forms Europe’s largest single-site cancer centre, and is hosting one of only two proton beam therapy facilities in the UK.
Whilst this sector within Sheffield is somewhat smaller, with between 1,800 and 3,000 jobs, it is well established in a series of niche specialisms, including medical and dental technology, orthopaedics, and clinical research. Sheffield has an emerging specialism within the tele-health and additive manufacturing/3D-printing sector.
Advanced Manufacturing
Sheffield is home to a strong advanced manufacturing and engineering sector, with a particular focus on materials, which employs approx. 59,000 people. The Sheffield CR is home to clusters within high precision engineering, high quality design and manufacturing, and a focus on metals and alloys. The Advanced Manufacturing Innovation District, a 2,000-acre area, is home to many of the UK’s leading manufacturers', including Rolls Royce, Aloca, Tata and Outokumpu.
Advanced Manufacturing plays a smaller role within Manchester City Region, although the area also has a key specialism in materials research. The University of Manchester has recently committed £300 million into the development of a new Engineering Campus, and it is centre of the UK’s advanced and 2D materials research base. £235 million has been invested in the Sir Henry Royce Institute Advanced Materials to enhance the UK’s world-leading research base in advanced materials.
Creative and Digital
Within the Manchester CR, this sector supports over 100,000 jobs, with a focus on digital media/broadcasting, entertainment and publishing. Media City within Salford Quays is home to the BBC and ITV, the arrival of which has stimulated the development of a cluster of new media and digital firms, and is currently undergoing rapid growth. Several leading IT companies are also located in the region, including Fujitsu and Siemens.
The sector employs more than 27,000 people in the Sheffield CR, with a series of specialisms, especially where they support the Healthcare Innovation and engineering sectors. The region has key strengths within data processing, interactive media, and e-learning, gaming and software, and is home to the Advanced Computing Research Centre at the University of Sheffield. Overall, the digital sector has experienced significant growth over the past decade, and this is expected to continue.
Finance and Professional
Greater Manchester is one of the UK’s largest centres for Financial and Professional Services outside of London, supporting approximately 20% of all employment within the CR. Professional firms are disproportionately located within the City Centre, including a number of HQs, regional offices, and a number of global financial and professional sector firms (including Barclays, RBS).
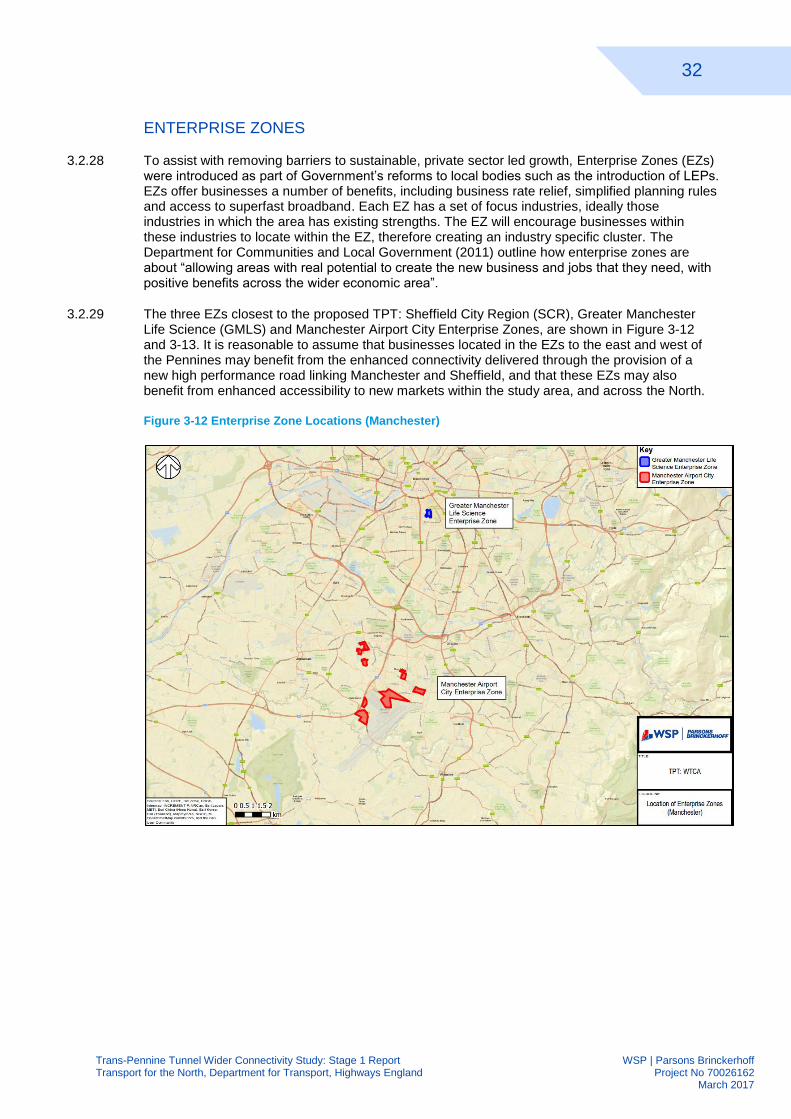
32
Trans-Pennine Tunnel Wider Connectivity Study: Stage 1 Report WSP | Parsons Brinckerhoff Transport for the North, Department for Transport, Highways England Project No 70026162 March 2017
ENTERPRISE ZONES
To assist with removing barriers to sustainable, private sector led growth, Enterprise Zones (EZs) 3.2.28were introduced as part of Government’s reforms to local bodies such as the introduction of LEPs. EZs offer businesses a number of benefits, including business rate relief, simplified planning rules and access to superfast broadband. Each EZ has a set of focus industries, ideally those industries in which the area has existing strengths. The EZ will encourage businesses within these industries to locate within the EZ, therefore creating an industry specific cluster. The Department for Communities and Local Government (2011) outline how enterprise zones are about “allowing areas with real potential to create the new business and jobs that they need, with positive benefits across the wider economic area”.
The three EZs closest to the proposed TPT: Sheffield City Region (SCR), Greater Manchester 3.2.29Life Science (GMLS) and Manchester Airport City Enterprise Zones, are shown in Figure 3-12 and 3-13. It is reasonable to assume that businesses located in the EZs to the east and west of the Pennines may benefit from the enhanced connectivity delivered through the provision of a new high performance road linking Manchester and Sheffield, and that these EZs may also benefit from enhanced accessibility to new markets within the study area, and across the North.
Figure 3-12 Enterprise Zone Locations (Manchester)
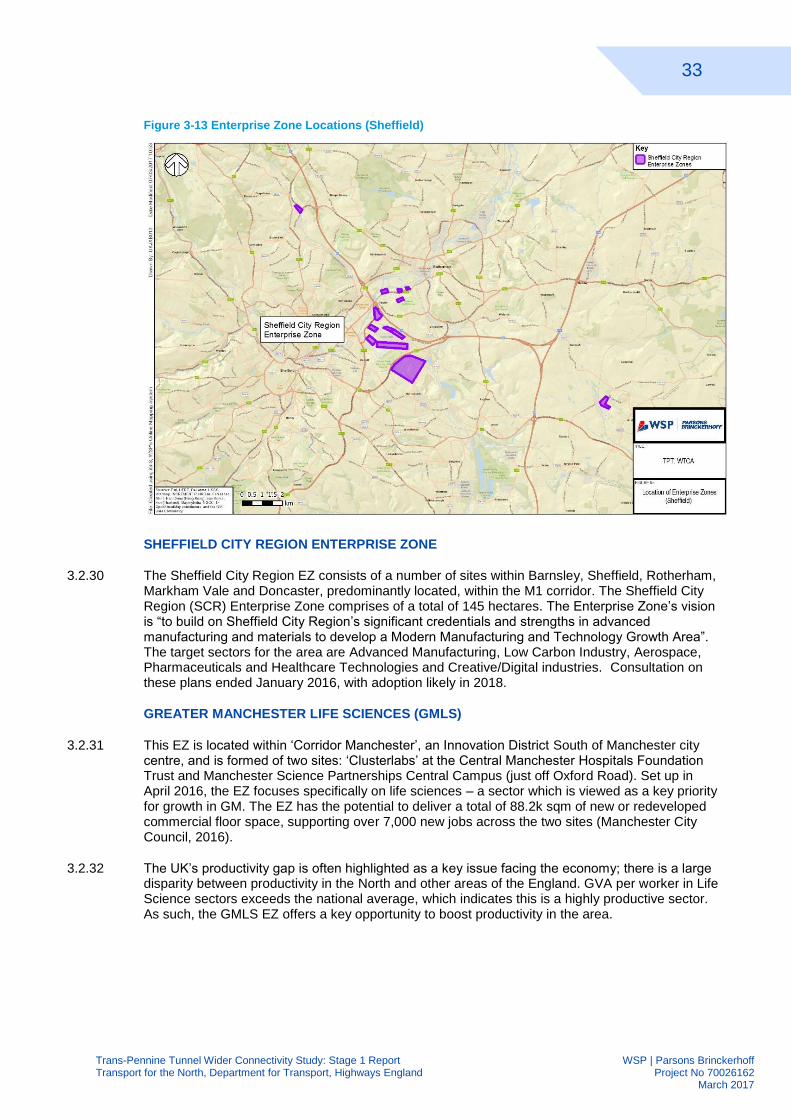
33
Trans-Pennine Tunnel Wider Connectivity Study: Stage 1 Report WSP | Parsons Brinckerhoff Transport for the North, Department for Transport, Highways England Project No 70026162 March 2017
Figure 3-13 Enterprise Zone Locations (Sheffield)
SHEFFIELD CITY REGION ENTERPRISE ZONE
The Sheffield City Region EZ consists of a number of sites within Barnsley, Sheffield, Rotherham, 3.2.30Markham Vale and Doncaster, predominantly located, within the M1 corridor. The Sheffield City Region (SCR) Enterprise Zone comprises of a total of 145 hectares. The Enterprise Zone’s vision is “to build on Sheffield City Region’s significant credentials and strengths in advanced manufacturing and materials to develop a Modern Manufacturing and Technology Growth Area”. The target sectors for the area are Advanced Manufacturing, Low Carbon Industry, Aerospace, Pharmaceuticals and Healthcare Technologies and Creative/Digital industries. Consultation on these plans ended January 2016, with adoption likely in 2018.
GREATER MANCHESTER LIFE SCIENCES (GMLS)
This EZ is located within ‘Corridor Manchester’, an Innovation District South of Manchester city 3.2.31centre, and is formed of two sites: ‘Clusterlabs’ at the Central Manchester Hospitals Foundation Trust and Manchester Science Partnerships Central Campus (just off Oxford Road). Set up in April 2016, the EZ focuses specifically on life sciences – a sector which is viewed as a key priority for growth in GM. The EZ has the potential to deliver a total of 88.2k sqm of new or redeveloped commercial floor space, supporting over 7,000 new jobs across the two sites (Manchester City Council, 2016).
The UK’s productivity gap is often highlighted as a key issue facing the economy; there is a large 3.2.32disparity between productivity in the North and other areas of the England. GVA per worker in Life Science sectors exceeds the national average, which indicates this is a highly productive sector. As such, the GMLS EZ offers a key opportunity to boost productivity in the area.
34
Trans-Pennine Tunnel Wider Connectivity Study: Stage 1 Report WSP | Parsons Brinckerhoff Transport for the North, Department for Transport, Highways England Project No 70026162 March 2017
MANCHESTER AIRPORT CITY
The EZ is comprised of a series of sites around the Airport, Atlas Business Park, Wythenshawe 3.2.33Town Centre and University Hospital South Manchester Foundation Trust. It focuses on a range of sectors across these different sites, including Advanced Manufacturing/Engineering, Business Services, Industrial Biotechnology and Pharmaceuticals & Healthcare Technology.
MediPark, one of the EZ sites, will become the largest health and science research centre in 3.2.34Europe and is expected to catalyse growth within the GM region. The location of this EZ, near to Manchester Airport, is a key draw for potential businesses and investors.
LOCAL PLANS
In addition to EZs, it is also important to consider Local Plans; these set out where local 3.2.35authorities predict future employment growth will be. This review of Local Plans has focused on those produced by areas closest to the TPT; Manchester and Sheffield/Rotherham.
MANCHESTER LOCAL PLAN6
The Manchester Local Plan (Policy EC 1) identifies the Regional Centre (Manchester City Centre 3.2.36and Central Park & Eastland) and the Airport & surrounding area as locations which will accommodate major employment growth in the future. Manchester promotes sustainable transport and according to the GM Growth and Reform Plan there has been a ‘significant shift from commuting by car to key employment centres, notably the Regional Centre’ as result of this.
Greater Manchester LEP has four major campaigns; to help attract inward investment and 3.2.37encourage growth, these are focused around the areas specialist sectors and building on current success. The sectors of focus are: Technology Media and Communications, Science, Advanced Materials and Financial Services.
SHEFFIELD LOCAL PLAN
Sheffield’s Local Plan puts forward the city centre as a key location for employment growth, both 3.2.38within the city and the wider city region. City centre roads are likely to be congested at peak times meaning city centre growth is likely to rely heavily on public transport.
Options for the TPT will link to the M1 via the Lower Don Valley, an area which the Sheffield Local 3.2.39Plan sets out as an important regeneration area. Several of the Sheffield City Region EZ sites are located here. The area around Meadowhall is identified as having capacity for growth (Policy CS 7), with vacant land here targeted for a mix of office and non-office uses.
Tinsley Park, also within the Lower Don Valley, is highlighted within Sheffield’s Local Plan as an 3.2.40area which can accommodate businesses in need of large employment sites (which are not available in city centres). Parts of Tinsley Park lie within the Sheffield City Region EZ. Target businesses here are those in manufacturing and distribution/warehouse sectors. Tinsley Park’s location, next to the M1, means it is ideally situated for nationally mobile businesses; the TPT will further strengthen the area’s connectivity.
6 It is noted that both Stockport and Oldham have adopted their own respective core strategies/local plans.
Furthermore, it is acknowledged that these link with the Manchester Local Plan and they impact on areas which are within the area of impact of the proposed TPT.

35
Trans-Pennine Tunnel Wider Connectivity Study: Stage 1 Report WSP | Parsons Brinckerhoff Transport for the North, Department for Transport, Highways England Project No 70026162 March 2017
HOUSING GROWTH
MANCHESTER, SALFORD, TRAFFORD, TAMESIDE, OLDHAM AND STOCKPORT
According to the Greater Manchester Spatial Framework (Consultation October 2016), 227,200 3.2.41new homes are to be built in the Manchester City Region between 2015 and 2035, with 7,400 planned in 2016/17 increasing to 12,300 every year from 2022/23. Manchester and Salford local authorities are expected to receive the greatest numbers of additional dwellings, as with each remaining local authority receiving between 6% and 10% of the total number of planned homes.
Within the Greater Manchester Spatial Framework, a number of major development sites – each 3.2.42with more than 1,000 new dwellings – are planned within the Area of Influence
7. These include:
Manchester 40,000 new dwellings constructed in the city centre. Notable development sites include Piccadilly/Mayfield, Spinningfields, St Johns and the Civic Quarter;
Trafford 3,300 new homes at Timperley Wedge, a site of strategic significance due to its proximity to the forthcoming Airport HS2 station. 7,500 new homes at Carrington;
Salford 6,000 new homes (primarily apartments) are to be built at Salford Quays. Major development of 2,250 homes at Irlam and Cadishead, representing a westward expansion;
Four major residential developments are to be built in Stockport, at Woodford (2,400 homes), High Lane (4,000 homes), and two sites near Heald Green, with 3,700 and 2,000 homes;
In Tameside, around 1,980 homes will be constructed at Ashton Moss, over an area spanning both sides of the M60. New garden village at Godley Green will provide 2,350 homes, situated between the A560 and the M67, and up to 935 homes are to be constructed in South Tameside, in close proximity to both the M60 and M67;
It is noted that while there is some certainty around the existing land supply considered in the 3.2.43GMSF, many outlying sites are far from certain to be developed as things stand at present.
SHEFFIELD
The Sheffield Plan: Citywide Options for Growth to 2034 (2015) outlines five possible housing 3.2.44growth options, currently under consultation. These options are not exclusive, and any number could be taken forward. Each has different spatial housing growth implications.
Option A is to continue the current strategy of concentrating new development on brownfield sites within the Sheffield, Stocksbridge and Chapeltown urban areas. This could deliver 19,300 new homes;
Option B would increase the capacity of the city centre and Kelham by an estimated 10,000 homes, through making more intensive use of sites within existing urban areas by relaxing amenity standards, emphasising city centre living and relaxing policies for the protection of open space (allowing surplus urban green space to be developed);
Option C involves major remodelling of parts of the existing urban area to create new neighbourhoods, mainly through relocation of poorer quality employment. Option C could deliver a total of 4,300 homes in Neepsend / Shalesmoor and Attercliffe towards the end of the trial period, making use of land close to the city centre;
Options D and E allow a limited number of urban extensions into the Green Belt. In combination these two options could provide an addition 6,650 in areas further from the city centre to the north, south, east and south east.
7 Draft Greater Manchester Spatial Framework, Greater Manchester Combined Authority; “The 57
developments that would transform every Greater Manchester borough by 2035”, Manchester Evening News, October 2016.
36
Trans-Pennine Tunnel Wider Connectivity Study: Stage 1 Report WSP | Parsons Brinckerhoff Transport for the North, Department for Transport, Highways England Project No 70026162 March 2017
BARNSLEY
Within Barnsley, the Local Plan Consultation Draft 2014 outlines proposals for 20,000 additional 3.2.45homes in Barnsley, and surrounding settlements, by 2033.
8,366 of these new homes will be in the Barnsley urban area, accounting for 40% of the proposed total development.
Hoyland will receive the second largest number of new homes. Of the 3,141 new homes to be developed in Hoyland, 607, 546 and 520 homes will be constructed on sites at Hoyland Common, on land north east of Hemingfield, and at Springwood Farm respectively.
Both Hoyland and Barnsley are located only a short distance from the M1, and hence are likely to be extremely accessible to the proposed TPT.
Although priority will be given to investment in development on non-green belt sites, the recognised insufficient availability of land on which to build enough new homes by 2033 will require a small amount of green belt development.
It is important to acknowledge that the growth outlined within this sub-section has been included 3.2.46as an indicative basis for future growth and is subject to change. Furthermore, it is noted that whilst there is relative certainty in terms of current land supply, there is a degree of uncertainty for future land supply within all of the areas under analysis.
STOCKPORT
The Core Strategy provides the spatial strategy for the borough of Stockport to 2026. It has the 3.2.47following relevant objectives:
Over the 15-year period (2011-2026), support an additional 7,200 new homes in the Stockport Area. This is equivalent to 495 new homes per year.
Create a prosperous and diverse economy to attract inward investment and support sustainable regeneration of the borough
Seek an efficient and extensive network to make service and opportunities accessible to all, reduce congestion and reduce the environmental impact of transport.
TAMESIDE
Tameside Local Plan is currently being prepared to replace to adopted Unitary Development Plan 3.2.48adopted in 2004. The key policies of the plan focus on housing and employment land requirements and the infrastructure requirements to deliver these. This is informed largely by the Greater Manchester Spatial Framework (GMSF) which defines the housing and employment requirements for Greater Manchester to 2035.
The GMSF recommends for Tameside, in the period to 2035 there is: 35,000 m2 of gross new office floor space 483,000 m2 of industrial and warehousing floor space in Tameside 13,600 dwellings in Tameside (680 per annum)
NEIGHBOURING AUTHORITIES
Neighbouring authorities including Chesterfield, North East Derbyshire, Bolsover, Bassetlaw, High 3.2.49Peak and Cheshire East all have growth agendas. In some cases this may ease the burden of Sheffield and Greater Manchester in relation to housing and employment sites. However, it is more likely that the two cities / City Regions will be the locations that the growing populations of surrounding boroughs and districts will be looking to for employment and access to other services. Development in one district may affect a neighbouring one and vice versa.
Sitting between Greater Manchester and the Peak District National Park, future plans for the High 3.2.50Peak District have been highlighted. The High Peak Local Plan, April 2016, sets out the strategic
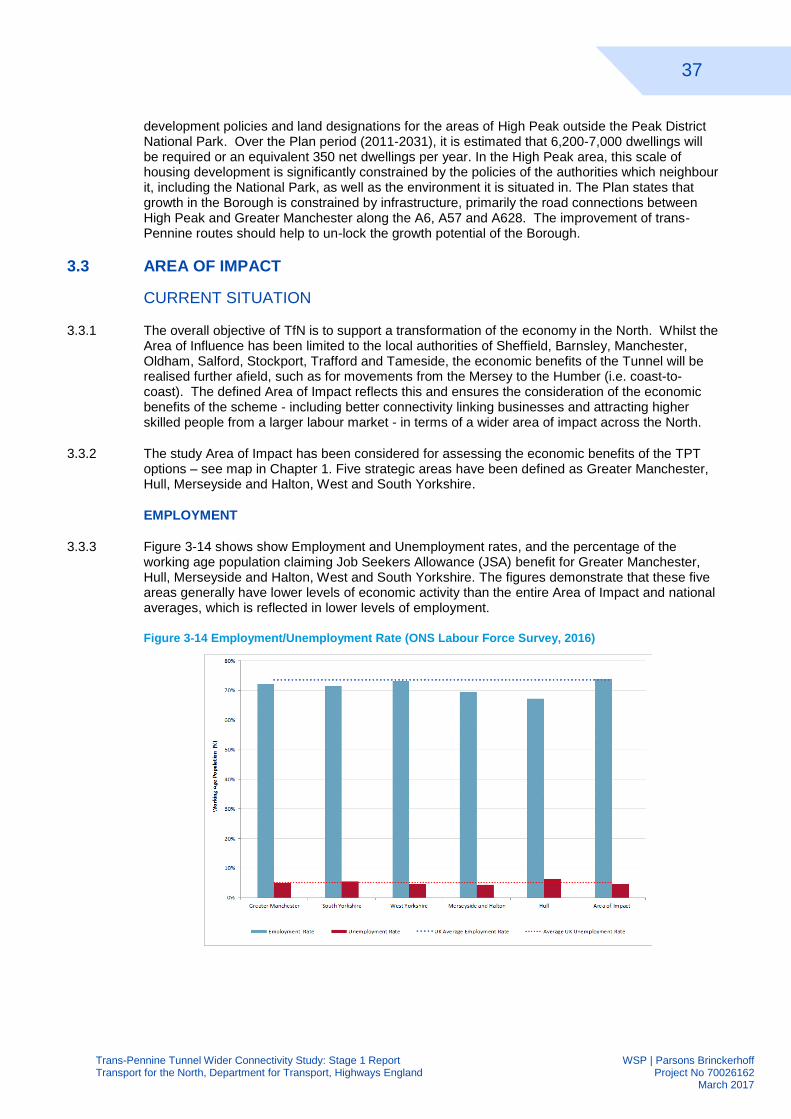
37
Trans-Pennine Tunnel Wider Connectivity Study: Stage 1 Report WSP | Parsons Brinckerhoff Transport for the North, Department for Transport, Highways England Project No 70026162 March 2017
development policies and land designations for the areas of High Peak outside the Peak District National Park. Over the Plan period (2011-2031), it is estimated that 6,200-7,000 dwellings will be required or an equivalent 350 net dwellings per year. In the High Peak area, this scale of housing development is significantly constrained by the policies of the authorities which neighbour it, including the National Park, as well as the environment it is situated in. The Plan states that growth in the Borough is constrained by infrastructure, primarily the road connections between High Peak and Greater Manchester along the A6, A57 and A628. The improvement of trans-Pennine routes should help to un-lock the growth potential of the Borough.
3.3 AREA OF IMPACT
CURRENT SITUATION
The overall objective of TfN is to support a transformation of the economy in the North. Whilst the 3.3.1Area of Influence has been limited to the local authorities of Sheffield, Barnsley, Manchester, Oldham, Salford, Stockport, Trafford and Tameside, the economic benefits of the Tunnel will be realised further afield, such as for movements from the Mersey to the Humber (i.e. coast-to-coast). The defined Area of Impact reflects this and ensures the consideration of the economic benefits of the scheme - including better connectivity linking businesses and attracting higher skilled people from a larger labour market - in terms of a wider area of impact across the North.
The study Area of Impact has been considered for assessing the economic benefits of the TPT 3.3.2options – see map in Chapter 1. Five strategic areas have been defined as Greater Manchester, Hull, Merseyside and Halton, West and South Yorkshire.
EMPLOYMENT
Figure 3-14 shows show Employment and Unemployment rates, and the percentage of the 3.3.3working age population claiming Job Seekers Allowance (JSA) benefit for Greater Manchester, Hull, Merseyside and Halton, West and South Yorkshire. The figures demonstrate that these five areas generally have lower levels of economic activity than the entire Area of Impact and national averages, which is reflected in lower levels of employment.
Figure 3-14 Employment/Unemployment Rate (ONS Labour Force Survey, 2016)
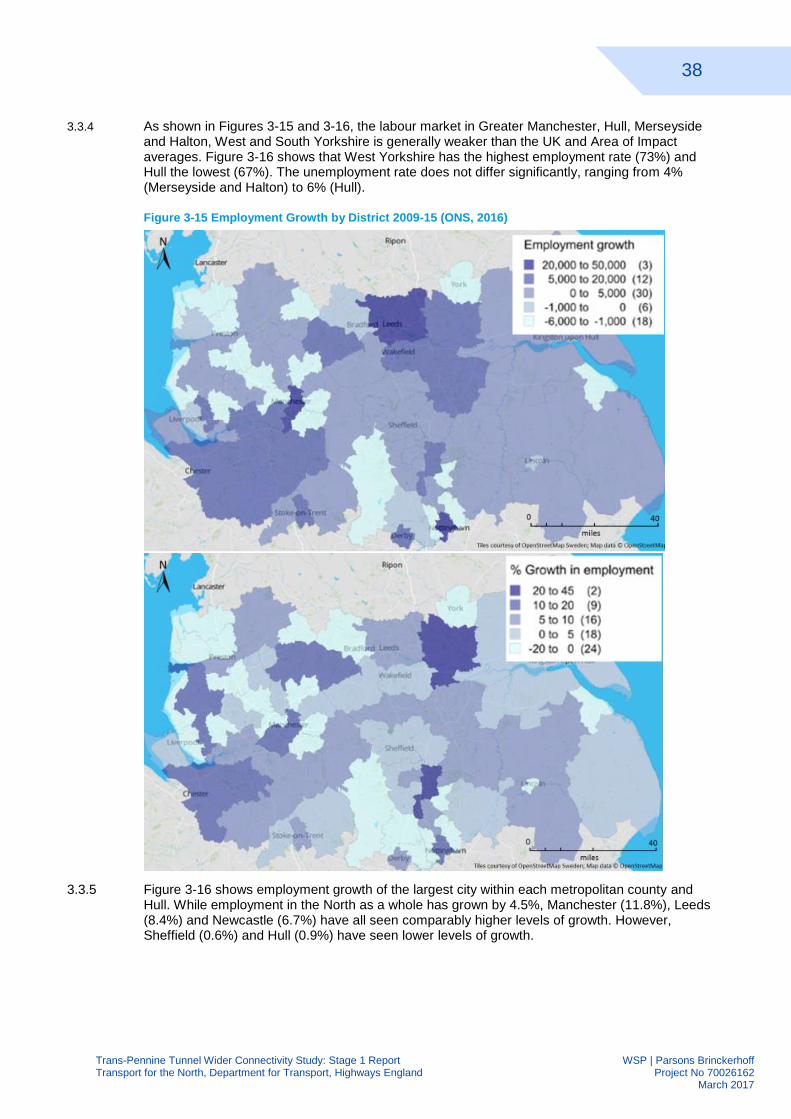
38
Trans-Pennine Tunnel Wider Connectivity Study: Stage 1 Report WSP | Parsons Brinckerhoff Transport for the North, Department for Transport, Highways England Project No 70026162 March 2017
As shown in Figures 3-15 and 3-16, the labour market in Greater Manchester, Hull, Merseyside 3.3.4
and Halton, West and South Yorkshire is generally weaker than the UK and Area of Impact averages. Figure 3-16 shows that West Yorkshire has the highest employment rate (73%) and Hull the lowest (67%). The unemployment rate does not differ significantly, ranging from 4% (Merseyside and Halton) to 6% (Hull).
Figure 3-15 Employment Growth by District 2009-15 (ONS, 2016)
Figure 3-16 shows employment growth of the largest city within each metropolitan county and 3.3.5Hull. While employment in the North as a whole has grown by 4.5%, Manchester (11.8%), Leeds (8.4%) and Newcastle (6.7%) have all seen comparably higher levels of growth. However, Sheffield (0.6%) and Hull (0.9%) have seen lower levels of growth.
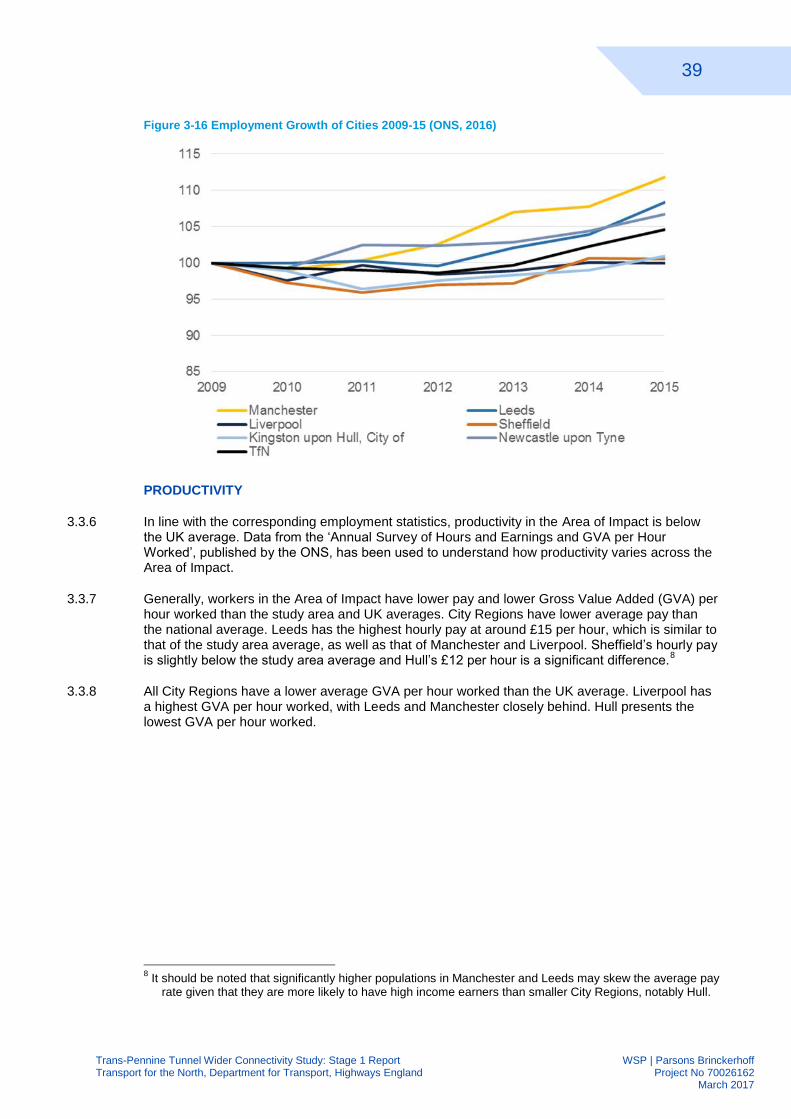
39
Trans-Pennine Tunnel Wider Connectivity Study: Stage 1 Report WSP | Parsons Brinckerhoff Transport for the North, Department for Transport, Highways England Project No 70026162 March 2017
Figure 3-16 Employment Growth of Cities 2009-15 (ONS, 2016)
PRODUCTIVITY
In line with the corresponding employment statistics, productivity in the Area of Impact is below 3.3.6the UK average. Data from the ‘Annual Survey of Hours and Earnings and GVA per Hour Worked’, published by the ONS, has been used to understand how productivity varies across the Area of Impact.
Generally, workers in the Area of Impact have lower pay and lower Gross Value Added (GVA) per 3.3.7hour worked than the study area and UK averages. City Regions have lower average pay than the national average. Leeds has the highest hourly pay at around £15 per hour, which is similar to that of the study area average, as well as that of Manchester and Liverpool. Sheffield’s hourly pay is slightly below the study area average and Hull’s £12 per hour is a significant difference.
8
All City Regions have a lower average GVA per hour worked than the UK average. Liverpool has 3.3.8a highest GVA per hour worked, with Leeds and Manchester closely behind. Hull presents the lowest GVA per hour worked.
8 It should be noted that significantly higher populations in Manchester and Leeds may skew the average pay
rate given that they are more likely to have high income earners than smaller City Regions, notably Hull.
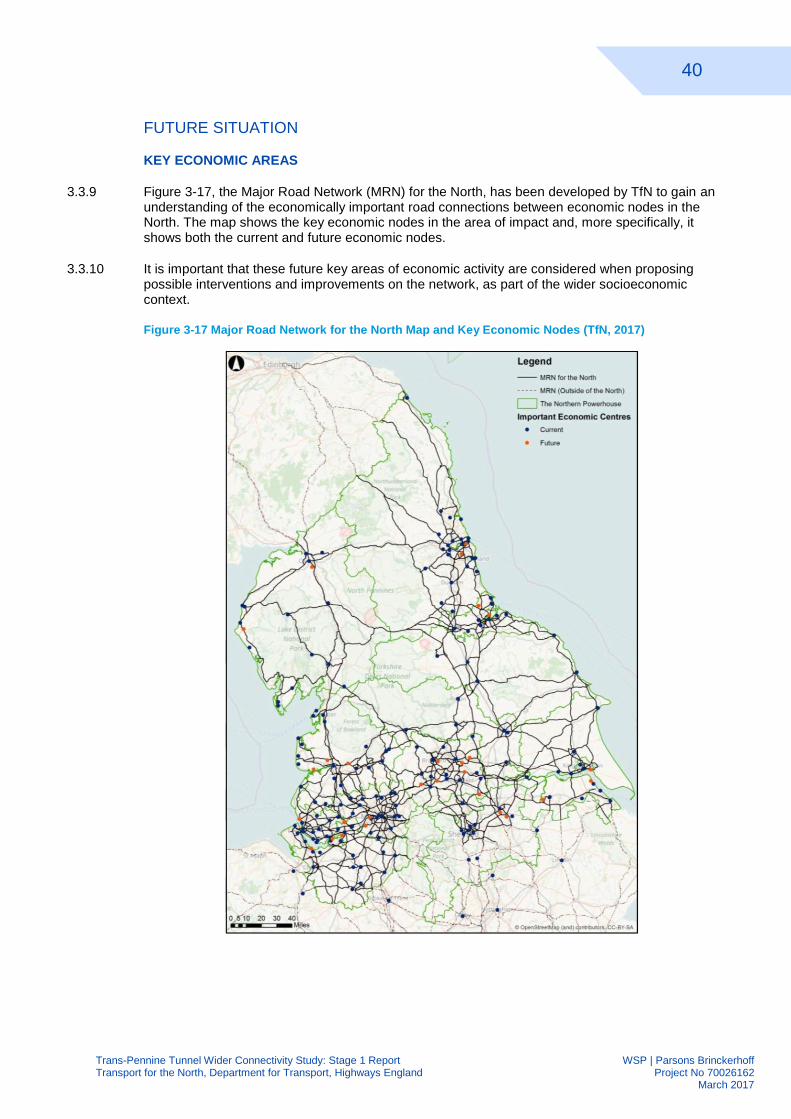
40
Trans-Pennine Tunnel Wider Connectivity Study: Stage 1 Report WSP | Parsons Brinckerhoff Transport for the North, Department for Transport, Highways England Project No 70026162 March 2017
FUTURE SITUATION
KEY ECONOMIC AREAS
Figure 3-17, the Major Road Network (MRN) for the North, has been developed by TfN to gain an 3.3.9understanding of the economically important road connections between economic nodes in the North. The map shows the key economic nodes in the area of impact and, more specifically, it shows both the current and future economic nodes.
It is important that these future key areas of economic activity are considered when proposing 3.3.10possible interventions and improvements on the network, as part of the wider socioeconomic context.
Figure 3-17 Major Road Network for the North Map and Key Economic Nodes (TfN, 2017)
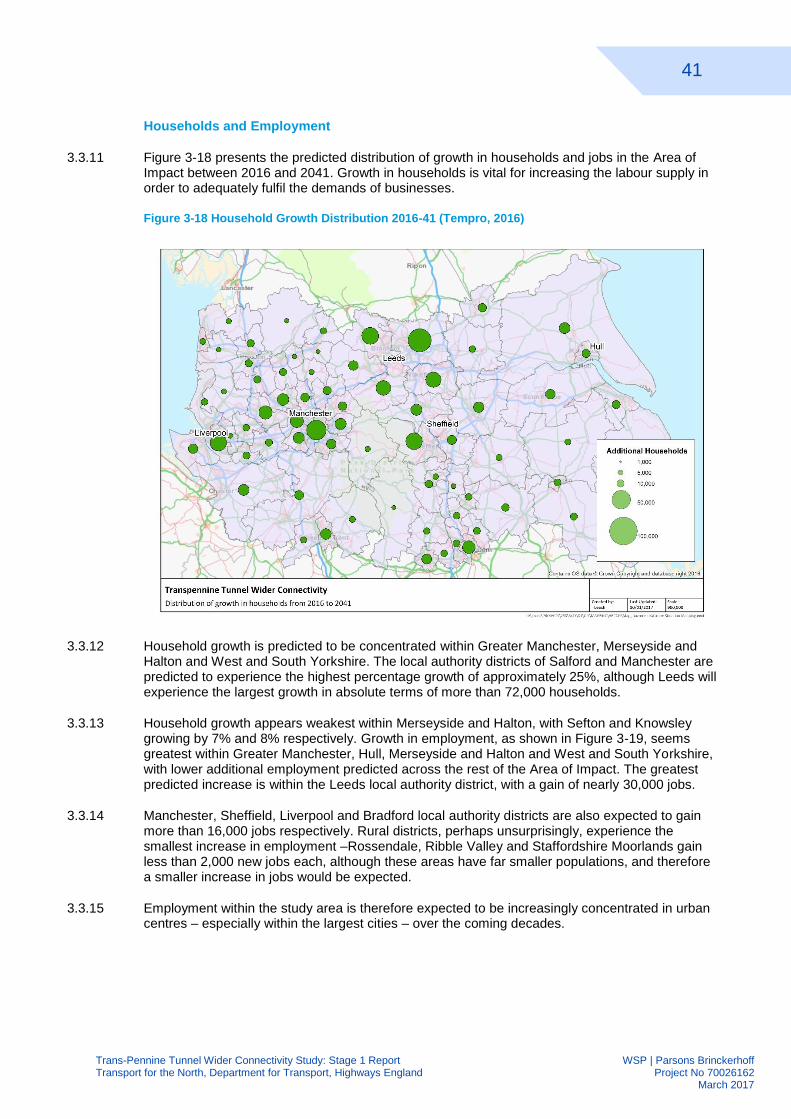
41
Trans-Pennine Tunnel Wider Connectivity Study: Stage 1 Report WSP | Parsons Brinckerhoff Transport for the North, Department for Transport, Highways England Project No 70026162 March 2017
Households and Employment
Figure 3-18 presents the predicted distribution of growth in households and jobs in the Area of 3.3.11Impact between 2016 and 2041. Growth in households is vital for increasing the labour supply in order to adequately fulfil the demands of businesses.
Figure 3-18 Household Growth Distribution 2016-41 (Tempro, 2016)
Household growth is predicted to be concentrated within Greater Manchester, Merseyside and 3.3.12Halton and West and South Yorkshire. The local authority districts of Salford and Manchester are predicted to experience the highest percentage growth of approximately 25%, although Leeds will experience the largest growth in absolute terms of more than 72,000 households.
Household growth appears weakest within Merseyside and Halton, with Sefton and Knowsley 3.3.13growing by 7% and 8% respectively. Growth in employment, as shown in Figure 3-19, seems greatest within Greater Manchester, Hull, Merseyside and Halton and West and South Yorkshire, with lower additional employment predicted across the rest of the Area of Impact. The greatest predicted increase is within the Leeds local authority district, with a gain of nearly 30,000 jobs.
Manchester, Sheffield, Liverpool and Bradford local authority districts are also expected to gain 3.3.14more than 16,000 jobs respectively. Rural districts, perhaps unsurprisingly, experience the smallest increase in employment –Rossendale, Ribble Valley and Staffordshire Moorlands gain less than 2,000 new jobs each, although these areas have far smaller populations, and therefore a smaller increase in jobs would be expected.
Employment within the study area is therefore expected to be increasingly concentrated in urban 3.3.15centres – especially within the largest cities – over the coming decades.
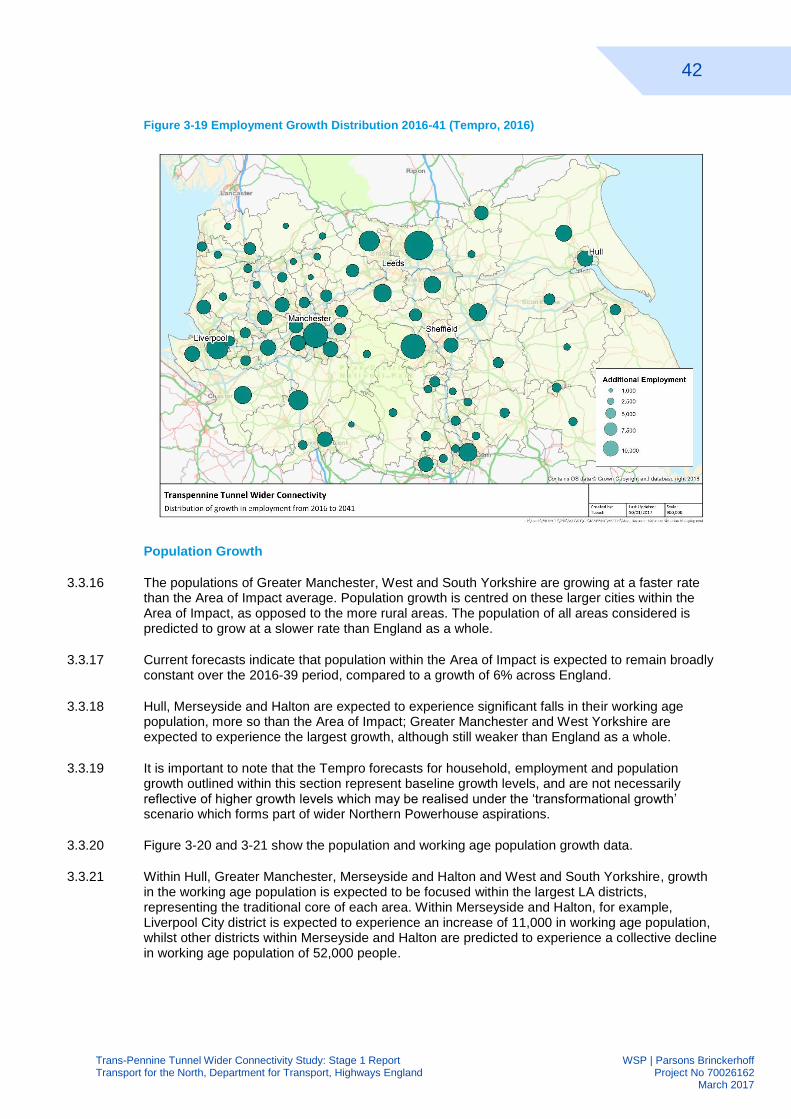
42
Trans-Pennine Tunnel Wider Connectivity Study: Stage 1 Report WSP | Parsons Brinckerhoff Transport for the North, Department for Transport, Highways England Project No 70026162 March 2017
Figure 3-19 Employment Growth Distribution 2016-41 (Tempro, 2016)
Population Growth
The populations of Greater Manchester, West and South Yorkshire are growing at a faster rate 3.3.16than the Area of Impact average. Population growth is centred on these larger cities within the Area of Impact, as opposed to the more rural areas. The population of all areas considered is predicted to grow at a slower rate than England as a whole.
Current forecasts indicate that population within the Area of Impact is expected to remain broadly 3.3.17constant over the 2016-39 period, compared to a growth of 6% across England.
Hull, Merseyside and Halton are expected to experience significant falls in their working age 3.3.18population, more so than the Area of Impact; Greater Manchester and West Yorkshire are expected to experience the largest growth, although still weaker than England as a whole.
It is important to note that the Tempro forecasts for household, employment and population 3.3.19growth outlined within this section represent baseline growth levels, and are not necessarily reflective of higher growth levels which may be realised under the ‘transformational growth’ scenario which forms part of wider Northern Powerhouse aspirations.
Figure 3-20 and 3-21 show the population and working age population growth data. 3.3.20
Within Hull, Greater Manchester, Merseyside and Halton and West and South Yorkshire, growth 3.3.21in the working age population is expected to be focused within the largest LA districts, representing the traditional core of each area. Within Merseyside and Halton, for example, Liverpool City district is expected to experience an increase of 11,000 in working age population, whilst other districts within Merseyside and Halton are predicted to experience a collective decline in working age population of 52,000 people.
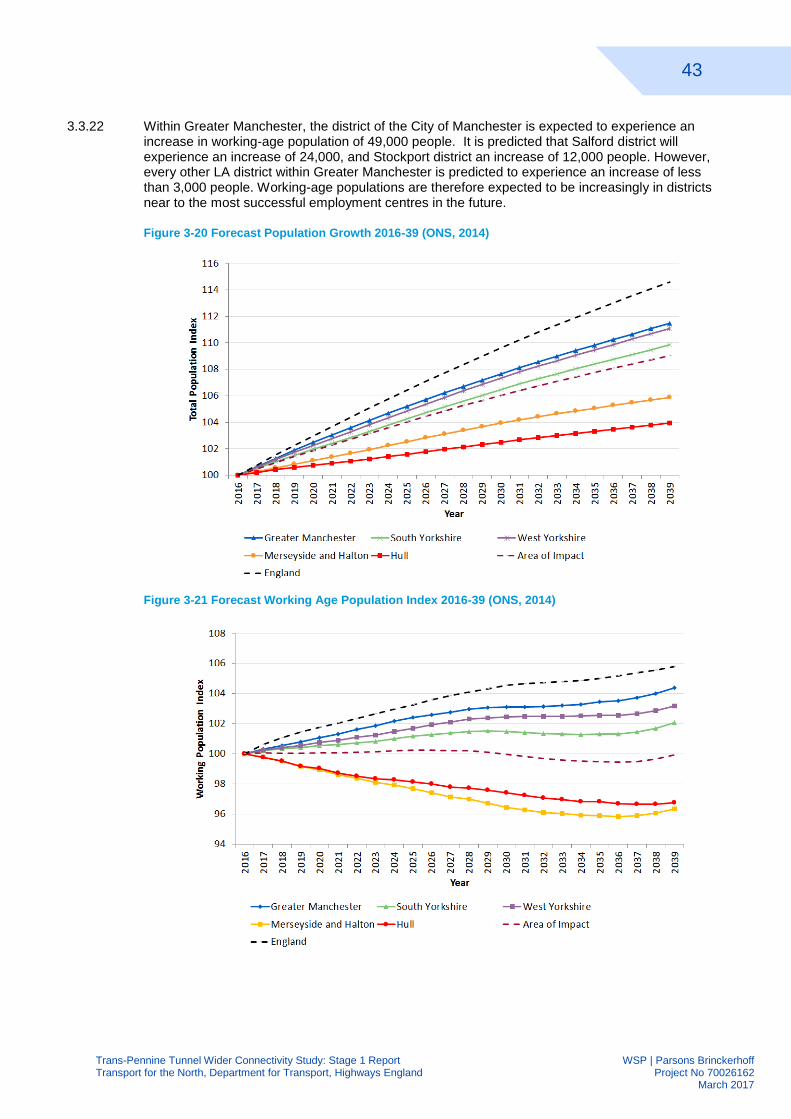
43
Trans-Pennine Tunnel Wider Connectivity Study: Stage 1 Report WSP | Parsons Brinckerhoff Transport for the North, Department for Transport, Highways England Project No 70026162 March 2017
Within Greater Manchester, the district of the City of Manchester is expected to experience an 3.3.22increase in working-age population of 49,000 people. It is predicted that Salford district will experience an increase of 24,000, and Stockport district an increase of 12,000 people. However, every other LA district within Greater Manchester is predicted to experience an increase of less than 3,000 people. Working-age populations are therefore expected to be increasingly in districts near to the most successful employment centres in the future.
Figure 3-20 Forecast Population Growth 2016-39 (ONS, 2014)
Figure 3-21 Forecast Working Age Population Index 2016-39 (ONS, 2014)
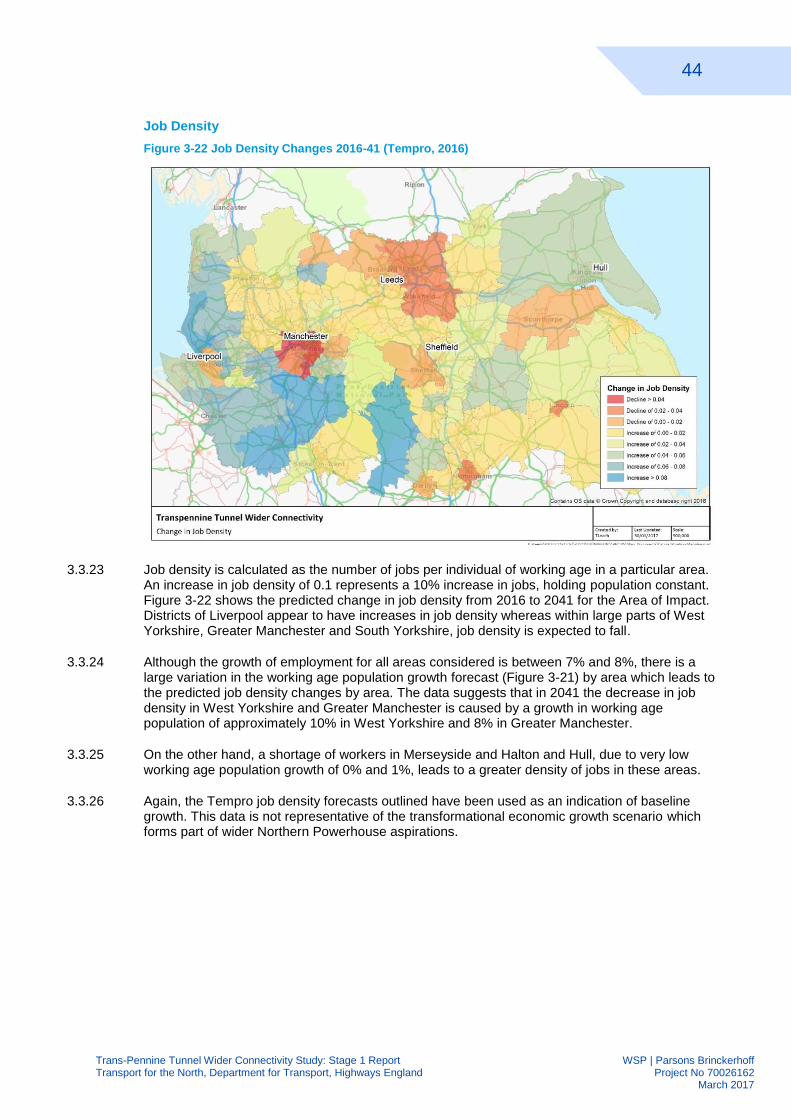
44
Trans-Pennine Tunnel Wider Connectivity Study: Stage 1 Report WSP | Parsons Brinckerhoff Transport for the North, Department for Transport, Highways England Project No 70026162 March 2017
Job Density
Figure 3-22 Job Density Changes 2016-41 (Tempro, 2016)
Job density is calculated as the number of jobs per individual of working age in a particular area. 3.3.23An increase in job density of 0.1 represents a 10% increase in jobs, holding population constant. Figure 3-22 shows the predicted change in job density from 2016 to 2041 for the Area of Impact. Districts of Liverpool appear to have increases in job density whereas within large parts of West Yorkshire, Greater Manchester and South Yorkshire, job density is expected to fall.
Although the growth of employment for all areas considered is between 7% and 8%, there is a 3.3.24large variation in the working age population growth forecast (Figure 3-21) by area which leads to the predicted job density changes by area. The data suggests that in 2041 the decrease in job density in West Yorkshire and Greater Manchester is caused by a growth in working age population of approximately 10% in West Yorkshire and 8% in Greater Manchester.
On the other hand, a shortage of workers in Merseyside and Halton and Hull, due to very low 3.3.25working age population growth of 0% and 1%, leads to a greater density of jobs in these areas.
Again, the Tempro job density forecasts outlined have been used as an indication of baseline 3.3.26growth. This data is not representative of the transformational economic growth scenario which forms part of wider Northern Powerhouse aspirations.
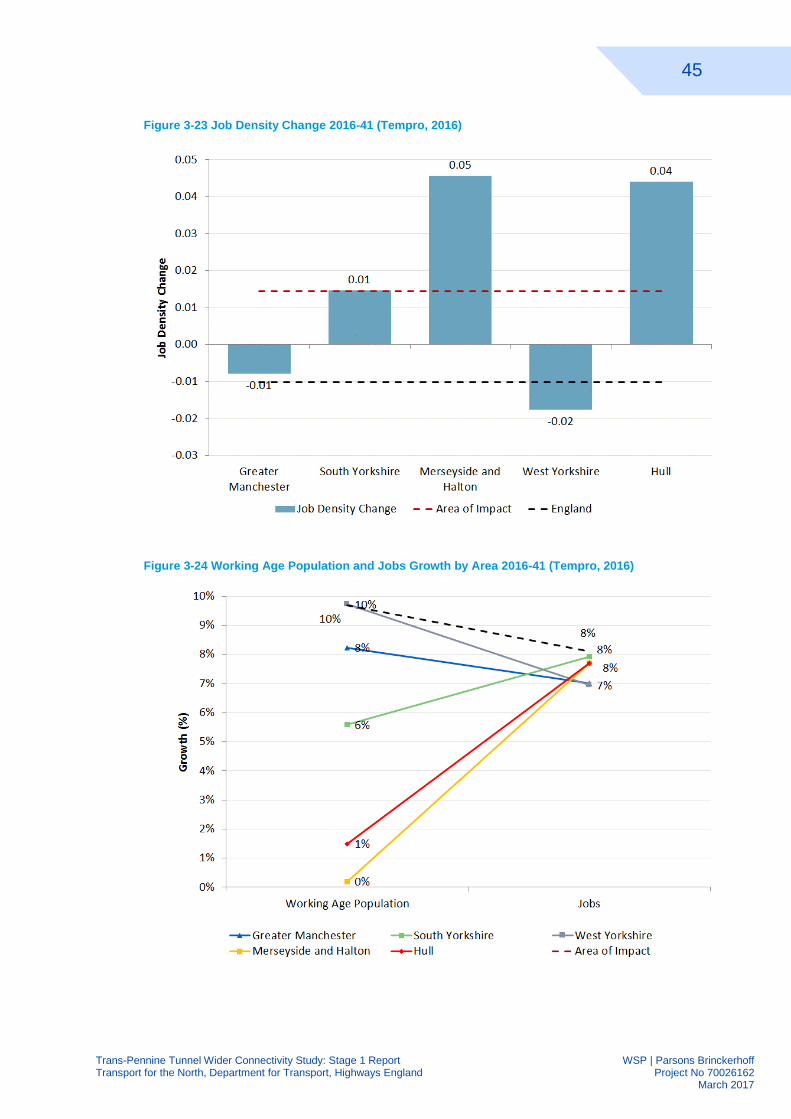
45
Trans-Pennine Tunnel Wider Connectivity Study: Stage 1 Report WSP | Parsons Brinckerhoff Transport for the North, Department for Transport, Highways England Project No 70026162 March 2017
Figure 3-23 Job Density Change 2016-41 (Tempro, 2016)
Figure 3-24 Working Age Population and Jobs Growth by Area 2016-41 (Tempro, 2016)
46
Trans-Pennine Tunnel Wider Connectivity Study: Stage 1 Report WSP | Parsons Brinckerhoff Transport for the North, Department for Transport, Highways England Project No 70026162 March 2017
3.4 LOCAL AND REGIONAL CONTEXT SUMMARY
Area of Intervention The Area of Intervention is expected to be the most affected by changes to 3.4.1travel times, traffic volumes, agglomeration effects and land use changes. Despite a similar working age population, the district of Manchester has over 35% more jobs than the district of Sheffield. A greater proportion of Sheffield residents must commute accentuating the need to improve connectivity of the district. Within Sheffield, population densities are greatest in the areas immediately west of the city centre, adjacent to the Pennines. Improved routes across the Pennines will improve the accessibility of these populations to the labour markets of Greater Manchester.
Commuting Patterns Despite the relative proximity of Greater Manchester – a distance of less 3.4.2than 40 miles – current trans-Pennine commuting rates are extremely low. 78% of Sheffield commuters travel to jobs within the city. Only 0.1% of commuters from Trafford, Stockport and Oldham travel to Sheffield every day. A significantly higher proportion of commuters travel from areas to the east of Sheffield into Sheffield, compared to areas to the west of Sheffield, reflecting the greater connectivity provided by the road and rail network to the east.
Capabilities and Enablers Key capability and enabling employment growth are predicted in 3.4.3Health and Life Sciences, Advanced Manufacturing, Creative and Digital and Financial and Professional Services. To assist with removing barriers to sustainable private sector led growth, Enterprise Zones have been established, most notably in the LEPs of Greater Manchester and Sheffield City Region.
Housing Growth Significant housing growth is allocated within the Greater Manchester Spatial 3.4.4Framework in Manchester, Trafford, Salford, Stockport, Tameside and Oldham. Sheffield is currently considering five possible housing options which will result in different spatial housing growth depending on which option is chosen.
Area of Impact The Area of Impact extends from coast to coast, as far as the A50 to the south 3.4.5and the A59 to the north. Analysis has shown that Hull, Greater Manchester, Merseyside and Halton and West and South Yorkshire have lower levels of activity than the entire Area of Impact and national averages and associated higher levels of unemployment benefits claimed. In line with the corresponding employment statistics, productivity in the Area of Impact is below the UK average. Generally, workers in the Area of Impact have lower pay and lower Gross Value Added per hour worked than the UK average. Growth of households and employment is expected to be increasingly concentrated in urban centres – especially within the largest cities – over the coming decades.
Connectivity and TPT Improvements The impact of poor connectivity across the Pennines is 3.4.6reflected by the low levels of commuting trips between Greater Manchester and Sheffield City Region. Improved connectivity is expected to increase the size of the labour market available in both these areas and lead to agglomeration impacts as travel between these areas is made easier and travel times are reduced. Whilst future predictions of employment and population growth do not presently reflect the impact of a significant improvement in connectivity that could be offered by the TPT, the growth of employment in Enterprise Zones, at key economic growth areas and in prime/enabling capabilities will seek to capitalise on the connectivity offered by an improved link.
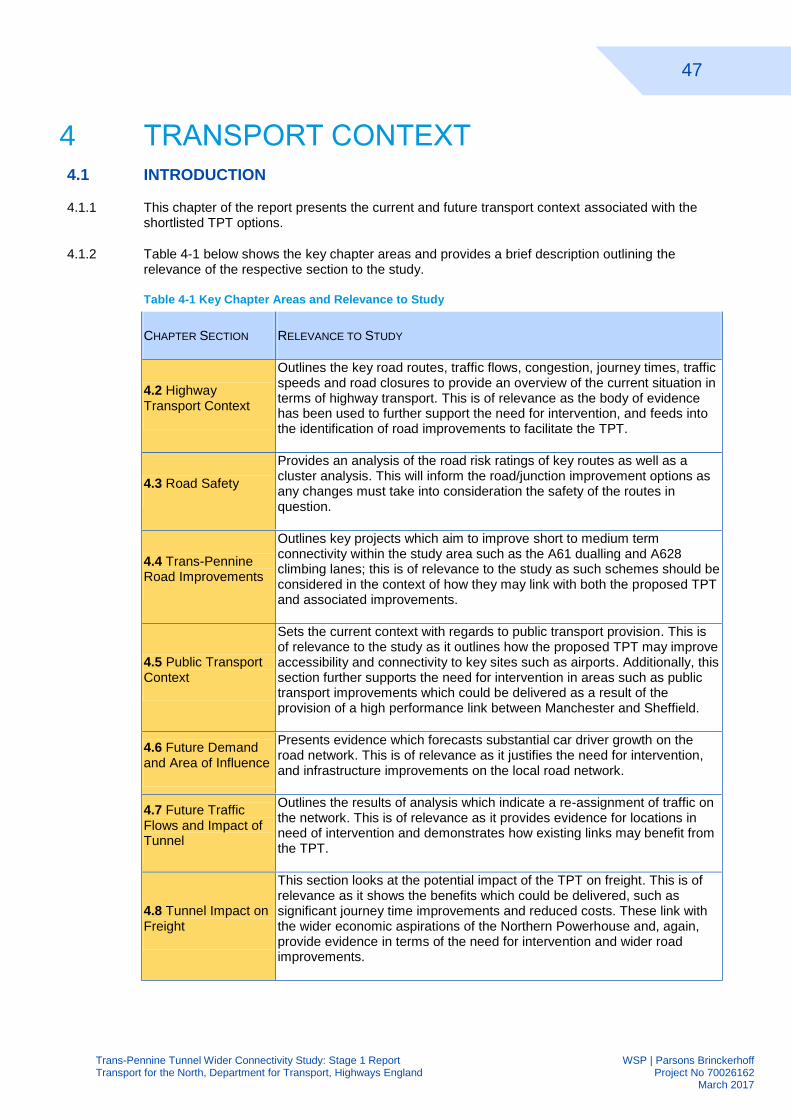
47
Trans-Pennine Tunnel Wider Connectivity Study: Stage 1 Report WSP | Parsons Brinckerhoff Transport for the North, Department for Transport, Highways England Project No 70026162 March 2017
TRANSPORT CONTEXT 4
4.1 INTRODUCTION
This chapter of the report presents the current and future transport context associated with the 4.1.1shortlisted TPT options.
Table 4-1 below shows the key chapter areas and provides a brief description outlining the 4.1.2relevance of the respective section to the study.
Table 4-1 Key Chapter Areas and Relevance to Study
CHAPTER SECTION RELEVANCE TO STUDY
4.2 Highway Transport Context
Outlines the key road routes, traffic flows, congestion, journey times, traffic speeds and road closures to provide an overview of the current situation in terms of highway transport. This is of relevance as the body of evidence has been used to further support the need for intervention, and feeds into the identification of road improvements to facilitate the TPT.
4.3 Road Safety
Provides an analysis of the road risk ratings of key routes as well as a cluster analysis. This will inform the road/junction improvement options as any changes must take into consideration the safety of the routes in question.
4.4 Trans-Pennine Road Improvements
Outlines key projects which aim to improve short to medium term connectivity within the study area such as the A61 dualling and A628 climbing lanes; this is of relevance to the study as such schemes should be considered in the context of how they may link with both the proposed TPT and associated improvements.
4.5 Public Transport Context
Sets the current context with regards to public transport provision. This is of relevance to the study as it outlines how the proposed TPT may improve accessibility and connectivity to key sites such as airports. Additionally, this section further supports the need for intervention in areas such as public transport improvements which could be delivered as a result of the provision of a high performance link between Manchester and Sheffield.
4.6 Future Demand and Area of Influence
Presents evidence which forecasts substantial car driver growth on the road network. This is of relevance as it justifies the need for intervention, and infrastructure improvements on the local road network.
4.7 Future Traffic Flows and Impact of Tunnel
Outlines the results of analysis which indicate a re-assignment of traffic on the network. This is of relevance as it provides evidence for locations in need of intervention and demonstrates how existing links may benefit from the TPT.
4.8 Tunnel Impact on Freight
This section looks at the potential impact of the TPT on freight. This is of relevance as it shows the benefits which could be delivered, such as significant journey time improvements and reduced costs. These link with the wider economic aspirations of the Northern Powerhouse and, again, provide evidence in terms of the need for intervention and wider road improvements.
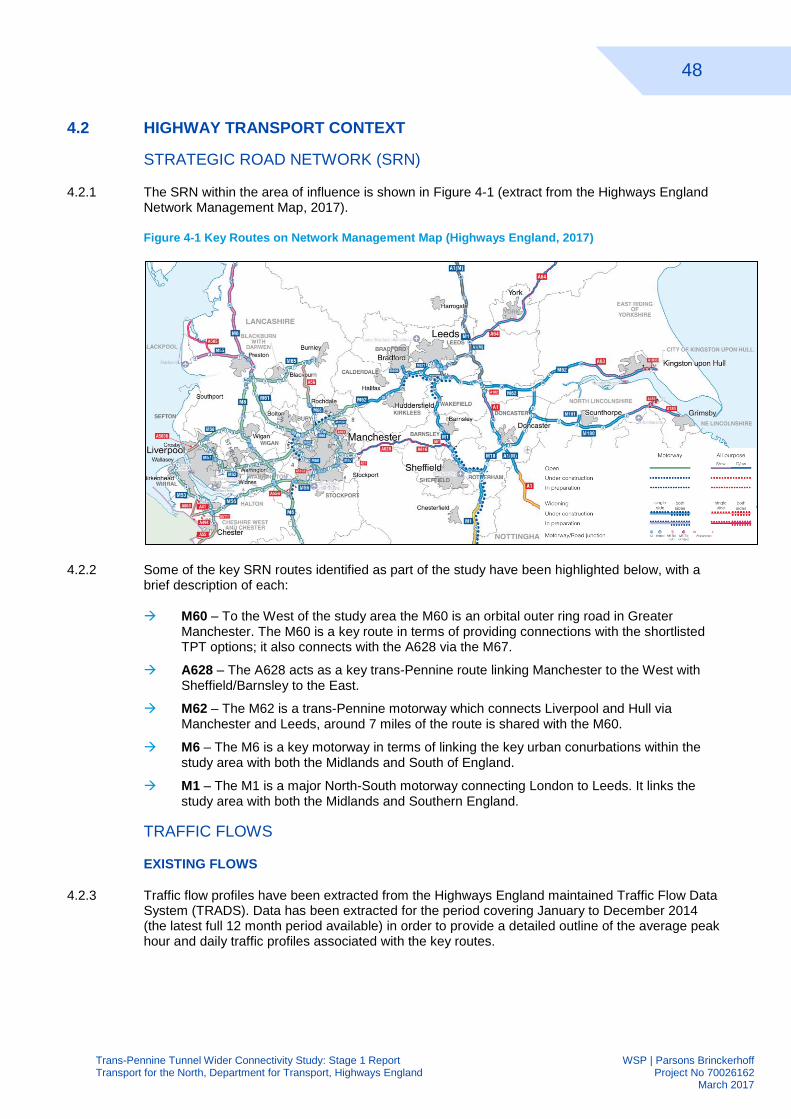
48
Trans-Pennine Tunnel Wider Connectivity Study: Stage 1 Report WSP | Parsons Brinckerhoff Transport for the North, Department for Transport, Highways England Project No 70026162 March 2017
4.2 HIGHWAY TRANSPORT CONTEXT
STRATEGIC ROAD NETWORK (SRN)
The SRN within the area of influence is shown in Figure 4-1 (extract from the Highways England 4.2.1Network Management Map, 2017).
Figure 4-1 Key Routes on Network Management Map (Highways England, 2017)
Some of the key SRN routes identified as part of the study have been highlighted below, with a 4.2.2brief description of each:
M60 – To the West of the study area the M60 is an orbital outer ring road in Greater Manchester. The M60 is a key route in terms of providing connections with the shortlisted TPT options; it also connects with the A628 via the M67.
A628 – The A628 acts as a key trans-Pennine route linking Manchester to the West with Sheffield/Barnsley to the East.
M62 – The M62 is a trans-Pennine motorway which connects Liverpool and Hull via Manchester and Leeds, around 7 miles of the route is shared with the M60.
M6 – The M6 is a key motorway in terms of linking the key urban conurbations within the study area with both the Midlands and South of England.
M1 – The M1 is a major North-South motorway connecting London to Leeds. It links the study area with both the Midlands and Southern England.
TRAFFIC FLOWS
EXISTING FLOWS
Traffic flow profiles have been extracted from the Highways England maintained Traffic Flow Data 4.2.3System (TRADS). Data has been extracted for the period covering January to December 2014 (the latest full 12 month period available) in order to provide a detailed outline of the average peak hour and daily traffic profiles associated with the key routes.
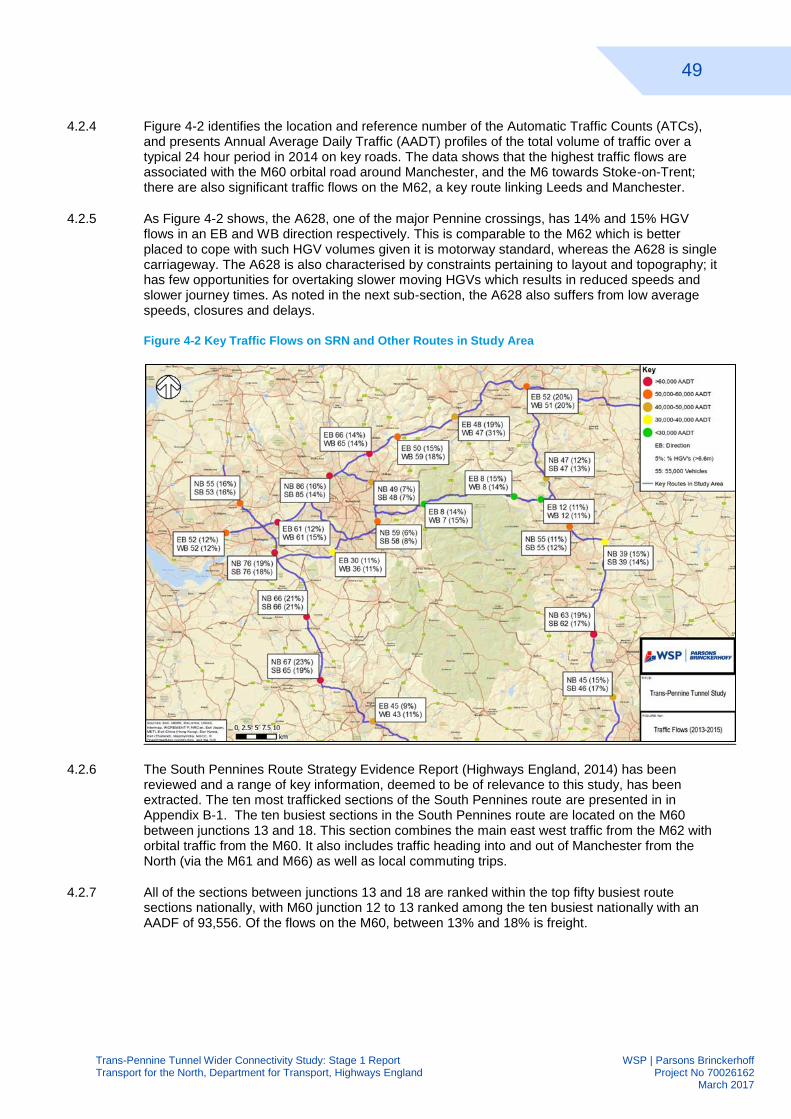
49
Trans-Pennine Tunnel Wider Connectivity Study: Stage 1 Report WSP | Parsons Brinckerhoff Transport for the North, Department for Transport, Highways England Project No 70026162 March 2017
Figure 4-2 identifies the location and reference number of the Automatic Traffic Counts (ATCs), 4.2.4and presents Annual Average Daily Traffic (AADT) profiles of the total volume of traffic over a typical 24 hour period in 2014 on key roads. The data shows that the highest traffic flows are associated with the M60 orbital road around Manchester, and the M6 towards Stoke-on-Trent; there are also significant traffic flows on the M62, a key route linking Leeds and Manchester.
As Figure 4-2 shows, the A628, one of the major Pennine crossings, has 14% and 15% HGV 4.2.5flows in an EB and WB direction respectively. This is comparable to the M62 which is better placed to cope with such HGV volumes given it is motorway standard, whereas the A628 is single carriageway. The A628 is also characterised by constraints pertaining to layout and topography; it has few opportunities for overtaking slower moving HGVs which results in reduced speeds and slower journey times. As noted in the next sub-section, the A628 also suffers from low average speeds, closures and delays.
Figure 4-2 Key Traffic Flows on SRN and Other Routes in Study Area
The South Pennines Route Strategy Evidence Report (Highways England, 2014) has been 4.2.6reviewed and a range of key information, deemed to be of relevance to this study, has been extracted. The ten most trafficked sections of the South Pennines route are presented in in Appendix B-1. The ten busiest sections in the South Pennines route are located on the M60 between junctions 13 and 18. This section combines the main east west traffic from the M62 with orbital traffic from the M60. It also includes traffic heading into and out of Manchester from the North (via the M61 and M66) as well as local commuting trips.
All of the sections between junctions 13 and 18 are ranked within the top fifty busiest route 4.2.7sections nationally, with M60 junction 12 to 13 ranked among the ten busiest nationally with an AADF of 93,556. Of the flows on the M60, between 13% and 18% is freight.
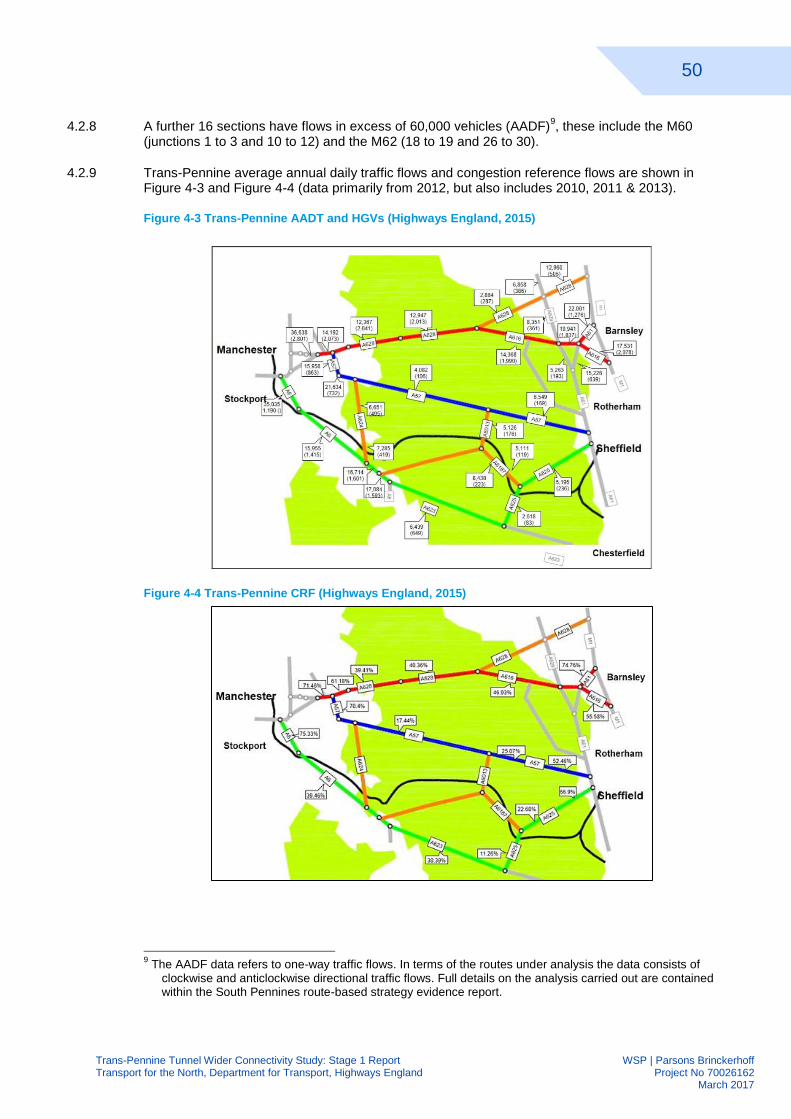
50
Trans-Pennine Tunnel Wider Connectivity Study: Stage 1 Report WSP | Parsons Brinckerhoff Transport for the North, Department for Transport, Highways England Project No 70026162 March 2017
A further 16 sections have flows in excess of 60,000 vehicles (AADF)9, these include the M60 4.2.8
(junctions 1 to 3 and 10 to 12) and the M62 (18 to 19 and 26 to 30).
Trans-Pennine average annual daily traffic flows and congestion reference flows are shown in 4.2.9Figure 4-3 and Figure 4-4 (data primarily from 2012, but also includes 2010, 2011 & 2013).
Figure 4-3 Trans-Pennine AADT and HGVs (Highways England, 2015)
Figure 4-4 Trans-Pennine CRF (Highways England, 2015)
9 The AADF data refers to one-way traffic flows. In terms of the routes under analysis the data consists of
clockwise and anticlockwise directional traffic flows. Full details on the analysis carried out are contained within the South Pennines route-based strategy evidence report.
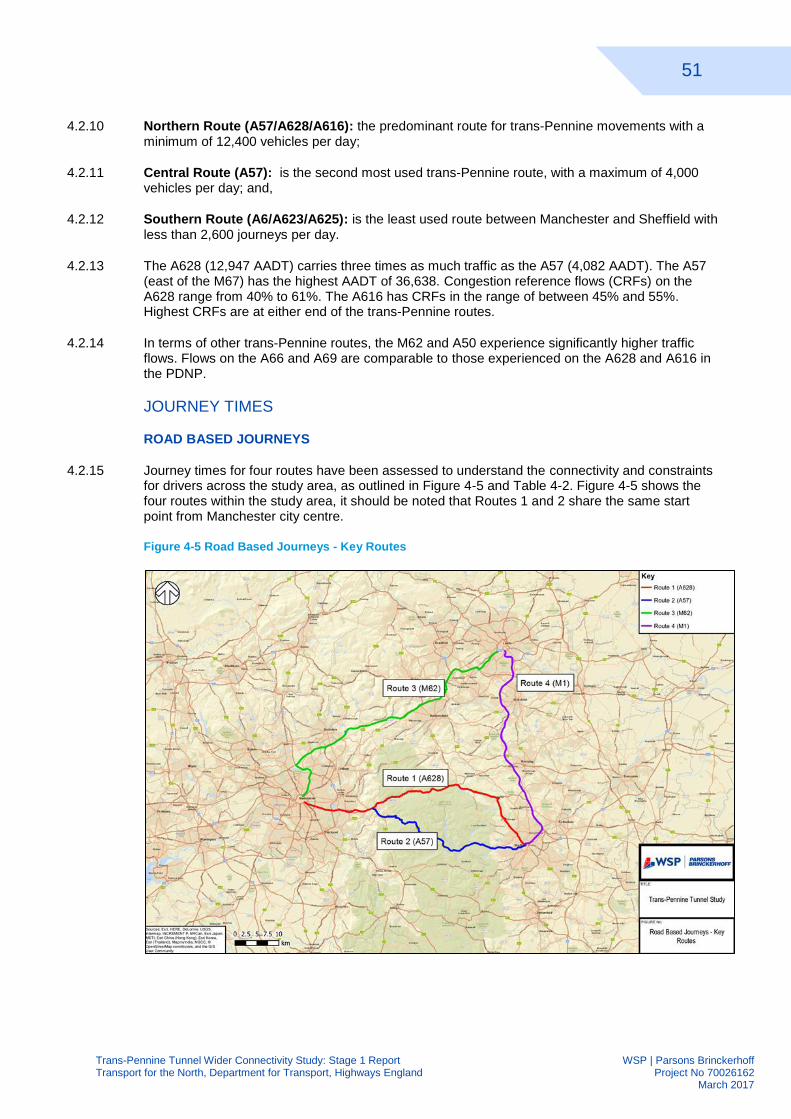
51
Trans-Pennine Tunnel Wider Connectivity Study: Stage 1 Report WSP | Parsons Brinckerhoff Transport for the North, Department for Transport, Highways England Project No 70026162 March 2017
Northern Route (A57/A628/A616): the predominant route for trans-Pennine movements with a 4.2.10minimum of 12,400 vehicles per day;
Central Route (A57): is the second most used trans-Pennine route, with a maximum of 4,000 4.2.11vehicles per day; and,
Southern Route (A6/A623/A625): is the least used route between Manchester and Sheffield with 4.2.12less than 2,600 journeys per day.
The A628 (12,947 AADT) carries three times as much traffic as the A57 (4,082 AADT). The A57 4.2.13(east of the M67) has the highest AADT of 36,638. Congestion reference flows (CRFs) on the A628 range from 40% to 61%. The A616 has CRFs in the range of between 45% and 55%. Highest CRFs are at either end of the trans-Pennine routes.
In terms of other trans-Pennine routes, the M62 and A50 experience significantly higher traffic 4.2.14flows. Flows on the A66 and A69 are comparable to those experienced on the A628 and A616 in the PDNP.
JOURNEY TIMES
ROAD BASED JOURNEYS
Journey times for four routes have been assessed to understand the connectivity and constraints 4.2.15for drivers across the study area, as outlined in Figure 4-5 and Table 4-2. Figure 4-5 shows the four routes within the study area, it should be noted that Routes 1 and 2 share the same start point from Manchester city centre.
Figure 4-5 Road Based Journeys - Key Routes
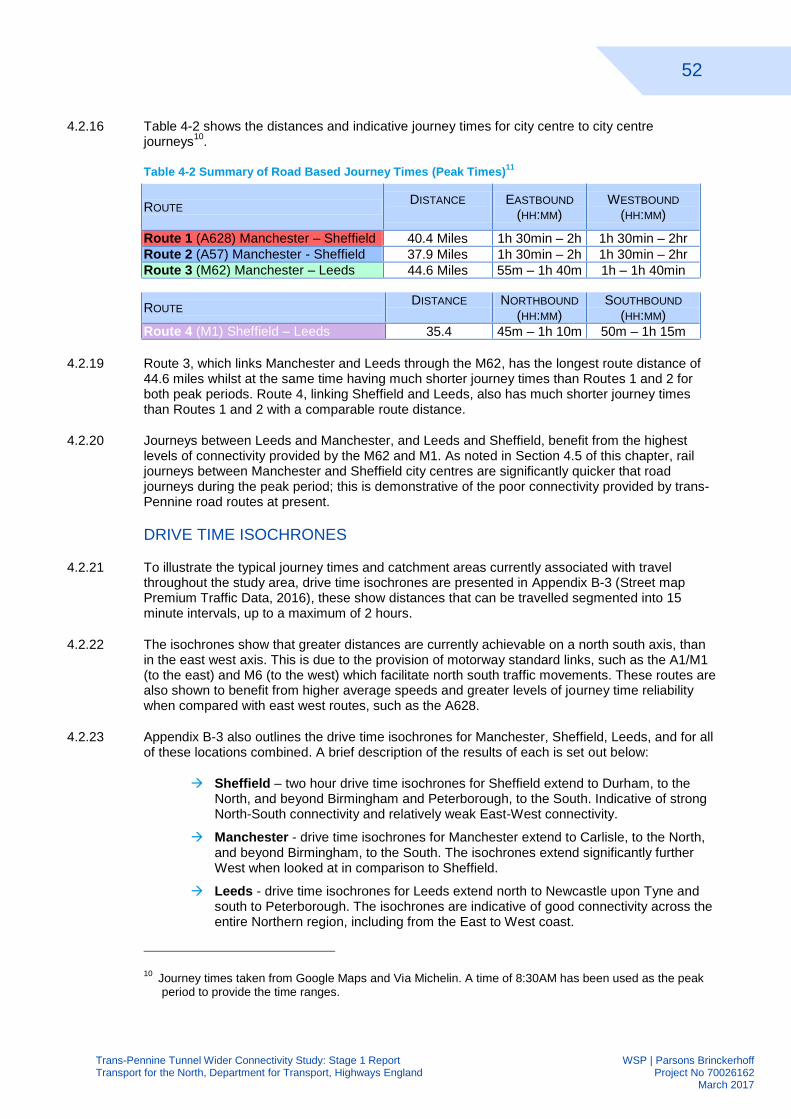
52
Trans-Pennine Tunnel Wider Connectivity Study: Stage 1 Report WSP | Parsons Brinckerhoff Transport for the North, Department for Transport, Highways England Project No 70026162 March 2017
Table 4-2 shows the distances and indicative journey times for city centre to city centre 4.2.16journeys
10.
Table 4-2 Summary of Road Based Journey Times (Peak Times)11
ROUTE DISTANCE
EASTBOUND
(HH:MM) WESTBOUND
(HH:MM)
Route 1 (A628) Manchester – Sheffield 40.4 Miles 1h 30min – 2h 1h 30min – 2hr
Route 2 (A57) Manchester - Sheffield 37.9 Miles 1h 30min – 2h 1h 30min – 2hr
Route 3 (M62) Manchester – Leeds 44.6 Miles 55m – 1h 40m 1h – 1h 40min
Route 3, which links Manchester and Leeds through the M62, has the longest route distance of 4.2.1944.6 miles whilst at the same time having much shorter journey times than Routes 1 and 2 for both peak periods. Route 4, linking Sheffield and Leeds, also has much shorter journey times than Routes 1 and 2 with a comparable route distance.
Journeys between Leeds and Manchester, and Leeds and Sheffield, benefit from the highest 4.2.20levels of connectivity provided by the M62 and M1. As noted in Section 4.5 of this chapter, rail journeys between Manchester and Sheffield city centres are significantly quicker that road journeys during the peak period; this is demonstrative of the poor connectivity provided by trans-Pennine road routes at present.
DRIVE TIME ISOCHRONES
To illustrate the typical journey times and catchment areas currently associated with travel 4.2.21throughout the study area, drive time isochrones are presented in Appendix B-3 (Street map Premium Traffic Data, 2016), these show distances that can be travelled segmented into 15 minute intervals, up to a maximum of 2 hours.
The isochrones show that greater distances are currently achievable on a north south axis, than 4.2.22in the east west axis. This is due to the provision of motorway standard links, such as the A1/M1 (to the east) and M6 (to the west) which facilitate north south traffic movements. These routes are also shown to benefit from higher average speeds and greater levels of journey time reliability when compared with east west routes, such as the A628.
Appendix B-3 also outlines the drive time isochrones for Manchester, Sheffield, Leeds, and for all 4.2.23of these locations combined. A brief description of the results of each is set out below:
Sheffield – two hour drive time isochrones for Sheffield extend to Durham, to the North, and beyond Birmingham and Peterborough, to the South. Indicative of strong North-South connectivity and relatively weak East-West connectivity.
Manchester - drive time isochrones for Manchester extend to Carlisle, to the North, and beyond Birmingham, to the South. The isochrones extend significantly further West when looked at in comparison to Sheffield.
Leeds - drive time isochrones for Leeds extend north to Newcastle upon Tyne and south to Peterborough. The isochrones are indicative of good connectivity across the entire Northern region, including from the East to West coast.
10
Journey times taken from Google Maps and Via Michelin. A time of 8:30AM has been used as the peak period to provide the time ranges.
ROUTE DISTANCE
NORTHBOUND
(HH:MM) SOUTHBOUND
(HH:MM)
Route 4 (M1) Sheffield – Leeds 35.4 45m – 1h 10m 50m – 1h 15m
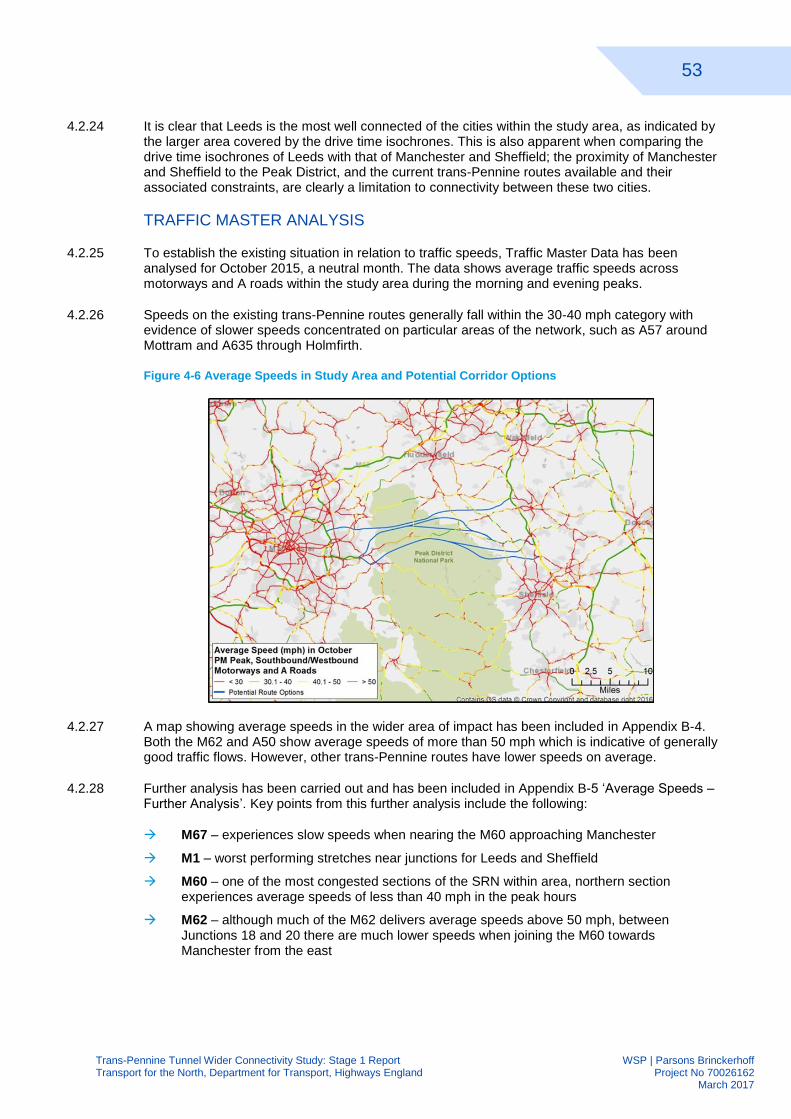
53
Trans-Pennine Tunnel Wider Connectivity Study: Stage 1 Report WSP | Parsons Brinckerhoff Transport for the North, Department for Transport, Highways England Project No 70026162 March 2017
It is clear that Leeds is the most well connected of the cities within the study area, as indicated by 4.2.24the larger area covered by the drive time isochrones. This is also apparent when comparing the drive time isochrones of Leeds with that of Manchester and Sheffield; the proximity of Manchester and Sheffield to the Peak District, and the current trans-Pennine routes available and their associated constraints, are clearly a limitation to connectivity between these two cities.
TRAFFIC MASTER ANALYSIS
To establish the existing situation in relation to traffic speeds, Traffic Master Data has been 4.2.25analysed for October 2015, a neutral month. The data shows average traffic speeds across motorways and A roads within the study area during the morning and evening peaks.
Speeds on the existing trans-Pennine routes generally fall within the 30-40 mph category with 4.2.26evidence of slower speeds concentrated on particular areas of the network, such as A57 around Mottram and A635 through Holmfirth.
Figure 4-6 Average Speeds in Study Area and Potential Corridor Options
A map showing average speeds in the wider area of impact has been included in Appendix B-4. 4.2.27Both the M62 and A50 show average speeds of more than 50 mph which is indicative of generally good traffic flows. However, other trans-Pennine routes have lower speeds on average.
Further analysis has been carried out and has been included in Appendix B-5 ‘Average Speeds – 4.2.28Further Analysis’. Key points from this further analysis include the following:
M67 – experiences slow speeds when nearing the M60 approaching Manchester
M1 – worst performing stretches near junctions for Leeds and Sheffield
M60 – one of the most congested sections of the SRN within area, northern section experiences average speeds of less than 40 mph in the peak hours
M62 – although much of the M62 delivers average speeds above 50 mph, between Junctions 18 and 20 there are much lower speeds when joining the M60 towards Manchester from the east
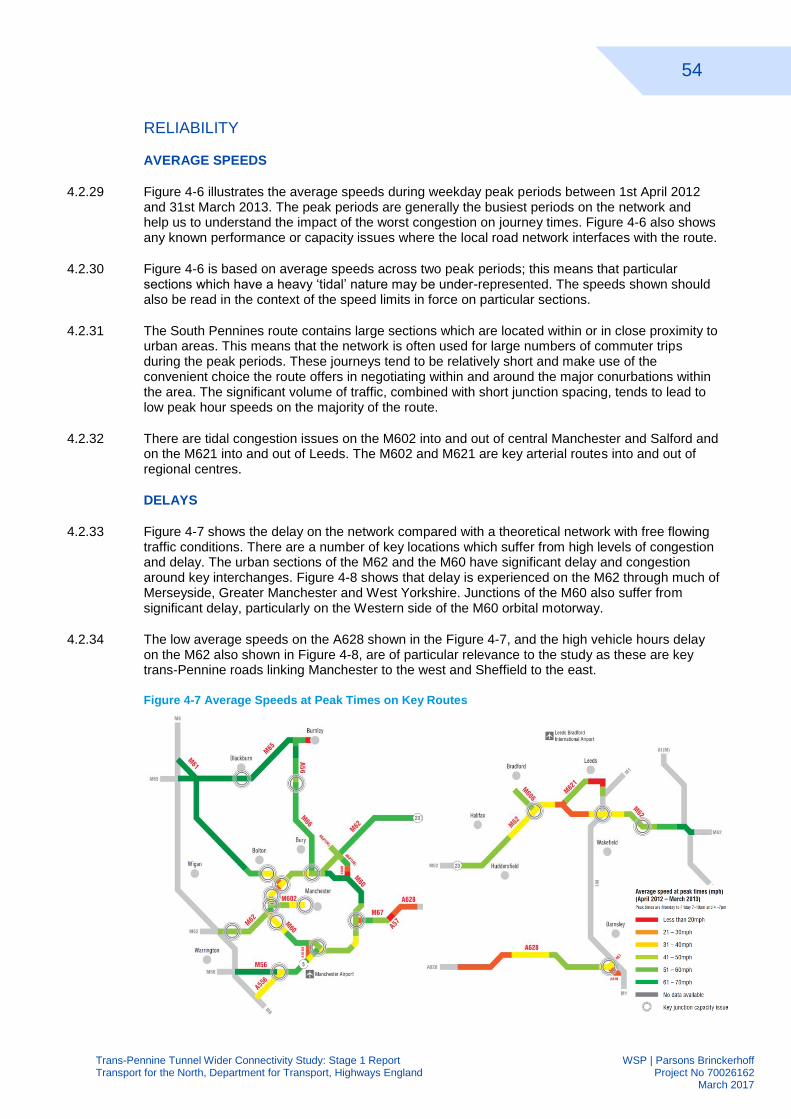
54
Trans-Pennine Tunnel Wider Connectivity Study: Stage 1 Report WSP | Parsons Brinckerhoff Transport for the North, Department for Transport, Highways England Project No 70026162 March 2017
RELIABILITY
AVERAGE SPEEDS
Figure 4-6 illustrates the average speeds during weekday peak periods between 1st April 2012 4.2.29and 31st March 2013. The peak periods are generally the busiest periods on the network and help us to understand the impact of the worst congestion on journey times. Figure 4-6 also shows any known performance or capacity issues where the local road network interfaces with the route.
Figure 4-6 is based on average speeds across two peak periods; this means that particular 4.2.30sections which have a heavy ‘tidal’ nature may be under-represented. The speeds shown should also be read in the context of the speed limits in force on particular sections.
The South Pennines route contains large sections which are located within or in close proximity to 4.2.31urban areas. This means that the network is often used for large numbers of commuter trips during the peak periods. These journeys tend to be relatively short and make use of the convenient choice the route offers in negotiating within and around the major conurbations within the area. The significant volume of traffic, combined with short junction spacing, tends to lead to low peak hour speeds on the majority of the route.
There are tidal congestion issues on the M602 into and out of central Manchester and Salford and 4.2.32on the M621 into and out of Leeds. The M602 and M621 are key arterial routes into and out of regional centres.
DELAYS
Figure 4-7 shows the delay on the network compared with a theoretical network with free flowing 4.2.33traffic conditions. There are a number of key locations which suffer from high levels of congestion and delay. The urban sections of the M62 and the M60 have significant delay and congestion around key interchanges. Figure 4-8 shows that delay is experienced on the M62 through much of Merseyside, Greater Manchester and West Yorkshire. Junctions of the M60 also suffer from significant delay, particularly on the Western side of the M60 orbital motorway.
The low average speeds on the A628 shown in the Figure 4-7, and the high vehicle hours delay 4.2.34on the M62 also shown in Figure 4-8, are of particular relevance to the study as these are key trans-Pennine roads linking Manchester to the west and Sheffield to the east.
Figure 4-7 Average Speeds at Peak Times on Key Routes
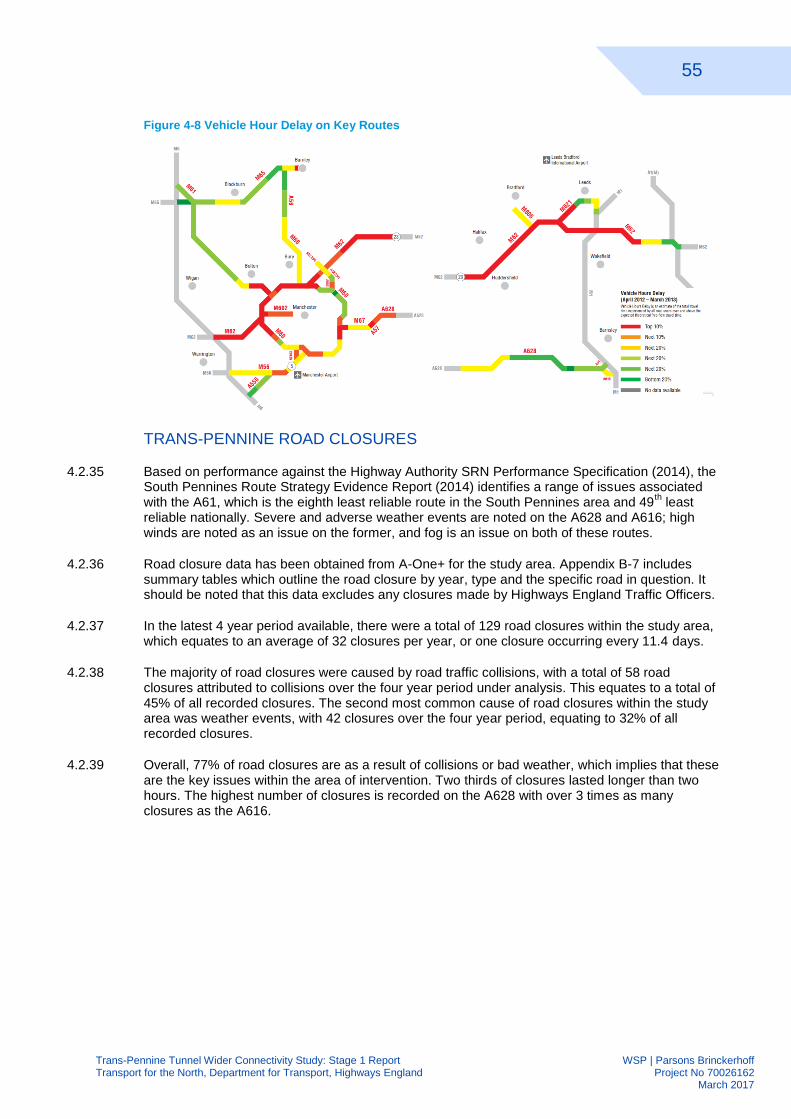
55
Trans-Pennine Tunnel Wider Connectivity Study: Stage 1 Report WSP | Parsons Brinckerhoff Transport for the North, Department for Transport, Highways England Project No 70026162 March 2017
Figure 4-8 Vehicle Hour Delay on Key Routes
TRANS-PENNINE ROAD CLOSURES
Based on performance against the Highway Authority SRN Performance Specification (2014), the 4.2.35South Pennines Route Strategy Evidence Report (2014) identifies a range of issues associated with the A61, which is the eighth least reliable route in the South Pennines area and 49
th least
reliable nationally. Severe and adverse weather events are noted on the A628 and A616; high winds are noted as an issue on the former, and fog is an issue on both of these routes.
Road closure data has been obtained from A-One+ for the study area. Appendix B-7 includes 4.2.36summary tables which outline the road closure by year, type and the specific road in question. It should be noted that this data excludes any closures made by Highways England Traffic Officers.
In the latest 4 year period available, there were a total of 129 road closures within the study area, 4.2.37which equates to an average of 32 closures per year, or one closure occurring every 11.4 days.
The majority of road closures were caused by road traffic collisions, with a total of 58 road 4.2.38closures attributed to collisions over the four year period under analysis. This equates to a total of 45% of all recorded closures. The second most common cause of road closures within the study area was weather events, with 42 closures over the four year period, equating to 32% of all recorded closures.
Overall, 77% of road closures are as a result of collisions or bad weather, which implies that these 4.2.39are the key issues within the area of intervention. Two thirds of closures lasted longer than two hours. The highest number of closures is recorded on the A628 with over 3 times as many closures as the A616.
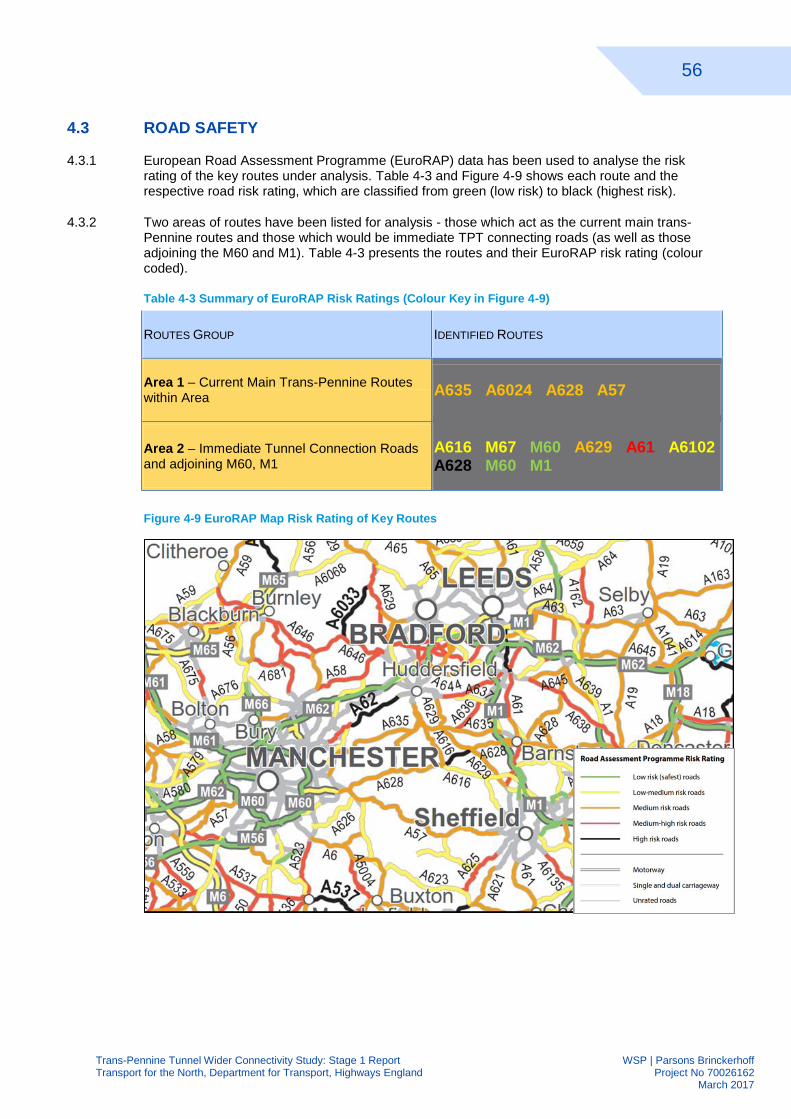
56
Trans-Pennine Tunnel Wider Connectivity Study: Stage 1 Report WSP | Parsons Brinckerhoff Transport for the North, Department for Transport, Highways England Project No 70026162 March 2017
4.3 ROAD SAFETY
European Road Assessment Programme (EuroRAP) data has been used to analyse the risk 4.3.1rating of the key routes under analysis. Table 4-3 and Figure 4-9 shows each route and the respective road risk rating, which are classified from green (low risk) to black (highest risk).
Two areas of routes have been listed for analysis - those which act as the current main trans-4.3.2Pennine routes and those which would be immediate TPT connecting roads (as well as those adjoining the M60 and M1). Table 4-3 presents the routes and their EuroRAP risk rating (colour coded).
Table 4-3 Summary of EuroRAP Risk Ratings (Colour Key in Figure 4-9)
ROUTES GROUP IDENTIFIED ROUTES
Area 1 – Current Main Trans-Pennine Routes within Area
A635 A6024 A628 A57
Area 2 – Immediate Tunnel Connection Roads and adjoining M60, M1
A616 M67 M60 A629 A61 A6102 A628 M60 M1
Figure 4-9 EuroRAP Map Risk Rating of Key Routes
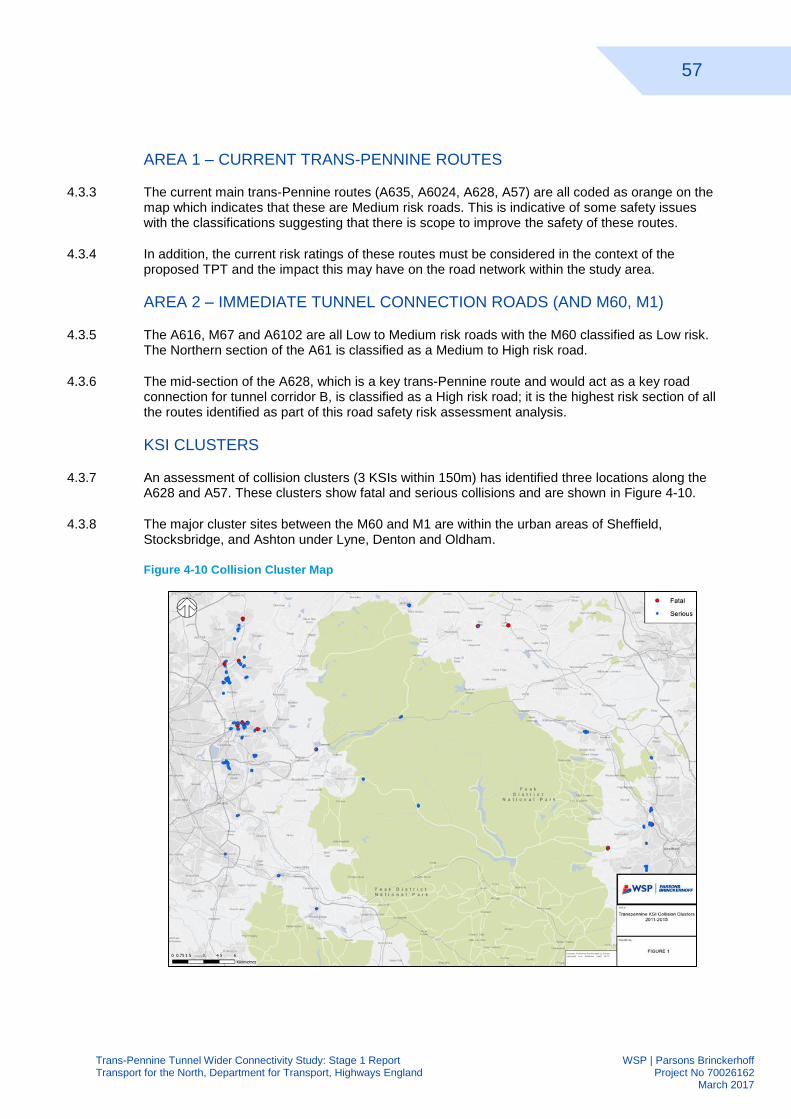
57
Trans-Pennine Tunnel Wider Connectivity Study: Stage 1 Report WSP | Parsons Brinckerhoff Transport for the North, Department for Transport, Highways England Project No 70026162 March 2017
AREA 1 – CURRENT TRANS-PENNINE ROUTES
The current main trans-Pennine routes (A635, A6024, A628, A57) are all coded as orange on the 4.3.3map which indicates that these are Medium risk roads. This is indicative of some safety issues with the classifications suggesting that there is scope to improve the safety of these routes.
In addition, the current risk ratings of these routes must be considered in the context of the 4.3.4proposed TPT and the impact this may have on the road network within the study area.
AREA 2 – IMMEDIATE TUNNEL CONNECTION ROADS (AND M60, M1)
The A616, M67 and A6102 are all Low to Medium risk roads with the M60 classified as Low risk. 4.3.5The Northern section of the A61 is classified as a Medium to High risk road.
The mid-section of the A628, which is a key trans-Pennine route and would act as a key road 4.3.6connection for tunnel corridor B, is classified as a High risk road; it is the highest risk section of all the routes identified as part of this road safety risk assessment analysis.
KSI CLUSTERS
An assessment of collision clusters (3 KSIs within 150m) has identified three locations along the 4.3.7A628 and A57. These clusters show fatal and serious collisions and are shown in Figure 4-10.
The major cluster sites between the M60 and M1 are within the urban areas of Sheffield, 4.3.8Stocksbridge, and Ashton under Lyne, Denton and Oldham.
Figure 4-10 Collision Cluster Map
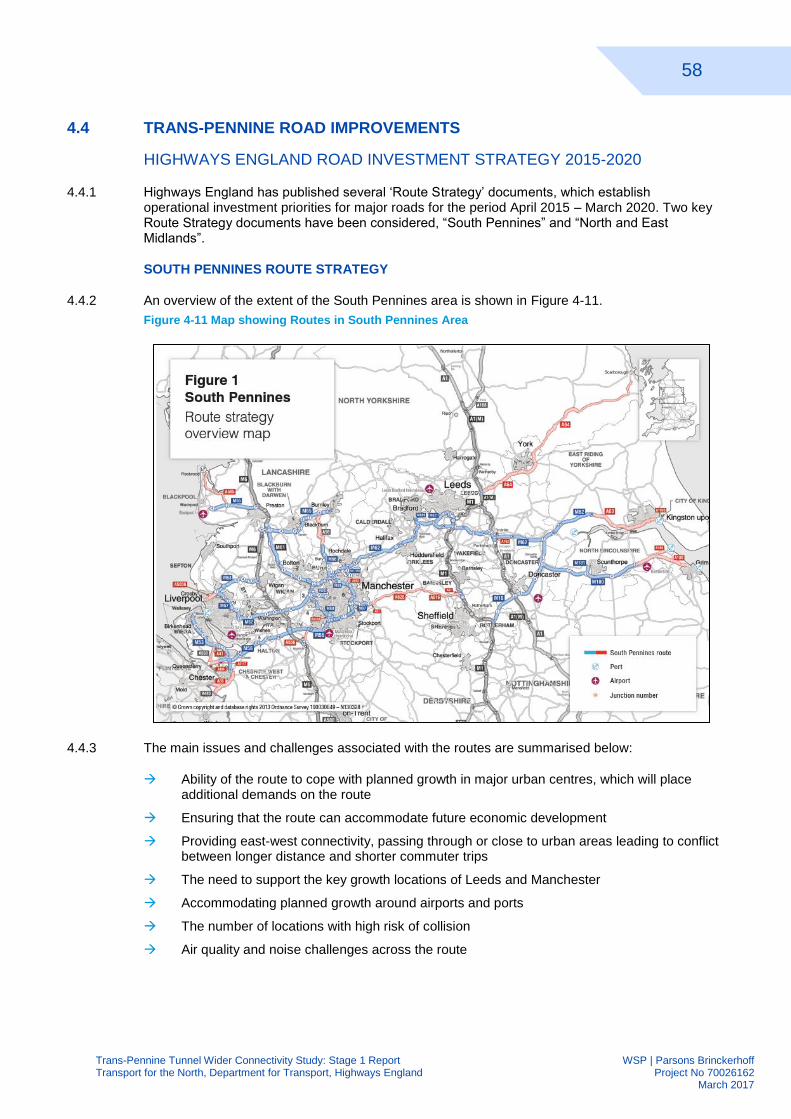
58
Trans-Pennine Tunnel Wider Connectivity Study: Stage 1 Report WSP | Parsons Brinckerhoff Transport for the North, Department for Transport, Highways England Project No 70026162 March 2017
4.4 TRANS-PENNINE ROAD IMPROVEMENTS
HIGHWAYS ENGLAND ROAD INVESTMENT STRATEGY 2015-2020
Highways England has published several ‘Route Strategy’ documents, which establish 4.4.1operational investment priorities for major roads for the period April 2015 – March 2020. Two key Route Strategy documents have been considered, “South Pennines” and “North and East Midlands”.
SOUTH PENNINES ROUTE STRATEGY
An overview of the extent of the South Pennines area is shown in Figure 4-11. 4.4.2
Figure 4-11 Map showing Routes in South Pennines Area
The main issues and challenges associated with the routes are summarised below: 4.4.3
Ability of the route to cope with planned growth in major urban centres, which will place additional demands on the route
Ensuring that the route can accommodate future economic development
Providing east-west connectivity, passing through or close to urban areas leading to conflict between longer distance and shorter commuter trips
The need to support the key growth locations of Leeds and Manchester
Accommodating planned growth around airports and ports
The number of locations with high risk of collision
Air quality and noise challenges across the route
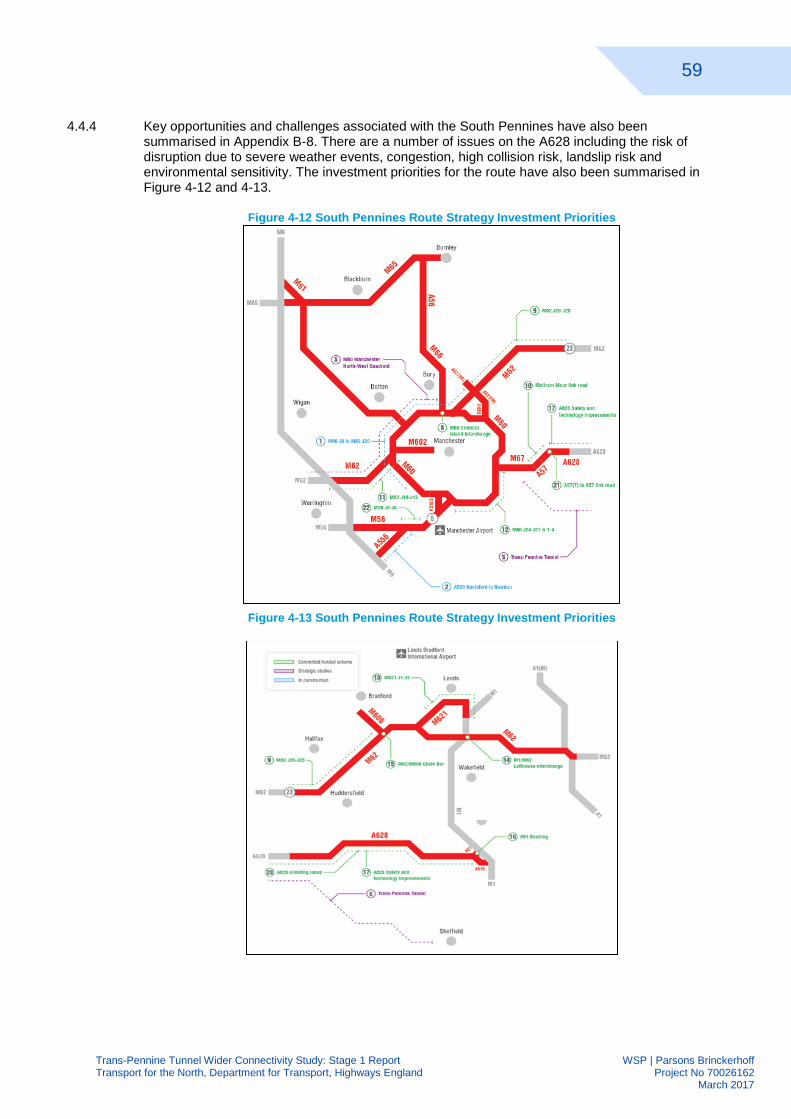
59
Trans-Pennine Tunnel Wider Connectivity Study: Stage 1 Report WSP | Parsons Brinckerhoff Transport for the North, Department for Transport, Highways England Project No 70026162 March 2017
Key opportunities and challenges associated with the South Pennines have also been 4.4.4summarised in Appendix B-8. There are a number of issues on the A628 including the risk of disruption due to severe weather events, congestion, high collision risk, landslip risk and environmental sensitivity. The investment priorities for the route have also been summarised in Figure 4-12 and 4-13.
Figure 4-12 South Pennines Route Strategy Investment Priorities
Figure 4-13 South Pennines Route Strategy Investment Priorities
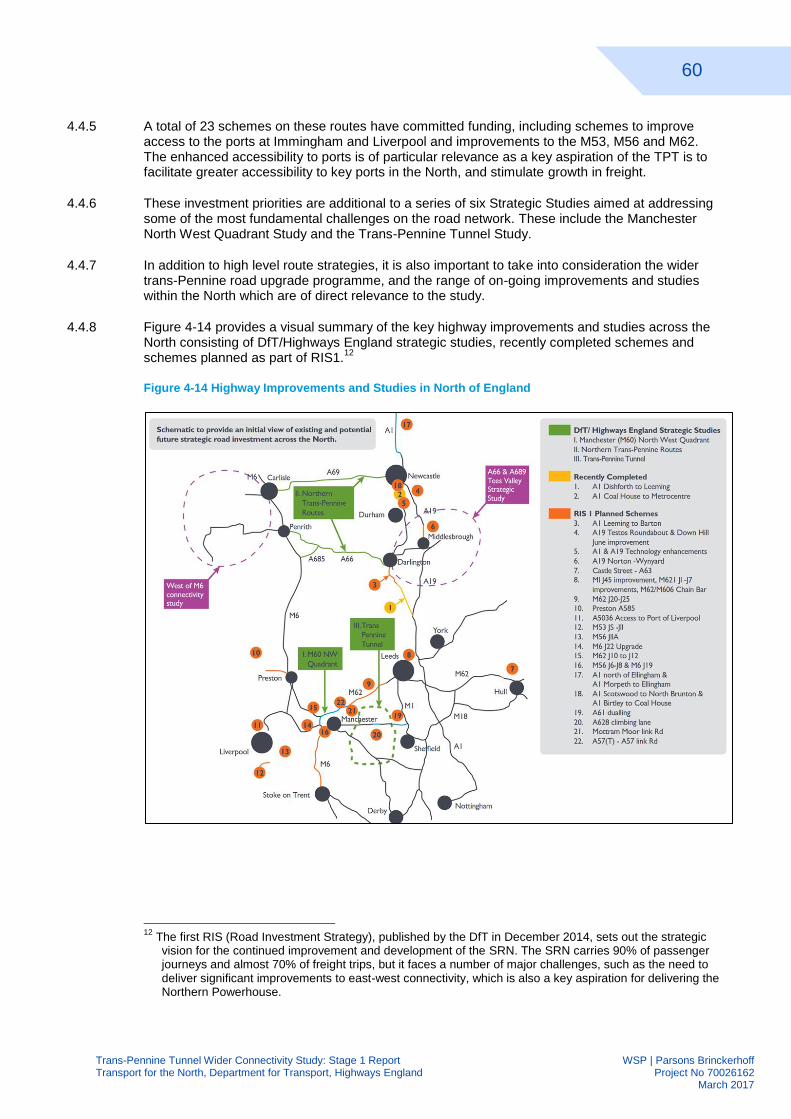
60
Trans-Pennine Tunnel Wider Connectivity Study: Stage 1 Report WSP | Parsons Brinckerhoff Transport for the North, Department for Transport, Highways England Project No 70026162 March 2017
A total of 23 schemes on these routes have committed funding, including schemes to improve 4.4.5access to the ports at Immingham and Liverpool and improvements to the M53, M56 and M62. The enhanced accessibility to ports is of particular relevance as a key aspiration of the TPT is to facilitate greater accessibility to key ports in the North, and stimulate growth in freight.
These investment priorities are additional to a series of six Strategic Studies aimed at addressing 4.4.6some of the most fundamental challenges on the road network. These include the Manchester North West Quadrant Study and the Trans-Pennine Tunnel Study.
In addition to high level route strategies, it is also important to take into consideration the wider 4.4.7trans-Pennine road upgrade programme, and the range of on-going improvements and studies within the North which are of direct relevance to the study.
Figure 4-14 provides a visual summary of the key highway improvements and studies across the 4.4.8North consisting of DfT/Highways England strategic studies, recently completed schemes and schemes planned as part of RIS1.
12
Figure 4-14 Highway Improvements and Studies in North of England
12
The first RIS (Road Investment Strategy), published by the DfT in December 2014, sets out the strategic vision for the continued improvement and development of the SRN. The SRN carries 90% of passenger journeys and almost 70% of freight trips, but it faces a number of major challenges, such as the need to deliver significant improvements to east-west connectivity, which is also a key aspiration for delivering the Northern Powerhouse.
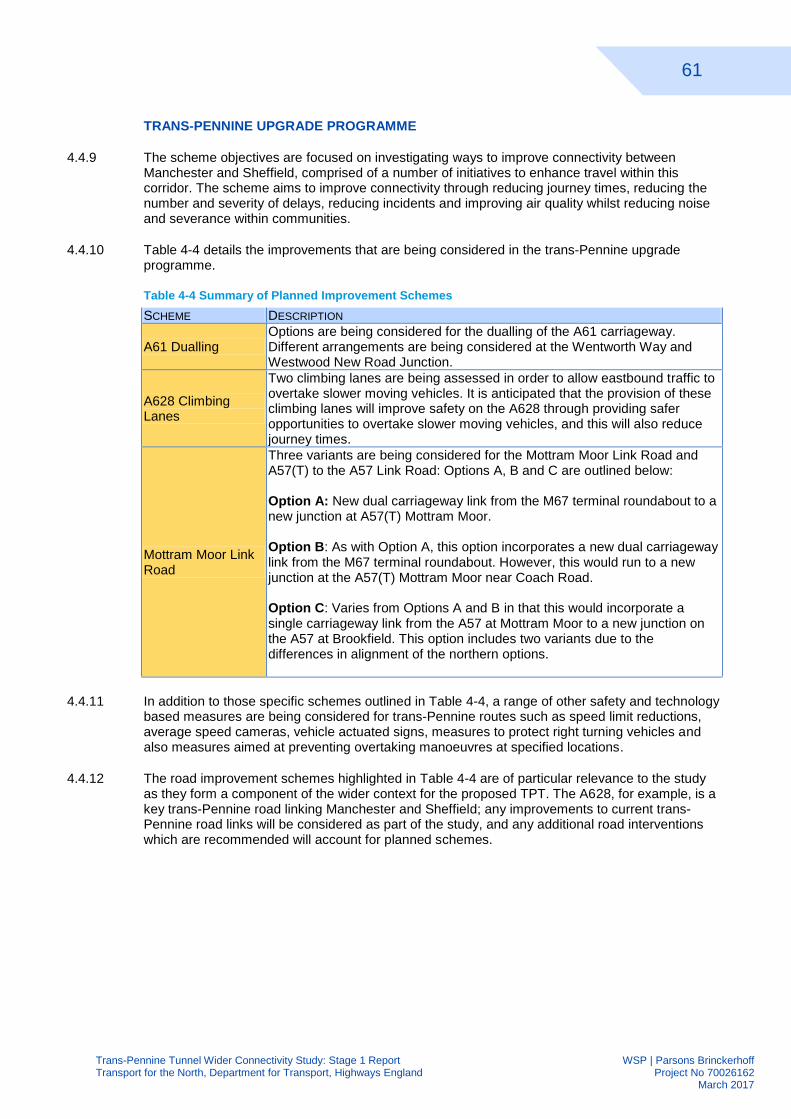
61
Trans-Pennine Tunnel Wider Connectivity Study: Stage 1 Report WSP | Parsons Brinckerhoff Transport for the North, Department for Transport, Highways England Project No 70026162 March 2017
TRANS-PENNINE UPGRADE PROGRAMME
The scheme objectives are focused on investigating ways to improve connectivity between 4.4.9Manchester and Sheffield, comprised of a number of initiatives to enhance travel within this corridor. The scheme aims to improve connectivity through reducing journey times, reducing the number and severity of delays, reducing incidents and improving air quality whilst reducing noise and severance within communities.
Table 4-4 details the improvements that are being considered in the trans-Pennine upgrade 4.4.10programme.
Table 4-4 Summary of Planned Improvement Schemes
SCHEME DESCRIPTION
A61 Dualling Options are being considered for the dualling of the A61 carriageway. Different arrangements are being considered at the Wentworth Way and Westwood New Road Junction.
A628 Climbing Lanes
Two climbing lanes are being assessed in order to allow eastbound traffic to overtake slower moving vehicles. It is anticipated that the provision of these climbing lanes will improve safety on the A628 through providing safer opportunities to overtake slower moving vehicles, and this will also reduce journey times.
Mottram Moor Link Road
Three variants are being considered for the Mottram Moor Link Road and A57(T) to the A57 Link Road: Options A, B and C are outlined below: Option A: New dual carriageway link from the M67 terminal roundabout to a new junction at A57(T) Mottram Moor. Option B: As with Option A, this option incorporates a new dual carriageway link from the M67 terminal roundabout. However, this would run to a new junction at the A57(T) Mottram Moor near Coach Road. Option C: Varies from Options A and B in that this would incorporate a single carriageway link from the A57 at Mottram Moor to a new junction on the A57 at Brookfield. This option includes two variants due to the differences in alignment of the northern options.
In addition to those specific schemes outlined in Table 4-4, a range of other safety and technology 4.4.11based measures are being considered for trans-Pennine routes such as speed limit reductions, average speed cameras, vehicle actuated signs, measures to protect right turning vehicles and also measures aimed at preventing overtaking manoeuvres at specified locations.
The road improvement schemes highlighted in Table 4-4 are of particular relevance to the study 4.4.12as they form a component of the wider context for the proposed TPT. The A628, for example, is a key trans-Pennine road linking Manchester and Sheffield; any improvements to current trans-Pennine road links will be considered as part of the study, and any additional road interventions which are recommended will account for planned schemes.
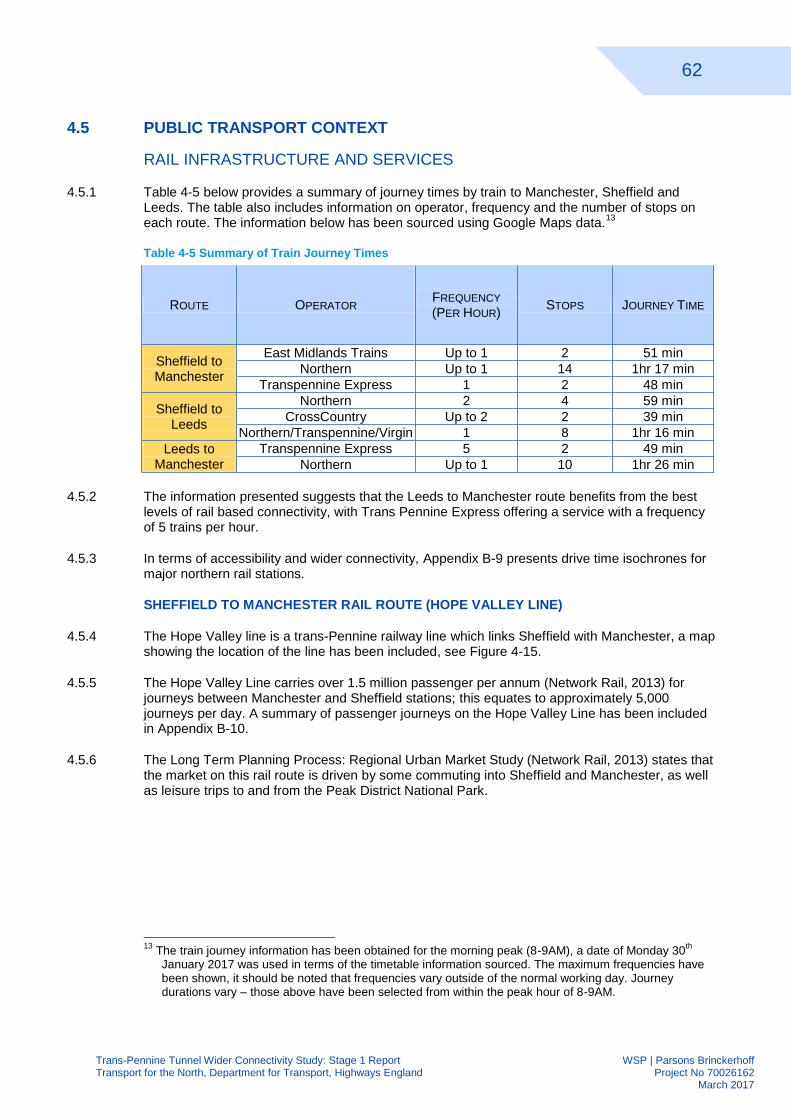
62
Trans-Pennine Tunnel Wider Connectivity Study: Stage 1 Report WSP | Parsons Brinckerhoff Transport for the North, Department for Transport, Highways England Project No 70026162 March 2017
4.5 PUBLIC TRANSPORT CONTEXT
RAIL INFRASTRUCTURE AND SERVICES
Table 4-5 below provides a summary of journey times by train to Manchester, Sheffield and 4.5.1Leeds. The table also includes information on operator, frequency and the number of stops on each route. The information below has been sourced using Google Maps data.
13
Table 4-5 Summary of Train Journey Times
ROUTE OPERATOR FREQUENCY
(PER HOUR) STOPS JOURNEY TIME
Sheffield to Manchester
East Midlands Trains Up to 1 2 51 min
Northern Up to 1 14 1hr 17 min
Transpennine Express 1 2 48 min
Sheffield to Leeds
Northern 2 4 59 min
CrossCountry Up to 2 2 39 min
Northern/Transpennine/Virgin 1 8 1hr 16 min
Leeds to Manchester
Transpennine Express 5 2 49 min
Northern Up to 1 10 1hr 26 min
The information presented suggests that the Leeds to Manchester route benefits from the best 4.5.2levels of rail based connectivity, with Trans Pennine Express offering a service with a frequency of 5 trains per hour.
In terms of accessibility and wider connectivity, Appendix B-9 presents drive time isochrones for 4.5.3major northern rail stations.
SHEFFIELD TO MANCHESTER RAIL ROUTE (HOPE VALLEY LINE)
The Hope Valley line is a trans-Pennine railway line which links Sheffield with Manchester, a map 4.5.4showing the location of the line has been included, see Figure 4-15.
The Hope Valley Line carries over 1.5 million passenger per annum (Network Rail, 2013) for 4.5.5journeys between Manchester and Sheffield stations; this equates to approximately 5,000 journeys per day. A summary of passenger journeys on the Hope Valley Line has been included in Appendix B-10.
The Long Term Planning Process: Regional Urban Market Study (Network Rail, 2013) states that 4.5.6the market on this rail route is driven by some commuting into Sheffield and Manchester, as well as leisure trips to and from the Peak District National Park.
13
The train journey information has been obtained for the morning peak (8-9AM), a date of Monday 30th
January 2017 was used in terms of the timetable information sourced. The maximum frequencies have been shown, it should be noted that frequencies vary outside of the normal working day. Journey durations vary – those above have been selected from within the peak hour of 8-9AM.
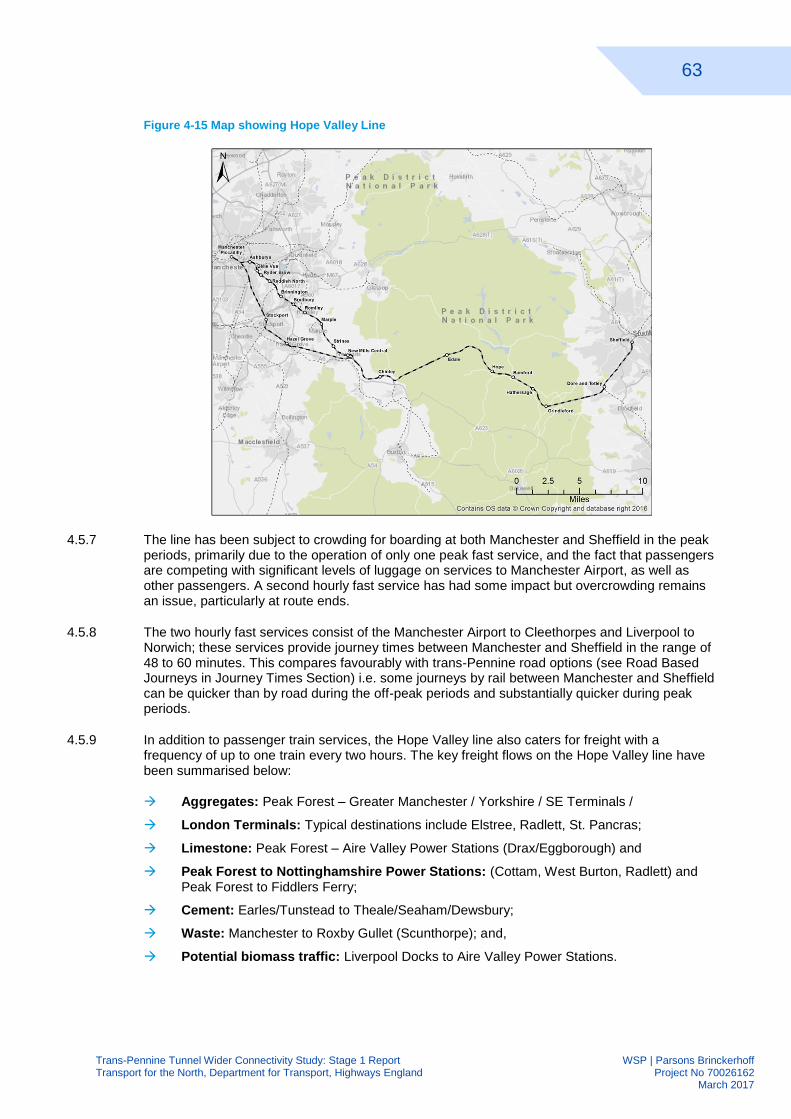
63
Trans-Pennine Tunnel Wider Connectivity Study: Stage 1 Report WSP | Parsons Brinckerhoff Transport for the North, Department for Transport, Highways England Project No 70026162 March 2017
Figure 4-15 Map showing Hope Valley Line
The line has been subject to crowding for boarding at both Manchester and Sheffield in the peak 4.5.7periods, primarily due to the operation of only one peak fast service, and the fact that passengers are competing with significant levels of luggage on services to Manchester Airport, as well as other passengers. A second hourly fast service has had some impact but overcrowding remains an issue, particularly at route ends.
The two hourly fast services consist of the Manchester Airport to Cleethorpes and Liverpool to 4.5.8Norwich; these services provide journey times between Manchester and Sheffield in the range of 48 to 60 minutes. This compares favourably with trans-Pennine road options (see Road Based Journeys in Journey Times Section) i.e. some journeys by rail between Manchester and Sheffield can be quicker than by road during the off-peak periods and substantially quicker during peak periods.
In addition to passenger train services, the Hope Valley line also caters for freight with a 4.5.9frequency of up to one train every two hours. The key freight flows on the Hope Valley line have been summarised below:
Aggregates: Peak Forest – Greater Manchester / Yorkshire / SE Terminals /
London Terminals: Typical destinations include Elstree, Radlett, St. Pancras;
Limestone: Peak Forest – Aire Valley Power Stations (Drax/Eggborough) and
Peak Forest to Nottinghamshire Power Stations: (Cottam, West Burton, Radlett) and Peak Forest to Fiddlers Ferry;
Cement: Earles/Tunstead to Theale/Seaham/Dewsbury;
Waste: Manchester to Roxby Gullet (Scunthorpe); and,
Potential biomass traffic: Liverpool Docks to Aire Valley Power Stations.
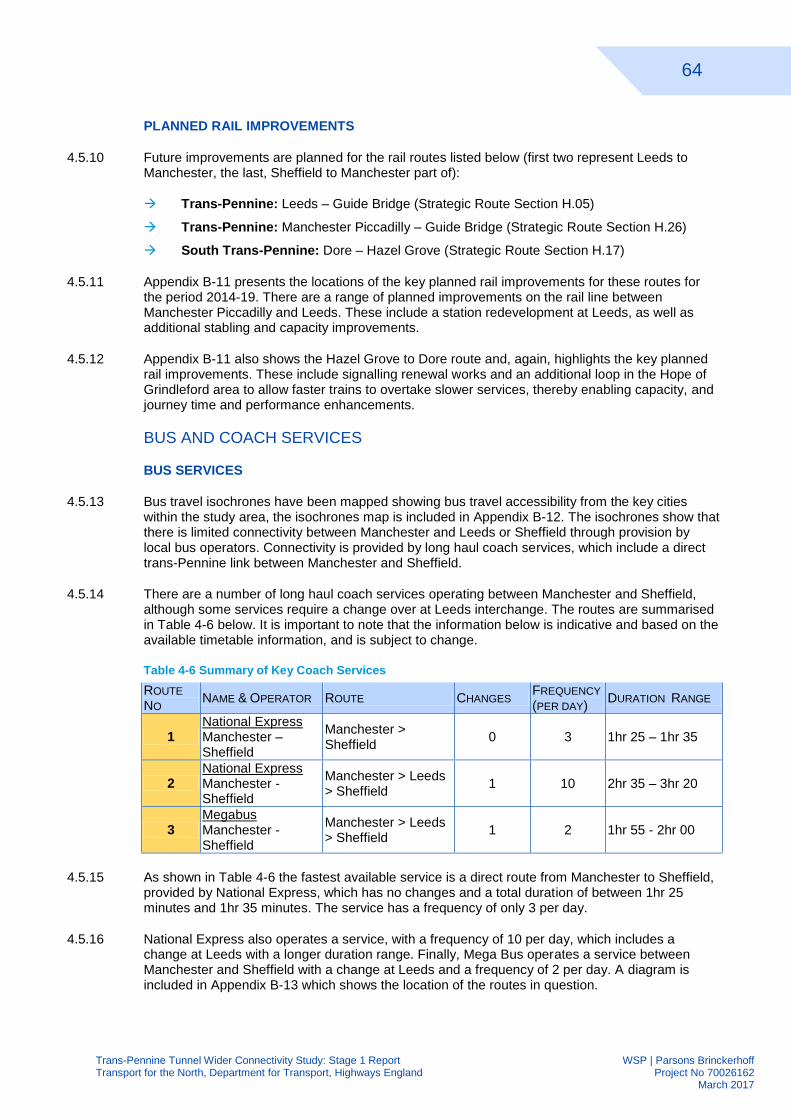
64
Trans-Pennine Tunnel Wider Connectivity Study: Stage 1 Report WSP | Parsons Brinckerhoff Transport for the North, Department for Transport, Highways England Project No 70026162 March 2017
PLANNED RAIL IMPROVEMENTS
Future improvements are planned for the rail routes listed below (first two represent Leeds to 4.5.10Manchester, the last, Sheffield to Manchester part of):
Trans-Pennine: Leeds – Guide Bridge (Strategic Route Section H.05)
Trans-Pennine: Manchester Piccadilly – Guide Bridge (Strategic Route Section H.26)
South Trans-Pennine: Dore – Hazel Grove (Strategic Route Section H.17)
Appendix B-11 presents the locations of the key planned rail improvements for these routes for 4.5.11the period 2014-19. There are a range of planned improvements on the rail line between Manchester Piccadilly and Leeds. These include a station redevelopment at Leeds, as well as additional stabling and capacity improvements.
Appendix B-11 also shows the Hazel Grove to Dore route and, again, highlights the key planned 4.5.12rail improvements. These include signalling renewal works and an additional loop in the Hope of Grindleford area to allow faster trains to overtake slower services, thereby enabling capacity, and journey time and performance enhancements.
BUS AND COACH SERVICES
BUS SERVICES
Bus travel isochrones have been mapped showing bus travel accessibility from the key cities 4.5.13within the study area, the isochrones map is included in Appendix B-12. The isochrones show that there is limited connectivity between Manchester and Leeds or Sheffield through provision by local bus operators. Connectivity is provided by long haul coach services, which include a direct trans-Pennine link between Manchester and Sheffield.
There are a number of long haul coach services operating between Manchester and Sheffield, 4.5.14although some services require a change over at Leeds interchange. The routes are summarised in Table 4-6 below. It is important to note that the information below is indicative and based on the available timetable information, and is subject to change.
Table 4-6 Summary of Key Coach Services
ROUTE
NO NAME & OPERATOR ROUTE CHANGES
FREQUENCY
(PER DAY) DURATION RANGE
1 National Express Manchester – Sheffield
Manchester > Sheffield
0 3 1hr 25 – 1hr 35
2 National Express Manchester - Sheffield
Manchester > Leeds > Sheffield
1 10 2hr 35 – 3hr 20
3 Megabus Manchester - Sheffield
Manchester > Leeds > Sheffield
1 2 1hr 55 - 2hr 00
As shown in Table 4-6 the fastest available service is a direct route from Manchester to Sheffield, 4.5.15provided by National Express, which has no changes and a total duration of between 1hr 25 minutes and 1hr 35 minutes. The service has a frequency of only 3 per day.
National Express also operates a service, with a frequency of 10 per day, which includes a 4.5.16change at Leeds with a longer duration range. Finally, Mega Bus operates a service between Manchester and Sheffield with a change at Leeds and a frequency of 2 per day. A diagram is included in Appendix B-13 which shows the location of the routes in question.
65
Trans-Pennine Tunnel Wider Connectivity Study: Stage 1 Report WSP | Parsons Brinckerhoff Transport for the North, Department for Transport, Highways England Project No 70026162 March 2017
4.6 AIRPORT CONNECTIVITY
MANCHESTER AIRPORT
Manchester Airport is the North’s main airport and third largest in the UK in terms of passenger 4.6.1numbers (CAA, 2016), serving over 200 international destinations. The airport has ambitious growth aspirations and will benefit from £1bn investment over the next 10 years (Manchester Airport, 2016).
The airport has its own dedicated railway station and is a major transport hub with over 300 train, 4.6.2100 coach and 500 bus movements per day (UK AirRail Report, 2015). MetroLink
14 runs every
12 minutes at all times except outside the hours of 9-5:30 on Sundays and public holidays, when they run at a 15 minute frequency.
ROBIN HOOD AIRPORT DONCASTER SHEFFIELD
Doncaster train station is located approximately 11.2km (7 miles) away from the airport on the 4.6.3East Coast Line. A dedicated bus service runs between the station and the airport approximately every half hour from early until late and has a journey time of around 25 minutes.
In 2014, members of the Sheffield Chamber of Commerce’s Transport Forum proposed a new 4.6.4railway station to be built at Robin Hood Airport, which would link to Doncaster central railway station as well as Sheffield station.
LEEDS BRADFORD INTERNATIONAL AIRPORT
Horsforth (4km East of the airport) and Guiseley (5km West) are the closest railway stations to 4.6.5Leeds Bradford International Airport. The ‘Flying Tiger’ bus services provide a link to the airport from the major rail hubs of Leeds and Bradford train stations and Harrogate bus station.
The Leeds Bradford International Airport Connectivity Study (2014) shortlisted a rail link between 4.6.6Leeds, Bradford and the airport to be taken forward for further appraisal.
Leeds City Council has given backing to release Greenbelt land near the airport to be used for 4.6.7expanding the passenger terminal building and developing an airport village. Plans include a new road link, public transport improvements and longer term aspirations for a dedicated rail connection.
LIVERPOOL JOHN LENNON AIRPORT
Liverpool South Parkway, opened in 2006, is the closest rail station to Liverpool John Lennon and 4.6.8is located approximately 4.8km from the airport. Frequent bus services operate between Liverpool South Parkway and the airport. Bus services also operate from Liverpool One bus station which connects the city centre to the airport.
The railway station is served by both the Northern Line and City Line by Mersey Rail train 4.6.9services. The City Line provides two trains per hour to Manchester and one train per hour to Birmingham. The Northern Line provides services operating up to a 15 minute frequency via Liverpool city centre to Southport. Liverpool Lime Street is located approximately 7 miles from Liverpool John Lennon Airport, and connects Liverpool to the UK’s main rail network; it provides a greater number of mainline/national rail services than Liverpool South Parkway.
14
The Metro Link is a light rail system in Greater Manchester. The system is owned by Transport for Greater Manchester (TFGM) and operated and maintained under contract by the RATP Group. The network consists of 7 lines which radiate from Manchester city centre.
66
Trans-Pennine Tunnel Wider Connectivity Study: Stage 1 Report WSP | Parsons Brinckerhoff Transport for the North, Department for Transport, Highways England Project No 70026162 March 2017
4.7 FREIGHT
OVERVIEW
Evidence indicates that 70% of UK road freight, in HGVs, moves less than 100km. This includes, 4.7.1for example, deliveries from distribution centres to High Streets, the movement of construction materials, and collection and disposal of waste. All of these examples are predominantly short distance freight movements.
The dominant role of road freight is to carry food and drink products and manufactured goods for 4.7.2retailers; this results in a concentration of traffic serving large population and retail centres. However, the supply chains for these goods may be long and complex, involving a series of distribution centres, and possibly originating overseas.
The TfN Northern Freight and Logistics Report found that 80% of road freight tonnage in the 4.7.3North is domestic traffic, most of which is short haul. The report also found that long distance road freight is focussed on north – south corridors, particularly to link the North to the major ports of Southampton, London, and Felixstowe, as well as to suppliers and customers in the South East and Scotland.
The North is an important source of freight movements, particularly to and from its ports on the 4.7.4Humber, Tees, Tyne, and Mersey, from its manufacturing centres, and to and from power stations. The TfN study reports that, although only home to 24% of the UK population, the North handles 56% of rail freight tonnage, 35% of road freight tonnage and 35% of ports tonnage; this is demonstrative of the North’s national importance as a freight hub.
The Ports of Hull, Immingham to the east and Liverpool and Salford to the west are located on the 4.7.5axis of the proposed new TPT corridors and would likely benefit from improved connectivity with a high capacity route across the south Pennines.
FREIGHT ASSETS IN THE NORTH
The TfN study identified the key freight assets in the North including: 4.7.6
Three Strategic Rail Freight Interchanges (SRFIs) - distribution centres with intermodal terminals) at Ditton, Wakefield and Selby with more emerging
Five further Intermodal Terminals at locations including Trafford Park / Barton Dock Road
Four key port areas on major estuaries (Humber, Tees, Mersey, Tyne) with generally good rail connections, and several rail connected sub-regional ports that can play a complementary role and reduce pressure on the major centre
A Strategic Road Network focused on the M62/M60/M56 and A66/69 East-West corridors and the M6 and M1/A1 North-South corridors
A strategic rail network principally comprising of the West Coast Main Line, East Coast Main Line and Midland Main Lines that connect the North of England to the South
A network of inland waterways (including the Manchester Ship Canal)
A significant amount of Distribution Centre capacity
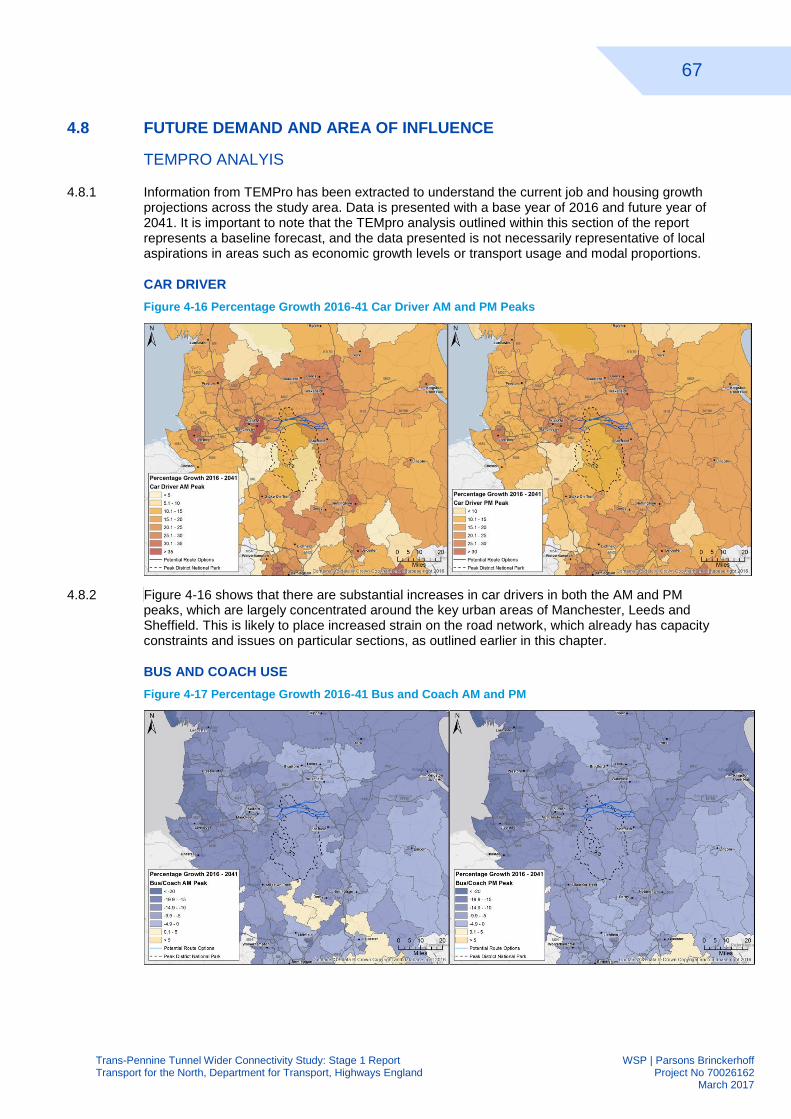
67
Trans-Pennine Tunnel Wider Connectivity Study: Stage 1 Report WSP | Parsons Brinckerhoff Transport for the North, Department for Transport, Highways England Project No 70026162 March 2017
4.8 FUTURE DEMAND AND AREA OF INFLUENCE
TEMPRO ANALYIS
Information from TEMPro has been extracted to understand the current job and housing growth 4.8.1projections across the study area. Data is presented with a base year of 2016 and future year of 2041. It is important to note that the TEMpro analysis outlined within this section of the report represents a baseline forecast, and the data presented is not necessarily representative of local aspirations in areas such as economic growth levels or transport usage and modal proportions.
CAR DRIVER
Figure 4-16 Percentage Growth 2016-41 Car Driver AM and PM Peaks
Figure 4-16 shows that there are substantial increases in car drivers in both the AM and PM 4.8.2peaks, which are largely concentrated around the key urban areas of Manchester, Leeds and Sheffield. This is likely to place increased strain on the road network, which already has capacity constraints and issues on particular sections, as outlined earlier in this chapter.
BUS AND COACH USE
Figure 4-17 Percentage Growth 2016-41 Bus and Coach AM and PM
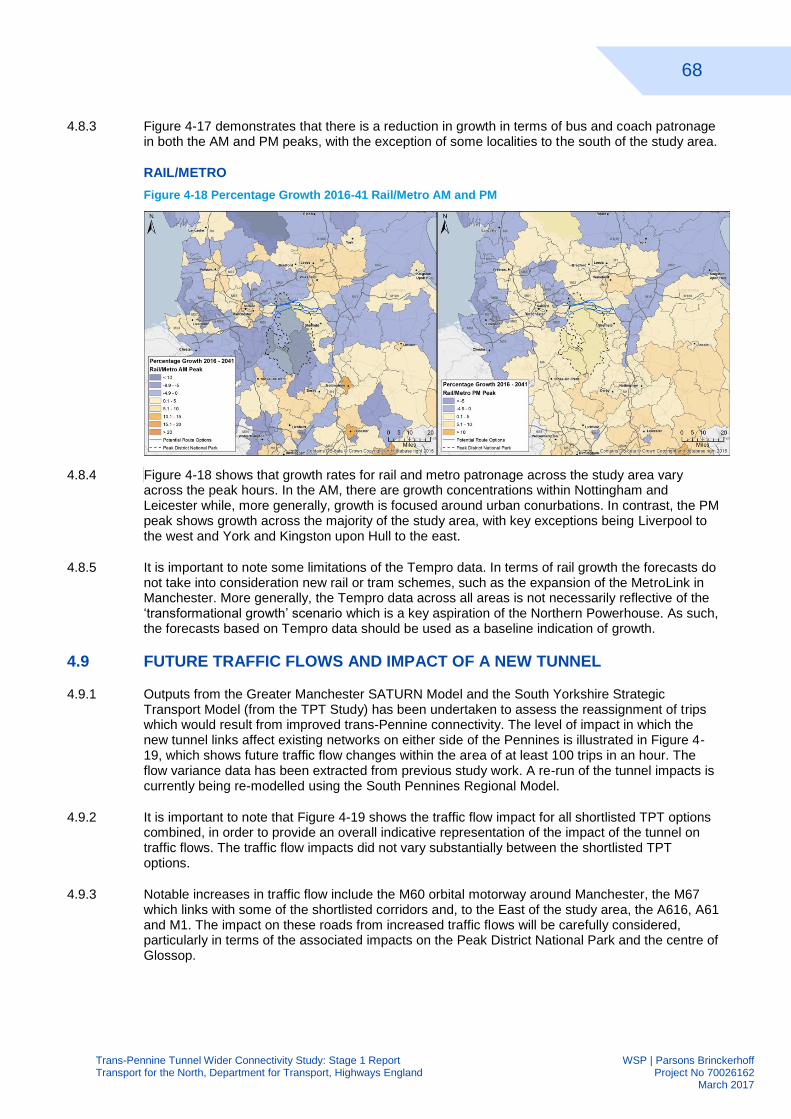
68
Trans-Pennine Tunnel Wider Connectivity Study: Stage 1 Report WSP | Parsons Brinckerhoff Transport for the North, Department for Transport, Highways England Project No 70026162 March 2017
Figure 4-17 demonstrates that there is a reduction in growth in terms of bus and coach patronage 4.8.3in both the AM and PM peaks, with the exception of some localities to the south of the study area.
RAIL/METRO
Figure 4-18 Percentage Growth 2016-41 Rail/Metro AM and PM
Figure 4-18 shows that growth rates for rail and metro patronage across the study area vary 4.8.4across the peak hours. In the AM, there are growth concentrations within Nottingham and Leicester while, more generally, growth is focused around urban conurbations. In contrast, the PM peak shows growth across the majority of the study area, with key exceptions being Liverpool to the west and York and Kingston upon Hull to the east.
It is important to note some limitations of the Tempro data. In terms of rail growth the forecasts do 4.8.5not take into consideration new rail or tram schemes, such as the expansion of the MetroLink in Manchester. More generally, the Tempro data across all areas is not necessarily reflective of the ‘transformational growth’ scenario which is a key aspiration of the Northern Powerhouse. As such, the forecasts based on Tempro data should be used as a baseline indication of growth.
4.9 FUTURE TRAFFIC FLOWS AND IMPACT OF A NEW TUNNEL
Outputs from the Greater Manchester SATURN Model and the South Yorkshire Strategic 4.9.1Transport Model (from the TPT Study) has been undertaken to assess the reassignment of trips which would result from improved trans-Pennine connectivity. The level of impact in which the new tunnel links affect existing networks on either side of the Pennines is illustrated in Figure 4-19, which shows future traffic flow changes within the area of at least 100 trips in an hour. The flow variance data has been extracted from previous study work. A re-run of the tunnel impacts is currently being re-modelled using the South Pennines Regional Model.
It is important to note that Figure 4-19 shows the traffic flow impact for all shortlisted TPT options 4.9.2combined, in order to provide an overall indicative representation of the impact of the tunnel on traffic flows. The traffic flow impacts did not vary substantially between the shortlisted TPT options.
Notable increases in traffic flow include the M60 orbital motorway around Manchester, the M67 4.9.3which links with some of the shortlisted corridors and, to the East of the study area, the A616, A61 and M1. The impact on these roads from increased traffic flows will be carefully considered, particularly in terms of the associated impacts on the Peak District National Park and the centre of Glossop.
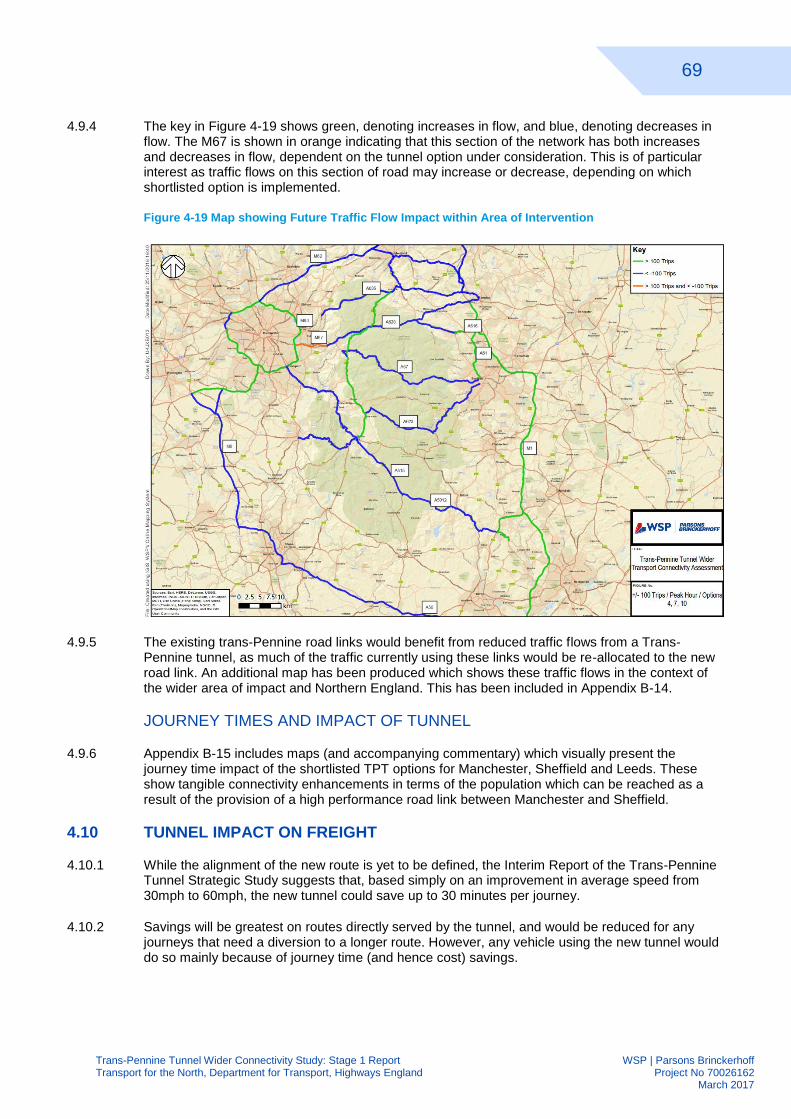
69
Trans-Pennine Tunnel Wider Connectivity Study: Stage 1 Report WSP | Parsons Brinckerhoff Transport for the North, Department for Transport, Highways England Project No 70026162 March 2017
The key in Figure 4-19 shows green, denoting increases in flow, and blue, denoting decreases in 4.9.4flow. The M67 is shown in orange indicating that this section of the network has both increases and decreases in flow, dependent on the tunnel option under consideration. This is of particular interest as traffic flows on this section of road may increase or decrease, depending on which shortlisted option is implemented.
Figure 4-19 Map showing Future Traffic Flow Impact within Area of Intervention
The existing trans-Pennine road links would benefit from reduced traffic flows from a Trans-4.9.5Pennine tunnel, as much of the traffic currently using these links would be re-allocated to the new road link. An additional map has been produced which shows these traffic flows in the context of the wider area of impact and Northern England. This has been included in Appendix B-14.
JOURNEY TIMES AND IMPACT OF TUNNEL
Appendix B-15 includes maps (and accompanying commentary) which visually present the 4.9.6journey time impact of the shortlisted TPT options for Manchester, Sheffield and Leeds. These show tangible connectivity enhancements in terms of the population which can be reached as a result of the provision of a high performance road link between Manchester and Sheffield.
4.10 TUNNEL IMPACT ON FREIGHT
While the alignment of the new route is yet to be defined, the Interim Report of the Trans-Pennine 4.10.1Tunnel Strategic Study suggests that, based simply on an improvement in average speed from 30mph to 60mph, the new tunnel could save up to 30 minutes per journey.
Savings will be greatest on routes directly served by the tunnel, and would be reduced for any 4.10.2journeys that need a diversion to a longer route. However, any vehicle using the new tunnel would do so mainly because of journey time (and hence cost) savings.
70
Trans-Pennine Tunnel Wider Connectivity Study: Stage 1 Report WSP | Parsons Brinckerhoff Transport for the North, Department for Transport, Highways England Project No 70026162 March 2017
The analysis of journey time savings to date has focussed on car journey times and speeds. The 4.10.3impact on HGVs is likely to be different:
HGVs are limited to 56mph so cannot achieve a 60mph average speed
HGVs are likely to be particularly slowed by uphill gradients on existing routes (and cannot make up that time on the descent due to their limited top speed)
There may be a particularly significant fuel impacts on HGVs climbing to the Pennine highway summits, although this may be mitigated by savings during the descent
There may be a measurable cost impact on brakes and tyres during the descent
INDIRECT IMPACTS
Indirect impacts for freight traffic associated with the TPT may include decongestion benefits on 4.10.4other routes within the area, and benefits from improved levels of network reliability.
The M62 is a vital corridor for connectivity in the North, and its importance is set to increase if it 4.10.5becomes a “super corridor” linking West and East Coast ports. A key benefit of the TPT will be the provision of a second high quality corridor, attracting some traffic from the M62 and thereby providing benefits to the remaining freight traffic on the M62 corridor.
Reliability is a major issue for goods traffic; while it is generally inconvenient if a road is blocked or 4.10.6closed at short notice, the consequences for HGVs are magnified. There are few diversionary routes suitable for HGVs, and so long detours are required. Also HGV drivers can only drive for strictly limited periods and once they are “out of hours” they must stop. Therefore any solution which improves reliability will be of significant benefit for freight.
USE OF THE TRANS PENNINE TUNNEL
Analysis was undertaken by MDS Transmodal for the TPT Strategic Study for a nominal tunnel 4.10.7route on HGV volumes on roads across a wide area from Edinburgh in the North to London in the South. The majority of HGV volume impact is concentrated around the area of intervention i.e. around the urban conurbations of Manchester, Leeds, Sheffield and the surrounding areas.
The following features are notable: 4.10.8
A large diversion of vehicles away from the M62.
HGV traffic flow reductions on longer distance routes, heading from Manchester to Birmingham and on towards the M6/M1/A14 junction.
HGV traffic flow reductions towards the NE and the A66 Northern Trans Pennine route.
HGV traffic flow increases from Sheffield, Southwards on the A1 towards the A14 junction
HGV traffic flow increases from Manchester, Northwards into the Lake District on the M6 corridor.
These observations suggest that a primary function of the new link would be to provide for 4.10.9relatively short distance traffic between Manchester and Sheffield/Barnsley. For longer distance traffic it is likely that additional traffic would be attracted to use the A1 and the new route across the Pennines, rather than the M6/M60/M62 from the South.
71
Trans-Pennine Tunnel Wider Connectivity Study: Stage 1 Report WSP | Parsons Brinckerhoff Transport for the North, Department for Transport, Highways England Project No 70026162 March 2017
MARKET IMPACT
The TPT would have an immediate impact in terms of reducing the costs of operation and 4.10.10unreliability for all vehicles diverting from other routes. There would also be decongestion benefits on the M62 strategic route. Other decongestion benefits on routes with fewer HGVs may be balanced by increased congestion on routes attracting more HGVs.
There may be additional fuel consumption and emission benefits, as HGVs would avoid the high 4.10.11summits of the existing routes. Similarly, there would likely be safety improvements through diversion of HGVs onto a modern road and away from steeper and less suitable roads.
The new route would create a completely new dynamic between Sheffield and Manchester, 4.10.12where, there is currently suppressed demand for HGV movements as demonstrated by the low levels of trade between these areas. Businesses in each city will be able to easily reach markets and suppliers across the Pennines, potentially increasing sales and reducing costs.
Presently the logistics industry sees the Pennines as a major barrier with, at best, a very long 4.10.13journey via the M62 to link the North West to Yorkshire. Supply chains have adapted by developing regional distribution centres to serve the North West or Yorkshire / Humberside and the North East, or by developing national distribution centres in the Midlands. A strong advantage of the Midlands is high quality motorway corridors that link the region to the North West and the North East / Yorkshire.
The new route has the potential to change the way logistics companies plan their business in the 4.10.14North of England. They may react by consolidating regional distribution centres to one location, or by moving national distribution centres northwards, away from the Midlands. A key element of the “Northern Freight Study” was a proposal to encourage more distribution centres to locate in the North; the new route would be a major step towards achieving this.
Accessibility is a major consideration for inward investors seeking to develop new businesses or 4.10.15relocate existing businesses. The new route would transform accessibility across a wide area of the North, potentially facilitating this.
The MDS map suggests that the new route may be attractive for traffic movements between the 4.10.16Humber and the Mersey. The “Gateways to the Northern Powerhouse” report raises the opportunity for “an East–West freight ‘super corridor’ linking Atlantic traffic with the European mainland”, but does not expand on how such a corridor could operate. There is an implication in the report that the corridor might be rail focussed, further confirmed in the “TfN Freight and Logistics Report”. While rail services would be ideal for bulk products and for deep sea containers, a high quality road link would be a more suitable option for trailers using ferry crossings and for many other manufactured and food products.
The new corridor would also offer a greater route choice, with significant benefits in terms of 4.10.17reliability for movements between the two groups of ports. In addition, the new corridor would provide future potential for logistics centres to be located in South Yorkshire, and it would also enhance the distribution ability of Northern ports.
72
Trans-Pennine Tunnel Wider Connectivity Study: Stage 1 Report WSP | Parsons Brinckerhoff Transport for the North, Department for Transport, Highways England Project No 70026162 March 2017
4.11 TRANSPORT CONTEXT SUMMARY
Key Road Routes The key routes identified as part of the study include the M60, A628, M62, M6 4.11.1and M1. Of particular interest is the A628, which acts as a key trans-Pennine road link.
Traffic Flows Within the study area, data shows that the highest traffic flows are associated with 4.11.2the M60, the M6 and the M62; a key route linking Manchester and Sheffield. The single carriageway A628 has comparable HGV flows to the M62 (motorway standard) which results in reduced speeds and journey times as vehicles are unable to over-take slower moving HGVs.
Congestion Reference Flows (CRFs) are high on the A628 (ranging from 40% to 61%). The 4.11.3A616 also has high CRFs ranging from 45% to 55%. The highest congestion reference flows are at either end of the trans-Pennine routes.
Road-based Journey Times confirm significantly better connectivity on the M62 and M1 when 4.11.4compared with key Trans-Pennine road links such as the A628 and A57.
Drive time isochrones show that greater distances are achievable on a north south axis, than in 4.11.5an east west axis, and this is due to the availability of motorway standard links which facilitate north south movements. These routes also benefit from higher average speeds and greater levels of journey time reliability when compared with trans-Pennine routes such as the A628.
Traffic Speeds Traffic Master Data has been analysed for the month of October 2015, a neutral 4.11.6month. Speeds on the existing trans-Pennine routes generally fall within the 30-40mph category with evidence of slower speeds on particular areas of the network, such as the A57 around Mottram and the A635 through Holmfirth.
Road Closures 77% of road closures within the study area are a result of collisions or bad 4.11.7weather, and two thirds of closures lasted longer than two hours. The majority of closures are located on the A628, with over 2 times as many closures as the A616.
Road Safety The majority of roads under analysis are low to medium risk (EuroRAP risk ratings) 4.11.8with the exception of the A61 which is medium-high risk, and a section of the A628 which is high risk, and the highest risk of those roads under analysis.
Trans-Pennine Upgrade Programme Key programmes to improve connectivity within the study 4.11.9area have been considered, these include the A61 dualling, A628 climbing lanes and the Mottram Moor Link Road.
Rail The Hope Valley line links Sheffield with Manchester and carries over 1.5 million passengers 4.11.10per annum, the market on this route is driven by some commuting into Sheffield and Manchester, as well as leisure trips. It has been subject to crowing issues, particularly at route ends. Some journeys by rail between Manchester and Sheffield can be quicker than by road during the off-peak, and these journeys can be substantially quicker during the peak period.
Airport Connectivity Manchester airport is the North’s main airport, and the third largest in the 4.11.11UK in terms of passenger numbers, it has ambitious growth aspirations and will benefit from £1bn investment over the next 10 years. Ensuring enhanced connectivity to Manchester, and other airport sites within the area, is of critical importance in terms of the future economic performance of the North.
Freight The North is a strategically important source of freight movements, particularly to and 4.11.12from its ports on the Humber, Tees, Tyne and Mersey, from its manufacturing centres, and to and from power stations. Although home to 24% of the UK population, the North handles 56% of rail freight tonnage and 35% of both road freight and ports tonnage.
73
Trans-Pennine Tunnel Wider Connectivity Study: Stage 1 Report WSP | Parsons Brinckerhoff Transport for the North, Department for Transport, Highways England Project No 70026162 March 2017
Future Demand Substantial car driver growth is forecast during the 2016-41 period, bus and 4.11.13coach use is forecast to decline during the same period. Growth rates for rail and metro across the study area vary across the peak hours with growth focused around urban conurbations.
Future Traffic Flows Analysis indicates that the TPT would result in a re-assignment of traffic on 4.11.14the network. Notable increases in traffic flow include the M60 orbital motorway around Manchester, the M67 which links with some of the shortlisted corridors and, to the east of the Pennines, the A616, A61 and M1. In addition, the existing trans-Pennine road links would benefit from reduced traffic flows from a TPT, as much of the traffic currently using these links would be re-allocated to the new road link.
Tunnel Impact on Freight Based on an improvement in average speed from 30mph to 60mph 4.11.15the new tunnel could save up to 30 minutes per journey. The TPT would have an immediate impact in terms of reducing the costs of operation and unreliability.
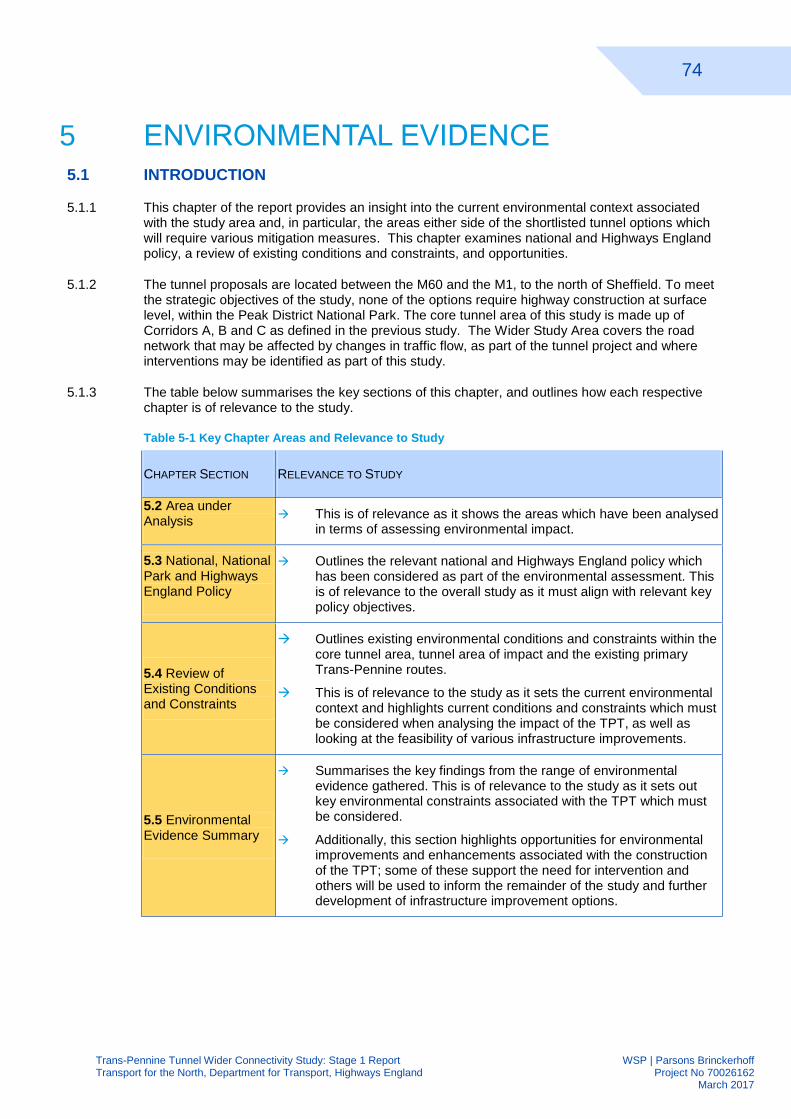
74
Trans-Pennine Tunnel Wider Connectivity Study: Stage 1 Report WSP | Parsons Brinckerhoff Transport for the North, Department for Transport, Highways England Project No 70026162 March 2017
ENVIRONMENTAL EVIDENCE 5
5.1 INTRODUCTION
This chapter of the report provides an insight into the current environmental context associated 5.1.1with the study area and, in particular, the areas either side of the shortlisted tunnel options which will require various mitigation measures. This chapter examines national and Highways England policy, a review of existing conditions and constraints, and opportunities.
The tunnel proposals are located between the M60 and the M1, to the north of Sheffield. To meet 5.1.2the strategic objectives of the study, none of the options require highway construction at surface level, within the Peak District National Park. The core tunnel area of this study is made up of Corridors A, B and C as defined in the previous study. The Wider Study Area covers the road network that may be affected by changes in traffic flow, as part of the tunnel project and where interventions may be identified as part of this study.
The table below summarises the key sections of this chapter, and outlines how each respective 5.1.3chapter is of relevance to the study.
Table 5-1 Key Chapter Areas and Relevance to Study
CHAPTER SECTION RELEVANCE TO STUDY
5.2 Area under Analysis
This is of relevance as it shows the areas which have been analysed in terms of assessing environmental impact.
5.3 National, National Park and Highways England Policy
Outlines the relevant national and Highways England policy which has been considered as part of the environmental assessment. This is of relevance to the overall study as it must align with relevant key policy objectives.
5.4 Review of Existing Conditions and Constraints
Outlines existing environmental conditions and constraints within the core tunnel area, tunnel area of impact and the existing primary Trans-Pennine routes.
This is of relevance to the study as it sets the current environmental context and highlights current conditions and constraints which must be considered when analysing the impact of the TPT, as well as looking at the feasibility of various infrastructure improvements.
5.5 Environmental Evidence Summary
Summarises the key findings from the range of environmental evidence gathered. This is of relevance to the study as it sets out key environmental constraints associated with the TPT which must be considered.
Additionally, this section highlights opportunities for environmental improvements and enhancements associated with the construction of the TPT; some of these support the need for intervention and others will be used to inform the remainder of the study and further development of infrastructure improvement options.
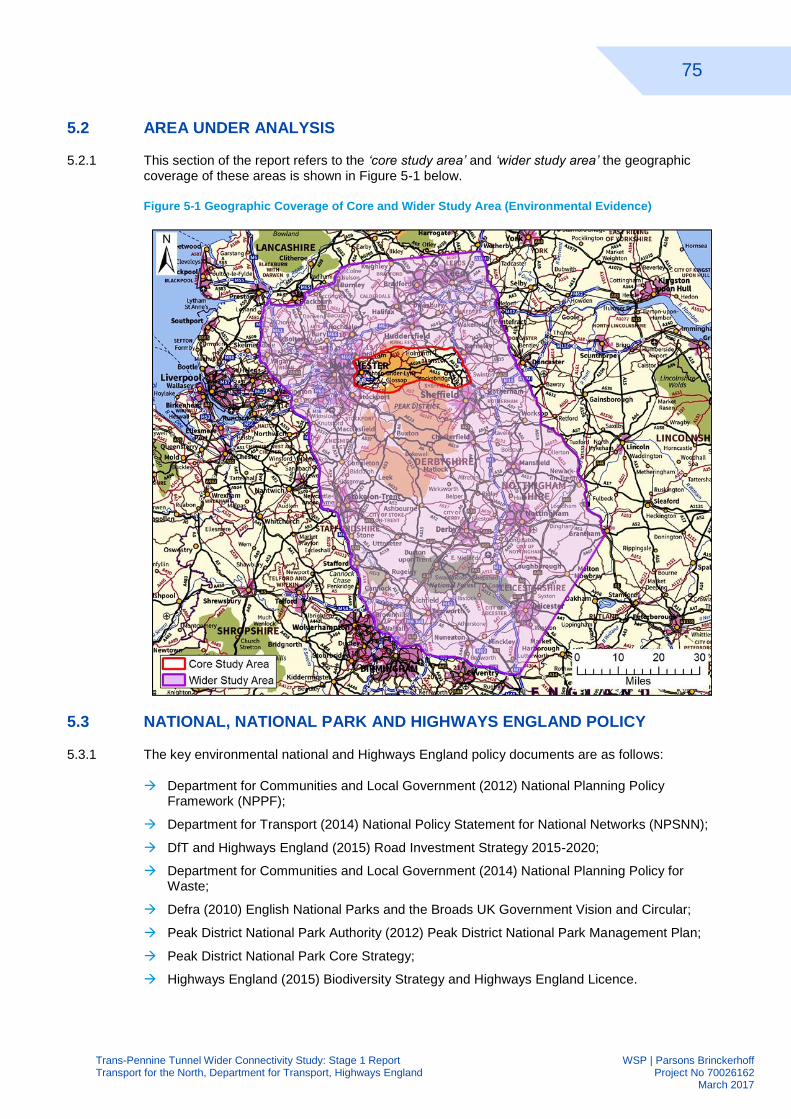
75
Trans-Pennine Tunnel Wider Connectivity Study: Stage 1 Report WSP | Parsons Brinckerhoff Transport for the North, Department for Transport, Highways England Project No 70026162 March 2017
5.2 AREA UNDER ANALYSIS
This section of the report refers to the ‘core study area’ and ‘wider study area’ the geographic 5.2.1coverage of these areas is shown in Figure 5-1 below.
Figure 5-1 Geographic Coverage of Core and Wider Study Area (Environmental Evidence)
5.3 NATIONAL, NATIONAL PARK AND HIGHWAYS ENGLAND POLICY
The key environmental national and Highways England policy documents are as follows: 5.3.1
Department for Communities and Local Government (2012) National Planning Policy Framework (NPPF);
Department for Transport (2014) National Policy Statement for National Networks (NPSNN);
DfT and Highways England (2015) Road Investment Strategy 2015-2020;
Department for Communities and Local Government (2014) National Planning Policy for Waste;
Defra (2010) English National Parks and the Broads UK Government Vision and Circular;
Peak District National Park Authority (2012) Peak District National Park Management Plan;
Peak District National Park Core Strategy;
Highways England (2015) Biodiversity Strategy and Highways England Licence.
76
Trans-Pennine Tunnel Wider Connectivity Study: Stage 1 Report WSP | Parsons Brinckerhoff Transport for the North, Department for Transport, Highways England Project No 70026162 March 2017
NATIONAL PLANNING POLICY FRAMEWORK
The NPPF states that the purpose of the planning system is to help achieve sustainable 5.3.2development and recognises that there are three separate but inter-linked dimensions: economic, social and environmental. The NPPF recognises the role of planning in contributing to building a strong, responsive and competitive economy and by identifying and coordinating development requirements, including the provision of infrastructure.
The policies within the Framework seek to improve health, social and cultural wellbeing for all, 5.3.3deliver sufficient community and cultural facilities and services to meet local needs and secure a good standard of amenity for all existing and future occupants of land and buildings. Development is expected to contribute to the conservation and enhancement of the natural and historic environments and prevent development from contributing to unacceptable levels of pollution.
The NPPF places emphasis on good design which is a key aspect of sustainable development 5.3.4and should contribute positively to making places better for people and should avoid significant adverse impacts which can affect health and well-being.
NATIONAL POLICY STATEMENT FOR NATIONAL NETWORKS
The NPSNN recognises that for development to be sustainable, these should be designed to 5.3.5minimise social and environmental impacts and improve well-being. Development should be delivered in an environmentally sensitive way including the consideration of opportunities to deliver environmental benefits. Government policy is to address existing environmental problems and improve performance of the network by reconnecting habitats and ecosystems, enhancing the historic and cultural heritage features, respecting and enhancing landscape character improving water quality and reducing flood risk avoiding significant adverse effects.
ROAD INVESTMENT STRATEGY 2015-2020
The Department for Transport has published its Road Investment Strategy: for the 2015/16 – 5.3.62019/20 Road Period which sets out policies relating to the strategic planning and funding of the road network and deliver environmental improvements for both new and existing schemes. The plan includes a statement regarding the Trans-Pennine Tunnel study:
“Following the Trans-Pennine routes feasibility study there is a need for further examination of the case for Manchester and Sheffield to be connected by a high-performance link. We are keen to explore the costs and feasibility of this potentially transformational improvement. Such a connection could have a dramatic impact on the economy of the north, particularly in combination with plans for high speed rail links. It would be capable of fundamentally changing the nature of the journey between two of the most important cities of the north. But the invaluable landscapes and ecological significance of the Peak District National Park rule out a surface link. The only credible solution may be to construct a tunnel under the central part of the Pennines. This carries with it the potential to bring important environmental improvements to the Peak District National Park.”
NATIONAL PLANNING POLICY FOR WASTE
The National Planning Policy for Waste provides detailed waste planning policies and should be 5.3.7read in conjunction with NPPF and the Waste Management Plan for England. The policy indicates a number of requirements for local planning authorities when determining planning applications for both waste and non-waste developments, preparation of and identification of waste sites. In determining planning for non-waste developments, as applicable for the Proposed Scheme.
77
Trans-Pennine Tunnel Wider Connectivity Study: Stage 1 Report WSP | Parsons Brinckerhoff Transport for the North, Department for Transport, Highways England Project No 70026162 March 2017
The likely impacts of proposed, non-waste related development on existing waste management 5.3.8facilities, and on sites and areas allocated for waste management, is acceptable and does not prejudice the implementation of the waste hierarchy and/or the efficient operation of such facilities; and the handling of waste arising from the construction and operation of development maximises reuse/recover opportunities, and minimises off-site disposal.
ENGLISH NATIONAL PARKS AND THE BROADS UK GOVERNMENT VISION AND CIRCULAR
This circular provides an update to policy guidance on the English National Parks and the Norfolk 5.3.9Broads. It sets out a vision for the National Parks and the Broads up to 2030 and includes the key outcomes the Government is seeking over the next five years towards delivering the vision. It provides the key statutory duties of the National Park authorities (‘NPAs’) and the policy on governance of the Authorities. In particular, paragraphs 85 to 87 set out the approach to road construction within the National Parks and states:
“there is a strong presumption against any significant road widening or the building of new roads through a Park, unless it can be shown there are compelling reasons for the new or enhanced capacity and with any benefits outweighing the costs very significantly.”
The circular then states that any development would require significant mitigation and 5.3.10compensation for the loss of environmental or landscape value.
PEAK DISTRICT NATIONAL PARK MANAGEMENT PLAN
This Plan sets out the following four visions: 5.3.11
A Diverse Working and Cherished Landscape;
A Welcoming and Inspiring Places
Thriving and Vibrant Communities; and
An Enterprising and Sustainable Economy
With respect to A Diverse Working and Cherished Landscape, the vision is to deliver: 5.3.12
A resilient Peak District where the unique beauty of its working landscapes, its wildlife and environment, its tranquillity, cultural heritage and the communities within it, continue to be understood and valued nationally for their diversity and richness.
With the following Specific Delivery Outcomes that relate to the environment: 5.3.13
DL 1 Landscape: The diverse national park landscapes will adapt to challenges whilst retaining their special qualities and natural beauty
DL 2 Cultural Heritage: Our cultural heritage and distinctive local traditions will be sustained and enhanced as an integral part of modern Peak District life
DL 3 Biodiversity and ecosystems: The richness of the natural environment will be conserved, restored and enhanced so wildlife can thrive, ecological systems continue to improve and its diverse geology is retained and valued
DL 4 Climate Change: Greenhouse gas emissions will be reduced and a healthy national park will adapt to the effects of climate change
WI 1 Sustainable Tourism: The national park will strengthen its role as a welcoming place and premier destination, synonymous with escape, adventure, enjoyment and sustainability
WI 2 Access for all: The Peak District will be an unrivalled setting for opportunities which enable people to develop a deeper understanding and appreciation of the place, and which instil a desire to contribute to the conservation, community and economy of the national park

78
Trans-Pennine Tunnel Wider Connectivity Study: Stage 1 Report WSP | Parsons Brinckerhoff Transport for the North, Department for Transport, Highways England Project No 70026162 March 2017
WI 4 Recreation: Accessible and diverse recreation opportunities will be available for all, encouraging healthy living, enjoyment of the landscape and a sense of adventure
TV 1 Sense of Place: Thriving villages, hamlets and the market town of Bakewell will adapt to new challenges whilst retaining their valued historic and cultural integrity
TV 3 Access to Services: Residents will have sustainable access to local services and employment
ES 2 Economic Diversity: There will be a diversity of thriving businesses supporting and contributing to the economy and local communities which are critical to the long term future of the national park
ES 3 Environmental Goods: The Peak District landscape will be managed by farmers and other land managers to increase the potential economic return from public goods, such as clean water, carbon storage and renewables
ES 4 Green Economy: Traditional and modern economic development that is innovative, well managed and appropriate to the landscape will be supported
PEAK DISTRICT NATIONAL PARK CORE STRATEGY
The Core Strategy sets out the vision, objectives and spatial strategy for the National Park, and 5.3.14core policies to guide development and change in the National Park to 2026. The focus of the Core Strategy is the need to conserve and enhance landscapes, settlements and other valued characteristics in line with National Park purposes. It is the principal document of the Local Development Framework and provides the spatial expression of the National Park Management Plan. It is supported by statutory Development Plan Documents (DPD) and Supplementary Planning Documents (SPD). The Core Strategy replaces the 2001 Local Plan.
Within the Core Strategy, there are four General Spatial Policies (GSPs) which provide 5.3.15overarching principles for spatial planning in the National Park:
GSP 1 Securing national park purposes and sustainable development: this policy requires any development proposal within the National Park complies with core policies in order that development satisfies the statutory purposes of National Park designation. Relevant sub-policy includes:
In securing national park purposes, major development should not take place within the Peak District National Park other than in exceptional circumstances. Major development will only be permitted following rigorous consideration of the criteria in national policy.
Where a proposal for major development can demonstrate a significant net benefit to the National Park, every effort to mitigate potential localised harm and compensate for any residual harm to the area’s valued characteristics would be expected to be secured.
GSP 2 Enhancing the national park: this policy places emphasis on enhancing the National Park’s valued characteristics, by ensuring that first consideration is always given to solutions which do not harm the area.
GSP 3 Development management principles: this policy states the overarching principles for development management to be considered in all circumstances.
GSP 4 Planning conditions and legal agreements: this policy outlines the way that planning gain will be operated to maximise the benefit of development to the National Park.
79
Trans-Pennine Tunnel Wider Connectivity Study: Stage 1 Report WSP | Parsons Brinckerhoff Transport for the North, Department for Transport, Highways England Project No 70026162 March 2017
HIGHWAYS ENGLAND BIODIVERSITY STRATEGY
The Highways England Biodiversity plan sets five outcomes for biodiversity to be achieved by 5.3.16Highways England over the Road Investment Strategy RIS1 period, i.e. 2015 - 2020. Central to the Highways Biodiversity Plan is the requirement for Highways England to achieve no net loss of biodiversity by 2020 (i.e. within RIS1) and a net gain in biodiversity by 2040, in line with objectives set within the Road Investment Strategy.
HIGHWAYS ENGLAND LICENCE
As an arm’s length company, Highways England operates under a licence granted by the 5.3.17Secretary of State in April 2015. The licence sets out various requirements of Highways England including environmental objectives: 4.2 (g) Minimise the environmental impacts of operating, maintaining and improving its network and seek to protect and enhance the quality of the surrounding environment. Section 5.23 (e & h) it must seeks to “minimise carbon emissions” and “other greenhouse gases from its operations and take opportunities to influence road users to reduce the greenhouse gas emissions from their journey choices.
5.4 REVIEW OF EXISTING CONDITIONS AND CONSTRAINTS
CORE TUNNEL AREA
Appraisal of the potential environmental impacts within the Area of intervention has already been 5.4.1completed in the Trans-Pennine Tunnel Study. It identifies the opportunity for improvement to the environment within the Peak District National Park. However, it also identifies the potential for adverse environmental impact outside of the National Park between the tunnel portal and the existing road network. The environmental designations within the Core Tunnel area are set out below and the corresponding constraints plan is located within Appendix C-1.
AIR QUALITY
There are four Air Quality Management Areas (AQMAs) within the core tunnel area. These are 5.4.2located outside of the National Park and relate to the towns and cities that are located with the area. There are also Pollution Climate Mapping (PCM) links within the surrounding towns and cities including areas within Sheffield, Barnsley and Ashton under Lyne which are in exceedance (2015) (above 40µg m
-3). There are also PCM links within the National Park in and around
Holmfirth but these were not in exceedance in 2015.
CULTURAL HERITAGE
There are no World Heritage Sites or Registered Battlefields within the Core Study Area. There 5.4.3are 40 Scheduled Monuments that vary from Roman settlements, cairns and wayfinders, barrows furnaces and bridges. There are six Registered Parks and Gardens of which there is one Grade I, Wentworth Castle, one Grade II*, Alexandra Park and four Grade II. There are 1130 listed buildings of which there are eight Grade I, 42 Grade II*, 1080 Grade II. Detailed data on the number of Conservation Areas within the Core Study Area will be made available at the next stage of the study however there are over 100 Conservation Areas within the National Park as a whole.
LANDSCAPE AND TOWNSCAPE
The baseline route passes through the Peak District National Park and Greater Manchester and 5.4.4West Yorkshire Greenbelts. There are no Areas of Outstanding Natural Beauty.
80
Trans-Pennine Tunnel Wider Connectivity Study: Stage 1 Report WSP | Parsons Brinckerhoff Transport for the North, Department for Transport, Highways England Project No 70026162 March 2017
Within the Core Study Area the Peak District National Park is characterised by the Dark Peak 5.4.5National Character Area (NCA); bordered to the west by Manchester Pennine Fringe beyond which is Manchester Conurbation; and bordered to the east by the Yorkshire Southern Pennine Fringe beyond which is the Nottinghamshire, Derbyshire and Yorkshire Coalfield NCA. Significant variations in landscape character exist within the Core Study Area between these NCAs; the wild and remote semi-natural character of landscapes contained within the National Park contrast sharply with the dense urban industrial development of the Manchester Conurbation.
NATURE CONSERVATION / BIODIVERSITY
There is one Special Area of Conservation (SAC), South Pennine Moors, and one Special 5.4.6Protection Area (SPA), Peak District Moors (South Pennine Moors Phase 1) within the core tunnel area. Both are located within the National Park and have similar extents.
There are six Biological Sites of Special Scientific Interest, one National Nature Reserve and one 5.4.7important bird area. There is also one RSPB Reserve, Dove Stone, which is located within the National Park at its north western extents. There are approximately 1,990 hectares of Ancient Woodland within the core tunnel area, but predominantly located outside of the National Park, to the north of Sheffield.
NOISE AND VIBRATION
There are 85 Noise Important Areas (NIAs) within the Core Study Area. These are predominantly 5.4.8located in the towns and cities that are outside of the National Park although there are a number of small NIAs that relate to some properties within the National Park.
ROAD DRAINAGE AND WATER ENVIRONMENT
The majority of the Core Study Area is located within the Flood Zone 1, which indicates a low risk 5.4.9of flooding from fluvial sources. However, there are areas that are situated within a mixture of Flood Zones 2/3 indicating a medium/high risk of fluvial flooding. The Environment Agency's Risk of Flooding from Surface Water Map shows the majority of the Scheme corridor is at very low and low risk of flooding. However, there are isolated areas, where a medium to high risk of surface water flooding has been identified.
The Core Study Area includes the watershed between the Humber and North West River Basins. 5.4.10As such, most of the watercourses make up the upper reaches or tributaries of a number of significant watercourses such as the Calder, Derwent Don and Tame and Mersey. There is one Groundwater Source Protection Zone that is located within the National Park at Ingbirchworth Moor. It is used for public potable water supply.
PEOPLES AND COMMUNITIES
There are many long distance footpaths / Bridlepaths and cycle routes within within the Core 5.4.11Study Area, in particular, both the Pennine Way and Pennine Bridleway. The Pennine Way, which runs from Edale to Kirk Yetholm and is 435 km (267 miles) long; is the oldest national trail and was opened in 1965. The Pennine Bridleway is the only national trail that is useable by horse riders and cyclists, and it runs from Middleton near Buxton to Cote Moor, a total of 334 km (207 miles). The Trans Pennine Trail, National cycle network route 62, runs through the study area, along the same area as the A628.
GEOLOGY, SOILS AND MATERIALS
There are five SSSIs designated for geological or mixed (biological and geological) reasons within 5.4.12the Core Study Area.
81
Trans-Pennine Tunnel Wider Connectivity Study: Stage 1 Report WSP | Parsons Brinckerhoff Transport for the North, Department for Transport, Highways England Project No 70026162 March 2017
TUNNEL AREA OF IMPACT
At this stage, the potential interventions to support the wider connectivity of tunnel proposals are 5.4.13unknown. However, it is possible to identify locations on the existing network that may benefit through decreases in traffic and already sensitive areas that may be further adversely impacted. At this time, air quality, noise and ecological designations are considered within the area of impact as these designations are sensitive to changes in traffic flow
The environmental designations within the wider study area are set out below and the 5.4.14corresponding constraints plan is located within Appendix C-1.
AIR QUALITY
There are 99 Air Quality Management Areas (AQMAs) within the area of impact. These relate to 5.4.15roads within the towns and cities and locations adjacent to strategic road network, for example, the M6, A1 and M60. There are also Pollution Climate Mapping (PCM) links across the strategic road network as well as within the towns and cities which are in exceedance (2015) (above 40µg m
-3). Locations include the A500 through Stoke on Trent, the M1 through Sheffield, Ainley Top on
the M62 and on the M60 to the east of Manchester, particularly at the junction with the A635. There are also further PCM links across the area of impact but these are not in exceedance in 2015.
Initial assessment of the changes in traffic flow as a result of the introduction of a tunnel suggests 5.4.16that there will be reduction in traffic across the Peak District National Park and a corresponding improvement in air quality. There are also likely to be improvements along the M62, M6 and A500 and the potential to improve the Air Quality in both the M62 part of the Greater Manchester AQMA and the A50 part of the Stoke on Trent Air quality Management Order 2011. Conversely, increases in traffic flow are identified along the M60 and M1 where the Greater Manchester AQMA and Barnsley AQMA No.1 and Rotherham AQMA 1, are already in place.
With regards to PCM links in exceedance, the changes in traffic flow have the potential to benefit 5.4.17the A500 and M62 but a negative impact on the M1 through Sheffield and the M60, east of Manchester.
NOISE AND VIBRATION
Within the area of impact there are 331 NIAs associated with the strategic road network, 5.4.18particularly along the M1, M6, M62 and the A500 through Stoke on Trent. There are further NIAs within the towns and cities across the area of impact, away from the strategic road network.
Initial assessment of the changes in traffic flow as a result of the introduction of a tunnel suggests 5.4.19that there will be reduction in traffic across the Peak District National Park as well as along the M62, A500 and M6, with a corresponding improvement in noise levels across the network and within NIAs. However, there is also potential noise increases along the M1 and M60 that are also subject to a number of NIAs.
NATURE CONSERVATION / BIODIVERSITY
Within the area of impact, there are 15 Special Areas of Conservation (SAC), two Ramsar sites, 5.4.20two Special Protection Areas (SPA) and 362 Sites of Special Scientific Interest. Generally, the designated sites are located away from the strategic road network, although there are some exceptions, including the South Pennines Moors SAC, South Pennines Moors phase 2 SPA and Rochdale Canal SAC that is bisected by the M62.
82
Trans-Pennine Tunnel Wider Connectivity Study: Stage 1 Report WSP | Parsons Brinckerhoff Transport for the North, Department for Transport, Highways England Project No 70026162 March 2017
Initial assessment of the changes in traffic flow as result of the introduction of a tunnel suggests 5.4.21that there will be reduction in traffic across the Peak District National Park and the M62. This has potential benefits to South Pennines Moors SAC, South Pennines Moors phase 2 SPA and Rochdale Canal SAC that is bisected by the M62.
EXISTING PRIMARY ROUTE
The environmental designations along the existing primary route (A57/A628/A616) and within 5.4.225km, are as follows:
AIR QUALITY
There are five Air Quality Management Areas (AQMAs) along, or within 5km of the existing 5.4.23primary route. These are located outside of the National Park and relate to the towns and cities that are located with the study area. There are also Pollution Climate Mapping (PCM) links within the surrounding towns and cities including areas within Sheffield, Barnsley and Ashton under Lyne which are in exceedance (2015) (above 40µg m
-3). There are also PCM links within the
National Park in and around Holmfirth but these were not in exceedance in 2015.
CULTURAL HERITAGE
There are no World Heritage Sites or Registered Battlefields within the Core Study Area. There 5.4.24are 40 Scheduled Monuments that vary from Roman settlements, cairns and wayfinders, barrows furnaces and bridges. There are six Registered Parks and Gardens of which there is one Grade I, Wentworth Castle, one Grade II*, Wentworth Woodhouse and four Grade II. There are 845 listed buildings of which there are nine Grade I, 47 Grade II*, 816 Grade II. Detailed data on the number of Conservation Areas within the Core Study Area will be made available at the next stage of the study however there are over 100 Conservation Areas within the National Park as a whole.
LANDSCAPE AND TOWNSCAPE
The baseline route passes through the Peak District National Park and Liverpool, Manchester and 5.4.25West Yorkshire Greenbelt. There are no Areas of Outstanding Natural Beauty.
The existing primary route runs through four NCAs: Manchester Pennine Fringe, Dark Peak, 5.4.26Yorkshire Southern Pennine Fringe and Nottinghamshire, Derbyshire and Yorkshire Coalfield. Between these NCAs the landscape of the existing route varies significantly, from the low-lying landscapes of rolling ridges and mixed pattern of built-up areas, industrial land and farmed open country of the Yorkshire coalfields, to the transitional landscapes of valley pastures and industrial towns within the Pennine Fringe NCAs, and the more remote landscapes of large sweeping moorland and reservoir valleys with woodland within the Dark Peak NCA. Notably, the Peak District National Park / Dark Peak NCA supports internationally important mosaics of habitats and rare species, nationally and internationally important historic landscapes and heritage assets, and with its open access areas and footpaths yet ease of access from adjacent settlements is an important landscape for recreation.
NATURE CONSERVATION / BIODIVERSITY
There are two Special Areas of Conservation (SAC) and one Special Protection Areas (SPA) 5.4.27within 5km of the baseline route. South Pennine Moors SAC and Peak District Moors (South Pennine Moors Phase 1) SPA are located within the National Park and have similar extents. The Rochdale Canal SAC is outside of the National Park to the west.
83
Trans-Pennine Tunnel Wider Connectivity Study: Stage 1 Report WSP | Parsons Brinckerhoff Transport for the North, Department for Transport, Highways England Project No 70026162 March 2017
There are eleven Biological Sites of Special Scientific Interest, one important bird area and no 5.4.28National Nature Reserves. There is also one RSPB Reserve, Dove Stone, which is located within the National Park at its north western extents. There are approximately 1,980 hectares of Ancient Woodland within 5km of the baseline route, but predominantly located outside of the National Park, to the north of Sheffield.
NOISE AND VIBRATION
There are 74 Noise Important Areas (NIAs) within the Core Study Area. These are predominantly 5.4.29located in the towns and cities that are outside of the National Park although there are a number of small NIAs that relate to some properties within the National Park.
ROAD DRAINAGE AND WATER ENVIRONMENT
The majority of the Core Study Area is located within the Flood Zone 1, which indicates a low risk 5.4.30of flooding from fluvial sources. However, there are areas that are situated within a mixture of Flood Zones 2/3 indicating a medium/high risk of fluvial flooding. The Environment Agency's Risk of Flooding from Surface Water Map shows the majority of the Scheme corridor is at very low and low risk of flooding. However, there are isolated areas, where a medium to high risk of surface water flooding has been identified.
The Core Study Area includes the watershed between the Humber and North West River Basins. 5.4.31As such, most of the watercourses make up the upper reaches or tributaries of a number of significant watercourses such as the Calder, Derwent Don and Tame and Mersey.
There is one Groundwater Source Protection Zone that is located within the National Park at 5.4.32Ingbirchworth Moor; it is used for public potable water supply. There are also potentially four major surface water abstractions from the reservoirs along the baseline route. These are used by both Yorkshire Water and United Utilities for Potable water supply for Sheffield and Barnsley, and Greater Manchester and Salford, respectively.
PEOPLES AND COMMUNITIES
There are many long distance footpaths / Bridlepaths and cycle routes within within the Core 5.4.33Study Area, in particular, both the Pennine Way and Pennine Bridleway. The Pennine Way, which runs from Edale to Kirk Yetholm and is 435 km (267 miles) long; is the oldest national trail and was opened in 1965. The Pennine Bridleway is the only national trail that is useable by horse riders and cyclists, and it runs from Middleton near Buxton to Cote Moor, a total of 334 km (207 miles). The Trans Pennine Trail, National cycle network route 62, runs through the study area.
GEOLOGY, SOILS AND MATERIALS
There are eleven SSSIs designated for geological or mixed (biological and geological) reasons 5.4.34within the Core Study Area.
5.5 ENVIRONMENTAL EVIDENCE SUMMARY
Table 5-1 sets out a summary of the key potential environmental constraints on a topic by topic 5.5.1basis, along with a Red/Amber/Green (RAG) rating. The methodology and criteria are detailed in the Appraisal Summary Report (ASR).
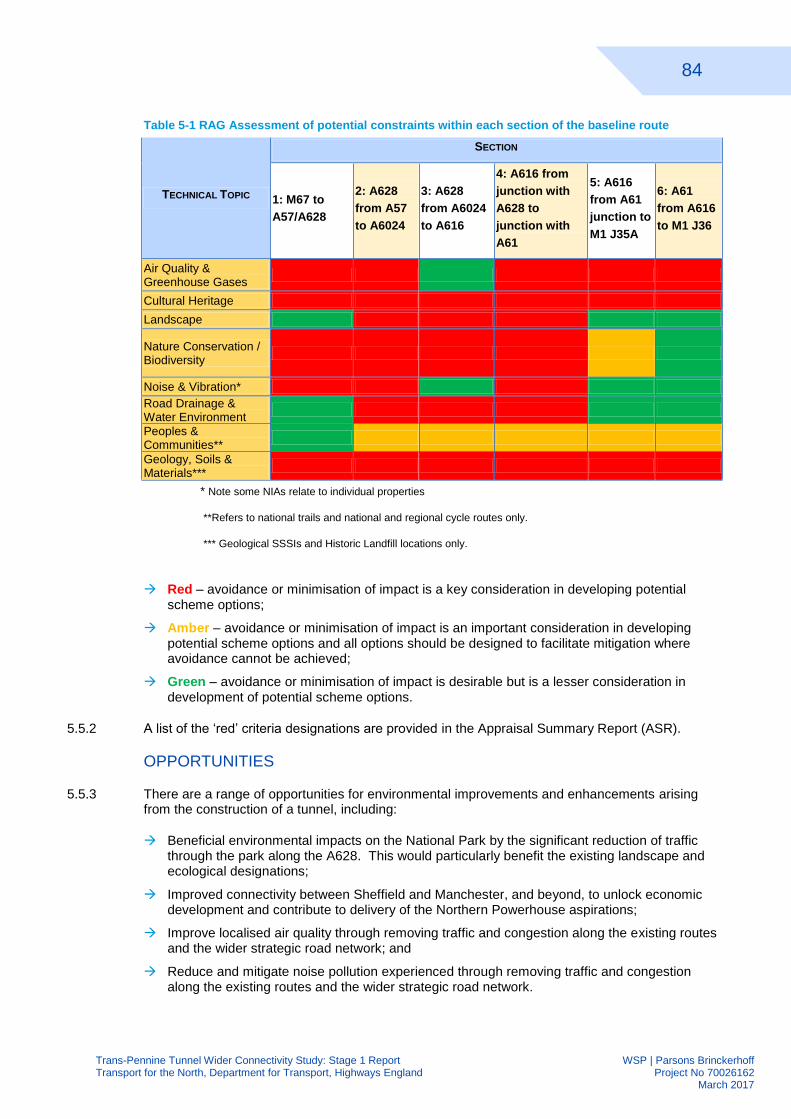
84
Trans-Pennine Tunnel Wider Connectivity Study: Stage 1 Report WSP | Parsons Brinckerhoff Transport for the North, Department for Transport, Highways England Project No 70026162 March 2017
Table 5-1 RAG Assessment of potential constraints within each section of the baseline route
TECHNICAL TOPIC
SECTION
1: M67 to
A57/A628
2: A628
from A57
to A6024
3: A628
from A6024
to A616
4: A616 from
junction with
A628 to
junction with
A61
5: A616
from A61
junction to
M1 J35A
6: A61
from A616
to M1 J36
Air Quality & Greenhouse Gases
Cultural Heritage
Landscape
Nature Conservation / Biodiversity
Noise & Vibration*
Road Drainage & Water Environment
Peoples & Communities**
Geology, Soils & Materials***
* Note some NIAs relate to individual properties
**Refers to national trails and national and regional cycle routes only.
*** Geological SSSIs and Historic Landfill locations only.
Red – avoidance or minimisation of impact is a key consideration in developing potential scheme options;
Amber – avoidance or minimisation of impact is an important consideration in developing potential scheme options and all options should be designed to facilitate mitigation where avoidance cannot be achieved;
Green – avoidance or minimisation of impact is desirable but is a lesser consideration in development of potential scheme options.
A list of the ‘red’ criteria designations are provided in the Appraisal Summary Report (ASR). 5.5.2
OPPORTUNITIES
There are a range of opportunities for environmental improvements and enhancements arising 5.5.3from the construction of a tunnel, including:
Beneficial environmental impacts on the National Park by the significant reduction of traffic through the park along the A628. This would particularly benefit the existing landscape and ecological designations;
Improved connectivity between Sheffield and Manchester, and beyond, to unlock economic development and contribute to delivery of the Northern Powerhouse aspirations;
Improve localised air quality through removing traffic and congestion along the existing routes and the wider strategic road network; and
Reduce and mitigate noise pollution experienced through removing traffic and congestion along the existing routes and the wider strategic road network.
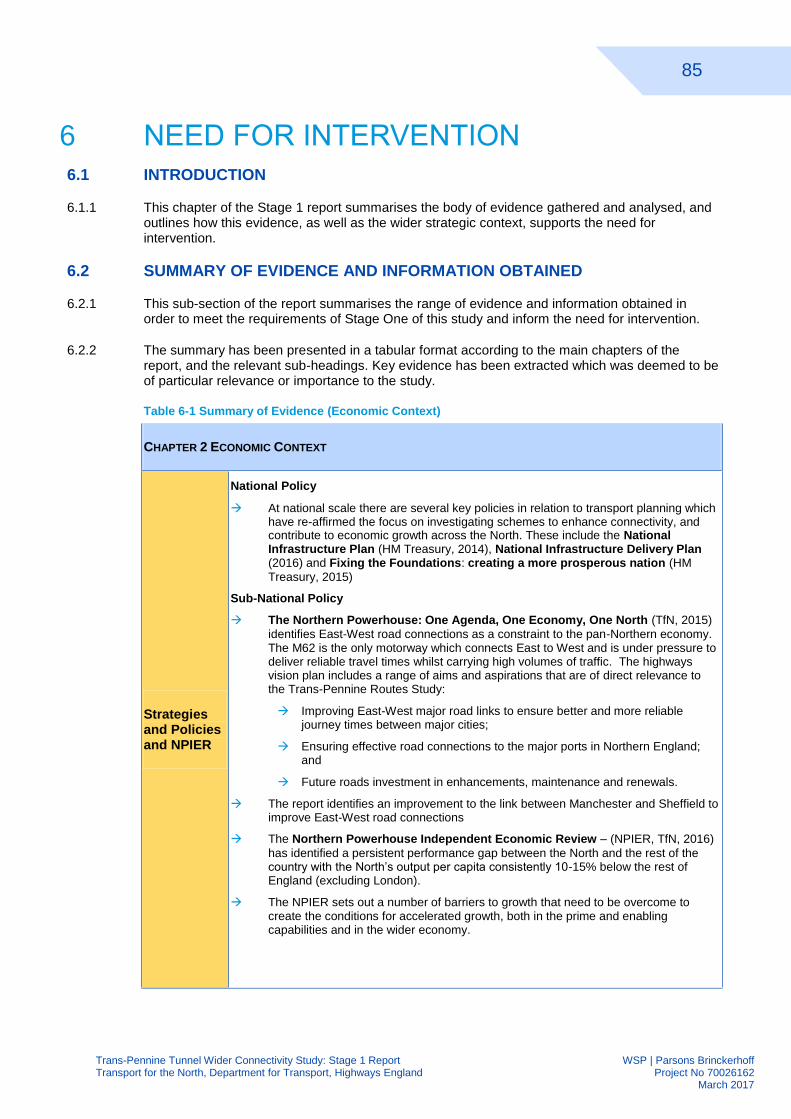
85
Trans-Pennine Tunnel Wider Connectivity Study: Stage 1 Report WSP | Parsons Brinckerhoff Transport for the North, Department for Transport, Highways England Project No 70026162 March 2017
NEED FOR INTERVENTION 6
6.1 INTRODUCTION
This chapter of the Stage 1 report summarises the body of evidence gathered and analysed, and 6.1.1outlines how this evidence, as well as the wider strategic context, supports the need for intervention.
6.2 SUMMARY OF EVIDENCE AND INFORMATION OBTAINED
This sub-section of the report summarises the range of evidence and information obtained in 6.2.1order to meet the requirements of Stage One of this study and inform the need for intervention.
The summary has been presented in a tabular format according to the main chapters of the 6.2.2report, and the relevant sub-headings. Key evidence has been extracted which was deemed to be of particular relevance or importance to the study.
Table 6-1 Summary of Evidence (Economic Context)
CHAPTER 2 ECONOMIC CONTEXT
Strategies and Policies and NPIER
National Policy
At national scale there are several key policies in relation to transport planning which have re-affirmed the focus on investigating schemes to enhance connectivity, and contribute to economic growth across the North. These include the National Infrastructure Plan (HM Treasury, 2014), National Infrastructure Delivery Plan (2016) and Fixing the Foundations: creating a more prosperous nation (HM
Treasury, 2015)
Sub-National Policy
The Northern Powerhouse: One Agenda, One Economy, One North (TfN, 2015)
identifies East-West road connections as a constraint to the pan-Northern economy. The M62 is the only motorway which connects East to West and is under pressure to deliver reliable travel times whilst carrying high volumes of traffic. The highways vision plan includes a range of aims and aspirations that are of direct relevance to the Trans-Pennine Routes Study:
Improving East-West major road links to ensure better and more reliable journey times between major cities;
Ensuring effective road connections to the major ports in Northern England; and
Future roads investment in enhancements, maintenance and renewals.
The report identifies an improvement to the link between Manchester and Sheffield to improve East-West road connections
The Northern Powerhouse Independent Economic Review – (NPIER, TfN, 2016)
has identified a persistent performance gap between the North and the rest of the country with the North’s output per capita consistently 10-15% below the rest of England (excluding London).
The NPIER sets out a number of barriers to growth that need to be overcome to create the conditions for accelerated growth, both in the prime and enabling capabilities and in the wider economy.
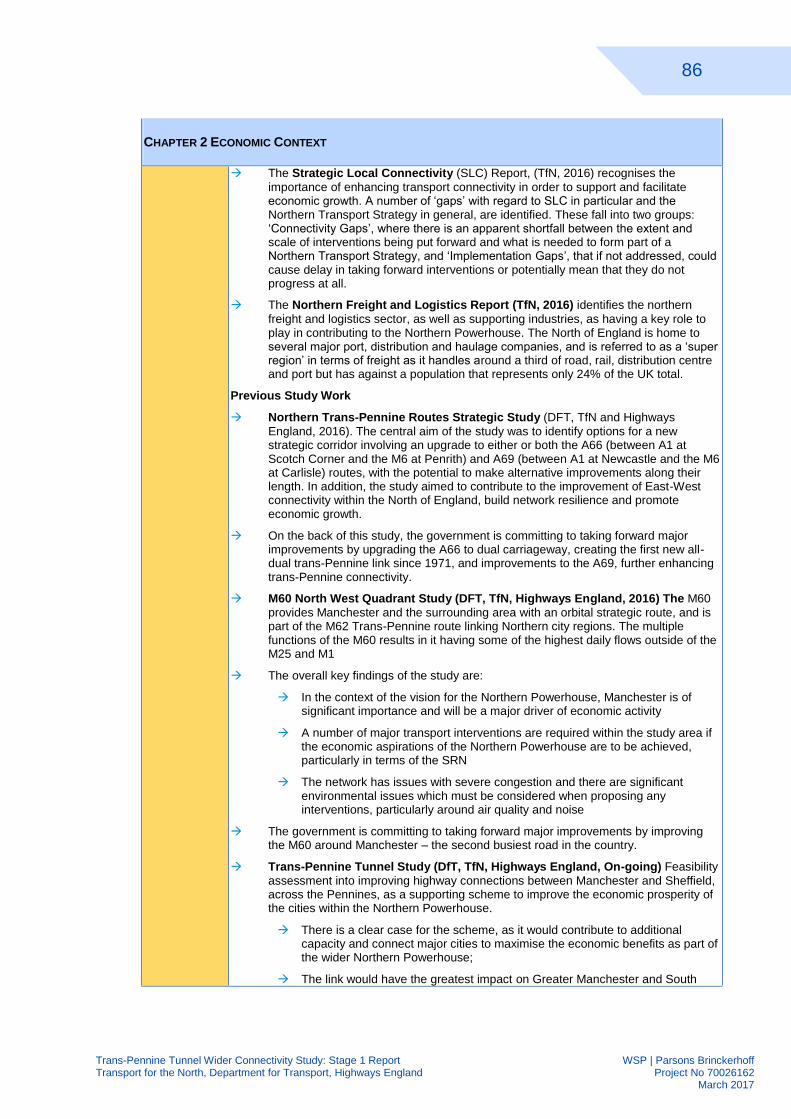
86
Trans-Pennine Tunnel Wider Connectivity Study: Stage 1 Report WSP | Parsons Brinckerhoff Transport for the North, Department for Transport, Highways England Project No 70026162 March 2017
CHAPTER 2 ECONOMIC CONTEXT
The Strategic Local Connectivity (SLC) Report, (TfN, 2016) recognises the
importance of enhancing transport connectivity in order to support and facilitate economic growth. A number of ‘gaps’ with regard to SLC in particular and the Northern Transport Strategy in general, are identified. These fall into two groups: ‘Connectivity Gaps’, where there is an apparent shortfall between the extent and scale of interventions being put forward and what is needed to form part of a Northern Transport Strategy, and ‘Implementation Gaps’, that if not addressed, could cause delay in taking forward interventions or potentially mean that they do not progress at all.
The Northern Freight and Logistics Report (TfN, 2016) identifies the northern
freight and logistics sector, as well as supporting industries, as having a key role to play in contributing to the Northern Powerhouse. The North of England is home to several major port, distribution and haulage companies, and is referred to as a ‘super region’ in terms of freight as it handles around a third of road, rail, distribution centre and port but has against a population that represents only 24% of the UK total.
Previous Study Work
Northern Trans-Pennine Routes Strategic Study (DFT, TfN and Highways
England, 2016). The central aim of the study was to identify options for a new strategic corridor involving an upgrade to either or both the A66 (between A1 at Scotch Corner and the M6 at Penrith) and A69 (between A1 at Newcastle and the M6 at Carlisle) routes, with the potential to make alternative improvements along their length. In addition, the study aimed to contribute to the improvement of East-West connectivity within the North of England, build network resilience and promote economic growth.
On the back of this study, the government is committing to taking forward major improvements by upgrading the A66 to dual carriageway, creating the first new all-dual trans-Pennine link since 1971, and improvements to the A69, further enhancing trans-Pennine connectivity.
M60 North West Quadrant Study (DFT, TfN, Highways England, 2016) The M60
provides Manchester and the surrounding area with an orbital strategic route, and is part of the M62 Trans-Pennine route linking Northern city regions. The multiple functions of the M60 results in it having some of the highest daily flows outside of the M25 and M1
The overall key findings of the study are:
In the context of the vision for the Northern Powerhouse, Manchester is of significant importance and will be a major driver of economic activity
A number of major transport interventions are required within the study area if the economic aspirations of the Northern Powerhouse are to be achieved, particularly in terms of the SRN
The network has issues with severe congestion and there are significant environmental issues which must be considered when proposing any interventions, particularly around air quality and noise
The government is committing to taking forward major improvements by improving the M60 around Manchester – the second busiest road in the country.
Trans-Pennine Tunnel Study (DfT, TfN, Highways England, On-going) Feasibility
assessment into improving highway connections between Manchester and Sheffield, across the Pennines, as a supporting scheme to improve the economic prosperity of the cities within the Northern Powerhouse.
There is a clear case for the scheme, as it would contribute to additional capacity and connect major cities to maximise the economic benefits as part of the wider Northern Powerhouse;
The link would have the greatest impact on Greater Manchester and South
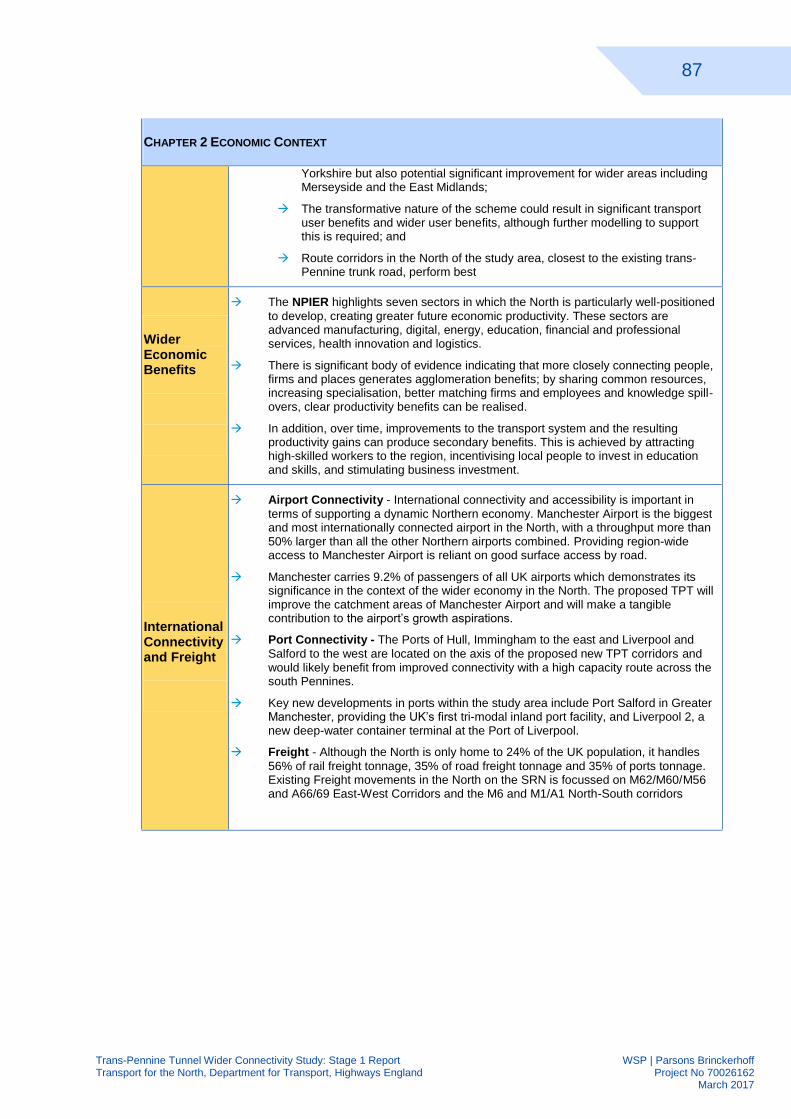
87
Trans-Pennine Tunnel Wider Connectivity Study: Stage 1 Report WSP | Parsons Brinckerhoff Transport for the North, Department for Transport, Highways England Project No 70026162 March 2017
CHAPTER 2 ECONOMIC CONTEXT
Yorkshire but also potential significant improvement for wider areas including Merseyside and the East Midlands;
The transformative nature of the scheme could result in significant transport user benefits and wider user benefits, although further modelling to support this is required; and
Route corridors in the North of the study area, closest to the existing trans-Pennine trunk road, perform best
Wider Economic Benefits
The NPIER highlights seven sectors in which the North is particularly well-positioned
to develop, creating greater future economic productivity. These sectors are advanced manufacturing, digital, energy, education, financial and professional services, health innovation and logistics.
There is significant body of evidence indicating that more closely connecting people, firms and places generates agglomeration benefits; by sharing common resources, increasing specialisation, better matching firms and employees and knowledge spill-overs, clear productivity benefits can be realised.
In addition, over time, improvements to the transport system and the resulting productivity gains can produce secondary benefits. This is achieved by attracting high-skilled workers to the region, incentivising local people to invest in education and skills, and stimulating business investment.
International Connectivity and Freight
Airport Connectivity - International connectivity and accessibility is important in
terms of supporting a dynamic Northern economy. Manchester Airport is the biggest and most internationally connected airport in the North, with a throughput more than 50% larger than all the other Northern airports combined. Providing region-wide access to Manchester Airport is reliant on good surface access by road.
Manchester carries 9.2% of passengers of all UK airports which demonstrates its significance in the context of the wider economy in the North. The proposed TPT will improve the catchment areas of Manchester Airport and will make a tangible contribution to the airport’s growth aspirations.
Port Connectivity - The Ports of Hull, Immingham to the east and Liverpool and
Salford to the west are located on the axis of the proposed new TPT corridors and would likely benefit from improved connectivity with a high capacity route across the south Pennines.
Key new developments in ports within the study area include Port Salford in Greater Manchester, providing the UK’s first tri-modal inland port facility, and Liverpool 2, a new deep-water container terminal at the Port of Liverpool.
Freight - Although the North is only home to 24% of the UK population, it handles
56% of rail freight tonnage, 35% of road freight tonnage and 35% of ports tonnage. Existing Freight movements in the North on the SRN is focussed on M62/M60/M56 and A66/69 East-West Corridors and the M6 and M1/A1 North-South corridors
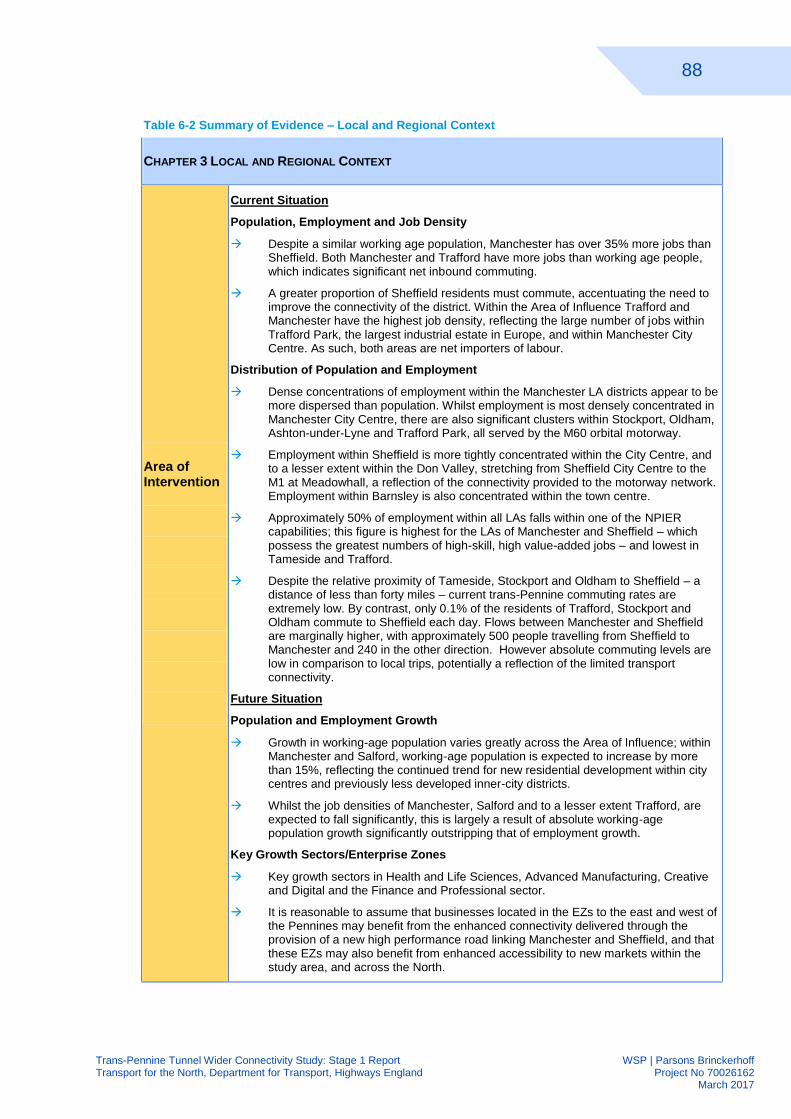
88
Trans-Pennine Tunnel Wider Connectivity Study: Stage 1 Report WSP | Parsons Brinckerhoff Transport for the North, Department for Transport, Highways England Project No 70026162 March 2017
Table 6-2 Summary of Evidence – Local and Regional Context
CHAPTER 3 LOCAL AND REGIONAL CONTEXT
Area of Intervention
Current Situation
Population, Employment and Job Density
Despite a similar working age population, Manchester has over 35% more jobs than Sheffield. Both Manchester and Trafford have more jobs than working age people, which indicates significant net inbound commuting.
A greater proportion of Sheffield residents must commute, accentuating the need to improve the connectivity of the district. Within the Area of Influence Trafford and Manchester have the highest job density, reflecting the large number of jobs within Trafford Park, the largest industrial estate in Europe, and within Manchester City Centre. As such, both areas are net importers of labour.
Distribution of Population and Employment
Dense concentrations of employment within the Manchester LA districts appear to be more dispersed than population. Whilst employment is most densely concentrated in Manchester City Centre, there are also significant clusters within Stockport, Oldham, Ashton-under-Lyne and Trafford Park, all served by the M60 orbital motorway.
Employment within Sheffield is more tightly concentrated within the City Centre, and to a lesser extent within the Don Valley, stretching from Sheffield City Centre to the M1 at Meadowhall, a reflection of the connectivity provided to the motorway network. Employment within Barnsley is also concentrated within the town centre.
Approximately 50% of employment within all LAs falls within one of the NPIER capabilities; this figure is highest for the LAs of Manchester and Sheffield – which possess the greatest numbers of high-skill, high value-added jobs – and lowest in Tameside and Trafford.
Despite the relative proximity of Tameside, Stockport and Oldham to Sheffield – a distance of less than forty miles – current trans-Pennine commuting rates are extremely low. By contrast, only 0.1% of the residents of Trafford, Stockport and Oldham commute to Sheffield each day. Flows between Manchester and Sheffield are marginally higher, with approximately 500 people travelling from Sheffield to Manchester and 240 in the other direction. However absolute commuting levels are low in comparison to local trips, potentially a reflection of the limited transport connectivity.
Future Situation
Population and Employment Growth
Growth in working-age population varies greatly across the Area of Influence; within Manchester and Salford, working-age population is expected to increase by more than 15%, reflecting the continued trend for new residential development within city centres and previously less developed inner-city districts.
Whilst the job densities of Manchester, Salford and to a lesser extent Trafford, are expected to fall significantly, this is largely a result of absolute working-age population growth significantly outstripping that of employment growth.
Key Growth Sectors/Enterprise Zones
Key growth sectors in Health and Life Sciences, Advanced Manufacturing, Creative and Digital and the Finance and Professional sector.
It is reasonable to assume that businesses located in the EZs to the east and west of the Pennines may benefit from the enhanced connectivity delivered through the provision of a new high performance road linking Manchester and Sheffield, and that these EZs may also benefit from enhanced accessibility to new markets within the study area, and across the North.
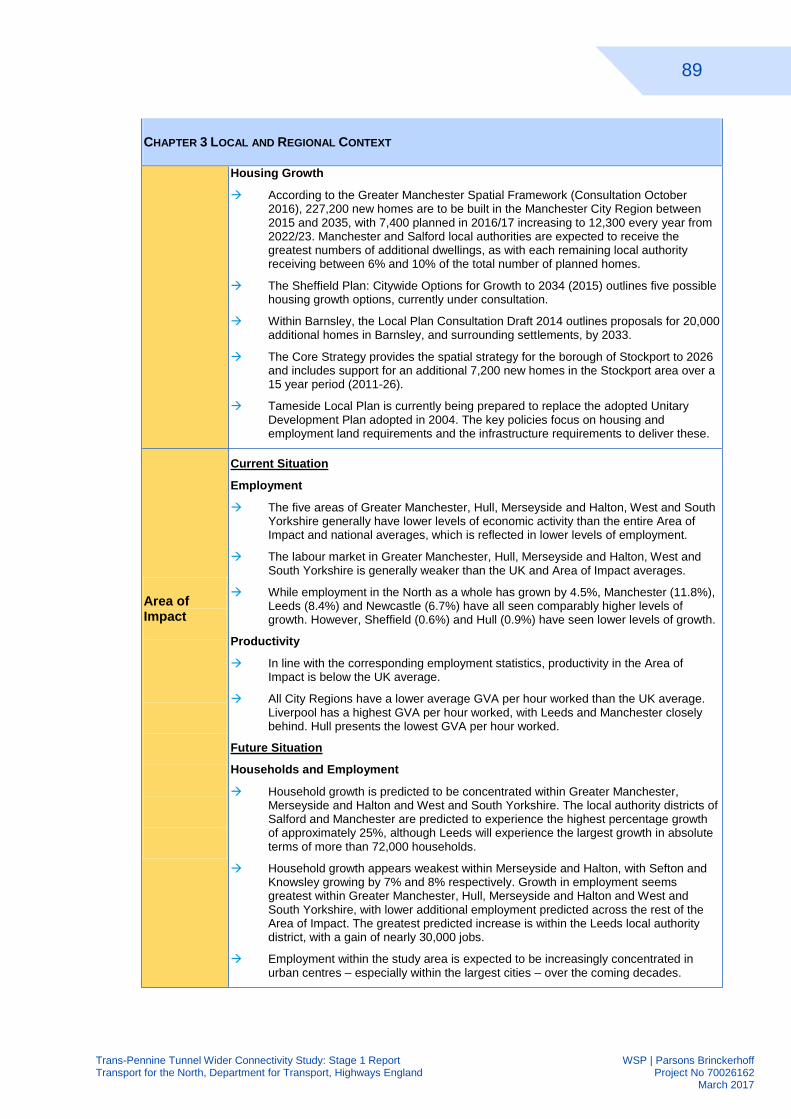
89
Trans-Pennine Tunnel Wider Connectivity Study: Stage 1 Report WSP | Parsons Brinckerhoff Transport for the North, Department for Transport, Highways England Project No 70026162 March 2017
CHAPTER 3 LOCAL AND REGIONAL CONTEXT
Housing Growth
According to the Greater Manchester Spatial Framework (Consultation October 2016), 227,200 new homes are to be built in the Manchester City Region between 2015 and 2035, with 7,400 planned in 2016/17 increasing to 12,300 every year from 2022/23. Manchester and Salford local authorities are expected to receive the greatest numbers of additional dwellings, as with each remaining local authority receiving between 6% and 10% of the total number of planned homes.
The Sheffield Plan: Citywide Options for Growth to 2034 (2015) outlines five possible housing growth options, currently under consultation.
Within Barnsley, the Local Plan Consultation Draft 2014 outlines proposals for 20,000 additional homes in Barnsley, and surrounding settlements, by 2033.
The Core Strategy provides the spatial strategy for the borough of Stockport to 2026 and includes support for an additional 7,200 new homes in the Stockport area over a 15 year period (2011-26).
Tameside Local Plan is currently being prepared to replace the adopted Unitary Development Plan adopted in 2004. The key policies focus on housing and employment land requirements and the infrastructure requirements to deliver these.
Area of Impact
Current Situation
Employment
The five areas of Greater Manchester, Hull, Merseyside and Halton, West and South Yorkshire generally have lower levels of economic activity than the entire Area of Impact and national averages, which is reflected in lower levels of employment.
The labour market in Greater Manchester, Hull, Merseyside and Halton, West and South Yorkshire is generally weaker than the UK and Area of Impact averages.
While employment in the North as a whole has grown by 4.5%, Manchester (11.8%), Leeds (8.4%) and Newcastle (6.7%) have all seen comparably higher levels of growth. However, Sheffield (0.6%) and Hull (0.9%) have seen lower levels of growth.
Productivity
In line with the corresponding employment statistics, productivity in the Area of Impact is below the UK average.
All City Regions have a lower average GVA per hour worked than the UK average. Liverpool has a highest GVA per hour worked, with Leeds and Manchester closely behind. Hull presents the lowest GVA per hour worked.
Future Situation
Households and Employment
Household growth is predicted to be concentrated within Greater Manchester, Merseyside and Halton and West and South Yorkshire. The local authority districts of Salford and Manchester are predicted to experience the highest percentage growth of approximately 25%, although Leeds will experience the largest growth in absolute terms of more than 72,000 households.
Household growth appears weakest within Merseyside and Halton, with Sefton and Knowsley growing by 7% and 8% respectively. Growth in employment seems greatest within Greater Manchester, Hull, Merseyside and Halton and West and South Yorkshire, with lower additional employment predicted across the rest of the Area of Impact. The greatest predicted increase is within the Leeds local authority district, with a gain of nearly 30,000 jobs.
Employment within the study area is expected to be increasingly concentrated in urban centres – especially within the largest cities – over the coming decades.
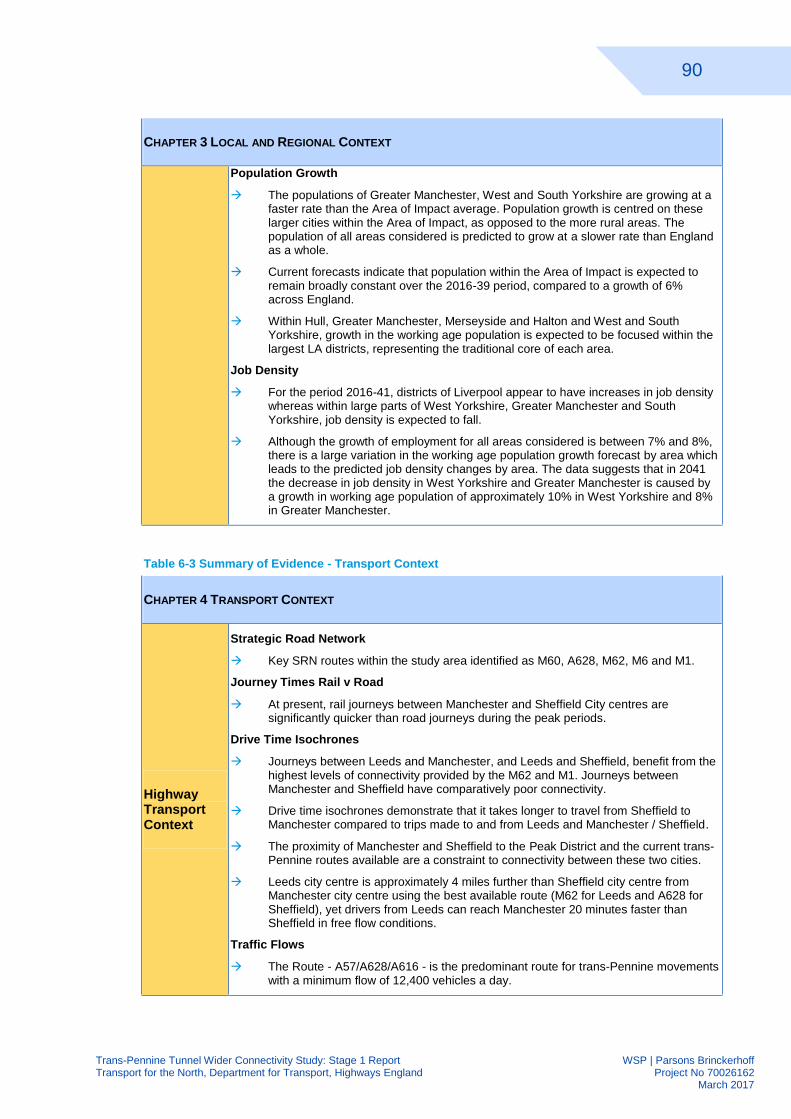
90
Trans-Pennine Tunnel Wider Connectivity Study: Stage 1 Report WSP | Parsons Brinckerhoff Transport for the North, Department for Transport, Highways England Project No 70026162 March 2017
CHAPTER 3 LOCAL AND REGIONAL CONTEXT
Population Growth
The populations of Greater Manchester, West and South Yorkshire are growing at a faster rate than the Area of Impact average. Population growth is centred on these larger cities within the Area of Impact, as opposed to the more rural areas. The population of all areas considered is predicted to grow at a slower rate than England as a whole.
Current forecasts indicate that population within the Area of Impact is expected to remain broadly constant over the 2016-39 period, compared to a growth of 6% across England.
Within Hull, Greater Manchester, Merseyside and Halton and West and South Yorkshire, growth in the working age population is expected to be focused within the largest LA districts, representing the traditional core of each area.
Job Density
For the period 2016-41, districts of Liverpool appear to have increases in job density whereas within large parts of West Yorkshire, Greater Manchester and South Yorkshire, job density is expected to fall.
Although the growth of employment for all areas considered is between 7% and 8%, there is a large variation in the working age population growth forecast by area which leads to the predicted job density changes by area. The data suggests that in 2041 the decrease in job density in West Yorkshire and Greater Manchester is caused by a growth in working age population of approximately 10% in West Yorkshire and 8% in Greater Manchester.
Table 6-3 Summary of Evidence - Transport Context
CHAPTER 4 TRANSPORT CONTEXT
Highway Transport Context
Strategic Road Network
Key SRN routes within the study area identified as M60, A628, M62, M6 and M1.
Journey Times Rail v Road
At present, rail journeys between Manchester and Sheffield City centres are significantly quicker than road journeys during the peak periods.
Drive Time Isochrones
Journeys between Leeds and Manchester, and Leeds and Sheffield, benefit from the highest levels of connectivity provided by the M62 and M1. Journeys between Manchester and Sheffield have comparatively poor connectivity.
Drive time isochrones demonstrate that it takes longer to travel from Sheffield to Manchester compared to trips made to and from Leeds and Manchester / Sheffield.
The proximity of Manchester and Sheffield to the Peak District and the current trans-Pennine routes available are a constraint to connectivity between these two cities.
Leeds city centre is approximately 4 miles further than Sheffield city centre from Manchester city centre using the best available route (M62 for Leeds and A628 for Sheffield), yet drivers from Leeds can reach Manchester 20 minutes faster than Sheffield in free flow conditions.
Traffic Flows
The Route - A57/A628/A616 - is the predominant route for trans-Pennine movements with a minimum flow of 12,400 vehicles a day.
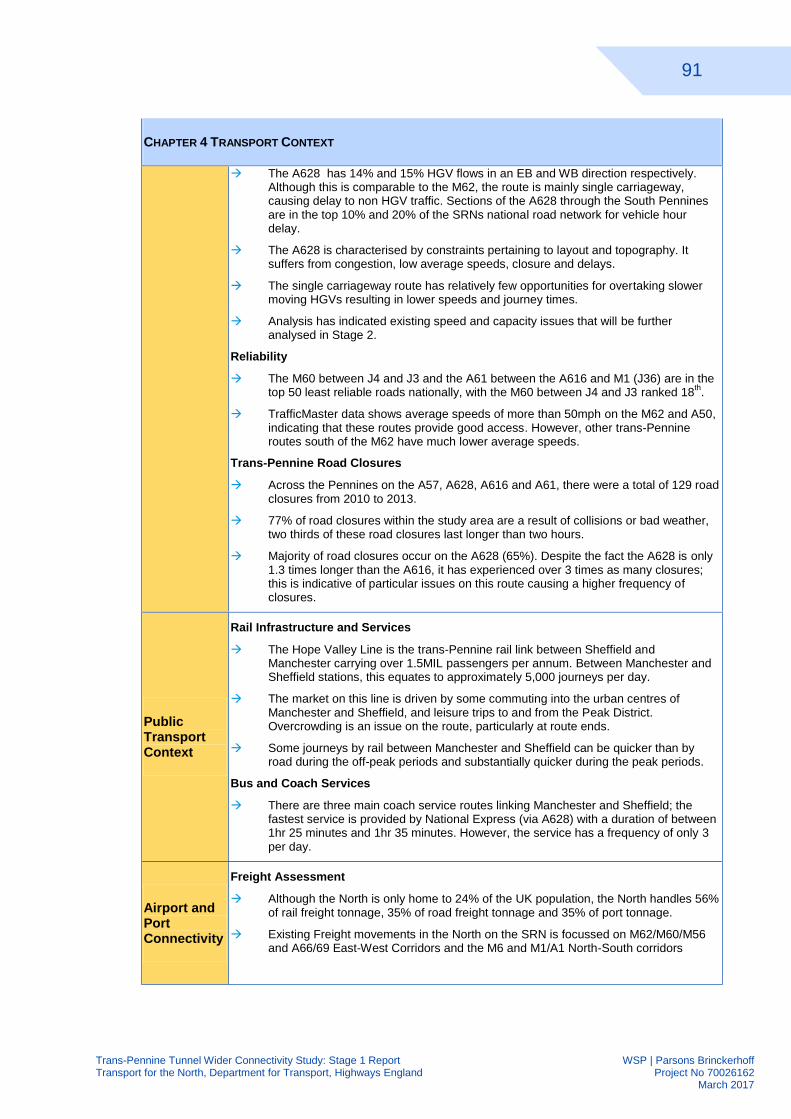
91
Trans-Pennine Tunnel Wider Connectivity Study: Stage 1 Report WSP | Parsons Brinckerhoff Transport for the North, Department for Transport, Highways England Project No 70026162 March 2017
CHAPTER 4 TRANSPORT CONTEXT
The A628 has 14% and 15% HGV flows in an EB and WB direction respectively. Although this is comparable to the M62, the route is mainly single carriageway, causing delay to non HGV traffic. Sections of the A628 through the South Pennines are in the top 10% and 20% of the SRNs national road network for vehicle hour delay.
The A628 is characterised by constraints pertaining to layout and topography. It suffers from congestion, low average speeds, closure and delays.
The single carriageway route has relatively few opportunities for overtaking slower moving HGVs resulting in lower speeds and journey times.
Analysis has indicated existing speed and capacity issues that will be further analysed in Stage 2.
Reliability
The M60 between J4 and J3 and the A61 between the A616 and M1 (J36) are in the top 50 least reliable roads nationally, with the M60 between J4 and J3 ranked 18
th.
TrafficMaster data shows average speeds of more than 50mph on the M62 and A50, indicating that these routes provide good access. However, other trans-Pennine routes south of the M62 have much lower average speeds.
Trans-Pennine Road Closures
Across the Pennines on the A57, A628, A616 and A61, there were a total of 129 road closures from 2010 to 2013.
77% of road closures within the study area are a result of collisions or bad weather, two thirds of these road closures last longer than two hours.
Majority of road closures occur on the A628 (65%). Despite the fact the A628 is only 1.3 times longer than the A616, it has experienced over 3 times as many closures; this is indicative of particular issues on this route causing a higher frequency of closures.
Public Transport Context
Rail Infrastructure and Services
The Hope Valley Line is the trans-Pennine rail link between Sheffield and Manchester carrying over 1.5MIL passengers per annum. Between Manchester and Sheffield stations, this equates to approximately 5,000 journeys per day.
The market on this line is driven by some commuting into the urban centres of Manchester and Sheffield, and leisure trips to and from the Peak District. Overcrowding is an issue on the route, particularly at route ends.
Some journeys by rail between Manchester and Sheffield can be quicker than by road during the off-peak periods and substantially quicker during the peak periods.
Bus and Coach Services
There are three main coach service routes linking Manchester and Sheffield; the fastest service is provided by National Express (via A628) with a duration of between 1hr 25 minutes and 1hr 35 minutes. However, the service has a frequency of only 3 per day.
Airport and Port Connectivity
Freight Assessment
Although the North is only home to 24% of the UK population, the North handles 56% of rail freight tonnage, 35% of road freight tonnage and 35% of port tonnage.
Existing Freight movements in the North on the SRN is focussed on M62/M60/M56 and A66/69 East-West Corridors and the M6 and M1/A1 North-South corridors
92
Trans-Pennine Tunnel Wider Connectivity Study: Stage 1 Report WSP | Parsons Brinckerhoff Transport for the North, Department for Transport, Highways England Project No 70026162 March 2017
CHAPTER 4 TRANSPORT CONTEXT
Airport Connectivity
Manchester Airport is the most heavily trafficked of all the airports within the study area, with a significantly higher number of terminal passengers and high levels of freight and mail traffic.
Manchester carries 9.2% of passengers of all UK airports which demonstrates its significance in the context of the wider economy in the North.
The proposed TPT will improve the catchment areas of Manchester Airport and will make a tangible contribution to the airport’s growth aspirations.
East Midlands airport is also of importance as it deals with the greatest volume of freight. It is the busiest cargo airport in the UK and is the UK hub for DHL, TNT, UPS and Royal Mail.
Port Connectivity
The Ports of Hull, Immingham to the east and Liverpool, Salford to the west are located on the axis of the proposed new TPT corridors and would likely benefit from improved connectivity with a high capacity route across the south Pennines.
Key new developments in ports within the study area include Port Salford in Manchester providing the UK’s first tri-modal inland port facility, and Liverpool 2 which is providing a new deep-water container terminal at the Port of Liverpool.
Future Demand and Area of Influence
TEMPRO Analysis
Between 2016 – 2041, there are expected to be substantial increases in car drivers for both the AM and PM peaks (over 35% increases in some areas). These are largely concentrated around the key urban conurbations of Manchester, Leeds and Sheffield. This will lead to increased demand to travel by road.
The analysis indicates a reduction in growth in terms of bus and coach patronage in both the AM and PM peaks, with the exception of some localities to the south of the study area.
In terms of rail/metro, growth rates vary across the study area during the peak hours. However, it is important to note the initiatives in Manchester and Sheffield pertaining to light rail expansion, such a second Metrolink line through Manchester city centre.
There is planned substantial housing growth up to 2041 within the study area.
Future Traffic Flows and Impact of Tunnel
Previous study work indicates a re-assignment of trips away from the M62 with improved trans-Pennine connectivity provided by the TPT. There are notable increases in traffic flow on multiple roads within the immediate study area such as the M60 orbital motorway, the M67 which links with some of the shortlisted TPT corridors and, to the east of the study area, the A616, A61 and M1.
Trans-Pennine road links would benefit from reduced flows from the TPT, as much of the traffic currently using these links would be re-assigned to the new road link.
Journey Times and Impact of Tunnel
There are significant improvements in journey times associated with shortlisted TPT corridor options for Manchester, Sheffield and Leeds.
Drive time catchment areas increase for origins in Manchester and Sheffield, meaning that people can drive further within the same journey time.
Tunnel Impact on Freight
Based on an improvement in average speed from 30mph to 60mph, the TPT has the potential to save up to 30 minutes per journey.
Indirect impacts include decongestion benefits on other routes in the area, and
93
Trans-Pennine Tunnel Wider Connectivity Study: Stage 1 Report WSP | Parsons Brinckerhoff Transport for the North, Department for Transport, Highways England Project No 70026162 March 2017
CHAPTER 4 TRANSPORT CONTEXT
benefits from improved levels of network reliability.
The TPT would have an immediate impact in terms of reducing the costs of operation and unreliability for all vehicles diverting from other routes.
The new route would create a new dynamic between Sheffield and Manchester where it is thought that there is currently suppressed demand for HGV movements as demonstrated by the current low levels of trade between these areas.
The TPT would also deliver benefits in terms of future potential for logistics centres to be located in South Yorkshire, and it will improve the distribution network used by Northern ports.
Table 6-4 Summary of Evidence - Environmental Evidence
CHAPTER 5 ENVIRONMENTAL EVIDENCE
The study area contains the Peak District National Park which is a nationally protected area. The National Park landscape is important to the regional’s health and well-being, making a significant contribution to the economy as well as providing an attractive place for people to live, work, visit and enjoy.
As part of evidence gathering, comprehensive mapping of environmental constraints within the immediate area of intervention has been undertaken. This includes mapping air quality management areas (AQMAs), special areas of conservation (SPCs), special protection areas (SPAs) and nature improvement areas (NIAs).
Interventions can also provide a range of opportunities for environmental improvements in the study area. The environmental impacts of potential interventions will be considered in more detail in the remaining stages of the study.
Following the body of evidence gathered, as summarised in this chapter, the next and final 6.2.3chapter of the report (Chapter 7) provides a preliminary view on the range of interventions which may be required within the area of intervention.
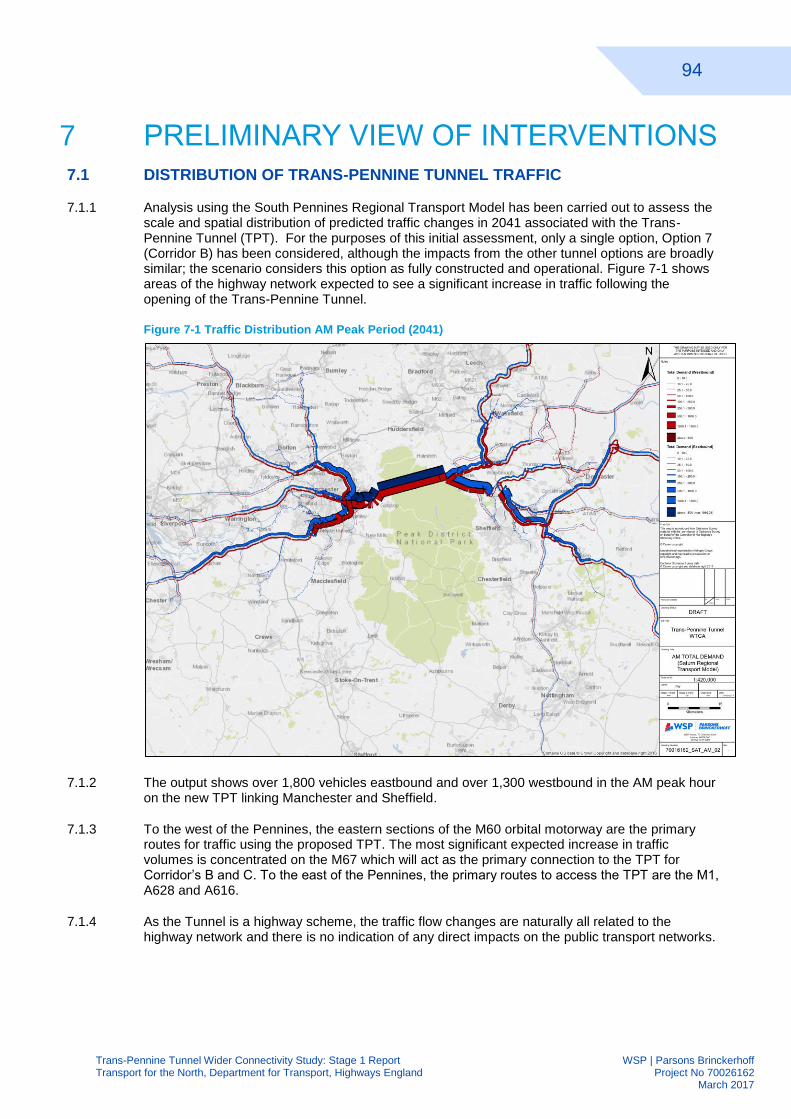
94
Trans-Pennine Tunnel Wider Connectivity Study: Stage 1 Report WSP | Parsons Brinckerhoff Transport for the North, Department for Transport, Highways England Project No 70026162 March 2017
PRELIMINARY VIEW OF INTERVENTIONS 7
7.1 DISTRIBUTION OF TRANS-PENNINE TUNNEL TRAFFIC
Analysis using the South Pennines Regional Transport Model has been carried out to assess the 7.1.1scale and spatial distribution of predicted traffic changes in 2041 associated with the Trans-Pennine Tunnel (TPT). For the purposes of this initial assessment, only a single option, Option 7 (Corridor B) has been considered, although the impacts from the other tunnel options are broadly similar; the scenario considers this option as fully constructed and operational. Figure 7-1 shows areas of the highway network expected to see a significant increase in traffic following the opening of the Trans-Pennine Tunnel.
Figure 7-1 Traffic Distribution AM Peak Period (2041)
The output shows over 1,800 vehicles eastbound and over 1,300 westbound in the AM peak hour 7.1.2on the new TPT linking Manchester and Sheffield.
To the west of the Pennines, the eastern sections of the M60 orbital motorway are the primary 7.1.3routes for traffic using the proposed TPT. The most significant expected increase in traffic volumes is concentrated on the M67 which will act as the primary connection to the TPT for Corridor’s B and C. To the east of the Pennines, the primary routes to access the TPT are the M1, A628 and A616.
As the Tunnel is a highway scheme, the traffic flow changes are naturally all related to the 7.1.4highway network and there is no indication of any direct impacts on the public transport networks.
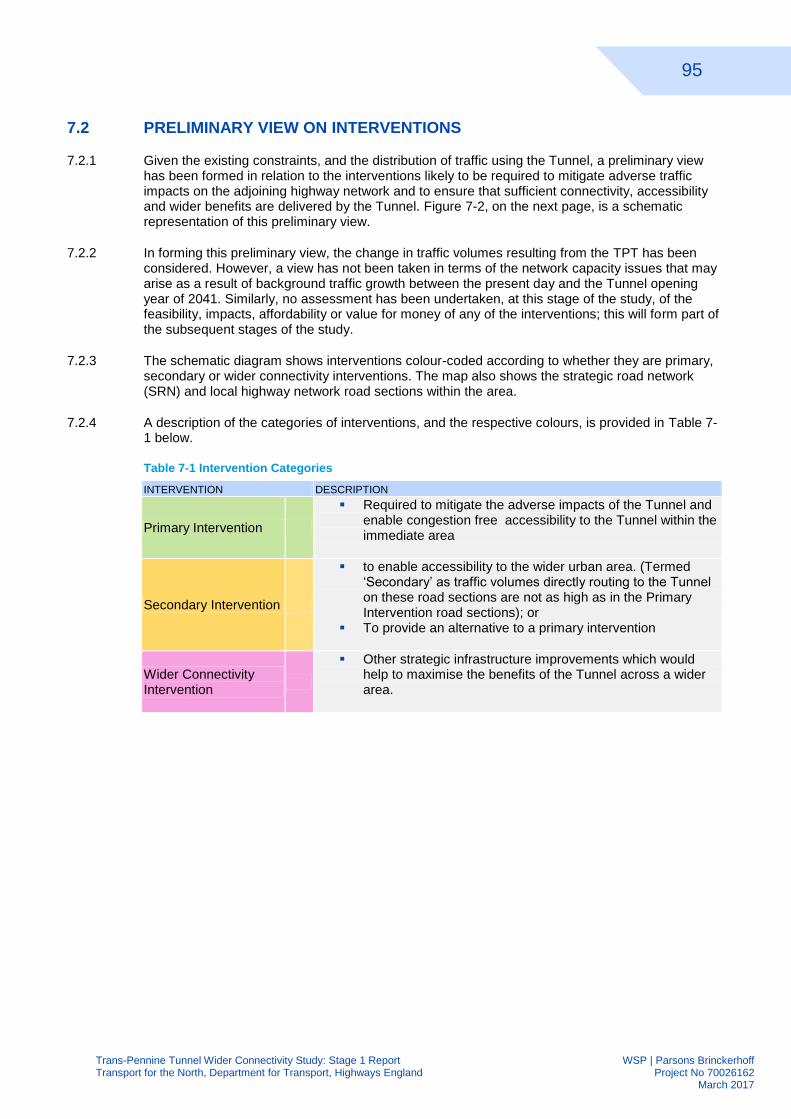
95
Trans-Pennine Tunnel Wider Connectivity Study: Stage 1 Report WSP | Parsons Brinckerhoff Transport for the North, Department for Transport, Highways England Project No 70026162 March 2017
7.2 PRELIMINARY VIEW ON INTERVENTIONS
Given the existing constraints, and the distribution of traffic using the Tunnel, a preliminary view 7.2.1has been formed in relation to the interventions likely to be required to mitigate adverse traffic impacts on the adjoining highway network and to ensure that sufficient connectivity, accessibility and wider benefits are delivered by the Tunnel. Figure 7-2, on the next page, is a schematic representation of this preliminary view.
In forming this preliminary view, the change in traffic volumes resulting from the TPT has been 7.2.2considered. However, a view has not been taken in terms of the network capacity issues that may arise as a result of background traffic growth between the present day and the Tunnel opening year of 2041. Similarly, no assessment has been undertaken, at this stage of the study, of the feasibility, impacts, affordability or value for money of any of the interventions; this will form part of the subsequent stages of the study.
The schematic diagram shows interventions colour-coded according to whether they are primary, 7.2.3secondary or wider connectivity interventions. The map also shows the strategic road network (SRN) and local highway network road sections within the area.
A description of the categories of interventions, and the respective colours, is provided in Table 7-7.2.41 below.
Table 7-1 Intervention Categories
INTERVENTION DESCRIPTION
Primary Intervention i
Required to mitigate the adverse impacts of the Tunnel and enable congestion free accessibility to the Tunnel within the immediate area
Secondary Intervention
to enable accessibility to the wider urban area. (Termed ‘Secondary’ as traffic volumes directly routing to the Tunnel on these road sections are not as high as in the Primary Intervention road sections); or
To provide an alternative to a primary intervention
Wider Connectivity Intervention
Other strategic infrastructure improvements which would help to maximise the benefits of the Tunnel across a wider area.
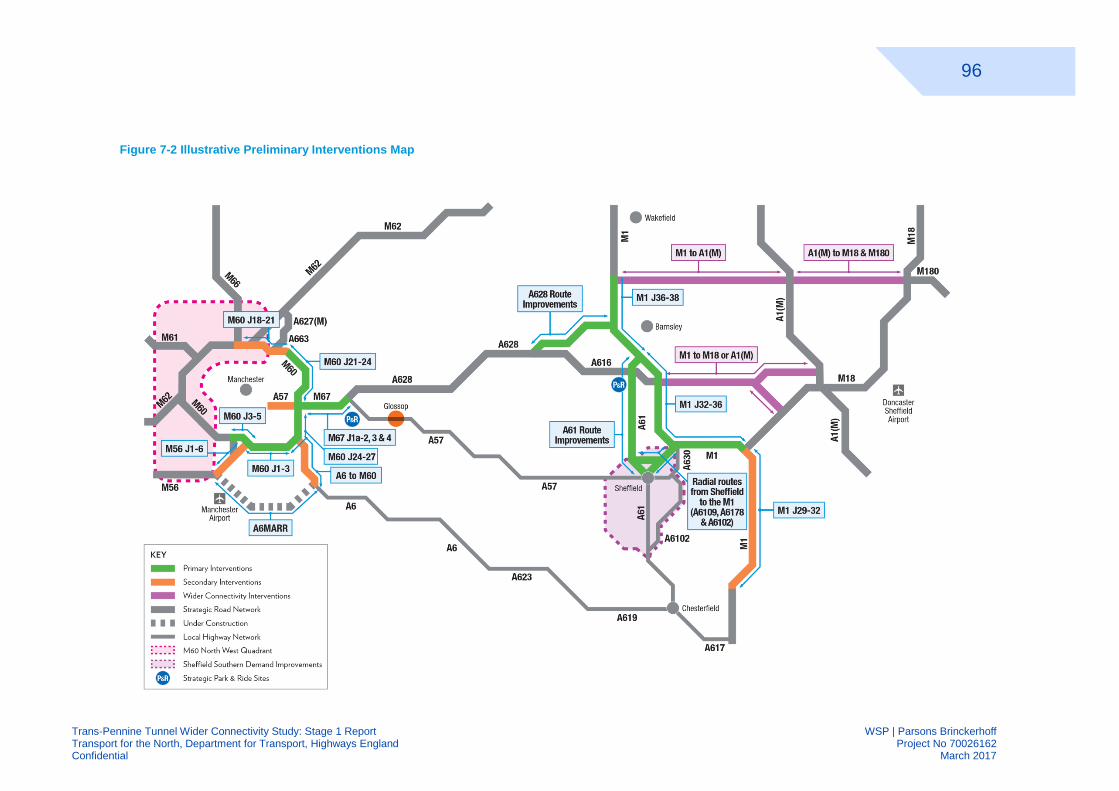
96
Trans-Pennine Tunnel Wider Connectivity Study: Stage 1 Report WSP | Parsons Brinckerhoff Transport for the North, Department for Transport, Highways England Project No 70026162 Confidential March 2017
Figure 7-2 Illustrative Preliminary Interventions Map
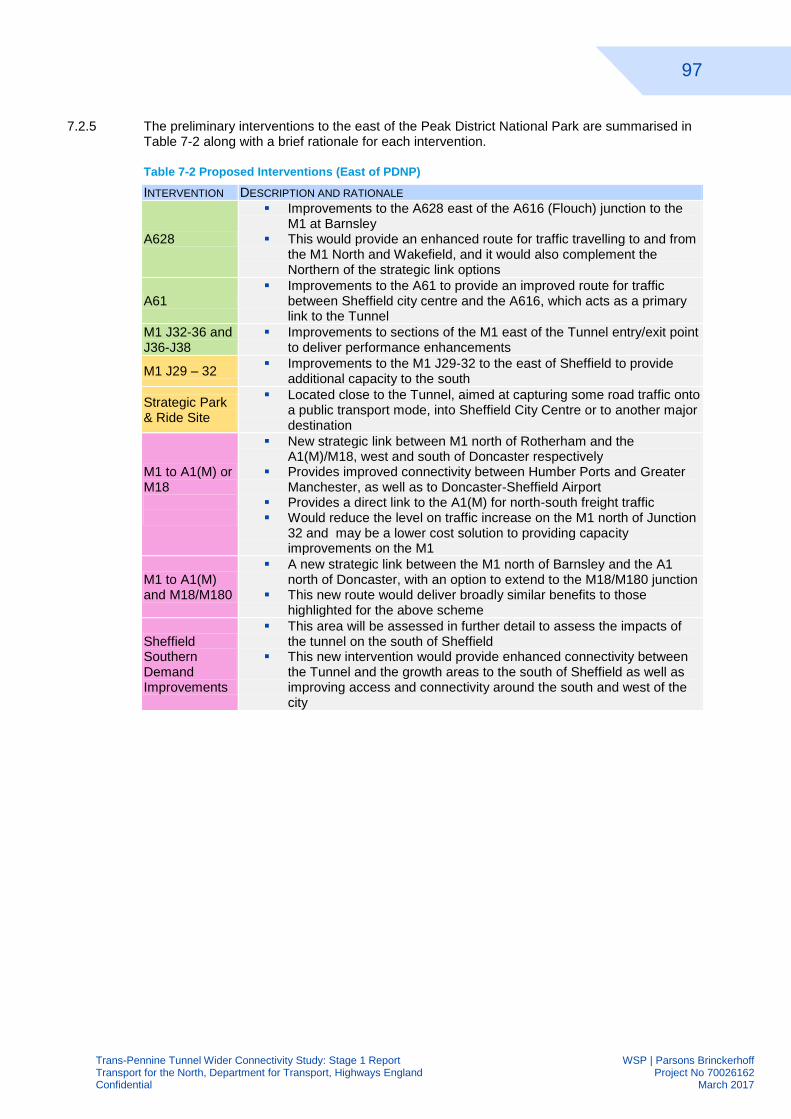
97
Trans-Pennine Tunnel Wider Connectivity Study: Stage 1 Report WSP | Parsons Brinckerhoff Transport for the North, Department for Transport, Highways England Project No 70026162 Confidential March 2017
The preliminary interventions to the east of the Peak District National Park are summarised in 7.2.5Table 7-2 along with a brief rationale for each intervention.
Table 7-2 Proposed Interventions (East of PDNP)
INTERVENTION DESCRIPTION AND RATIONALE
A628
Improvements to the A628 east of the A616 (Flouch) junction to the M1 at Barnsley
This would provide an enhanced route for traffic travelling to and from the M1 North and Wakefield, and it would also complement the Northern of the strategic link options
A61 Improvements to the A61 to provide an improved route for traffic
between Sheffield city centre and the A616, which acts as a primary link to the Tunnel
M1 J32-36 and J36-J38
Improvements to sections of the M1 east of the Tunnel entry/exit point to deliver performance enhancements
M1 J29 – 32 Improvements to the M1 J29-32 to the east of Sheffield to provide
additional capacity to the south
Strategic Park & Ride Site
Located close to the Tunnel, aimed at capturing some road traffic onto a public transport mode, into Sheffield City Centre or to another major destination
M1 to A1(M) or M18
New strategic link between M1 north of Rotherham and the A1(M)/M18, west and south of Doncaster respectively
Provides improved connectivity between Humber Ports and Greater Manchester, as well as to Doncaster-Sheffield Airport
Provides a direct link to the A1(M) for north-south freight traffic Would reduce the level on traffic increase on the M1 north of Junction
32 and may be a lower cost solution to providing capacity improvements on the M1
M1 to A1(M) and M18/M180
A new strategic link between the M1 north of Barnsley and the A1 north of Doncaster, with an option to extend to the M18/M180 junction
This new route would deliver broadly similar benefits to those highlighted for the above scheme
Sheffield Southern Demand Improvements
This area will be assessed in further detail to assess the impacts of the tunnel on the south of Sheffield
This new intervention would provide enhanced connectivity between the Tunnel and the growth areas to the south of Sheffield as well as improving access and connectivity around the south and west of the city
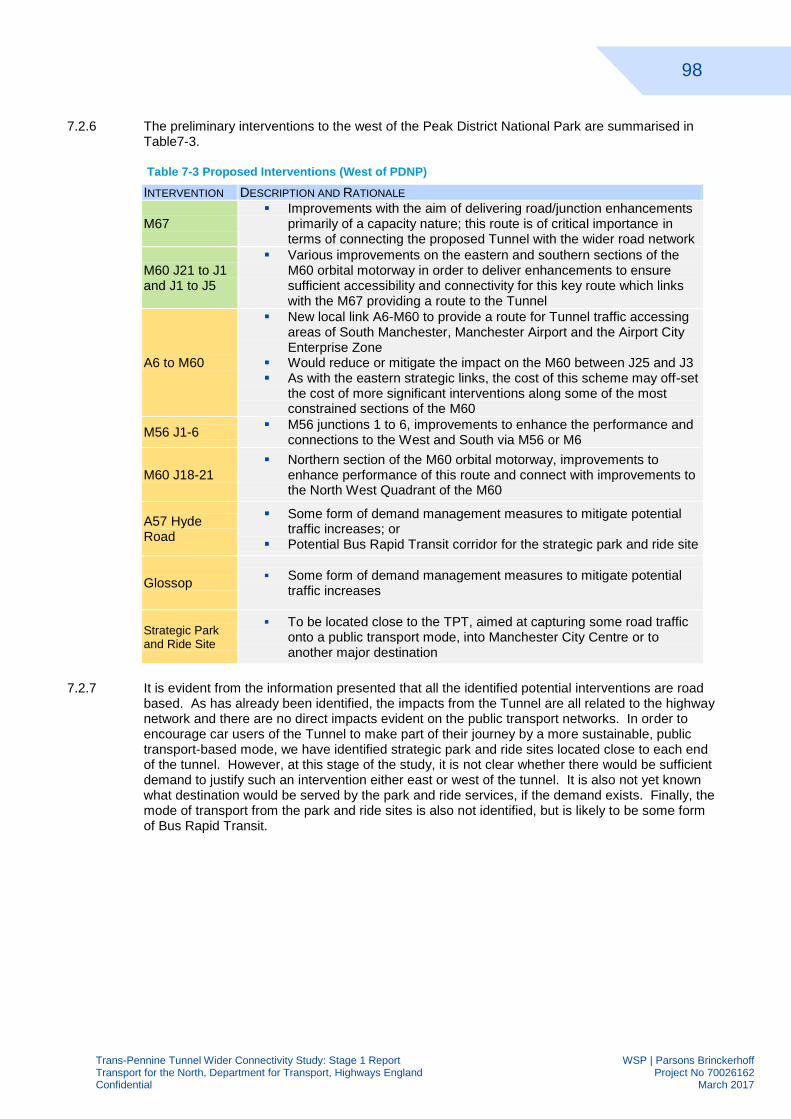
98
Trans-Pennine Tunnel Wider Connectivity Study: Stage 1 Report WSP | Parsons Brinckerhoff Transport for the North, Department for Transport, Highways England Project No 70026162 Confidential March 2017
The preliminary interventions to the west of the Peak District National Park are summarised in 7.2.6Table7-3.
Table 7-3 Proposed Interventions (West of PDNP)
INTERVENTION DESCRIPTION AND RATIONALE
M67 Improvements with the aim of delivering road/junction enhancements
primarily of a capacity nature; this route is of critical importance in terms of connecting the proposed Tunnel with the wider road network
M60 J21 to J1 and J1 to J5
Various improvements on the eastern and southern sections of the M60 orbital motorway in order to deliver enhancements to ensure sufficient accessibility and connectivity for this key route which links with the M67 providing a route to the Tunnel
A6 to M60
New local link A6-M60 to provide a route for Tunnel traffic accessing areas of South Manchester, Manchester Airport and the Airport City Enterprise Zone
Would reduce or mitigate the impact on the M60 between J25 and J3 As with the eastern strategic links, the cost of this scheme may off-set
the cost of more significant interventions along some of the most constrained sections of the M60
M56 J1-6 M56 junctions 1 to 6, improvements to enhance the performance and
connections to the West and South via M56 or M6
M60 J18-21 Northern section of the M60 orbital motorway, improvements to
enhance performance of this route and connect with improvements to the North West Quadrant of the M60
A57 Hyde Road
Some form of demand management measures to mitigate potential traffic increases; or
Potential Bus Rapid Transit corridor for the strategic park and ride site
Glossop Some form of demand management measures to mitigate potential
traffic increases
Strategic Park and Ride Site
To be located close to the TPT, aimed at capturing some road traffic onto a public transport mode, into Manchester City Centre or to another major destination
It is evident from the information presented that all the identified potential interventions are road 7.2.7based. As has already been identified, the impacts from the Tunnel are all related to the highway network and there are no direct impacts evident on the public transport networks. In order to encourage car users of the Tunnel to make part of their journey by a more sustainable, public transport-based mode, we have identified strategic park and ride sites located close to each end of the tunnel. However, at this stage of the study, it is not clear whether there would be sufficient demand to justify such an intervention either east or west of the tunnel. It is also not yet known what destination would be served by the park and ride services, if the demand exists. Finally, the mode of transport from the park and ride sites is also not identified, but is likely to be some form of Bus Rapid Transit.
99
Trans-Pennine Tunnel Wider Connectivity Study: Stage 1 Report WSP | Parsons Brinckerhoff Transport for the North, Department for Transport, Highways England Project No 70026162 Confidential March 2017
WIDER CONNECTIVITY
A key task of the TPT WTCA study is to understand whether additional transport investment could 7.2.8extend the benefits of the Tunnel across a much wider area, beyond the Manchester and Sheffield City Regions. Based on the information available to date, a preliminary view on this wider investment has been taken and these interventions are also included within Table 7-2 and 7-3.
East of the Tunnel, three new interventions have been identified. Two of these comprise new 7.2.9east-west strategic links and are alternatives that may depend upon the Tunnel options eventually selected.
The southern intervention consists of a new strategic link between the M1 north of Rotherham 7.2.10and the A1(M) or the M18 at Doncaster. Initial traffic forecasts indicate a significant level of traffic travelling south along the M18 and then north along the M1 to access the Tunnel. Such a route would cater for this traffic and provide improved connectivity via the Tunnel between Humber Ports and Greater Manchester, as well as to Doncaster-Sheffield Airport. It would also provide a direct link to the A1(M) for north-south freight traffic from the North West. This route would take traffic off the M18 and M1 between Doncaster and the Tunnel, along a route up to 15km shorter than the current route via the M1 and M18 and provide a significant benefit to freight traffic. This route would also lead to a reduction in the level on traffic increase on the M1 north of Junction 32 and this may avoid the need for a more substantial capacity improvement on the M1.
The second alternative option, a more northerly route providing a new strategic link between the 7.2.11M1 north of Barnsley and the A1 north of Doncaster, with an option to extend to the M18/M180 junction. This route would deliver broadly similar benefits to those highlighted for the southern route, saving a distance of about 12km for traffic travelling through the tunnel to the M18/M180 junction, compared to the current route via the M1 and M18.
The third intervention is Sheffield Southern Demand Improvements. This area will be assessed in 7.2.12further detail to assess the impacts of the tunnel on the south of Sheffield. This new intervention would provide enhanced connectivity between the Tunnel and the growth areas to the south of Sheffield as well as improving access and connectivity around the south and west of the city.
Compared to east of the Pennines, a significantly better east-west road network already exists in 7.2.13the west beyond the M60 motorway. This includes the M62 motorway to Liverpool, the M56 to Chester which also provides links into the Wirral and North Wales as well as the A580 and the M58 providing access to north Merseyside areas. For trans-Pennine traffic using the Tunnel, all of these routes are accessed via the M60 Ring Road, which is heavily congested and would be the main constraint to accessing that wider east-west network.
In terms of improving wider connectivity beyond Greater Manchester, the available evidence 7.2.14suggests that this should be focussed on relieving the constraint caused by the M60. As such, the preliminary interventions focus on the eastern half of the M60 motorway. However, it is recognised that in order to access most of the strategic routes to the west of the M60, traffic would have to travel along the western part of the M60 Ring Road. It is also acknowledged that sections of this western part of the M60 are amongst some of the most congested and within the top 10% of least reliable motorway links in the country. The M62 immediately to the west of the M60 is also amongst the least reliable motorway links but this is largely related to the interaction with the congested M60.
The congested, western (and northern) sections of the M60 are currently the subject of a national 7.2.15strategic study: the M60 North West Quadrant Study. A summary of the interventions being considered by that study is provided below. It is expected that the interventions taken forward from that study will address the issues of congestion on the northern/western half of the M60 and will also resolve associated current congestion issues on the M62 immediately to the west of the M60.
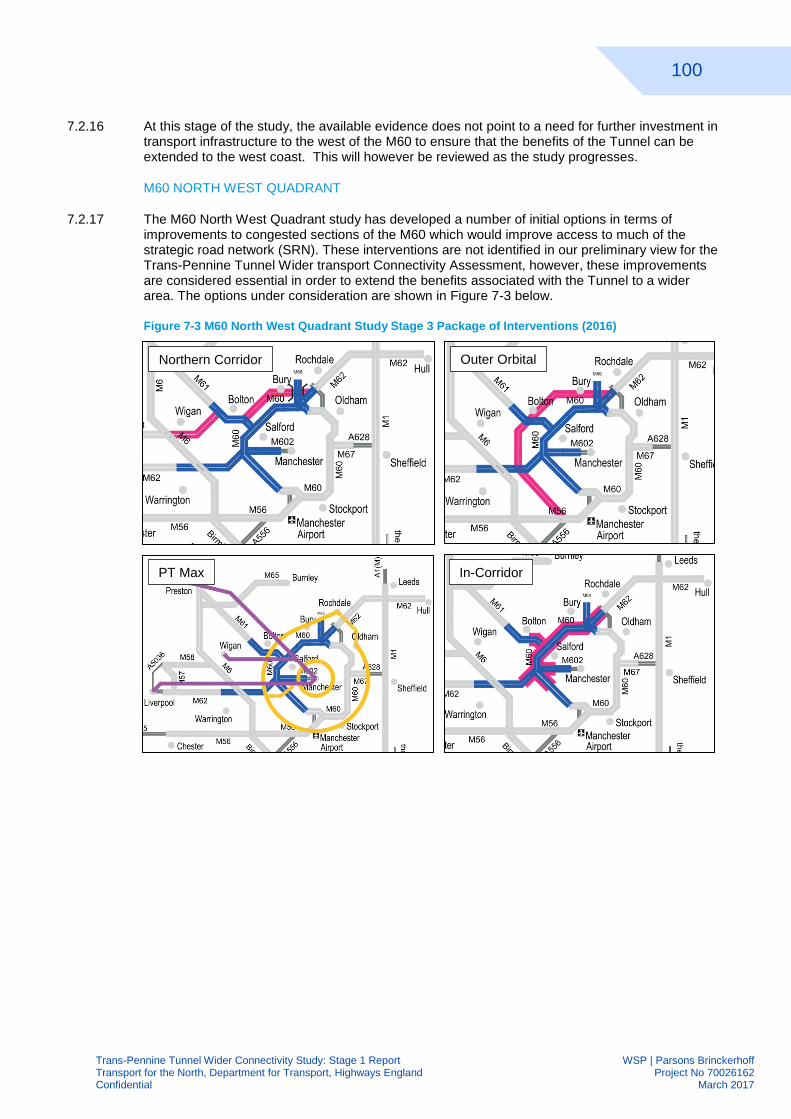
100
Trans-Pennine Tunnel Wider Connectivity Study: Stage 1 Report WSP | Parsons Brinckerhoff Transport for the North, Department for Transport, Highways England Project No 70026162 Confidential March 2017
At this stage of the study, the available evidence does not point to a need for further investment in 7.2.16transport infrastructure to the west of the M60 to ensure that the benefits of the Tunnel can be extended to the west coast. This will however be reviewed as the study progresses.
M60 NORTH WEST QUADRANT
The M60 North West Quadrant study has developed a number of initial options in terms of 7.2.17improvements to congested sections of the M60 which would improve access to much of the strategic road network (SRN). These interventions are not identified in our preliminary view for the Trans-Pennine Tunnel Wider transport Connectivity Assessment, however, these improvements are considered essential in order to extend the benefits associated with the Tunnel to a wider area. The options under consideration are shown in Figure 7-3 below.
Figure 7-3 M60 North West Quadrant Study Stage 3 Package of Interventions (2016)
Northern Corridor Outer Orbital
PT Max In-Corridor
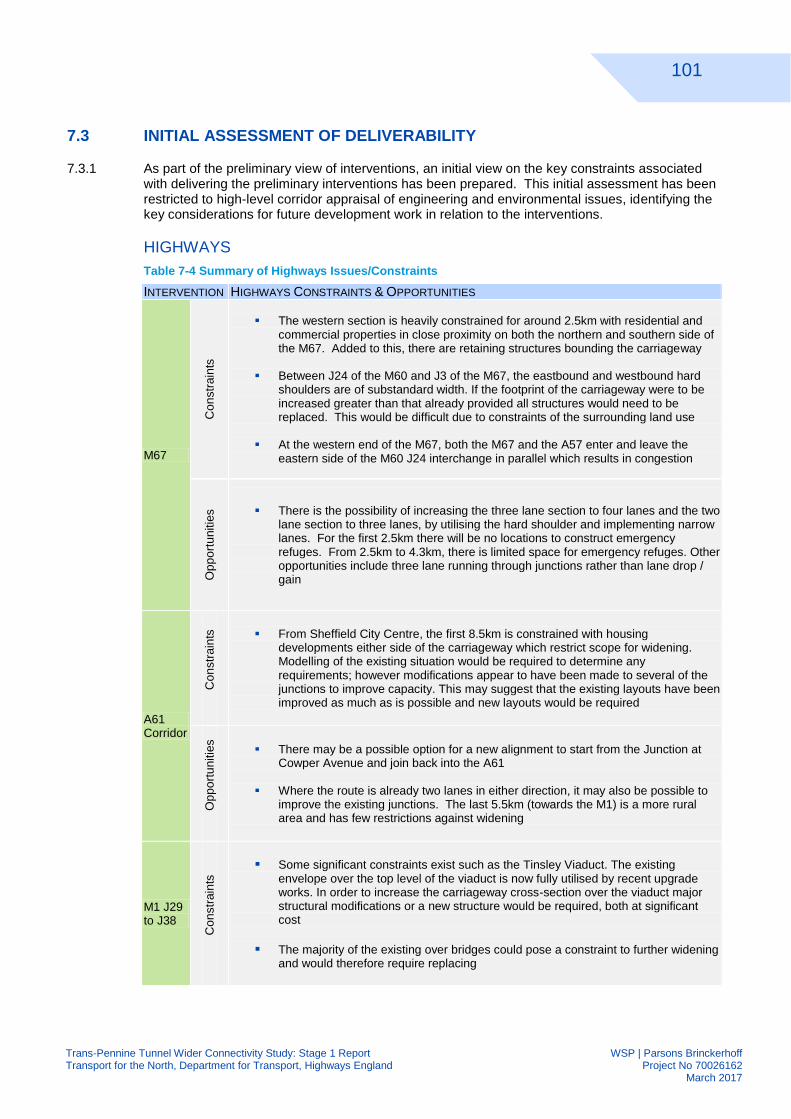
101
Trans-Pennine Tunnel Wider Connectivity Study: Stage 1 Report WSP | Parsons Brinckerhoff Transport for the North, Department for Transport, Highways England Project No 70026162 March 2017
7.3 INITIAL ASSESSMENT OF DELIVERABILITY
As part of the preliminary view of interventions, an initial view on the key constraints associated 7.3.1with delivering the preliminary interventions has been prepared. This initial assessment has been restricted to high-level corridor appraisal of engineering and environmental issues, identifying the key considerations for future development work in relation to the interventions.
HIGHWAYS
Table 7-4 Summary of Highways Issues/Constraints
INTERVENTION HIGHWAYS CONSTRAINTS & OPPORTUNITIES
M67
Co
nstr
ain
ts
The western section is heavily constrained for around 2.5km with residential and
commercial properties in close proximity on both the northern and southern side of the M67. Added to this, there are retaining structures bounding the carriageway
Between J24 of the M60 and J3 of the M67, the eastbound and westbound hard shoulders are of substandard width. If the footprint of the carriageway were to be increased greater than that already provided all structures would need to be replaced. This would be difficult due to constraints of the surrounding land use
At the western end of the M67, both the M67 and the A57 enter and leave the
eastern side of the M60 J24 interchange in parallel which results in congestion
Op
po
rtu
nitie
s
There is the possibility of increasing the three lane section to four lanes and the two lane section to three lanes, by utilising the hard shoulder and implementing narrow lanes. For the first 2.5km there will be no locations to construct emergency refuges. From 2.5km to 4.3km, there is limited space for emergency refuges. Other opportunities include three lane running through junctions rather than lane drop / gain
A61 Corridor
Con
str
ain
ts
From Sheffield City Centre, the first 8.5km is constrained with housing developments either side of the carriageway which restrict scope for widening. Modelling of the existing situation would be required to determine any requirements; however modifications appear to have been made to several of the junctions to improve capacity. This may suggest that the existing layouts have been improved as much as is possible and new layouts would be required
Op
po
rtu
nitie
s
There may be a possible option for a new alignment to start from the Junction at Cowper Avenue and join back into the A61
Where the route is already two lanes in either direction, it may also be possible to
improve the existing junctions. The last 5.5km (towards the M1) is a more rural area and has few restrictions against widening
M1 J29 to J38
Con
str
ain
ts
Some significant constraints exist such as the Tinsley Viaduct. The existing
envelope over the top level of the viaduct is now fully utilised by recent upgrade works. In order to increase the carriageway cross-section over the viaduct major structural modifications or a new structure would be required, both at significant cost
The majority of the existing over bridges could pose a constraint to further widening
and would therefore require replacing
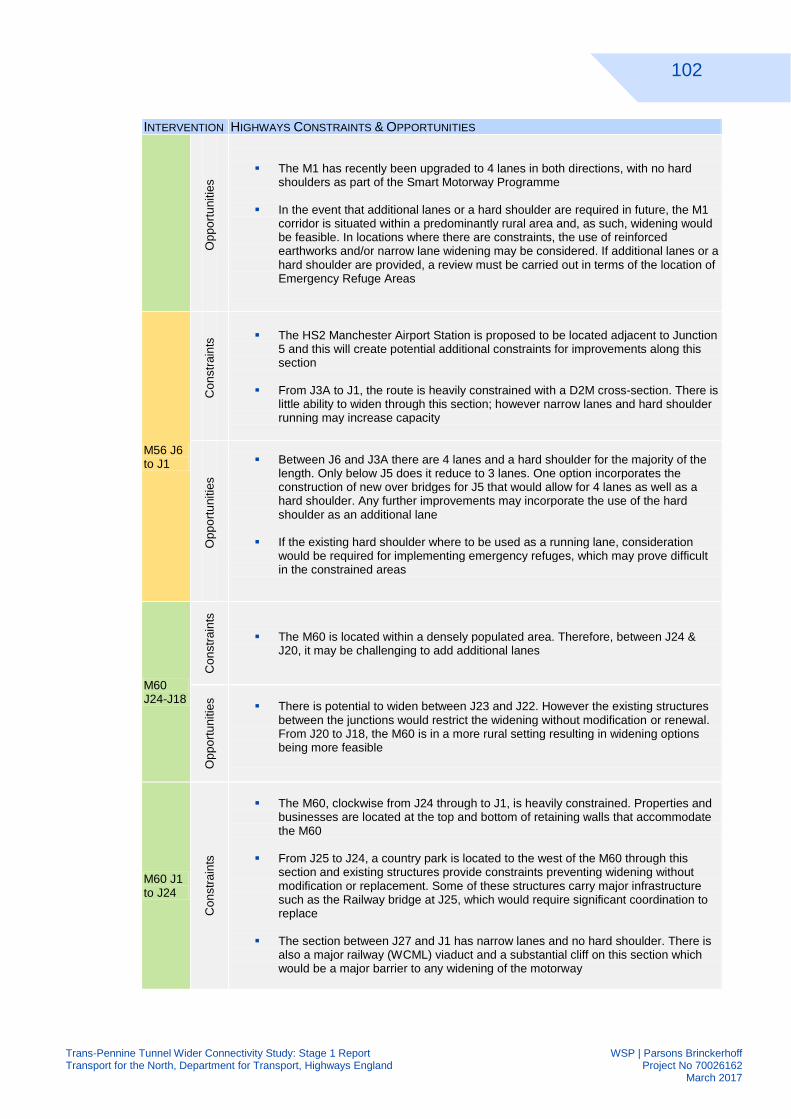
102
Trans-Pennine Tunnel Wider Connectivity Study: Stage 1 Report WSP | Parsons Brinckerhoff Transport for the North, Department for Transport, Highways England Project No 70026162 March 2017
INTERVENTION HIGHWAYS CONSTRAINTS & OPPORTUNITIES
Op
po
rtu
nitie
s
The M1 has recently been upgraded to 4 lanes in both directions, with no hard
shoulders as part of the Smart Motorway Programme
In the event that additional lanes or a hard shoulder are required in future, the M1 corridor is situated within a predominantly rural area and, as such, widening would be feasible. In locations where there are constraints, the use of reinforced earthworks and/or narrow lane widening may be considered. If additional lanes or a hard shoulder are provided, a review must be carried out in terms of the location of Emergency Refuge Areas
M56 J6 to J1
Co
nstr
ain
ts
The HS2 Manchester Airport Station is proposed to be located adjacent to Junction
5 and this will create potential additional constraints for improvements along this section
From J3A to J1, the route is heavily constrained with a D2M cross-section. There is
little ability to widen through this section; however narrow lanes and hard shoulder running may increase capacity
Op
po
rtu
nitie
s
Between J6 and J3A there are 4 lanes and a hard shoulder for the majority of the length. Only below J5 does it reduce to 3 lanes. One option incorporates the construction of new over bridges for J5 that would allow for 4 lanes as well as a hard shoulder. Any further improvements may incorporate the use of the hard shoulder as an additional lane
If the existing hard shoulder where to be used as a running lane, consideration
would be required for implementing emergency refuges, which may prove difficult in the constrained areas
M60 J24-J18
Con
str
ain
ts
The M60 is located within a densely populated area. Therefore, between J24 &
J20, it may be challenging to add additional lanes
Op
po
rtu
nitie
s
There is potential to widen between J23 and J22. However the existing structures between the junctions would restrict the widening without modification or renewal. From J20 to J18, the M60 is in a more rural setting resulting in widening options being more feasible
M60 J1 to J24
Con
str
ain
ts
The M60, clockwise from J24 through to J1, is heavily constrained. Properties and
businesses are located at the top and bottom of retaining walls that accommodate the M60
From J25 to J24, a country park is located to the west of the M60 through this section and existing structures provide constraints preventing widening without modification or replacement. Some of these structures carry major infrastructure such as the Railway bridge at J25, which would require significant coordination to replace
The section between J27 and J1 has narrow lanes and no hard shoulder. There is
also a major railway (WCML) viaduct and a substantial cliff on this section which would be a major barrier to any widening of the motorway
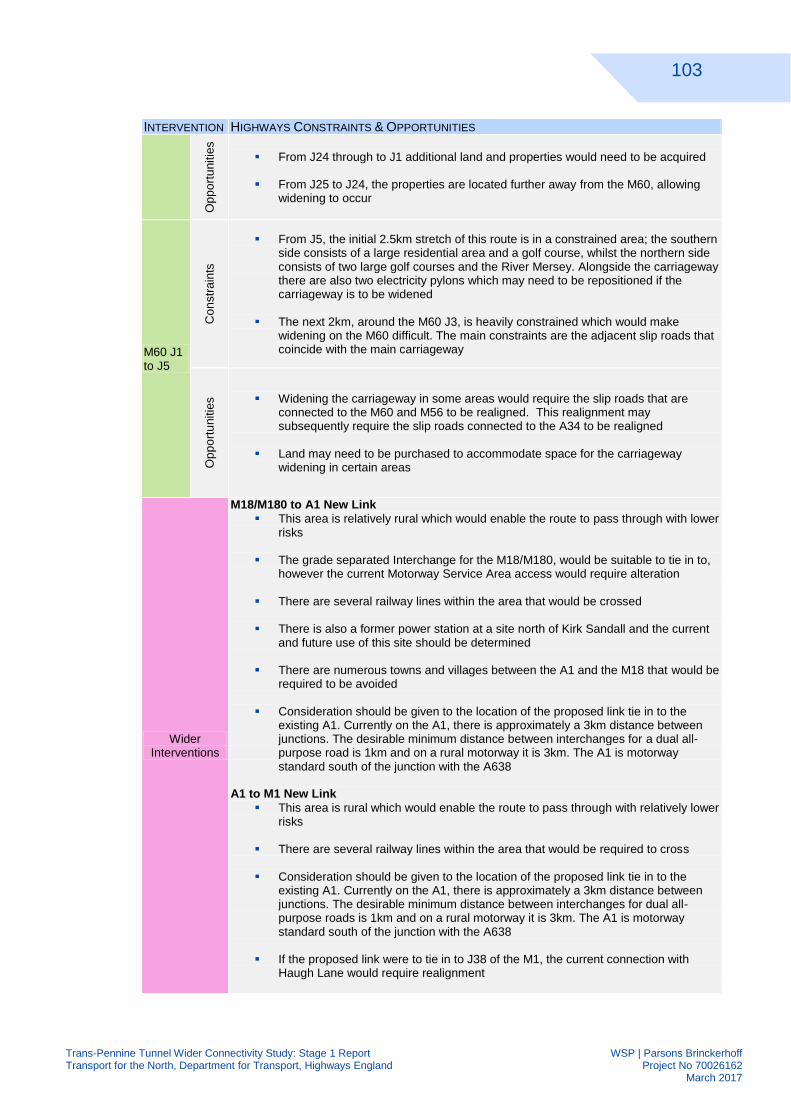
103
Trans-Pennine Tunnel Wider Connectivity Study: Stage 1 Report WSP | Parsons Brinckerhoff Transport for the North, Department for Transport, Highways England Project No 70026162 March 2017
INTERVENTION HIGHWAYS CONSTRAINTS & OPPORTUNITIES
Op
po
rtu
nitie
s
From J24 through to J1 additional land and properties would need to be acquired
From J25 to J24, the properties are located further away from the M60, allowing widening to occur
M60 J1 to J5
Co
nstr
ain
ts
From J5, the initial 2.5km stretch of this route is in a constrained area; the southern side consists of a large residential area and a golf course, whilst the northern side consists of two large golf courses and the River Mersey. Alongside the carriageway there are also two electricity pylons which may need to be repositioned if the carriageway is to be widened
The next 2km, around the M60 J3, is heavily constrained which would make
widening on the M60 difficult. The main constraints are the adjacent slip roads that coincide with the main carriageway
Op
po
rtu
nitie
s
Widening the carriageway in some areas would require the slip roads that are connected to the M60 and M56 to be realigned. This realignment may subsequently require the slip roads connected to the A34 to be realigned
Land may need to be purchased to accommodate space for the carriageway widening in certain areas
Wider Interventions
M18/M180 to A1 New Link
This area is relatively rural which would enable the route to pass through with lower risks
The grade separated Interchange for the M18/M180, would be suitable to tie in to, however the current Motorway Service Area access would require alteration
There are several railway lines within the area that would be crossed
There is also a former power station at a site north of Kirk Sandall and the current and future use of this site should be determined
There are numerous towns and villages between the A1 and the M18 that would be required to be avoided
Consideration should be given to the location of the proposed link tie in to the existing A1. Currently on the A1, there is approximately a 3km distance between junctions. The desirable minimum distance between interchanges for a dual all-purpose road is 1km and on a rural motorway it is 3km. The A1 is motorway standard south of the junction with the A638
A1 to M1 New Link
This area is rural which would enable the route to pass through with relatively lower risks
There are several railway lines within the area that would be required to cross
Consideration should be given to the location of the proposed link tie in to the existing A1. Currently on the A1, there is approximately a 3km distance between junctions. The desirable minimum distance between interchanges for dual all-purpose roads is 1km and on a rural motorway it is 3km. The A1 is motorway standard south of the junction with the A638
If the proposed link were to tie in to J38 of the M1, the current connection with Haugh Lane would require realignment
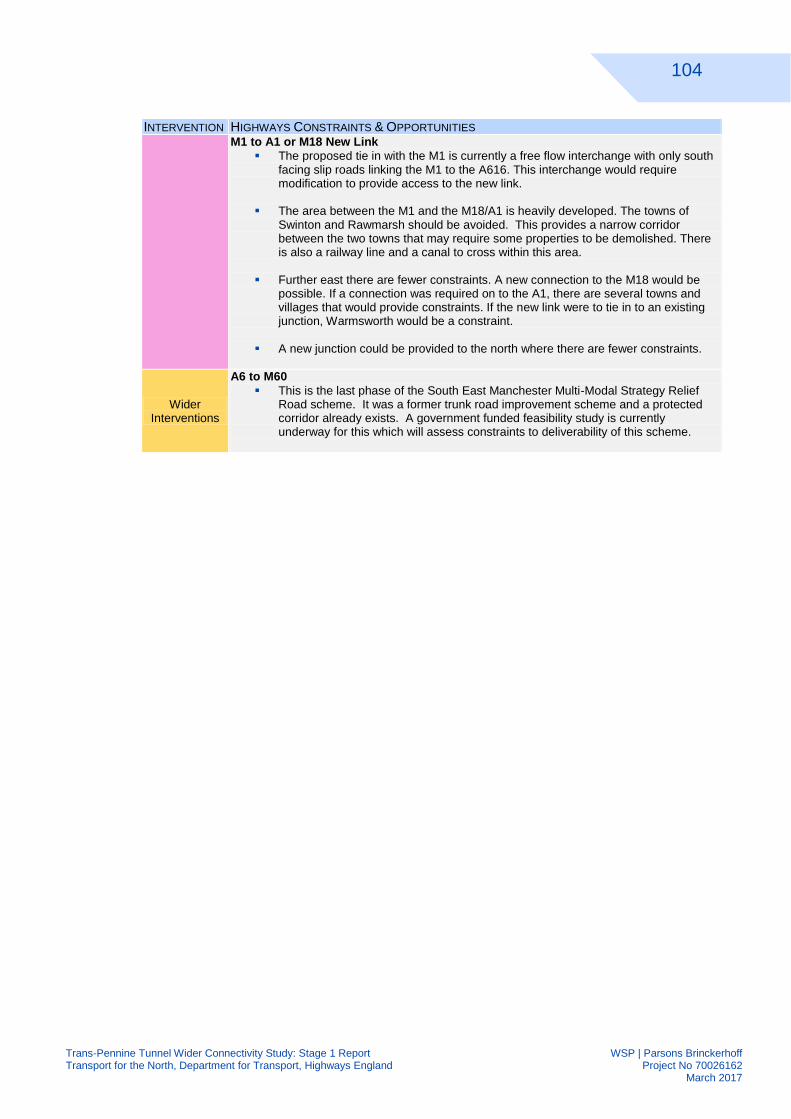
104
Trans-Pennine Tunnel Wider Connectivity Study: Stage 1 Report WSP | Parsons Brinckerhoff Transport for the North, Department for Transport, Highways England Project No 70026162 March 2017
INTERVENTION HIGHWAYS CONSTRAINTS & OPPORTUNITIES M1 to A1 or M18 New Link
The proposed tie in with the M1 is currently a free flow interchange with only south facing slip roads linking the M1 to the A616. This interchange would require modification to provide access to the new link.
The area between the M1 and the M18/A1 is heavily developed. The towns of Swinton and Rawmarsh should be avoided. This provides a narrow corridor between the two towns that may require some properties to be demolished. There is also a railway line and a canal to cross within this area.
Further east there are fewer constraints. A new connection to the M18 would be possible. If a connection was required on to the A1, there are several towns and villages that would provide constraints. If the new link were to tie in to an existing junction, Warmsworth would be a constraint.
A new junction could be provided to the north where there are fewer constraints.
Wider Interventions
A6 to M60
This is the last phase of the South East Manchester Multi-Modal Strategy Relief Road scheme. It was a former trunk road improvement scheme and a protected corridor already exists. A government funded feasibility study is currently underway for this which will assess constraints to deliverability of this scheme.
105
Trans-Pennine Tunnel Wider Connectivity Study: Stage 1 Report WSP | Parsons Brinckerhoff Transport for the North, Department for Transport, Highways England Project No 70026162 March 2017
ENVIRONMENT
All interventions have the potential to directly impact on AQMA’s, including those around 7.3.2Sheffield, Barnsley and Wakefield. There would also be an opportunity to mitigate a number of existing NIA’s, however without careful mitigation there are potential negative noise impacts on a wider population across the routes.
In addition to schemes to increase the capacity of existing routes, a number of new routes could 7.3.3be considered to improve connectivity to the proposed tunnel route, this includes new links between the M1, A1 and M18; one running between the conurbations of Barnsley and Rotherham; and the other between the conurbations of Wakefield and Barnsley.
Interventions on the M18 or M180 could be within 5km of Thorne Moor SPA and Thorne and 7.3.4Hatfield Moors SAC. There are several SSSI’s along the route corridors as well as Local Nature Reserves and parcels of ancient woodland which could be directly impacted. Main rivers run within the route corridors with flood zones 2 and 3, including the large floodplain of the River Dearne north of Mexborough; there is a large source protection zone around Doncaster which could be impacted.
For the historic environment there are potential impacts on Registered Parks and Gardens within 7.3.5the route corridors, notably Wentworth Woodhouse (Grade II*), Whinfell Quarry Garden (Grade II), and Beauchief Hall (Grade II).
In addition there are numerous Grade I, II* and II listed buildings and Scheduled Monuments 7.3.6within the corridors for which potential impacts on setting would need to be considered. Careful design would be needed on all routes to ensure integration with surrounding landscapes and to minimise severance in urban areas.
Further assessment of Environmental constraints and scheme impacts will be undertaken in 7.3.7subsequent stages of the study.
7.4 NEXT STEPS
The findings and evidence base from the Stage 1 report will be used to develop a set of study-7.4.1specific objectives. It will also inform the development and subsequent refinement of the long list of interventions. The study specific objectives will be used to sift and appraise the long list of options into a short list as part of Stage 2 of the study, and for the detailed appraisal work to be carried out as part of Stage 3 of the study.
106
Trans-Pennine Tunnel Wider Connectivity Study: Stage 1 Report WSP | Parsons Brinckerhoff Transport for the North, Department for Transport, Highways England Project No 70026162 March 2017
GLOSSARY OF TERMS
AADT Annual Average Daily Traffic Flows
AAWT Annual Average Weekday Traffic
AQMA Air Quality Management Area
AQS Air Quality Strategy
BRES Business Register and Employment Survey
CRF Congestion Reference Flows
DfT Department for Transport
EZ Enterprise Zone
FDI Foreign Direct Investment
GDP Gross Domestic Product
GIS Geographic Information System Software
GM Greater Manchester
GMLS Greater Manchester Life Science
GVA Gross Value Added
HE Highways England
HGV Heavy Goods Vehicle
HS2 High Speed 2 Rail
IER Independent Economic Review
JSA Job Seekers Allowance Benefit
KMH Kilometres per Hour
LCR Leeds City Region

107
Trans-Pennine Tunnel Wider Connectivity Study: Stage 1 Report WSP | Parsons Brinckerhoff Transport for the North, Department for Transport, Highways England Project No 70026162 March 2017
LEP Local Enterprise Partnerships
MDP Multi-modal Distribution Parks
MPH Miles per Hour
MRN TFN's Major Road Network
NIA Noise Improvement Area
NIC National Infrastructure Commission
NIP National Infrastructure Plan
NNR National Nature Reserve
NNTPCS National Networks Trans-Pennine Connectivity Study
NPIER Northern Powerhouse Independent Economic Review
NPPF National Planning Policy Framework
NPSNN National Policy Statement for National Networks
ONS Office for National Statistics
RIS Road Investment Strategy
SCR Sheffield City Region
SEP Strategic Economic Plan
SLC Strategic Local Connectivity
SPA Special Protection Areas
SRFI Strategic Rail Freight Interchanges
SRG Stakeholder Reference Group
SRN Strategic Road Network
SRO Senior Responsible Officer
108
Trans-Pennine Tunnel Wider Connectivity Study: Stage 1 Report WSP | Parsons Brinckerhoff Transport for the North, Department for Transport, Highways England Project No 70026162 March 2017
TAG Transport Analysis Guidance
TfGM Transport for Greater Manchester
TfN Transport for the North
TPRFS Trans-Pennine Routes Feasibility Study
TPT Trans-Pennine Tunnel
TPT WTCA Trans-Pennine Tunnel Wider Transport Connectivity Assessment
109
Trans-Pennine Tunnel Wider Connectivity Study: Stage 1 Report WSP | Parsons Brinckerhoff Transport for the North, Department for Transport, Highways England Project No 70026162 March 2017
BIBLIOGRAPHY Centre for Urban Policy Studies, Institute for Political and Economic Governance,
University of Manchester and David Coates (2008) Connecting the North:
Interdependence and barriers: rail, road, air and maritime links Newcastle-upon-Tyne: The
Northern Way Secretariat. 44.
Department for Communities and Local Government (2012) National Planning Policy
Framework. Available: https://www.gov.uk/government/publications/national-planning-policy-
framework--2.
Department for Communities and Local Government (2014) National Planning Policy for
Waste Available:
https://www.gov.uk/.../uploads/.../141015_National_Planning_Policy_for_Waste.pdf
Department for Transport (2011) Local Transport White Paper: Creating Growth, Cutting
Carbon: Making Sustainable Local Transport Happen . Available:
https://www.gov.uk/government/publications/creating-growth-cutting-carbon-making-
sustainable-local-transport-happen
Department for Transport (2014) National Policy Statement for National Networks Available:
https://www.gov.uk/government/uploads/system/uploads/...data/.../npsnn-print.pdf
Department for Transport (2016) A1 east of England strategic study: interim report
Available: https://www.gov.uk/government/publications/a1-east-of-england-strategic-study-
interim-report
Department for Transport (2016) Manchester north-west quadrant strategic study: interim
report Available: https://www.gov.uk/government/publications/manchester-north-west-
quadrant-strategic-study-interim-report
Department for Transport (2016) Northern Trans-Pennine strategic study: stage 3 report
Available: https://www.gov.uk/government/publications/northern-trans-pennine-strategic-
study-stage-3-report
Department for Transport (2016) Northern transport strategy: spring 2016. Available:
https://www.gov.uk/government/publications/northern-transport-strategy-spring-2016.
Department for Transport (2016) Oxford to Cambridge expressway strategic study: interim
report Available: https://www.gov.uk/government/publications/oxford-to-cambridge-
expressway-strategic-study-interim-report
110
Trans-Pennine Tunnel Wider Connectivity Study: Stage 1 Report WSP | Parsons Brinckerhoff Transport for the North, Department for Transport, Highways England Project No 70026162 March 2017
Department for Transport (2016) Trans-Pennine Tunnel Strategic Study: updated interim
report Available: https://www.gov.uk/government/publications/trans-pennine-tunnel-strategic-
study-updated-interim-report
Department for Transport and Highways Agency (2014) Road Investment Strategy: 2015
to 2020. Available: https://www.gov.uk/government/collections/road-investment-strategy.
Department for Transport and Highways Agency (2015) Trans-Pennine Routes Feasibility
Study (Stage 1 Report) Available: https://www.gov.uk/government/publications/trans-
pennine-routes-feasibility-study-overview
Department for Transport, High Speed Two (HS2) Limited and Highways England
(2015) The Northern Powerhouse: One Agenda, One Economy, One North. Available:
https://www.gov.uk/government/publications/northern-transport-strategy.
Department for Transport, Highways England and Office of Rail and Road (2016) Road
Investment Strategy: post-2020 Available: https://www.gov.uk/government/collections/road-
investment-strategy-post-2020
EY (2016) UK region and city economic forecast Available:
http://www.ey.com/uk/en/issues/business-environment/financial-markets-and-
economy/rebalancing---ey-uk-region-and-city-economic-forecast-2016---regions
Google Maps (2016) Routes between Manchester and Sheffield Available:
https://www.google.co.uk/maps
Greater Manchester Combined Authority, Greater Manchester Local Enterprise
Partnership, Association of Greater Manchester Authorities (2014) A Plan for Growth
and Reform in Greater Manchester Available: https://www.greatermanchester-
ca.gov.uk/.../id/10/gm_growth_and_reform_plan.pdf
Highways Agency (2014) Highways England: Strategic Business Plan 2015 to 2020.
Available: https://www.gov.uk/government/publications/highways-england-strategic-business-
plan-2015-to-2020.
Highways England (2014) Network Management Map
Highways England (2015) Biodiversity Strategy Available:
https://www.gov.uk/government/publications/biodiversity-plan
Highways England (2015) Highways England Delivery Plan 2015-2020. Available:
https://www.gov.uk/government/publications/highways-england-delivery-plan-2015-2020.
Highways England (2016) A57/A628 Trans-Pennine Programme. Available:
http://roads.highways.gov.uk/projects/a57a628-trans-pennine-programme/#progress.

111
Trans-Pennine Tunnel Wider Connectivity Study: Stage 1 Report WSP | Parsons Brinckerhoff Transport for the North, Department for Transport, Highways England Project No 70026162 March 2017
HM Treasury, Department for Business, Innovation & Skills, The Rt Hon George
Osborne MP and The Rt Hon Sajid Javid MP (2015) Fixing the foundations: creating a
more prosperous nation. Available: https://www.gov.uk/government/publications/fixing-the-
foundations-creating-a-more-prosperous-nation.
HM Treasury, Infrastructure and Projects Authority, Lord O’Neill of Gatley and The Rt
Hon George Osborne MP (2016) National Infrastructure Delivery Plan 2016 to 2021.
Available: https://www.gov.uk/government/publications/national-infrastructure-delivery-plan-
2016-to-2021.
HM Treasury, Infrastructure UK, The Rt Hon Danny Alexander and Lord Deighton (2014)
National Infrastructure Plan 2014. Available:
https://www.gov.uk/government/publications/national-infrastructure-plan-2014.
Humber Local Enterprise Partnership (2016) Strategic Economic Plan 2013-2020
Available: http://www.humberlep.org/strategies-and-deals/the-humber-strategic-economic-
plan/
IPPR North (2016) Gateways to the Northern Powerhouse: A Northern Ports Strategy
Available: http://www.ippr.org/files/publications/pdf/gateways-to-the-northern-
powerhouse_June2016.pdf
Leeds City Region Enterprise Partnership and West Yorkshire Combined Authority
(2016) Leeds City Region Strategic Economic Plan Available:
investleedscityregion.com/system/files/uploaded_files/SEP-2016-FINAL.pdf
Liverpool City Region (2012) Liverpool City Region Growth Prospectus Available:
https://www.lepnetwork.net/modules/downloads/download.php?file_name=25
Liverpool City Region (2015) Liverpool City Region Combined Authority: A Transport Plan
for Growth Available: http://www.merseytravel.gov.uk/about-us/local-transport-
delivery/pages/transport-plan-for-growth.aspx
Manchester City Council (2014) One North: A Proposition for an Interconnected North.
Available: http://www.manchester.gov.uk/downloads/download/5969/one_north.
Manchester Local Plan (2012) Manchester Local Plan Available:
http://www.manchester.gov.uk/info/200074/planning/6572/local_plan
Mega Bus (2016) Bus Timetables Available: http://uk.megabus.com/
National Express (2016) Bus Timetables Available:
http://www.nationalexpress.com/home.aspx
112
Trans-Pennine Tunnel Wider Connectivity Study: Stage 1 Report WSP | Parsons Brinckerhoff Transport for the North, Department for Transport, Highways England Project No 70026162 March 2017
National Infrastructure Commission (2016) High Speed North: A National Infrastructure
Commission Report. Available: https://www.gov.uk/government/publications/high-speed-
north-a-national-infrastructure-commission-report.
Network Rail (2013) Long Term Planning Process: Regional Urban Market Study Available:
http://www.networkrail.co.uk/improvements/planning-policies-and-plans/long-term-planning-
process/market-studies/regional-urban/
Network Rail (2016) Network Rail Route Specifications Available:
http://www.networkrail.co.uk/aspx/4451.aspx
OECD (2003) OECD Glossary of Statistical Terms. Available:
https://stats.oecd.org/glossary/detail.asp?ID=2440.
Office for National Statistics (2016) Annual Survey of Hours and Earnings: 2016 provisional
results Available:
https://www.ons.gov.uk/employmentandlabourmarket/peopleinwork/earningsandworkinghour
s/bulletins/annualsurveyofhoursandearnings/2016provisionalresults
Peak District National Park (2011) Local Development Framework Core Strategy Available:
http://www.peakdistrict.gov.uk/planning/how-we-work/policies-and-guides/core-strategy.
Peak District National Park (2017) Media Centre Facts and Figures Available:
http://www.peakdistrict.gov.uk/learning-about/news/mediacentrefacts
Peel Ports Group (2017) Introducing Liverpool2 Available:
https://www.peelports.com/campaigns/liverpool2.
Rotherham Metropolitan Borough Council (2013) Rotherham Local Plan Available:
http://www.rotherham.gov.uk/downloads/download/57/local_plan_core_strategy_documentati
on
Sheffield City Council (2015) Sheffield Local Plan Available:
https://www.sheffield.gov.uk/planning-and-city-development/planning-documents/sheffield-
plan.html
Sheffield City Region (2011) Sheffield City Region Transport Strategy, 2011-2026 Available:
www.syltp.org.uk/documents/scrtransportstrategy.pdf
Sheffield City Region (2014) Strategic Economic Plan: A Focused 10 Year Plan for Private
Sector Growth 2015-2025 Available:
https://www.lepnetwork.net/modules/downloads/download.php?file_name=31
TfGM (2016). Way Ahead: Transport for Greater Manchester 2040. Available:
http://www.tfgm.com/2040/Pages/strategy/index.html.
113
Trans-Pennine Tunnel Wider Connectivity Study: Stage 1 Report WSP | Parsons Brinckerhoff Transport for the North, Department for Transport, Highways England Project No 70026162 March 2017
Transport for Greater Manchester, Greater Manchester Combined Authority and
Greater Manchester Local Enterprise Partnership (2015) Greater Manchester Transport
Strategy 2040 Our Vision Available: http://www.tfgm.com/2040/Pages/default.aspx
Transport for North (2016) Northern Freight and Logistics Report Available:
http://www.transportforthenorth.com/publications/?publication-keywords=freight
Transport for the North (2016) Northern Powerhouse Independent Economic Review.
Available: http://www.transportforthenorth.com/publications/
West Yorkshire Combined Authority (2016) West Yorkshire Transport Strategy 2016-2036,
Summary Consultation Draft Available: http://www.westyorks-
ca.gov.uk/uploadedFiles/Content/Transport/West%20Yorkshire%20Transport%20Strategy%
20Summary%20Doc%20-%20Large%20Print%20Text.pdf