nys department of labor, division of research and statistics frank m. surdey, managing economist may...
TRANSCRIPT
NYS Department of Labor, Division of Research and Statistics
Frank M. Surdey, Managing Economist
May 2008
Labor Market and Demographic Trends in Greene County
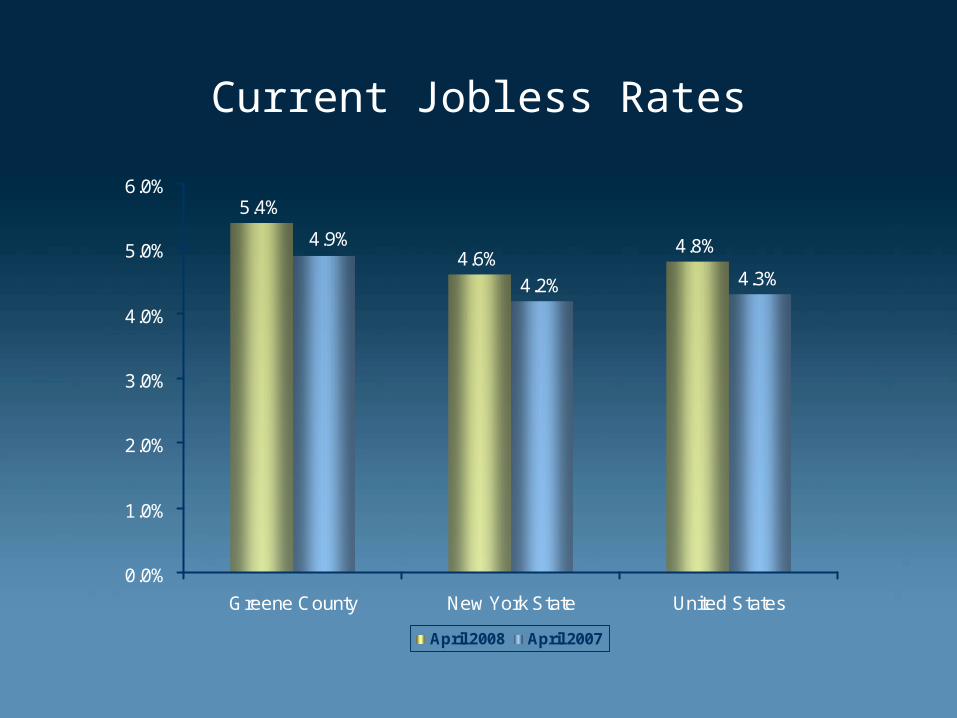
Current Jobless Rates
5.4%
4.6%4.8%
4.2% 4.3%
4.9%
0.0%
1.0%
2.0%
3.0%
4.0%
5.0%
6.0%
Greene County New York State United States
April 2008 April 2007
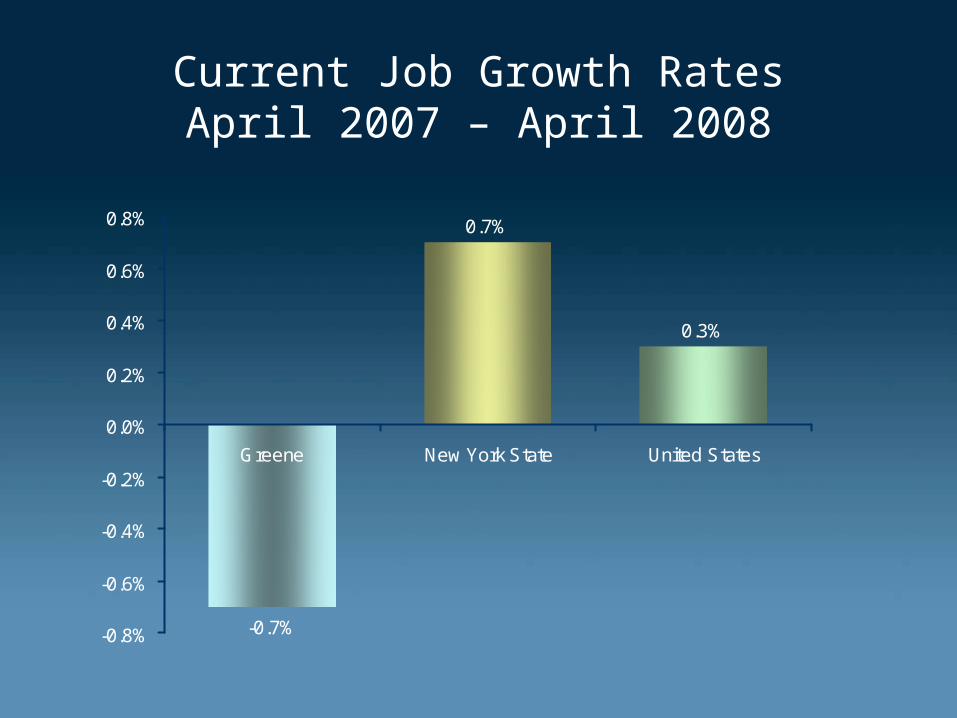
Current Job Growth RatesApril 2007 – April 2008
-0.7%
0.7%
0.3%
-0.8%
-0.6%
-0.4%
-0.2%
0.0%
0.2%
0.4%
0.6%
0.8%
Greene New York State United States

Historical Job Growth Rates 2003-2006
2.9%
2.5%
4.7%
0.0%
0.5%
1.0%
1.5%
2.0%
2.5%
3.0%
3.5%
4.0%
4.5%
5.0%
Greene New York State United States
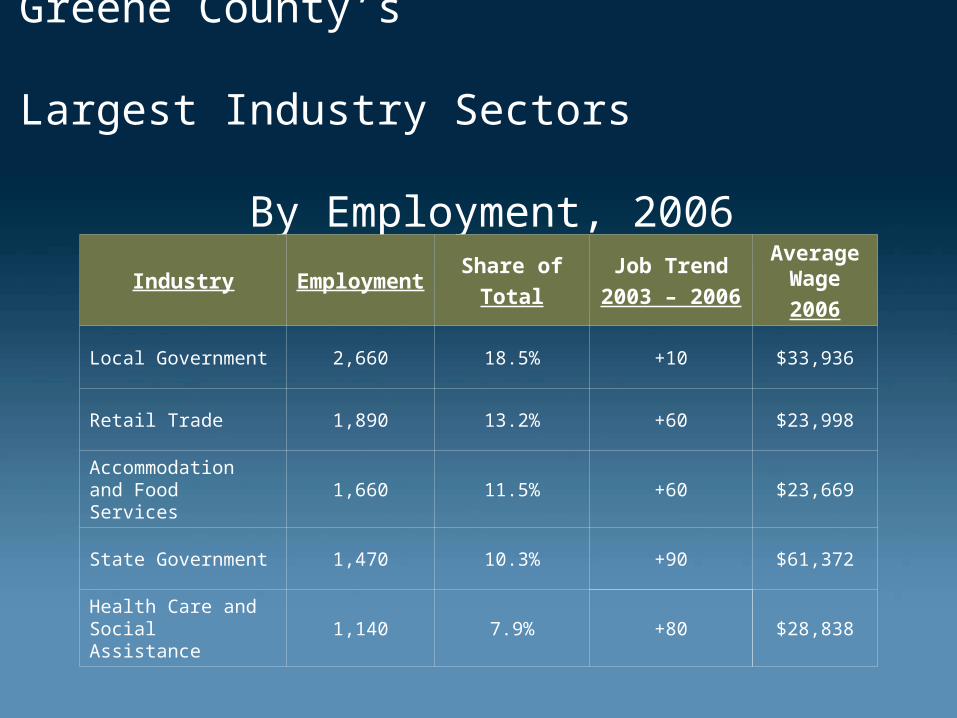
Greene County’s Largest Industry Sectors
By Employment, 2006
Industry EmploymentShare of
Total
Job Trend
2003 – 2006
Average Wage
2006
Local Government 2,660 18.5% +10 $33,936
Retail Trade 1,890 13.2% +60 $23,998
Accommodation and Food Services
1,660 11.5% +60 $23,669
State Government 1,470 10.3% +90 $61,372
Health Care and Social Assistance
1,140 7.9% +80 $28,838
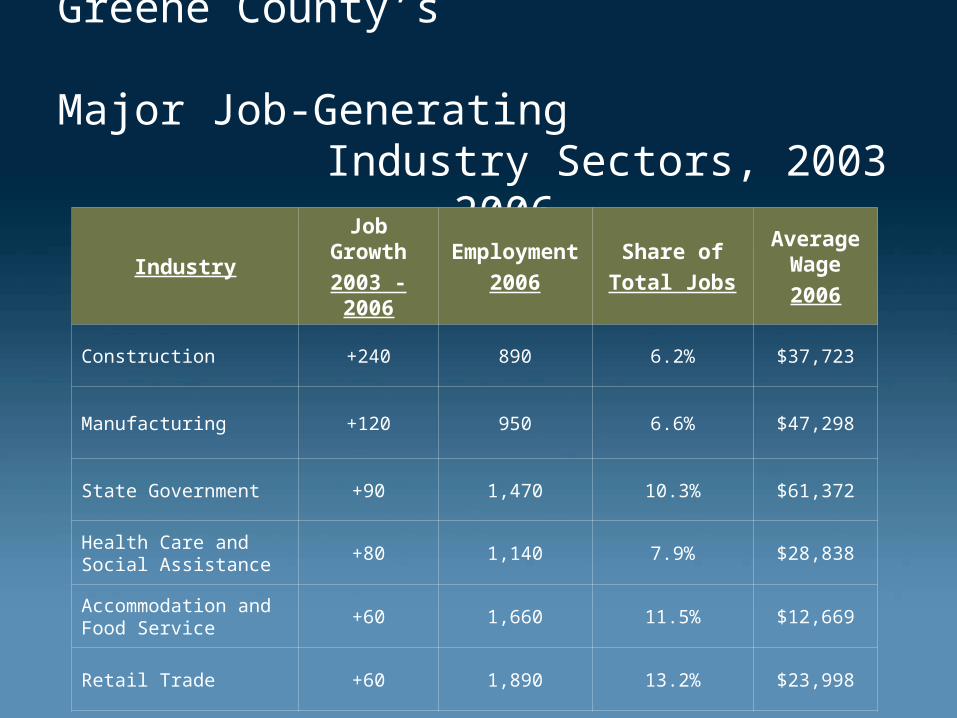
Greene County’s Major Job-Generating
Industry Sectors, 2003 - 2006
IndustryJob Growth
2003 - 2006
Employment
2006
Share of
Total Jobs
Average Wage
2006
Construction +240 890 6.2% $37,723
Manufacturing +120 950 6.6% $47,298
State Government +90 1,470 10.3% $61,372
Health Care and Social Assistance
+80 1,140 7.9% $28,838
Accommodation and Food Service
+60 1,660 11.5% $12,669
Retail Trade +60 1,890 13.2% $23,998

Declining Industry Sectors By EmploymentGreene County: 2003-2006
IndustryJob Loss
2003 - 2006
Employment
2006
Share of
Total Jobs 2006
Average Wage
2006
Professional and Technical Services
-400 370 2.6% $39,361
Agriculture -20 80 0.5% $26,516
Information -20 210 1.5% $40,725
Federal Government -10 110 0.7% $44,733
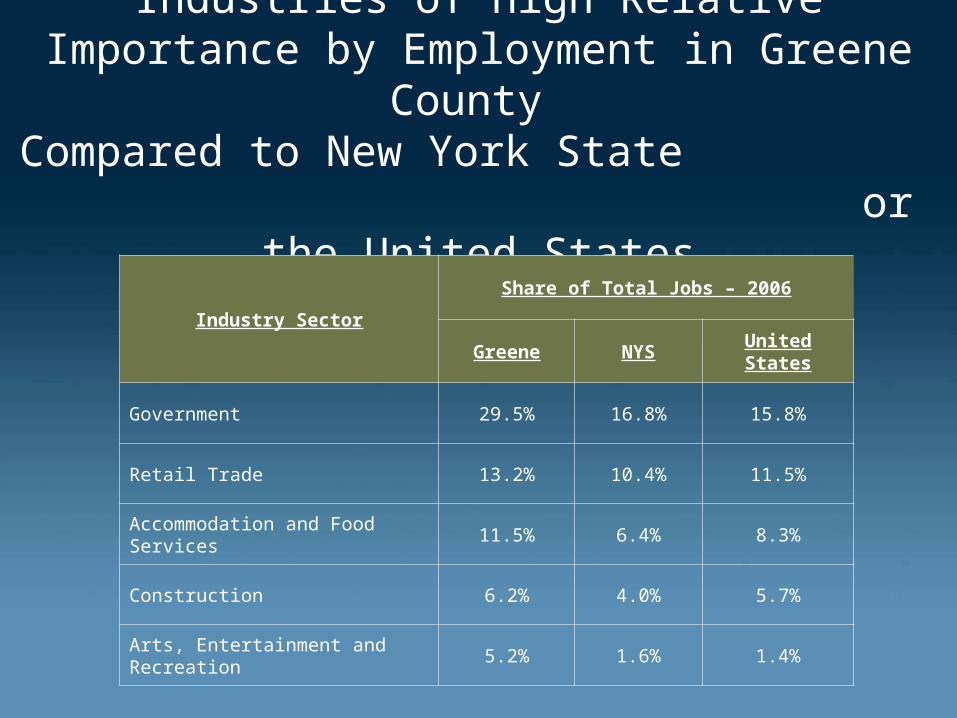
Industries of High Relative Importance by Employment in Greene County
Compared to New York State or the United States
Industry Sector
Share of Total Jobs – 2006
Greene NYS United States
Government 29.5% 16.8% 15.8%
Retail Trade 13.2% 10.4% 11.5%
Accommodation and Food Services 11.5% 6.4% 8.3%
Construction 6.2% 4.0% 5.7%
Arts, Entertainment and Recreation 5.2% 1.6% 1.4%

Long-Term National Employment ProjectionsIndustries of High Relative Performance by
Employment in Greene County
Industry Sector
Projected Job Change,
United States – 2006-2016
Net Percent
Government +1,331,800 +6.1%
Retail Trade +687,000 +4.5%
Accommodation and Food Services +1,278,000 +11.4%
Construction +780,700 +10.2%
Arts, Entertainment and Recreation +595,300 +30.9%
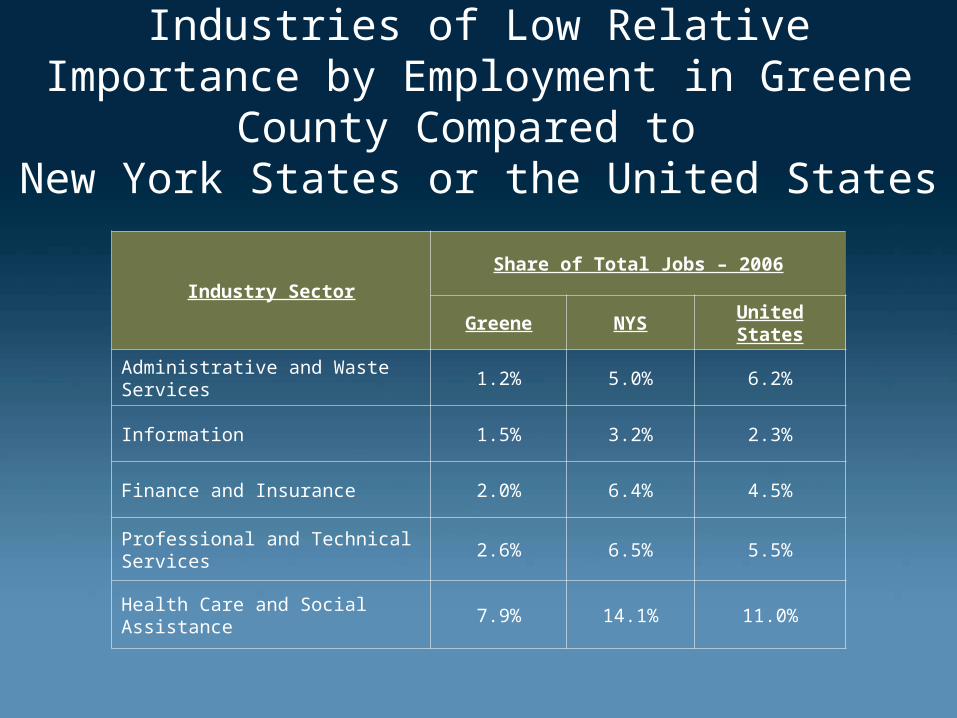
Industries of Low Relative Importance by Employment in Greene County Compared to
New York States or the United States
Industry SectorShare of Total Jobs – 2006
Greene NYS United States
Administrative and Waste Services 1.2% 5.0% 6.2%
Information 1.5% 3.2% 2.3%
Finance and Insurance 2.0% 6.4% 4.5%
Professional and Technical Services
2.6% 6.5% 5.5%
Health Care and Social Assistance 7.9% 14.1% 11.0%
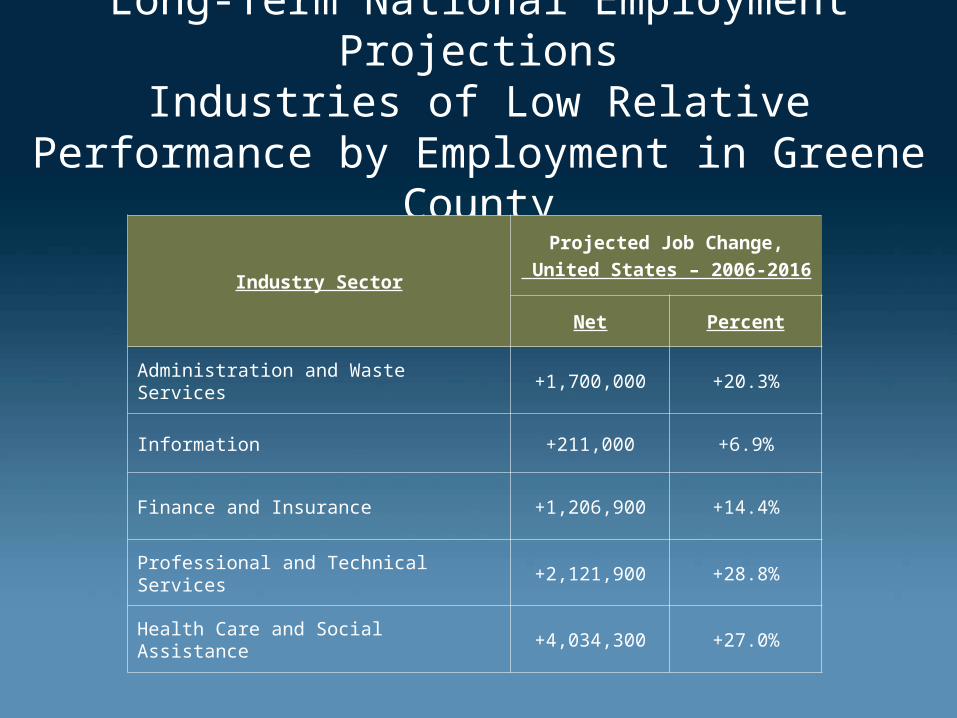
Long-Term National Employment ProjectionsIndustries of Low Relative Performance by
Employment in Greene County
Industry Sector
Projected Job Change,
United States – 2006-2016
Net Percent
Administration and Waste Services +1,700,000 +20.3%
Information +211,000 +6.9%
Finance and Insurance +1,206,900 +14.4%
Professional and Technical Services +2,121,900 +28.8%
Health Care and Social Assistance +4,034,300 +27.0%

Distribution of Firms By Employment SizePrivate Sector, Greene County, 2007
20 - 996%
100 and Over1%
Under 2093%
Total Firms = 1,229

Distribution of Jobs by Employment Size of Firm
Private Sector, Greene County, 2007
20 - 9923%
Under 2039%
100 and Over38%
Total Jobs = 10,070
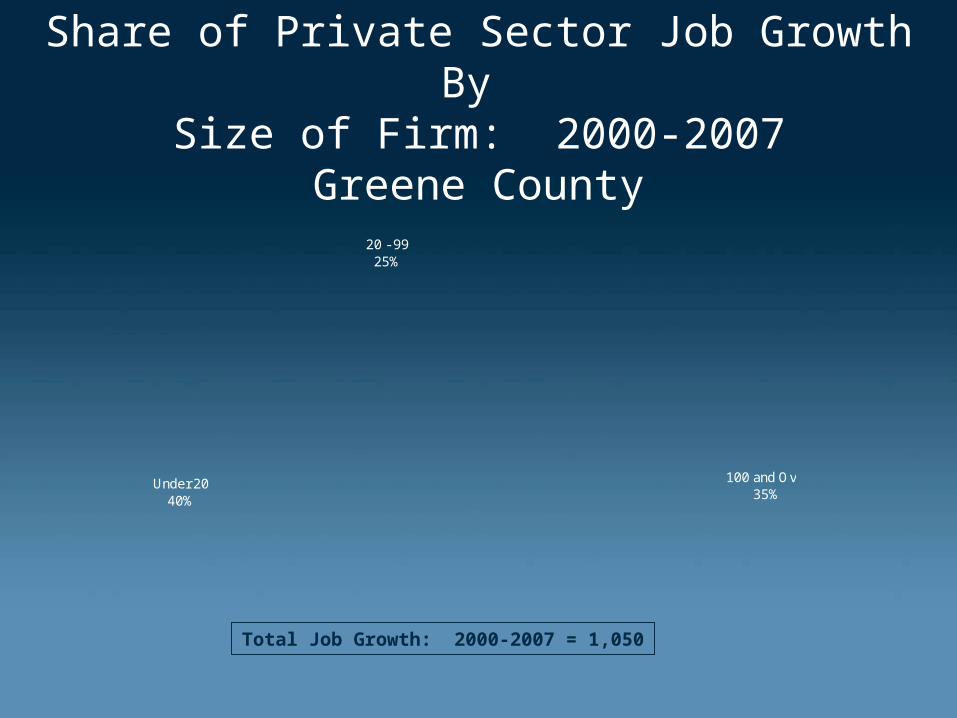
Share of Private Sector Job Growth By Size of Firm: 2000-2007
Greene County
100 and Over35%
Under 2040%
20 - 9925%
Total Job Growth: 2000-2007 = 1,050

Share of Employed Persons Who Work Outside Their County of Residence (Outcommutation)
36.8%30.7%
42.3%34.5%
71.5%
45.6%
32.6% 33.5%37.1%
0%
10%
20%
30%
40%
50%
60%
70%
80%

Share of Jobholders Who Reside Outside Their County of Work (Incommutation)
33.4%
16.0%15.8%
28.7%
42.8%
21.7%24.8%
22.2%23.7%
0%
5%
10%
15%
20%
25%
30%
35%
40%
45%
Columbia Dutchess Greene Orange Putnam Rockland Sullivan Ulster Westchester
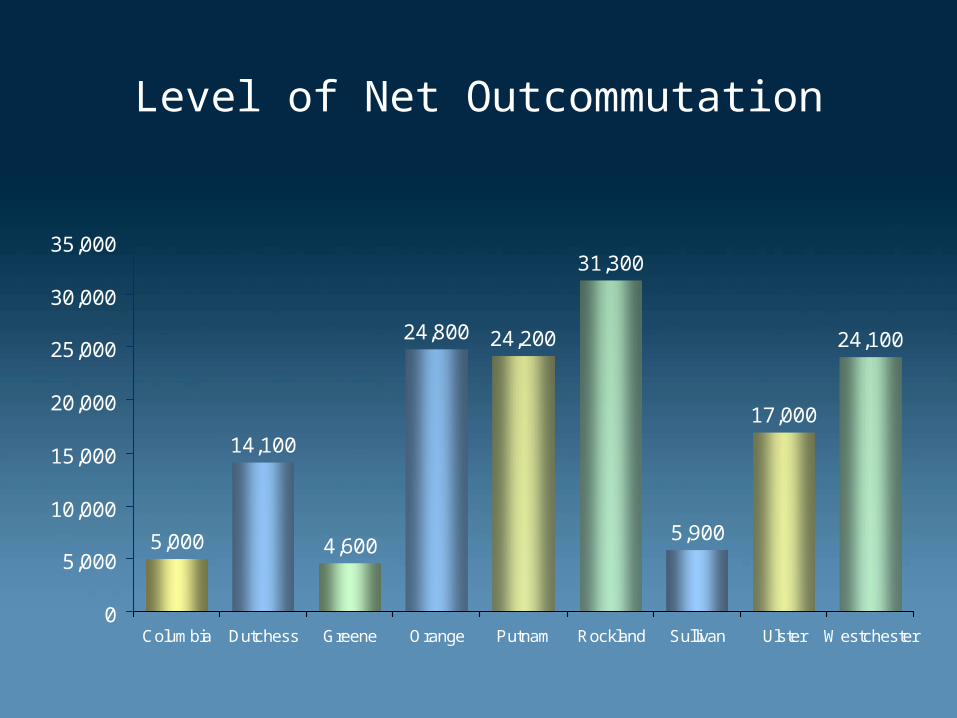
Level of Net Outcommutation
24,100
17,000
5,900
31,300
24,20024,800
4,600
14,100
5,000
0
5,000
10,000
15,000
20,000
25,000
30,000
35,000
Columbia Dutchess Greene Orange Putnam Rockland Sullivan Ulster Westchester
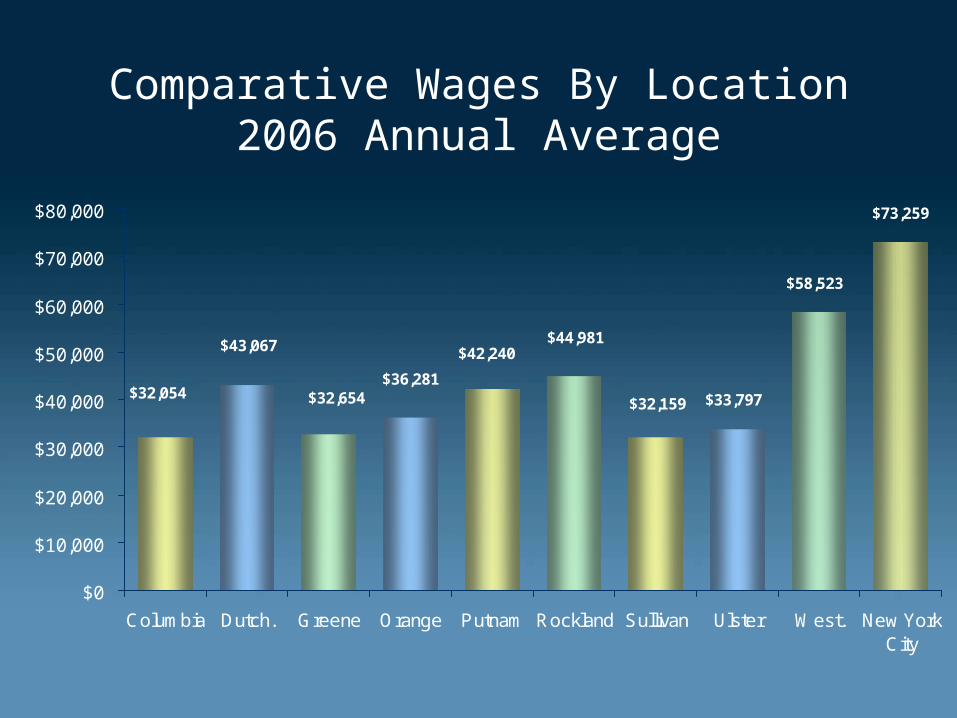
Comparative Wages By Location2006 Annual Average
$32,159 $33,797
$58,523
$73,259
$32,054
$43,067
$32,654$36,281
$42,240$44,981
$0
$10,000
$20,000
$30,000
$40,000
$50,000
$60,000
$70,000
$80,000
Columbia Dutch. Greene Orange Putnam Rockland Sullivan Ulster West. New YorkCity

34.3
17.6
7.3
9.6
5.4
4.2
13.0
4.3
1.5
1.5
1.4
0 5 10 15 20 25 30 35 40
Short-Term On-The-Job Training
Moderate-Term On-theJob Training
Long-Term On-the Job Training
Work Experience in Related Occupation
Post-secondary Vocational Aware
Associate Degree
Bachelor's Degree
Bachelor's or More Plus Work Exper.
Masters Degree
Doctorial Degree
First Professional Degree
Share of Total Employment, United States, by Level of Education and Training Required, 2006
Share of Total Employment (Percent)
Source: United States Department of Labor

4,613
2,018
711
1,310
1,072
1,087
3,074
592
409
437
277
0 1000 2000 3000 4000 5000
Short-Term On-The-Job Training
Moderate-Term On-theJob Training
Long-Term On-the Job Training
Work Experience in Related Occupation
Post-secondary Vocational Aware
Associate Degree
Bachelor's Degree
Bachelor's or More Plus Work Exper.
Masters Degree
Doctorial Degree
First Professional Degree
Projected Numeric Change in Employment Growth, United States, by Level of Education and Training Required, 2006 - 2016
Source: United States Department of Labor
Change in Employment (in 000’s)
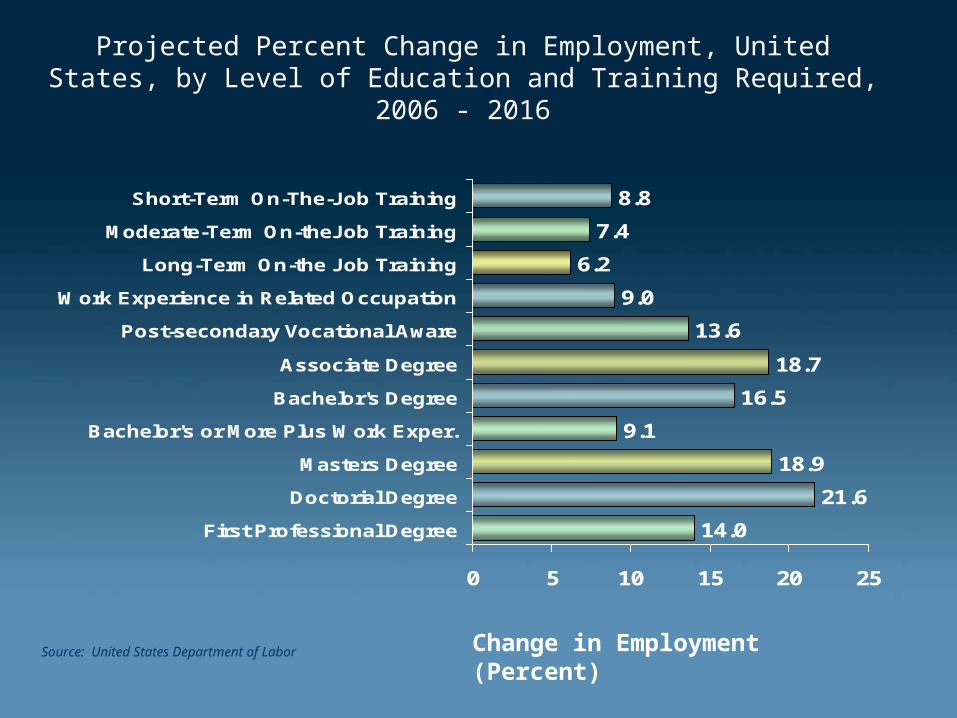
8.8
7.4
6.2
9.0
13.6
18.7
16.5
9.1
18.9
21.6
14.0
0 5 10 15 20 25
Short-Term On-The-Job Training
Moderate-Term On-theJob Training
Long-Term On-the Job Training
Work Experience in Related Occupation
Post-secondary Vocational Aware
Associate Degree
Bachelor's Degree
Bachelor's or More Plus Work Exper.
Masters Degree
Doctorial Degree
First Professional Degree
Projected Percent Change in Employment, United States, by Level of Education and Training Required, 2006 - 2016
Source: United States Department of Labor Change in Employment (Percent)

20,123
7,516
3,232
4,126
2,491
2,240
6,706
2,008
819
793
638
0 5000 10000 15000 20000 25000
Short-Term On-The-Job Training
Moderate-Term On-theJob Training
Long-Term On-the Job Training
Work Experience in Related Occupation
Post-secondary Vocational Aware
Associate Degree
Bachelor's Degree
Bachelor's or More Plus Work Exper.
Masters Degree
Doctorial Degree
First Professional Degree
Projected Total Annual Openings, United States, by Level of Education and Training Required, 2006 - 2016
Source: United States Department of Labor
Change in Annual Openings (000’s)

$19,620
$29,100
$37,360
$43,480
$29,520
$50,240
$53,550
$81,280
$51,380
$57,640
$112,070
$0 $20,000 $40,000 $60,000 $80,000 $100,000
$120,000
Short-Term On-The-Job Training
Moderate-Term On-theJob Training
Long-Term On-the Job Training
Work Experience in Related Occupation
Post-secondary Vocational Aware
Associate Degree
Bachelor's Degree
Bachelor's or More Plus Work Exper.
Masters Degree
Doctorial Degree
First Professional Degree
Average (Mean) Occupational Wage, United States, by Level of Education and Training Required, 2006
Source: NYS Department of Labor, Division of Research & Statistics Average Wage (dollars)
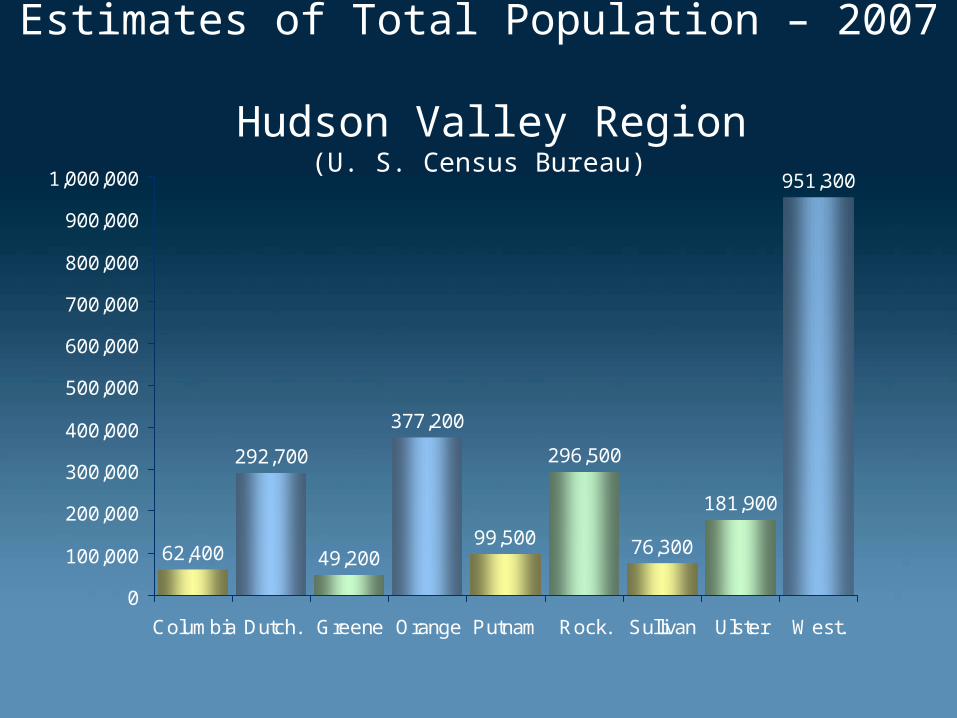
Estimates of Total Population – 2007 Hudson Valley Region
(U. S. Census Bureau)
951,300
181,900
76,300
296,500
99,500
377,200
49,20062,400
292,700
0
100,000
200,000
300,000
400,000
500,000
600,000
700,000
800,000
900,000
1,000,000
Columbia Dutch. Greene Orange Putnam Rock. Sullivan Ulster West.

Population Growth Rates: 2000-2007 Hudson Valley Region
(U.S. Census Bureau)
10.5%
4.5%3.9%3.4%3.2%3.0%
2.3%2.2%1.7%
-1.2%
-2.0%
0.0%
2.0%
4.0%
6.0%
8.0%
10.0%
12.0%
(Growth Rate Rank Among 62 Counties)
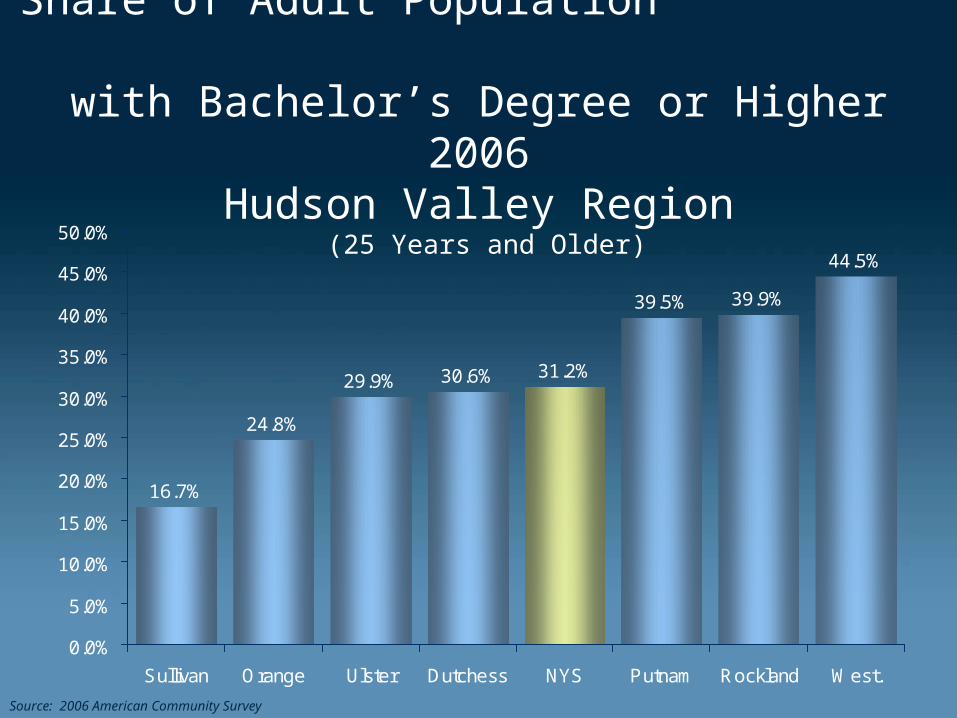
Share of Adult Population with Bachelor’s Degree or Higher 2006
Hudson Valley Region (25 Years and Older)
16.7%
24.8%
29.9% 30.6% 31.2%
39.5% 39.9%
44.5%
0.0%
5.0%
10.0%
15.0%
20.0%
25.0%
30.0%
35.0%
40.0%
45.0%
50.0%
Sullivan Orange Ulster Dutchess NYS Putnam Rockland West.
Source: 2006 American Community Survey

Share of Minority Group Members in Total Population, 2006
Hudson Valley Region
15.0% 16.1%
22.8% 23.1%
28.9%31.2%
39.2% 39.8%
0.0%
5.0%
10.0%
15.0%
20.0%
25.0%
30.0%
35.0%
40.0%
45.0%
Putnam Ulster Dutchess Sullivan Orange Rockland West. NYS
Source: 2006 American Community Survey

Share of Foreign-Born Residents, 2006Hudson Valley Region
6.7% 7.0%
10.1%
12.2% 12.2%
21.6% 21.8%22.5%
0.0%
5.0%
10.0%
15.0%
20.0%
25.0%
Ulster Sullivan Dutchess Orange Putnam NYS Rockland West.
Source: 2006 American Community Survey
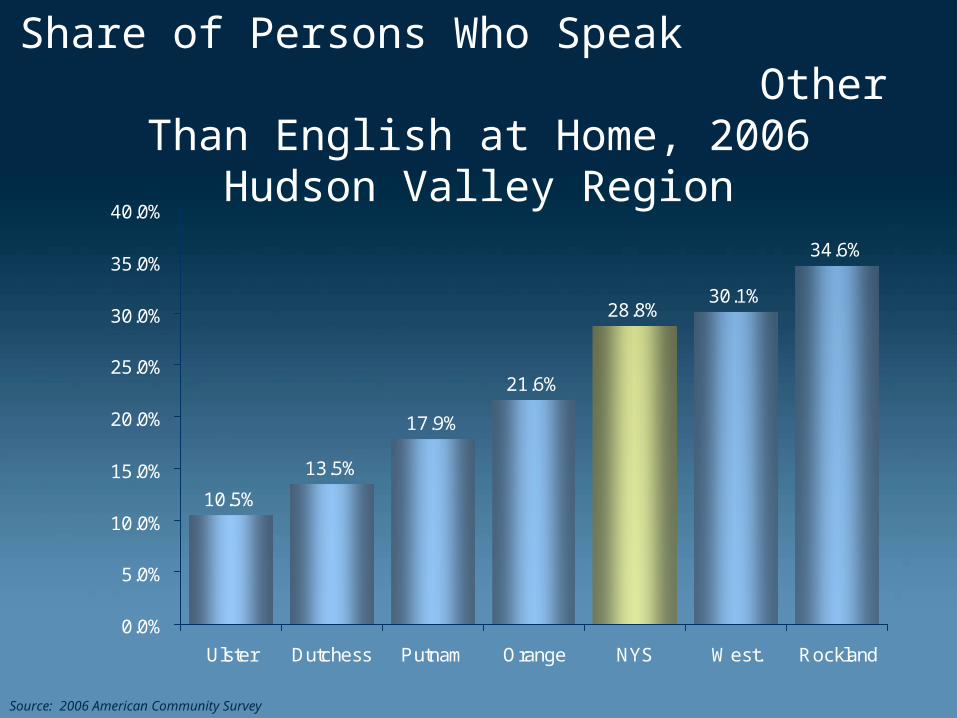
Share of Persons Who Speak Other Than English at Home, 2006
Hudson Valley Region
10.5%
13.5%
17.9%
21.6%
28.8%30.1%
34.6%
0.0%
5.0%
10.0%
15.0%
20.0%
25.0%
30.0%
35.0%
40.0%
Ulster Dutchess Putnam Orange NYS West. Rockland
Source: 2006 American Community Survey
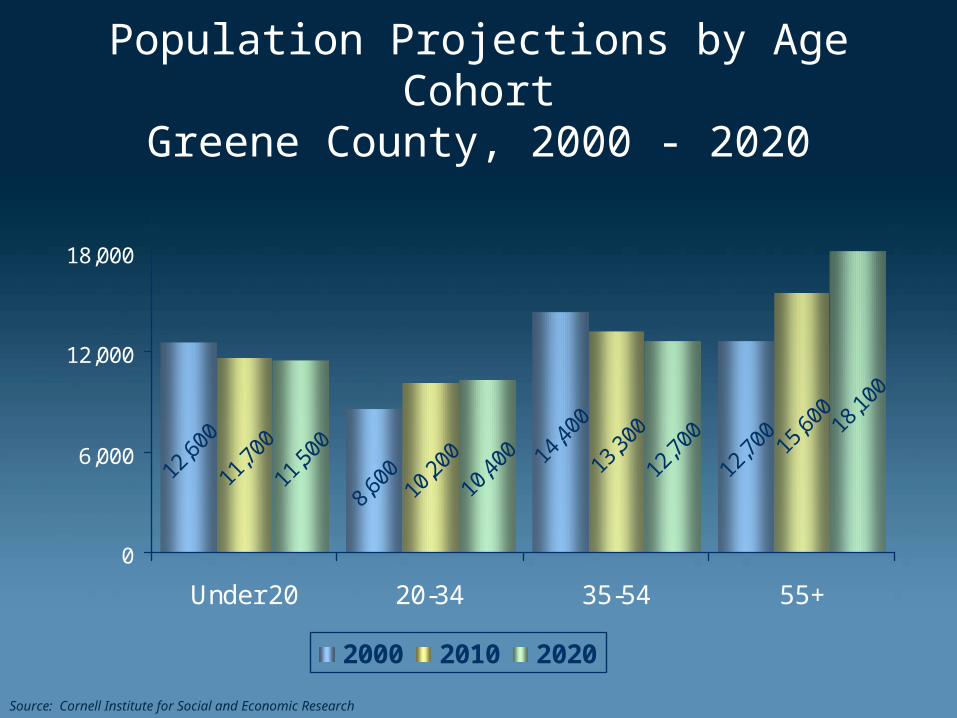
Population Projections by Age CohortGreene County, 2000 - 2020
12,7
0014
,400
8,60
012,6
00 15,6
00
13,3
00
10,2
0011
,700
18,1
00
12,7
00
10,4
0011
,500
0
6,000
12,000
18,000
Under 20 20-34 35-54 55+
2000 2010 2020
Source: Cornell Institute for Social and Economic Research
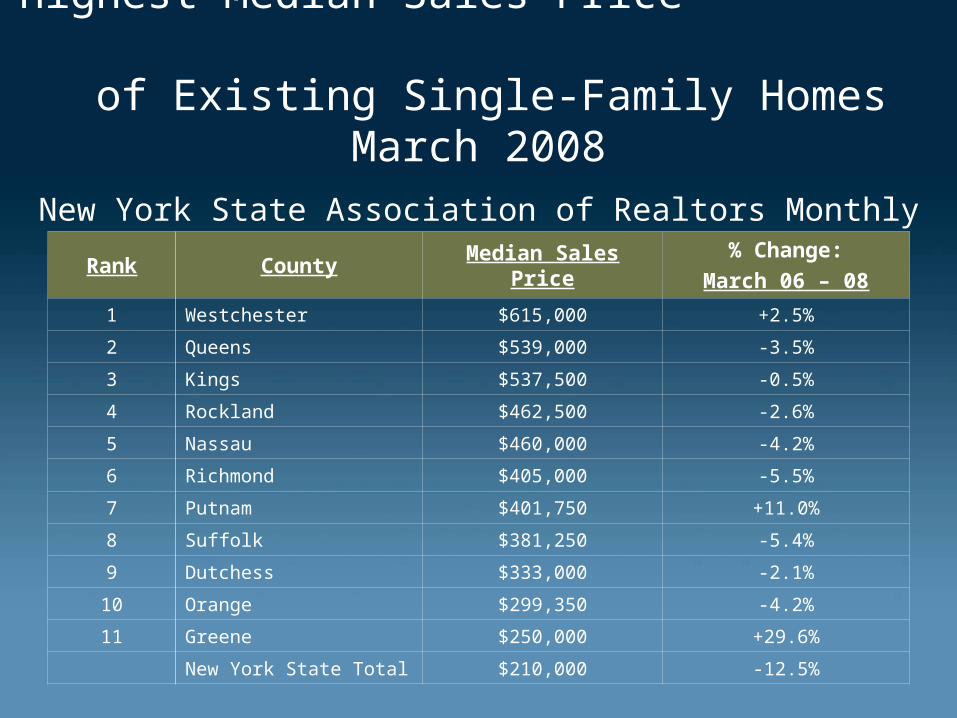
Highest Median Sales Price of Existing Single-Family Homes March
2008
New York State Association of Realtors Monthly Housing Survey
Rank County Median Sales Price% Change:
March 06 – 08
1 Westchester $615,000 +2.5%
2 Queens $539,000 -3.5%
3 Kings $537,500 -0.5%
4 Rockland $462,500 -2.6%
5 Nassau $460,000 -4.2%
6 Richmond $405,000 -5.5%
7 Putnam $401,750 +11.0%
8 Suffolk $381,250 -5.4%
9 Dutchess $333,000 -2.1%
10 Orange $299,350 -4.2%
11 Greene $250,000 +29.6%
New York State Total $210,000 -12.5%
For additional information, please contact:
Frank M. Surdey, Managing Economist
New York State Department of LaborDivision of Research and Statistics2001 Perimeter Road East, Suite 3Endicott, NY 13760
Phone: (607)741-4526 Fax: (607) 741-4527E-Mail: [email protected]