nutritional awareness among anganwadi workers...
TRANSCRIPT
1
NUTRITIONAL AWARENESS AMONG ANGANWADI WORKERS AND
THEIR IMPLEMENTATION TO NUTRITIONAL SERVICES: A
COMPARATIVE STUDY OF RURAL AND URBAN ZONE OF JAMMU
DISTRICT.
A THESIS SUBMITTED TO THE UNIVERSITY OF JAMMU
FOR THE AWARD OF
DOCTOR OF PHILOSOPHY
IN
HOME SCIENCE
(HUMAN DEVELOPMENT)
SUPERVISOR INVESTIGATOR
DR. (MRS.) SHASHI MANHAS ANNPURNA DOGRA
Associate Professor
Post Graduate Department of Home Science
University of Jammu
Jammu - 180006
2013
2
CERTIFICATE
This is to certify that, Annpurna Dogra ,P.hD. Scholar has worked for her degree of
Philosophy in Home Science (Human Development) under my supervision on the topic
―NUTRITIONAL AWARENESS AMONG ANGANWADI WORKERS AND
THEIR IMPLEMENTATION TO NUTRITIONAL SERVICES: A
COMPARATIVE STUDY OF RURAL AND URBAN ZONE OF JAMMU
DISTRICT.” This work is original and worthy of consideration for the award of Ph.D.
degree in Home Science (Human Development). She has fulfilled the statutory
requirement for submission of thesis for evaluation.
I further certify that the:
1. thesis embodies the work of the candidate.
2. candidate has worked under my supervision for the period required under statutes.
3. candidate has put in the required attendance in the department during the period
of research.
4. candidate has fulfilled the statutory conditions as laid down in section -18.
Dated :
Head of Department Supervisor
Prof. Neeru Sharma Dr. Shashi Manhas
P.G. Department of Home Science P.G. Department of Home Science
University of Jammu University of Jammu
Jammu Jammu
3
DECLARATION
The author of the present thesis, Annpurna Dogra, declares that the work reported in the
thesis has been entirely done by her under the supervision of Dr. Shashi Manhas,
Associate Professor of P.G. Department of Home Science (Human Development),
University Of Jammu. No part of the present work has been so far submitted in partial or
full for a degree in any university.
Dated: Annpurna Dogra
4
Dedicated to
My Parents and Brothers
5
ACKNOWLEDGEMENT
It is a matter of pleasure to glance back and recall the path one traverse
during days of hard work and perseverance. It is still great at this juncture to recall the
faces and sprits in the form of teachers, friends, near and dear ones. I would consider
this work, nothing more than incomplete without attending to the task of
acknowledging the overwhelming help; I received during this endeavor of mine.
The investigator, records her sincere thanks to Prof. Mohan Paul Singh
Isher, Vice Chancellor, University of Jammu , Jammu, for providing the infra structural
facilities for the conduct of the study.
With glowing sense of gratitude and honesty, the researcher places her sincere
and grateful thanks to her most honored guide Dr.Shashi Manhas , Associate Professor,
P.G. Department of Home Science, University of Jammu , for her dynamic guidance,
scholarly advice, affable help, amicable suggestions, constant encouragement, patience
and dedication, without which the conduct of the study would have been impossible.
Heartfelt thanks are expressed to Dr. Neeru Sharma, Professor and Head of
the Department of P.G Department of Home Science, University of Jammu, Jammu,
for her constant encouragement, warm and willing help rendered during the study.
Investigator expresses her sincere thanks to Dr. Rajni Dhingra, Professor and Conveyor
of Departmental Research Committee, P.G. Department of Home Science, University of
Jammu, Jammu, for her valuable support and guidance rendered during the research
process.
6
The investigator also expresses her warm gratitude to all her COLLEAGUES and
FRIENDS for their valuable help and suggestions rendered throughout the tenure of
the research work.
The investigator expresses her sincere thanks to the STAFF MEMBERS of
the Social Welfare Department, Jammu and anganwadi workers from Jammu district
for their help and cooperation.
The investigator owes her gratitude to all the subjects for their kind
cooperation in the conduct of the study.
Finally, on a personal note, the investigator owes her respected and very
special thanks to her FAMILY MEMBERS for their unending love and unconditional
support, without whose help, co-operation and encouragement, this research would not
be successful.
Above all, the investigator raises her humble heart in adoration to GOD
ALMIGHTY, who in His infinite goodness and wisdom has designed and executed the
research.
Dated: Annpurna Dogra
7
“Nutritional Awareness Among Anganwadi Workers and Their
Implementation to Nutritional Services: A Comparative Study of Rural
and Urban Zone of Jammu District.”
ABSTRACT
In pursuance to the national policy for children, the Government of India launched the
Integrated Child Development Services (ICDS) Scheme, which was introduced on
experimental basis on 2nd October 1975. ICDS today represents one of the world's
largest programmes for early childhood development. ICDS Scheme is the most
comprehensive scheme of the Government of India for early childhood care and
development. It aims at enhancing survival and development of children from the
vulnerable sections of the society. Being the world's largest outreach programme
targeting infants and children below six years of age, expectant and nursing mothers,
ICDS has generated interest worldwide amongst academicians, planners, policy makers,
administrators and those responsible for implementation. The Anganwadi worker
(AWW) is the community based voluntary frontline worker of the ICDS programme.
Selected from the community, anganwadi worker assumes a pivotal role due to her close
and continuous contact with the beneficiaries. The output of the ICDS scheme is to a
great extent dependant on the profile of the key functionary i,e. the anganwadi worker,
her qualification, experience, skills, attitude., training etc. The present study was
conducted to assess the implementation of nutritional services provided to pre- schoolars
(3-6 yrs), to assess the nutritional awareness among anganwadi workers and to study the
influence of their knowledge for improved performance at anganwadi centre, to study the
comparison for the level of nutritional awareness among anganwadi workers and their
implementation to nutritional services between rural and urban zone of Jammu district, to
assess the nutritional status of pre- schoolars (3-6 yrs) attending anganwadi centers and to
study the evaluation of the final output and expected output of nutritional services at
anganwadi centers. The study was conducted in urban and rural zone of Jammu district.
Under rural zone, Bishnah block and Purmandal block were selected for sample locale

8
while under urban zone Jammu block was studied as sample locale. 50 Anganwadi
workers and 150 preschool children (3-6 years) from each zone of rural and urban areas
were selected as respondents. Total sample size of respondents for the study was 400.
Multi stage sampling technique was adopted for sample selection. Samples were
randomly selected for the purpose. In order to collect data, the tools used were
observation method, self devised interview schedule, anthropometric measurements and
24- hour dietary recall sheet. After conducting a pre testing on 10 % population of study
sample and making minor modifications in the design of tools, the final data of the study
was collected. Data was collected by visits made to anganwadi centers. The data obtained
was coded and tabulated. Analysis of the data was done qualitatively and quantitatively.
Results related to Demographic profile of anganwadi workers revealed that
majority of anganwadi workers were young workers up to the age group of 33 years,
were non graduates and had work experience of around 20-30 years. Majority of
anganwadi workers were reported to be trained. Majority anganwadi centers had
enrollment of 20-30 children (55%) in the age group of 0-6 years while 5-10 children
(57%) in the age group of 3-6 years. The physical infrastructure of anganwadi centers
under study reflected that majority of anganwadi centers had pacca buildings, with
congested indoor space while non- congested outdoor space. Majority of anganwadi
centers had storage space within the main room and separate space for cooking was also
available to them. Majority of anganwadi centers were found to be well ventilated and
had hygienic conditions. In Majority of anganwadi centers, electricity and toilet facility
was not available. All the anganwadi centers had drinking water facility.
Results regarding implementation of nutritional services at anganwadi centers
showed that only 36 % anganwadi workers were following official menu for
supplementary menu. Use of standard measure by anganwadi workers for weighing raw
food was more in practice than cooked food. Only 4 % anganwadi workers were found to
practice weighing of raw as well as cooked food. It was revealed by study that majority
of children attending anganwadi centers were consuming the supplementary meal
partially. It was observed that children were either taking their food home along with
them or were partially consuming the food for the sake of demonstration in presence of
outside visitor. Majority of anganwadi centers had Salter scale for weighing of children
9
and 52 % anganwadi workers had maintained records. The accuracy in proper use of
weighing scale by anganwadi worker was found to be 57% while accuracy in plotting
weight on growth chart by anganwadi worker was found to be 49%. Only 42 %
anganwadi workers were found to be accurate in both the skills. 51 % anganwadi workers
conducted nutrition and health education (NHED) sessions at their respective centers.
Majority of them had conducted NHED sessions for once a month.
Majority of anganwadi workers had medium awareness regarding nutrition.
Majority of them had a clear concept about health and balanced diet and had awareness
regarding the caloric need of pre schoolars for supplementary nutrition in ICDS and
caloric need of malnourished child for supplementary nutrition. 13 % anganwadi workers
were familiar with the full form of term RDA (recommended dietary allowances) and
8 % workers were aware about the RDA‘s of preschool children. The study revealed that
awareness regarding functions of food, sources of nutrients and nutritive value of food
was not very much clear among anganwadi workers. Anganwadi workers had fair
knowledge about energy foods, body building foods, and protective food. Majority of
them had knowledge about pulses as a source of protein and importance of protein for
preschool children but only 3 % were familiar with number of calories present in 1 gm
protein. The study revealed that anganwadi workers recognized malnutrition as major
cause of death among children below five and were familiar with the number of grades of
malnutrition. Awareness regarding the deficiency diseases was although good except for
vitamin B and vitamin C. It has been analyzed that there is positive influence of nutrition
awareness on implementation of nutritional services at anganwadi centre.
The comparison between urban and rural zone showed that urban anganwadi
workers with high awareness level showed better participation for implementation of
nutritional services in comparison to rural anganwadi workers with high awareness.
Results related to nutritional status of preschool children (3-6 years) attending anganwadi
centre revealed that in spite of higher percentage adequacy of nutrient intake by rural
children, they were reported to be more malnourished in comparison to urban preschool
children for the parameters of height for age (HFA), weight for height (WFH). Results
related to study the evaluation of the final output and expected output of nutritional
10
services at anganwadi centers revealed that there is huge difference between the expected
output and actual output of nutritional services
On the basis of findings of the study, intervention programs were conducted. A
power point presentation and informal discussion methods were used for the intervention
programme. A positive response and active participation by anganwadi workers was
achieved through these intervention programs. The present study shows that performance
as well as awareness among anganwadi workers regarding the importance of
implementation of nutritional services was not satisfactory. Although the anganwadi
workers were mostly familiar with the knowledge for various nutritional services of
ICDS but the provision of these services, their importance for the programme was not
clear to them, also the implementation part of these services was immensely lacking in
aspect of effective utilization of these services by the beneficiaries and for beneficiaries.
The study concluded that irregularities at work place was the common practice among
anganwadi workers. Their nutritional knowledge regarding the role of supplementary
nutrition and ICDS norms was not up to the mark as expected from a trained worker and
hence an utmost need of regular quality training as well as on spot training programme
was strongly felt. The study also suggests that the quality of training being provided to
anganwadi workers at training centers should be strictly scrutinized as it is the first step
towards the achievements of goals of ICDS.

11
CONTENTS
CERTIFICATE
DECLARATION
ACKNOWLEDGEMENT
ABSTRACT
LIST OF TABLES
LIST OF FIGURES
CHAPTER
NO.
TITLE PAGE
NO.
1 INTRODUCTION 1-44
2 REVIEW OF LITERATURE 45-84
3 RESEARCH METHODOLOGY 85-97
4 RESULTS AND DISCUSSION 98-204
SECTION 4.1: Demographic Profile of Anganwadi Worker. 99-105
SECTION 4.2: Enrollment of Children in Anganwadi
Centre.
106-109
SECTION 4.3: Physical Infrastructure of Anganwadi
Centre.
110-119
SECTION 4.4: Implementation of Nutritional Services at
Anganwadi Centre.
120-134
SECTION 4.5: Nutritional Awareness among Anganwadi
Worker.
135-149
SECTION 4.6: Influence of Nutritional Awareness of
Anganwadi Workers on Implementation of Nutritional
Services at Anganwadi Centre.
150-151
12
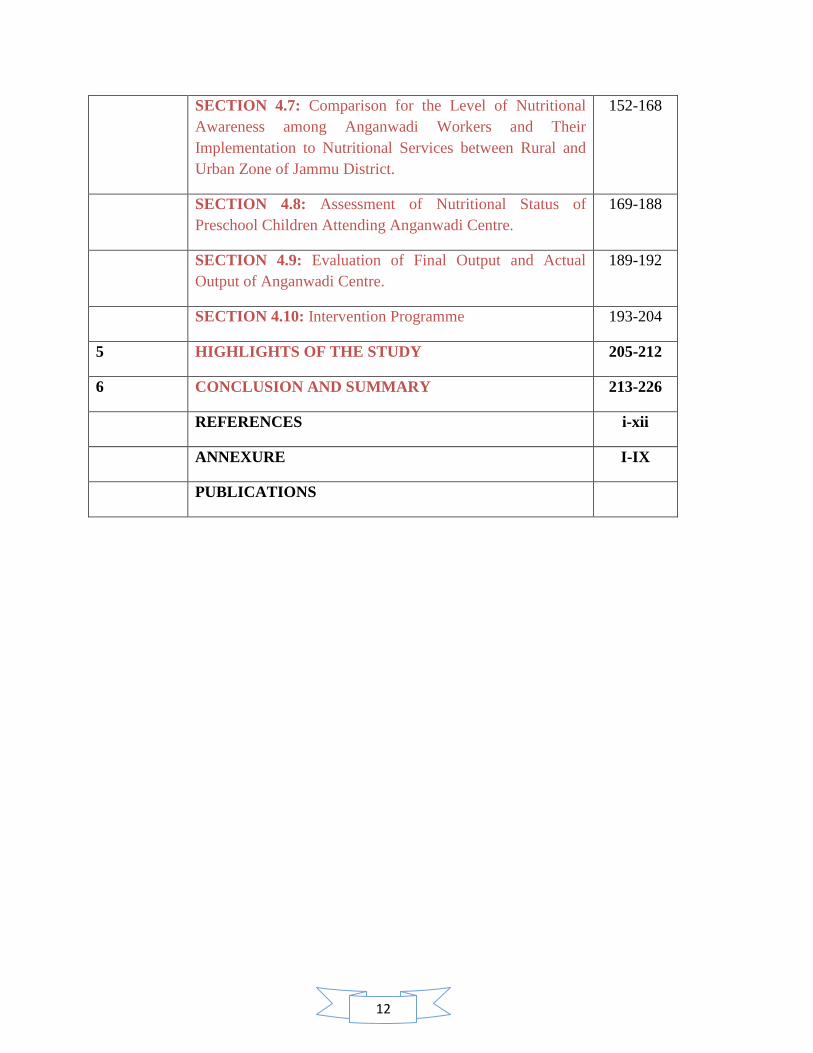
SECTION 4.7: Comparison for the Level of Nutritional
Awareness among Anganwadi Workers and Their
Implementation to Nutritional Services between Rural and
Urban Zone of Jammu District.
152-168
SECTION 4.8: Assessment of Nutritional Status of
Preschool Children Attending Anganwadi Centre.
169-188
SECTION 4.9: Evaluation of Final Output and Actual
Output of Anganwadi Centre.
189-192
SECTION 4.10: Intervention Programme 193-204
5 HIGHLIGHTS OF THE STUDY 205-212
6 CONCLUSION AND SUMMARY 213-226
REFERENCES i-xii
ANNEXURE I-IX
PUBLICATIONS
13
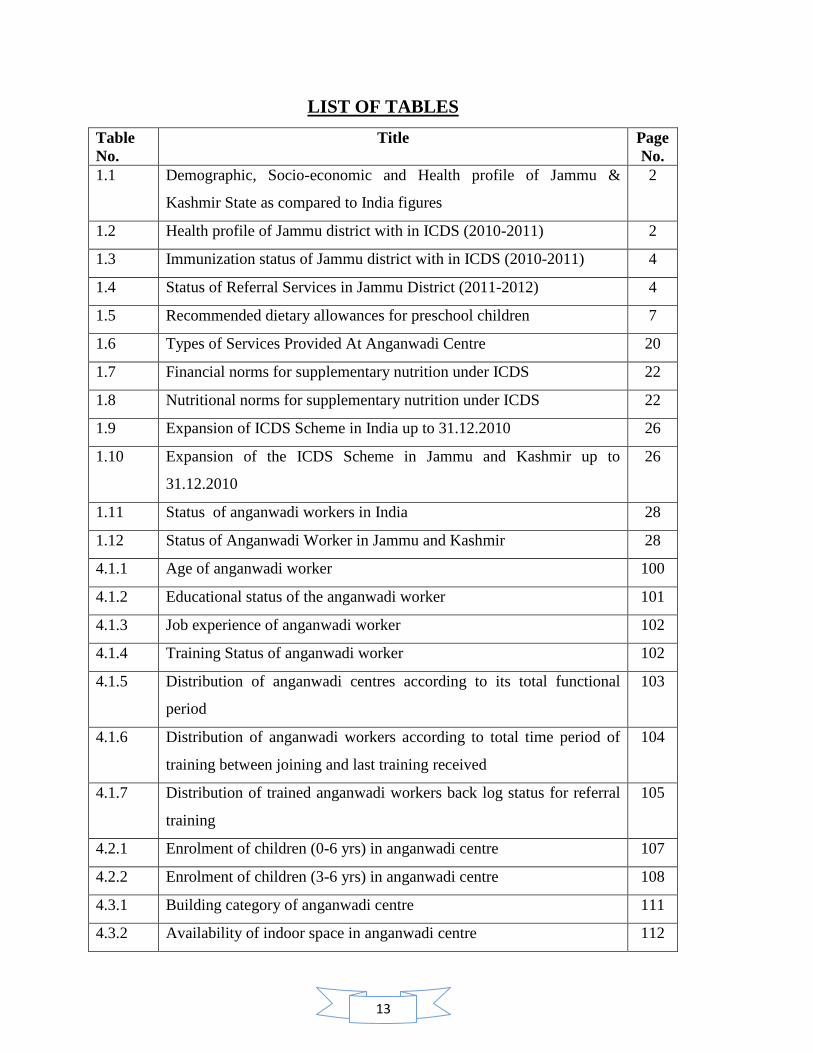
LIST OF TABLES
Table
No.
Title Page
No.
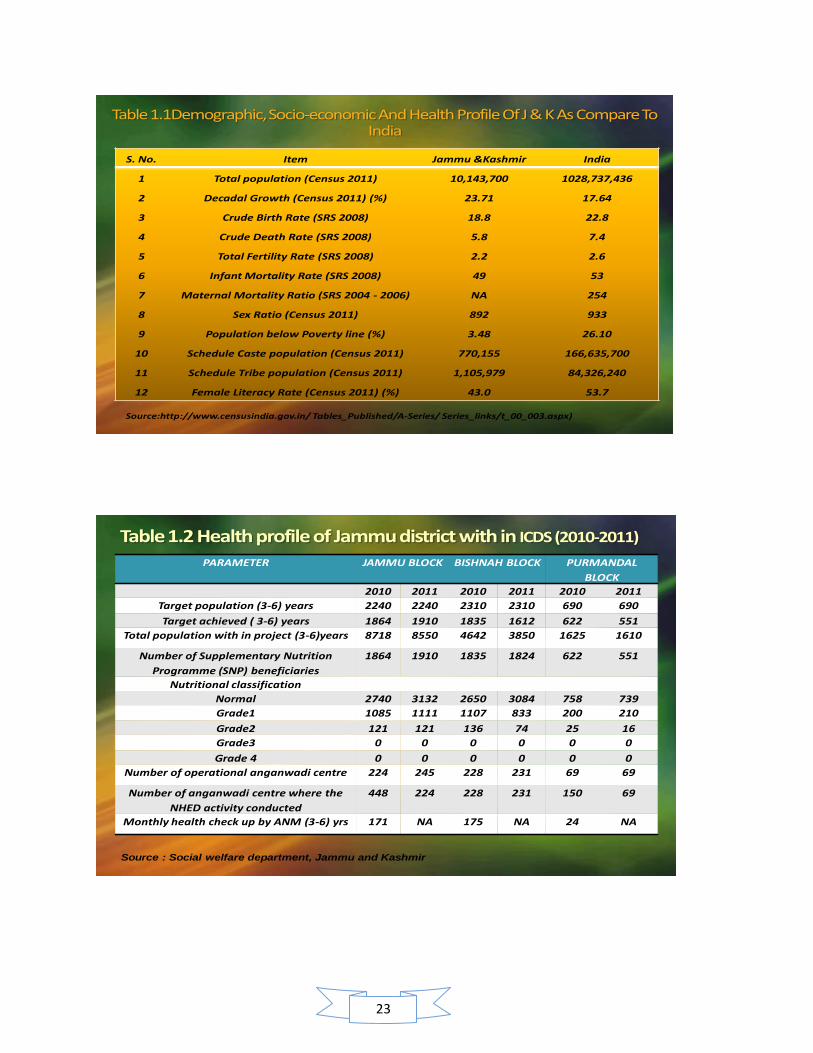
1.1 Demographic, Socio-economic and Health profile of Jammu &
Kashmir State as compared to India figures
2
1.2 Health profile of Jammu district with in ICDS (2010-2011) 2
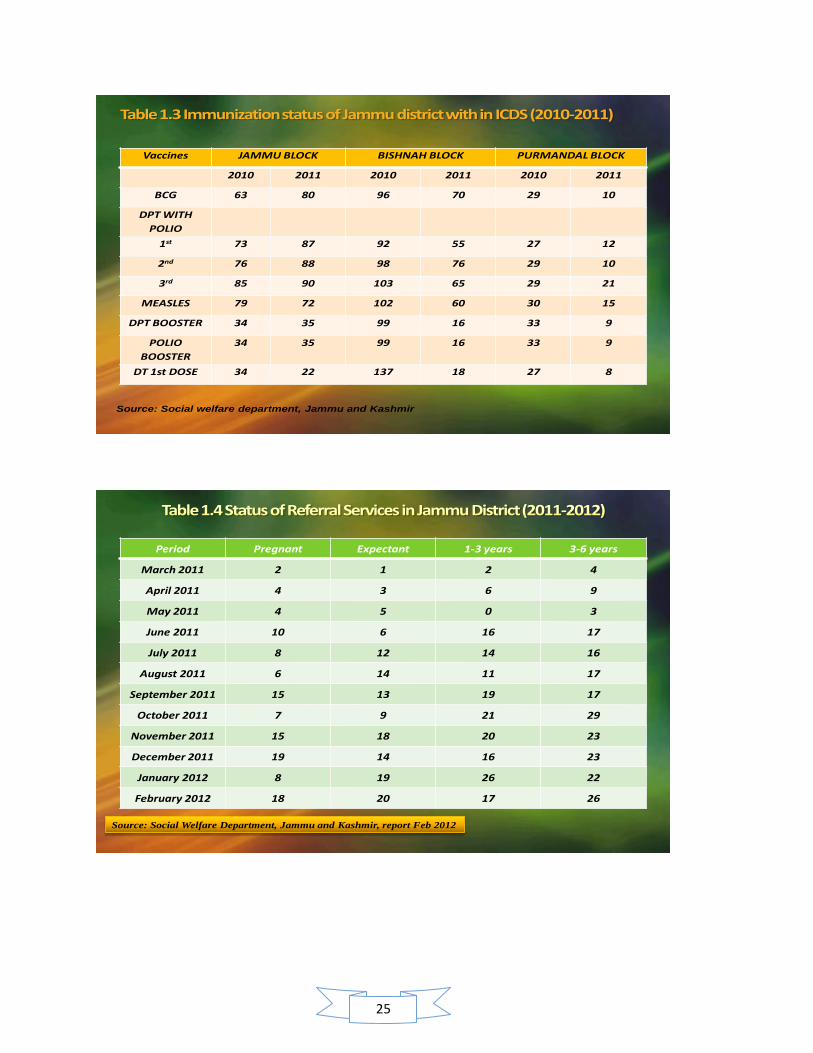
1.3 Immunization status of Jammu district with in ICDS (2010-2011) 4
1.4 Status of Referral Services in Jammu District (2011-2012) 4
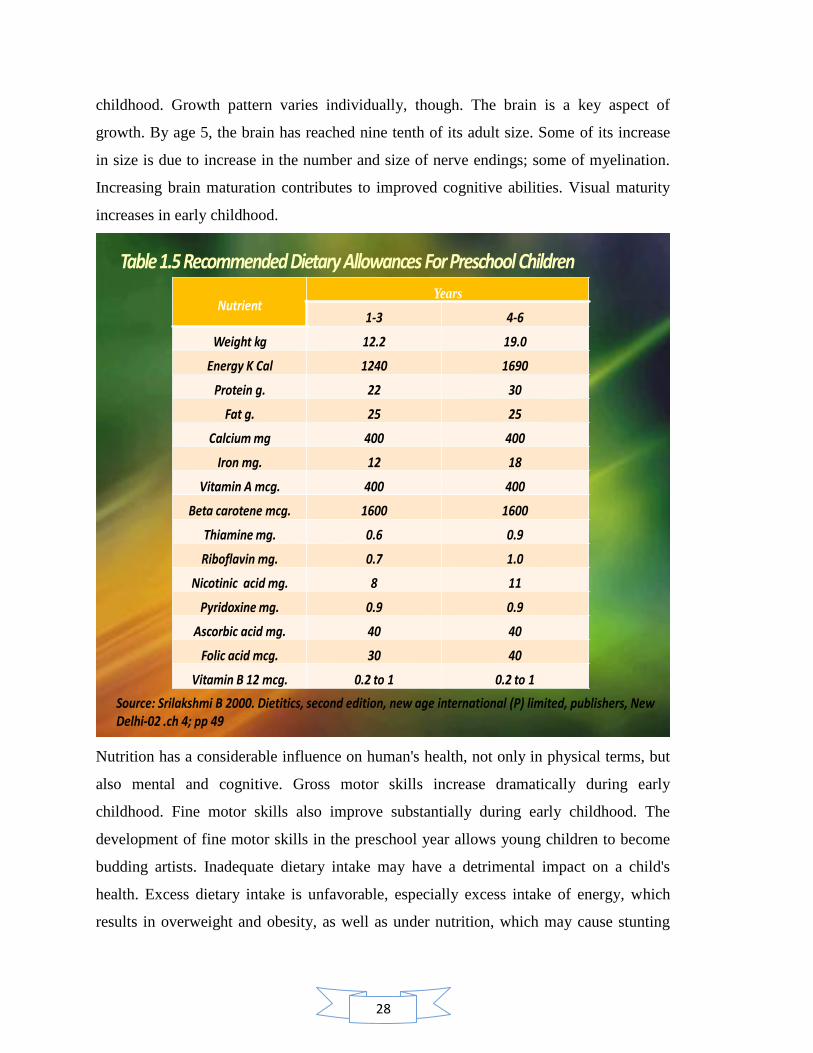
1.5 Recommended dietary allowances for preschool children 7
1.6 Types of Services Provided At Anganwadi Centre 20
1.7 Financial norms for supplementary nutrition under ICDS 22
1.8 Nutritional norms for supplementary nutrition under ICDS 22
1.9 Expansion of ICDS Scheme in India up to 31.12.2010 26
1.10 Expansion of the ICDS Scheme in Jammu and Kashmir up to
31.12.2010
26
1.11 Status of anganwadi workers in India 28
1.12 Status of Anganwadi Worker in Jammu and Kashmir 28
4.1.1 Age of anganwadi worker 100
4.1.2 Educational status of the anganwadi worker 101
4.1.3 Job experience of anganwadi worker 102
4.1.4 Training Status of anganwadi worker 102
4.1.5 Distribution of anganwadi centres according to its total functional
period
103
4.1.6 Distribution of anganwadi workers according to total time period of
training between joining and last training received
104
4.1.7 Distribution of trained anganwadi workers back log status for referral
training
105
4.2.1 Enrolment of children (0-6 yrs) in anganwadi centre 107
4.2.2 Enrolment of children (3-6 yrs) in anganwadi centre 108
4.3.1 Building category of anganwadi centre 111
4.3.2 Availability of indoor space in anganwadi centre 112
14
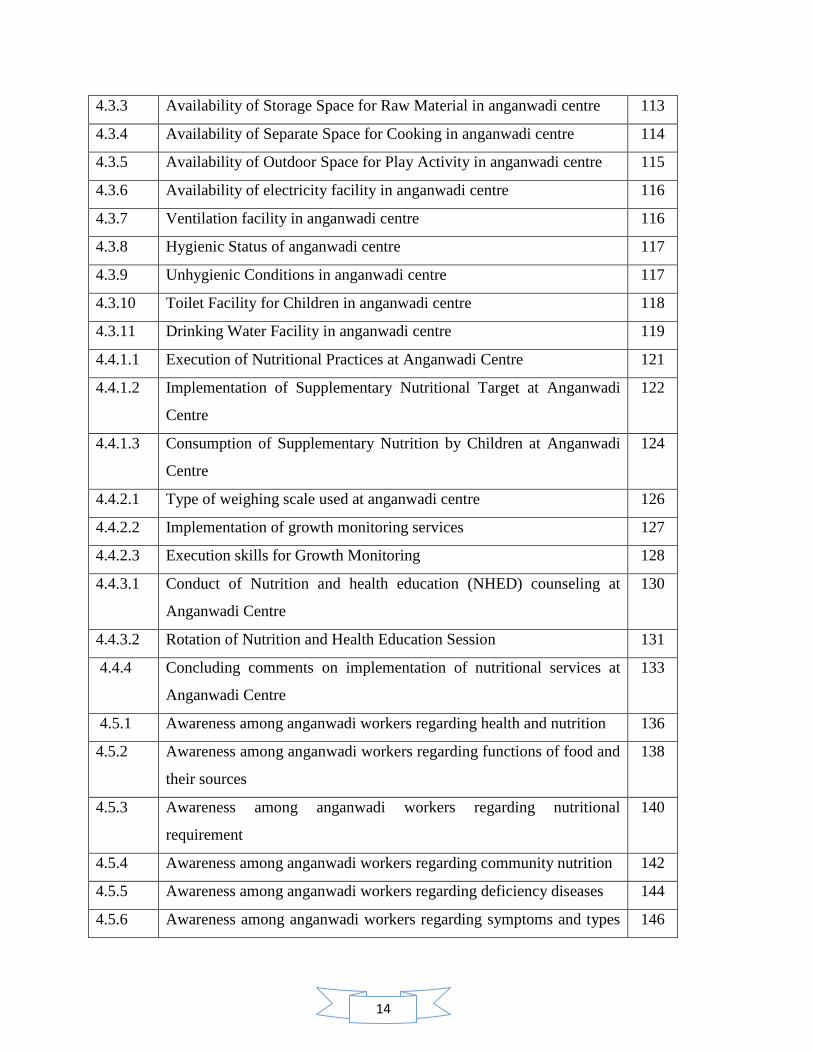
4.3.3 Availability of Storage Space for Raw Material in anganwadi centre 113
4.3.4 Availability of Separate Space for Cooking in anganwadi centre 114
4.3.5 Availability of Outdoor Space for Play Activity in anganwadi centre 115
4.3.6 Availability of electricity facility in anganwadi centre 116
4.3.7 Ventilation facility in anganwadi centre 116
4.3.8 Hygienic Status of anganwadi centre 117
4.3.9 Unhygienic Conditions in anganwadi centre 117
4.3.10 Toilet Facility for Children in anganwadi centre 118
4.3.11 Drinking Water Facility in anganwadi centre 119
4.4.1.1 Execution of Nutritional Practices at Anganwadi Centre 121
4.4.1.2 Implementation of Supplementary Nutritional Target at Anganwadi
Centre
122
4.4.1.3 Consumption of Supplementary Nutrition by Children at Anganwadi
Centre
124
4.4.2.1 Type of weighing scale used at anganwadi centre 126
4.4.2.2 Implementation of growth monitoring services 127
4.4.2.3 Execution skills for Growth Monitoring 128
4.4.3.1 Conduct of Nutrition and health education (NHED) counseling at
Anganwadi Centre
130
4.4.3.2 Rotation of Nutrition and Health Education Session 131
4.4.4 Concluding comments on implementation of nutritional services at
Anganwadi Centre
133
4.5.1 Awareness among anganwadi workers regarding health and nutrition 136
4.5.2 Awareness among anganwadi workers regarding functions of food and
their sources
138
4.5.3 Awareness among anganwadi workers regarding nutritional
requirement
140
4.5.4 Awareness among anganwadi workers regarding community nutrition 142
4.5.5 Awareness among anganwadi workers regarding deficiency diseases 144
4.5.6 Awareness among anganwadi workers regarding symptoms and types 146
15
of deficiency diseases
4.5.7 Nutritional awareness among anganwadi workers in Jammu district 148
4.6.1 Regression Analysis 151
4.7.1.1 Execution of Nutritional Practices at Anganwadi Centre 153
4.7.1.2 Implementation of supplementary Nutritional Target at Anganwadi
Centre
155
4.7.1.3 Consumption of Supplementary Nutrition by Children at Anganwadi
Centre
157
4.7.2.1 Implementation of services under Growth Monitoring 159
4.7.2.2 Execution Skills of Anganwadi Worker under Growth Monitoring 161
4.7.3.1 Nutrition and Health Education (NHED) counseling at Anganwadi
Centres.
163
4.7.3.2 Rotation of Nutrition and Health Education (NHED) Session 165
4.7.4 Concluding Table 167
4.8.1.1 Age and sex variation in anthropometric characteristics of urban and
rural children of Jammu district
170
4.8.1.2 Nutritional status and age of children 172
4.8.1.3 Nutritional status and sex of children 174
4.8.1.4 Classification of Types of Malnutrition Based On Z- Scores for Urban
and Rural Boys (3-4 Years) of Jammu District
176
4.8.1.5 Classification of Types of Malnutrition Based On Z- Scores for Urban
and Rural Girls (3-4 Years) of Jammu District
177
4.8.1.6 Classification of Types of Malnutrition Based On Z- Scores for Urban
and Rural Boys (4-5 Years) of Jammu District
178
4.8.1.7 Classification of Types of Malnutrition Based On Z- Scores for Urban
and Rural Girls (4-5 Years) of Jammu District
179
4.8.1.8 Classification of Types of Malnutrition Based On Z- Scores for Urban
and Rural Boys (5-6Years) of Jammu District
180
4.8.1.9 Classification of Types of Malnutrition Based On Z- Scores for Urban
and Rural Girls (5-6 Years) of Jammu District
181

16
4.8.1.10 Classification of Types of Malnutrition Based on Z- Scores for Urban
and Rural children (3-6 Years) of Jammu District
183
4.8.2.1 Mean nutrient intakes of the children by structured 24 hour dietary
recall method
185
4.8.2.2 Children‘s percentage between 3-6 years meeting Recommended
Daily Allowance
187
4.9.1 Evaluation of final output and expected output of nutritional services
at anganwadi centres
190
5.1 Nutritional Status among Urban and Rural Pre School Children 211
5.2 Dietary Intake of Majority Child Population in Terms of
Recommended Daily Allowance
212
17
LIST OF FIGURES
Figure
No.
Title Page
No.
1.1 Conceptual Framework For The Causes Of Malnutrition 14
1.2 Organizational Set Up Of ICDS 27
1.3 Focus Areas Of Training Schedule Of Anganwadi Worker In Nutrition
And Health
30
1.4 Justification Of The Study 42
3.1 Diagrammatic Representation of Sample 86
3.2 Sample description of the study 89
3.3 Sample size of the study 89
3.4 Tools for the study 91
3.5 Objectives of the tools 91
4.1 Enrolment of Children (0-6 Yrs) In Anganwadi Centre 107
4.2 Implementation of Supplementary Nutritional Target at Anganwadi
Centre
123
4.3 Execution Skills for Growth Monitoring 129
4.4 Awareness among Anganwadi Workers Regarding Health and Nutrition 136
4.5 Awareness among Anganwadi Workers Regarding Functions of Food
and Their Sources
138
4.6 Awareness among Anganwadi Workers Regarding Nutritional
Requirement
140
4.7 Awareness among Anganwadi Workers Regarding Community
Nutrition
142
4.8 Awareness among Anganwadi Workers Regarding Deficiency Diseases 144
4.9 Awareness among Anganwadi Workers Regarding Symptoms and
Types of Deficiency Diseases
146
4.10 Execution of Nutritional Practices at Anganwadi Centre 154
4.11 Consumption of Supplementary Nutrition by Children at Anganwadi
Centre
157
4.12 Implementation of Services under Growth Monitoring 159
18
4.13 Nutrition and Health Education (NHED) Counseling at Anganwadi
Centre
164
4.14 Rotation of Nutrition and Health Education (NHED) Session 166
4.15 Sample area for intervention programme 198
4.16 Conduct of intervention programme 198
4.17 Communicative tools of intervention programme 200
5.1 Effect of Improper Execution of Nutrition Practices Applicable At
Anganwadi Centre
205
5.2 Improper Implementation of Nutritional Services Affecting Nutritional
Target to Be Achieved At Anganwadi Centre
207
5.3 Nutritional Status of Pre Scholars Attending Anganwadi Centres at
Urban and Rural Zone of Jammu District
210

19
Chapter 1
Introduction
20
CHAPTER 1: INTRODUCTION
Contents:
1.1 Status of Health in Jammu & Kashmir
1.1.1 Health indicators of Jammu & Kashmir
1.2 Nutrition
1.2.1 Children: The Valuable Asset of Nation
1.2.2 The Importance of Nutrition in Preschool Age
1.2.3 The Effect Of Under Nutrition on Schooling
1.2.4 The Indian Challenge for Child Survival
1.3 Malnutrition – An Unsolved Mystery
1.3.1 Under-Nutrition
1.3.2 The Effect Of Under Nutrition on Morbidity, Mortality, Cognitive and Motor Development
1.3.3 Protein-energy malnutrition (PEM)
1.3.4 A conceptual framework of the causes of under nutrition 1.3.4. (a) The immediate causes of under nutrition 1.3.4. (b) The underlying determinants of under nutrition
A. Household-level food security B. Access to health resources i. Access to sufficient clean water, good sanitation and a clean living environment.
ii. Access to health services, including vector and disease control
C. Adopting appropriate childcare behaviors
1.3.4. (c) The basic determinants of under nutrition
1.4 Integrated Child Development Scheme (ICDS)
1.4.1 The design of the ICDS program and the underlying causes of child under nutrition
1.4.2 Types of services provided at anganwadi centre
21
1.4.2 (a) SUPPLEMENTARY NUTRITION
I. SUPPLEMENTARY NUTRITION NORMS i. Financial norms
ii. Nutritional Norms II. Type Of Supplementary Nutrition i. Children in the age group 0 – 6 months
ii. Children in the age group 6 months to 3 years iii. Children in the age group 3 to 6 years
1.4.2. (b) PRE-SCHOOL EDUCATION
1.4.2. (c) IMMUNIZATION
1.4.2. (d )HEALTH CHECK-UPS
1.4.2. (e) REFERRAL SERVICES
1.4.2. (f) NUTRITION AND HEALTH EDUCATION (NHED)
1.4.3. Budgetary Allocation under ICDS in India
1.4.4 Budgetary Allocation under ICDS for Jammu and Kashmir
1.4.5 Utilization of Fund under ICDS in Jammu and Kashmir
1.5 Anganwadi Centre
1.5.1 A Typical Anganwadi Centre
1.5.2 Structure and personnel
1.5.3 The job training curriculum of the anganwadi worker
1.5.4 Role of Nutrition Knowledge and Performance of Anganwadi Worker
1.5.5 Job Responsibilities of the Anganwadi Worker
1.6 Justification of the Study
1.7 Objectives of the Study
1.8 Research Questions of the Study
22
INTRODUCTION
Good health is the basic objective of any development effort. The concept of human
development rests on three pillars: knowledge, health and livelihood. Health of the people
has been recognized as a valuable national resource and the government‘s endeavor has
been to improve the same and enable them to contribute to the enhancement of the
nation‘s productivity. Health is defined by World Health Organization (WHO) as a state
of complete physical, mental and social well-being and not just avoidance of disease.
Physical health implies the perfect functioning of the body (WHO, 1948). It
conceptualizes health as a state in which every cell or organ is functioning at optimum
capacity and is in perfect harmony with the rest of the body. Mental health implies not
merely the absence of illness but the state of balance between the individual and the
surrounding world, and a state of harmony between oneself and others, and coexistence
between oneself and others and between the realities of self and that of other people and
that of the environment. Social well-being implies the quality and quantity of
interpersonal ties and the extent of involvement with in the individual, between each
individual and other member of the society and between each individual and the world in
which he lives. Thus health is a multidimensional and a holistic concept involving the
well-being of the whole community.
1.1 STATUS OF HEALTH IN JAMMU & KASHMIR
One of the largest states of the Indian union, Jammu and Kashmir covers an area of 2,
22,236 sq km. Geographically, the Jammu and Kashmir state is divided into four zones.
First, the mountainous and semi- mountainous plain commonly known as Kandi belt, the
second, hills including Siwalik ranges, the third, mountains of Kashmir valley, and
Pir Panjal range and the fourth is Tibetan tract of Ladakh and Kargil. Initially it was seen
that the health status of the people was poor due to prevalence of diseases of various
kinds resulting in morbidity and mortality. This was specially so with respect to women
and children. The constraints in the improvement of health status of the people included
lack of financial resources, dearth of technical staff, and inadequate health infrastructure.
Therefore, in order to improve the health status and to achieve the objectives of ―Health
23
S. No. Item Jammu &Kashmir India
1 Total population (Census 2011) 10,143,700 1028,737,436
2 Decadal Growth (Census 2011) (%) 23.71 17.64
3 Crude Birth Rate (SRS 2008) 18.8 22.8
4 Crude Death Rate (SRS 2008) 5.8 7.4
5 Total Fertility Rate (SRS 2008) 2.2 2.6
6 Infant Mortality Rate (SRS 2008) 49 53
7 Maternal Mortality Ratio (SRS 2004 - 2006) NA 254
8 Sex Ratio (Census 2011) 892 933
9 Population below Poverty line (%) 3.48 26.10
10 Schedule Caste population (Census 2011) 770,155 166,635,700
11 Schedule Tribe population (Census 2011) 1,105,979 84,326,240
12 Female Literacy Rate (Census 2011) (%) 43.0 53.7
Source:http://www.censusindia.gov.in/ Tables_Published/A-Series/ Series_links/t_00_003.aspx)
PARAMETER JAMMU BLOCK BISHNAH BLOCK PURMANDAL
BLOCK
2010 2011 2010 2011 2010 2011
Target population (3-6) years 2240 2240 2310 2310 690 690
Target achieved ( 3-6) years 1864 1910 1835 1612 622 551
Total population with in project (3-6)years 8718 8550 4642 3850 1625 1610
Number of Supplementary Nutrition
Programme (SNP) beneficiaries
1864 1910 1835 1824 622 551
Nutritional classification
Normal 2740 3132 2650 3084 758 739
Grade1 1085 1111 1107 833 200 210
Grade2 121 121 136 74 25 16
Grade3 0 0 0 0 0 0
Grade 4 0 0 0 0 0 0
Number of operational anganwadi centre 224 245 228 231 69 69
Number of anganwadi centre where the
NHED activity conducted
448 224 228 231 150 69
Monthly health check up by ANM (3-6) yrs 171 NA 175 NA 24 NA
Source : Social welfare department, Jammu and Kashmir
24
for All‖, the Government of India enunciated the National Health Policy in 1983. In
response to this, the state government initiated a number of programmes and activities
through which health and medical services could flow to the needy and gradually achieve
the aims and objectives set under the national policy. As a result, some improvement was
seen in the health status of the people.
While this is in itself a positive sign, the rates of change are far too slow for sustainable
development and a better quality of life for the people. The state has not been able to
keep pace with the national level achievement, in spite of giving due priority to the health
sector while distributing state resources. Further, recent disturbances may also have
worsened the condition. Consequently, the state till date has a considerable segment of
population living below poverty line, with poor infrastructure amongst abundant
resources. Under such conditions, women are the most affected, given the burden of child
bearing in a patriarchal set up. Poverty coupled with poor social status, lack of access to
social development, increases health problems. Set in this background, this sub-section
presents an intriguing picture of the health status in Jammu and Kashmir as measured by
fertility, mortality and morbidity indicators. These vital indicators indicate the health
status and well-being of the people in society, and give a broad idea of the issues related
to health and nutrition.
1.1.1 HEALTH INDICATORS OF JAMMU & KASHMIR
The Total Fertility Rate of the State is 2.2. The Infant Mortality Rate is 49 and Maternal
Mortality Ratio is NA (SRS 2004 - 2006). The Sex Ratio in the State is 892 (as compared
to 933 for the country). Comparative figures of major health and demographic indicators
are shown in table 1.1
25
Vaccines JAMMU BLOCK BISHNAH BLOCK PURMANDAL BLOCK
2010 2011 2010 2011 2010 2011
BCG 63 80 96 70 29 10
DPT WITH
POLIO
1st 73 87 92 55 27 12
2nd 76 88 98 76 29 10
3rd 85 90 103 65 29 21
MEASLES 79 72 102 60 30 15
DPT BOOSTER 34 35 99 16 33 9
POLIO
BOOSTER
34 35 99 16 33 9
DT 1st DOSE 34 22 137 18 27 8
Source: Social welfare department, Jammu and Kashmir
Period Pregnant Expectant 1-3 years 3-6 years
March 2011 2 1 2 4
April 2011 4 3 6 9
May 2011 4 5 0 3
June 2011 10 6 16 17
July 2011 8 12 14 16
August 2011 6 14 11 17
September 2011 15 13 19 17
October 2011 7 9 21 29
November 2011 15 18 20 23
December 2011 19 14 16 23
January 2012 8 19 26 22
February 2012 18 20 17 26
Source: Social Welfare Department, Jammu and Kashmir, report Feb 2012

26
1.2 NUTRITION: Nutrition is the science of foods, the nutrients and other
substances therein; their action, interaction and balance in relationship to health and
disease. It can be defined as the process by which the organism ingests, digests, absorbs,
transports and utilizes nutrients and disposes of their end products. Nutrition can also be
defined as ―food at work in the body‖. Nutrition must perforce be concerned with social,
economic, cultural and psychological implications of food and eating. Good, adequate
and optimum are the terms applied to that quality of nutrition in which the essential
nutrients in correct amounts and balance are utilized to promote the highest level of
physical and mental health throughout one‘s life. (Moorthy, 1993)
Better nutrition means stronger immune systems, less illness and better health. Healthy
children learn better. Healthy people are stronger, are more productive and more able to
create opportunities to gradually break the cycles of both poverty and hunger in a
sustainable way. Better nutrition is a prime entry point to ending poverty and a
milestone to achieving better quality of life. Freedom from hunger and malnutrition is a
basic human right and their alleviation is a fundamental prerequisite for human and
national development.
1.2.1 CHILDREN: THE VALUABLE ASSET OF NATION
The years between 1-6 years, growth is generally slower than in the first year of life but
continues gradually. Activity also increases markedly during the second year of life as the
child becomes increasingly mobile .Development of full dentition by about the age of 2
years also increases the range of foods that can safely be eaten. There is an increased
need for all nutrients, but the pattern of increase varies for different nutrients in relation
to their role in growth of specific tissues. (Srilakshmi, 2000)
―In every child who is born, under what circumstances, and no matter what parents,
the potentiality of the human race is born again.‖
- James Agee, American Writer, 20th Century.
27
Pre-school children constitute one of the most nutritionally vulnerable segments of the
population and their nutritional status is considered as a sensitive indicator of community
health and nutrition. However, there has not been any substantial improvement in their
dietary intake over the last couple of decades. Data on energy intake in children,
adolescents and adults from surveys in rural areas in nine states carried out by National
Nutrition Monitoring Bureau (NNMB) in 2000, shows that mean energy consumption, as
percentage of recommended dietary allowances (RDA) is the least among preschool
children, in spite of the fact that their requirement is the lowest. NNMB data on time
trends in intra-familial distribution of food indicate that while the proportion of families
where both adults and preschool children have adequate food has remained at around
30%, over the last 20 years the proportion of families with inadequate intake has come
down substantially. However, the proportion of families where pre-school children
receive inadequate food intake while adults have adequate intake has nearly doubled.
This is despite the fact that the RDA for preschool children forms a very small proportion
(on an average 1300 Kcal/day) of the family‘s total intake of around 11000 Kcal/day
(assuming a family size of 5). It would, therefore, appear that young child feeding and
caring practices, and not poverty and lack of food at home, are becoming major factors
responsible for inadequate dietary intake in preschool children.
1.2.2 THE IMPORTANCE OF NUTRITION IN PRESCHOOL AGE
Preschool age is a special period in human ontogenesis. Although young children‘s
physical growth and development are slower than in infancy, their lives are very active -
the most active of any period in the human life span (Santrock, 1997). Changes in body
size and body proportions become slower, while all the organs and systems develop and
improve their functioning, especially the digestive, respiratory and motor systems. At the
end of this period a child should achieve school-readiness, not only physical, but also
mental and emotional. One of the most important factors influencing preschool child's
development is nutrition. Various studies done in past had reflected that nutrition has had
a positive impact on the survival, growth and development of young children. (Milla,
1991; Engle and Zeitlin, 1996; Engle et al., 1997; Gittelsohn et al., 1998) .The average
child grows 2 ½ inches in height and gains between 5 and 7 pounds a year during early
28
childhood. Growth pattern varies individually, though. The brain is a key aspect of
growth. By age 5, the brain has reached nine tenth of its adult size. Some of its increase
in size is due to increase in the number and size of nerve endings; some of myelination.
Increasing brain maturation contributes to improved cognitive abilities. Visual maturity
increases in early childhood.
NutrientYears
1-3 4-6
Weight kg 12.2 19.0
Energy K Cal 1240 1690
Protein g. 22 30
Fat g. 25 25
Calcium mg 400 400
Iron mg. 12 18
Vitamin A mcg. 400 400
Beta carotene mcg. 1600 1600
Thiamine mg. 0.6 0.9
Riboflavin mg. 0.7 1.0
Nicotinic acid mg. 8 11
Pyridoxine mg. 0.9 0.9
Ascorbic acid mg. 40 40
Folic acid mcg. 30 40
Vitamin B 12 mcg. 0.2 to 1 0.2 to 1
Source: Srilakshmi B 2000. Dietitics, second edition, new age international (P) limited, publishers, New Delhi-02 .ch 4; pp 49
Nutrition has a considerable influence on human's health, not only in physical terms, but
also mental and cognitive. Gross motor skills increase dramatically during early
childhood. Fine motor skills also improve substantially during early childhood. The
development of fine motor skills in the preschool year allows young children to become
budding artists. Inadequate dietary intake may have a detrimental impact on a child's
health. Excess dietary intake is unfavorable, especially excess intake of energy, which
results in overweight and obesity, as well as under nutrition, which may cause stunting
29
and adversely affects the development of all organs and systems of the child's body. This
especially concerns the central nervous system, but also the other systems, for example
the immune system, whose reaction is a decrease in immunity. When considering the
importance of nutrition during childhood, one should not forget about its influence on
health later in life. The consequences of the childhood diet may be observed even in adult
life. Qualitative and quantitative imbalance in the childhood diet predisposes to
hypertension, coronary heart disease, obesity, osteoporosis and diabetes later in life.
Adequate nutrition during childhood also has a psychological aspect. Dietary behavior
during childhood has an influence on attitudes toward nutrition, which is evident for the
whole life. ( Premachandran et al., 2009)
1.2.3 THE EFFECT OF UNDER NUTRITION ON SCHOOLING
Malnutrition at any stage of childhood affects schooling and, thus, the lifetime-earnings
potential of the child (Alderman, 2005). Malnutrition impedes motor, sensory, cognitive
and social development (Health education to villages, programme for mother and child
nutrition), so malnourished children will be less likely to benefit from schooling, and will
consequently have lower income as adults. Some of the pathways through which
malnutrition affects educational outcomes include a reduced capacity to learn (as a result
of early cognitive deficits or lowered current attention spans) and fewer total years of
schooling (since caregivers may invest less in malnourished children or schools may use
child size as an indicator of school readiness (Alderman, 2005). For example, in rural
Pakistan, malnutrition has been found to decrease the probability of ever attending
school, particularly for girls (Alderman et al., 2001). In the Philippines, children with
higher nutritional status during the preschool years start primary school earlier, repeat
fewer grades (Glewwe et al., 2001) and have higher high school completion rates
(Daniels and Adair, 2004) than other children. In Zimbabwe, stunting, via its association
with a 7 month delay in school completion and 0.7 loss in grade attainment, has been
shown to reduce lifetime income by 7-12% (Alderman et al., 2003).
30
1.2.4 THE INDIAN CHALLENGE FOR CHILD SURVIVAL
Today, the Indian infant mortality rate is 53 per 1,000 live births. The under-five
mortality rate is estimated at 76 per 1,000 live births. Major investments in child health
in India have not yet yielded substantial decline in maternal, infant and young child
mortality in the recent decade. Importantly, the current neonatal mortality rate accounts
for nearly two-thirds of all infant mortality and half of under-five child mortality. These
facts point to two inescapable conclusions: India must accelerate efforts to reduce infant
and child mortality and these efforts must give particular attention to reducing neonatal
morality.
Good nutrition early in life is a key input for human capital formation, a fundamental
factor for sustainable and equitable economic growth. Widespread under nutrition
impedes socio-economic development and poverty reduction. With persistently high
levels of child under nutrition, vital opportunities to save millions of lives are being lost,
and many more children are not growing to their full potential.
A number of emerging economies have encountered nutrition challenges similar to those
currently facing India. For example, China reduced child under nutrition by more than
half (from 25 per cent to 8 per cent) between 1990 and 2002; Brazil reduced child under
nutrition by 60 per cent (from 18 per cent to 7 per cent) from 1975 to 1989; Thailand
reduced child under nutrition by half (from 50 per cent to 25 per cent) in less than a
decade (1982-1986); and Viet Nam reduced child under nutrition by 40 per cent (from 45
per cent to 27 per cent) between 1990 and 2006. Four lessons can be learned from these
countries‘ experiences:
Leadership at the highest level to ensure that priority is given to child nutrition
outcomes across sectors and states, with large investments in nutrition
interventions and successful poverty alleviation strategies.
Targeted nutrition interventions to prevent mild and moderate under nutrition and
treat severe under nutrition as part of a continuum of care for children,
31
particularly among the most vulnerable children: the youngest, the poorest, and
the socially-excluded;
Reliance on community-based primary health care to ensure high coverage
through community-based frontline workers;
Strong supervision, monitoring, evaluation, and knowledge management to
provide the evidence base for timely and effective policy, programme and
budgetary action.
India has the resources — financial and human — to address, once and for all, the
challenge of child under nutrition. India‘s leadership is recognized globally and its
economy is growing at an enviable rate. That strength and leadership can be channeled to
ensure survival of India‘s most precious asset — its children — to thrive and survive.
(THE HINDU, December 2009)
1.3 MALNUTRITION – AN UNSOLVED MYSTERY
Every individual requires an adequate supply of nutrients in suitable proportions for
normal growth and development. Malnutrition means disordered nutrition, which may be
due to excessive nutrition (over nutrition) or deficient nutrition (under nutrition).In India,
among the poor sections of the society, even the basic calorie requirement are not met.
The intake of protein is found to be marginal. Vitamins and minerals are not taken at the
desired levels. There is, therefore, a high incidence of nutritional deficiency disorders
among the poorer sections, especially in the vulnerable group of infants and mothers.
Malnutrition can be defined as a pathological state resulting from a relative or absolute
deficiency or excess of one or more essential nutrients, which can manifest into over-
nutrition or under nutrition or imbalance.
Malnutrition‘s most devastating impact is in the womb – when the foetus can fail to
develop properly – and during the first years of a child‘s life, when it can hamper her or
his physical and mental development. Malnutrition takes different forms and a child can
be affected in several ways simultaneously. Millions of children suffer from
micronutrient malnutrition – when the body lacks essential minerals like iodine, iron and
32
zinc and vitamins like vitamin A and folate. The body needs micronutrients in minute
doses to manufacture enzymes, hormones and other substances required to regulate
growth, development and the functioning of the immune and reproductive systems.
Deficiencies in iodine can lead to severe mental or physical impairment, in iron to life-
threatening anaemia or lowered productivity, in vitamin A to blindness or to a weakened
immune system and in folate to low birth weight or birth defects such as spina bifida (a
fault in the spinal column in which one or more vertebrae fail to form properly, leaving a
gap or split, causing damage to the central nervous system).
Breastfeeding is the initial source of vital micronutrients, as well as providing overall
sound nutrition and good health. The immune factors, growth factors, and other
protective factors in mother‘s milk cannot be found anywhere else in nature. Lack of
breastfeeding exposes infants to an increased risk of death and disease in childhood, and
increases the risk of chronic diseases such as diabetes and childhood cancer. Key tools in
the effort to defeat malnutrition include: an adequate diet, which includes immediate and
exclusive breastfeeding for the first six months, and continued breastfeeding with age-
appropriate complementary foods, micronutrients, prevention and treatment of disease
and proper care and feeding practices. Malnutrition is both a consequence and cause of
poverty. Children‘s nutrition and well being are the foundation of a healthy, productive
society.
1.3.1 UNDER-NUTRITION: As mentioned earlier, under nutrition is the result of
deficiency of one or more of the essential nutrients in the diet. The scope of under
nutrition can be general or partial. General under nutrition implies a total reduction in
food intake( hollow hunger) while partial under nutrition results from a deficiency of one
or several nutrients (hidden hunger).Primary under-nutrition results from a poor dietary
intake whereas secondary under nutrition is caused by some disease process in body
which interferes with the normal utilization and assimilation of the nutrients. Under
nutrition may be termed ‗mild‘, ‗moderate‘, or ‗severe‘ depending upon the degree of the
problem.
33
Under nutrition is the form of malnutrition which is wide spread in the developing
countries with large population and low economic strata. Nearly two-thirds of the total
world population suffers from the varying degrees of malnutrition. In India poor growth
and other manifestations of under nutrition can be seen among its population.
1.3.2 THE EFFECT OF UNDER NUTRITION ON MORBIDITY, MORTALITY,
COGNITIVE AND MOTOR DEVELOPMENT: Through precipitating disease and
speeding its progression, malnutrition is a leading contributor to infant, child and
maternal mortality and morbidity. It has been estimated to play a role in about half of all
child deaths (Horton, 1999; Pelletier et al., 1995; Pelletier and Frongillo, 2003) and
globally more than one-third of child deaths are attributable to under nutrition in form of
major diseases, such as malaria (8%), diarrhoea (14 %) and pneumonia (14 %), as well as
1% of deaths from measles and 41 % neonatal death (Black et al., 2003; Caulfield, 2004;
UNICEF, 2010). In turn, infections contribute to malnutrition through a variety of
mechanisms, including loss of appetite and reduced capacity to absorb nutrients. (Calder
and Jackson, 2000)
1.3.3 PROTEIN-ENERGY MALNUTRITION (PEM): It is one of the most important
public health problems in many developing countries including India, South East Asia
and Africa. It is a wide-spread deficiency disease among children of low socio-economic
groups. In many areas nearly half the children do not survive to the age five years on
account of protein calorie malnutrition; those who survive may suffer impaired growth
and perhaps mental retardation. The disease known as ‗kwashiorkor‘ and‘ marasmus‘
represent extreme forms of protein calorie malnutrition. In 1993, a paediatrician, Cicelly
William, working in West Africa used the local term kwashiorkor which means
‗displaced child‘ meaning ―the sickness which a child develops when the next baby is
born and the older one gets deprived of breast milk‖. Kwashiorkor occurs due to the
imbalance between proteins and carbohydrates. The term marasmus is derived from a
Greek word meaning ―to waste‖. Marasmus is also the result of a continued deficiency of
calories, protein and other nutrients.
Isolating the effects of protein and energy deficiencies on health and development
outcomes is confounded by the fact that when food intake is low, the intake of many
34
other nutrients is usually also inadequate (Allen, 1994). Nevertheless, it is generally
accepted that children who are underweight or stunted are at greater risk for childhood
morbidity and mortality, poor physical and mental development, inferior school
performance and reduced adult size and capacity for work. (WHO, 1995)
Protein-energy malnutrition weakens immune response and aggravates the effects of
infection (Pelletier and Frongillo, 2003) and, so, children who are malnourished tend to
have more severe diarrheal episodes and are at a higher risk of pneumonia. In addition,
malnutrition in early infancy is associated with increased susceptibility to chronic disease
in adulthood, including coronary heart disease, diabetes and high blood pressure
(Agarwal et al., 1998; Agarwal et al., 2002; Barker et al., 2001; Lucas et al., 1999;
Popkin et al., 2001; UNICEF, 1998). Although the precise mechanisms are not clear
(Grantham-McGregor and Ani, 2001), protein-energy malnutrition in early childhood is
also associated with poor cognitive and motor development. The magnitude of the effect
is very much dependent on the severity and duration of malnutrition as well as its timing.
There is evidence that moderate protein-energy malnutrition of long-term duration has
worse consequences for cognitive development than transient severe under nutrition.
With respect to timing, it is nutritional status in the period between the last trimesters of
pregnancy and two to three years of age that is most important for mental development.
1.3.4 A CONCEPTUAL FRAMEWORK OF THE CAUSES OF UNDER NUTRITION
Child under nutrition is a consequence of the complex interactions of multiple
determinants. One way to conceptualize these interactions is with the use of a framework
that traces the causal pathways of under nutrition through different levels – the most
immediate, the underlying, and the basic causes.
1.3.4 (a) THE IMMEDIATE CAUSES OF UNDER NUTRITION
The first level is composed of the most immediate causes of malnutrition and highlights
the importance of both food intake and the absence of infection for improving child
nutritional status. Inadequate dietary intake and infections create a vicious cycle that is
35
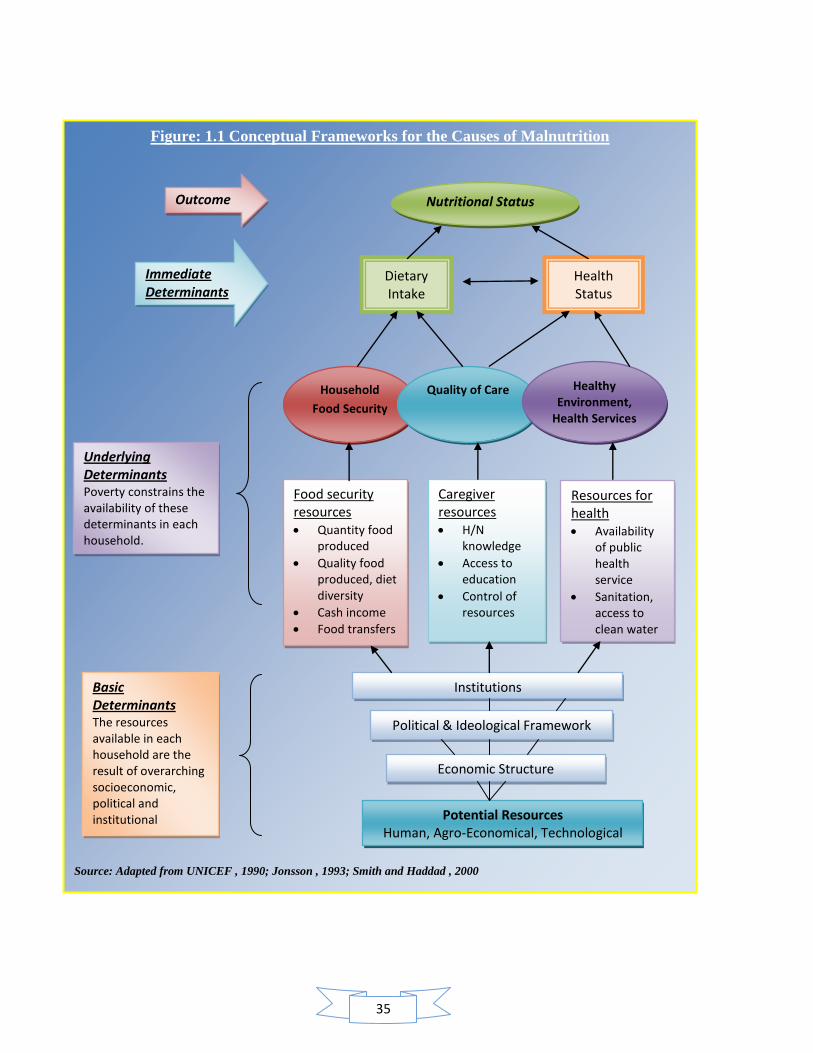
Figure: 1.1 Conceptual Frameworks for the Causes of Malnutrition
Source: Adapted from UNICEF , 1990; Jonsson , 1993; Smith and Haddad , 2000
Nutritional Status
Health Status
Dietary Intake
Outcome
Immediate Determinants
Household
Food Security
Quality of Care Healthy Environment,
Health Services
Food security resources Quantity food
produced
Quality food produced, diet diversity
Cash income
Food transfers
Caregiver resources H/N
knowledge
Access to education
Control of resources
Resources for health Availability
of public health service
Sanitation, access to clean water
Institutions
Political & Ideological Framework
Economic Structure
Potential Resources Human, Agro-Economical, Technological
Underlying Determinants Poverty constrains the availability of these determinants in each household.
Basic Determinants The resources available in each household are the result of overarching socioeconomic, political and institutional
structures.
36
responsible for much of the high morbidity and mortality among children in developing
countries. On the one hand, when children do not consume enough, immune response is
lowered, rendering them more susceptible to infectious diseases. On the other hand, ill
children deplete their nutritional stores and are in poor health because of reduced intake,
poor absorption of nutrients and the increased demands of combating disease. Over the
past decades, a large body of work has documented the interaction between nutrition and
infection. Evidence of the malnutrition-infection syndrome was first reported in studies
conducted in India and Guatemala which found that children developed diarrheal
infections around the time of weaning from breast milk to other foods, and that they were
subsequently more prone to infections and growth faltering. (Gordon et al., 1964;
Scrimshaw et al., 1968).While the weight loss associated with a single episode of
infection can be made up if the diet is adequate, recurrent episodes of infection without
sufficient food or inadequate recovery time is a primary cause of poor growth among
children in developing countries. (Schürch and Scrimshaw, 1989). Thus, sufficient food
intake is only one determinant of nutritional status.
1.3.4 (b) THE UNDERLYING DETERMINANTS OF UNDER NUTRITION
The two immediate causes of malnutrition, poor dietary intake and infection, are closely
linked to the three underlying determinants of nutritional status: household-level access
to food, health resources (such as preventive and curative healthcare, and clean water and
sanitation) and the appropriateness of the child care and feeding behaviors that caregivers
adopt with respect to their children.
A. HOUSEHOLD-LEVEL FOOD SECURITY
This refers to physical and economic access to foods that are socially and culturally
acceptable, and of sufficient quality and quantity. This is not necessarily assured by
macro-level food security, i.e. sufficient food production at national/regional levels. Food
security at the household level is determined by a more complex array of factors than
agricultural production, including local prices (of food and other goods), income and an
effective trade and transport infrastructure (Bouis and Hunt, 1999). Moreover, household
food security is not in itself sufficient to assure that the nutritional needs of every child,

37
and adult, living in a particular household will be met. Within each household, decisions
are made as to the quantity and quality of food that is allocated to each household
member and a further complex range of factors influences this decision. These factors
may include the relative bargaining power of household members (which in turn may be
related to their individual income, autonomy, gender and education) as well as other
characteristics, such as health status of individual members. Consequently, the diets of
individual children (or others) within the household may be deficient even though per
capita caloric intakes are high and even when the household is food secure.
B. ACCESS TO HEALTH RESOURCES
(i) Access to sufficient clean water, good sanitation and a clean living environment :
Over-crowding, congestion, a shortage of clean water and inadequate facilities for the
disposal of human excreta, waste water and solid wastes contribute to the development of
gastrointestinal infections, such as diarrhea, and facilitate the spread of infectious disease.
Historical studies of the sanitary revolution, for example, show that while mortality rates
in urban areas exceeded those of rural areas prior to the revolution; the situation was
reversed following the sanitation improvements (Collins and Thomasson, 2002). Crowding
has been shown to be associated with an increased risk of infectious intestinal disease
(due to rotavirus group A) in children (Sethi et al., 2001) and tuberculosis infection
(MacIntyre, 1997). Poor water quality, a limited quantity of water, poor excreta disposal
practices and poor food hygiene are all associated with increased diarrhea prevalence in
infants (Esrey et al., 1990; Moe et al., 1991). Moreover, good water, sanitation and hygiene
conditions at the community level generate important externalities for individual
households in the community: in Peru (Alderman et al., 2003) and Andhra Pradesh
(Alderman et al., 2003; Gordon and Dunleavy, 2001) , it has been shown that good water and
sanitation at the neighborhood level has a positive effect on the height of children in a
particular household independent of whether that household itself has a healthy
environment .(Alderman et al., 2003; Gordon and Dunleavy, 2001)
38
(ii) Access to health services, including vector and disease control. Since the presence
of infection, and particularly communicable disease, is a direct cause of malnutrition.
Consequently, efforts to prevent exposure to infection and cure disease should stand
central to any strategy aimed at combating malnutrition, including regular deworming,
the use of bed nets in malaria areas and access to regular and affordable health check-ups.
C. ADOPTING APPROPRIATE CHILDCARE BEHAVIORS
Providing appropriate care, which can mitigate the impact of the malnutrition-infection
cycle for vulnerable groups such as children and pregnant and lactating women, means
adopting child-care and feeding behaviors that direct available resources towards
promoting child nutritional well-being. For example, adequate care during pregnancy and
delivery can reduce the incidence of maternal death, miscarriage, stillbirth and low birth
weight among infants. Likewise, adequate feeding of young children (initiation of
breastfeeding within an hour of birth, exclusive breast-feeding for the first six months of
life and adequate and timely complementary feeding starting at 6 months while
continuing to breastfeed) is critical for child growth. Caregiver‘s time, their knowledge
and educational status, autonomy, control over monetary and other resources, and their
capacity to make appropriate caring decisions are often the key factors that determine
how children (and pregnant women) are cared for.
1.3.4 ( c ) THE BASIC DETERMINANTS OF UNDER NUTRITION
Finally, the framework links these underlying determinants to a set of basic determinants
which include the availability of human, economic and organizational resources with
which to improve nutrition, the use of which is shaped by how society is organized in
terms of economic structure, political and ideological expectations, and the institutions
through which activities and resources within society are regulated, social values are met,
and potential resources are converted into actual resources.
39
1.4 INTEGRATED CHILD DEVELOPMENT SCHEME (ICDS)
Millions of young children today in the developing world live in conditions of poverty.
From the perspective of overall development, they are born and brought up in an
environment which is hostile. Since independence, Government of India's determination
to bring essential services to all these young children is impressive indeed. Human
development programmes focused on care and welfare of children occupied an important
place. Despite significant improvements in the health and education sectors
in recent decades, when it comes to nutrition, all of India‘s children are not equal.
According to India‘s third National Family Health Survey (NFHS-3) of 2005-06, 20 per
cent of Indian children under five-years-old are wasted due to acute under nutrition and
48 per cent are stunted due to chronic under nutrition. Seventy per cent of children
between six months and 59 months are anemic. Despite a booming economy, nutrition
deprivation among India‘s children remains widespread.
In absolute numbers, an average 25 million children are wasted and 61 million are
stunted. The state of child under nutrition in India is — first and foremost — a major
threat to the survival, growth, and development and of great importance for India as a
global player. Prime Minister Manmohan Singh has referred to under nutrition as ‗a
matter of national shame.‘ (THE HINDU, online edition, 10th
Dec.2010)
A nation’s children are its supremely important asset and the nation’s
future lies in their proper development. An investment in children is needed
an investment in the Nation’s Future. A healthy and educated child of
today is the active and intelligent child of tomorrow.
Bestow blessing on those little, innocent lives bloomed on earth, who have
brought the message of joy from heavenly garden.
----- Rabindra Nath Tagore
40
The need for providing children with improved childhood necessities through a holistic
approach, involving cooperation and liaison between disciplines and agencies are well
recognized in India. The National Policy on Education placed high priority on Early
Childhood Care and Development (ECCD). The policy suggested integration with the
Integrated Child Development Services (ICDS) programme which is the largest child
development service in the country .With strong government commitment and political
will, the ICDS program has emerged from small beginnings in 1975 to become India‘s
flagship nutrition program.
Launched on 2nd
October 1975 in 33 Community Development Blocks, ICDS today
represents one of the world‘s largest programmes for early childhood development. ICDS
is the foremost symbol of India‘s commitment to her children – India‘s response to the
challenge of providing pre-school education on one hand and breaking the vicious cycle
of malnutrition, morbidity, reduced learning capacity and mortality, on the other.It is an
inter-sectoral programme which seeks to directly reach out to children, below six years,
especially from vulnerable and remote areas and give them a head-start by providing an
integrated programme of early childhood education, health and nutrition. No programme
on Early Childhood Care and Education can succeed unless mothers are also brought
within it ambit as it is in the lap of the mother that human beings learn the first lessons in
life.
OBJECTIVES OF ICDS:
Lay the foundation for proper psychological development of the child
Improve nutritional & health status of children 0-6 years
Reduce incidence of mortality, morbidity, malnutrition and school drop-outs
Enhance the capability of the mother and family to look after the health, nutritional
and development needs of the child
Achieve effective coordination of policy and implementation among various
departments to promote child development.
41
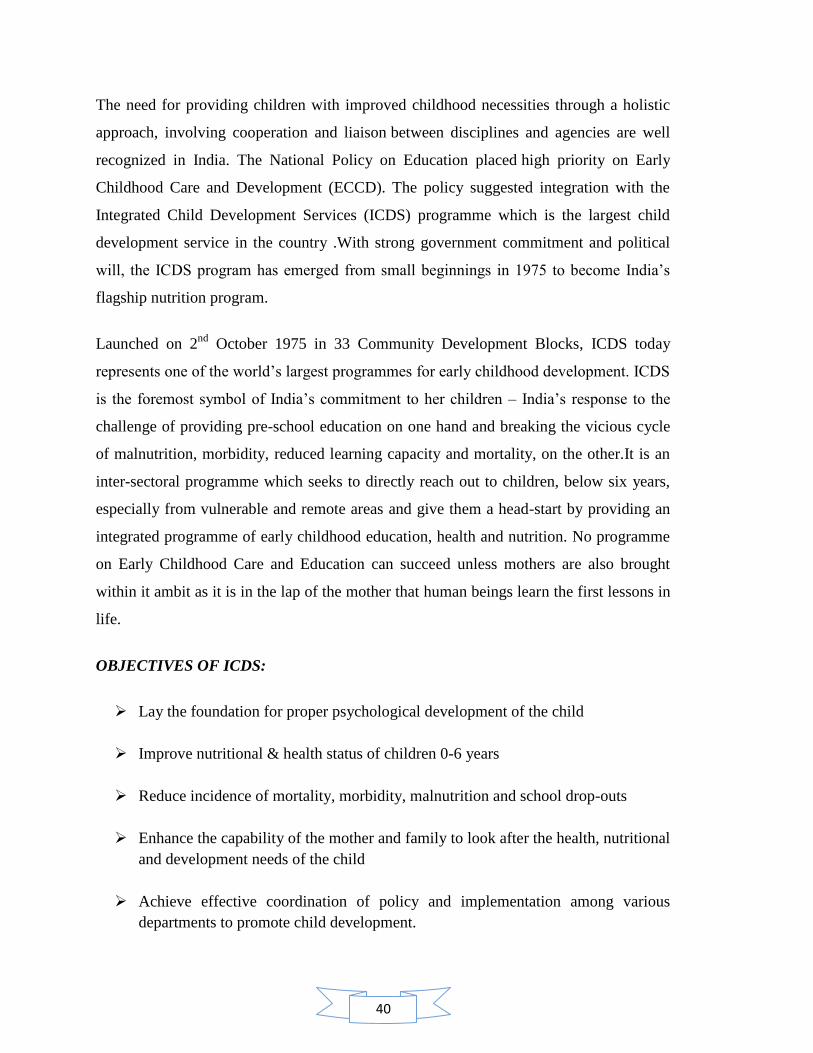
1.4.1 THE DESIGN OF THE ICDS PROGRAM AND THE UNDERLYING CAUSES
OF CHILD UNDER NUTRITION
The Integrated Child Development Services (ICDS) program is potentially well-poised to
address some of the underlying causes of persistent under nutrition, identified in the
framework discussed earlier (Fig. 1.1). The program adopts a multi-sectoral approach to
child well-being, incorporating health, education and nutrition interventions and is
implemented through a network of anganwadi centers at the community level.
Services Target Group Service Provided by
Supplementary
Nutrition
Children below 6 years:
Pregnant & Lactating Mother (P&LM)
Anganwadi Worker
and Anganwadi
Helper
Immunization* Children below 6 years:
Pregnant & Lactating Mother (P&LM)
ANM/MO
Health Check-up* Children below 6 years:
Pregnant & Lactating Mother (P&LM)
ANM/MO/AWW
Referral Services Children below 6 years:
Pregnant & Lactating Mother (P&LM)
AWW/ANM/MO
Pre-School Education Children 3-6 years AWW
Nutrition & Health
Education
Women (15-45 years) AWW/ANM/MO
*AWW assists ANM in identifying the target group
Source: NIPCCD
Note: The three services namely immunization, health check-up and referral are
delivered through public health infrastructure viz. Health Sub Centres, Primary an
Community Health Centers under the Ministry of Health & Family Welfare
The Department of Women and Child Development‘s (DWCD) emphasis on a ―life-cycle
approach‖ means that malnutrition is fought through interventions targeted at unmarried

42
adolescent girls, pregnant women, mothers and children aged 0 to 6 years. Eight key
services are provided, including supplementary feeding, immunization, health checkups
and referrals, health and nutrition education to adult women, micronutrient
supplementation and preschool education for 3 to 6 year olds. As the program has
developed, it has expanded its range of interventions to include Components focused on
adolescent girls‘ nutrition, health, awareness, and skills development, as well as income-
generation schemes for women.
1.4.2 Types of services provided at anganwadi centre:
1.4.2 (a) SUPPLEMENTARY NUTRITION: This includes supplementary feeding and
growth monitoring; and prophylaxis against vitamin A deficiency and control of
nutritional anaemia. All families in the community are surveyed, to identify children
below the age of six and pregnant & nursing mothers. They avail of supplementary
feeding support for 300 days in a year. By providing supplementary feeding, the
Anganwadi attempts to bridge the protein energy gap between the recommended dietary
allowance and average dietary intake of children and women. Growth Monitoring and
nutrition surveillance are two important activities that are undertaken. Children below the
age of three years of age are weighed once a month and children 3-6 years of age are
weighed every quarter. Weight-for-age growth cards are maintained for all children
below six years. This helps to detect growth faltering and helps in assessing nutritional
status. Besides, severely malnourished children are given special supplementary feeding
and referred to health sub-centres, Primary Health Centres as and when required.
I. SUPPLEMENTARY NUTRITION NORMS: The effort is to provide, on an
average, daily nutritional supplements to the extent indicated below.
i. Financial Norms: The Government of India has recently, revised the cost of
supplementary nutrition for different category of beneficiaries vide this Ministry‘s
letter no. F.No. 4-2/2008-CD.II dated 07.11.2008, the details of which are as
under in table no 1.7.
43
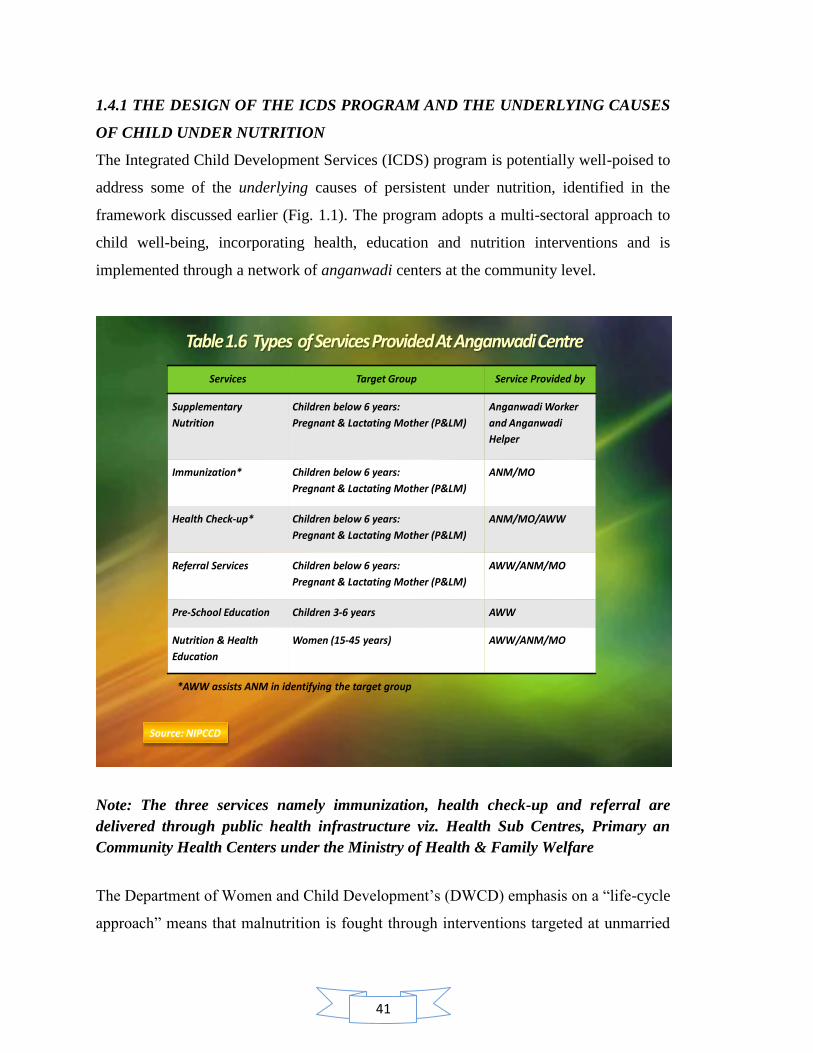
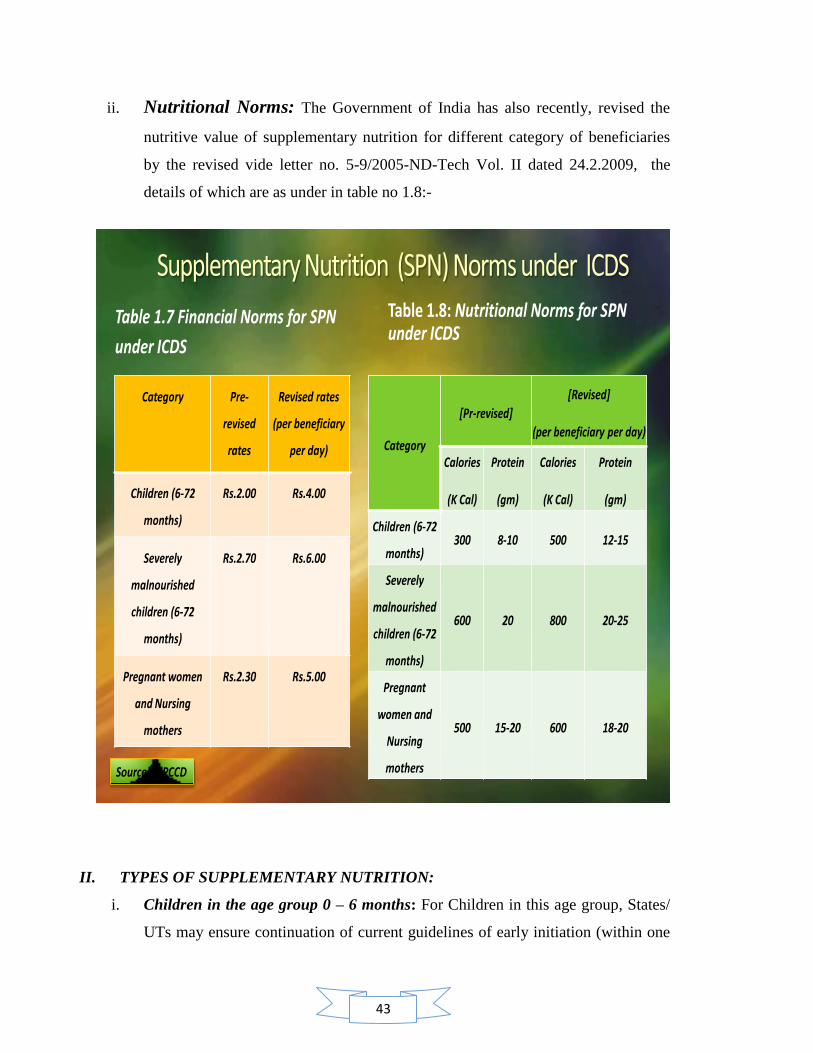
ii. Nutritional Norms: The Government of India has also recently, revised the
nutritive value of supplementary nutrition for different category of beneficiaries
by the revised vide letter no. 5-9/2005-ND-Tech Vol. II dated 24.2.2009, the
details of which are as under in table no 1.8:-
Table 1.7 Financial Norms for SPN
under ICDS
Category Pre-
revised
rates
Revised rates
(per beneficiary
per day)
Children (6-72
months)
Rs.2.00 Rs.4.00
Severely
malnourished
children (6-72
months)
Rs.2.70 Rs.6.00
Pregnant women
and Nursing
mothers
Rs.2.30 Rs.5.00
Table 1.8: Nutritional Norms for SPN under ICDS
Category
[Pr-revised]
[Revised]
(per beneficiary per day)
Calories
(K Cal)
Protein
(gm)
Calories
(K Cal)
Protein
(gm)
Children (6-72
months)300 8-10 500 12-15
Severely
malnourished
children (6-72
months)
600 20 800 20-25
Pregnant
women and
Nursing
mothers
500 15-20 600 18-20
Source: NIPCCD
II. TYPES OF SUPPLEMENTARY NUTRITION:
i. Children in the age group 0 – 6 months: For Children in this age group, States/
UTs may ensure continuation of current guidelines of early initiation (within one
44
hour of birth) and exclusive breast-feeding for children for the first 6 months of
life
ii. Children in the age group 6 months to 3 years: For children in this age group,
the existing pattern of Take Home Ration (THR) under the ICDS Scheme will
continue. However, in addition to the current mixed practice of giving either dry
or raw ration (wheat and rice) which is often consumed by the entire family and
not the child alone, THR should be given in the form that is palatable to the child
instead of the entire family.
iii. Children in the age group 3 to 6 years: For the children in this age group, State/
UTs have been requested to make arrangements to serve Hot Cooked Meal in
AWCs and mini-AWCs under the ICDS Scheme. Since the child of this age group
is not capable of consuming a meal of 500 calories in one sitting, the States/ UTs
are advised to consider serving more than one meal to the children who come to
AWCs. Since the process of cooking and serving hot cooked meal takes time, and
in most of the cases, the food is served around noon, States/ UTs may provide 500
calories over more than one meal. States/ UTs may arrange to provide a morning
snack in the form of milk/ banana/ egg/ seasonal fruits/ micronutrient fortified
food etc.
1.4.2. (b) PRE-SCHOOL EDUCATION :This component for the three-to six years old
children in the anganwadi is directed towards providing and ensuring a natural, joyful and
stimulating environment, with emphasis on necessary inputs for optimal growth and
development. The early learning component of the ICDS is a significant input for
providing a sound foundation for cumulative lifelong learning and development. It also
contributes to the universalization of primary education, by providing to the child the
necessary preparation for primary schooling and offering substitute care to younger
siblings, thus freeing the older ones – especially girls – to attend school.
1.4.2. (c) IMMUNIZATION: Immunization of pregnant women and infants protects
children from six vaccine preventable diseases-poliomyelitis, diphtheria, pertussis,
tetanus, tuberculosis and measles. These are major preventable causes of child mortality,
disability, morbidity and related malnutrition. Immunization of pregnant women against
45
tetanus also reduces maternal and neonatal mortality. This service is delivered by the
Ministry of Health and Family Welfare under its Reproductive Child Health (RCH)
programme. In addition, the Iron and Vitamin "A" Supplementation to children and
pregnant women is done under the RCH Programme of the Ministry of Health and
Family Welfare.
1.4.2. (d) HEALTH CHECK-UPS: This includes health care of children less than six
years of age, antenatal care of expectant mothers and postnatal care of nursing mothers.
These services are provided by the ANM, Medical Officers In Charge of Health Sub-
Centres and Primary Health Centres under the RCH programme of the Ministry of Health
and Family Welfare. The various health services include regular health check-ups,
immunization, management of malnutrition, treatment of diarrhoea, deworming and
distribution of simple medicines etc.
1.4.2 (e) REFERRAL SERVICES: During health check-ups and growth monitoring, sick
or malnourished children, in need of prompt medical attention, are referred to the Primary
Health Centre or its sub-centre. The anganwadi worker has also been oriented to detect
disabilities in young children. She enlists all such cases and refers them to the ANM and
Medical Officer in charge of the Primary Health Centre/ Sub-centre. These cases referred
by the Anganwadi worker are to be attended by health functionaries on priority basis.
1.4.2. (f) NUTRITION AND HEALTH EDUCATION: Nutrition and Health Education
(NHE) is a key element of the work of the anganwadi worker. This forms part of BCC
(Behavior Change Communication) strategy. This has the long term goal of capacity-
building of women – especially in the age group of 15-45 years – so that they can look
after their own health, nutrition and development needs as well as that of their children
and families.
1.4.3 BUDGETARY ALLOCATION UNDER ICDS IN INDIA: Alongside gradual
expansion of the Scheme, there has also been a significant increase in the Budgetary
allocation for ICDS Scheme from Rs.10391.75 crores in 10th
Five Year Plan to Rs.44,400
crores in XI Plan Period.

46
1.4.4 BUDGETARY ALLOCATION UNDER ICDS FOR JAMMU AND KASHMIR:
The state has witnessed more than threefold increase in the availability of funds under
ICDS between the years 2000-2007. In 2000 the funds allotted to state was 2443 lacs
which have reached up to 7787 lacs in 2007.
1.4.5 UTILIZATION OF FUND UNDER ICDS IN JAMMU AND KASHMIR:
Interestingly the state has utilized only 80% of the funds made available to it during the
period 2000-2007
1.5 ANGANWADI CENTRE AND ANGANWADI WORKER
The heart of the ICDS system is a network of anganwadi centre- literally a court yard
child care centre- each staffed by an anganwadi worker. AWW‘s are unquestionably the
focal points of the ICDS programme. They are selected from within the community and
from an economically needy class. At the level, an additional functionary (helper) is also
made available to the workers.
1.5.1 A TYPICAL ANGANWADI CENTRE: The anganwadi centre is the focal point for
delivery of a package of services to the children and mothers. An anganwadi centre
usually covers a population of 1000 in urban areas. Normally it is expected that the local
community should provide the accommodation for the anganwadi centre as this is the
beginning of community participation in the programme .the place should be clean, safe
and such that children and women can come freely and easily to get the benefit of the
services regularly. In urban areas which are already overcrowded, there is difficulty in
getting accommodation free of cost. Therefore, few centers run in a hired place or
community hall or in some other place provided by the community. For outdoor
activities, the anganwadi worker takes the children to the nearest park, playground or any
open place that is protected.
47
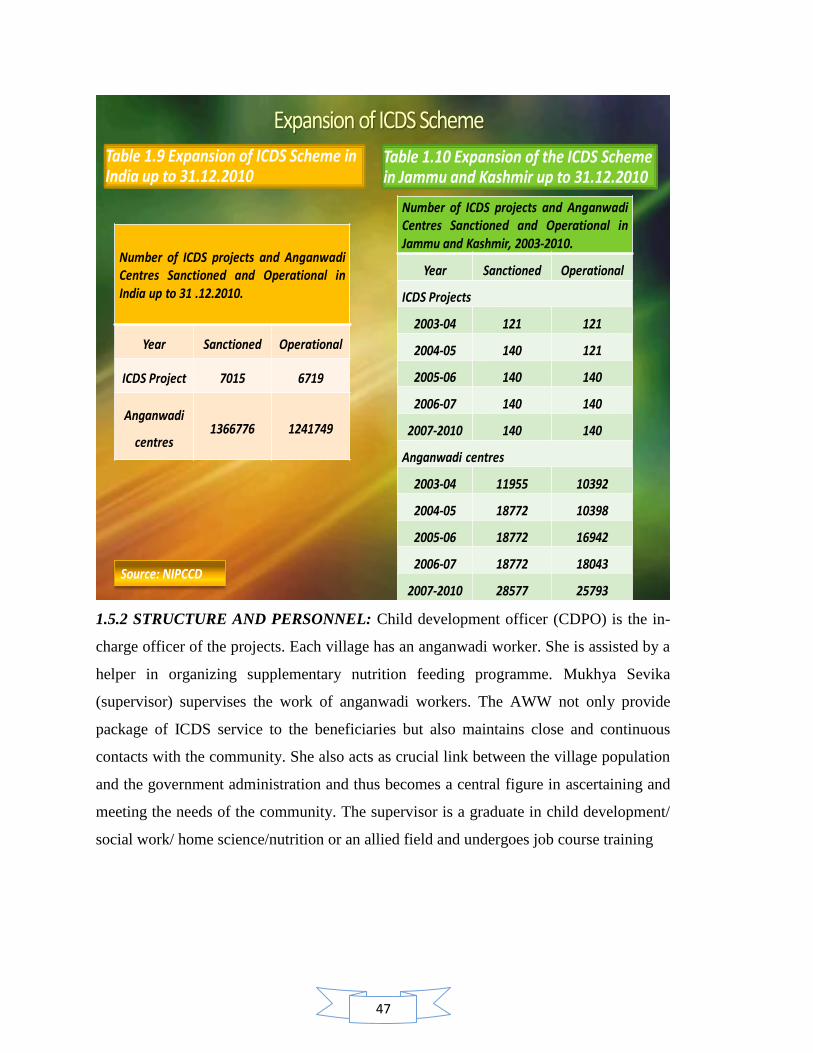
Table 1.9 Expansion of ICDS Scheme in India up to 31.12.2010
Number of ICDS projects and AnganwadiCentres Sanctioned and Operational inIndia up to 31 .12.2010.
Year Sanctioned Operational
ICDS Project 7015 6719
Anganwadi
centres1366776 1241749
Table 1.10 Expansion of the ICDS Scheme in Jammu and Kashmir up to 31.12.2010
Number of ICDS projects and AnganwadiCentres Sanctioned and Operational inJammu and Kashmir, 2003-2010.
Year Sanctioned Operational
ICDS Projects
2003-04 121 121
2004-05 140 121
2005-06 140 140
2006-07 140 140
2007-2010 140 140
Anganwadi centres
2003-04 11955 10392
2004-05 18772 10398
2005-06 18772 16942
2006-07 18772 18043
2007-2010 28577 25793Source: NIPCCD
1.5.2 STRUCTURE AND PERSONNEL: Child development officer (CDPO) is the in-
charge officer of the projects. Each village has an anganwadi worker. She is assisted by a
helper in organizing supplementary nutrition feeding programme. Mukhya Sevika
(supervisor) supervises the work of anganwadi workers. The AWW not only provide
package of ICDS service to the beneficiaries but also maintains close and continuous
contacts with the community. She also acts as crucial link between the village population
and the government administration and thus becomes a central figure in ascertaining and
meeting the needs of the community. The supervisor is a graduate in child development/
social work/ home science/nutrition or an allied field and undergoes job course training

48
Ministry Of Health And Family Welfare
Ministry Of Human Resources Development Department Of Women’s
Welfare
Director/Project Officer In Charge of ICDS
Chief medical officer Adviser District Social Welfare/ District Tribal Welfare Officer/ICDS Programme Officer
Medical Officer (MO)Child Development Project Officer (CDPO)
Block Development Officer (BDO)
Health Assistant Female (HAF) Lady Health Visitor (LHV)
Mukhya Sevika (Supervisor)
Health worker female (HWF) auxiliary nurse midwife (ANM)
Health Anganwadi worker
CommunitySource : NIPCCD,1992
Director Of Health Services State Coordinator (Health Inputs)
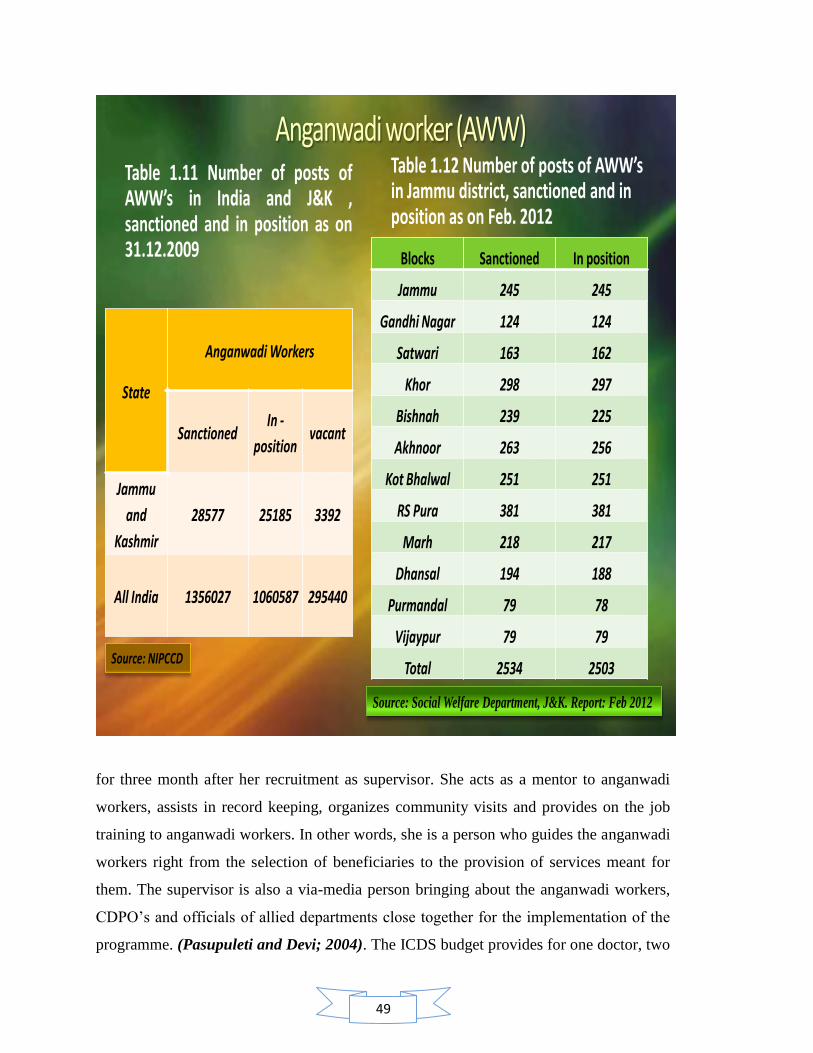
49
Table 1.11 Number of posts ofAWW’s in India and J&K ,sanctioned and in position as on31.12.2009
State
Anganwadi Workers
SanctionedIn -
positionvacant
Jammu
and
Kashmir
28577 25185 3392
All India 1356027 1060587 295440
Table 1.12 Number of posts of AWW’s in Jammu district, sanctioned and in position as on Feb. 2012
Blocks Sanctioned In position
Jammu 245 245
Gandhi Nagar 124 124
Satwari 163 162
Khor 298 297
Bishnah 239 225
Akhnoor 263 256
Kot Bhalwal 251 251
RS Pura 381 381
Marh 218 217
Dhansal 194 188
Purmandal 79 78
Vijaypur 79 79
Total 2534 2503Source: NIPCCD
Source: Social Welfare Department, J&K. Report: Feb 2012
for three month after her recruitment as supervisor. She acts as a mentor to anganwadi
workers, assists in record keeping, organizes community visits and provides on the job
training to anganwadi workers. In other words, she is a person who guides the anganwadi
workers right from the selection of beneficiaries to the provision of services meant for
them. The supervisor is also a via-media person bringing about the anganwadi workers,
CDPO‘s and officials of allied departments close together for the implementation of the
programme. (Pasupuleti and Devi; 2004). The ICDS budget provides for one doctor, two
50
lady health visitors/PHN and eight ANM‘s in the primary health centre. In the case of
tribal and urban areas instead of eight ANM‘s, four ANM‘s are provided. Even though
funds are provided by the central government, this additional staff of PHC is borne on the
state cadre.
1.5.3 THE JOB TRAINING CURRICULUM OF THE ANGANWADI WORKER
i. Job training: The anganwadi workers and supervisors receive job training and
short term refresher courses at the training centers. The duration of the job
training is three months. The training is carefully structured to learn about child
development and early childhood education, health and nutritional services, and
are taught how to tackle problems, shoulder responsibilities and evolve some
methods of management. The training process of the anganwadi workers involves
considerable field exposure and oral communication, with the maximum use of
audio visual aids, song and role play. A lot of emphasis is laid on facilitating
preschool activities like group singing, dancing and play acting and making
recreational objects out of waste material. Special importance is laid on the need
for supplementary nutrition and to clarify that supplementary does not mean full
meal. It is a challenging job to train the marginally literate.
ii. Orientation or induction training: This programme is for new recruits who
have not taken the job training. This training programme usually lasts for six
days. One or two such programme is held in a year. The curriculum for the
induction programme includes an introduction to the scheme and its rationale,
immunization, nutrition, growth monitoring, preschool education and community
participation.

51
FIGURE: 1.3 FOCUS AREAS OF TRAINING SCHEDULE OF ANGANWADI WORKER IN NUTRITION
AND HEALTH
Source: Self Devised Based On Training Syllabus of ICDS for Anganwadi Worker
Importance Of Healthy Living
Nutrition And Health Services Under ICDS
Nutrition And Health Care Expectant And Nursing Mother, Infants And Young Children
PEM Among Children-Causes, Symptoms, Prevention And Management
Micronutrient Deficiency Among Children Causes, Symptoms, Prevention And Management
Organizing Supplementary Nutrition At An AWC
Growth Monitoring And Promotion
Nutrition Counseling
Organizing Nutrition And Health Education Session For IYCF
Neonatal And Children Illness
Treatment With Home Care And Advice
Identification And Prevention Of Disability Among Children
Prevention Of Emerging Endemic Diseases Among Children
Personal Hygiene And Safe Drinking Water
52
1.5.4 ROLE OF NUTRITION KNOWLEDGE AND PERFORMANCE OF
ANGANWADI WORKER.
As the anganwadi worker is the key person in the programme (Udani et al., 1980), her
education level and knowledge of nutrition and the guidance she received from the ANM
individually or synergistically related to her performance in the anganwadi. Knowledge
and understanding of some aspects of basic nutrition and health care is of great
importance for the anganwadi worker's performance (Udani et al., 1980).
The relative coverage of children for the services provided by the programme was higher
where the anganwadi worker had a high school education or more than where her
education was below that level. Sharma (Sharma , 1987), in findings similar to those of
the present study, reported that education was positively related to performance. Perhaps
relatively better educated anganwadi workers are better able to convince parents to have
their children immunized against the six killer diseases and more confident in persuading
children to come to the anganwadi for supplementary nutrition. It has also been reported
that, in addition to education level, training anganwadi workers about growth monitoring
plays a beneficial role in improving their performance (Gopaldas et al., 1990). Under
nutrition among preschool children may be the result of faulty feeding practices rather
than the scarcity of the food .It was also assessed that the low status of woman and their
lack of nutritional knowledge are important determinants of high prevalence of
underweight children. Appropriate intervention strategies need to be developed to
educate the mothers regarding the feeding practices of infant and young children. Despite
several nutrition programmes in operation, we could not make a significant dent in this
area. India is even lagging behind with sub Saharan countries, in spite high economic
growth. A study done by Gujral et al (1992) in panchmahals district of Gujarat state,
covering 43 anganwadi centre shows that workers with adequate nutrition knowledge
reached more children with various services than those whose knowledge was
inadequate.
During the job training Anganwadi workers received a well structured training
programme at anganwadi training centre. Although an anganwadi worker receives her
53
training at AWTC, the training syllabus used to be prepared by the NIPCCD. NIPCCD
has the responsibility of planning, coordinating and monitoring the training, designing,
revising and standardizing of curriculum for all categories of functionaries; and
preparing, procuring and distributing training material and aids.
In community-based programs like ICDS anganwadi workers interact with households to
protect their health and nutrition and to facilitate access to treatment of sickness. Mothers
and children are the primary focus, but others in the household should participate. The
existence, training, support, and supervision of the anganwadi worker are indispensable
features of these programs. The focus areas of training schedule of anganwadi workers in
nutrition and health are shown in figure 1.2.
1. Importance of healthy living and nutrition: During the training at AWTC an
anganwadi worker gets familiar with the definition of food, nutrient and nutrition.
Training makes an anganwadi worker understand the importance of good
nutrition, its function for growth and development and protection against diseases
etc. Training provides her (AWW) all the information on sources of food and
nutrients. The knowledge gained through the training programme on nutrition and
health makes her understand the need and importance of a balanced diet.
2. Nutrition and health services under ICDS programme: Training provides the
platform to an anganwadi worker to get familiar with nutrition and health services
under ICDS programme. Under the nutrition services in ICDS, she (AWW) get
familiar with the need of supplementary nutrition , feeding practices of
supplementary food for children and provision of nutritional supplements-
Vitamin A and Iron and Folic acid tablets. She gets familiar with the concept,
need and importance of monitoring growth of a child from birth onwards. She
also gets familiar with the concept, need and importance of nutrition and health
education. She learns the skills of counseling on infant and young child.
Another important area of ICDS services is health. During the
training anganwadi worker learns the skills of organizing health check-up of
children and expectant and nursing mothers. She gets familiar with immunization
54
details, treatment of common childhood illness and minor ailments with
medicines in the kit. She also learns about the referral services.
3. Nutrition and health care of expectant and nursing mothers, infants and
young children(birth-6yrs)and adolescent girls: The life cycle approach of
ICDS means that malnutrition is fought through interventions targeted at
unmarried adolescents girls, pregnant women and mothers and children aged
between 0-6 yrs.
a) Nutritional health care of expectant and nursing mothers: anganwadi
worker learns the important facts about food and nutrition for time period
of pregnancy and lactation
- Nutrition need during pregnancy and lactation
- Effects of inadequate diet and physical stress on birth weight of a new born
baby
- Intake of supplementary food and nutritional supplements provided at AWC
- Good practices ,fads and beliefs associated with intake of supplementary food
during pregnancy and lactation
An Anganwadi worker also receives training in health care services regarding
pregnancy and lactation which includes early registration at AWC/PHC for
antenatal, natal and postnatal care. She learns the skills of antenatal care
which includes health check-up, immunization, personal hygiene, exercise and
rest. She receives education on importance of community support and learns
the skills of establishing community support.
b) Nutritional health care of infant and young children: She gets familiar with
the importance of optimal infant and young child feeding. She learns about
the breastfeeding, its early initiation, colostrum feeding, exclusive breast
feeding up to six months and prelacteal feeding. She learns the dangers of
artificial feeding before 6 months of age. She learns about the breast milk
production and flow and correct positioning of the baby at the breast,
helping mother for correct attachment. In situations like less milk
production by mother she receives training for finding common causes for
less milk production, deciding whether the baby is getting enough milk
55
and evaluation of the condition that why baby is not getting enough milk .
She also learns about the various breast conditions like problem related to
size and shape of the nipple. During the training she learns about age
specific nutritional requirements of children between 2-6 years. She learns
about need of immunization, health check-ups and nutritional
supplementation for the children between 2-6 yrs. She also learns about
feeding of the children during illness and enriching the food value of foods
by ways and means of improvement for nutritional quality of food, by
preventing nutrient loss during cooking, by fortification of foods, by
improving dietary practices and by clarifying fads and fallacies associated
with feeding of children.
c) Nutritional health care of adolescent girls: During the training she receives
the scientific knowledge about body changes during adolescence ex.
Menstruation- maintaining personal hygiene during menstruation. She also
get familiar with the nutritional and health needs of girls during
adolescence especially the need for increased amount of iron and
supplementation of iron and folic acid to adolescent girls. Training
provides her the knowledge of various schemes and programmes of
MWCD for adolescent girl‘s ex. Khishori shakti yojna, national
programme for adolescent girls, SABLA.
4. Protein energy malnutrition among children- causes, symptoms, prevention
and management: During training anganwadi worker learns the definition of
malnutrition, cycle of malnutrition, effects and causes of malnutrition. She also
learns about the classification and assessment of malnutrition. Training designed
makes her understand the difference between under nutrition, wasting and
stunting. She learns the use of growth chart for the identification of grades of
malnutrition. During training she learns about the types of protein energy
malnutrition-kwashiorkor, marasmus, its causes and symptoms. She learns the
skills of prevention and management of PEM regarding pregnancy, infancy, 6
months-1 yr and 2-6 yrs. She learns about the referral of cases of malnutrition to
PHC.
56
5. Micronutrient deficiencies among children- causes, symptoms, prevention
and management: During training anganwadi worker receives training
regarding early detection, causes, signs and symptoms, prevention and home
management of micronutrient deficiency diseases ex. Vitamin –A deficiency, iron
deficiency anaemia, iodine deficiency disorders. She learns about the services
provided at anganwadi centre for micronutrient deficiencies among children.
6. Organizing supplementary nutrition at an AWC: During training she learns
about objectives and importance of supplementary nutrition, criteria for selection
of beneficiaries, norms and budgetary provision of supplementary nutrition in
ICDS, procurement and supplementary food, type of supplementary food like
RTE food, wheat based locally cooked food, CARE etc. she also learns about
cooking and distribution and serving of supplementary food. She learns the skills
of feeding food to a child at AWC. During training she gets familiar with the
points to remember while procuring and distributing supplementary food to
AWC‘s. An anganwadi worker also learns about the guidelines for distribution
and dosage of nutrition supplements like vitamin A solution and iron and folic
acid to women and children. She learns the skills of involving community in
supplementary nutrition programme by involving members of Mahila Mandal in
cooking and distribution of food, by improving the quality and variety of food by
enriching it with the locally available foods contributed by the community. She
learns about maintaining stock registers of supplementary nutrition.
7. Growth monitoring and promotion: During the training she learns regarding the
need and importance of growth monitoring of a child from birth onwards,
frequency of monitoring growth of children between 0-3 yrs and 3-6yrs, criteria
and identification of ‗at risk‘ children and tools and techniques for growth
monitoring. She gets familiar with the use of growth charts, weighing scales etc.
She receives training for recording correct date of birth and ways to interpret
correct age of the child, weighing of children, plotting the weight on growth chart,
nutrition counseling using growth chart and responsive and active feeding of food
for a malnourished child for the encouragement of food intake.
57
8. Nutrition counseling: During training anganwadi worker learns the skills of
building confidence and giving support to mother by accepting what mother
thinks and feels, by recognizing and praising the right things, by providing
practical help to mother given at appropriate time, by using simple or local
language for conversation with mother and by giving suggestions instead of
commands to mother. During the training she (AWW) learns about the reasons for
refusal to breastfeed and excessive crying of baby.
9. Organizing nutrition and health education session on IYCF: During the
training anganwadi worker learns about the need and importance of nutrition and
health education (NHED) in a community. She also learns about the points to
remember while planning and organizing a NHED session.
10. Neonatal and childhood illness: During the training she gets familiar with the
concept, strategy and need of integrated management of neonatal and childhood
illness in ICDS. She learns about the common causes of death among children in
ICDS project areas under the discussion programmes. She receives training for
the care of a new born and low birth weight baby. She also receives training for
the special care like cleaning, weighing, keeping the baby warm and initiating
exclusive breast feeding. She learns about the communicative and technical skills
to treat a sick child which includes the communication with mother of a sick
child, technical skills to treat a sick child ex. Counting breathing rate in case of
cough and difficult breathing, use of weight for age standard in case of under
nutrition and anaemia and use of growth and videos if available for the mother for
the explanations of a diseased condition. During the training she also learns when
and how to organize a referral services, treatment with medicines ex.
Cotrimoxazole for Pneumonia, treatment of diarrhoea with dehydration with ORS
Solution.
11. Treatment with home care and advice: An anganwadi worker receives training
in the home care for the child with ‗Cough and Cold‘, ‗No Pneumonia‘ and
‗Diarrhoea and No Dehydration‘. During the training she learns about home made
safe cough remedies and home available fluids and breastfeeding during diarrhea.
She learns about the assessment of child‘ feeding , feeding recommendations for
58
children between 2-5 years, breastfeeding during second year of life and praising
the mother for good practices and encouraging her to discuss her problem
regarding her children.
12. Prevention of emerging endemic diseases among children: during the training
an anganwadi worker receives regarding causes, general symptoms and
prevention of following diseases
- Chickenpox
- Hepatitis B,C,A,E
- Malaria and dengue fever
- Tuberculosis, Diphtheria, Pertussis, Measles, Tetanus
- Thypoid
- HIV/AIDS with special reference to mother to child transmission through
breastfeeding
13. Identification and prevention of disability among children: during the training
she (AWW) gets familiar with definition, causes and type of disability among
children. She learns about the early detection and prevention of disability among
children. She also gets familiar with the needs, right and legal safeguards for
children with disabilities.
14. Personal hygiene and safe drinking water: An anganwadi worker about learns
the need and importance of personal hygiene and safe drinking water. Training
provides her knowledge about types of infections and illnesses which occurs due
to contaminated water, methods of making water safe for drinking at anganwadi
/home.
While AWWs tend to be well-educated, they are often poorly trained for ICDS tasks in
spite of the well design training content. Survey data show that while almost all AWWs
have at least matriculated from high school and half of those in urban areas have even
received some college education; pre-service training is scarce with most women
undergoing short-term in-service training (Bredenkamp and Akin 2004). More resources
have been directed towards strengthening the capacity at the central, state and block
levels to provide high quality support and training to functionaries of ICDS programs. In
2002, a new training program, Udisha (―first rays of the new dawn‖), was initiated with
59
funding from the World Bank and attempts to shift the focus of training away from the
mere transfer of knowledge and towards the strengthening of AWW competencies.
Various Studies done in past (NIPCCD Lucknow, 2005; Gadkar et al., 2006; Indian
Institute of Development Management, Bhopal, 2008) reflected that in a majority of the
AWTC‘s, the educational qualifications of the instructors did not match with the subject
they taught. Quality of training also suffered due to lack of specialist speakers. Findings
of the study indicated that very little material or no material was given to the trainees.
These studies also explored the poor availabilities of basic facilities like toilets, furniture,
teaching materials etc.
1.5.5 Job responsibilities of the anganwadi worker
The anganwadi worker is a key person in the ICDS programme and has multiple
responsibilities for the development of women and children. Her job responsibilities are:
1. To elicit community support and participation in running the programme.
2. To weigh each child every month, record the weight graphically on the growth
card, use referral card for referring cases of mothers/children to the sub-
centres/PHC etc., and maintain child cards for children below 6 years and produce
these cards before visiting medical and para-medical personnel.
3. To carry out a quick survey of all the families, especially mothers and children in
those families in their respective area of work once in a year.
4. To organise non-formal pre-school activities in the anganwadi of children in the
age group 3-6 years of age and to help in designing and making of toys and play
equipment of indigenous origin for use in anganwadi.
5. To organise supplementary nutrition feeding for children (0-6 years) and
expectant and nursing mothers by planning the menu based on locally available
food and local recipes.
6. To provide health and nutrition education and counselling on breastfeeding/ Infant
& young feeding practices to mothers. Anganwadi Workers, being close to the
60
local community, can motivate married women to adopt family planning/birth
control measures
7. Anganwadi workers shall share the information relating to births that took place
during the month with the Panchayat Secretary/Gram Sabha Sewak/ANM
whoever has been notified as Registrar/Sub Registrar of Births & Deaths in her
village.
8. To make home visits for educating parents to enable mothers to plan an effective
role in the child's growth and development with special emphasis on new born
child.
9. To maintain files and records as prescribed.
10. To assist the PHC staff in the implementation of health component of the
programme viz. immunisation, health check-up, ante natal and post natal check
etc.
11. To assist ANM in the administration of IFA and Vitamin A by keeping stock of
the two medicines in the Centre without maintaining stock register as it would add
to her administrative work which would affect her main functions under the
Scheme.
12. To share information collected under ICDS Scheme with the ANM. However,
ANM will not solely rely upon the information obtained from the records of
Anganwadi worker.
13. To bring to the notice of the Supervisors/ CDPO any development in the village
this requires their attention and intervention, particularly in regard to the work of
the coordinating arrangements with different departments.
14. To maintain liaison with other institutions (Mahila Mandals) and involve lady
school teachers and girls of the primary/middle schools in the village which have
relevance to her functions.
61
15. To guide Accredited Social Health Activists (ASHA) engaged under National
Rural Health Mission in the delivery of health care services and maintenance of
records under the ICDS Scheme.
16. To assist in implementation of Kishori Shakti Yojana (KSY) and motivate and
educate the adolescent girls and their parents and community in general by
organizing social awareness programmes/ campaigns etc.
17. AWW would also assist in implementation of Nutrition Programme for
Adolescent Girls (NPAG) as per the guidelines of the Scheme and maintain such
record as prescribed under the NPAG.
18. Anganwadi Worker can function as depot holder for RCH Kit/ contraceptives and
disposable delivery kits. However, actual distribution of delivery kits or
administration of drugs, other than OTC (Over the Counter) drugs would actually
be carried out by the ANM or ASHA as decided by the Ministry of Health &
Family Welfare.
19. To identify the disability among children during her home visits and refer the case
immediately to the nearest PHC or District Disability Rehabilitation Centre.
20. To support in organizing Pulse Polio Immunization (PPI) drives.
21. To inform the ANM in case of emergency cases like diahorrea, cholera etc.
1.6 JUSTIFICATION OF STUDY: The Integrated Child Development
Services (ICDS) programme is a globally recognized community based early child
care programme, which addresses the basic interrelated needs of young children,
expectant and nursing mothers and adolescent girls across the life cycle, in a holistic
manner. ICDS in India is a response to the challenge of breaking a vicious cycle of
malnutrition, impaired development, morbidity and mortality in young children,
working in convergence with other flagship programmes such as National Rural
Health Mission, Sarva Shiksha Mission and others. The ICDS is perhaps one of the
better concerned programmes, yet on travels around country one realises that there is
62
a huge gap between what is expected of the programme and the ground situation.
What is even more worrying is that even the existing centres do not function
effectively and that corruption, mismanagement and callousness seem to permeate
even the ICDS programme (Ramachandran, 2005). At the grass-root level, delivery
of various services to target groups is given at the Anganwadi Centre (AWC). An
AWC is managed by an honorary Anganwadi Worker (AWW) and an honorary
Anganwadi Helper (AWH).
In ICDS there are 7073 sanctioned projects out of which 6506 are operational
throughout India while in the state of Jammu and Kashmir there are 140 sanctioned
projects which are fully operational. With the constant effort of fight against under
nutrition, ICDS has reached up to approx. 44% children nationally and 29% within
state but in spite of this massive reach the nutritional status of children under normal
category has still attained only up to 54.16% children at national level and 68.88%
children at state level (NIPCCD, 2009). Various studies (Barman, 2001; Forces,
New Delhi, 2007) in recent past has revealed that implementation of services under
ICDS are not up to satisfactory standards and still more efforts are needed for
improving the quality of services for the successful achievement of expected targets.
In the opinion of some scholars Sharma (1987) and Chattopadhyay (1999), the
attainment of ICDS Programme goals depends heavily upon the effectiveness of the
Anganwadi Workers, which in turn, depends upon their knowledge, attitude and
practice. The studies done in past have strongly concluded on the need of improved
knowledge and awareness among anganwadi workers but regrettably it was found to
be the most underrate aspect of their job profile (Kant et al., 1984; Gopaldas et al.,
1990; Bhasin et al., 2001). Thus, the present study has been taken up with the main
objective of assessing the awareness among anganwadi workers regarding the
implementation of services of ICDS in following areas viz. pre-school education,
supplementary nutrition , immunization and growth monitoring
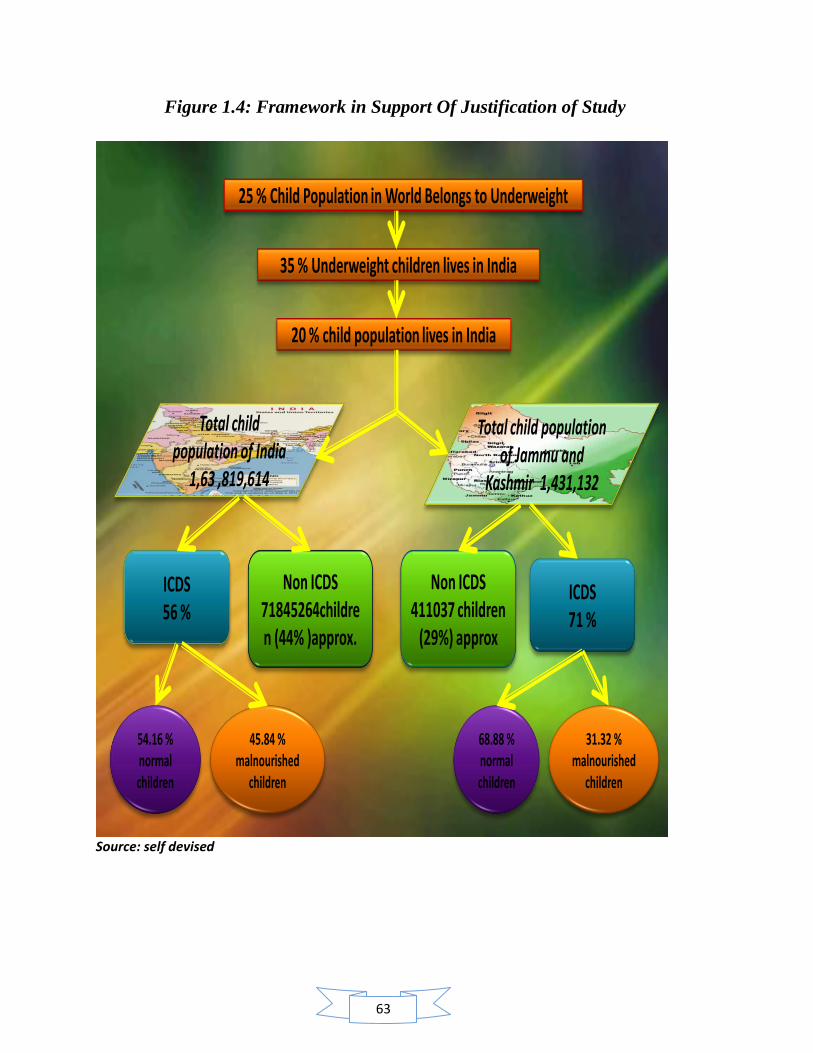
63
Figure 1.4: Framework in Support Of Justification of Study
25 % Child Population in World Belongs to Underweight
35 % Underweight children lives in India
20 % child population lives in India
ICDS56 %
ICDS71 %
Non ICDS71845264children (44% )approx.
Non ICDS 411037 children
(29%) approx
Total child population of India
1,63 ,819,614
Total child population of Jammu and
Kashmir 1,431,132
45.84 % malnourished
children
54.16 % normal children
68.88 % normal children
31.32 % malnourished
children
Source: self devised
64
1.7 OBJECTIVES OF THE STUDY:
1. To assess the implementation of nutritional services provided to pre- schoolars
(3-6 yrs) at anganwadi centre.
2. To assess the nutritional awareness among anganwadi workers.
3. To study the influence of nutrition knowledge for improved performance of
implementation of nutrition services at anganwadi centre.
4. To assess the nutritional status of pre- schoolars (3-6 yrs) attending anganwadi
centers.
5. Comparison for the level of nutritional awareness among anganwadi workers and
their implementation to nutritional services between rural and urban zone of
Jammu district.
6. To evaluate the final output and expected output of nutritional services at
anganwadi centre.
1.8 RESEARCH QUESTIONS:
What is the extent of proper use of standard measures for weighing the raw and
cooked food served to pre schoolars at anganwadi centre?
What is the extent of accuracy of proper use of weighing scale and plotting weight
on growth chart?
What is the extent of conducting nutrition and health education sessions at
anganwadi centre?
Is there any influence of awareness on the implementation of nutritional services?
What is the extent regarding nutritional awareness among anganwadi workers?
Is the increasing level of knowledge playing any significant role in quantitative
and qualitative participation for nutritional services?
65
Is there any case of malnutrition existing in the sample child population of the
study?
Are the children of sample consuming a one day diet as per the Recommended
Dietary Allowance (RDA)?
Is there any existing difference between the expected and final output of
nutritional services at anganwadi centre?

66
Chapter 2
Review of literature
67
CHAPTER 2: REVIEW OF LITERATURE
Contents:
2.1 Health And Nutrition Status In India
2.2 Training, Knowledge, Awareness, Performance And Job Satisfaction Of
Anganwadi Workers
2.3 Implementation Of Growth Monitoring And Nutritional Services In ICDS
2.4 Nutritional Status Of ICDS Children
2.5 Trainings at Anganwadi Worker Training Centre
68
REVIEW OF LITERATURE
Proper background information to design the research programme, analyze the research
data and interpret the research findings is provided by comprehensive review of
literature. A critical appraisal of earlier studies is essential for thorough understanding of
the problem. It has been observed that very few research studies were conducted on
nutrition awareness among anganwadi workers. However, a good number of studies are
available on the nutritional status of children. Keeping in view the specific objectives of
the present research, an earnest effort was made to collect the literature related to
anganwadi worker and nutrition awareness either directly or indirectly through other
related parameters. The available literature has been organized and presented under the
following heads:
Health And Nutrition Status Of India
Training , Knowledge, Awareness, Performance and Job Satisfaction of
Anganwadi Worker
Implementation of nutritional services at anganwadi centre.
Anganwadi Training Institutes.
2.1 HEALTH AND NUTRITION STATUS OF INDIA
Mishra et al (2000) presented a study under National Family Health Survey, titled as
―Women‘s Education Can Improve Child Nutrition in India ―. The study estimated the
levels of child malnutrition and examines the effects of mother‘s education and other
demographic and socioeconomic factors on the nutritional status of children. Results
indicate that more than half of all children under age four are malnourished. Children
whose mothers have little or no education tend to have a lower nutritional status than do
children of more-educated women, even after controlling for a number of other—
potentially confounding—demographic and socioeconomic variables. This finding
69
suggests that women‘s education and literacy programs could play an important role in
improving children‘s nutritional status.
Sharma et al (2003) A cross sectional study of the nutritional status was made on 123
Raj Gond (tribal community of Central India) preschool children (62 boys and 61 girls;
aged 1 to 5 years) in the Waratola village of Balaghat district of Madhya Pradesh, India.
Anthropometric nutritional status was assessed by WHO criterion (SD classification) and
also NCHS standard using weight for age, height for age, weight for height indices and
MUAC. The prevalence of nutritional deficiency was also investigated by clinical signs.
The results revealed that there was high prevalence of underweight (37.4%), stunting
(46.3%), wasting (41.5%) and low MUAC (50.4%) as well as different grades of
malnutrition. Boys suffered these more than the girls. Comparatively, Raj Gond
preschool children were nutritionally more wasted than Gond and other nontribal
preschool children of Madhya Pradesh. When gradation of malnutrition was compared
with other tribal and caste preschool children of Central India, it was observed that the
present children studied suffered more by different grades of protein energy malnutrition
(PEM). The poorer nutritional status was also reflected through high prevalence of sparse
hair (18.7%), conjunctival xeroxis (18.7%), angular stomatitis (32.5%) and other
nutritional deficiency signs. All these observations suggest that preschool children need
better nutrition to combat the problem of PEM. Further studies should be made to
identify the factors responsible for it.
Kumar et al (2006) conducted a study to assess the nutritional status of under-five
children and to observe the association of infant feeding practices with under nutrition in
anganwadi (AW) areas of urban Allahabad, Uttar Pradesh. The study was conducted in
four selected AW areas of urban Allahabad, and data was collected from 217 children
under the age of five years. The factors considered were socio-demographic
characteristics, age of children, caste, religion, socioeconomic status (SES), education of
mother, infant feeding practices, initiation of breastfeeding, feeding of colostrum,
exclusive breastfeeding upto 6 months, complementary feeding, and also information
about receipt of ICDS benefits by children. Out of all the children studied 36.4% were
70
underweight, 51.6% stunted and 10.6% wasted. Maximum prevalence of underweight
(45.5%) as well as stunting (81.8%) was found in the age group of 13-24 months. There
was decline in the prevalence of stunting after the age of 24 months. Wasting was found
to be most prevalent (18.2%) in the age group of 13-24 months. There was decline in the
prevalence of stunting after the age of 24 months. Wasting was found to be most
prevalent (18.2%) in the age group 37-48 months. In cases where mothers had higher
levels of education, the prevalence of under nourishment among children was low. There
were more male underweight children (37%) as compared to female children (35.4%),
but the prevalence of stunting was more among females (63.3%) than males (44.9%).
Proportion of underweight was significantly less among children whose mothers reported
initiation of breastfeeding within 6 hours of birth (30.6%), children who were fed
colostrum (27.5%), and children who got proper complementary feeding (28.6%).
Wasting was not significantly associated with any infant feeding practices studied. ICDS
benefits received by children failed to improve the nutritional status of children. The
study found that delayed initiation of breastfeeding, deprivation of colostrum, and
improper complementary feeding were significant risk factors for under nutrition among
under five children. The study suggested that there is need for promotion and protection
of optimal infant feeding practices for improving the nutritional status of children.
Singh et al (2006) conducted a study to assess the impact of drought on childhood illness
and nutrition in under- five children of the rural population. The study was carried out in
24 villages belonging to 6 tehsils of Jodhpur district which was a drought affected desert
district of Western Rajasthan. A total of 914 under 5 children (0-5 years) could be
examined for their childhood illness history, malnutrition, dietary intake and clinical
signs of nutritional deficiency. The main childhood illnesses observed during drought
were respiratory (7.5%), gastroenterological (7.5%), and fevers (viral, malaria and
jaundice) (5.6%). Male children were reported to have significantly higher illnesses
(28.5%) than females (18.7%). Other illness observed were ear disease (2.1%), skin
problems (0.5%) and eye disease (0.2%). All childhood illnesses showed increasing trend
with age, i.e. 13% in infants to 26.0% among children in 4-5 years age group. Recent
malnutrition (weight for age) was observed to be 39%. Highest level of recent

71
malnutrition was observed in 1-2 years age group. Girls were found to be more
malnutritioned (40.8%) as compared to boys (36.1%). Overall 25.8% children suffered
from chronic malnutrition, i.e. long term malnutrition. Chronic malnutrition was also
higher in girls (31.2%) than in boys (20.4%), particularly among children aged 1-2 years.
The overall prevalence of Anaemia was observed to be 30.5%. Prevalence of various
signs related to Protein Calorie Malnutrition (PCM) was observed to be high, i.e.
dispigmentation (20.2%), dryness of hair (21.6%), and others which accounted for 2.6%
only. Prevalence of Marasmus was 1.7%. All signs associated with PCM were observed
to be higher among girls (46.3%) than boys (42.8%). Vitamin A deficiency sign (Bitot
Spot) was observed in just 0.2% children, and no night blindness was observed. The
overall prevalence of Vitamin B complex deficiency was seen in 3% children, and
Vitamin C deficiency was observed in 0.1% children. The study suggested that firstly,
gender differences should be removed by giving proper education to community people;
also, effective measures to make adequate calories and proteins available to all age
groups, especially to under- 5 children through the ongoing nutrition programmes, needs
to be ensured.
Mishra (2007) conducted study to evaluate the achievement of Indian states on 3
anthropometric indicators (Height-for-age, Weight-for-age and Weight-for-height), to
measure the prevalence of child nutrition. Data collected from all 28 states of India
through NFHS-2 (1998-99) and NFHS-3 (2005-2006) was analysed. The rural-urban
difference for states in NFHS-3 showed that Rajasthan had the highest difference of
13.5% points in child stunting, followed by Punjab (12.5%) among states of northern
India. In the western region in Maharashtra, the rural-urban difference was 10.9% in
1998-99 which came down to 5.5% in 2005-06. The prevalence of stunting in Gujarat
was nearly stagnant in all the 3 rounds, 42.4% in 2005-06, 43.6% in 1998-99 and 43.6%
in 1992-93. The rural-urban difference was also stagnant at around 8%. In Kerala,
southern India, the prevalence of child stunting was minimum and the rural-urban
difference was also very nominal (-0.2%) and Tamil Nadu was the next best state where
aggregate prevalence of stunting was about 25%. At all India level, the prevalence of
stunting showed gradual decline from NFHS-1 (52% in 1992-93) to NFHS-3 (38.4% in

72
2005-06). Using weight-for-age of children as an indicator, Punjab had the lowest
prevalence of underweight (27%) children among all other counterparts of northern India.
The situation in Madhya Pradesh had worsened as prevalence of underweight among pre-
school children had increased from 57.4% in 1992-93 to 60.3% in 2005-06. In eastern
India the concentration of under-weight among young children was very high in West
Bengal, Bihar, and Chhattisgarh. For Bihar and Jharkhand the prevalence of underweight
had increased from 54.3% each in 1998-99 to 58.4% and 59.2% in 2005-06. Among
North-Eastern states, Meghalaya (46.3%) had the highest prevalence of underweight.
Maharashtra had highest decline in prevalence of underweight in all the 3 rounds at State
level, (12.9%), as well as in rural areas (14%). In south India, Kerala continues to be the
best performer in the region, in all the 3 rounds (28.8% in 2005-06, 26.9% in 1998-99
and 28.5% in 1992-93). At all India level, the prevalence of underweight had come down
marginally between NFHS-2 and NFHS-3 (from 47% to 45.9%). For northern India, it
was found that wasting increased over the period of time at aggregate level, especially in
the last phase, for all states in the region. The situation worsened in Madhya Pradesh,
where the aggregate prevalence of wasting increased from 20.2% in NFHS-2 (1998-99)
to 33.3% in NFHS-3 (2005-06). In eastern India the prevalence of wasting had came
down in Chhattisgarh and Orissa in the NFHS-2, whereas for Bihar, Jharkhand and West
Bengal, prevalence of wasting among young children has shown an increase in all the 3
rounds. Among the North-Eastern states, Meghalaya had the highest prevalence of
wasting. The prevalence of wasting among young children had come down in the second
phase among Western states, especially in Goa and Maharashtra. The prevalence of
wasting among all the Southern states except Karnataka (where it has come down from
20% to 17.9%) has gone up between the last two rounds of NFHS. Future intervention
programmes aiming at reducing undernourishment among Indian children should be more
focused.
Verma et al (2007) Children participating in the ICDS in India have high rates of iron
and Vitamin A deficiency. This study was conducted in 30 AWCs of Mahestala block in
South 24 Parganas, West Bengal to assess the efficacy of a premix fortified with iron and
Vitamin A added at the community level to prepared khichdi, a rice and dal mixture. All
73
attending children received a single 200 gm portion of the khichdi treatment assigned to
their AWC 6 times a week for 24 weeks. For each 200 gm serving of khichdi, the premix
provided 14 mg encapsulated ferrous fumarate, 500 International Unit (IU) Vitamin A
(retinyle acetate: particle size of 250; cold water soluble) and 0.05 mg folic acid. The
placebo premix contained only dextrose anhydrous. Both premixes were packed in reseal
able polyethylene bags in 500 gm increments. Each selected AWC received 500 gm
premix at baseline and after 3 months of the intervention. After 2 weeks of the
intervention, 85% AWWs had minor problems with the packaging of the premix,
including breakage of the polyethylene bag and failure of the bag to properly seal. Total
684 children were screened and enrolled, 168 (24.5%) were lost to follow-up (dropped
out) before the 24 week assessment; thus 516 completed the 24 week trial. Reasons for
loss to follow-up were refusal of further venipunture (n=161), change of location (n=5),
and low attendance at the AWC (n=2). Most of the characteristics of the children who
dropped out of the study did not differ significantly from those of the children who
completed the trial, including the age, sex, iron status, and mean haemoglobin
concentration. However, the prevalence of anaemia was significantly greater in the
children lost to follow-up (35.1%) than in those who completed the trial (26.2%)
(p<0.05). Prevalence of anaemia in fortified group was 19.1% at 0 week; 9.8% at 12
weeks; and came down to 4.1% at 24 weeks. Similarly in non-fortified group it was
32.6% at 0 week; 13.3% at 12 weeks and 20.7% at 24 weeks. Iron deficiency in fortified
group was 22.5% at 0 week; 10.2% at 24 weeks; and in non-fortified group it was 20.7%
at 0 week and 30.4% at 24 weeks. Prevalence of Vitamin A deficiency of fortified group
was 17.5% at 0 week; and 8.1% at 24 weeks; and in non-fortified group it was 13% at 0
week; and 6.3% at 24 weeks. Low Vitamin A status in fortified group was 47.9% at 0
week and came down to 21.5% at 24 weeks. Similarly, in non-fortified group, low
Vitamin A prevalence was 40.8% at 0 week, and it came down to 20.4% at 24 weeks.
The failure of the fortified khichdi to increase serum retinol concentrations or to reduce
the prevalence of Vitamin A deficiency and low vitamin status might have resulted
because of the deterioration of Vitamin A in the fortified premix. The addition of a
fortified premix to khichdi in ICDS AWCs provides an excellent opportunity to provide
the needed micronutrients to children with or at risk of micronutrient deficiencies
74
throughout India. It also would be an effective means of meeting the micronutrient
malnutrition needs of pregnant and lactating women and of younger children who are
consuming solid foods.
Sharma (2008) conducted a study to examine the determinants of childhood mortality
and child health in India, and the factors explaining the differential performance of child
immunization and treatment of childhood diseases. Data was taken from 3 rounds of the
National Family Health Survey of India (NFHS) conducted in 1992-93, 1998-99 and
2005-06. Analysis revealed that on account of interventions for children, the infant
mortality rate in India had gone down from 114 in 1980 to 58 in 2005. Data from NFHS
indicated that under-five child mortality (U5MR) rate was 109.3 per 1000 live births in
1992-93, declined to 94.9 per 1000 live births in 1998-99, and 74.3 per 1000 live births in
2005-06. The neonatal mortality rate was 48.6 per 1000 live births in 1992-93, which
decreases to 39 in the year 2005-06. It was found that mortality in India was lower for
females (37) than for males (41). As children get older, females had higher mortality than
males. The study found that females had 36% higher mortality than males in the post
neonatal period, but a 61% higher mortality than males at age 1-4 years. It was found that
infant mortality rate was lowest when mother‘s age was 20-29 years (50), and was
substantially higher when mother‘s age was less than 20 years (77), and 40-49 years (72).
Similar age differentials were found in neonatal mortality, post neonatal mortality and
child mortality (at age 1-4 years). In India, it was found that STs have the highest infant
mortality, followed by SCs. The situation regarding child immunization was not as clear.
Only a small improvement was found in full vaccination coverage. Only 44% of the
children aged 12-23 months were fully immunized in 2005-06, which was a slight
improvement from 42% in 1998-99 and 36% in 1992-93. It is estimated that under-
nutrition and anaemia were contributory factors in over 50% of under-5 deaths in the
country. The other major causes of infant mortality were premature births and low birth
weight, poor intra-partum and newborn care, diarrhoea diseases, acute respiratory
infections, and other infections. There is need to strengthen the health system, prioritize
essential elements of child health and nutrition services, and develops and expands
community participation for the prevention and treatment of childhood illness. Also, a

75
multi-sectoral approach should be adopted which would include female education and
nutrition, increasing the use of health services during pregnancy and delivery, eliminating
gender gap in child health services, and improving nutrition throughout the life cycle.
2.2 TRAINING, KNOWLEDGE, AWARENESS, PERFORMANCE
AND JOB SATISFACTION OF ANGANWADI WORKER
Udani and Patel (1980) The Integrated Child Development Services Scheme of urban
slum of Bombay was launched in April 1977. The evaluation of knowledge and
competence of anganwadi workers employed was carried out in February–March 1979
and again in February–March 1980. An attempt was made to assess the impact of their
knowledge, on the community in respect of their health and nutrition components. The
study reveals poor knowledge in the community despite a good performance of the
related anganwadi workers in examination. It is suggested that an active participation of
the community in the programme should be encouraged and there should be a closer and
frequent supervision of the anganwadi workers.
Kant et al (1984) conducted a study to assess the profile of 96 AWW of Inder Puri
project areas in Delhi and their knowledge about ICDS was assessed thru a
questionnaire.92.71% AWW were trained only.17.71 % lived and worked in the small
locality. The number .of children under age group of 2 yrs whom they would expect in an
awc were known to only 3.12% .Majority 92.71 % could not tell full form of ICDS. Most
of them 90.62% could not enumerate all the services being provided and none could list
out their job responsibilities. It is recommended that the existing training of AWW need
to be evaluated and their continuous education strengthened.
Gujral et al (1992) conducted a study in which forty-three anganwadi workers
(community health workers) in Gujarat state, India, were interviewed to record their
education level, evaluate their nutrition knowledge, and collect information on the
number of visits made by the auxiliary nurse midwife (ANM) in the preceding three
months and the activities she performed for the anganwadi. The coverage of five services
76
delivered or assisted by the anganwadi worker- supplementary feeding, growth
monitoring, vitamin A prophylaxis, health check-ups, and immunization- was estimated
by interviewing the mothers of 3,987 children 0-6 years old. The anganwadi worker's
having at least a high school education, a nutrition knowledge score of more than 4 out of
7, more than one visit by the ANM in three months, and an ANM activity score of more
than 2 out of 9 were significant determinants, individually or in combination, for the
anganwadi worker's performance. Multiple regression analysis indicated that nutrition
knowledge was the most powerful determinant of performance, followed by guidance
from the ANM and education level. It is therefore concluded that anganwadi workers
should receive nutrition health education and regular guidance from the ANMs, and their
education level should be high school or above.
Singh and Vashist (1993) conducted a study on assessment of training needs of
anganwadi workers in relation to infant feeding. The present study was conducted to
assess the training needs of AWWs in relation to infant feeding. Anganwadi Workers (n
= 82) working in field practice areas of Preventive and Social Medicine, Department of
LHMC, New Delhi were included. A pretested semi-structured questionnaire covering
different aspects of breast feeding and weaning was administered to them Majority of
them responded correctly about (a) initiation of breast feeding (98%), (b) feeding
colostrums (98%), (c) superiority of breast milk over commercial milk preparations
(98%), (d) age of introduction of semisolids (98%), and (e) unhygienic bottle feeding a
major cause of diarrhoea (95%).Different incorrect responses were (a) top milk should be
diluted (43%), (b) bottle feeding should not be avoided (52%), (c) wet (surrogate)!
nursing is harmful (60%), and (d) breast feeding is not beneficial for health of the mother
(41%). Sixty six per cent, 41 per cent and 24 per cent AWWs responded incorrectly that
breast feeding should be stopped if the mother is suffering from tuberculosis, malaria and
diarrhoea respectively in the light of these findings training of AWWs in relation to infant
feeding should be modified. There is need for continuing education of AWWs for
updating their knowledge.
77
Bhasin et al. (1995) conducted a study in an Integrated Child Development Services
(ICDS) block, Alipur, in Delhi, India, interviews were conducted with 100 anganwadi
workers (one of whose major functions is growth monitoring) to determine their
knowledge on growth monitoring and to identify gaps in that knowledge. Each
anganwadi worker serves a population of 1000. 99% had adequate knowledge about the
significance of the lines on the growth charts that indicate different grades of nutritional
status. Yet only 43% knew that they can begin growth monitoring for any child under age
6. 37% did not know that assessment of correct age is not essential for growth
monitoring. 90-91% had correct knowledge about weight of a child at 1 and 3 years. Yet
only 17-30% knew the correct mid-upper arm circumference (MUAC) for an optimally
nourished child aged 2 years and 4years . These findings suggest that training programs
and various meetings have emphasized inputs of growth monitoring but not on age at
which growth monitoring can be started, on correct age for successfully conducting
growth monitoring, and on the cut-off measurements for MUAC. Continued education on
various aspects of growth monitoring is needed for anganwadi worker.
Datta (2001) conducted a study to understand the issues affecting job performance of
AWWs by looking at various dimensions. 6 blocks from three districts of Maharashtra,
namely Nagpur, Nasik and Amravati were covered. A total of 615 AWWs and 72
Supervisors were selected. It was found that the training centers were very old and there
were no additional classes or laboratories for intensive work or doing practical. There
was no feedback taken from training centers. The CDPO does not visit the AWCs to see
how AWWs communicate with beneficiaries. 70% Supervisors were graduates or post
graduates. Their training had been done long ago and there had been no refresher training
courses for them. 70% Supervisors had more than 10 years experience. Out of 72
Supervisors, around 52 of them visited AWCs only once a month, while 17 of them
visited twice a month and only 3 Supervisors visited AWCs more than twice a month.
50% Supervisors looked into the many registers and records maintained like attendance,
growth chart, food record, Mahila Mandal meetings, etc. They also looked at records of
severely malnourished children. 97% AWWs mentioned that training helped them to
measure a child‘s height and weight. 98% AWWs said training was essential for
78
knowledge about immunization, distributing nutritious food, and providing parents with
nutrition and health education. Only 74% AWWs mentioned that training was useful to
create self help groups and conduct adult literacy classes for women. 46% AWWs
mentioned they would try and take interest in children by telling those stories or singing
songs, etc. Another 24% organized interesting activities like picnics or playing with toys.
Some said that decorating the AWC well would induce the children to come, while others
mentioned that parents need to be convinced first to send their children to the AWC. 36%
children were neat, clean, hygienic and obedient, and 12% children looked physically
dirty and suffered from coughs and colds. 89% Supervisors mentioned that attendance of
the AWW was regular. 56% Supervisors said that AWWs participated in the block office
work and 13% participated only if there was some important work. 81% AWWs were
fully trained and had adequate information to measure height and weight of children.
43% AWWs were giving personal attention to each child. 58% taught according to the
syllabus. AWWs mentioned that training prepared them for informal education, nutrition
demonstration, home visits, plotting weight charts and health related issues. All AWWs
could weigh children and interpret growth charts. 90% Supervisors agreed that AWWs
got average co-operation from villagers in their work. There is need to improve the
quality of training, improve board and lodging facilities. There is need for Mobile
Training Units. Basic text books should be available in regional language.
Thakare at el (2007) conducted a study on knowledge of anganwadi workers and their
problems in an urban ICDS block. The present study was carried out at the urban
Integrated Childhood Development Services Scheme (ICDS) block of Aurangabad city
from June 2006 to June 2007. The objective of the study was to study the profile of
Anganwadi Workers (AWWs) and to assess knowledge of AWWs & problems faced by
them while working. Anganwadi centers were selected by stratified sampling technique.
From each sector, 20% AWWs were enrolled into study. The functioning of AWWs was
assessed by interviewing Anganwadi workers for their literacy status, years of
experience, their knowledge about the services rendered by them and problems faced by
them. Most of AWWs were from the age group of between 41-50 years; half of them
were matriculate and 82.14% workers had an experience of more than 10 yrs. Majority
79
(78.58 %) of AWWs had a knowledge assessment score of above 50%. They had best
knowledge about nutrition and health education (77.14%). 75% of the workers
complained of inadequate honorarium, 14.28% complained of lack of help from
community and other problems reported were infrastructure related supply, excessive
work overload and record maintenance. The study concluded that majority of AWWs
were beyond 40 years of age, matriculate, experienced, having more than 50% of
knowledge related to their job. Complaints mentioned by them were chiefly honorarium
related and excessive workload.
Dongre et al (2008) conducted a study on perceived responsibilities of anganwadi
workers and malnutrition in rural Wardha. The objective of the study was to find out the
nutritional status of under-six children attending ICDS scheme and to study Anganwadi
workers‘ (AWW) perceived work load and operational problems. A triangulated research
design of quantitative (survey) and qualitative (Venn diagram, seasonal calendar)
methods was used. Nutritional status of children was assessed by a survey. Participatory
methods like Venn diagram and Seasonal calendars were used to collect qualitative data
regarding AWWs perceived work load and food security with malnourished children.
Overall, prevalence of underweight and severe underweight among children under-six
was found to be 53% and 15% respectively and among children below three years it was
47% and 15% respectively. Venn diagram showed AWWs‘ multiple responsibilities. In
seasonal diagram exercise, the mothers of severely malnourished children showed
enough food availability in their house across all months of a year. The study concluded
that to efficiently tap the potential of AWWs for reducing multidimensional problem of
malnutrition, ICDS needs to design and implement flexible, area-specific and focused
activities for AWW.
2.3 IMPLEMENTATION OF NUTRITIONAL SERVICES AT
ANGANWADI CENTRE
National Council of Economic Research (1998) conducted a pilot study for the
evaluation of ICDS scheme in the selected blocks of five states .It was found that
80
supplementary nutrition used to be given to pre schoolars across the states.
Supplementary feeding for pre school children aims at preventing marginal cases of
under nutrition for lapsing into severe or fatal forms. About 75% of the children received
the supplements regularly and also consumed it at spot. Approximate 25% of the
beneficiaries were supplied ration in bulk for consumption at home. Usual practice was to
give a fixed quantity of supplement to all children irrespective of their age and nutritional
status. Study showed that in ten blocks, the food is cooked on spot whereas on other
blocks centrally processed ready to eat food is distributed ,corn Soya blend popularly
known as CSB is supplied in the blocks of Darjeeling districts through CARE.
Barman (2001) conducted a study to evaluate the impact of the ICDS programme on
beneficiaries, and assess the performance of AWWs. The study was undertaken in Jorhat
district of Assam. Out of 150 AWCs, 50 AWCs were covered, and a total of 150
beneficiary women were selected for the study. It was found that Community Survey was
conducted very often by 86.67% AWWs. Activities based on community participation
and maintaining liaison with other institutions were given medium level of priority by the
AWWs. Formal sessions of NHE were conducted only in 26.67% AWCs, out of which in
only 6.67% AWCs, NHE sessions were conducted once in 6 months, and in 13.33%
AWCs, NHE sessions were conducted once in a year. 77.33% beneficiaries expressed
dissatisfaction due to irregularity of NHE programme, 65.33% mentioned that teaching
was not satisfactory, and 64% expressed that the content of classes and timing of classes
was unsatisfactory. The immunization status of children below 1 year of age against
BCG, measles, DPT and polio was 52.2%, 49.45%, 41.59% and 86.7% respectively.
Immunization of children in the age group 1-3 years for DPT booster and polio drops was
52.16% and 80.40% respectively. DT was given only to 26.12% of the total children aged
3-6 years. Of the total pregnant mothers, only 54.25% received Tetanus Toxoid vaccine.
100% of the beneficiaries were aware of the health services provided, and about 60%
were satisfied with the services. 60% AWWs mentioned that health check-up was carried
out for both children and women at least once in 3 months. Medicine kit was available in
all AWCs, which was replenished regularly. Only 26.67% beneficiaries were aware of
referral services, and only 17.33% were satisfied with the service. Only 26.67% AWWs
81
conducted referral services at their centre, but none of them filled in the referral slips with
requisite details. Only 26.67% AWWs arranged meetings for imparting NHE to mothers,
and only 6.67% used aids during meetings. All the AWWs weighed the children, but only
46.67% of them interpreted the growth trends. Only 33.33% AWCs had adequate indoor
space. Outdoor space and storage space was available only in 40% and 13.33% of the
AWCs respectively. All beneficiaries were aware that supplementary nutrition was
provided by AWWs but none of them were satisfied with the services due to irregular
supply of food, poor quality and insufficient quantity of food. 100% beneficiaries were
aware of the PSE component, but only 26.67% of them were satisfied with PSE being
imparted at AWCs. The reasons for dissatisfaction were the informal character of PSE
and unsatisfactory activities conducted under the preschool component. The training of
ICDS functionaries should emphasize more on important functions like growth
monitoring, health and nutrition education, NPE (Non-Formal Preschool Education) and
referral services. The content of the training course for AWWs also needs thorough
analysis.
Bhasin et al (2001) conducted a study in 13 anganwadi (out of 132) in Nand Nagri, East
Delhi to assess the nutritional status of children in relation to utilization of ICDS during
their early childhood. Information regarding utilization of ICDS facilities, socio-
demographic details, general awareness etc was collected through interviews,
anthropometric and clinical examination of every child and attendance score of every
child at the anganwadi was calculated. Results revealed that most of the children were
non- beneficiaries. Parents of most of the children were illiterates.94.2% children were
attending schools. The proportion of children utilizing ICDS services for more than 6
months ranges from 8.8% to 24.3%. Age and sex of the children, educational status and
total attendance at the anganwadi showed statically significant relation with the degree of
malnutrition. Overall, children who attended anganwadi were nutritionally better than
their counterparts who did not attend anganwadi during their childhood.
Bhowmick and Samita (2001) A study was conducted by West Bengal council for child
welfare to assess the health status of mother and children in 3 district of West Bengal.
82
The study found that the impact of ICDS was immense in maintaining the health of
mother and children and raising their level of awareness .The study recommended
opening more AWC, s so that the health and nutrition status of women and children could
be improved.
National Council of Applied Economic Research, New Delhi (2001) conducted a
nationwide evaluation of the ICDS Scheme to help the Government in initiating
corrective measures to make the programme more effective. Nearly 4000 projects, 60,000
AWCs, 4000 Mukhya Sevikas and 1.80 lakh beneficiary households with children in the
age group of 0-1 years, 1-3 years and 3-6 years were selected. It was found that nearly
66% of the eligible children and 75% of the eligible women were registered at AWCs.
Less than 3% children were severely malnourished, except in Bihar, where severe
malnutrition among children 13-36 months was 28%, children 6-12 months were 6%, and
in children aged 37-72 months was 5%. Most states indicated low levels of severe
malnourishment. About 11.3% of the children were moderately malnourished and
children in the age group of 37-72 months reported higher incidence of moderate
malnourishment. More than 75% AWWs were matriculate in the northern and eastern
part of the country. Gujarat and Rajasthan had the lowest percentage of matriculate
functionaries. About 84% of the functionaries had received training, mainly pre-service
training. More than 80% children were immunized against all major diseases. More than
90% of the women mentioned that they received tetanus toxoid vaccination, but the
referral system was found to be quite weak in many states. Most AWWs and community
leaders were not in favour of ICDS functioning under the panchayats, either due to lack
of interest or inadequate knowledge and awareness of the importance of women and child
development. The community and panchayats, both provided space and other
infrastructural support to AWCs, and helped in identifying beneficiaries. Community
participation was mainly from mothers and family members of beneficiaries whose
children derived benefits from the programme. Participation of beneficiary women and
adolescent girls in AWC activities was very low. Majority of households reported that
they needed the services of SN, PSE, immunization and NHE provided under the ICDS
programme, and they were satisfied with the delivery of these components. Of the 26
83
states in the country, Mizoram, Meghalaya, Orissa, Gujarat and Goa were the top 5 states
due to adequate infrastructure, better profile of functionaries and efficient functioning of
the AWCs. Arunachal Pradesh, Bihar, Jammu and Kashmir, Nagaland and Uttar Pradesh
were ranked low. There was lack of one to one correspondence between the overall
performance and the household perception of the benefits received from the programme
in Arunachal Pradesh, Assam, Goa, Gujarat, Himachal Pradesh, Punjab, Tamil Nadu and
Uttar Pradesh. In a majority of the states, the weight register, health and referral register
received less attention. Orissa, Arunachal Pradesh and Punjab scored over other states in
maintenance of records. The performance of Sikkim was poor. The coordination between
various departments at micro level was weak. There is need for strengthening both inter
and intra-departmental coordination for smooth delivery of the programme services.
Training of functionaries should be more focused, and special skills and training are
required to identify children having disabilities. Package of services provided under
ICDS should be based on local socio-economic and cultural population needs.
Bharti et al (2003) The study was conducted to assess the nutritional services provided at
anganwadi centers and to know the awareness and utilization level of these services. A
sample of 15 anganwadi centers (AWCs), 15 anganwadi workers (AWWs) and 30
parents of children who attended AWCs was taken from the urban slums of Jammu city.
Data was collected through interview schedules and observations. In spite of the poor
set-up of AWCs they provided supplementary nutrition (SN) to the children, but AWWs
were not keeping in mind the recommendations given by the Government. Only 40%
centers were maintaining growth charts, showing the nutritional status of children. But
parents were satisfied with the type of nutritional supplement provided to their children,
and they knew the health status of their children. It was recommended that
supplementary nutrition provided should be as per the recommendations of the
Government, and that growth charts should be maintained regularly in anganwadi
centres.
Dutta (2004) conducted a study to assess the functioning of the AWW in slums of Delhi.
The findings revealed that 5 % of AWC were running in rented house. Infrastructure
84
facilities like source of drinking water was present in 75% of AWC sanitary facilities was
not allowed for the children to use.55 % of AWC after the gap of 4 yrs received medicine
kit and iron and folic acid since last four years. Nearly 50% of the AWC reported and
adequate space especially for cooking .on an average nearly 66 % of eligible children and
75% women were registered at the AWC. Lack of motivation of AWW in identifying and
registering the population.AWC are not that much popular as expected and the major
reason revealed poor rapport between AWW and community members.
Haryana, Department of Economics and Statistics, Chandigarh (2004) Economic and
Statistical Organization, Planning Department conducted a study to evaluate the
functioning of ICDS in Haryana. In all, 48 AWCs and 576 beneficiaries were selected. In
2001-02, the expenditure on Supplementary Nutrition (SN) component of ICDS was
borne by the Central Government (57%) and by the State Government (43%). The trend
of availing SN by expectant women/ nursing mothers during the years 1999-2000 to
2001-02 was decreasing. The achievements under immunization for children was 100%
or above whereas for T.T. of mothers was 84%. In non-formal preschool education the
achievement was 98%. All AWWs were fully trained, while 33 (69%) helpers were not
trained. It was found that the achievements under SNP was 76% in 6 months – 3 years
age group for enrolled children, 83% for 3 years – 6 years children, and 74% for pregnant
and nursing mothers enrolled. A total of 16,324 children were weighed and it was found
that 6583 children were normal (40%), 6105 children were in Grade I (37%), 3502 were
in Grade II (21%), 127 were in Grade III (1%), and 7 were in Grade IV malnutrition
(0.42%) respectively. Only 4889 (32%) beneficiaries were medically checked up either
by ANM/ LHV or Medical Officers during the preceding three months. Out of a total of
9302 families, 7323 (79%) were visited by ICDS staff. A total of 4839 (83%) children
received PSE benefit, out of which 2549 (53%) were males and 2290 (47%) were
females. Around 126 (88%) pregnant women received folic acid tablets from AWCs. Out
of 288, 178 (89%) expecting women got ante-natal care from AWWs and were satisfied
with their advice. Out of 144 nursing mothers, 97% were visited by AWWs after
delivery. Out of 144 sampled beneficiary women, 139 (97%) breastfed their babies. 98%
women were taking care of their children and their children were found to be in good

85
health. Around 88% women adopted family planning norms. SN was distributed on an
average of 25 days in a month. 62% children took SN to their homes thus defeating the
very purpose of the scheme. Around 96% children‘s mothers mentioned that SN items
were of good quality. 90% beneficiary children came to AWCs for other reasons like
getting non-formal education, health care and learning good habits. 93% beneficiaries
were in favour of the prevailing system of SN. Only 18 (56%) Gram Panchayats extended
help to AWWs in organizing cultural functions in AWCs to attract public participation.
60% AWCs were running in Panchayat/ Government buildings, whereas 40% were run in
rented/ private buildings. The weight record of 283 (98%) children out of 288 was
maintained using register/ card system. Members of Mahila Mandals took active part in
AWCs. The performance of ICDS was found to be satisfactory in SN, PSE and
immunization programme, but supervisory staff, P.O., CDPO and supervisors should
increase their visits to further improve the programme. Condition of AWCs need more
attention, the participation of local community like panchayats should be sought, and
public health, PWD and Electricity Departments may provide better facilities in AWCs.
Davey et al (2005) conducted a study on Perception regarding quality of services in
urban ICDS blocks in Delhi. The good quality of the services is an important determinant
for acceptance of a programme in a community. It not only enhances the credibility of a
worker at the ground level but also generate the demand for the services. In this paper
perception for the quality of the services was assessed through the exit interview of the
beneficiaries at the Anganwadi centres (AWCs). 200 beneficiaries were included from 20
AWCs in a period of one and half month. 52.5% respondents were dissatisfied for the
services provided from the AWC for one or more reason. The most common reason
mentioned was the not easy accessibility of the AWC and less space available at the
AWC (68.6%), followed by the poor quality of the food distributed (66.7%) and irregular
preschool education (57.1%) from AWCs
Indian Institute of Management Bangalore, Bangaluru (2005) A social assessment of
ICDS in Karnataka was initiated by UNICEF. 240 AWCs from four districts namely
Kolar, Dharwad, Gulbarga and Mysore were covered. It was found that pre-school

86
education (PSE) was the weakest link of the ICDS programme. Toys, playground and
teaching equipment were not available in a number of centres. The training imparted to
AWWs did not offer the required competencies and skills to carry out pre-school
activities. Parents were not happy with mere games and oral skills taught under pre-
school activities. The supplementary nutrition (SN) and Amylase Rich Food (ARF) was
not of good quality and distribution was not regular. Storage facilities, measuring scales
and cooking facilities were not available or were inadequate. Lack of proper coordination
with the health department and absence of mission mode had made the immunization
programme less effective. Proper buildings constructed at the right locations were a
major problem. Clean drinking water was not available in many AWCs. Lack of proper
transportation facilities for CDPOs and supervisors had an impact on functioning of the
scheme. ACDPOs were deputed for other duties and many times did not have any
delegation of power to take decisions regarding monitoring and implementation. As their
post did not have proper job description and their services were not well streamlined in
ICDS. The PRIs namely ZP, TP and GP did not fully participate in ICDS activities. The
AWTCs and Middle Level Training Centres (MLTCs) had good physical infrastructure,
but more full time faculty were needed for enriching the training programme. Some
AWTCs did not have adequate physical infrastructure. In both MLTCs and AWTCs,
UDISHA package was implemented. As there was no reading and writing in the pre-
school component under ICDS, this motivated parents to admit children of 4 years either
to government or nearby private schools. There is a need to improve the buildings and
provide proper toilet facilities, clean drinking water and proper storage facilities. Proper
scales to measure SN, and standing scales to weigh pregnant women and adolescent girls
need to be supplied. Modernization of offices of ICDS at the taluk and district level
should be given utmost importance. The post of ACDPOs should be abolished; instead
CDPOs should be posted in every project with a maximum of 150 centres. The
Management Information System (MIS) should not be confined to stating the number of
PHCs, PHUs, SCs school enrolment, etc. It should, at any given point of time, be able to
provide information on the status of a number of facilities in terms of how it is supporting
the ICDS programme and its current status.
87
Lokshin et al (2005) presented an article on, ―Improving Child Nutrition? The Integrated
Child Development Services in India.‖ Levels of child malnutrition in India have fallen
only slowly during the 1990s, despite significant economic growth and considerable
expenditure on the Integrated Child Development Services (ICDS) programme, of which
the major component is supplementary feeding for malnourished children. To begin to
unravel this puzzle, this article assesses the programme‘s placement and its outcomes,
using NFHS data from 1992 and 1998. The authors find that programme placement is
clearly regressive across states. The states with the greatest need for the programme —
the poor Northern states which account for nearly half of India‘s population and which
suffer from high levels of child malnutrition — have the lowest programme coverage and
the lowest budgetary allocations from the central government. Programme placement
within states is more progressive: poorer and larger villages have a higher probability of
having an ICDS centre, as do those with other development programmes or community
associations. In terms of outcomes, the authors find little evidence of programme impact
on child nutrition status in villages with ICDS centres.
Mustaphi (2005) In West Bengal, almost every second child is underweight, and the
State‘s child malnutrition stands at 49%, above the country‘s average of 44%. 16.3%
children below the age of 3 years were classed as moderately to severely malnourished
(NFHS 2, 1998). More than 66% of the children aged 6-35 months, were anaemic
(2000). The system of data collection and compilation in Integrated Child Development
Services (ICDS) comprised filling out 300 data fields in 2 formats (5 copies at project/
block level). This data was collated for 12-14 AWCs by Supervisors, and submitted to be
forwarded routinely without being analyzed or used by functionaries at any level.
Inconsistencies in the data were not located, nor were data used for monitoring the
programme. This project aimed at streamlining and simplifying the process of data
collection by the Integrated Child Development Services (ICDS) functionaries and
making the formats user-friendly to enable field level analysis and utilization of the data
for monitoring and improving the nutrition levels of young children. The Surveillance
and Monitoring tools were – Mother and Child Protection Card; Community Growth
Chart; SMART Register; Cohort Register; Community Mapping Sheets; Whiz Map; and
88
Colour Coding (green: good; yellow: intermediate; red: poor ). Two steps made it easier
to develop m Pacro-micro linkages in nutrition surveillance and a focused intervention
programme. Firstly, streamlining of data made it easier for all the stakeholders at state,
district, block and project levels to identify geographical pockets of malnutrition.
Secondly, the use of colour coding for streamlining the ICDS Management Information
System (MIS) also improved visibility of malnutrition to a large extent. In West Bengal
in March 2003, barring 2 districts, all others had a weighing efficiency of less than 50%.
After the training intervention, in April 2005, 5 districts have achieved a weighing
efficiency of more than 70%, while the average has reached to over 60%. Purulia district
has 20 ICDS projects and 2,512 AWCs. In March 2003, 10 projects were below 50% in
weighing efficiency, but by April 2005 all projects had crossed 70% in weighing
efficiency. Moderate and severe malnutrition in children aged 0-3 years in West Bengal
was 20.41% in March 2003, which reduced to 18.09% by April 2005. Reduction of
moderate and severe malnutrition in 168 AWCs of Dakhin Dinajpur was from 25% to 5%
in two years. The following are some of the highlights of the impact of nutritional
surveillance. In Dakhin Dinajpur, a positive deviance district, there was extensive use of
resource map and community growth chart; mothers regularly contributed food for
Nutrition Counseling and Childcare Sessions (NCCS); there was preponderance of girl
children at the entry stage; ‗ripple effect‘ was observed resulting in improvement of
nutritional status of siblings; there was improvement in child care practices and
awareness, and steady improvement in nutritional status of children. To mothers/
caregivers the position of the child on the growth chart became an important concern.
Functionaries at the project and district levels were motivated when they were able to
relate to the data mapping and colour coding that was being used in spreadsheets and in
GIS maps.
Ray (2005) presented an article on Action for tackling malnutrition: growth monitoring
or surveillance? The author reported that Malnutrition is an important Public Health
problem globally as well as in India. Mortality is a multi-causal phenomenon in which
malnutrition is but one factor directly or indirectly contributing 55% mortality of children
under-five years of age. Authors observed higher prevalence of severe degree of
89
Malnutrition in the underserved section of population with specific reference to girl child,
under 3 years of age, where there were large number of children in the family, repeated
infections and Measles. Growth monitoring Services in the ICDS scheme meant only
weight recording and was not at all satisfactory. Even the majority of the Anganwadi
workers (AWW) stated that it meant monthly weight recording of children while only
few knew it is in addition plotting these on growth charts and advising mothers if growth
was not proper. Around 60% of caregivers did not know about growth monitoring. The
concept of growth monitoring should be changed to Growth surveillance to emphasize
more on the action components of it.
Prinja et al (2005) conducted a study on role of ICDS program in delivery of nutritional
services and functional integration between anganwadi and health worker in north India.
The objective of the study was to ascertain the nutritional status and dietary patterns of 1-
3 year old children in areas served by ICDS program and to assess the nature and extent
of functional integration between the ICDS and health sector. A Community based cross
sectional study was done from June 2005 to November 2005 in 60 anganwadi centres
within 30 ―functional‖ sub centres from 5 community development blocks in district
Rohtak selected by stratified random sampling. A total of 408 children between 1-3 years
age, mothers of 408 children and 60 anganwadi workers were selected from these
anganwadis for the study. All children were weighed to assess the nutritional status using
IAP classification of weight for age. Mothers of all children were interviewed to assess
dietary patterns and nutritional education imparted by anganwadi workers. 60 anganwadi
workers were interviewed to assess the functional integration with Multipurpose health
worker [MPHW(F)].The study revealed that 199 (48.7%) children were underweight and
19.8% children had dietary calories intake more than 80% of RDA. Advice regarding
breast feeding and complementary feeding was given by anganwadi workers to 179
(43.8%) women only. Involvement of mothers in growth monitoring is very low. The
program is well integrated in functioning with the health sector. The study concluded that
the problem of under-nutrition continues to persist with low involvement of mother. The
program needs to be further revamped with a holistic approach towards child
development and making the mother responsible for the health of the child.
90
Centre for North East Studies and Policy Research, Guwahati (2006). The Centre for
North East Studies and Policy Research (CNESPR) conducted a study to assess the
functioning of ICDS in the AWs of Assam and Meghalaya. In Assam, Kamrup, Dhubri
and Dibrugarh, and in Meghalaya, East Khasi Hills and West Garo Hills were selected. In
Kamrup, about 35 (87.5%) centres out of 40 had 70-89 beneficiaries. On an average
every centre had a total of 25.60 children in the age group of 0-3 years, and every centre
provided services to nearly 6.33 pregnant mothers and 6.41 lactating mothers. The
average number of live births was 6.10 per centre per year. Only 22.5% centres recorded
the total deaths. On an average 1.22 deaths occurred per year. Out of the total 40 centres,
34 centres accounting for 85% provided immunization to the beneficiaries and 6 of the
centres did not keep records of immunization. Only 31 centres provided PHC services to
the beneficiaries, but 9 centres did not provide immunization services, and did not keep
any record. On an average the centres provided immunization services to nearly 13.23
people, indicating a very low performance of the PHCs. In Dibrugarh, nearly 68% of the
centres provided services to 5-9 pregnant mothers and 8 lactating mothers. Around 66%
centres did not keep any record of the nutritional status of children. The average numbers
of live births of children in all 40 centres were 7.36 and nearly 1.10 deaths took place
yearly. In Dhubri district, on an average every centre had 97.16 beneficiaries and 42.63
children in the age group of 0-3 years. Only 37 centres maintained records and every
centre had 5 pregnant and 5 lactating mothers. Only Dhubri district provided services to
adolescent girls, and no other district had any AG beneficiaries which took advantage of
the AWC. Most of the centres (82.5%) had 5 AG, whereas 15% of them did not maintain
any records. On an average, the centres had 4.91 AGs as beneficiaries. The average
enrollment of children per centre was 40.26. 65% of the male children and 52.5% of the
female children were among the 20-24 enrolled children. On an average there were 6.4
live births in every centre per year. Most centres had not recorded live births (62.5%).
2.5% of the centres had recorded more than 10 live births. Every centre had 1.33 deaths.
85% of the centres had not recorded any death. In East Khasi Hills every centre had
nearly 96 beneficiaries. Every centre provided services to nearly 8.06 pregnant women
and 7 lactating mothers. The average enrollment per centre was 34.63 children. In 14
91
centres majority of the children had normal nutritional status i.e. 35% of the children had
average diet. On an average every centre had 9.94 live births yearly. In West Garo Hills,
7 centres catered to the needs of nearly 60-69 child beneficiaries. Every centre averaged
85.13 beneficiaries. 53% of the total centres provided services to 5-9 pregnant women
and 8 lactating mothers. 41.10 children were enrolled per centre. In 35% of the centres
children had average growth (52.18). The number of children who had normal growth
was between 50-59. In 15 centres the growth of children was below normal, whereas the
children of 11 centres had better nutritional status. Most of the centres did not maintain
proper records of the nutritional status of children. The average number of live births was
10.31 annually. Only 27 centres maintained death records, while 13 centres did not
maintained them. The number of deaths per year was 2.07. AWCs provided
immunization services to nearly 28.77 beneficiaries. Only 32 centres provided
immunization services through PHCs, but 8 of the centres did not keep the record or they
did not provide immunization services. In all districts, 5% centres did not keep any record
of the services related to pregnant and lactating mothers. Either they did not provide any
services or they were not aware of this service. More than 85% women in rural areas and
98% in remote areas gave birth at home. Only about 42% women in Meghalaya and 58%
in Assam had access to safe delivery facilities. Most of the centres in West Garo Hills
and East Khasi Hills were in interior villages and were inaccessible. There were no
transport facilities. There were many complaints against the RTE packets as these were
half opened and damaged. In several villages, pregnant women also refused
immunization. Many parents did not allow their children to be weighed because of
superstition. Community must be made aware of the benefits provided by AWCs.
Services of ICDS should be available for every child under 6 years, not only for those
from BPL families. Take-home rations (THR) for children should be provided on a
regular basis. There is urgent need to revamp the training capsule and improve
supervision and monitoring arrangements.
Dash et al (2006) conducted a study in Orissa to evaluate the ICDS programme. A total
of 250 villages/ AWCs were covered. 12,621 children under 3 years, 12,468 children 3-6
years, 2221 pregnant women, 2686 lactating mothers and 13908 AGs comprised the
92
sample. It was found that supplementary feeding was usually given for 25 days in a
month and was considered adequate by over 96% of the mothers of beneficiary children.
92% mothers mentioned that the quality of food was good. 60% mothers of non-
beneficiary children considered supplementary feeding to be useful for the better health
and nutritional status of children. Over 92% of the beneficiary children received 3 doses
of immunization against DPT/ Polio. The immunization coverage for measles was 96%,
and over 96% of them had received BCG immunization. Around 26.32% children of 9-12
months had received complete immunization. Almost 9 out of 10 mothers of beneficiary
children mentioned that their children had been administered Vitamin A supplement
against 77% of non-beneficiary children. 80% mothers mentioned that AWWs were
capable of treating minor diseases. Nearly 73% mothers of beneficiary children had
received treatment/ health services from AWWs. Nearly 60% mothers of non-beneficiary
children mentioned that they had been visited at home by the AWW within 1-3 months.
Over 99% mothers of beneficiary children aged 3-6 years mentioned that they were
sending their children for Preschool education (PSE). Among pre-school children, the
proportion of female children (53%) was more than that of the males (47%). It was found
that 8 out of every 10 lactating mothers mentioned that they did not receive any IFA
tablets from the AWCs. 93% of the pregnant women mentioned that they had received at
least 1 antenatal checkup, but only 22% of the pregnant women received 3 health
checkups. Around 76% of the pregnant women mentioned that they received
supplementary food. The Take Home Ration (THR) was usually shared with other
members of the family (49%) and children (29%). About 90% pregnant women received
IFA tablets supplied mostly by AWWs (75%), followed by ANMs (14%). It was found
that home (58%) was the common place of delivery, followed by hospital (39%), and
family members (21%). Traditional Birth Attendants (22%) and ANMs (7%) had been
the birth attendants at home. 57% of the women faced obstetric complications during
delivery and they were referred to First Referral Unit (FRUs) such as PHC (34%),
District Hospital (30%) and Sub-Centre (7%). 99% of the AGs mentioned that vocational
training was hardly addressed by AWWs. 88% of them said there was no Balika Mandal
in their village. About 70% AGs were familiar with the symptoms of anaemia. About
60% of the children were found to be malnourished, 40% children had mild, 18%
93
moderate and 0.6% had severe malnutrition. Female children (64%) were more
malnourished than male children (54%). The nutritional status of beneficiary children
was better than that of non-beneficiary children. 59% of the beneficiary children were
malnourished compared to 69.9% of the non-beneficiary children. 92% AWWs could
take the weight of children correctly and 90% were capable of maintaining growth charts.
96% AWWs provided HNE to target groups. They faced problems of irregular supply of
food (12%), irregular supply of drugs (12%), and extraneous work assignments such as
formation and grading of SHGs, survey works, preparation and distribution of emergency
feeding, etc. Referral units were found to be suffering due to non availability of funds.
The amount earmarked for the purpose, Rs. 10,000 per annum, was considered too small
an amount and was found largely unspent. The medicine kit was hardly replenished on a
regular basis. The lady village level workers, particularly in Balasore district, were
deputed to the post of sector Supervisors, and they were neither conversant with the
programme nor motivated. Maintenance of Records and Registers, updating and
compiling them for monitoring progress was an uphill task for low educated AWWs,
mostly in tribal areas. Health workers were not properly oriented to the concepts of ICDS
scheme. Joint orientation of Health and ICDS workers would ensure mutual reciprocity
and accountability. The funds earmarked should be enhanced. The medicine kits provided
to AWWs need to be regularly replenished. A special campaign to enroll children with
disability for PSE should be launched. The convergence for antenatal and post-natal care
and referral should be strengthened.
Devi and Padmavati (2006) The aim of this study was to investigate the effects of the
nutrition and health education programme of the Integrated Child Development Services
on the nutrition/health knowledge levels and hygienic practices of women, and on the
nutritional status of their children. Anganwadi workers carried out the education
programme, which consisted of 12 sessions (one per month). A total of 300 children and
their mothers were included in the intervention group, while another 100 children and
their mothers served as the control group. All participants were recruited from rural
communities in the Mahaboobnagar District of Andhra Pradesh, India. Mothers in the
intervention group had significantly higher scores on nutrition and health knowledge, and
94
hygienic practices than the control mothers. The education intervention did not have
significant impact on the nutritional status of children. This study confirms the value of
an education programme in improving the nutrition and health knowledge of rural
mothers
Loyola College of Social Sciences, Thiruvananthapuram (2006) Supplementary
nutrition is a high cost input of the ICDS programme. This study was conducted in
Kerala, and a sample of 593 persons was taken for the study, comprising 5 CDPOs, 38
Supervisors, 200 AWWs, 200 beneficiaries and 150 elected representatives. About 92%
of the beneficiary respondents visited the anganwadi centres (AWC) on all days, either to
receive food or to take the preschool children, or for feeding their children in the 0-3
years age group. 95% beneficiaries of Thiruvananthapuram urban and 75% of
Kashakuttom were happy with the menu. All beneficiaries were punctual in attending the
feeding programme, and they mentioned that there was no wastage of cooked food. 15%
respondents preferred raw food, which they could cook according to their taste.
Respondents said that there were inadequate containers and this problem was felt more in
AWCs functioning in rented buildings. In Thiruvananthapuram urban I, Kazhakuttom,
and rural areas of Medumangad and Parassala projects, children did not have enough
space for play, and beneficiaries had no facilities to sit and take food. 84.2% CDPOs
mentioned that through the feeding programme nutritious food was supplied to the most
deserving beneficiaries in quite a regular manner. Majority of supervisors of
Medumangad said that beneficiaries were not satisfied with the variety in the menu. 62%
respondents felt that only deserving people were selected as beneficiaries, but members
of local self-government institutions (LSGI) were not confident of this opinion, they
expressed the need for more strict procedures for the selection of beneficiaries. 92.1%
Supervisors said that members of LSGIs were very co-operative in implementing the
feeding programme. 55.3% Supervisors mentioned that there was good co-ordination
between gram panchayats (village councils) and block panchayats in the allocation of
funds, but 31.6% said there was no such co-ordination. 75.5% respondents said that there
was no interruption in feeding in their AWCs. 51.7% respondents were not making any
ad hoc arrangements to overcome interruption as the problem was not so severe. AWWs
95
were not interested in approaching local people for getting assistance to handle any crisis.
Shopkeepers refuse to supply food materials to AWCs due to delay in payment. 97.7%
AWWs mentioned that the beneficiaries showed willingness to understand the situation
when there was interruption in feeding. 76.5% AWWs said that beneficiaries had no
complaints regarding accessibility to AWCs, and there was no demand for establishing
new AWCs in their locality. 44% of the respondents accepted that the present feeding
programme was effective. There is need to construct their own building for each AWC.
AWW should be aware of the quantity of food required for her AWC. There is need to
increase the storage facilities for food materials in AWCs, and the same food items
should be supplied in all AWCs. Funds of LSGIs must be made available to Supervisors
without delay, and ICDS officials must take strong corrective action about complaints
against anganwadi workers or helpers. There is need to increase awareness about the
feeding programme among those people who could be beneficiaries of the service.
Forum for organized resource conservation and enhancement (FORCES), New
Delhi (2007) This study was conducted to evaluate the status of the performance of ICDS
services in the city of Delhi. Out of a total of 28 projects, 27 were covered, including 242
AWCs and 2970 beneficiaries and functionaries. It was found that 96% anganwadi
centres (AWCs) were on rent, 57% centres had toilets and 58% centres had clean
drinking water. 82.23% AWWs mentioned that there was scarcity of equipment like
weighing machines, education kits, etc. In 39% centres there were complaints of poor
quality of food. In Najafgarh area there were specific complaints of insects and dirt
found in the food material supplied. Children over six months had been receiving food
from the AWC regularly. Some beneficiaries mentioned that the quantity of food given
was one katori (bowl). So the number of beneficiaries was more, but less quantity of
food was distributed. In 26% centres AWWs complained about irregular food supply.
Polio vaccination was irregular, and a major problem was that there was no fixed food
supply. Only 82 out of 2861 (2.87%) beneficiaries were taking food in the centre. 76%
beneficiaries shared supplementary nutrition (SN) with their family members and rest of
them (21%) took SN to their home and consumed it themselves. Only 4 centres had data
on Grade I and 17% centres on Grade II malnutrition. Only one centre offered medical
96
intervention, and around 9% centres offered double ration. 85% children were
immunized by the ANMs in PHCs and dispensaries in Delhi. 87% AWCs had data on
immunization for children below 3 years and only 67% for children aged 3-6 years. Many
AWC records were not updated. Data on Vitamin A distribution was available in 9% of
the centres but the survey on beneficiaries revealed that 25% children below 6 years had
received Vitamin A. 84% AWWs mentioned that the Medical Officer (MO) had not
visited the centres for more than six months. ANMs were more regular visitors, and 51%
of them visited AWCs once a month. But as per the AWWs‘ experience only 28.5%
ANMs had been supportive. 93% AWWs had received job training and 82% had
attended the week long refresher course. Apart from that 10% AWWs were trained on
RCH (Reproductive Child Health), 27% on AIDS and 18% on nutrition. Only 2.89%
AWWs had special training on disability. It showed that enough attention was not given
to disability in this scheme, and this should be specified in the guidelines of the scheme.
Awareness, sensitization and community participation needs to be addressed.
Jain et al (2007) This study was conducted to assess the impact of nutrition in terms of
nutritional grading and nutritional deficiency diseases among children in the age group 0-
6 years in rural Gird block, Gwalior. Out of 85 AWCs in rural ICDS Gird block only 10
AWCs were covered. 813 children from ICDS group (429 boys and 384 girls) from Gird
and 500 children (258 boys and 242 girls) from non-ICDS group were selected from
Hastinapur. These children were assessed using dietary recall method, anthropometric
measurement and clinical survey by making anganwadi and domiciliary visits. In both
the groups most of the children belonged to low socio-economic class. Daily intake of
nutrients was deficient in both the groups when compared with ICMR values of RDA. In
ICDS group 35.92% children were in normal nutritional grade. The prevalence of Grade
I, II, III and IV malnutrition in ICDS group was found to be 42.19%, 17.35%, 4.55% and
0% respectively. In non-ICDS group 26.40% children were normal, 41.20% children
were in Grade I malnutrition. 26.20% were in Grade II, 5.40% were in Grade III, and
0.80% was in Grade IV malnutrition. Mid upper arm circumference in the lowest age
group 0-1 years in both sexes showed no significant difference in nutritional status of
ICDS and non-ICDS children. Grown up boys and girls aged 3-6 years from ICDS block
97
had better nutritional status than those from non-ICDS block. There was hardly any
difference in the nutritional status of ICDS and non-ICDS groups. The ICDS scheme may
be very attractive but beneficiaries do not realize its importance. Proper and sufficient
nutritional supplementation provided to beneficiaries may help children towards leading a
nutritionally sound and healthy life and combat malnutrition.
Tandon and Kapil (2008) conducted a study on Integrated child development services
scheme: need for reappraisal. The distribution of supplementary nutrition (SN) to
beneficiaries is an issue of debate in the Integrated Child Development Services (ICDS)
program, discussed in almost all fora in which the scheme is on the agenda. ICDS
program managers rightly decided in 1975 to make SN a program component, and it
should remain so. However, in areas which are relatively better off, where program
beneficiaries do not require SN, the discontinuation of SN can be considered. More than
3 lakh Anganwadi Centers (AWCs) are operating in India. No solid data are available on
how many AWCs are closed when SN is not available. Many Anganwadi workers are
taking innovative approaches for the holistic development of children even without SN.
Although the process of growth monitoring (GM) is not being conducted as it was
conceptualized, experience is being gained in the field. Based upon feedback received
from independent evaluating agencies, mid-course changes have been made to the ICDS.
For example, training activities have been made more realistic.
2.4 NUTRITIONAL STATUS OF ICDS CHILDREN
Pratinidhi et al (1998) conducted a study to know the calorie intake of children who
were beneficiaries of supplementary nutrition of ICDS in project area of Pune city. From
11 anganwadis, 165 children were taken, using cluster sampling method. Mothers of
these children were interviewed to know their knowledge and perceptions regarding
ICDS as well as the dietary intake of child in the previous 24 hours were also taken.
Results revealed that immunization (93.9%) and nutrition (75.8%) was recognized by
mothers as the main activity in the anganwadi. Preschool education and health check-ups
(29.7%) were relatively found to be less known to be unknown. It was found that
98
majority of the children (71.4%) used to take supplementary nutrition to their homes and
in these, 74% of the children shared it with other family members. The response of the
children to supplementary feeding was found to be excellent. It was found that 92% of
the children attended anganwadi for more than 20 days in a month. 7.1% attended the
anganwadi for less than 15 days a month. From the diet survey carried out by 24 hours
recall, it was found, calorie intake was more than 90% of the RDA for only12.7% of
children, whereas, 2.4% of children were found of consuming grossly deficient diet. The
supplementary being provided at anganwadi was having average nutritive values of 213
calories and 5.1gm protein as compared to the recommended values of 300 calories and
10 gm protein.
Jindal (1999) conducted a study to investigate the incidence of malnutrition among pre-
school children in ICDS and to evaluate its effect on developmental status of children.
240 subjects (120 each from ICDS and non-ICDS group) from Gadarpur block of Tarai
region of Udham Singh Nagar, Uttar Pradesh were selected using stratified random
sampling technique. Interviews with parents and anthropometric measurements of
children were used to evaluate socio-economic status of parents and nutritional status of
children respectively. Analysis of data revealed that all subjects belonged to lower socio-
economic class, and the status of on-going nutrition intervention services was not
satisfactory. The mean values for body weight, height and circumference of head and
chest were higher at all ages in the ICDS group as compared to those of non-ICDS group.
Based on Gomez classification, the percentage of children falling under normal and mild
category of malnutrition were more in the ICDS group (31.67% and 40% respectively) as
compared to 25% and 35.83% in the non ICDS group. The percentage of children having
clinical signs of nutrient deficiencies was higher among non-ICDS group as compared to
ICDS group. Children suffered most often from diarrhoea and the percentage was higher
among non-ICDS group. The average developmental scores percentage of preschool
children were higher at all ages in ICDS group as compared to those of non-ICDS group.
Although the on-going nutrition intervention service of ICDS scheme was not achieving
its full in terms of objectives set, but children in the ICDS group had lesser incidence of
malnutrition, and their developmental status was better than that of the non-ICDS group.
99
The study recommends that awareness must be created in the community to utilize ICDS
services. Physical infrastructure facilities of the anganwadi complex need to be upgraded
and regular supply of supplementary nutrition and vitamin `A' and iron tablets should be
ensured. Frequent medical check-ups and immunization programmes should be launched
in villages. Regular sessions of nutrition and health education to women need to be
organized.
Kapil et al (1999) evaluated the nutrient intake and consumption pattern of
supplementary nutrition by severely malnourished children in two ICDS projects of the
Rajasthan. 25 anganwadi were selected for detailed study. The nutritional status of
children in 6 months to 6 years age group in all these centers was assessed by weight for
age criteria as per the Indian Academy of Pediatrics Classification. Home visits were also
made and mothers were specifically asked about the actual receipt and consumption of
supplementary nutrition by their child. Results of the study revealed that mean calorie
intake in 6-11 month age group was 626 kcal, which was 26% less than recommended
dietary allowance for this age group. In 23-35 months age group children, the mean
calorie and protein intake was 717 kcal and 22 gm respectively. The calorie deficit for
this age group was 42.2%. Supplementary nutrition by 84.6 % severely malnourished
children, of those receiving supplementary nutrition, 45.4% received single and 39.2%
received double ration of supplementary nutrition. Almost 46% severely malnourished
children who should have received double supplementary nutrition were still provided the
single ration of supplementary nutrition.
George et al (2000) The study was conducted among 3633 pre-school children of 108
anganwadi centres (AWCs) in rural Kerala to find out the haemoglobin level, weight for
age status and dietary habits of preschool children. Information regarding their age, sex,
clinical condition and dietary habits was collected on a proforma through interviews.
Most of the children belonged to low income nonvegetarian group (74.5%). The
prevalence of anaemia was 11.4%, and female children were more susceptible to
anaemia. Normal nutritional status was seen among 46.7% of the children, and while
11.78% of the mildly undernourished children were anaemic, the percentage of anaemia
100
among moderate undernourished children was 16.37%. Among vegetarians 9.27%
children were anaemic, and among non-vegetarians 12.1% were anaemic. Dietary survey
revealed that consumption of iron from natural sources was below the recommended
dietary level. Changes in eating behaviour have the potential to affect the bio-availability
of iron.
Mahapatra et al (2000) conducted study in the Kalahandi district of Orrisa. A total of
751 ICDS children aged 4-5 yrs were studied for anthropometry and clinical signs of
nutritional deficiencies .15 gram panchayats were selected using probability
proportionate to size sampling. There was no significant difference between boys and
girls for nutritional status. According to weight for age, 57.1%of the children were under
weight.
Saiyed and Seshadri (2000) investigated the impact of an integrated package of nutrition
and health services on the nutritional status and morbidity profile of preschool children in
Baroda.610 preschool children, under an urban ICDS block were placed in 3 categories
of service utilization, viz. full, partial and none. Data on socio – economic characteristics
of the children included family size and type, religion, education, occupation, per capita
income, house type, toilet facilities and home sanitation. The findings showed that
complete utilization of all services resulted in significant improvement in nutritional
status as assessed through anthropometric indices viz. height/ age, weight/age and
weight/ height. Data on morbidity among children showed that the frequency and
duration of illness were significantly lower when the services were utilized fully, than
when utilized partially or not utilized at all. Thus major efforts should go into the
convergence of services and their full utilization by the community.
Bhalani and kotecha (2002) undertook a study to measure the prevalence of
malnutrition with gender difference and age trend in 30 anganwadi of urban slums.
Weight and sex records of children less than five years of age were taken from records
maintained in anganwadi. Using Indian Academy of Pediatrics, it was found that 22.4%
children were in the zone of moderate to severe malnourishment (in grade II and grade
101
III), 40.5% were in mild malnourishment zone (grade I) and 37.1% were not found to be
malnourished at all . No child was found to be in grade IV of malnourishment.
Statistically significant difference was found among malnourishment between boys
(58%) and girls (68.2%). The level of moderate to severe malnutrition in the elder
children was found to be higher than that in the younger children.
Organization for Applied Socio Economic Systems (OASES), New Delhi (2002)
Malnutrition is a social problem of staggering dimension in South Asia .The present
study was an attempt to evaluate malnutrition among ICDS children upto 6 years of age.
The project aimed to study the level of nutritional status and health care of children in
terms of physical growth i.e. by age, weight and height and its effectiveness. The study
was conducted in 3 districts each from Uttar Pradesh ( Rampur, Ambedkar Nagar and
Badauni), Rajasthan ( Dungarpur, Banswara and Jhalawara) and Orissa( Sundargarh,
Gajapati and Rayagada).From each district ,two blocks were selected and a total of 80
respondents were selected from ICDS centres in 18 blocls, making a total of 1440
respondents for the entire study. The study revealed that among the three states,
maximum percentage of children (26.1%) in grades III and IV malnutrition were from
Uttar Pradesh. The study revealed that overall about 36.8 % of the children whose height
measurements could be taken was short for their age or stunted. In Rajasthan, 19 % of the
respondents affirmed the poor health status of their child. Around 90% respondents from
Orissa affirmed the good health status of their child, and 10.6 % mothers from Uttar
Pradesh were certain of the poor health status of the child. The study recommended to
improve nutrition and health status, strategies to impart comprehensive awareness on
malnutrition should be given prime importance. The study further suggested that it is
most important that the issue of malnutrition should be moved from the‘ Agenda of
welfare‘ to the‘ Agenda of Rights‘. It is the right of child to have adequate care, and to
grow the maximum mental and physical potential.
Vaid and vaid (2006) conducted study on nutritional status of ICDS and non ICDS
children and results revealed that all the anganwadi workers were assessing the
nutritional status of children by taking anthropometric measurements of the children i.e.
102
height and weight in anganwadi. Majority of the respondents were not aware regarding
the maintenance of records in the anganwadis centers but they had very positive attitude
towards ICDS centers and all the mothers observed some changes in the children after
being enrolled in the ICDS centers. It was also revealed that children who attended
anganwadis centers had good health or appearance compared to their counterparts.
Anitha and Begum (2008) This study was conducted in Mysore district of Karnataka to
assess the nutritional status of child beneficiaries. Ten per cent (281) of all the
functioning AWCs from 12 taluks were selected, and 3425 child beneficiaries from 281
AWC were assessed for nutritional status. It was found that the children were
considerably shorter and lighter than their American counterparts (50th
centile of NCHS
data), and were nearer to 3rd
centile of NCHS standard. The percentages of normal grade
children were 6.4% to 31.4% among males and 14.0% to 36.0% among females
according to Gomez classification. Percentage of children in Grade III (severe
malnutrition) ranged from 0.7% to 6.5% in both males and females. Comparison of the
observed and recorded data (by AWW) for classification into grades of malnutrition
found an exaggeration in the number of normal and Grade I children according to AWW.
Hence it raises doubts regarding the competence of the AWW in performing
nutrition surveillance. Further, use of Indian Association of Pediatrics (IAP) classification
was found to carry an in-built lacuna for exhibiting normal and Grade I at an exaggerated
rate, and a concomitant decrease in Grade II and Grade III states of malnutrition. Use of
80% as the cut off level for classification of normal nutritional status according to IAP is
not feasible, as it gives way to poor functional development in children. Hence it fails to
project the actual state of nutrition. Deficiency symptoms of nutrition observed were flat
nails (0.8-15%), night blindness (1.4-4.4%) and conjunctival xerosis (1.5-6.7%).
Prevalence of anaemia in mild, moderate and severe conditions was 21%, 37% and 23%
respectively, while 17.5% had normal haemoglobin level. It can be mentioned that the
nutritional status of child beneficiaries has not improved to an appreciable level since the
per cent of children in mild and moderate under nutrition is still high. Competence of
AWWs for nutritional surveillance is doubtful, indicating the need for an intensive
training programme to improve their performance.
103
Kumar (2009) conducted a study on nutritional status assessment of under-five
beneficiaries of Integrated Child Development Services program in rural Karnataka. The
objective of this study was to determine the nutritional status of children aged between 3-
6 years registered in government sponsored maternal and child care Anganwadi centres in
India. A cross-sectional study was conducted in 35 centres in 11 villages situated in the
field practice area of Community Medicine Department of a Medical College situated in
Southern India. Out of the 585 children in the study, 46.5% of the children were aged
between 36 to 48 months. Assessment of nutritional status using the ICDS growth chart
revealed malnourishment to be present among 189 (32.3%) children, of whom 166
children were grade I malnourished and 23 children were grade II malnourished.
Proportionally girls (46.2%) were more malnourished than boys (33.6%). No significant
association was found between the nutritional status of children and their duration of stay
in an Anganwadi centre (p-value=0.56). The findings of this study indicate that
malnutrition is still an important problem even among children attending anganwadis.
Further improvements in functioning of Integrated Child Development Services need to
be made in order to address the problem of malnutrition.
2.5 STUDIES ON ANGANWADI TRAINING INSTITUTES
REGARDING TRAINING PROVIDED TO ANGANWADI
WORKER.
NIPCCD, Regional Centre Lucknow, Lucknow (2004) NIPCCD, Lucknow conducted
an intensive overall assessment of Anganwadi Workers Training Centres (AWTCs) in
Bihar. All AWTCs had hostel facilities, though the rooms were too small to accomodate
the trainees, even on the floor. At Patna, the Centre had 5 bathrooms and 5 toilets but
they were not in use due to lack of adequate water supply in them. Participants took bath
at open wells very early in the morning. All centres had safe drinking water. Other
facilities like kitchen were there in 3 centres; ventilation and lighting were appropriate in
7 out of 8 centres; teaching aids were there in all the 8 centres; 6 classrooms had durries
(mats), and 2 had tables and benches. Books were there in all centres but the least were in
Hajipur centre; newspapers were received in 4 centres, and medicine kit was not available
104
even in one centre. Except one centre at Kadamkuan, all AWTCs followed the newly
developed Induction Training Syllabus. Only one centre at Madhubani took the
evaluation of performance of trainees in writing, while the rest took it verbally. To
improve the quality of training, following organizations contributed to AWTCs like
Parent Organisation of AWTC, NIPCCD, State Government, UNICEF and others. There
were certain problems faced by AWTCs such as non-release of funds in time, inadequate
training material, etc. The heads of organizations suggested that co-ordination with the
State Government, timely release of funds and provision of electricity should be
enhanced. In training sessions, lecture was the main method used for instruction. All
AWTCs were located in good places with proper transportation and market facilities.
BCCW was getting some funds from the ICDS Directorate for administrative
expenditure. All AWWs were residing in the AWC villages, and the distance between
AWC and their homes was around 5 metres to 500 metres. AWTCs should have adequate
physical infrastructure like hostel, kitchen, toilets, bathrooms, library, classrooms, office,
etc. Every AWTC should rearrange training/communication materials available with
them and keep them in a specified place with some space so that these are used by
trainees and trainers. Skill training programs for Instructors of AWTCs on training
methods, organization of preschool education activities, growth monitoring and
mobilization of the community need to be organized.
NIPCCD, Regional Centre Lucknow, Lucknow (2005) A qualitative study of
Anganwadi Workers Training Centres (AWTCs) in Uttar Pradesh was conducted under
Project UDISHA by National Institute of Public Cooperation and Child Development,
Regional Centre, Lucknow. A total of six AWTCs comprised the sample of the study.
The respondents included Head of the Organisations, Principals of AWTCs, Instructors
and trainees. Data was collected through interview schedules and an observation
checklist. There was wide variation in the training centres regarding infrastructure and
experience of staff, their orientation to early childhood care and development, teaching
methodologies, etc. Findings indicated that only two centres could provide adequate
number of chairs and tables to trainees in the classrooms, and the rest had to sit on the
floor on mats (durries). At the AWTC, Allahabad, the trainees were paid daily allowance
105
in cash for meals, and this practice should be checked. Classrooms should be well
ventilated and spacious enough to accommodate 35 trainees. A.V. aids and training
equipment were also missing in these centres. In a majority of the centres, the educational
qualifications of the instructors did not match with the subject they taught. Quality of
training also suffered due to lack of specialist speakers. Findings indicated that very little
material or no material was given to the trainees. Experiential learning, which is an
important aspect of training provided through field visits and supervised practice, had
been neglected due to lack of knowledge about this, in almost all centers. The root cause
of these was late release of grants and the unrealistic budgetary provisions. There is a
need to provide funds for a library in the budget. There is also need to develop a training
module for the job training of AWWs in order send a uniform message to all the AWWs.
Skill building training for Instructors of AWTCs may also be organized from time to
time. Facilities like blackboard, projection of films, display of programme schedule,
growth charts, posters, demonstration room, etc. should be available. Hostels should be
located within the premises of the training centres. The trainees should share the same
food, have food in a common place, and it may be prepared in a common kitchen with the
cooperation and help of trainees. International agencies should put AWTCs on their
mailing list so that whatever material is developed by these organizations could go
directly to these training institutions
Gadkar et al (2006) This study was undertaken to assess the existing infrastructure and
training facilities available in the AWTCs; to identify the gaps in training; to assess the
knowledge, understanding and skills of trained AWWs in work situations; to find out the
problems faced by AWTCs in the organization of training; to suggest measures to
strengthen the overall functioning of AWTCs; and to suggest common minimum
standards for AWTCs. At the time of data collection, there were 5 AWTCs functioning
since many years in Jharkhand, and 23 more AWTCs were being set up to clear the
backlog of training of ICDS functionaries. The Government of Jharkhand had started 7
additional AWTCs recently to clear the backlog. Of the five old AWTCs, four had been
selected randomly for assessment. Head of the organizations, principals of AWTCs,
instructors, trainee anganwadi workers and trained AWWs with 1-3 years of work
106
experience at AWCs were selected for collecting detailed information. Findings revealed
that the job training course (JTC) was of 30 days duration with 26 working days. Of
these, three days were allocated to field visits and four days for supervised practice at the
AWC and in the community. Refresher courses of 6 days duration were also organized
for AWWs, who had worked for at least 21 months in ICDS projects. The syllabus of the
JTC and refresher course for AWWs and helpers was revised by NIPCCD, keeping in
view the job functions, qualifications and the skills required by AWWs to run the
programme efficiently. All the AWTCs selected were run by voluntary organizations
with financial support from the Government of Jharkhand. Holy Cross, Ranchi was oldest
among them (1978). The survey covered rural, urban and tribal areas. It was found that
there was wide variation in infrastructure, experience of staff, teaching methodologies,
transaction of training and management of training centres, etc. among these locations.
AWTCs located in urban areas should provide either a desk or table for writing in
classrooms with durries. There is a need to organize training programmes for instructors
on all the new topics like Participatory Learning and Action (PLA), communication
counseling, Integrated Management of Childhood Illnesses (IMCI), training techniques
and guidance for organizations of observational visits and supervised practices in the
field. Thus, AWTCs should be provided with required component wise training material
for conducting training programmes. The performance of the visiting lecturers should be
reviewed at the conclusion of the course.
Indian Institute of Development Management, Bhopal (2008) Integrated Child
Development Services (ICDS) scheme was launched on 2nd
October 1975, in 33 blocks of
the country on experimental basis. It covers the entire nation and is recognized as one of
the most unique community based outreach programmes catering to health and nutrition
needs of children below 6 years of age, their mothers, adolescent girls, pregnant women,
nursing mothers and all women between 15 to 45 years.20% of the total number of
MLTCs (17), that could be accessed for data collection were selected for the study
randomly, and it was ensured that at least 1 MLTC from each state was covered. From
each state 20% of the AWTCs, were also selected randomly for the study. The evaluation
study was carried out in 125 AWTCs (out of 127 planned) in 30 states and Union

107
Territories. Most of these AWTCs were managed by Trusts/ NGOs/ Academic Institutes
and State Councils for Child Welfare. Public transport was found easily in 97 AWTCs
(77.6%), hostel facilities were available in 115 (92%) AWTCs. In 16 AWTCs (12.8%),
hostels had rooms (10-12 as per the norms), 5 bathrooms and toilets. In 122 AWTCs
(97.6%) electricity and drinking water facilities were available, 45% AWTCs had tables
in the hostels, and chairs were available in 86.4% AWTCs. in 10 (8.8%) AWTCs
blackboards were not available, white boards were available in only 80 (64%) AWTCs
and magnetic boards were available in only 8 (6.4%) AWTCs. OHPs were available in 76
(60.8%) AWTCs. Film projectors were available in 39 (31.2%) AWTCs and 98 (78.4%)
AWTCs were having VCRs, video cassettes and audio cassettes, TV sets were available
in 84.8% AWTCs and LCD was available in 25 AWTCs and LCD was available in 25
AWTCs (16%). 94.1% Lesson plans were finalized by 80.8% Instructors and the plan for
guest speakers by 63.1% Instructors/Principals. 8 MLTCs (46.1%) were housed in rented
buildings, 82% MLTCs were having black/white boards in the classrooms, 9 MLTCs
(52.9%) were in their own buildings, while the remaining 8 MLTCs (46.1%) were housed
in rented buildings. To improve the quality of training at AWTCs and MLTCs it was
recommended that training institutions that are not easily accessible should make
alternate arrangements of hiring a vehicle at the time of organizing the training
programme. Hostel facilities should be improved and required number of toilets,
bathrooms, furniture, kitchen facilities, etc. should be there in all training centres. All the
State Governments/ Union Territories should ensure timely release of grants to all
AWTCs and MLTCs to ensure smooth running of training programmes. There should be
a uniform recruitment procedure, and State Governments/ Union Territories should help
AWTCs and MLTCs in developing training and communication material/ aids. At time,
the ICDS functionaries deputed for training do not turn up, so State Governments should
take a serious view of this and see that this situation is avoided. But State Governments
should also give sufficient time to ICDS functionaries while deputing them for training so
that they can make suitable arrangements.
108
Chapter 3
Research Methodology
109
CHAPTER 3: RESEARCH METHODOLOGY
Contents:
3.1 Research Design
3.2 Sample Description
3.3 Sample Size
3.4 Sample Locale
3.4.1 Criteria for Sample Selection
3.5 Sample Technique
3.6 Tools for the Study
3.7 Intervention Programme
3.8 Data Analysis
3.9 Ethical Issues Concerned
110
RESEARCH METHODOLOGY
RESEARCH:
A WAY OF EXAMINING YOUR PRACTICE…
Community-level workers, such as Auxiliary Nurse Midwives (ANMs) and Anganwadi
Workers (AWWs), deliver most of the critical public health services for the poor in India.
Nutrition is the focal point of health and well-being and it is directly linked to human
resource development, productivity and ultimately to the national growth. As the
anganwadi worker is the key person in the ICDS programme, her education level and
knowledge of nutrition plays an important role related to her performance in the
anganwadi centre. It has also been reported that, in addition to education level, training of
anganwadi workers about growth monitoring plays a beneficial role in improving their
performance (Gopaldas et al., 1990). Based on review of available literature it was found
that since no such studies has been conducted so far regarding awareness among
anganwadi workers in state of Jammu and Kashmir, the present study was undertaken to
study nutritional awareness among anganwadi workers and their implementation to
nutritional services in rural and urban zone of Jammu district.
Research methodology is a way to systematically solve the research problem. It may be
understood as a science of studying how research is done scientifically. The procedure
followed in sampling, empirical measurement of variables, devices used for collection of
data and the statistical measures used for the analysis of data are described in this chapter
under the following sub heads:
1. Sampling procedure
2. Devices used for collection of data ,and
3. Statistical tools used for analysis of data

111
JAMMU DISTRICT
URBAN RURAL
ANGANDWADI NU = 50 ANGANDWADI Nr = 50
CENTRE CENTRE
ANGANWADI PRE-SCHOOL ANGANWADI PRE-SCHOOL
WORKER CHILDREN WORKER CHILDREN
(1) (3) (1) (3)
NU 1 = 1 X 50 NU2 = 3 x 50 Nr1 = 1 X 50 Nr2 = 3 x 50
= 50 = 150 = 50 = 150
TOTAL NO. OF ANGANWADI CENTRES = 50 + 50 + 100
TOTAL NO. OF ANGANWADI WORKERS = 50 + 50 + 100
TOTAL NO. OF PRE-SHOOL CHILDREN = 150 + 150 + 300
TOTAL NO. OF RESPONDENTS = 100 + 300 + 400
Figure 3.1 : DIAGRAMMATIC REPRESENTATION OF SAMPLE
112
3.1 SAMPLE DESCRIPTION: The sample for the study consisted of two
groups.
GROUP1: Anganwadi workers: : The Government of India in 1975 initiated the
Integrated Child Development Service (ICDS) scheme which operates at the state level to
address the health issues of small children, all over the country. It is one of the largest
child care programmes in the world aiming at child health, hunger, mal nutrition and its
related issues. Under the ICDS scheme, one trained person is allotted to a population of
1000, to bridge the gap between the person and organized healthcare, and to focus on the
health and educational needs of children aged 0-6 years. This person is the Anganwadi
worker. She is a health worker chosen from the community and given 4 months training
in health, nutrition and child-care. She is in charge of an Anganwadi centre. There are an
estimated 1.053 million anganwadi centers employing 1.8 million mostly-female workers
and helpers across the country (Wikipedia). They provide outreach services to poor
families in need of immunization, healthy food, clean water, clean toilets and a learning
environment for infants, toddlers and pre-schoolars. They also provide similar services
for expectant and nursing mothers. According to government figures, anganwadi reach
about 58.1 million children and 10.23 million pregnant or lactating women. The
Anganwadi worker and helper are the basic functionaries of the ICDS who run the
anganwadi centre and implement the ICDS scheme in coordination with the functionaries
of the health, education, rural development and other departments. Their services also
include the health and nutrition of pregnant women, nursing mothers, and adolescent
girls. Anganwadi workers are India‘s primary tool against the menace of child
malnourishment, infant mortality, and lack of child education, community health
problems and in curbing preventable diseases. They provide services to villagers, poor
families and sick people across the country helping them access healthcare services,
immunization, healthy food, hygiene, and provide healthy learning environment for
infants, toddlers and children.
113
GROUP 2: Pre-school children: Early childhood is a crucial developmental period
during which there is considerable scope to influence the growth of malnourished
children through growth-monitoring, which is supposed to be performed monthly, and
through encouraging sound child-care and feeding practices.
3.3 SAMPLE SIZE: The sample size for the study consisted of 400 respondents.
GROUP 1: 100 anganwadi workers were selected with in Jammu district through 100
anganwadi centers, out of which 50 were from rural areas and 50 were from urban areas.
GROUP 2: 300 pre- school children were selected with in Jammu district through the
calculation of 3 pre- school children per anganwadi centre, out of which, 150 pre-
scholars belonged to rural anganwadi and 150 pre- scholars were from urban areas.
3.4 SAMPLE LOCALE:
The area for study was selected from following blocks of Jammu district under urban and
rural zone. There are 2389 operational anganwadi centers in Jammu district in year
2011. Out of these, anganwadi centers from urban zone and rural zone were selected
further for study.
Urban zone: In urban zone of Jammu district, the sample was selected from Jammu block
which consisted of 245 operational anganwadi centers .out of these, 25 anganwadi centers
were randomly selected for the study.
Rural zone: In rural zone, the sample was selected combined from 25 AWC of Purmandal
block and Bishnah block. The total operational anganwadi centers in Bishnah block was
231 while Purmandal block had 69 operational anganwadi centers. Out of the total 25
AWC randomly selected under rural zone, 13 AWC were selected from Bishnah block
and 12 AWC from Purmandal block.

114
Figure 3.2 Sample description Of The Study
Figure: self devised
115
3.5 SAMPLE TECHNIQUE:
GROUP 1: ANGANWADI WORKERS Multi stage sampling technique was adopted
for sample selection of anganwadi workers. Out of various blocks with in Jammu
districts, 100 anganwadi centers were picked randomly from rural as well as urban areas
for 50 each. From these 100 anganwadi centers, 100 anganwadi workers, one from each,
was selected to assess the nutritional awareness and implementation of nutritional
services.
GROUP 2: PRE- SCHOOL CHILDREN: During the pre testing phase it was observed
that availability of 3-6 yrs children was more feasible than the availability of younger age
group. Thus the study aimed at the assessing the nutritional status of 3-6 years children
attending anganwadi centre. From each anganwadi centre out of total 100 centers, 3 pre-
scholars were selected randomly to assess the nutritional status, thus making the total
number of respondents up to 300.
3.6 TOOLS FOR THE STUDY:
In order to collect data, following tools were applied:
1. Observation: Those aspects which may have been reported through interview
yet whose presence had significant implication for the issues under study, were
included here. Observations were made on various aspects like physical
infrastructure of anganwadi centre and implementation of nutritional services at
anganwadi centre.
2. Interview Schedule: Keeping in mind the purpose of the study, interview
method was used for data collection. The interview method was adopted through
a schedule .On the basis of extensive review of available literature and personnel
experience, an interview schedule was prepared for collection of data which
consisted of close ended questions. . The schedule is divided into different
sections. Under each section, several relevant questions are raised to elicit all
possible information about each of the selected samples under study.
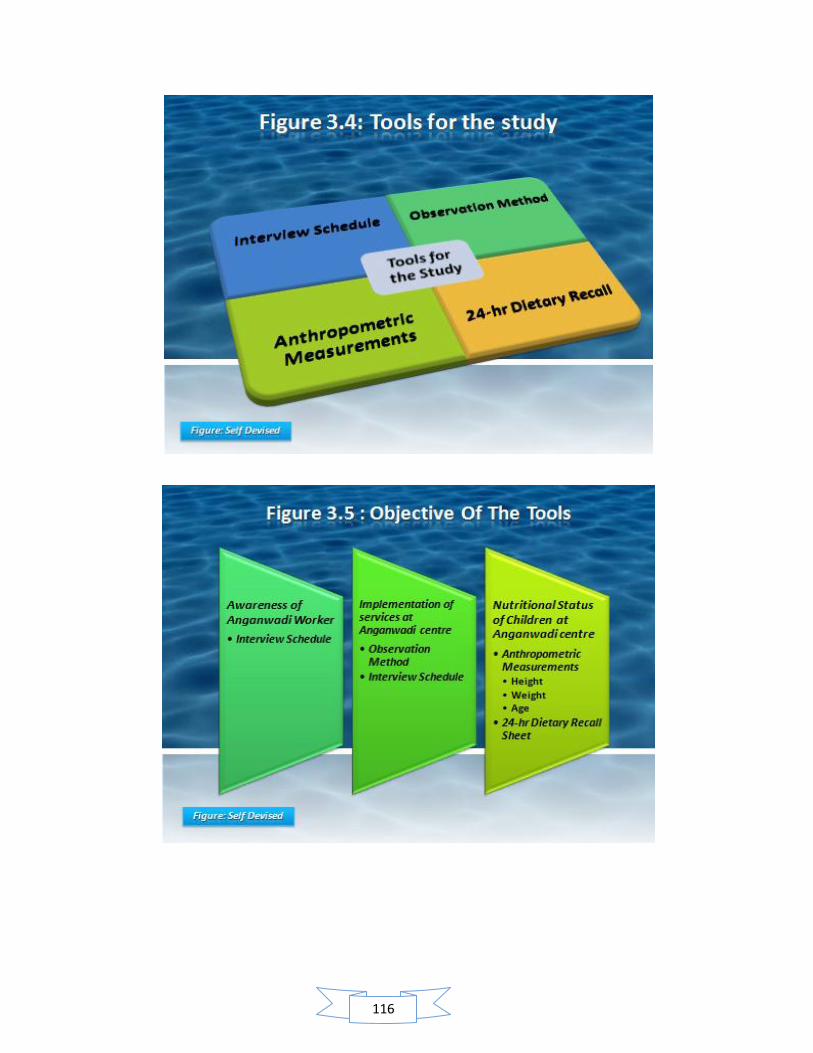
116
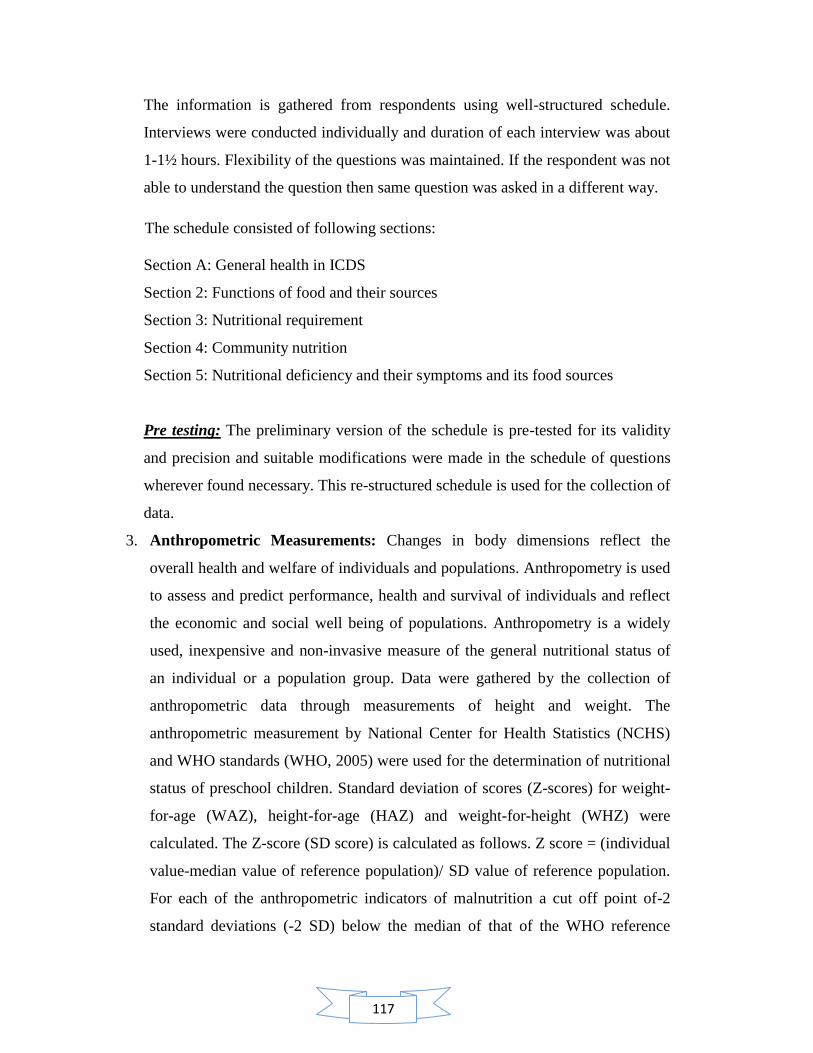
117
The information is gathered from respondents using well-structured schedule.
Interviews were conducted individually and duration of each interview was about
1-1½ hours. Flexibility of the questions was maintained. If the respondent was not
able to understand the question then same question was asked in a different way.
The schedule consisted of following sections:
Section A: General health in ICDS
Section 2: Functions of food and their sources
Section 3: Nutritional requirement
Section 4: Community nutrition
Section 5: Nutritional deficiency and their symptoms and its food sources
Pre testing: The preliminary version of the schedule is pre-tested for its validity
and precision and suitable modifications were made in the schedule of questions
wherever found necessary. This re-structured schedule is used for the collection of
data.
3. Anthropometric Measurements: Changes in body dimensions reflect the
overall health and welfare of individuals and populations. Anthropometry is used
to assess and predict performance, health and survival of individuals and reflect
the economic and social well being of populations. Anthropometry is a widely
used, inexpensive and non-invasive measure of the general nutritional status of
an individual or a population group. Data were gathered by the collection of
anthropometric data through measurements of height and weight. The
anthropometric measurement by National Center for Health Statistics (NCHS)
and WHO standards (WHO, 2005) were used for the determination of nutritional
status of preschool children. Standard deviation of scores (Z-scores) for weight-
for-age (WAZ), height-for-age (HAZ) and weight-for-height (WHZ) were
calculated. The Z-score (SD score) is calculated as follows. Z score = (individual
value-median value of reference population)/ SD value of reference population.
For each of the anthropometric indicators of malnutrition a cut off point of-2
standard deviations (-2 SD) below the median of that of the WHO reference
118
population was used. Anthropometric method is a quantitative method; it also
considers the different types of measurements like, height-for-age, weight-for-
age and weight for- height.
Height-for-age (HAZ): Low height-for-age index identifies past under
nutrition or chronic malnutrition. Height-for-age (HAZ) is an indicator of
stunting, which can result from chronic malnutrition, but genetic factors are
also related to it. It cannot measure short-term changes in malnutrition.
Stunting is associated with a number of long-term factors including chronic
insufficient protein and energy intake, frequent infection, sustained
inappropriate feeding practices and poverty.
Weight-for-age (WAZ): Low weight-for-age index identifies the condition of
being underweight, for a specific age. This index reflects both chronic and
acute under nutrition. Underweight is based on weight-for-age, is a composite
measure of stunting and wasting and is recommended as the indicator to
assess changes in the magnitude of malnutrition over time. There is relation
between prevalence of underweight and several factors such as gross national
product, infant mortality rate, energy intake per capita, female education,
governmental social support, child population, food sources of energy,
distribution of income, access to safe water, female literacy rate and region.
Weight-for-height (WHZ): The weight-for-height (WHZ) index is an
indicator of thinness or wasting. Wasting is short-term malnutrition due to
acute starvation or severe disease, famine etc., but it may result also from
chronic dietary deficiency or disease. Wasting indicates current or acute
malnutrition resulting from failure to gain weight or actual weight loss. It is
associated with the causes include inadequate food intake, incorrect feeding
practices, diseases and infection.
The nutritional status of a child is normally expressed in the Z-score of
the concerned indicator. Weight and height of children of a certain age group
follow more or less the normal distribution. In the present study Z-scores for
119
the three anthropometric indices height-for-age, weight-for-age and weight-
for-height are used to assess the nutritional status of children. The height-for
age Z-score compares the height of a child of a certain age with the median
height of a healthy reference population of that age group, the weight-for-age
Z-score does the same for height; and the weight-for-height Z-score compares
the weight of a certain height with the reference median weight for a child
with the same height. A Z-score of -2 was used as a cut-off point for
estimation of status of malnutrition of children. The Z-score is defined as the
deviation of the value observed for an individual from the median of the
reference population, divided by the standard deviation (SD) of the reference
population. The reference standards most commonly used to standardize
measurements were developed by the US National Center for Health Statistics
(NCHS) and are recommended for international use by the World Health
Organization. The Nutrition Foundation of India support that the WHO
standard is applicable to Indian children (Dibley et al, 1987; Agarwal et al,
1991).
The basic idea is to assume that the given child comes from a healthy
population. Under this null hypothesis, the z-score showed follow the child is
too low as to give it a very small probability of occurring child as
malnourished. The usual cut off point is to classify the child as malnourished.
Deviations of Z-scores less than –2 SD (standard deviation) from the
international reference population were used to classify children as
moderately low weight-for-age, low height-for-age and low weight-for-height,
Deviation of Z-scores less than – 3SD put children in the severe under
nutrition category.
WHO system
< -1 to > -2 Z-score: Mild Malnutrition
< -2 to > -3 Z-score: Moderate Malnutrition
< -3 Z-score: Severe Malnutrition
120
Height and weight were two indicators measured. Non stretchable
steel tape was used to measure the height of children. It was standardized at 1
mm. The subjects were asked to stand with bare foot on a flat floor on a floor
against a wall with feet parallel and with heels, buttocks, shoulders and back
of the head was held comfortably erect and a mark was made on a wall with
the help of right angled objects i.e., wooden scale, touching the top of the
head horizontally with a vertical edge flat against the wall. The reading was
recorded at 1mm.
The body weight of Children was weighed using a standardized
Salter's scale. The grades of malnutrition were assessed using World Health
Organization (WHO) recommended standards. Data of 300 children were
analyzed with the help of WHO Anthropometric softwares. Z scores of
malnutrition were calculated by these softwares. Anthro software was used
for children between 3-5 years and Anthro-plus software was used for
children between 5-6 years. Further the Z-score data of children obtained was
systematically coded and tabulated according to exhaustive categories.
4. 24 hour Dietary Recall Sheet: For the 24-hour dietary recall, the respondents
were asked to remember and report all the foods and beverages consumed in
the preceding 24 hours or in the preceding day. The recall typically is
conducted by interview, in person by using a paper-and-pencil form. Well-
trained interviewers are crucial in administering a 24-hour recall because
much of the dietary information is collected by asking probing questions.
Ideally, interviewers would be dieticians with education in foods and
nutrition; however, non-nutritionists who have been trained in the use of a
standardized instrument can be effective. All interviewers should be
knowledgeable about foods available in the marketplace and about preparation
practices, including prevalent regional or ethnic foods. The interview is often
structured, usually with specific probes, to help the respondent remember all
foods consumed throughout the day. Probing is especially useful in collecting
necessary details, such as how foods were prepared. It is also useful in
recovering many items not originally reported, such as common additions to
121
foods (e.g., butter on toast) and eating occasions not originally reported (e.g.,
snacks and beverage breaks). However, interviewers should be provided with
standardized neutral probing questions so as to avoid leading the respondent
to specific answers when the respondent really does not know or remember.
The process consists of :
(1) an initial ‗‗quick list,‘‘ where the respondent reports all the foods and
beverages consumed without interruption from the interviewer;
(2) time and occasion, where the respondent reports the time each eating
occasion began and names the occasion;
(3) a detail pass, where probing questions ask for more detailed
information about each food and the portion size, in addition to
review of the eating occasions and times between the eating
occasions; and
(4) final review, where questions about any other item not already
reported are asked.
Data collection using the structured interactive 24-hour recalls method:
To assist the parent/ guardian to estimate portion size consumed by the study
child and for easy estimation and calculation of quantity, the interviewers also
moved with utensils such as spoons, cups and plates for the parent to use.. The
interviewer asked the parent to recite all the foods and beverages the child had
eaten the preceding day, while the interviewer compared the oral information to
what was marked on the calendar. The interviewer weighed the portion and
recorded the weight in the specially developed 24-hour recall questionnaire
Calculating energy and nutrient intake: The amounts of foods from the weighed
record and the structured interactive 24-hour recall were converted to grams and
the nutrient values were computed using reference exchange list from book titled
as ―nutritive value of Indian food‖, written by C Gopalan.
122
3.7 INTERVENTION PROGRAMME: A program was designed specifically
to improve the level of nutritional awareness for the improvement of the
implementation of the services and utilization of available resources in a much better
way to achieve expected targets.
3.8 DATA ANALYSIS: The present study is mainly qualitative in nature and the
data obtained by using interview schedule and observation method have mainly been
analyzed using content analysis methods. After scoring, the data was systematically
coded and tabulated according to exhaustive categories .Both quantitative and
qualitative methods were employed for data analysis. The quantitative data obtained
was analyzed by calculating frequencies and computing percentages. Appropriate
statistical techniques like frequencies, correlation, binary logististic regression and
chi-square were used for further analysis, wherever required. SPSS software was
used for quantitative analyses. For computing Z-scores of malnutrition, Anthro
software (children between 3-5 years) and Anthro plus software (children between 5-
6 years) were used.
3.9 ETHICAL ISSUES CONSIDERED: Success of any study depends upon
whole hearted cooperation from the respondents. If the respondents are not willing to
participate in the study voluntarily they might provide haphazard response, which
could mislead the overall findings of the study. In order to ensure the quality data and
also for ethical purpose the following steps were adopted:
Objectives of the study were briefed to all the study subjects.
Informed consent was obtained.
Confidentiality of information was ensured.

123
Chapter 4
Result and Discussion
124
RESULTS AND DISCUSSION
The prime objective of this investigation was to analyze the awareness among anganwadi
workers regarding nutrition. The study was undertaken to assess implementation of
nutritional services at anganwadi centre for pre scholars aged 3-6 yrs. The study also
assess the nutritional status of pre-scholars (3-6 yrs) attending anganwadi centre. Keeping
in view the specific objective, the empirical evidences obtained in terms of factual data,
through objective research procedures, designed and developed for this study, have been
analyzed in the context of the objectives set for the study by subjecting them to the
appropriate statistical tests and analytical tests. The findings thus arrived are presented as
below:
4.1 Demographic profile of anganwadi worker
4.2 Enrollment of children at anganwadi centre.
4.3 Physical infrastructure of anganwadi centre
4.4 Implementation of nutritional services at anganwadi centre provided to pre scholars
of rural and urban zone of Jammu District
4.5 Nutritional awareness among anganwadi workers of rural and urban zone of Jammu
district.
4.6 Influence of nutritional awareness of anganwadi worker on implementation of
nutritional services at anganwadi centre
4.7 Comparison for the level of nutritional awareness among anganwadi workers and
their implementation to nutritional services between rural and urban zone of Jammu
district.
4.8 Assessment of nutritional status of pre scholars in Jammu district
4.9 Evaluation of the final output and expected output of nutritional services at
anganwadi centers
4.10 Intervention programme
125
Contents:
4.1 Demographic profile of anganwadi worker
4.1.1 Age of anganwadi worker
4.1.2 Educational status of the anganwadi worker
4.1.3 Job experience of anganwadi worker
4.1.4 Training Status of anganwadi worker
4.1.5 Distribution of anganwadi centers according to its total functional
period
4.1.6 Distribution of anganwadi workers according to total time period of
training between joining and last training received
4.1.7 Distribution of trained anganwadi workers back log status for referral
training
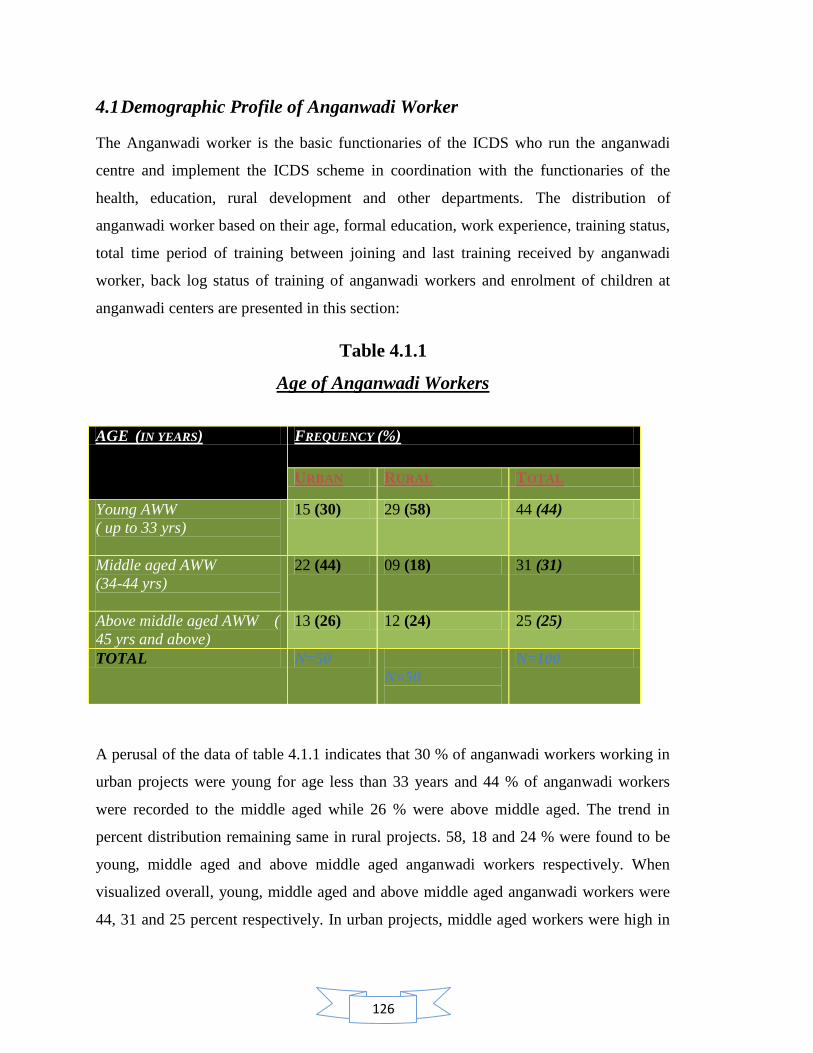
126
4.1 Demographic Profile of Anganwadi Worker
The Anganwadi worker is the basic functionaries of the ICDS who run the anganwadi
centre and implement the ICDS scheme in coordination with the functionaries of the
health, education, rural development and other departments. The distribution of
anganwadi worker based on their age, formal education, work experience, training status,
total time period of training between joining and last training received by anganwadi
worker, back log status of training of anganwadi workers and enrolment of children at
anganwadi centers are presented in this section:
Table 4.1.1
Age of Anganwadi Workers
A perusal of the data of table 4.1.1 indicates that 30 % of anganwadi workers working in
urban projects were young for age less than 33 years and 44 % of anganwadi workers
were recorded to the middle aged while 26 % were above middle aged. The trend in
percent distribution remaining same in rural projects. 58, 18 and 24 % were found to be
young, middle aged and above middle aged anganwadi workers respectively. When
visualized overall, young, middle aged and above middle aged anganwadi workers were
44, 31 and 25 percent respectively. In urban projects, middle aged workers were high in
AGE (IN YEARS) FREQUENCY (%)
URBAN RURAL TOTAL
Young AWW
( up to 33 yrs)
15 (30) 29 (58) 44 (44)
Middle aged AWW
(34-44 yrs)
22 (44) 09 (18) 31 (31)
Above middle aged AWW (
45 yrs and above)
13 (26) 12 (24) 25 (25)
TOTAL N=50
N=50
N=100
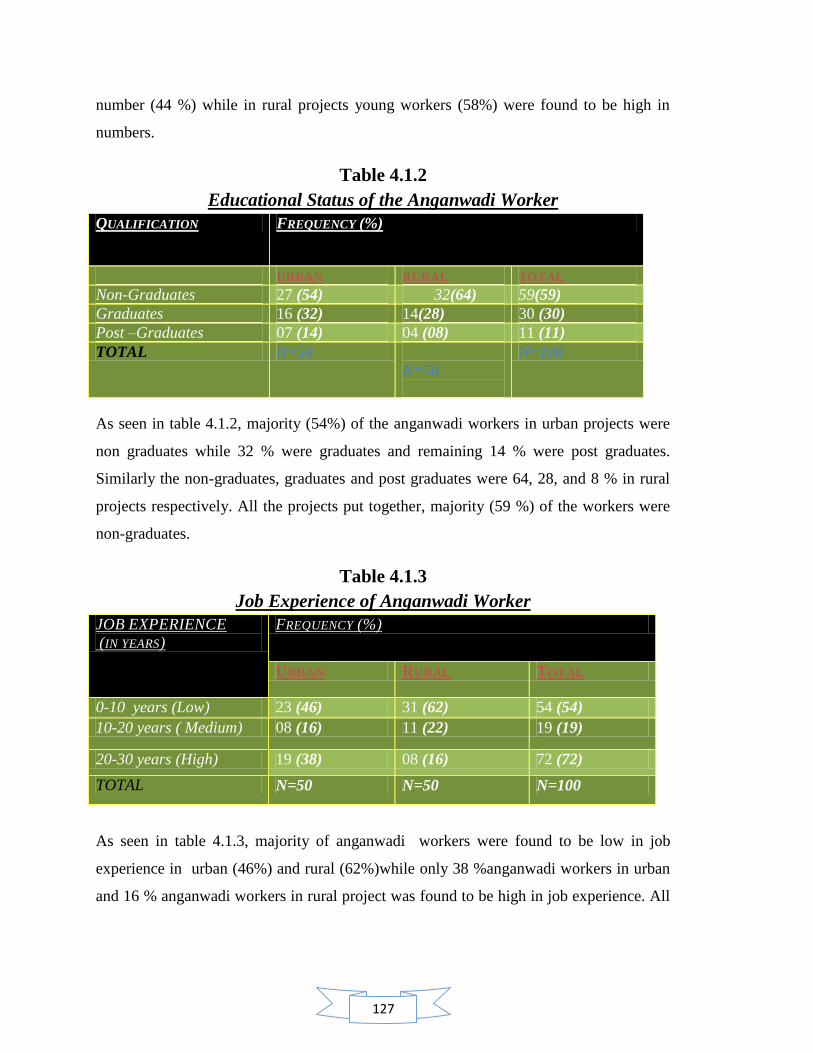
127
number (44 %) while in rural projects young workers (58%) were found to be high in
numbers.
Table 4.1.2
Educational Status of the Anganwadi Worker
QUALIFICATION FREQUENCY (%)
URBAN RURAL TOTAL
Non-Graduates 27 (54) 32(64) 59(59)
Graduates 16 (32) 14(28) 30 (30)
Post –Graduates 07 (14) 04 (08) 11 (11)
TOTAL N=50
N=50
N=100
As seen in table 4.1.2, majority (54%) of the anganwadi workers in urban projects were
non graduates while 32 % were graduates and remaining 14 % were post graduates.
Similarly the non-graduates, graduates and post graduates were 64, 28, and 8 % in rural
projects respectively. All the projects put together, majority (59 %) of the workers were
non-graduates.
Table 4.1.3
Job Experience of Anganwadi Worker
JOB EXPERIENCE
(IN YEARS)
FREQUENCY (%)
URBAN RURAL TOTAL
0-10 years (Low) 23 (46) 31 (62) 54 (54)
10-20 years ( Medium) 08 (16) 11 (22) 19 (19)
20-30 years (High) 19 (38) 08 (16) 72 (72)
TOTAL N=50 N=50 N=100
As seen in table 4.1.3, majority of anganwadi workers were found to be low in job
experience in urban (46%) and rural (62%)while only 38 %anganwadi workers in urban
and 16 % anganwadi workers in rural project was found to be high in job experience. All
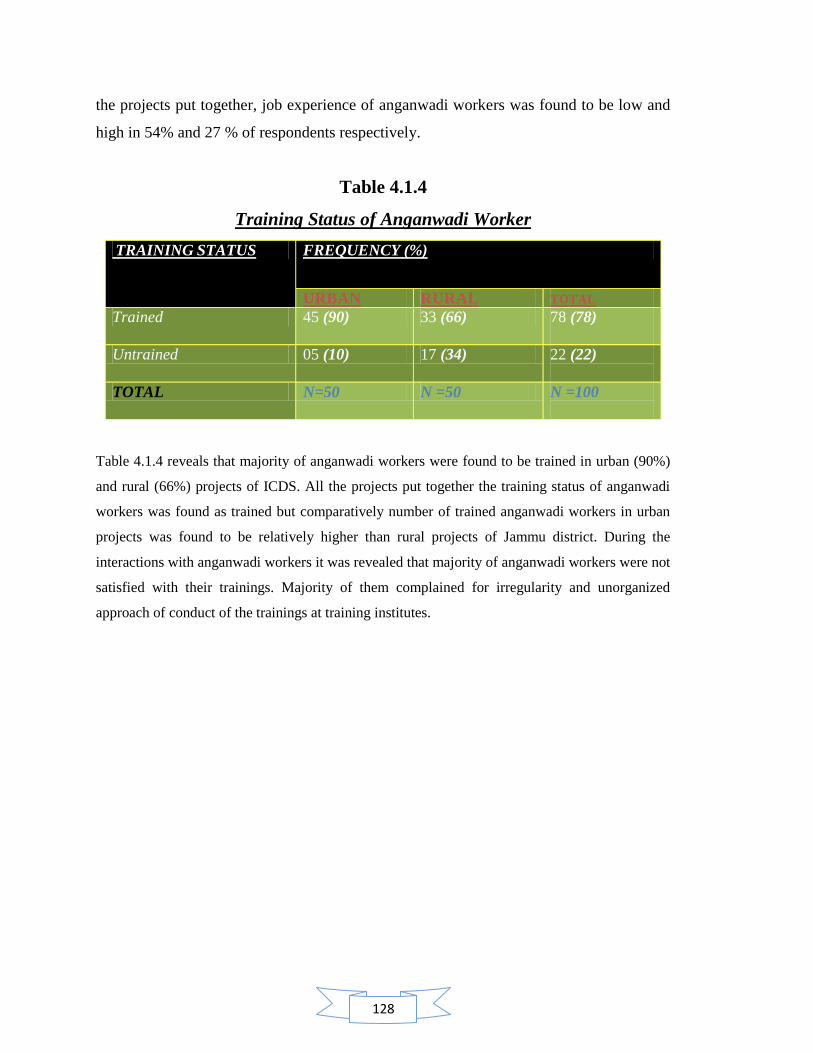
128
the projects put together, job experience of anganwadi workers was found to be low and
high in 54% and 27 % of respondents respectively.
Table 4.1.4
Training Status of Anganwadi Worker
TRAINING STATUS FREQUENCY (%)
URBAN RURAL TOTAL
Trained 45 (90) 33 (66) 78 (78)
Untrained 05 (10) 17 (34) 22 (22)
TOTAL N=50 N =50 N =100
Table 4.1.4 reveals that majority of anganwadi workers were found to be trained in urban (90%)
and rural (66%) projects of ICDS. All the projects put together the training status of anganwadi
workers was found as trained but comparatively number of trained anganwadi workers in urban
projects was found to be relatively higher than rural projects of Jammu district. During the
interactions with anganwadi workers it was revealed that majority of anganwadi workers were not
satisfied with their trainings. Majority of them complained for irregularity and unorganized
approach of conduct of the trainings at training institutes.
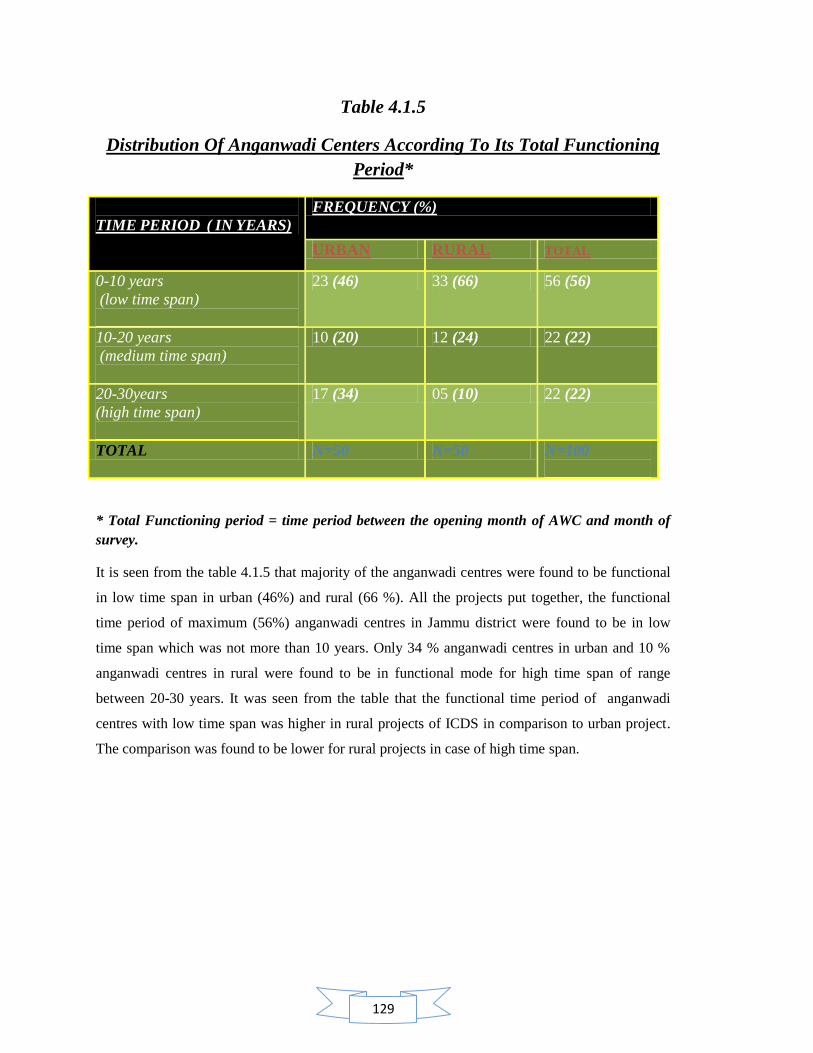
129
Table 4.1.5
Distribution Of Anganwadi Centers According To Its Total Functioning
Period*
TIME PERIOD ( IN YEARS)
FREQUENCY (%)
URBAN RURAL TOTAL
0-10 years
(low time span)
23 (46) 33 (66) 56 (56)
10-20 years
(medium time span)
10 (20) 12 (24) 22 (22)
20-30years
(high time span)
17 (34) 05 (10) 22 (22)
TOTAL N=50 N=50 N=100
* Total Functioning period = time period between the opening month of AWC and month of
survey.
It is seen from the table 4.1.5 that majority of the anganwadi centres were found to be functional
in low time span in urban (46%) and rural (66 %). All the projects put together, the functional
time period of maximum (56%) anganwadi centres in Jammu district were found to be in low
time span which was not more than 10 years. Only 34 % anganwadi centres in urban and 10 %
anganwadi centres in rural were found to be in functional mode for high time span of range
between 20-30 years. It was seen from the table that the functional time period of anganwadi
centres with low time span was higher in rural projects of ICDS in comparison to urban project.
The comparison was found to be lower for rural projects in case of high time span.

130
Table 4.1.6
Distribution Of Anganwadi Workers According To Total Time Period Of
Training Between Joining And Last Training Received
TIME PERIOD (IN YEARS)
FREQUENCY (%)
URBAN RURAL TOTAL
0-10 years
(low time span)
25 (55) 25 (76) 50 (64)
10-20 years
( medium time span)
11 (24) 07 (21) 18 (23)
20-30years
( high time span)
09 (20) 01 (03) 10 (13)
TOTAL N=45 N=33 N=78
Table 4.1.6 reveals that majority of trained anganwadi workers in urban (55%) and rural (76%)
had completed all rounds of their training programme within low time span of not more than 10
years. Only 20 % in urban and 3 % in rural projects of Jammu district, trained anganwadi
workers had completed all rounds of their training programme within high span between the
range of 20-30 years. All the projects put together, the table revealed that maximum (64 %)
anganwadi workers were fully trained within the time span of 10 years While 13 % trained
anganwadi workers had completed all rounds of training within the time span of 20-30 years.
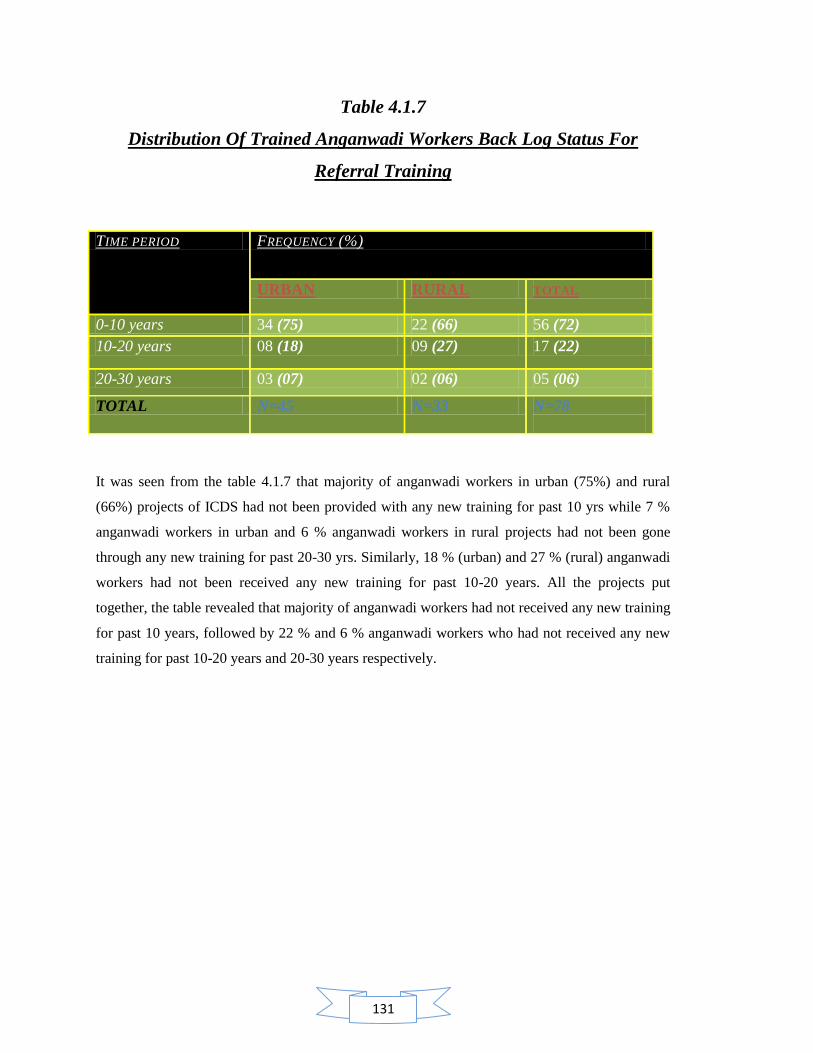
131
Table 4.1.7
Distribution Of Trained Anganwadi Workers Back Log Status For
Referral Training
TIME PERIOD FREQUENCY (%)
URBAN RURAL TOTAL
0-10 years 34 (75) 22 (66) 56 (72)
10-20 years 08 (18) 09 (27) 17 (22)
20-30 years 03 (07) 02 (06) 05 (06)
TOTAL N=45 N=33 N=78
It was seen from the table 4.1.7 that majority of anganwadi workers in urban (75%) and rural
(66%) projects of ICDS had not been provided with any new training for past 10 yrs while 7 %
anganwadi workers in urban and 6 % anganwadi workers in rural projects had not been gone
through any new training for past 20-30 yrs. Similarly, 18 % (urban) and 27 % (rural) anganwadi
workers had not been received any new training for past 10-20 years. All the projects put
together, the table revealed that majority of anganwadi workers had not received any new training
for past 10 years, followed by 22 % and 6 % anganwadi workers who had not received any new
training for past 10-20 years and 20-30 years respectively.
132
Contents:
4.2 Enrollment of children at anganwadi centre.
4.2.1 Enrollment of children (0-6 yrs) in anganwadi centre
4.2.2 Enrollment of children (3-6 yrs) in anganwadi centre
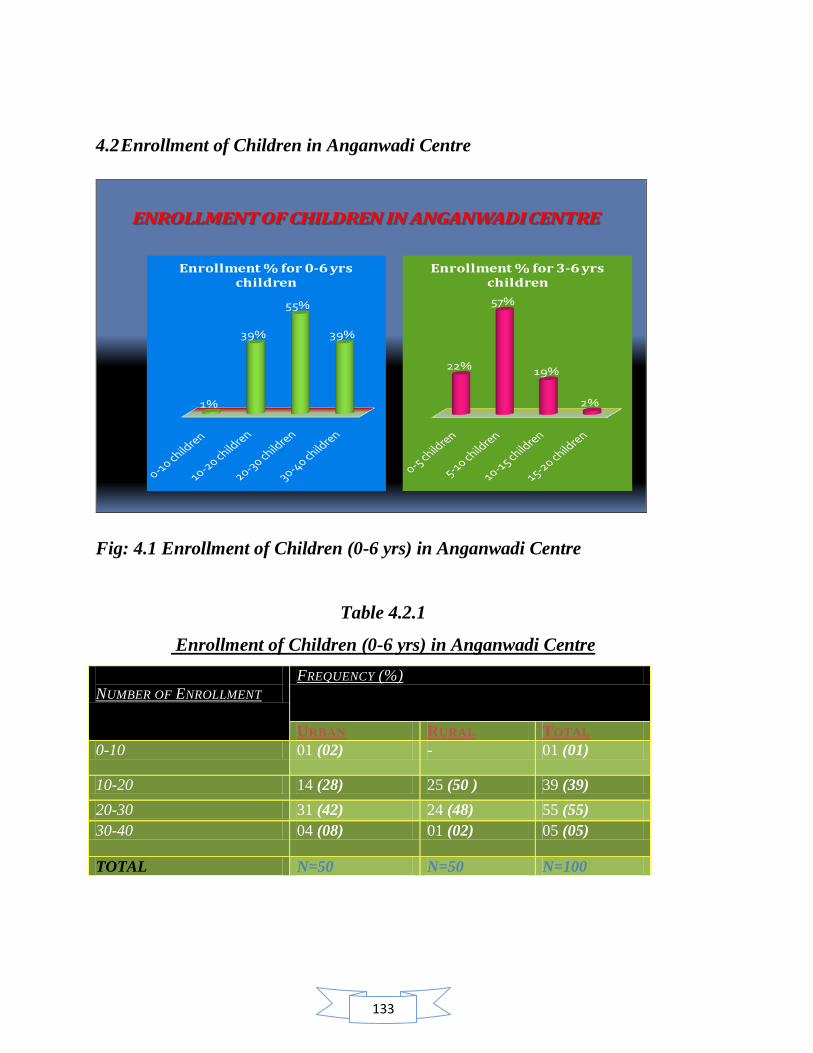
133
4.2 Enrollment of Children in Anganwadi Centre
ENROLLMENT OF CHILDREN IN ANGANWADI CENTRE
1%
39%
55%
39%
Enrollment % for 0-6 yrs children
22%
57%
19%
2%
Enrollment % for 3-6 yrs children
Fig: 4.1 Enrollment of Children (0-6 yrs) in Anganwadi Centre
Table 4.2.1
Enrollment of Children (0-6 yrs) in Anganwadi Centre
NUMBER OF ENROLLMENT
FREQUENCY (%)
URBAN RURAL TOTAL
0-10 01 (02) - 01 (01)
10-20 14 (28) 25 (50 ) 39 (39)
20-30 31 (42) 24 (48) 55 (55)
30-40 04 (08) 01 (02) 05 (05)
TOTAL N=50 N=50 N=100
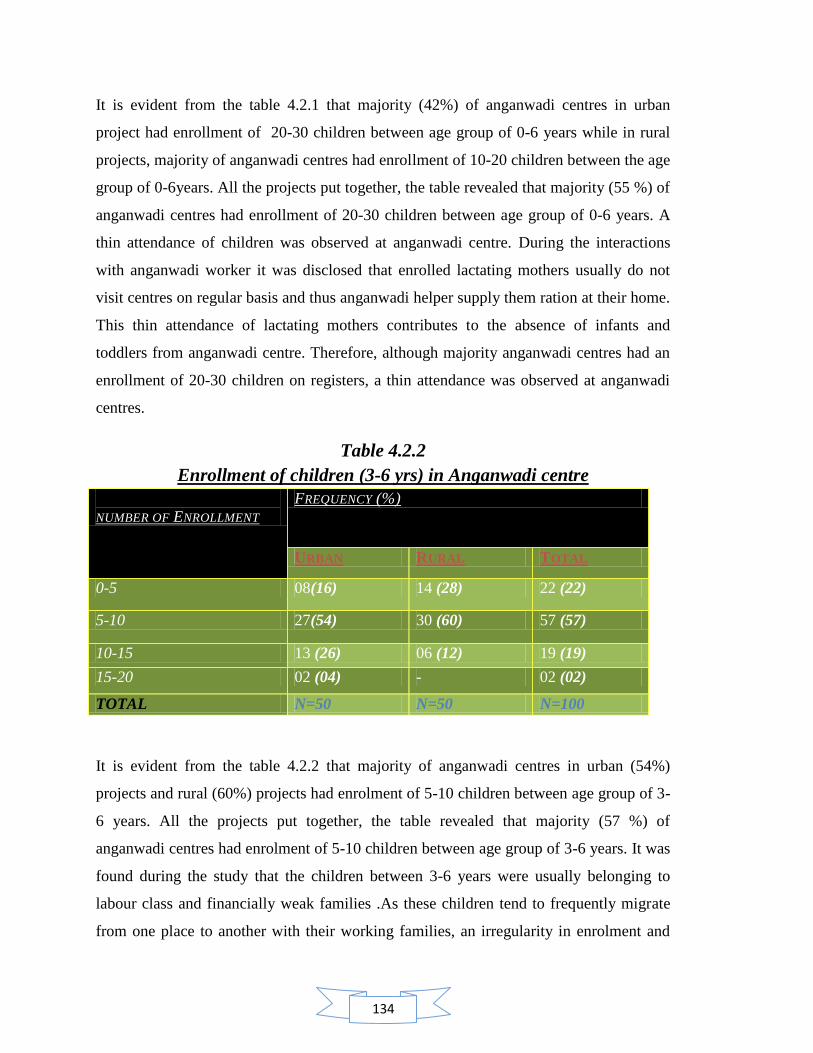
134
It is evident from the table 4.2.1 that majority (42%) of anganwadi centres in urban
project had enrollment of 20-30 children between age group of 0-6 years while in rural
projects, majority of anganwadi centres had enrollment of 10-20 children between the age
group of 0-6years. All the projects put together, the table revealed that majority (55 %) of
anganwadi centres had enrollment of 20-30 children between age group of 0-6 years. A
thin attendance of children was observed at anganwadi centre. During the interactions
with anganwadi worker it was disclosed that enrolled lactating mothers usually do not
visit centres on regular basis and thus anganwadi helper supply them ration at their home.
This thin attendance of lactating mothers contributes to the absence of infants and
toddlers from anganwadi centre. Therefore, although majority anganwadi centres had an
enrollment of 20-30 children on registers, a thin attendance was observed at anganwadi
centres.
Table 4.2.2
Enrollment of children (3-6 yrs) in Anganwadi centre
NUMBER OF ENROLLMENT
FREQUENCY (%)
URBAN RURAL TOTAL
0-5 08(16) 14 (28) 22 (22)
5-10 27(54) 30 (60) 57 (57)
10-15 13 (26) 06 (12) 19 (19)
15-20 02 (04) - 02 (02)
TOTAL N=50 N=50 N=100
It is evident from the table 4.2.2 that majority of anganwadi centres in urban (54%)
projects and rural (60%) projects had enrolment of 5-10 children between age group of 3-
6 years. All the projects put together, the table revealed that majority (57 %) of
anganwadi centres had enrolment of 5-10 children between age group of 3-6 years. It was
found during the study that the children between 3-6 years were usually belonging to
labour class and financially weak families .As these children tend to frequently migrate
from one place to another with their working families, an irregularity in enrolment and
135
thin attendance was observed during the study. Anganwadi workers on further
interactions shared that parents usually demands for better preschool infrastructure
certified preschool education and trained teacher for anganwadi centre so that they could
send their children (3-6 years) to anganwadi centre for components, supplementary
nutrition as well as preschool education. Anganwadi worker further stated that parents do
tend to appreciate the ICDS scheme for it good framework of design but majority are not
satisfied with its implementation of services both for supplementary nutrition as well as
preschool education. Thus, parents who are economically sound are left with no other
choice but to pull out their child above age 3 years, in order to get enrolled to some good
school for formal education. Since anganwadi centre do not provide such formal
education with good infrastructure, a thin attendance as well as low enrollment of local
children was observed during study.
136
Contents:
4.3 Physical infrastructure of anganwadi centre
4.3.1 Building category of anganwadi centre
4.3.2 Availability of indoor space in anganwadi centre
4.3.3 Availability of storage space for raw material in anganwadi centre
4.3.4 Availability of separate space for cooking in anganwadi centre
4.3.5 Availability of outdoor space for play activity in anganwadi centre
4.3.6 Availability of electricity facility in anganwadi centre
4.3.7 Ventilation facility in anganwadi centre
4.3.8 Hygienic status of anganwadi centre
4.3.9 Unhygienic conditions in anganwadi centre
4.3.10 Toilet facility for children in anganwadi centre
4.3.11 Drinking water facility in anganwadi centre
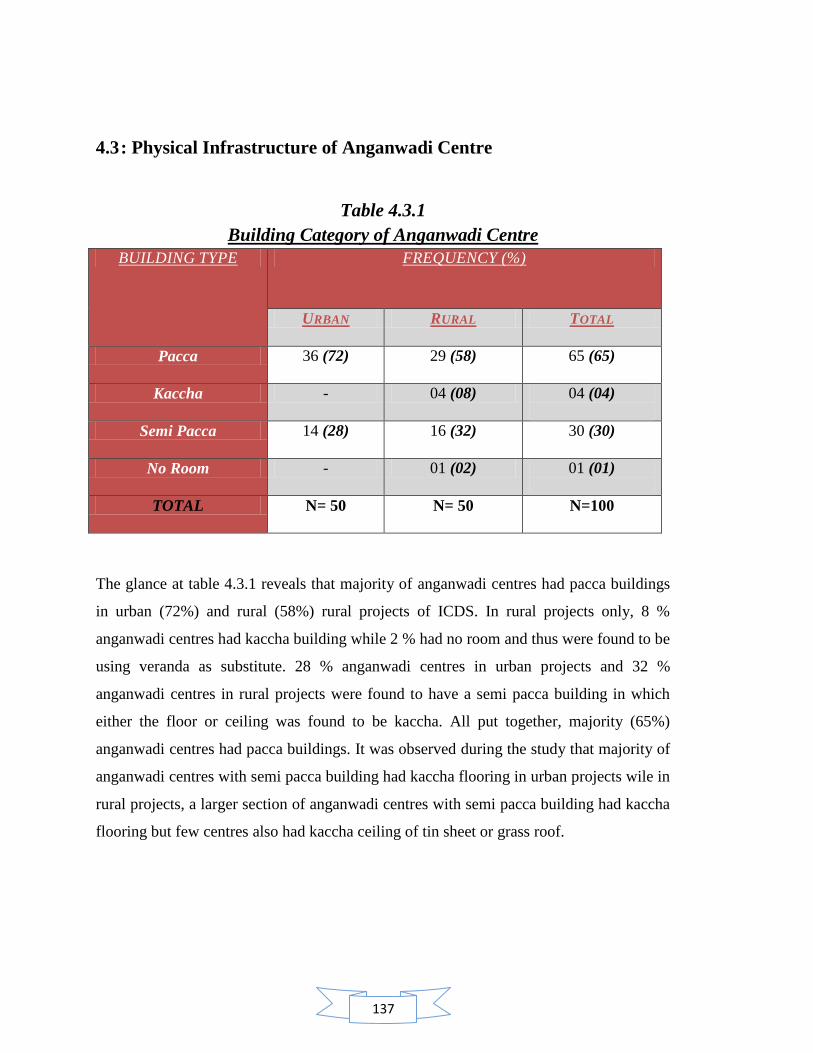
137
4.3 : Physical Infrastructure of Anganwadi Centre
Table 4.3.1
Building Category of Anganwadi Centre
BUILDING TYPE FREQUENCY (%)
URBAN RURAL TOTAL
Pacca 36 (72) 29 (58) 65 (65)
Kaccha - 04 (08) 04 (04)
Semi Pacca 14 (28) 16 (32) 30 (30)
No Room - 01 (02) 01 (01)
TOTAL N= 50 N= 50 N=100
The glance at table 4.3.1 reveals that majority of anganwadi centres had pacca buildings
in urban (72%) and rural (58%) rural projects of ICDS. In rural projects only, 8 %
anganwadi centres had kaccha building while 2 % had no room and thus were found to be
using veranda as substitute. 28 % anganwadi centres in urban projects and 32 %
anganwadi centres in rural projects were found to have a semi pacca building in which
either the floor or ceiling was found to be kaccha. All put together, majority (65%)
anganwadi centres had pacca buildings. It was observed during the study that majority of
anganwadi centres with semi pacca building had kaccha flooring in urban projects wile in
rural projects, a larger section of anganwadi centres with semi pacca building had kaccha
flooring but few centres also had kaccha ceiling of tin sheet or grass roof.
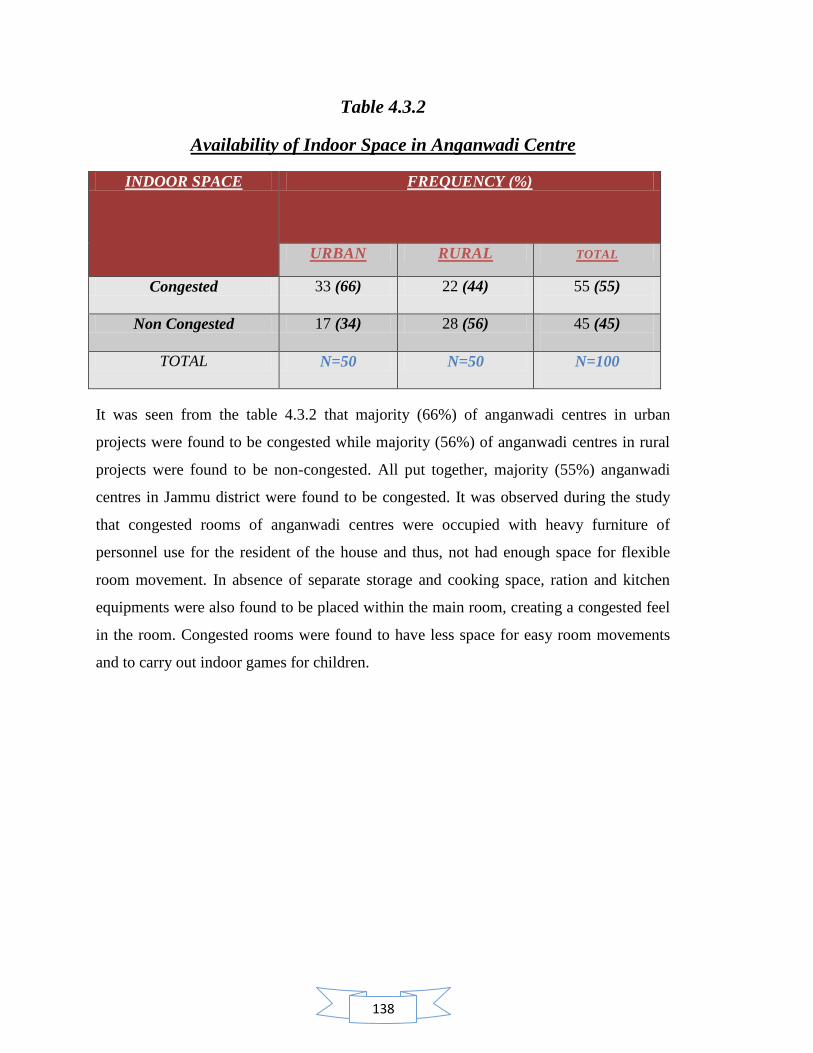
138
Table 4.3.2
Availability of Indoor Space in Anganwadi Centre
INDOOR SPACE FREQUENCY (%)
URBAN RURAL TOTAL
Congested 33 (66) 22 (44) 55 (55)
Non Congested 17 (34) 28 (56) 45 (45)
TOTAL N=50 N=50 N=100
It was seen from the table 4.3.2 that majority (66%) of anganwadi centres in urban
projects were found to be congested while majority (56%) of anganwadi centres in rural
projects were found to be non-congested. All put together, majority (55%) anganwadi
centres in Jammu district were found to be congested. It was observed during the study
that congested rooms of anganwadi centres were occupied with heavy furniture of
personnel use for the resident of the house and thus, not had enough space for flexible
room movement. In absence of separate storage and cooking space, ration and kitchen
equipments were also found to be placed within the main room, creating a congested feel
in the room. Congested rooms were found to have less space for easy room movements
and to carry out indoor games for children.
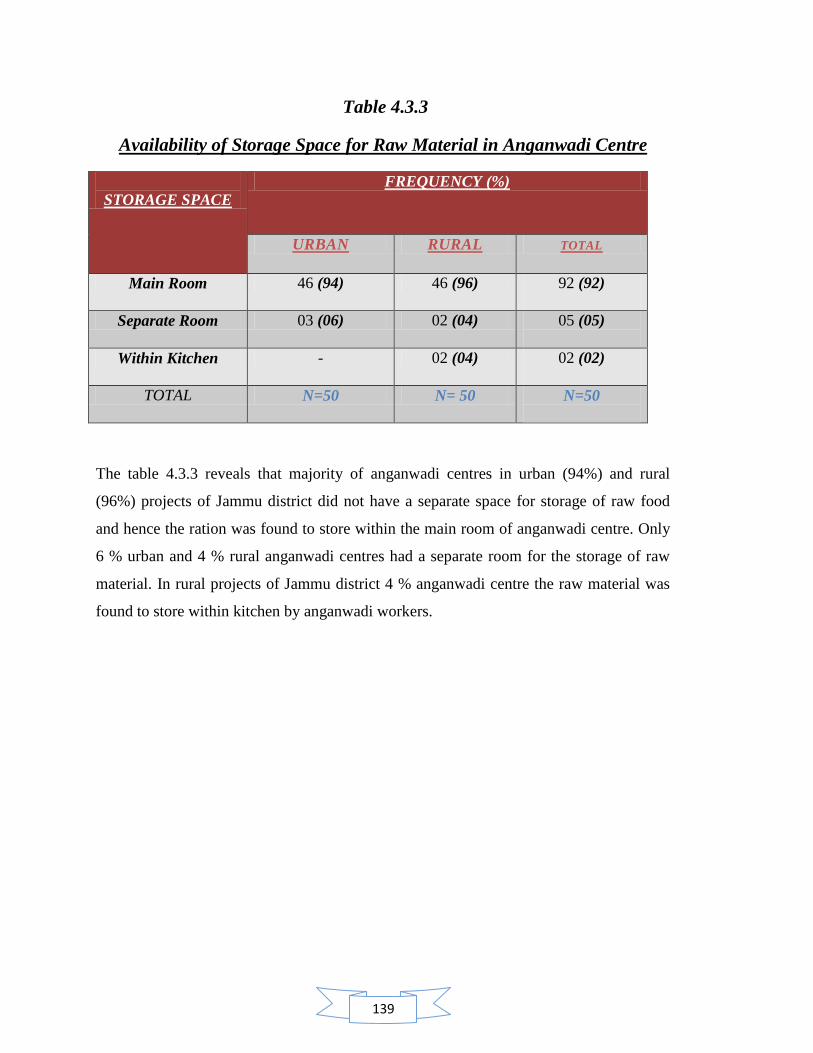
139
Table 4.3.3
Availability of Storage Space for Raw Material in Anganwadi Centre
STORAGE SPACE
FREQUENCY (%)
URBAN RURAL TOTAL
Main Room 46 (94) 46 (96) 92 (92)
Separate Room 03 (06) 02 (04) 05 (05)
Within Kitchen - 02 (04) 02 (02)
TOTAL N=50 N= 50 N=50
The table 4.3.3 reveals that majority of anganwadi centres in urban (94%) and rural
(96%) projects of Jammu district did not have a separate space for storage of raw food
and hence the ration was found to store within the main room of anganwadi centre. Only
6 % urban and 4 % rural anganwadi centres had a separate room for the storage of raw
material. In rural projects of Jammu district 4 % anganwadi centre the raw material was
found to store within kitchen by anganwadi workers.
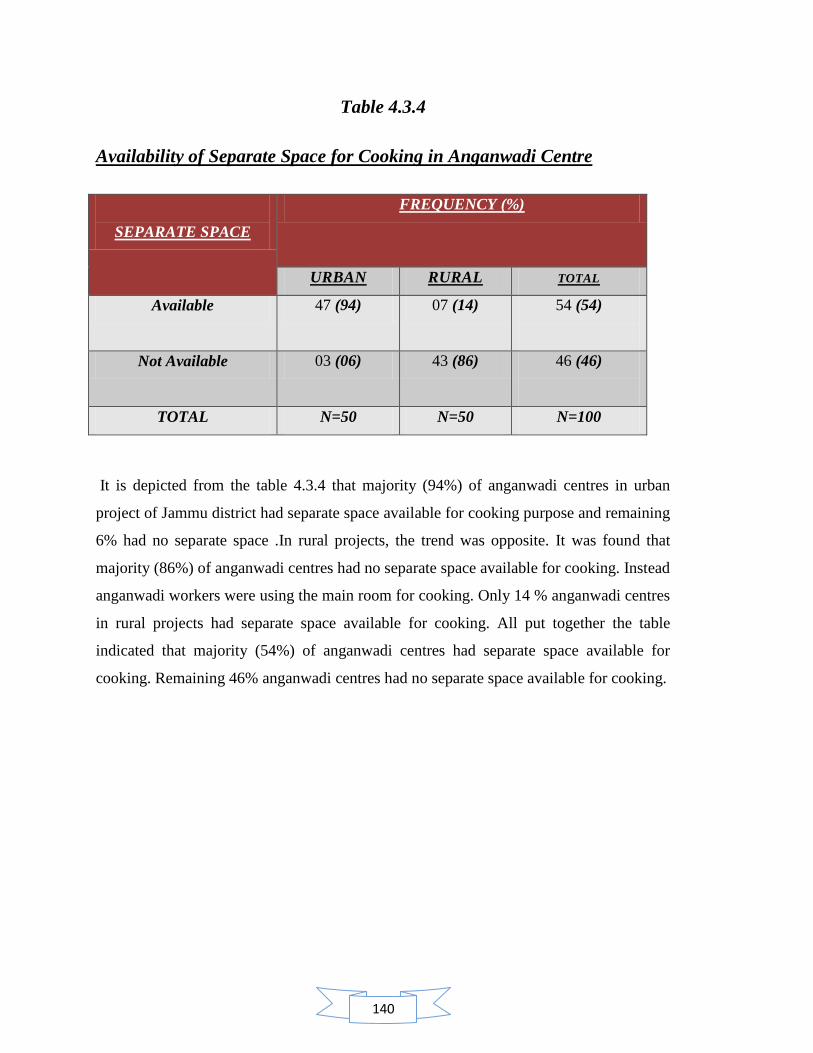
140
Table 4.3.4
Availability of Separate Space for Cooking in Anganwadi Centre
SEPARATE SPACE
FREQUENCY (%)
URBAN RURAL TOTAL
Available 47 (94) 07 (14) 54 (54)
Not Available 03 (06) 43 (86) 46 (46)
TOTAL N=50 N=50 N=100
It is depicted from the table 4.3.4 that majority (94%) of anganwadi centres in urban
project of Jammu district had separate space available for cooking purpose and remaining
6% had no separate space .In rural projects, the trend was opposite. It was found that
majority (86%) of anganwadi centres had no separate space available for cooking. Instead
anganwadi workers were using the main room for cooking. Only 14 % anganwadi centres
in rural projects had separate space available for cooking. All put together the table
indicated that majority (54%) of anganwadi centres had separate space available for
cooking. Remaining 46% anganwadi centres had no separate space available for cooking.
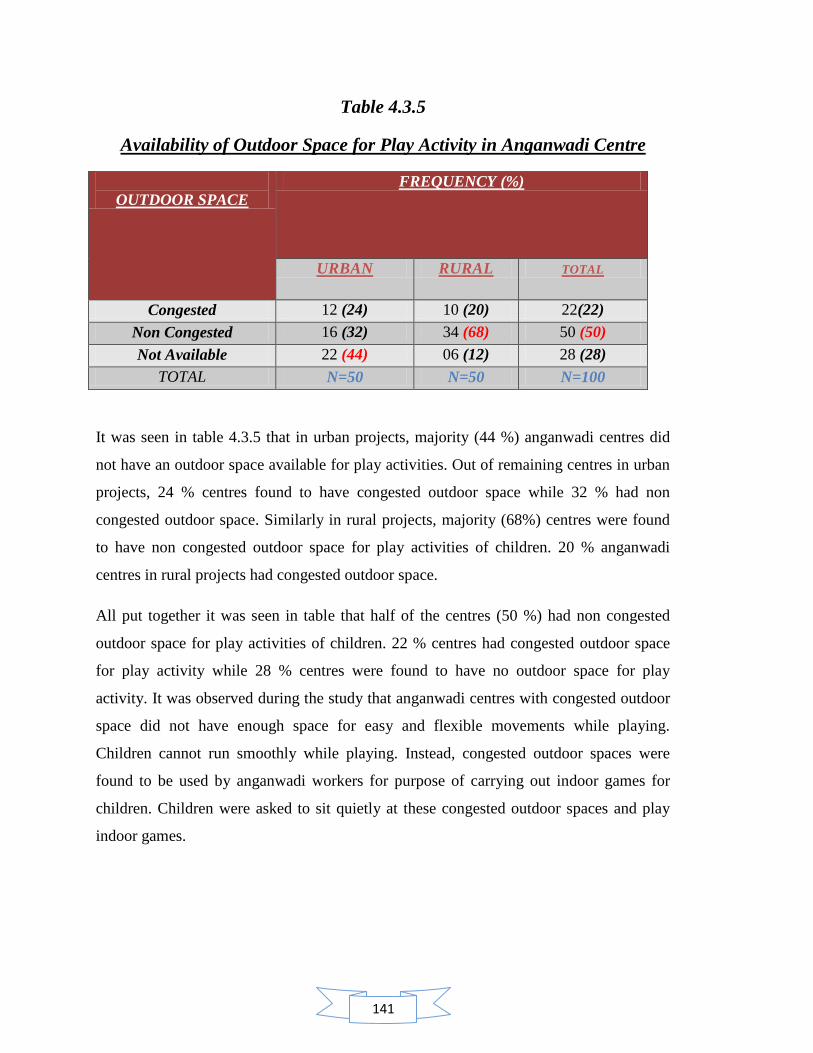
141
Table 4.3.5
Availability of Outdoor Space for Play Activity in Anganwadi Centre
OUTDOOR SPACE
FREQUENCY (%)
URBAN RURAL TOTAL
Congested 12 (24) 10 (20) 22(22)
Non Congested 16 (32) 34 (68) 50 (50)
Not Available 22 (44) 06 (12) 28 (28)
TOTAL N=50 N=50 N=100
It was seen in table 4.3.5 that in urban projects, majority (44 %) anganwadi centres did
not have an outdoor space available for play activities. Out of remaining centres in urban
projects, 24 % centres found to have congested outdoor space while 32 % had non
congested outdoor space. Similarly in rural projects, majority (68%) centres were found
to have non congested outdoor space for play activities of children. 20 % anganwadi
centres in rural projects had congested outdoor space.
All put together it was seen in table that half of the centres (50 %) had non congested
outdoor space for play activities of children. 22 % centres had congested outdoor space
for play activity while 28 % centres were found to have no outdoor space for play
activity. It was observed during the study that anganwadi centres with congested outdoor
space did not have enough space for easy and flexible movements while playing.
Children cannot run smoothly while playing. Instead, congested outdoor spaces were
found to be used by anganwadi workers for purpose of carrying out indoor games for
children. Children were asked to sit quietly at these congested outdoor spaces and play
indoor games.
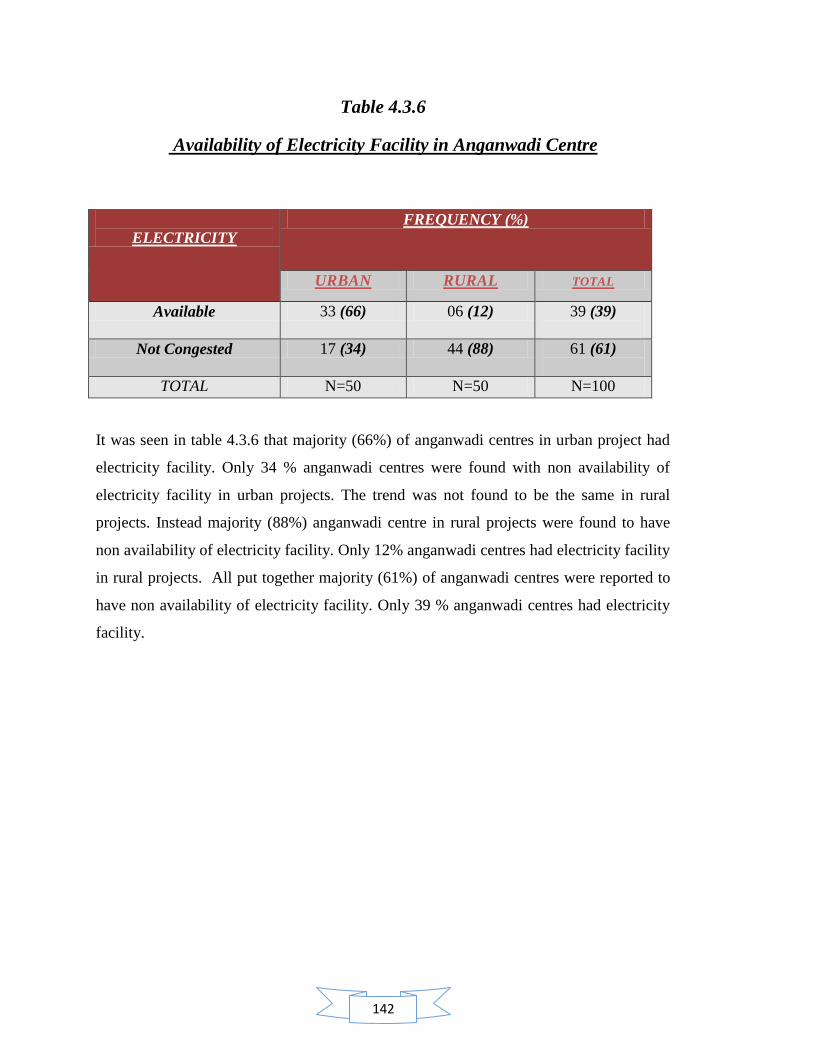
142
Table 4.3.6
Availability of Electricity Facility in Anganwadi Centre
ELECTRICITY
FREQUENCY (%)
URBAN RURAL TOTAL
Available 33 (66) 06 (12) 39 (39)
Not Congested 17 (34) 44 (88) 61 (61)
TOTAL N=50 N=50 N=100
It was seen in table 4.3.6 that majority (66%) of anganwadi centres in urban project had
electricity facility. Only 34 % anganwadi centres were found with non availability of
electricity facility in urban projects. The trend was not found to be the same in rural
projects. Instead majority (88%) anganwadi centre in rural projects were found to have
non availability of electricity facility. Only 12% anganwadi centres had electricity facility
in rural projects. All put together majority (61%) of anganwadi centres were reported to
have non availability of electricity facility. Only 39 % anganwadi centres had electricity
facility.
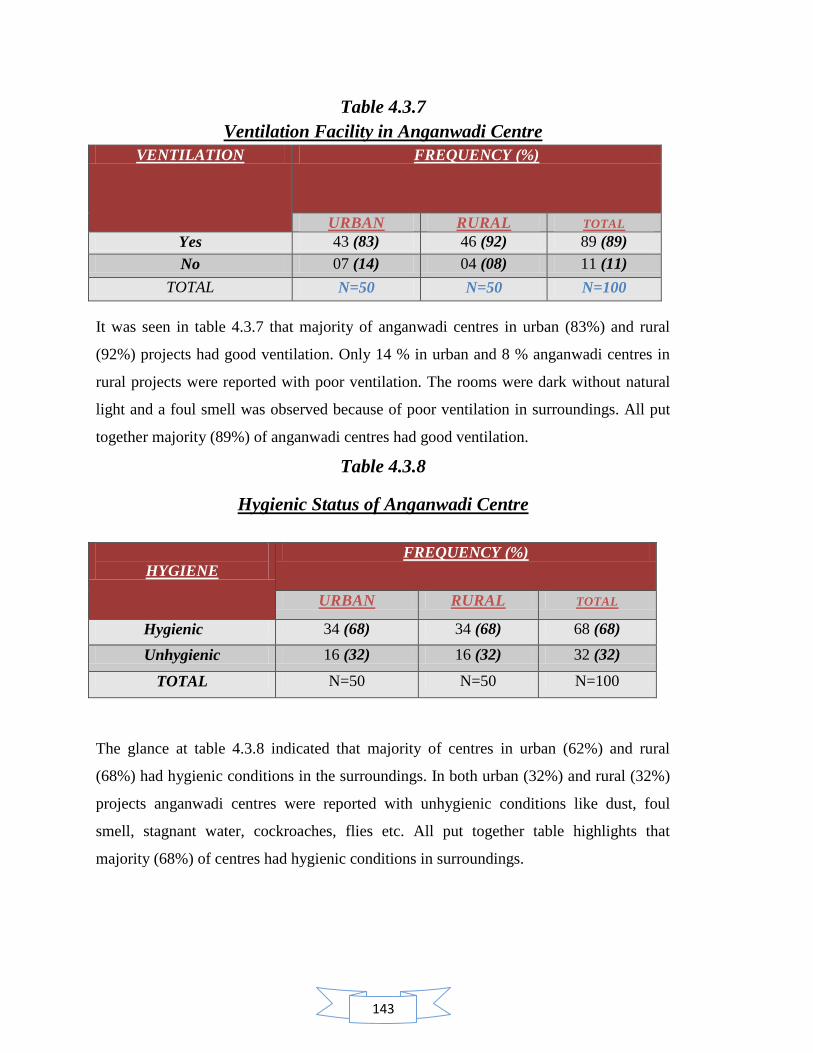
143
Table 4.3.7
Ventilation Facility in Anganwadi Centre
VENTILATION FREQUENCY (%)
URBAN RURAL TOTAL
Yes 43 (83) 46 (92) 89 (89)
No 07 (14) 04 (08) 11 (11)
TOTAL N=50 N=50 N=100
It was seen in table 4.3.7 that majority of anganwadi centres in urban (83%) and rural
(92%) projects had good ventilation. Only 14 % in urban and 8 % anganwadi centres in
rural projects were reported with poor ventilation. The rooms were dark without natural
light and a foul smell was observed because of poor ventilation in surroundings. All put
together majority (89%) of anganwadi centres had good ventilation.
Table 4.3.8
Hygienic Status of Anganwadi Centre
HYGIENE
FREQUENCY (%)
URBAN RURAL TOTAL
Hygienic 34 (68) 34 (68) 68 (68)
Unhygienic 16 (32) 16 (32) 32 (32)
TOTAL N=50 N=50 N=100
The glance at table 4.3.8 indicated that majority of centres in urban (62%) and rural
(68%) had hygienic conditions in the surroundings. In both urban (32%) and rural (32%)
projects anganwadi centres were reported with unhygienic conditions like dust, foul
smell, stagnant water, cockroaches, flies etc. All put together table highlights that
majority (68%) of centres had hygienic conditions in surroundings.
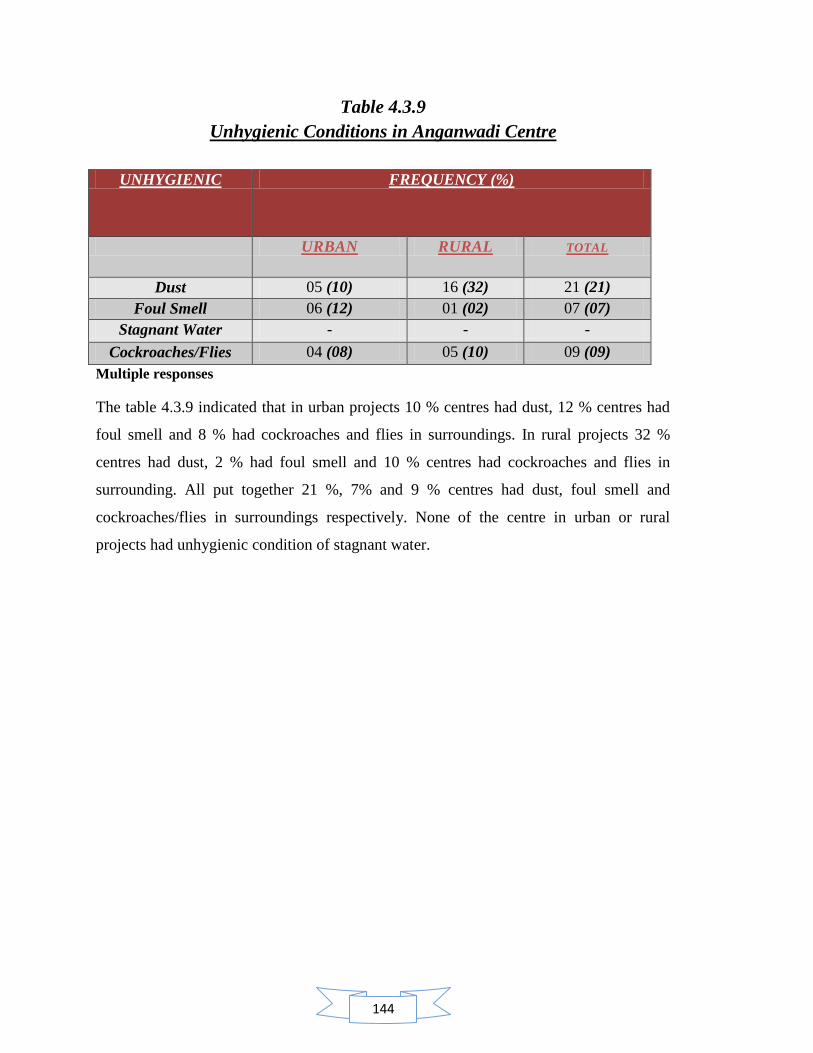
144
Table 4.3.9
Unhygienic Conditions in Anganwadi Centre
UNHYGIENIC FREQUENCY (%)
URBAN RURAL TOTAL
Dust 05 (10) 16 (32) 21 (21)
Foul Smell 06 (12) 01 (02) 07 (07)
Stagnant Water - - -
Cockroaches/Flies 04 (08) 05 (10) 09 (09)
Multiple responses
The table 4.3.9 indicated that in urban projects 10 % centres had dust, 12 % centres had
foul smell and 8 % had cockroaches and flies in surroundings. In rural projects 32 %
centres had dust, 2 % had foul smell and 10 % centres had cockroaches and flies in
surrounding. All put together 21 %, 7% and 9 % centres had dust, foul smell and
cockroaches/flies in surroundings respectively. None of the centre in urban or rural
projects had unhygienic condition of stagnant water.

145
Table 4.3.10
Toilet Facility for Children in Anganwadi Centre
TOILET FACILITY
FREQUENCY (%)
URBAN
N=50
RURAL
N=50
TOTAL
N=100
Available 20 (40) 11 (22) 31 (31)
Indian 19 (38) 11 (22) 30 (30)
English 01 (02) - 01 (01)
Not available 30 (60) 39 (78) 69 (69)
The table 4.3.10 highlights that majority of anganwadi centres in urban (60 %) and rural
(78%) projects did not have toilet facility. In urban projects only 40 % centres had toilet
facility out of which 19 % had Indian toilet facility and 1 % had English toilet facility. In
rural projects only 22 % anganwadi centres had toilet facility and all of them had Indian
toilet facility.
All put together, table indicated that majority (69%) of centres did not have toilet facility
for beneficiaries. It was observed during the study that where ever centres had this
facility children were not permitted to use the facility. Rather children were asked to go
outside or at their home. It was further observed that anganwadi worker only allows
children whenever it is extremely urgent and usually prefer to avoid the use of toilet
facility by children for the sake of cleanliness.
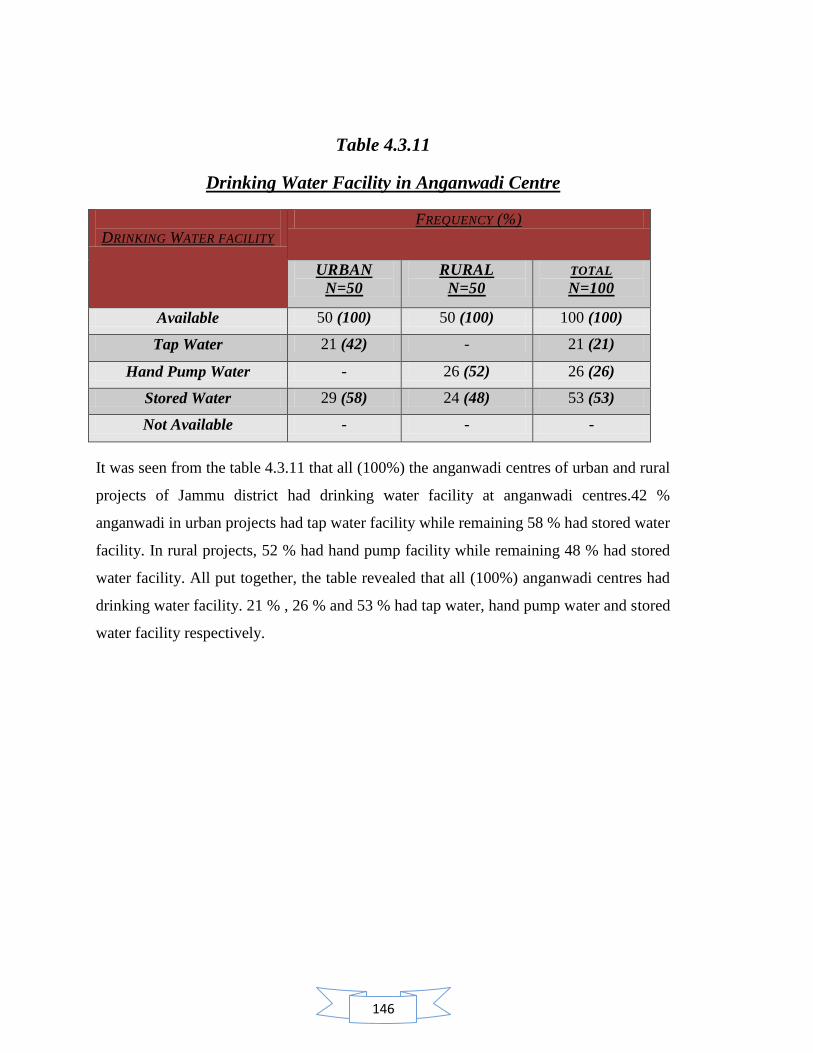
146
Table 4.3.11
Drinking Water Facility in Anganwadi Centre
DRINKING WATER FACILITY
FREQUENCY (%)
URBAN
N=50
RURAL
N=50
TOTAL
N=100
Available 50 (100) 50 (100) 100 (100)
Tap Water 21 (42) - 21 (21)
Hand Pump Water - 26 (52) 26 (26)
Stored Water 29 (58) 24 (48) 53 (53)
Not Available - - -
It was seen from the table 4.3.11 that all (100%) the anganwadi centres of urban and rural
projects of Jammu district had drinking water facility at anganwadi centres.42 %
anganwadi in urban projects had tap water facility while remaining 58 % had stored water
facility. In rural projects, 52 % had hand pump facility while remaining 48 % had stored
water facility. All put together, the table revealed that all (100%) anganwadi centres had
drinking water facility. 21 % , 26 % and 53 % had tap water, hand pump water and stored
water facility respectively.
147
Contents:
4.4 Implementation of nutritional services at anganwadi centre provided to pre scholars
of rural and urban zone of Jammu District.
4.4.1 Implementation of supplementary nutrition services at anganwadi
centre.
4.4.1.1 Execution of nutritional practices at anganwadi centre.
4.4.1.2 Implementation of supplementary nutritional target at anganwadi
centre.
4.4.1.3 Consumption of supplementary nutrition by children at anganwadi
centre.
4.4.2 Implementation of growth monitoring services at anganwadi centre.
4.4.2.1 Type of weighing scale used at anganwadi centre.
4.4.2.2 Implementation of growth monitoring services.
4.4.2.3 Execution skills for growth monitoring.
4.4.3 Implementation of Nutrition and health education (NHED) at
anganwadi centre.
4.4.3.1 Conduct of nutrition and health education sessions at anganwadi
centre.
4.4.3.2 Rotation of nutrition and health education sessions held at anganwadi
centre.
4.4.4 Concluding Comments
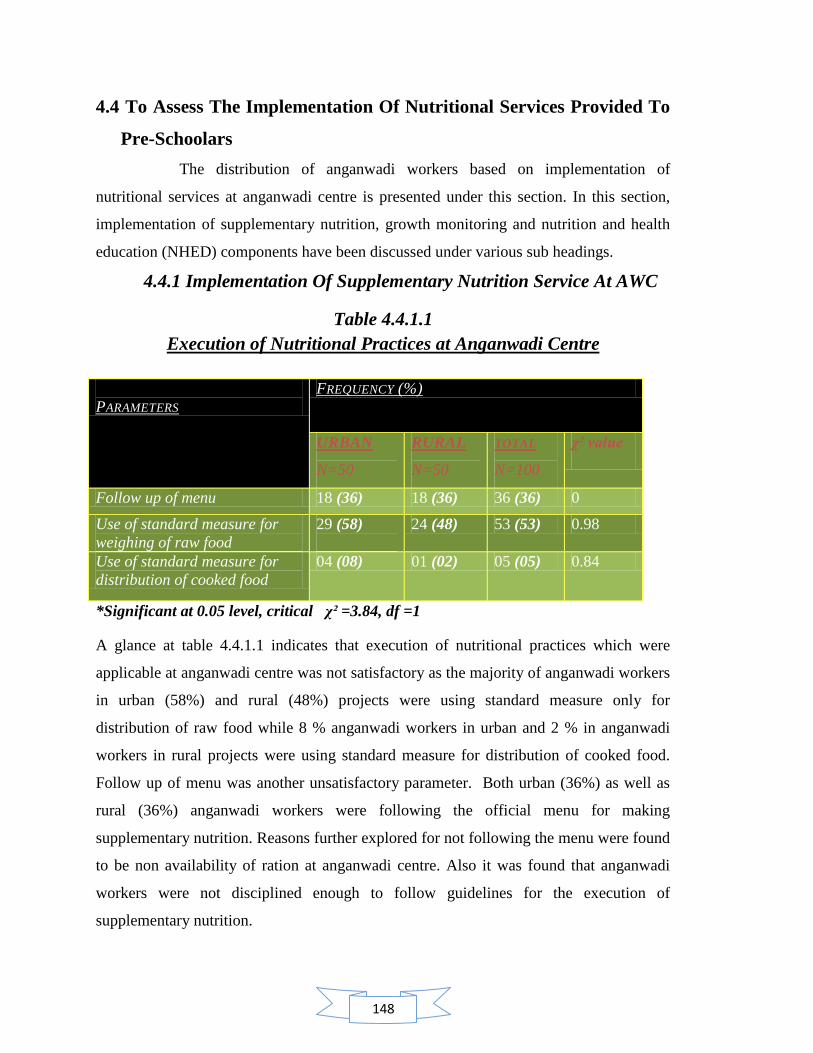
148
4.4 To Assess The Implementation Of Nutritional Services Provided To
Pre-Schoolars
The distribution of anganwadi workers based on implementation of
nutritional services at anganwadi centre is presented under this section. In this section,
implementation of supplementary nutrition, growth monitoring and nutrition and health
education (NHED) components have been discussed under various sub headings.
4.4.1 Implementation Of Supplementary Nutrition Service At AWC
Table 4.4.1.1
Execution of Nutritional Practices at Anganwadi Centre
PARAMETERS
FREQUENCY (%)
URBAN
N=50
RURAL
N=50
TOTAL
N=100
χ² value
Follow up of menu 18 (36) 18 (36) 36 (36) 0
Use of standard measure for
weighing of raw food
29 (58)
24 (48) 53 (53) 0.98
Use of standard measure for
distribution of cooked food
04 (08) 01 (02) 05 (05) 0.84
*Significant at 0.05 level, critical χ² =3.84, df =1
A glance at table 4.4.1.1 indicates that execution of nutritional practices which were
applicable at anganwadi centre was not satisfactory as the majority of anganwadi workers
in urban (58%) and rural (48%) projects were using standard measure only for
distribution of raw food while 8 % anganwadi workers in urban and 2 % in anganwadi
workers in rural projects were using standard measure for distribution of cooked food.
Follow up of menu was another unsatisfactory parameter. Both urban (36%) as well as
rural (36%) anganwadi workers were following the official menu for making
supplementary nutrition. Reasons further explored for not following the menu were found
to be non availability of ration at anganwadi centre. Also it was found that anganwadi
workers were not disciplined enough to follow guidelines for the execution of
supplementary nutrition.

149
All put together it was seen in table 4.4.1.1 that 36 % anganwadi workers in total sample
population were following the official menu, 53 % were using standard measure for
weighing of raw food and 5 % were using standard measure for distribution of cooked
food.
Calculation of chi square further revealed insignificant difference between anganwadi
centres from urban and rural zone for services of follow up of official menu and use of
standard measure for raw and cooked food.
Table 4.4.1.2
Implementation of Supplementary Nutritional Target at AWC
IMPLEMENTATION OF STANDARD
MEASURES TO ACHIEVE FIXED
QUANTITY OF NUTRITION
FREQUENCY (%)
URBAN
N=50
RURAL
N=50
TOTAL
N=100
Raw but not for cooked 26 (52) 23 (46) 49 (49)
Cooked but not for raw 01 (02) - 01 (01)
Both ( raw + cooked) 03 (06) 01(02) 04 (04)
None 18 (36) 25 (50 ) 43 (43)
Multiple responses
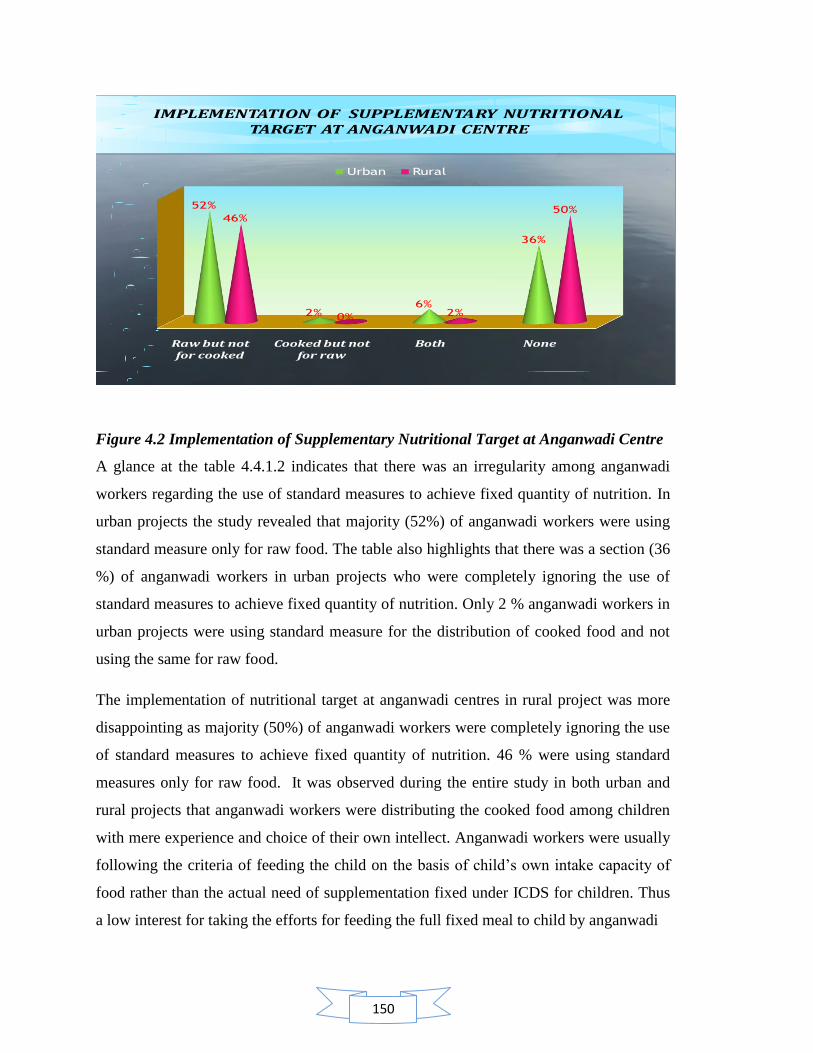
150
IMPLEMENTATION OF SUPPLEMENTARY NUTRITIONAL TARGET AT ANGANWADI CENTRE
Raw but not for cooked
Cooked but not for raw
Both None
52%
2%6%
36%
46%
0% 2%
50%
Urban Rural
Figure 4.2 Implementation of Supplementary Nutritional Target at Anganwadi Centre
A glance at the table 4.4.1.2 indicates that there was an irregularity among anganwadi
workers regarding the use of standard measures to achieve fixed quantity of nutrition. In
urban projects the study revealed that majority (52%) of anganwadi workers were using
standard measure only for raw food. The table also highlights that there was a section (36
%) of anganwadi workers in urban projects who were completely ignoring the use of
standard measures to achieve fixed quantity of nutrition. Only 2 % anganwadi workers in
urban projects were using standard measure for the distribution of cooked food and not
using the same for raw food.
The implementation of nutritional target at anganwadi centres in rural project was more
disappointing as majority (50%) of anganwadi workers were completely ignoring the use
of standard measures to achieve fixed quantity of nutrition. 46 % were using standard
measures only for raw food. It was observed during the entire study in both urban and
rural projects that anganwadi workers were distributing the cooked food among children
with mere experience and choice of their own intellect. Anganwadi workers were usually
following the criteria of feeding the child on the basis of child‘s own intake capacity of
food rather than the actual need of supplementation fixed under ICDS for children. Thus
a low interest for taking the efforts for feeding the full fixed meal to child by anganwadi
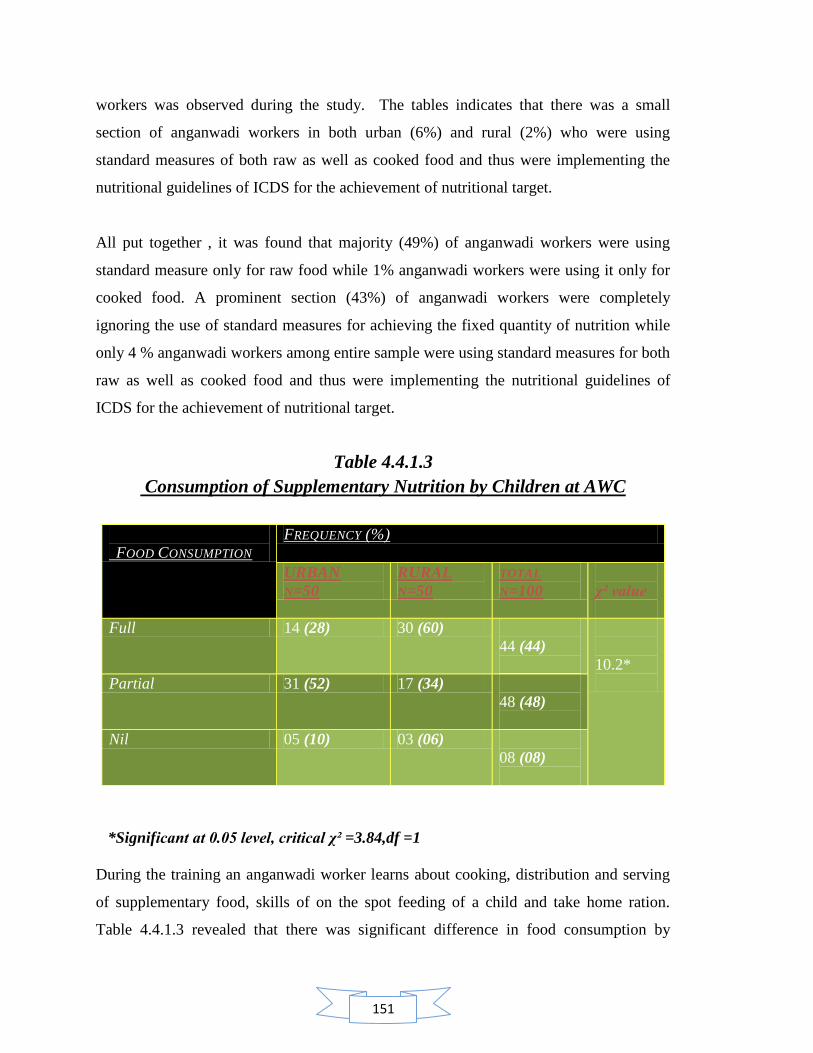
151
workers was observed during the study. The tables indicates that there was a small
section of anganwadi workers in both urban (6%) and rural (2%) who were using
standard measures of both raw as well as cooked food and thus were implementing the
nutritional guidelines of ICDS for the achievement of nutritional target.
All put together , it was found that majority (49%) of anganwadi workers were using
standard measure only for raw food while 1% anganwadi workers were using it only for
cooked food. A prominent section (43%) of anganwadi workers were completely
ignoring the use of standard measures for achieving the fixed quantity of nutrition while
only 4 % anganwadi workers among entire sample were using standard measures for both
raw as well as cooked food and thus were implementing the nutritional guidelines of
ICDS for the achievement of nutritional target.
Table 4.4.1.3
Consumption of Supplementary Nutrition by Children at AWC
FOOD CONSUMPTION
FREQUENCY (%)
URBAN
N=50
RURAL
N=50
TOTAL
N=100
χ² value
Full 14 (28) 30 (60)
44 (44)
10.2*
Partial 31 (52) 17 (34)
48 (48)
Nil 05 (10) 03 (06)
08 (08)
*Significant at 0.05 level, critical χ² =3.84,df =1
During the training an anganwadi worker learns about cooking, distribution and serving
of supplementary food, skills of on the spot feeding of a child and take home ration.
Table 4.4.1.3 revealed that there was significant difference in food consumption by

152
children between anganwadi centres from urban and rural zone. Majority (52%) of
anganwadi workers in urban projects reported for partial consumption of supplementary
nutrition by children at their respective anganwadi centres while 28% were stated that
children tend to consume full meal at the anganwadi centre. Remaining 10 % anganwadi
workers stated that children do not prefer eating at anganwadi centres and thus take their
ration home for consumption.
The table 4.4.1.3 also highlights that majority (60%) of anganwadi workers in rural
projects stated that children tend to consume full meal at their respective anganwadi
centres while 17 % anganwadi workers reported for the partial consumption of
supplementary food by children at their anganwadi centres. Remaining 6% anganwadi
workers stated that children do not prefer eating at anganwadi centres and thus take their
ration home for consumption.
All put together , the table 4.4.1.3 presented that majority (48%) of anganwadi workers
reported for partial consumption of food by children at their respective anganwadi centres
while 44 % anganwadi workers stated that children tend to consume full meal at the
anganwadi centre. Remaining 8 % anganwadi workers stated that children do not prefer
eating at anganwadi centres and thus take their ration home for consumption.
During the study it was observed that children were either taking their ration home along
with them or were partially consuming the food for the sake of demonstration in presence
of outside visitor. It was also observed that majority of children in urban as well as rural
projects were bringing their own Tiffin meals and were consuming it at anganwadi
centres. When served the supplementary food by anganwadi workers they were tend to
reject eating and preferred to take their ration home because of the satiety feeling of the
Tiffin meal they already had around 11-12 pm. Anganwadi workers were also not
keeping a track of consumption of food by children who were taking the ration home.
Anganwadi workers and anganwadi helpers both were not found to take efforts for
feeding the child or motivating him/her to consume the meal. Also it was found to be a
general practice among anganwadi workers to serve the child twice in his/her Tiffin box:
once for partial eating at anganwadi centre and secondly when the child is about the leave
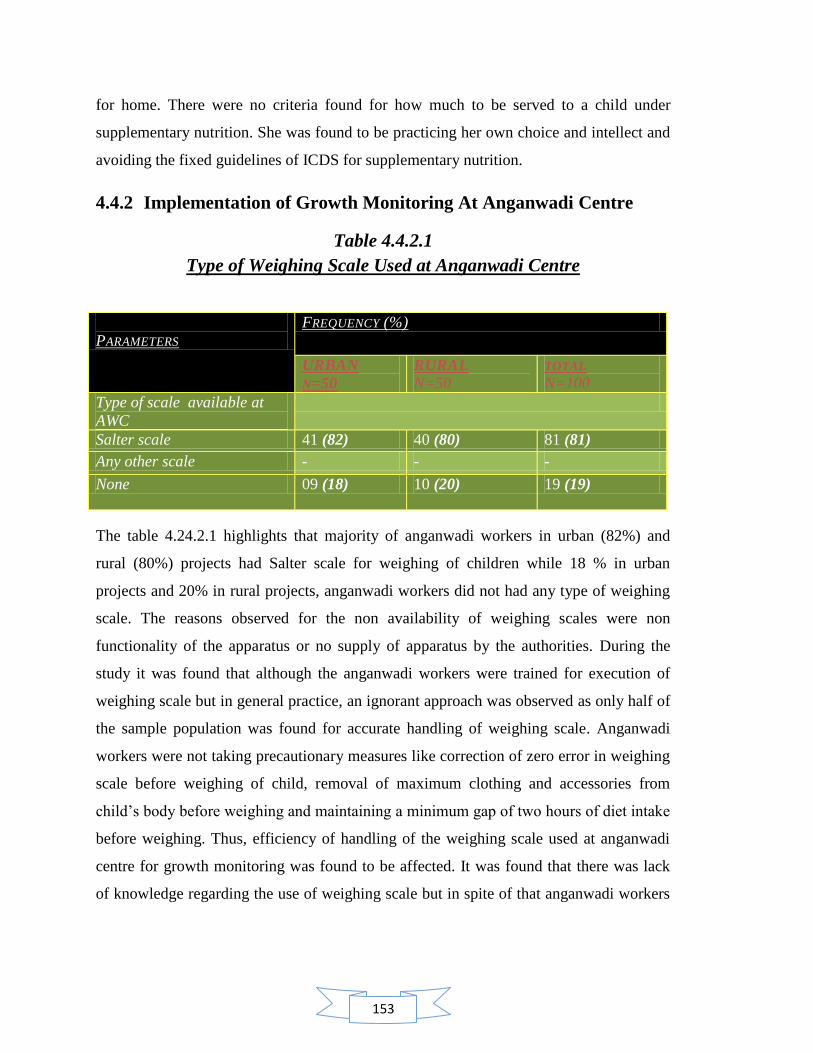
153
for home. There were no criteria found for how much to be served to a child under
supplementary nutrition. She was found to be practicing her own choice and intellect and
avoiding the fixed guidelines of ICDS for supplementary nutrition.
4.4.2 Implementation of Growth Monitoring At Anganwadi Centre
Table 4.4.2.1
Type of Weighing Scale Used at Anganwadi Centre
PARAMETERS
FREQUENCY (%)
URBAN
N=50
RURAL
N=50 TOTAL
N=100
Type of scale available at
AWC
Salter scale 41 (82) 40 (80) 81 (81)
Any other scale - - -
None 09 (18) 10 (20) 19 (19)
The table 4.24.2.1 highlights that majority of anganwadi workers in urban (82%) and
rural (80%) projects had Salter scale for weighing of children while 18 % in urban
projects and 20% in rural projects, anganwadi workers did not had any type of weighing
scale. The reasons observed for the non availability of weighing scales were non
functionality of the apparatus or no supply of apparatus by the authorities. During the
study it was found that although the anganwadi workers were trained for execution of
weighing scale but in general practice, an ignorant approach was observed as only half of
the sample population was found for accurate handling of weighing scale. Anganwadi
workers were not taking precautionary measures like correction of zero error in weighing
scale before weighing of child, removal of maximum clothing and accessories from
child‘s body before weighing and maintaining a minimum gap of two hours of diet intake
before weighing. Thus, efficiency of handling of the weighing scale used at anganwadi
centre for growth monitoring was found to be affected. It was found that there was lack
of knowledge regarding the use of weighing scale but in spite of that anganwadi workers
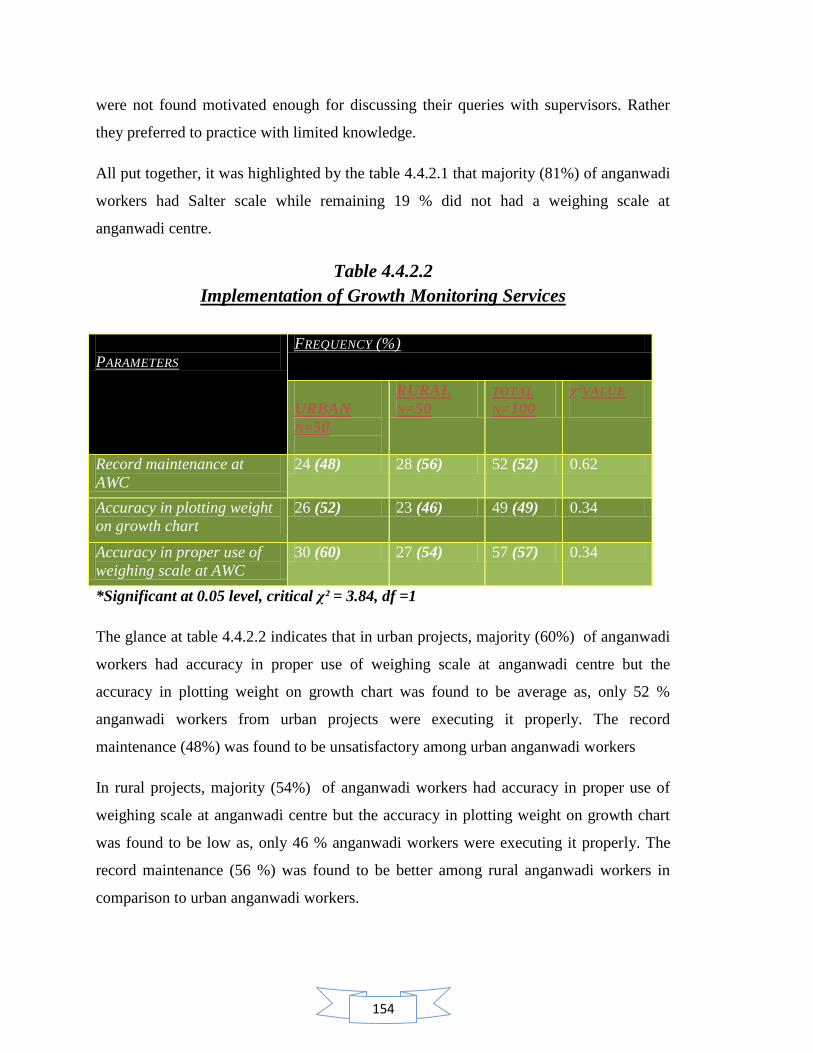
154
were not found motivated enough for discussing their queries with supervisors. Rather
they preferred to practice with limited knowledge.
All put together, it was highlighted by the table 4.4.2.1 that majority (81%) of anganwadi
workers had Salter scale while remaining 19 % did not had a weighing scale at
anganwadi centre.
Table 4.4.2.2
Implementation of Growth Monitoring Services
PARAMETERS
FREQUENCY (%)
URBAN
N=50
RURAL
N=50
TOTAL
N=100
χ²VALUE
Record maintenance at
AWC
24 (48) 28 (56) 52 (52) 0.62
Accuracy in plotting weight
on growth chart
26 (52) 23 (46) 49 (49) 0.34
Accuracy in proper use of
weighing scale at AWC
30 (60) 27 (54) 57 (57) 0.34
*Significant at 0.05 level, critical χ² = 3.84, df =1
The glance at table 4.4.2.2 indicates that in urban projects, majority (60%) of anganwadi
workers had accuracy in proper use of weighing scale at anganwadi centre but the
accuracy in plotting weight on growth chart was found to be average as, only 52 %
anganwadi workers from urban projects were executing it properly. The record
maintenance (48%) was found to be unsatisfactory among urban anganwadi workers
In rural projects, majority (54%) of anganwadi workers had accuracy in proper use of
weighing scale at anganwadi centre but the accuracy in plotting weight on growth chart
was found to be low as, only 46 % anganwadi workers were executing it properly. The
record maintenance (56 %) was found to be better among rural anganwadi workers in
comparison to urban anganwadi workers.
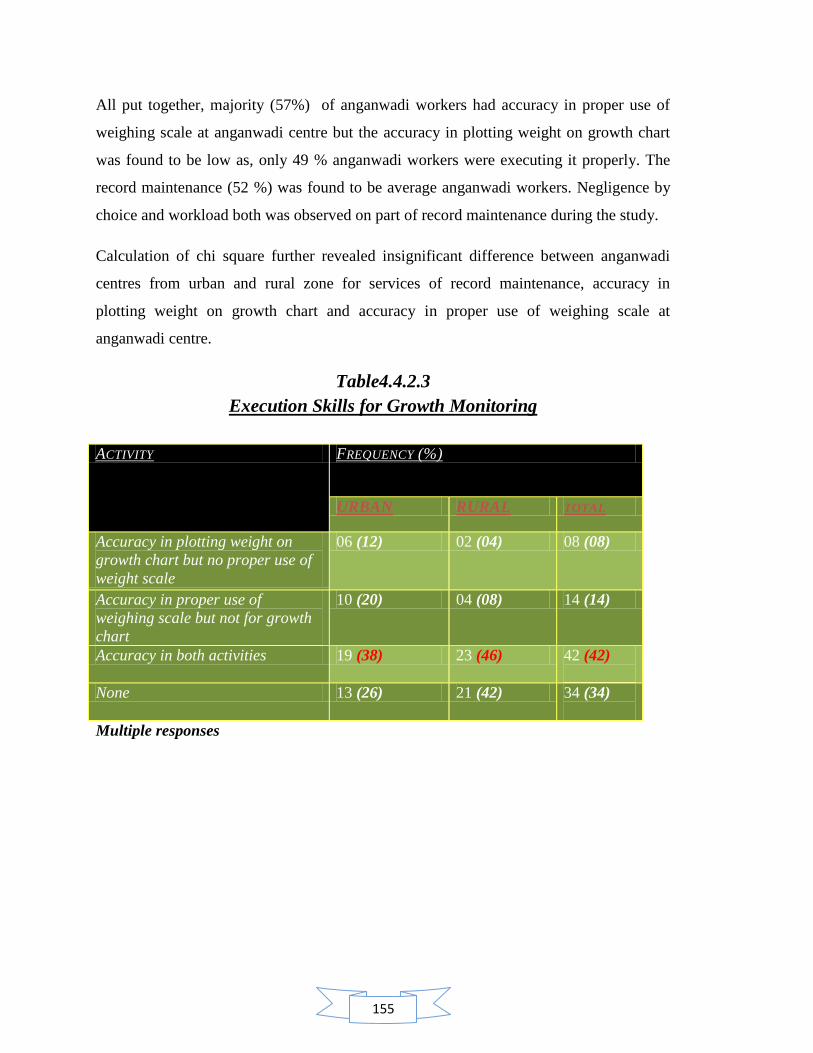
155
All put together, majority (57%) of anganwadi workers had accuracy in proper use of
weighing scale at anganwadi centre but the accuracy in plotting weight on growth chart
was found to be low as, only 49 % anganwadi workers were executing it properly. The
record maintenance (52 %) was found to be average anganwadi workers. Negligence by
choice and workload both was observed on part of record maintenance during the study.
Calculation of chi square further revealed insignificant difference between anganwadi
centres from urban and rural zone for services of record maintenance, accuracy in
plotting weight on growth chart and accuracy in proper use of weighing scale at
anganwadi centre.
Table4.4.2.3
Execution Skills for Growth Monitoring
ACTIVITY FREQUENCY (%)
URBAN RURAL TOTAL
Accuracy in plotting weight on
growth chart but no proper use of
weight scale
06 (12) 02 (04) 08 (08)
Accuracy in proper use of
weighing scale but not for growth
chart
10 (20) 04 (08) 14 (14)
Accuracy in both activities 19 (38) 23 (46) 42 (42)
None 13 (26) 21 (42) 34 (34)
Multiple responses
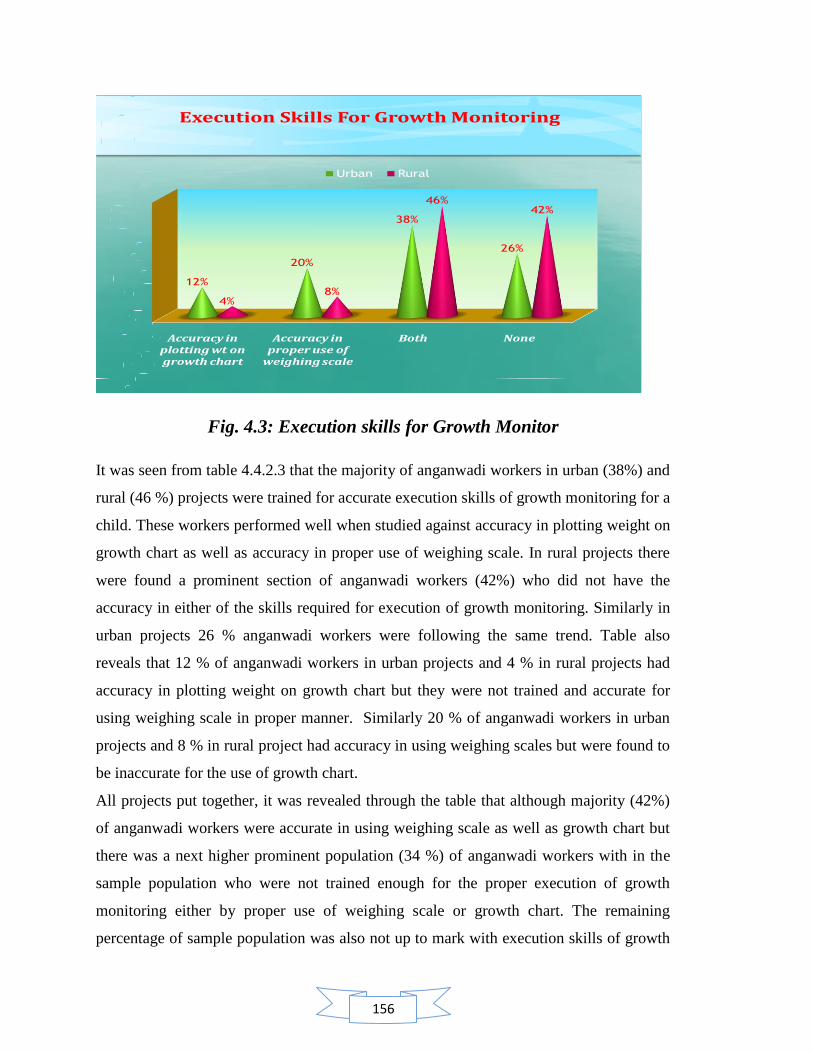
156
Execution Skills For Growth Monitoring
Accuracy in plotting wt on growth chart
Accuracy in proper use of
weighing scale
Both None
12%
20%
38%
26%
4%8%
46%42%
Urban Rural
Fig. 4.3: Execution skills for Growth Monitor
It was seen from table 4.4.2.3 that the majority of anganwadi workers in urban (38%) and
rural (46 %) projects were trained for accurate execution skills of growth monitoring for a
child. These workers performed well when studied against accuracy in plotting weight on
growth chart as well as accuracy in proper use of weighing scale. In rural projects there
were found a prominent section of anganwadi workers (42%) who did not have the
accuracy in either of the skills required for execution of growth monitoring. Similarly in
urban projects 26 % anganwadi workers were following the same trend. Table also
reveals that 12 % of anganwadi workers in urban projects and 4 % in rural projects had
accuracy in plotting weight on growth chart but they were not trained and accurate for
using weighing scale in proper manner. Similarly 20 % of anganwadi workers in urban
projects and 8 % in rural project had accuracy in using weighing scales but were found to
be inaccurate for the use of growth chart.
All projects put together, it was revealed through the table that although majority (42%)
of anganwadi workers were accurate in using weighing scale as well as growth chart but
there was a next higher prominent population (34 %) of anganwadi workers with in the
sample population who were not trained enough for the proper execution of growth
monitoring either by proper use of weighing scale or growth chart. The remaining
percentage of sample population was also not up to mark with execution skills of growth
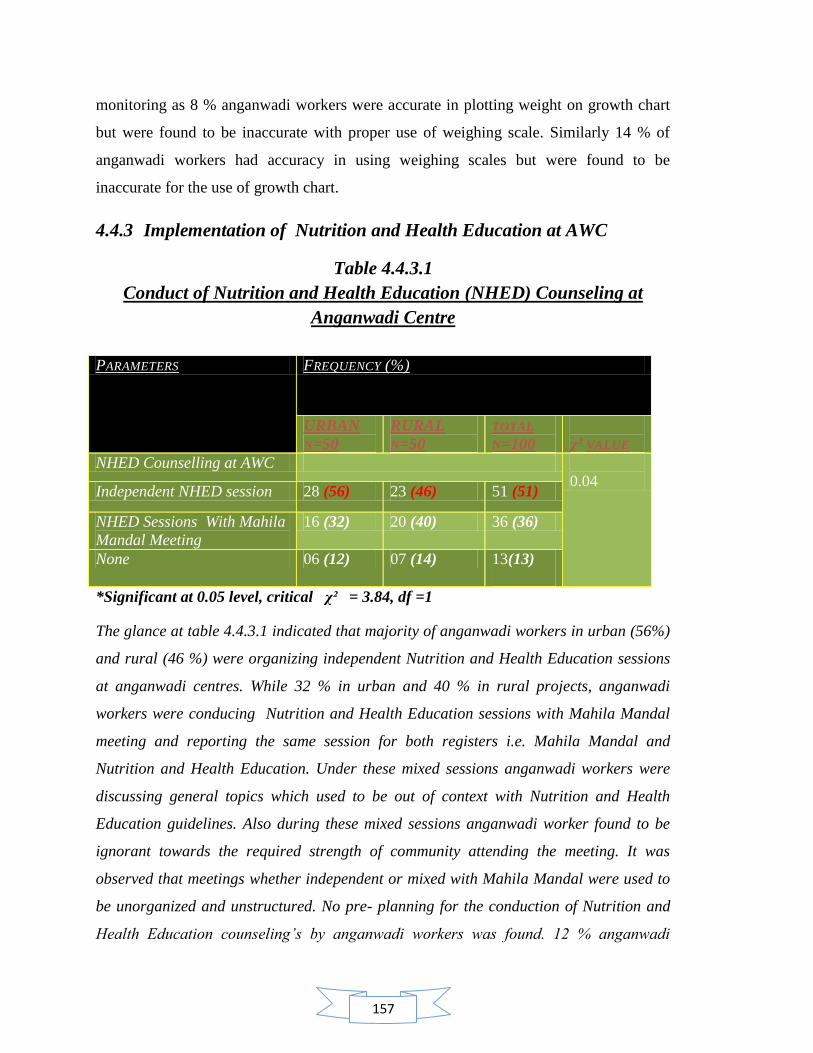
157
monitoring as 8 % anganwadi workers were accurate in plotting weight on growth chart
but were found to be inaccurate with proper use of weighing scale. Similarly 14 % of
anganwadi workers had accuracy in using weighing scales but were found to be
inaccurate for the use of growth chart.
4.4.3 Implementation of Nutrition and Health Education at AWC
Table 4.4.3.1
Conduct of Nutrition and Health Education (NHED) Counseling at
Anganwadi Centre
PARAMETERS FREQUENCY (%)
URBAN
N=50
RURAL
N=50
TOTAL
N=100
χ² VALUE
NHED Counselling at AWC
0.04 Independent NHED session 28 (56) 23 (46) 51 (51)
NHED Sessions With Mahila
Mandal Meeting
16 (32) 20 (40) 36 (36)
None 06 (12) 07 (14) 13(13)
*Significant at 0.05 level, critical χ² = 3.84, df =1
The glance at table 4.4.3.1 indicated that majority of anganwadi workers in urban (56%)
and rural (46 %) were organizing independent Nutrition and Health Education sessions
at anganwadi centres. While 32 % in urban and 40 % in rural projects, anganwadi
workers were conducing Nutrition and Health Education sessions with Mahila Mandal
meeting and reporting the same session for both registers i.e. Mahila Mandal and
Nutrition and Health Education. Under these mixed sessions anganwadi workers were
discussing general topics which used to be out of context with Nutrition and Health
Education guidelines. Also during these mixed sessions anganwadi worker found to be
ignorant towards the required strength of community attending the meeting. It was
observed that meetings whether independent or mixed with Mahila Mandal were used to
be unorganized and unstructured. No pre- planning for the conduction of Nutrition and
Health Education counseling’s by anganwadi workers was found. 12 % anganwadi
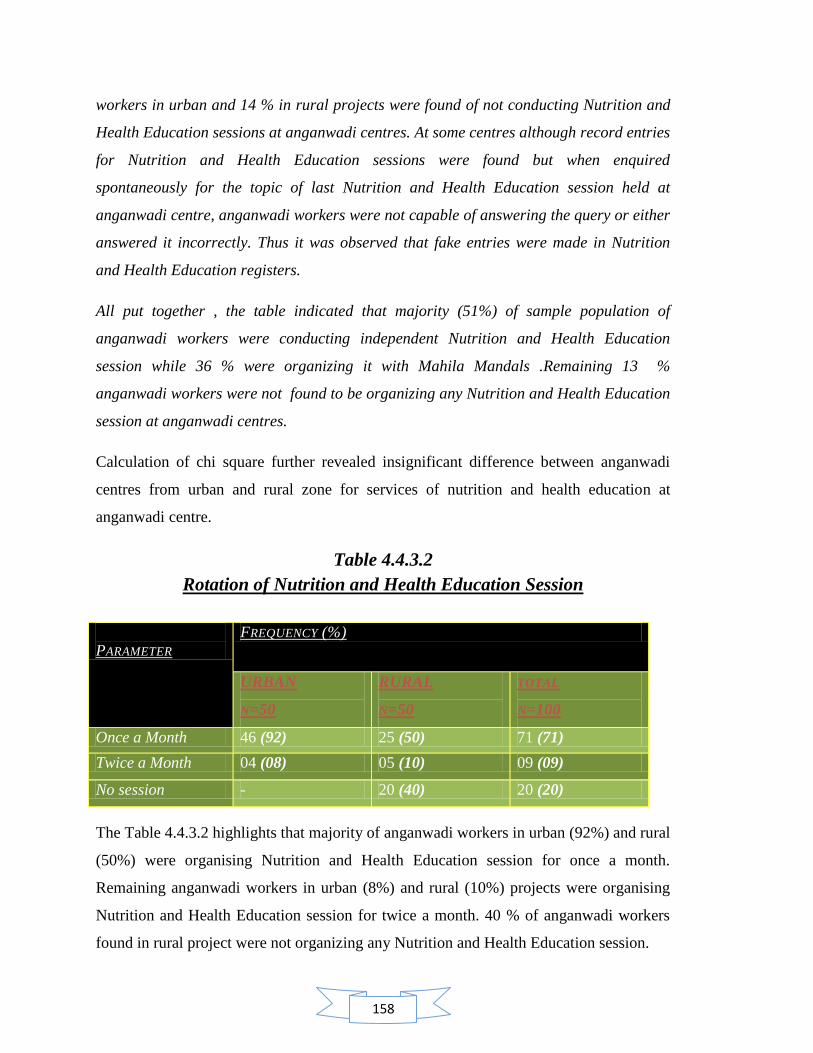
158
workers in urban and 14 % in rural projects were found of not conducting Nutrition and
Health Education sessions at anganwadi centres. At some centres although record entries
for Nutrition and Health Education sessions were found but when enquired
spontaneously for the topic of last Nutrition and Health Education session held at
anganwadi centre, anganwadi workers were not capable of answering the query or either
answered it incorrectly. Thus it was observed that fake entries were made in Nutrition
and Health Education registers.
All put together , the table indicated that majority (51%) of sample population of
anganwadi workers were conducting independent Nutrition and Health Education
session while 36 % were organizing it with Mahila Mandals .Remaining 13 %
anganwadi workers were not found to be organizing any Nutrition and Health Education
session at anganwadi centres.
Calculation of chi square further revealed insignificant difference between anganwadi
centres from urban and rural zone for services of nutrition and health education at
anganwadi centre.
Table 4.4.3.2
Rotation of Nutrition and Health Education Session
PARAMETER
FREQUENCY (%)
URBAN
N=50
RURAL
N=50
TOTAL
N=100
Once a Month 46 (92) 25 (50) 71 (71)
Twice a Month 04 (08) 05 (10) 09 (09)
No session - 20 (40) 20 (20)
The Table 4.4.3.2 highlights that majority of anganwadi workers in urban (92%) and rural
(50%) were organising Nutrition and Health Education session for once a month.
Remaining anganwadi workers in urban (8%) and rural (10%) projects were organising
Nutrition and Health Education session for twice a month. 40 % of anganwadi workers
found in rural project were not organizing any Nutrition and Health Education session.
159
All put together, the table 4.4.3.2 highlighted that majority (71%) of anganwadi workers
were organizing Nutrition and Health Education session for once a month only while 9 %
were doing the same for twice a month. 20 % anganwadi workers were completely
ignoring the conduction of Nutrition and Health Education session.
During the study it was observed that many of the anganwadi workers were even not
aware of mandatory guidelines of organizing two independent sessions of Nutrition and
Health Education in a month. It was also observed that anganwadi workers were not
confident and motivated enough of personating themselves as a nutrition and health
educator for these sessions. They also reported the non corporation of community for
these sessions and thus found helpless enough to conduct the sessions with in the
schedule.
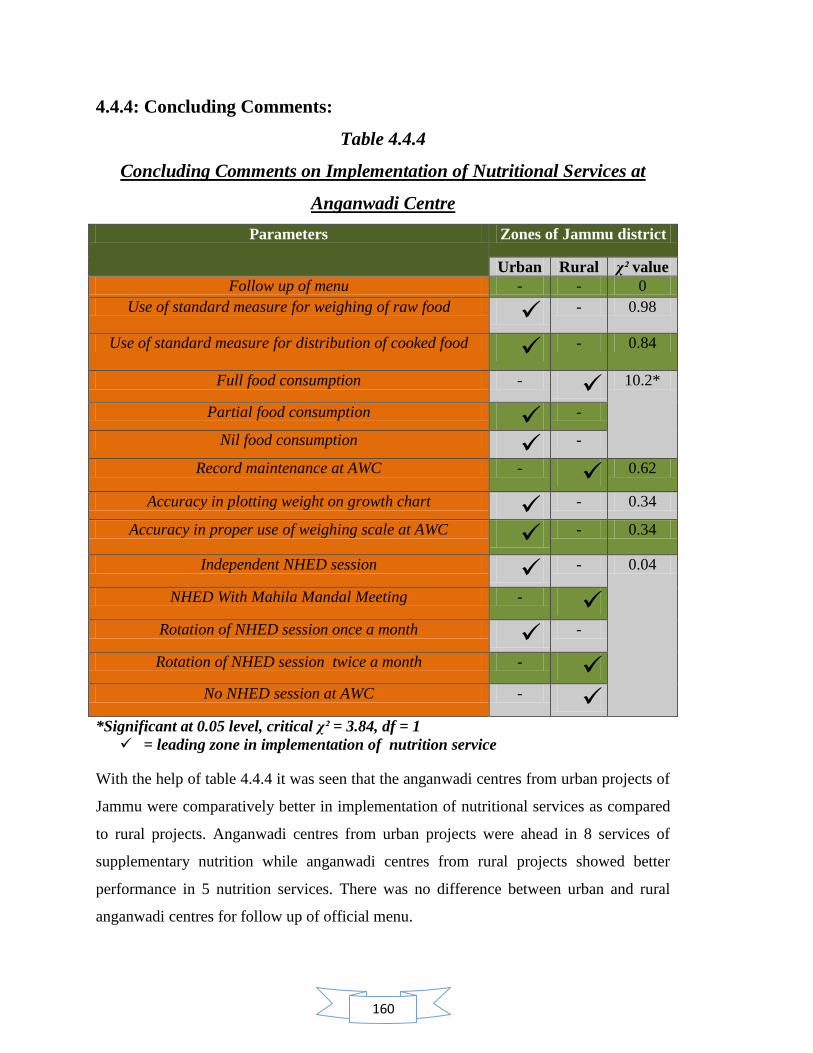
160
4.4.4: Concluding Comments:
Table 4.4.4
Concluding Comments on Implementation of Nutritional Services at
Anganwadi Centre
Parameters Zones of Jammu district
Urban Rural χ² value
Follow up of menu - - 0
Use of standard measure for weighing of raw food - 0.98
Use of standard measure for distribution of cooked food - 0.84
Full food consumption - 10.2*
Partial food consumption -
Nil food consumption -
Record maintenance at AWC - 0.62
Accuracy in plotting weight on growth chart - 0.34
Accuracy in proper use of weighing scale at AWC - 0.34
Independent NHED session - 0.04
NHED With Mahila Mandal Meeting -
Rotation of NHED session once a month -
Rotation of NHED session twice a month -
No NHED session at AWC -
*Significant at 0.05 level, critical χ² = 3.84, df = 1
= leading zone in implementation of nutrition service
With the help of table 4.4.4 it was seen that the anganwadi centres from urban projects of
Jammu were comparatively better in implementation of nutritional services as compared
to rural projects. Anganwadi centres from urban projects were ahead in 8 services of
supplementary nutrition while anganwadi centres from rural projects showed better
performance in 5 nutrition services. There was no difference between urban and rural
anganwadi centres for follow up of official menu.
161
The table also revealed further on calculation of chi square that out of all the services, the
service of supplementary food consumption by children showed a highly significant
difference between anganwadi centres of urban and rural zone. For rest of the services,
there was found no significant difference.

162
Contents:
4.5 Nutritional awareness among anganwadi workers of rural and urban zone of Jammu
district.
4.5.1 Awareness among anganwadi workers regarding health and nutrition
4.5.2 Awareness among anganwadi workers regarding functions of food and
their sources
4.5.3 Awareness among anganwadi workers regarding nutritional
requirement
4.5.4 Awareness among anganwadi workers regarding community nutrition
4.5.5 Awareness among anganwadi workers regarding deficiency diseases
4.5.6 Awareness among anganwadi workers regarding symptoms and types
of deficiency diseases
4.5.7 Concluding comments
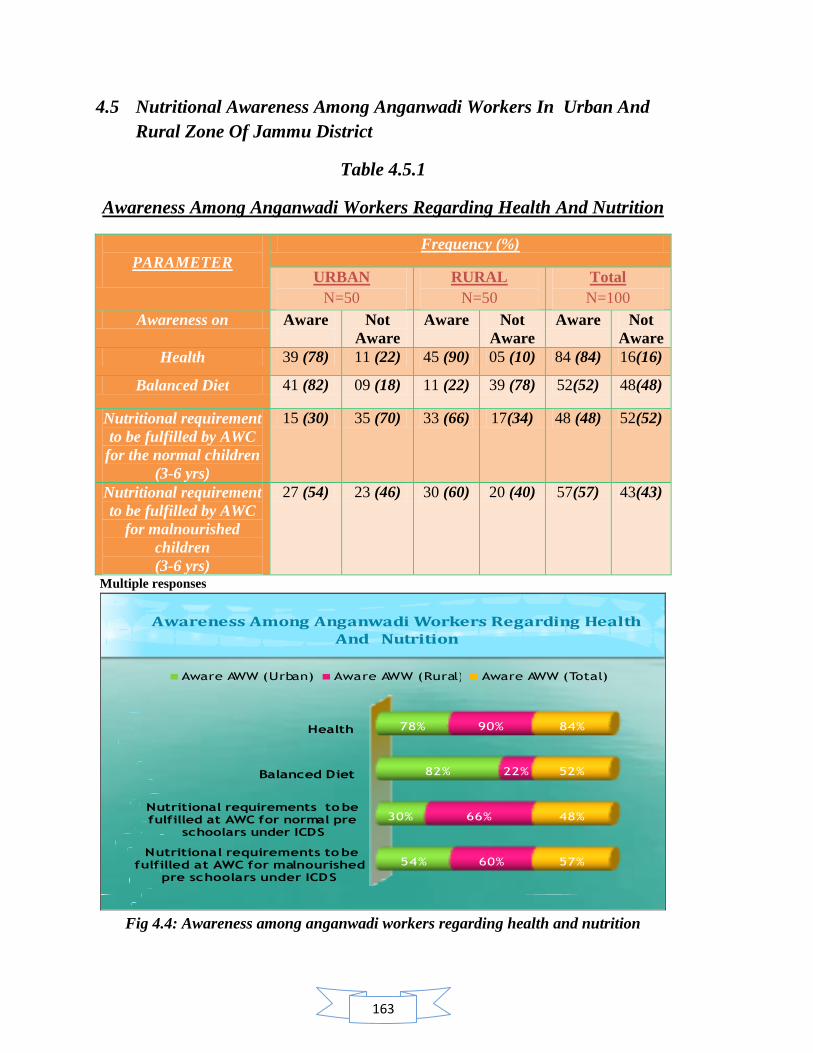
163
4.5 Nutritional Awareness Among Anganwadi Workers In Urban And
Rural Zone Of Jammu District
Table 4.5.1
Awareness Among Anganwadi Workers Regarding Health And Nutrition
PARAMETER
Frequency (%)
URBAN
N=50
RURAL
N=50
Total
N=100
Awareness on Aware
Not
Aware
Aware Not
Aware
Aware Not
Aware
Health 39 (78) 11 (22) 45 (90) 05 (10) 84 (84) 16(16)
Balanced Diet 41 (82) 09 (18) 11 (22) 39 (78) 52(52) 48(48)
Nutritional requirement
to be fulfilled by AWC
for the normal children
(3-6 yrs)
15 (30) 35 (70) 33 (66) 17(34) 48 (48) 52(52)
Nutritional requirement
to be fulfilled by AWC
for malnourished
children
(3-6 yrs)
27 (54) 23 (46) 30 (60) 20 (40) 57(57) 43(43)
Multiple responses
Awareness Among Anganwadi Workers Regarding Health And Nutrition
Nutritional requirements to be fulfilled at AWC for malnourished
pre schoolars under ICDS
Nutritional requirements to be fulfilled at AWC for normal pre
schoolars under ICDS
Balanced Diet
Health
54%
30%
82%
78%
60%
66%
22%
90%
57%
48%
52%
84%
Aware AWW (Urban) Aware AWW (Rural) Aware AWW (Total)
Fig 4.4: Awareness among anganwadi workers regarding health and nutrition
164
The glance at table 4.5.1 suggested that majority of anganwadi workers in urban projects
had sufficient awareness about balanced diet (82%), followed by awareness about health
(78%). The table reflected the fact that in-spite of trained status of anganwadi workers,
the awareness regarding the caloric requirement for normal pre schoolars and
malnourished children in ICDS was not satisfactory as the percentage found among
anganwadi workers for these parameters was comparatively low i.e. 30 % and 54 %
respectively.
On the other hand , it was found that majority of anganwadi workers in rural projects had
sufficient awareness about health but they were not clear with the concept of balanced
diet as the percentage (22%) found among anganwadi workers was quite unsatisfactory.
Also it was revealed through the table that anganwadi workers were in rural project had
average awareness about the caloric requirement for pre schoolars and malnourished
children in ICDS. The percentage found for these parameters was 66 % and 60 %
respectively. It was interesting to know that in-spite of less awareness about the concept
of balanced diet among rural anganwadi workers; the need of calorie requirement for pre
schoolars and malnourished children in ICDS was the familiar knowledge to them in
comparison to anganwadi workers from urban projects.
All put together the table revealed that larger section of anganwadi workers had sufficient
awareness about health (84 %) but the awareness regarding the caloric requirement of
supplementary food for pre schoolars at anganwadi centre (48%), balanced diet (52%)
and caloric need of supplementary food for malnourished children at anganwadi centre
(57%) were not found to be up to the mark.

165
Table 4.5.2
Awareness Among Anganwadi Workers Regarding Functions Of Food
And Their Sources
PARAMETER
FREQUENCY (%)
URBAN
N= 50
RURAL
N=50
TOTAL
N=100
Awareness on Aware
Not
Aware Aware
Not
Aware Aware
Not
Aware
Energy foods 13 (26) 37 (74)
12 (24) 38 (76) 25 (25) 75(75)
Body building
foods 30 (60) 20 (40)
26 (52) 24 (48) 56 (56) 44(44)
Protective foods 17 (34) 33(66)
03 (06) 47(94) 20 (20) 80(80)
Pulses as a rich
source 42 (84) 08 (16)
35 (70) 15(30) 77 (77) 23(23)
Cereals as a rich
source 14 (28) 36 (72)
27 (54) 23(46) 41 (41) 59 (59)
Multiple responses
Awareness Among Anganwadi Workers Regarding Functions Of Food And Their Sources
Cereals as rich source
Pulses as rich source
Pro te ctiv e fo o ds
Body building foods
Energy foods
28%
84%
34%
60%
26%
54%
70%
6%
52%
2 4 %
41%
77%
20%
56%
25%
Aware AWW (Urban) Aware AWW (Rura l) Aware AWW (Tota l)
Fig .4.5 Awareness among anganwadi workers regarding functions of food and their
sources
It was seen from the table 4.5.2, majority of anganwadi workers in urban (60%) and rural
(52%) projects were aware about the body building foods. The awareness about energy
166
foods (26 % and 24 %) and protective foods (34% and 06%) was found to be
unsatisfactory among anganwadi workers from both urban as well as rural projects
respectively. The table highlighted the fact that the knowledge and awareness regarding
the functions of food was limited only to growth function of food as majority of
anganwadi workers were familiar to availability of body building foods and the nutrients
it provides but were least familiar with other important role of food as energy needs and
protection from diseases and the nutrients required for these roles. The data of the table
revealed that anganwadi workers from rural projects had low awareness in comparison to
urban anganwadi workers regarding the nutrients required for various functions of food.
Similarly, it was seen from the above table that majority of anganwadi workers in urban
(84%) and rural (70%) projects had sufficient awareness regarding the pulses and its
main nutrient: protein but again they were lacking in awareness regarding the importance
of cereals and millets which provides carbohydrates as main energy giving food. The
awareness about cereals among anganwadi workers in urban (28 %) and rural (54%)
projects was not found to be satisfactory. Collectively the table highlighted the fact that
the training of anganwadi workers was more emphasised on the importance of protein, its
role and its food sources while the other important aspects of food in context of protein
energy malnutrition management were neglected.
All put together, the table revealed that majority of anganwadi workers were aware about
the pulses and its main nutrient: protein (77%), followed by the awareness of body
building foods (56%). It was highlighted by the table that nutrients required for various
functions of food was not clear to the sample population of the study as the percentages
reflected in table in reference to these parameters were unsatisfactory .
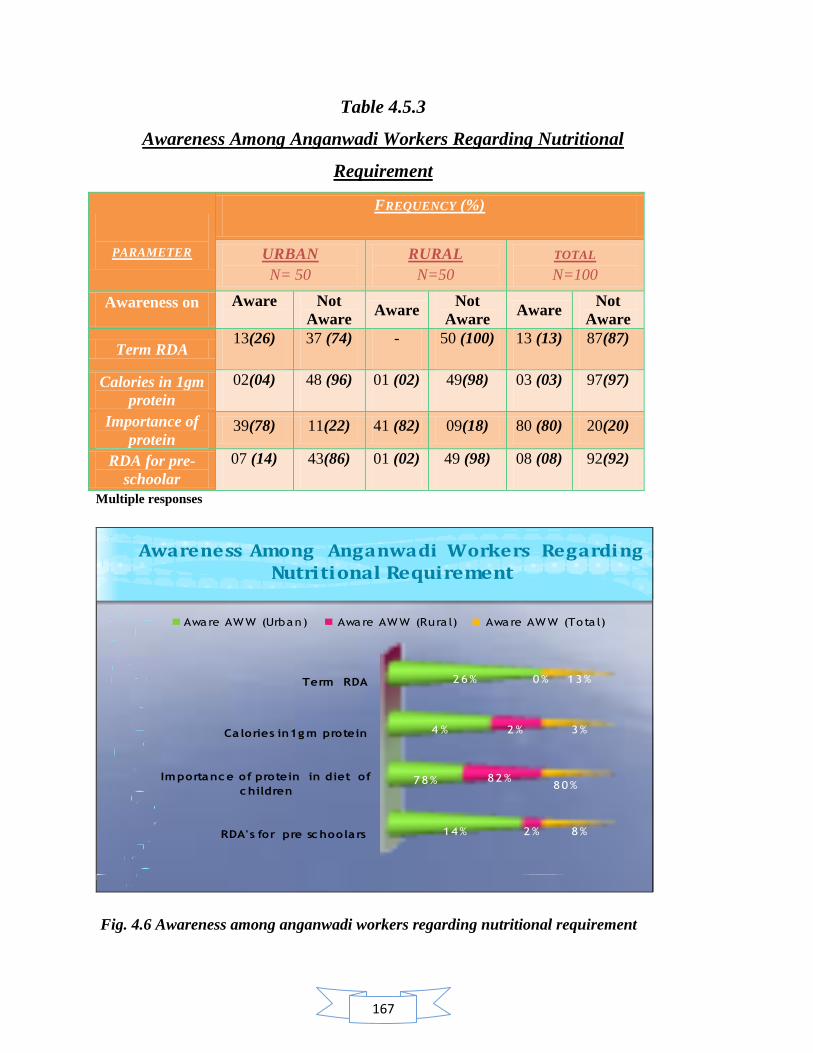
167
Table 4.5.3
Awareness Among Anganwadi Workers Regarding Nutritional
Requirement
PARAMETER
FREQUENCY (%)
URBAN
N= 50
RURAL
N=50
TOTAL
N=100
Awareness on Aware
Not
Aware Aware
Not
Aware Aware
Not
Aware
Term RDA 13(26) 37 (74) - 50 (100) 13 (13) 87(87)
Calories in 1gm
protein
02(04) 48 (96) 01 (02) 49(98) 03 (03) 97(97)
Importance of
protein 39(78) 11(22) 41 (82) 09(18) 80 (80) 20(20)
RDA for pre-
schoolar
07 (14) 43(86) 01 (02) 49 (98) 08 (08) 92(92)
Multiple responses
Awareness Among Anganwadi Workers Regarding Nutritional Requirement
RDA's for pre sc hoolars
Importanc e of protein in diet of
c hildren
Ca lories in1g m protein
Term RDA
14%
78%
4 %
26%
2%
82%
2%
0%
8%
80%
3%
13%
Aware AWW (Urban) Aware AWW (Rura l) Aware AWW (Tota l)
Fig. 4.6 Awareness among anganwadi workers regarding nutritional requirement

168
It is seen from the table 4.5.3 that majority of anganwadi workers in urban (78%) and
rural (82%) projects had sufficient awareness regarding the importance of protein in
children‘s diet. It is also evident from the table that in urban projects, only 26 %
anganwadi workers were familiar with the term RDA while 2 % had awareness about the
amount of calories present in 1 gm protein and only 14 % anganwadi workers were aware
with the RDA‘s for pre schoolars.
On the other hand in rural projects it was found that anganwadi workers were completely
unaware about the term RDA while only 2 % anganwadi workers had awareness
regarding caloric content of 1gm protein and as well as about RDA for pre schoolars. The
data of table highlighted the fact that anganwadi workers were lacking in technical
knowledge of nutritional requirements as the percentages were found to be unsatisfactory.
The rural anganwadi workers were more unaware regarding these parameters in
comparison to urban anganwadi workers.
All put together the table revealed that majority of anganwadi workers had awareness
regarding the importance of protein in diet of children but the awareness about the other
nutrition parameters were found to be unsatisfactory.
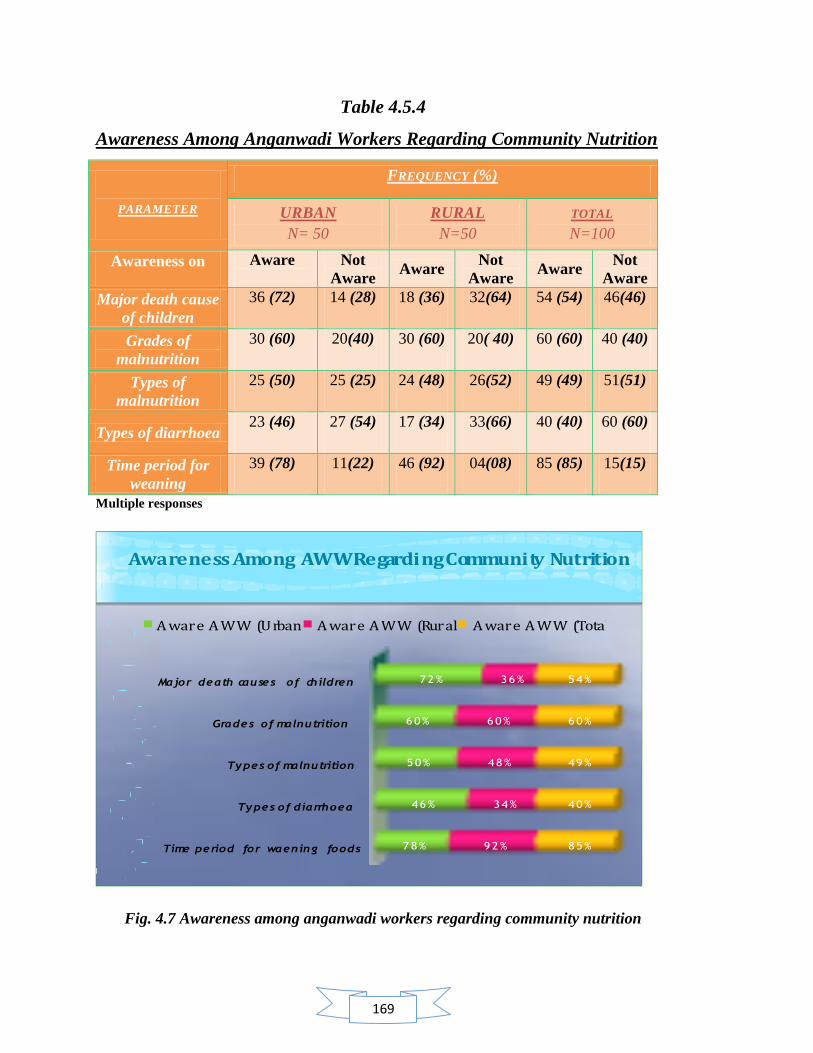
169
Table 4.5.4
Awareness Among Anganwadi Workers Regarding Community Nutrition
PARAMETER
FREQUENCY (%)
URBAN
N= 50
RURAL
N=50
TOTAL
N=100
Awareness on Aware
Not
Aware Aware
Not
Aware Aware
Not
Aware
Major death cause
of children
36 (72) 14 (28) 18 (36) 32(64) 54 (54) 46(46)
Grades of
malnutrition
30 (60) 20(40) 30 (60) 20( 40) 60 (60) 40 (40)
Types of
malnutrition
25 (50) 25 (25) 24 (48) 26(52) 49 (49) 51(51)
Types of diarrhoea 23 (46) 27 (54) 17 (34) 33(66) 40 (40) 60 (60)
Time period for
weaning
39 (78) 11(22) 46 (92) 04(08) 85 (85) 15(15)
Multiple responses
Awareness Among AWW Regarding Community Nutrition
Time period for waening foods
Types of diarrhoea
Types of malnutrition
Grades of malnutrition
Major death causes of children
78%
46%
50%
60%
72%
92%
34%
48%
60%
36%
85%
40%
49%
60%
54%
A ware A WW (Urban) A ware A WW (Rural) A ware A WW (Total)
Fig. 4.7 Awareness among anganwadi workers regarding community nutrition
170
It is seen from table 4.5.4 that in urban projects 72 % anganwadi workers were aware
about the death cause of children below five years in country which is malnutrition and
60 % had awareness regarding the grades of malnutrition but only 50 % anganwadi
workers were familiar with the various types of malnutrition.78 % anganwadi workers in
urban projects had awareness about the time period of inclusion of weaning food in
infant‘s diet and 46 % anganwadi workers were familiar with types of diarrhoea.
Similarly in rural projects, 36 % anganwadi workers were aware about the death cause of
children in country which is malnutrition and 60 % had awareness regarding the grades of
malnutrition but only 48 % anganwadi workers were familiar with the various types of
malnutrition.92 % anganwadi workers in rural projects had awareness about the time
period of inclusion of weaning food in infant‘s diet and 34 % anganwadi workers were
familiar with types of diarrhoea. The data of the table revealed that rural anganwadi
workers were less familiar in comparison to urban anganwadi workers, with the severity
of problem of malnutrition as a major threat to child survival as only 36 % identified
malnutrition as a death cause of children in country.
All put together, the table highlighted that 54 % anganwadi workers were aware about the
death cause of children in country which is malnutrition and 60 % had awareness
regarding the grades of malnutrition but only 49 % anganwadi workers were familiar
with the various types of malnutrition.85 % anganwadi workers had awareness about the
time period of inclusion of weaning food in infant‘s diet and 40 % anganwadi workers
were familiar with types of diarrhoea. The data of the table highlighted the fact that more
intense and focused training content is required on the diseases like malnutrition and
diarrhoea as the awareness of anganwadi workers on these diseases was quite
unsatisfactory.

171
Table 4.5.5
Awareness Among Anganwadi Workers Regarding Deficiency Diseases
PARAMETER
FREQUENCY (%)
URBAN
N=50
RURAL
N=50
TOTAL
N=100
Awareness on Aware
Not
Aware
Aware Not
Aware
Aware Not
Aware
Cause of Weak
Eyesight
44 (88) 06(12) 44 (88) 06(12) 88 (88) 12(12)
Cause of Night
Blindness
35 (70) 15(30) 32 (64) 18(36) 67 (67) 33(33)
Cause of Beri -
Beri
19 (38) 31(62) 02 (04) 48(96) 21 (21) 79(79)
Cause of
Scurvy
19 (38) 31(62) 19 (38) 31(62) 38 (38) 62(62)
Cause of
Anaemia
45 (90) 05(10) 43 (86) 07(14) 88 (88) 12(12)
Cause of Goitre 47 (94) 03(06) 45 (90) 05(10) 92 (92) 08(08)
Multiple responses
AWARENESS AMONG ANGANWADI WORKERS REGARDING
DEFICIENCY DISEASES
Cause of Goitre
Cause of Anaemia
Cause of Scurvy
Cause of Beri-Beri
Cause of Night Blindness
Causes of weak eyesight
94%
90%
38%
38%
70%
88%
90%
86%
38%
4%
64%
88%
92%
88%
38%
21%
67%
88%
Aware AWW (Urban) Aware AWW (Rural) Aware AWW (Total)
Fig. 4.8 Awareness among anganwadi workers regarding deficiency diseases
172
The table 4.5.5 highlighted that majority of anganwadi workers were aware regarding the
Vitamin A deficiency, Anaemia and Goitre but they were less familiar with Vitamin B
and C deficiency diseases. In urban projects, 88 % anganwadi workers were aware that
Vitamin A deficiency can cause weakness of eyesight, 70 % anganwadi workers replied
that night blindness occurs due to Vitamin A deficiency, 90 % replied that anaemia
occurs due to deficiency of iron and folic acid, 94 % were familiar that goitre occurs due
to iodine deficiency while very less (38%) anganwadi workers identified the cause of
deficiency diseases like Beri beri and scurvy.
Similarly, in rural projects 88 % anganwadi workers were aware that Vitamin A
deficiency can cause weakness of eyesight, 64 % anganwadi workers replied that night
blindness occurs due to Vitamin A deficiency, 86 % replied that anaemia occurs due to
deficiency of iron and folic acid, 90 % were familiar that goitre occurs due to iodine
deficiency while 38% anganwadi workers identified the cause of deficiency disease
scurvy and only 4 % identified the cause of deficiency disease Beri beri. The table clearly
revealed that rural anganwadi workers were unaware about the Vitamin B deficiency
diseases and were also less familiar with Vitamin C deficiency diseases in comparison to
urban anganwadi workers. All put together, the table indicated that 88 % anganwadi
workers were aware that Vitamin A deficiency can cause weakness of eyesight, 67 %
anganwadi workers replied that night blindness occurs due to Vitamin A deficiency, 88 %
replied that anaemia occurs due to deficiency of iron and folic acid, 92 % were familiar
that goitre occurs due to iodine deficiency while 38% anganwadi workers identified the
cause of deficiency disease scurvy and 21 % identified the cause of deficiency disease
Beri beri. During the study, on further interactions with anganwadi workers, it was
explored that although the anganwadi workers had some knowledge of deficiency
diseases but they were least familiar with dietary management of these deficiency
diseases. Since an anganwadi worker plays the role of nutrition educator for beneficiaries
and community, it is very important for her to have a sound knowledge of dietary
management of these deficiency diseases after its identification through various signs and
symptoms. The interactions made during study revealed that since anganwadi workers
had poor knowledge of various food sources of micronutrients they were found to be
weak in her nutrition counseling skills

173
Table 4.5.6
Awareness Among Anganwadi Workers Regarding Symptoms And Types
Of Deficiency Diseases
PARAMETER
FREQUENCY (%)
URBAN
N=50
RURAL
N=50
TOTAL
N=50
Awareness on Aware
Not
Aware
Aware Not
Aware
Aware Not
Aware
Paleness of eyes and
nails as a symptom of
anaemia
47 (94) 03 (06) 46 (92) 04(08) 93 (93) 07(07)
Bleeding gums as a
symptom of Vitamin C
31 (62) 19 (38) 12 (24) 38(76) 43(43) 57(57)
Symptoms of
malnutrition
43 (86) 07 (14) 42 (84) 08(16) 85 (85) 15 (15)
Types of malnutrition
occurs due to PEM
35 (70) 15 (30) 28 (56) 22(44) 63 (63) 37(37)
Multiple responses
Fig: 4.9 Awareness among anganwadi workers regarding symptoms and types of
deficiency diseases
174
The table 4.5.6 indicated that majority of anganwadi workers in urban projects had
sufficient awareness regarding the various symptoms and types of deficiency diseases.
94% anganwadi workers were aware about the paleness of eyes and nails as a symptom
of anaemia, 86% anganwadi workers were familiar with the symptoms of malnutrition,
70% anganwadi workers identified the types of malnutrition and 62 % anganwadi
workers had awareness about bleeding gums as a symptom of Vitamin C.
On the other hand, in rural projects 92 % anganwadi workers were aware about the
paleness of eyes and nails as a symptom of anaemia, 84 % anganwadi workers were
familiar with the symptoms of malnutrition, 56 % anganwadi workers identified the types
of malnutrition and 24 % anganwadi workers had awareness about bleeding gums as a
symptom of Vitamin C. It is evident from the table that rural anganwadi workers were
less aware regarding the symptoms of Vitamin C and various types of malnutrition in
comparison to urban anganwadi workers.
All put together, the table highlighted that majority(93%) of anganwadi workers were
aware about the paleness of eyes and nails as a symptom of anaemia, 85 % anganwadi
workers were familiar with the symptoms of malnutrition, 63 % anganwadi workers
identified the types of malnutrition and 43 % anganwadi workers had awareness about
bleeding gums as a symptom of Vitamin C.
It was explored during interactions with anganwadi workers that in spite of the familiarity
of deficiency diseases, anganwadi workers had unsatisfactory awareness about the signs
and symptoms of deficiency diseases. This limited knowledge of her could create
hindrance in identifying a malnourished child or other beneficiary at appropriate time
thus, increasing the severity of the disease. Deficiency diseases are usually considered as
silent sign of poor nutritional status. Being into the role of nutrition educator an
anganwadi must have good skills and knowledge of identifying deficiency diseases and
other critical health status at an appropriate time through sign and symptoms of disease.
By doing so, she could provide nutrition counseling to beneficiaries for the home
management of these diseases through diet and if needed could plan for referral case at
appropriate time.
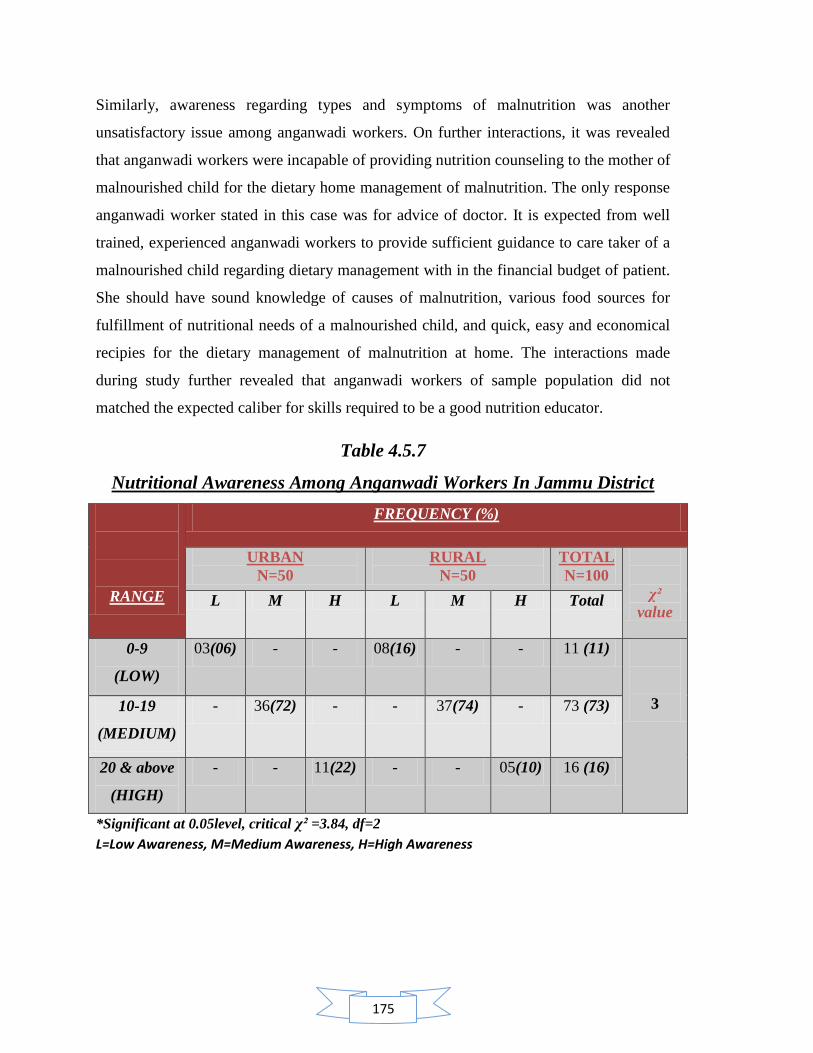
175
Similarly, awareness regarding types and symptoms of malnutrition was another
unsatisfactory issue among anganwadi workers. On further interactions, it was revealed
that anganwadi workers were incapable of providing nutrition counseling to the mother of
malnourished child for the dietary home management of malnutrition. The only response
anganwadi worker stated in this case was for advice of doctor. It is expected from well
trained, experienced anganwadi workers to provide sufficient guidance to care taker of a
malnourished child regarding dietary management with in the financial budget of patient.
She should have sound knowledge of causes of malnutrition, various food sources for
fulfillment of nutritional needs of a malnourished child, and quick, easy and economical
recipies for the dietary management of malnutrition at home. The interactions made
during study further revealed that anganwadi workers of sample population did not
matched the expected caliber for skills required to be a good nutrition educator.
Table 4.5.7
Nutritional Awareness Among Anganwadi Workers In Jammu District
RANGE
FREQUENCY (%)
URBAN
N=50
RURAL
N=50
TOTAL
N=100
χ²
value L M H L M H Total
0-9
(LOW)
03(06) - - 08(16) - - 11 (11)
3 10-19
(MEDIUM)
- 36(72) - - 37(74) - 73 (73)
20 & above
(HIGH)
- - 11(22) - - 05(10) 16 (16)
*Significant at 0.05level, critical χ² =3.84, df=2
L=Low Awareness, M=Medium Awareness, H=High Awareness
176
4.5.7: Concluding Comments:
The table 4.5.7 revealed that majority of anganwadi workers had medium awareness
regarding nutrition in urban projects (72%) and rural projects (74%). The table also
revealed that in aspect of highly aware anganwadi workers, the urban projects (22%) had
more aware anganwadi workers than rural projects (10%). Similarly in aspect of low
awareness it was found that rural projects (16 %) had more anganwadi workers than
urban projects (6%). The reason observed were less interactions between
supervisors/CDPO‘s and anganwadi workers, less visits by supervisors to rural
anganwadi centres because of far flung areas and low confidence and motivation among
anganwadi workers to seek guidance from supervisor regarding any query.
All put together, the table 4.5.7 highlighted that majority (73%) of anganwadi workers
had medium awareness regarding nutrition. 16 % of anganwadi workers had scored for
high awareness of nutrition. Thus the table indicated that, with the help of more précised
and intense training there remains a scope of preparing and promoting medium aware
anganwadi workers to highly aware anganwadi workers.
Calculation of chi square further revealed insignificant difference between nutritional
awareness among anganwadi centres from urban and rural zone of Jammu district.
177
Contents:
4.6 Influence of nutritional awareness of anganwadi worker on implementation of
nutritional services at anganwadi centre
4.6.1 Regression analysis
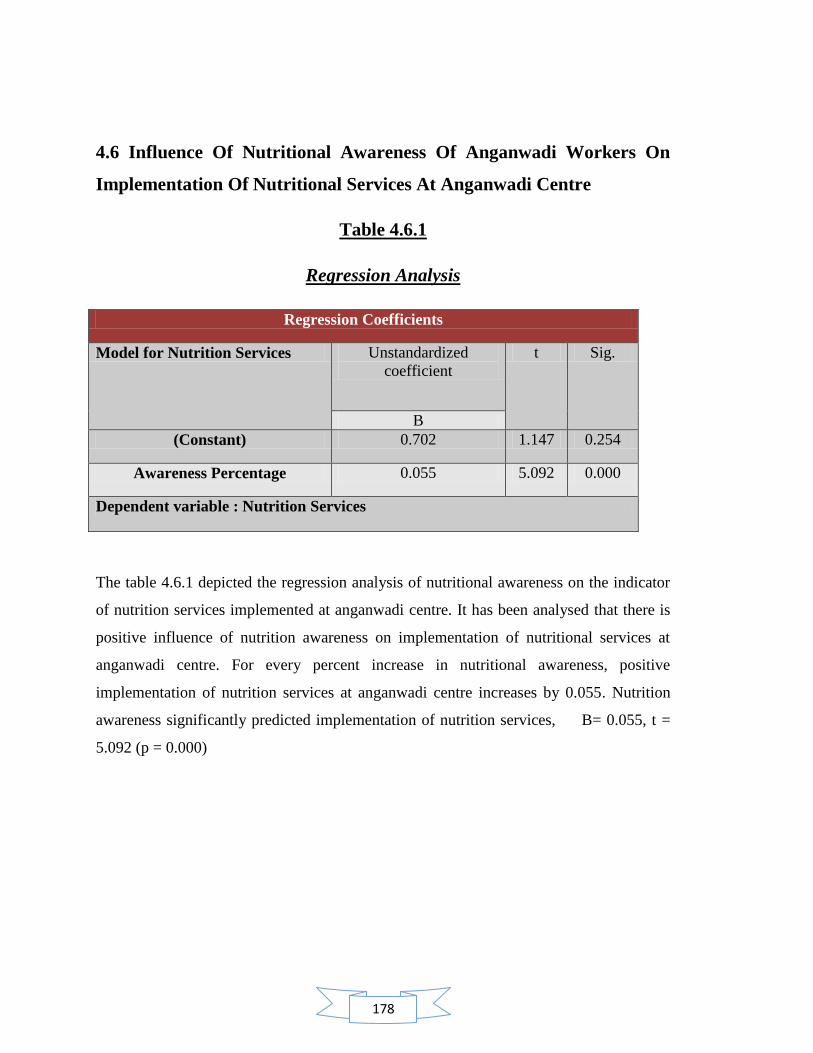
178
4.6 Influence Of Nutritional Awareness Of Anganwadi Workers On
Implementation Of Nutritional Services At Anganwadi Centre
Table 4.6.1
Regression Analysis
Regression Coefficients
Model for Nutrition Services Unstandardized
coefficient
t Sig.
B
(Constant) 0.702 1.147 0.254
Awareness Percentage 0.055 5.092 0.000
Dependent variable : Nutrition Services
The table 4.6.1 depicted the regression analysis of nutritional awareness on the indicator
of nutrition services implemented at anganwadi centre. It has been analysed that there is
positive influence of nutrition awareness on implementation of nutritional services at
anganwadi centre. For every percent increase in nutritional awareness, positive
implementation of nutrition services at anganwadi centre increases by 0.055. Nutrition
awareness significantly predicted implementation of nutrition services, B= 0.055, t =
5.092 (p = 0.000)

179
Contents:
4.7 Comparison for the level of nutritional awareness among anganwadi workers and
their implementation to nutritional services between rural and urban zone of Jammu
district.
4.7.1 Implementation of supplementary nutrition services at anganwadi
centre.
4.7.1.1 Execution of nutritional practices at anganwadi centre.
4.7.1.2 Implementation of supplementary nutritional target at anganwadi
centre.
4.7.1.3 Consumption of supplementary nutrition by children at anganwadi
centre.
4.7.2 Implementation of growth monitoring services at anganwadi centre.
4.7.2.1 Implementation of growth monitoring services.
4.7.2.2 Execution skills for growth monitoring.
4.7.3 Implementation of Nutrition and health education (NHED) at
anganwadi centre.
4.7.3.1 Nutrition and health education counseling
4.7.3.2 Rotation of nutrition and health education sessions
4.7.4 Concluding Comment

180
4.7 Comparison For The Level Of Nutritional Awareness Among Anganwadi
Workers And Their Implementation To Nutritional Services Between Rural
And Urban Zone Of Jammu District
4.7.1 Implementation of Supplementary Nutrition Services at AWC
Table 4.7.1.1
Execution of Nutritional Practices at Anganwadi Centre
PARAMETER
FREQUENCY (%)
URBAN N=50
RURAL N=50
JAMMU DISTRICT N=100
L=03 M=36 H=11 L=08 M=37 H=05 L=11 M=73 H=16
Follow up of menu - 15 (42)
02 (18)
02 (25)
16 (43)
- 02 (18)
31 (42)
02 (13)
Use of standard measure for weighing of raw food
01 (33)
17 (47)
10 (90)
03 (38)
21 (57)
- 04 (36)
38 (52)
10 (63)
Use of standard measure for distribution of cooked food
- 03 (08)
02 (18)
01 (13)
- - - 03 (04)
02 (13)
MULTIPLE RESPONSES
L=Low Awareness, M=Medium Awareness, H=High Awareness
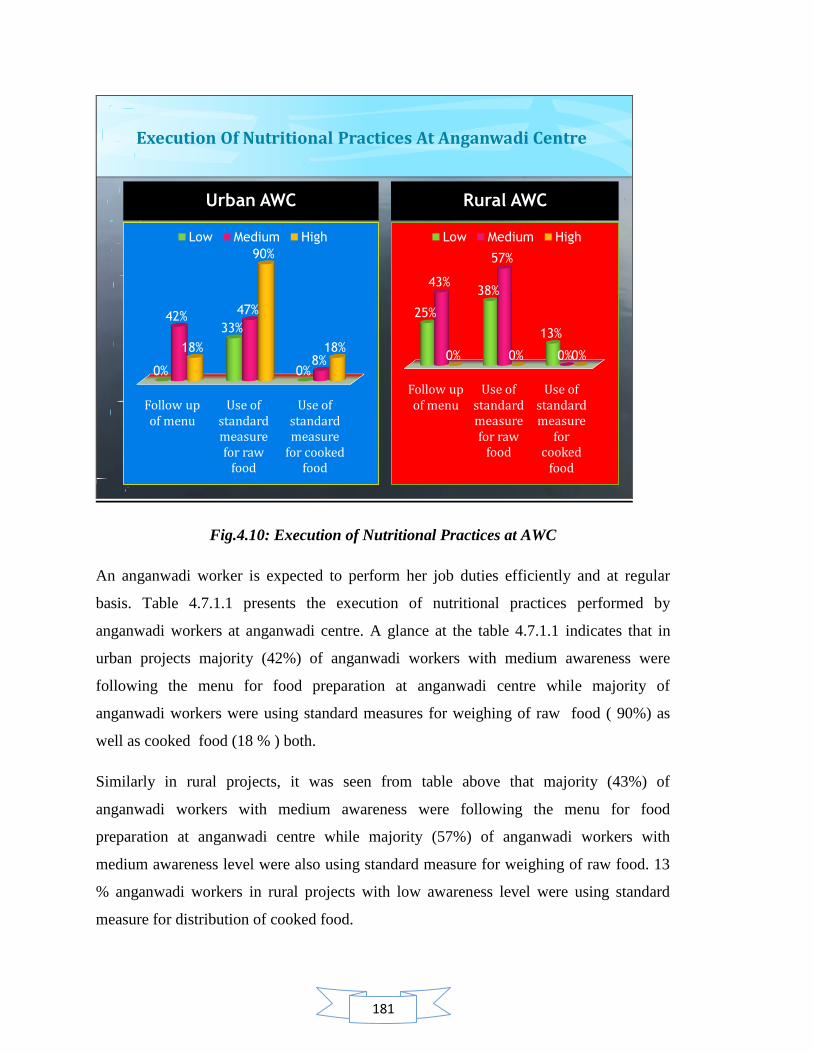
181
Execution Of Nutritional Practices At Anganwadi Centre
Urban AWC
Follow up of menu
Use of standard measure for raw
food
Use of standard measure
for cooked food
0%
33%
0%
42%47%
8%18%
90%
18%
Low Medium High
Rural AWC
Follow up of menu
Use of standard measure for raw
food
Use of standard measure
for cooked
food
25%
38%
13%
43%
57%
0%0% 0% 0%
Low Medium High
Fig.4.10: Execution of Nutritional Practices at AWC
An anganwadi worker is expected to perform her job duties efficiently and at regular
basis. Table 4.7.1.1 presents the execution of nutritional practices performed by
anganwadi workers at anganwadi centre. A glance at the table 4.7.1.1 indicates that in
urban projects majority (42%) of anganwadi workers with medium awareness were
following the menu for food preparation at anganwadi centre while majority of
anganwadi workers were using standard measures for weighing of raw food ( 90%) as
well as cooked food (18 % ) both.
Similarly in rural projects, it was seen from table above that majority (43%) of
anganwadi workers with medium awareness were following the menu for food
preparation at anganwadi centre while majority (57%) of anganwadi workers with
medium awareness level were also using standard measure for weighing of raw food. 13
% anganwadi workers in rural projects with low awareness level were using standard
measure for distribution of cooked food.
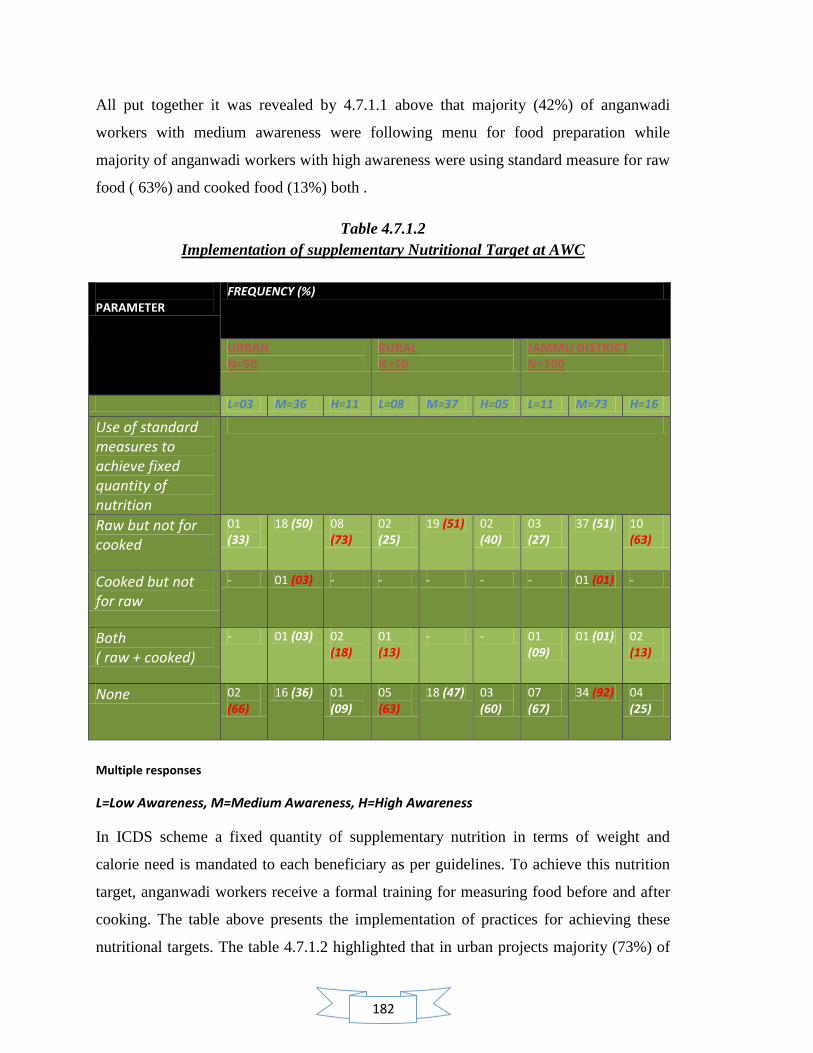
182
All put together it was revealed by 4.7.1.1 above that majority (42%) of anganwadi
workers with medium awareness were following menu for food preparation while
majority of anganwadi workers with high awareness were using standard measure for raw
food ( 63%) and cooked food (13%) both .
Table 4.7.1.2
Implementation of supplementary Nutritional Target at AWC
PARAMETER
FREQUENCY (%)
URBAN N=50
RURAL N=50
JAMMU DISTRICT N=100
L=03 M=36 H=11 L=08 M=37 H=05 L=11 M=73 H=16
Use of standard measures to achieve fixed quantity of nutrition
Raw but not for cooked
01 (33)
18 (50) 08 (73)
02 (25)
19 (51) 02 (40)
03 (27)
37 (51) 10 (63)
Cooked but not for raw
- 01 (03) - - - - - 01 (01) -
Both ( raw + cooked)
- 01 (03) 02 (18)
01 (13)
- - 01 (09)
01 (01) 02 (13)
None 02 (66)
16 (36) 01 (09)
05 (63)
18 (47) 03 (60)
07 (67)
34 (92) 04 (25)
Multiple responses
L=Low Awareness, M=Medium Awareness, H=High Awareness
In ICDS scheme a fixed quantity of supplementary nutrition in terms of weight and
calorie need is mandated to each beneficiary as per guidelines. To achieve this nutrition
target, anganwadi workers receive a formal training for measuring food before and after
cooking. The table above presents the implementation of practices for achieving these
nutritional targets. The table 4.7.1.2 highlighted that in urban projects majority (73%) of
183
highly aware anganwadi workers were using standard measures for raw food but not for
cooked food. On the contrary only 3 % anganwadi workers with medium awareness were
using standard measures for cooked food but not for raw food. Table 4.7.1.2 also
highlighted that 18 %anganwadi workers with high awareness were using standard
measures for booth raw as well as cooked food. Majority (66%) of anganwadi workers
with low awareness in urban projects were not using any standard measure for weighing
raw and cooked food at anganwadi centre.
Similarly, in rural projects the table revealed that (51 %) of highly aware anganwadi
workers were using standard measures for raw food but not for cooked food. In the rural
projects, the table data highlighted that there was no anganwadi worker who was using
standard measure for cooked food but not for raw food. 13 %anganwadi workers with
low awareness were using standard measures for booth raw as well as cooked food.
Majority (63%) of anganwadi workers with low awareness in urban projects were not
using any standard measure for weighing raw and cooked food at anganwadi centre.
All put together, the table 4.7.1.2 revealed that majority (63%) of highly aware
anganwadi workers were using standard measure for raw food but not for cooked food
while only 1 % anganwadi worker with medium awareness were using standard food for
cooked but not for raw food. The table also revealed that majority of highly aware
anganwadi workers were using standard measure for both raw as well as cooked food
while majority (67%) of anganwadi workers with low awareness level were not using any
standard measure for weighing of raw and cooked food

184
Table 4.7.1.3
Consumption of Supplementary Nutrition by Children at AWC
Food
consumption
Frequency (%)
URBAN
N=50
RURAL
N=50
JAMMU DISTRICT
N=100
L=03 M=36 H=11 L=08 M=37 H=05 L=11 M=73 H=16
Full 01
(33)
09
(25)
05
(45)
01
(13)
23
(62)
05
(100)
02
(18)
32
(44)
10
(63)
Partial 01
(33)
23
(64)
06
(55)
06
(75)
11
(30)
- 07
(64)
34
(92)
06
(38)
Nil 01
(33)
04
(11)
- 01
(13)
02
(54)
- 02
(18)
06
(82)
-
L=Low Awareness, M=Medium Awareness, H=High Awareness
SUPPLEMENTARY FOOD CONSUMPTION BY CHILDREN AT ANGANWADI CENTRE
Urban children
Full Partial Nil
33% 33% 33%
25%
64%
11%
45%
55%
0%
Low Medium High
Rural children
Full Partial Nil
13%
75%
13%
62%
30%
54%
100%
0% 0%
Low Medium High
Fig. 4.11 Consumption of Supplementary Nutrition by Children at AWC
185
The table 4.7.1.3 highlighted that in urban projects, majority (45%) of highly aware
anganwadi workers were making efforts for the full consumption of meal by children at
anganwadi centre while majority (64%) anganwadi workers with medium awareness
were making efforts for the partial consumption of meal by children at anganwadi centre.
The table 4.7.1.3 also highlighted that in urban projects, majority (33%) of anganwadi
workers with low awareness were not making any effort for the consumption of food by
children at anganwadi centre and hence children at these anganwadi centres showed nil
consumption of supplementary food instead they found to take their meals at home for
consumption. Further when it was enquired to anganwadi worker that whether she keep
any follow up for the children who take their meals at home to know that who consumed
the meal, she reported that there is no such follow up taken by her.
Similarly in rural projects the table 4.7.1.3 revealed that all (100%) highly aware
anganwadi workers were making efforts for the full consumption of food by children at
anganwadi centre while majority (75%) of anganwadi workers with low awareness level
were making efforts for the partial consumption of food by children at anganwadi centre.
The table also highlighted that majority (54%) of anganwadi workers with medium
awareness level were not making any effort for the consumption of supplementary food
by children.
All put together, it was revealed by the that majority (63%) of anganwadi workers with
high awareness were making efforts for full consumption of food by children at
anganwadi centre while majority of anganwadi workers with medium awareness were
either making efforts for partial (92%) consumption of food or nil consumption of food.
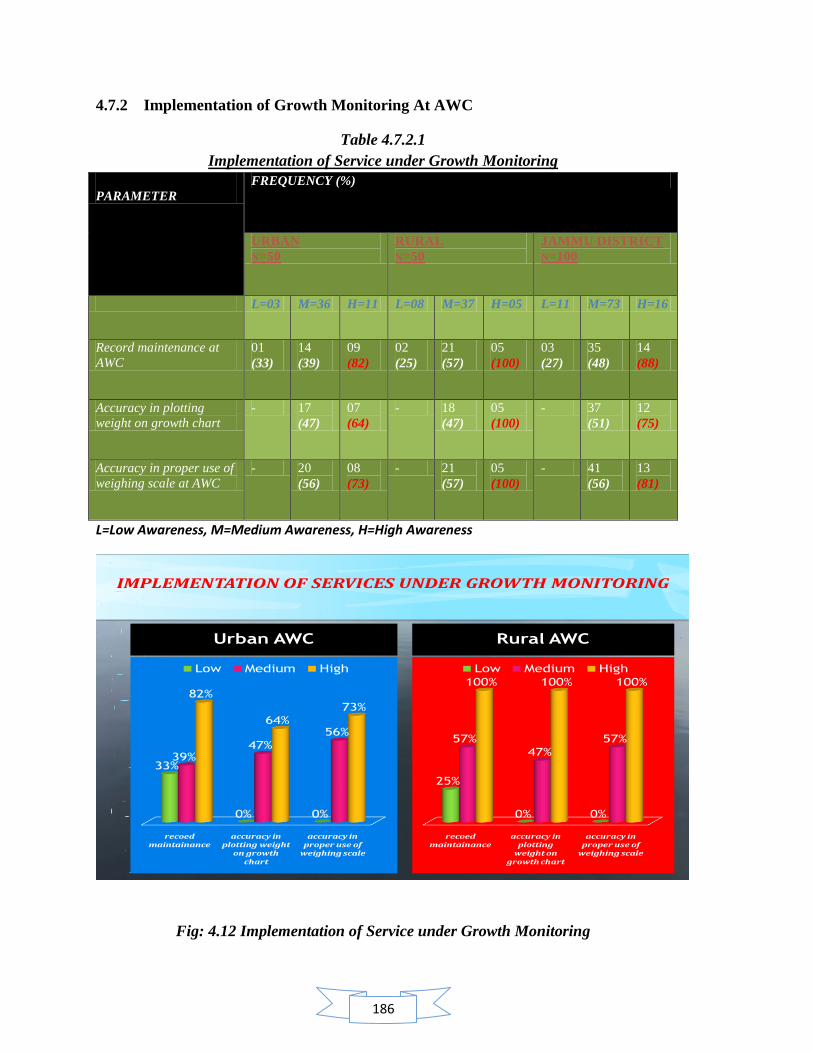
186
4.7.2 Implementation of Growth Monitoring At AWC
Table 4.7.2.1
Implementation of Service under Growth Monitoring
PARAMETER
FREQUENCY (%)
URBAN
N=50
RURAL
N=50
JAMMU DISTRICT
N=100
L=03 M=36 H=11 L=08 M=37 H=05 L=11 M=73 H=16
Record maintenance at
AWC
01
(33)
14
(39)
09
(82)
02
(25)
21
(57)
05
(100)
03
(27)
35
(48)
14
(88)
Accuracy in plotting
weight on growth chart
- 17
(47)
07
(64)
- 18
(47)
05
(100)
- 37
(51)
12
(75)
Accuracy in proper use of
weighing scale at AWC
- 20
(56)
08
(73)
- 21
(57)
05
(100)
- 41
(56)
13
(81)
L=Low Awareness, M=Medium Awareness, H=High Awareness
IMPLEMENTATION OF SERVICES UNDER GROWTH MONITORING
Urban AWC
recoed maintainance
accuracy in plotting weight
on growth chart
accuracy in proper use of
weighing scale
33%
0% 0%
39%47%
56%
82%
64%
73%
Low Medium High
Rural AWC
recoed maintainance
accuracy in plotting
weight on growth chart
accuracy in proper use of
weighing scale
25%
0% 0%
57%
47%
57%
100% 100% 100%
Low Medium High
Fig: 4.12 Implementation of Service under Growth Monitoring
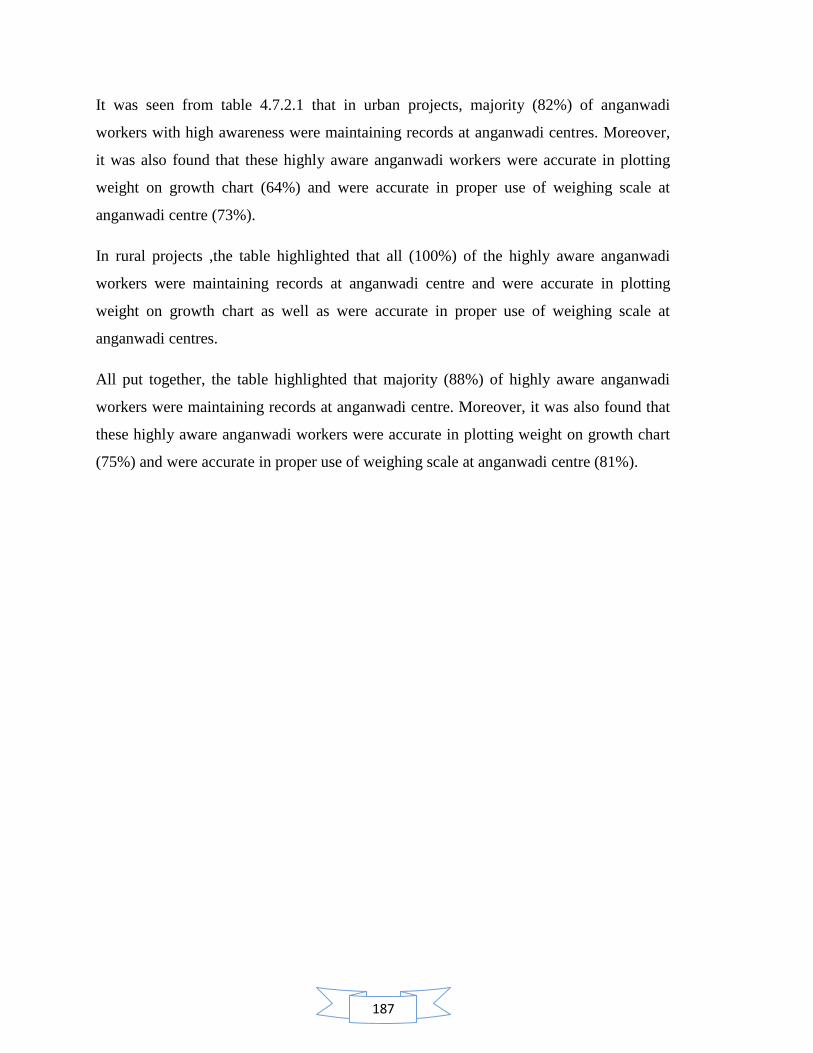
187
It was seen from table 4.7.2.1 that in urban projects, majority (82%) of anganwadi
workers with high awareness were maintaining records at anganwadi centres. Moreover,
it was also found that these highly aware anganwadi workers were accurate in plotting
weight on growth chart (64%) and were accurate in proper use of weighing scale at
anganwadi centre (73%).
In rural projects ,the table highlighted that all (100%) of the highly aware anganwadi
workers were maintaining records at anganwadi centre and were accurate in plotting
weight on growth chart as well as were accurate in proper use of weighing scale at
anganwadi centres.
All put together, the table highlighted that majority (88%) of highly aware anganwadi
workers were maintaining records at anganwadi centre. Moreover, it was also found that
these highly aware anganwadi workers were accurate in plotting weight on growth chart
(75%) and were accurate in proper use of weighing scale at anganwadi centre (81%).

188
Table 4.7.2.2
Execution Skills of Anganwadi Worker under Growth Monitoring
PARAMETER
FREQUENCY (%)
URBAN
N=50
RURAL
N=50
JAMMU DISTRICT
N=100
L=03 M=36 H=11 L=08 M=37 H=05 L=11 M=73 H=16
Accuracy in
plotting
weight on
growth chart
but no proper
use of
weighing scale
- 06
(17)
- - 03
(08)
- - 09
(12)
-
Accuracy in
proper use of
weighing scale
but not for
growth chart
- 09
(25)
01 (09) - 07
(19)
- - 16
(22)
01 (06)
Accuracy in
both activities
- 11
(31)
07 (64) - 15
(41)
05
(100)
- 26
(36)
11 (69)
None 03
(100)
10
(28)
03 (27) 08
(100)
12
(32)
- 11
(100)
22
(30)
03 (19)
Multiple responses
L=Low Awareness, M=Medium Awareness, H=High Awareness
The glance at table 4.7.2.2 indicates that in urban projects, majority (17%) of anganwadi
workers with medium awareness were accurate in plotting weight on growth chart but
they were not accurate in their skills for the proper use of weighing scale while 25 % of
these workers with medium awareness were also accurate in proper use of weighing scale
but were not accurate in their skills for plotting weight on growth chart. On the other
hand, majority (64%) of anganwadi workers with high awareness were found to be
accurate with both the skills of plotting weight on growth chart as well as proper use of
weighing skills. The table data also revealed that all (100%) of the anganwadi workers
with low awareness were completely non accurate with both skills. Neither they were
accurate with plotting weight on growth chart nor were they accurate with proper use of
weighing scale.
189
Similarly, in rural projects, the table 4.7.2.2 highlighted that majority (8%) of anganwadi
workers with medium awareness were accurate in plotting weight on growth chart but
they were accurate in their skills for the proper use of weighing scale while 19 % of these
workers with medium awareness were also accurate in proper use of weighing scale but
were not accurate in their skills for plotting weight on growth chart. On the other hand,
all (100%) of the anganwadi workers with high awareness were found to be accurate
with both the skills of plotting weight on growth chart as well as proper use of weighing
skills. The table data also revealed that 100% of anganwadi workers with low awareness
were completely non accurate with both skills. Neither they were accurate with plotting
weight on growth chart nor were they accurate with proper use of weighing scale.
All put together, it was highlighted by the table 4.7.2.2 that, majority (12%) of anganwadi
workers with medium awareness were accurate in plotting weight on growth chart but
they were accurate in their skills for the proper use of weighing scale while 22 % of these
workers with medium awareness were also accurate in proper use of weighing scale but
were not accurate in their skills for plotting weight on growth chart. On the other hand,
majority (69%) of anganwadi workers with high awareness were found to be accurate
with both the skills of plotting weight on growth chart as well as proper use of weighing
skills. The table data also revealed that majority (100%) of anganwadi workers with low
awareness were completely non accurate with both skills. Neither they were accurate
with plotting weight on growth chart nor were they accurate with proper use of weighing
scale.
Thus the table 4.7.2.2 indicated that anganwadi workers with medium awareness were
partially accurate in their skills of growth monitoring. Either they were accurate for
plotting weight on growth chart and assessing malnutrition grade from the growth chart
data or they were accurate in proper use of weighing scale. Anganwadi workers with high
awareness were completely accurate in growth monitoring skills while anganwadi
workers with low awareness level were completely non accurate with their growth
monitoring skills. For judging the accuracy of skills for proper use of weighing scale, the
anganwadi workers were observed for taking precautions measures like correction of zero
error before weighing, removal of maximum clothing and accessories from child body
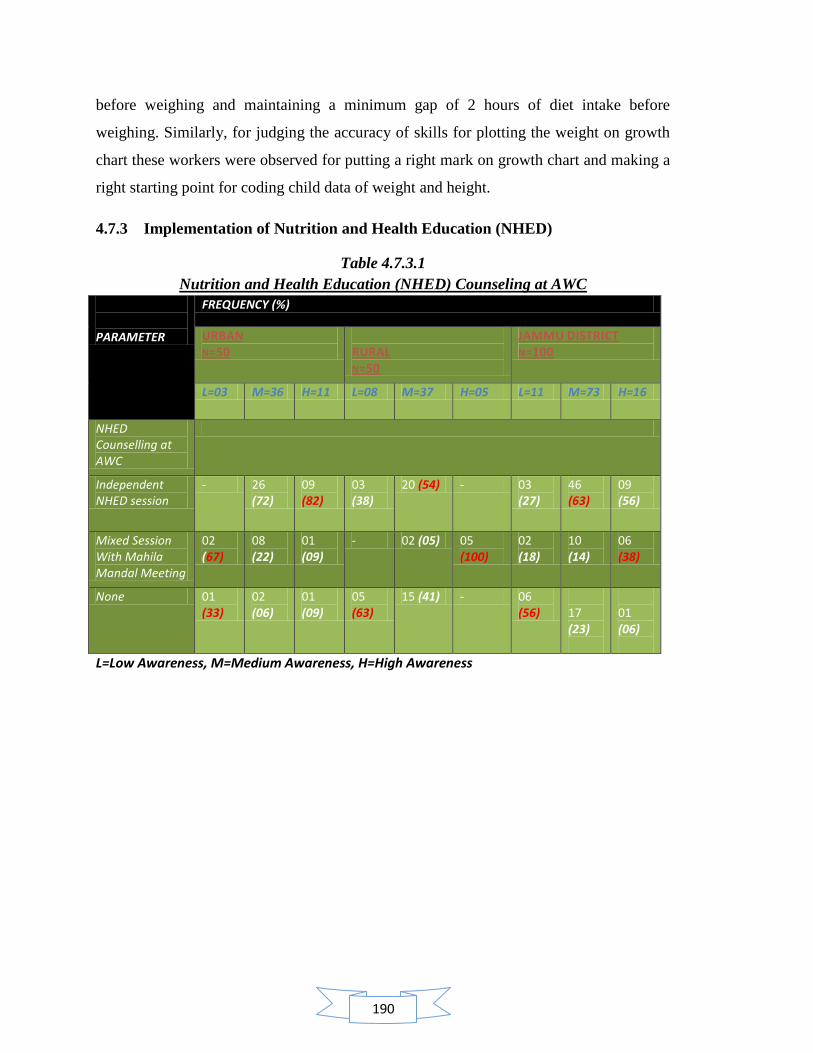
190
before weighing and maintaining a minimum gap of 2 hours of diet intake before
weighing. Similarly, for judging the accuracy of skills for plotting the weight on growth
chart these workers were observed for putting a right mark on growth chart and making a
right starting point for coding child data of weight and height.
4.7.3 Implementation of Nutrition and Health Education (NHED)
Table 4.7.3.1
Nutrition and Health Education (NHED) Counseling at AWC
PARAMETER
FREQUENCY (%)
URBAN N=50
RURAL N=50
JAMMU DISTRICT N=100
L=03 M=36 H=11 L=08 M=37 H=05 L=11 M=73 H=16
NHED Counselling at AWC
Independent NHED session
- 26 (72)
09 (82)
03 (38)
20 (54) - 03 (27)
46 (63)
09 (56)
Mixed Session With Mahila Mandal Meeting
02 (67)
08 (22)
01 (09)
- 02 (05) 05 (100)
02 (18)
10 (14)
06 (38)
None 01 (33)
02 (06)
01 (09)
05 (63)
15 (41) - 06 (56)
17 (23)
01 (06)
L=Low Awareness, M=Medium Awareness, H=High Awareness
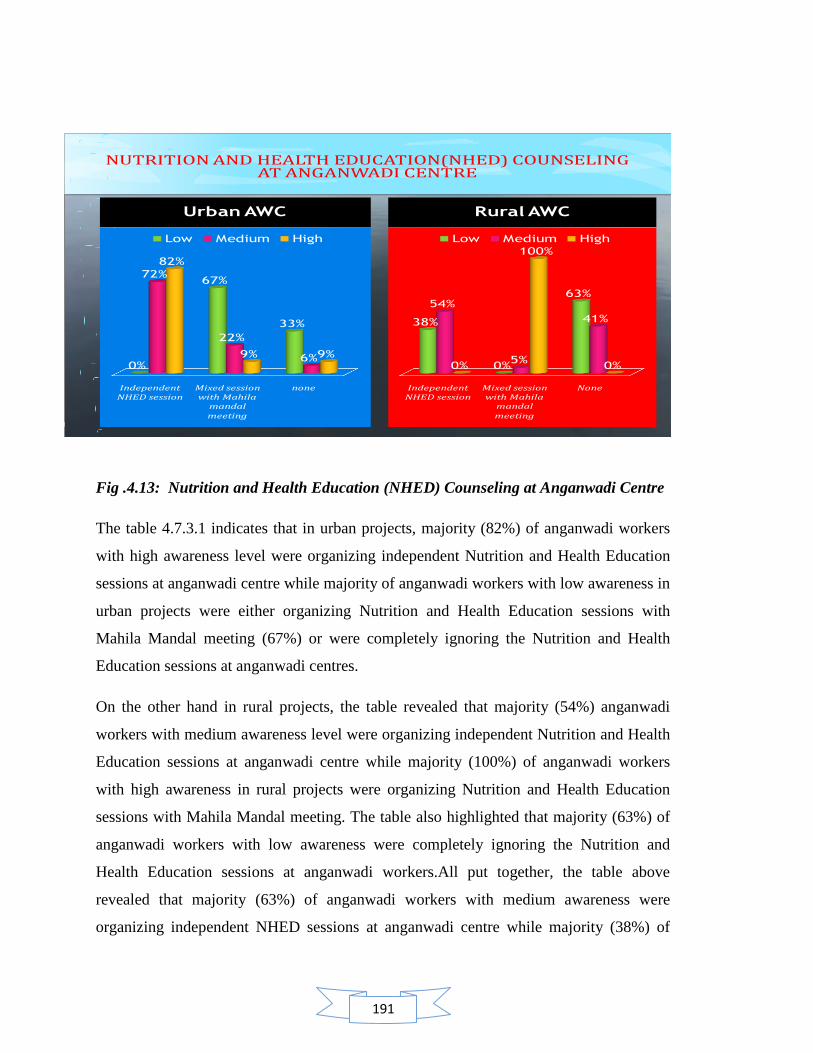
191
Fig .4.13: Nutrition and Health Education (NHED) Counseling at Anganwadi Centre
The table 4.7.3.1 indicates that in urban projects, majority (82%) of anganwadi workers
with high awareness level were organizing independent Nutrition and Health Education
sessions at anganwadi centre while majority of anganwadi workers with low awareness in
urban projects were either organizing Nutrition and Health Education sessions with
Mahila Mandal meeting (67%) or were completely ignoring the Nutrition and Health
Education sessions at anganwadi centres.
On the other hand in rural projects, the table revealed that majority (54%) anganwadi
workers with medium awareness level were organizing independent Nutrition and Health
Education sessions at anganwadi centre while majority (100%) of anganwadi workers
with high awareness in rural projects were organizing Nutrition and Health Education
sessions with Mahila Mandal meeting. The table also highlighted that majority (63%) of
anganwadi workers with low awareness were completely ignoring the Nutrition and
Health Education sessions at anganwadi workers.All put together, the table above
revealed that majority (63%) of anganwadi workers with medium awareness were
organizing independent NHED sessions at anganwadi centre while majority (38%) of
NUTRITION AND HEALTH EDUCATION(NHED) COUNSELING AT ANGANWADI CENTRE
Urban AWC
Independent NHED session
Mixed session with Mahila
mandal meeting
none
0%
67%
33%
72%
22%
6%
82%
9% 9%
Low Medium High
Rural AWC
Independent NHED session
Mixed session with Mahila
mandal meeting
None
38%
0%
63%54%
5%
41%
0%
100%
0%
Low Medium High
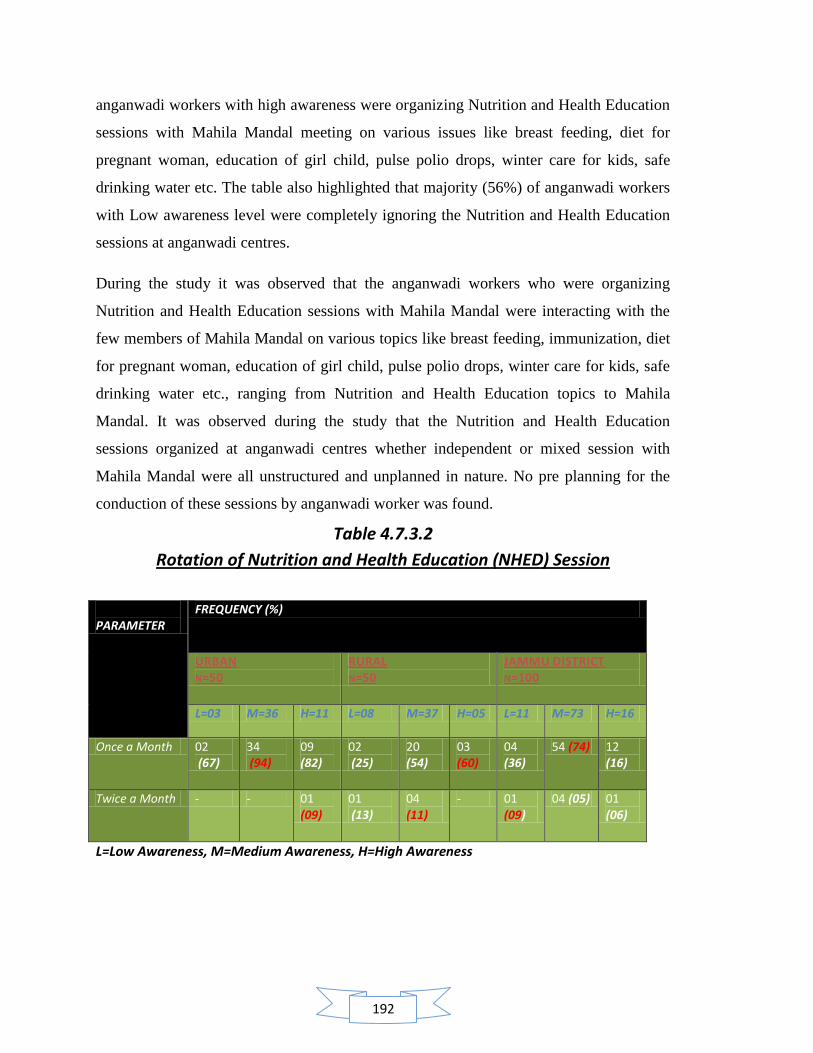
192
anganwadi workers with high awareness were organizing Nutrition and Health Education
sessions with Mahila Mandal meeting on various issues like breast feeding, diet for
pregnant woman, education of girl child, pulse polio drops, winter care for kids, safe
drinking water etc. The table also highlighted that majority (56%) of anganwadi workers
with Low awareness level were completely ignoring the Nutrition and Health Education
sessions at anganwadi centres.
During the study it was observed that the anganwadi workers who were organizing
Nutrition and Health Education sessions with Mahila Mandal were interacting with the
few members of Mahila Mandal on various topics like breast feeding, immunization, diet
for pregnant woman, education of girl child, pulse polio drops, winter care for kids, safe
drinking water etc., ranging from Nutrition and Health Education topics to Mahila
Mandal. It was observed during the study that the Nutrition and Health Education
sessions organized at anganwadi centres whether independent or mixed session with
Mahila Mandal were all unstructured and unplanned in nature. No pre planning for the
conduction of these sessions by anganwadi worker was found.
Table 4.7.3.2
Rotation of Nutrition and Health Education (NHED) Session
PARAMETER
FREQUENCY (%)
URBAN N=50
RURAL N=50
JAMMU DISTRICT N=100
L=03 M=36 H=11 L=08 M=37 H=05 L=11 M=73 H=16
Once a Month 02 (67)
34 (94)
09 (82)
02 (25)
20 (54)
03 (60)
04 (36)
54 (74) 12 (16)
Twice a Month - - 01 (09)
01 (13)
04 (11)
- 01 (09)
04 (05) 01 (06)
L=Low Awareness, M=Medium Awareness, H=High Awareness
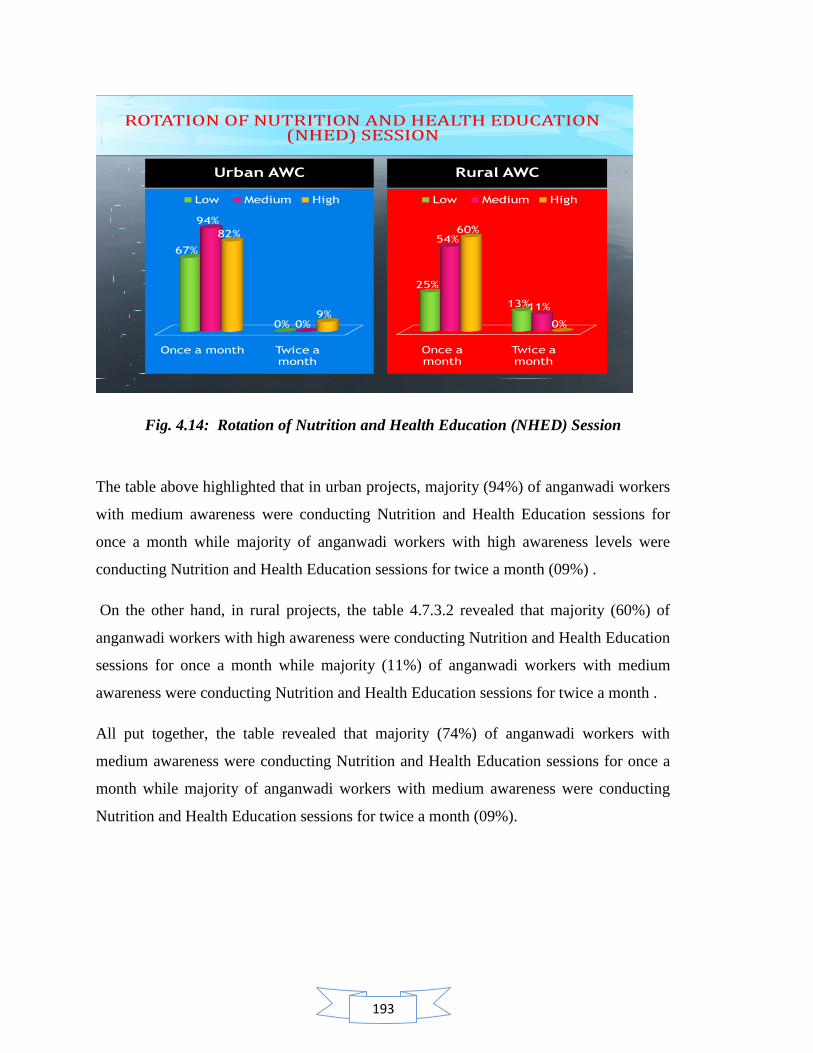
193
ROTATION OF NUTRITION AND HEALTH EDUCATION (NHED) SESSION
Urban AWC
Once a month Twice a month
67%
0%
94%
0%
82%
9%
Low Medium High
Rural AWC
Once a month
Twice a month
25%
13%
54%
11%
60%
0%
Low Medium High
Fig. 4.14: Rotation of Nutrition and Health Education (NHED) Session
The table above highlighted that in urban projects, majority (94%) of anganwadi workers
with medium awareness were conducting Nutrition and Health Education sessions for
once a month while majority of anganwadi workers with high awareness levels were
conducting Nutrition and Health Education sessions for twice a month (09%) .
On the other hand, in rural projects, the table 4.7.3.2 revealed that majority (60%) of
anganwadi workers with high awareness were conducting Nutrition and Health Education
sessions for once a month while majority (11%) of anganwadi workers with medium
awareness were conducting Nutrition and Health Education sessions for twice a month .
All put together, the table revealed that majority (74%) of anganwadi workers with
medium awareness were conducting Nutrition and Health Education sessions for once a
month while majority of anganwadi workers with medium awareness were conducting
Nutrition and Health Education sessions for twice a month (09%).
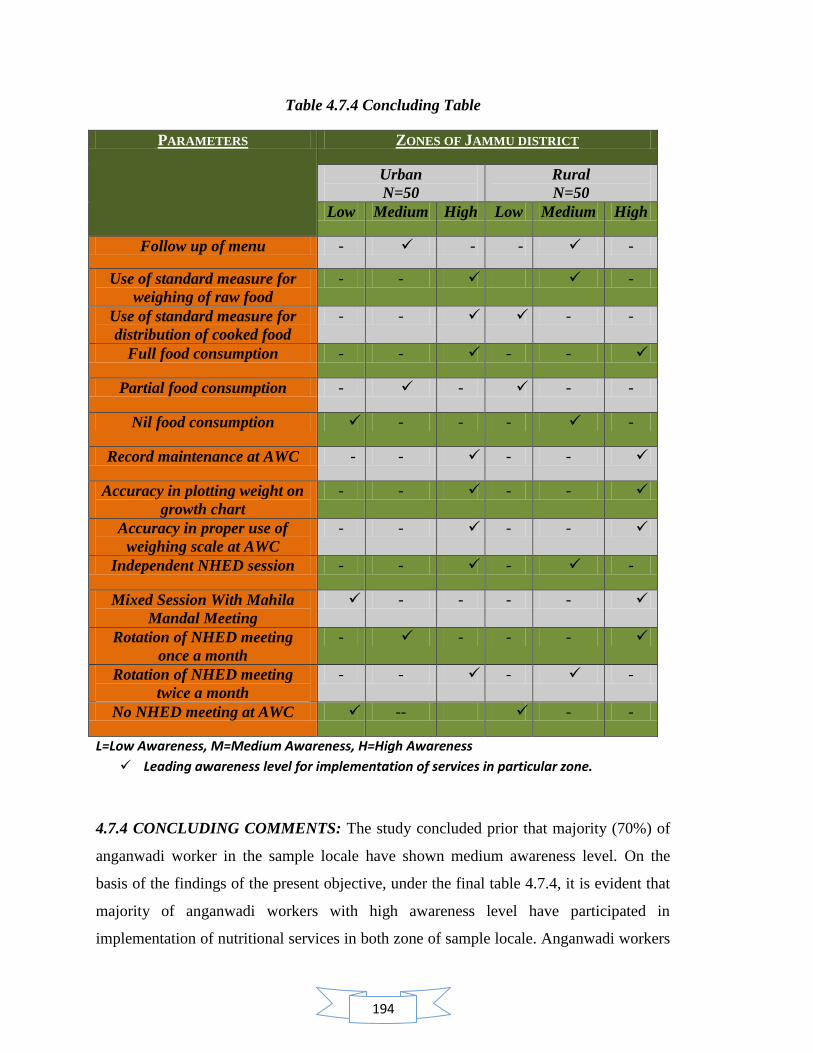
194
Table 4.7.4 Concluding Table
PARAMETERS ZONES OF JAMMU DISTRICT
Urban
N=50
Rural
N=50
Low Medium High Low Medium High
Follow up of menu - - - -
Use of standard measure for
weighing of raw food
- - -
Use of standard measure for
distribution of cooked food
- - - -
Full food consumption - - - - -
Partial food consumption - - - - -
Nil food consumption - - - -
Record maintenance at AWC - - - - -
Accuracy in plotting weight on
growth chart
- - - -
Accuracy in proper use of
weighing scale at AWC
- - - - -
Independent NHED session - - - - -
Mixed Session With Mahila
Mandal Meeting
- - - -
Rotation of NHED meeting
once a month
- - - -
Rotation of NHED meeting
twice a month
- - - -
No NHED meeting at AWC -- - -
L=Low Awareness, M=Medium Awareness, H=High Awareness
Leading awareness level for implementation of services in particular zone.
4.7.4 CONCLUDING COMMENTS: The study concluded prior that majority (70%) of
anganwadi worker in the sample locale have shown medium awareness level. On the
basis of the findings of the present objective, under the final table 4.7.4, it is evident that
majority of anganwadi workers with high awareness level have participated in
implementation of nutritional services in both zone of sample locale. Anganwadi workers
195
with low awareness level showed least participation in the implementation of nutritional
services while anganwadi workers with medium awareness level have participated in
between the line. With the help of regression analysis it has been established by the study
in advance that awareness does have a positive influence on the implementation of the
services. Thus, table 4.7.4 depicted that there is scope of improving the training quality of
anganwadi workers with medium awareness and converting them into a highly aware
worker in order to improve the quality of implementation of nutritional services. This
effort, in result, will lead to successful achievement of nutritional targets of ICDS. The
comparison between urban and rural zone showed that urban anganwadi workers with
high awareness level showed better participation for implementation of nutritional
services in comparison to rural anganwadi workers with high awareness.
196
Contents :
4.8 Assessment of nutritional status of pre scholars attending anganwadi centers in
Jammu district
4.8.1 Assessment of nutritional status by anthropometric measurements
4.8.1.1 Age and sex variation in anthropometric characteristics of urban and
rural children of Jammu district
4.8.1.2 Nutritional status and age of children
4.8.1.3 Nutritional status and sex of children
4.8.1.4 Classification of types of malnutrition based on Z-scores for urban and
rural boys (3-4 years) of Jammu district
4.8.1.5 Classification of types of malnutrition based on Z-scores for urban and
rural girls (3-4 years) of Jammu district
4.8.1.6 Classification of types of malnutrition based on Z-scores for urban and
rural boys (4-5 years) of Jammu district
4.8.1.7 Classification of types of malnutrition based on Z-scores for urban and
rural girls (4-5 years) of Jammu district
4.8.1.8 Classification of types of malnutrition based on Z-scores for urban and
rural boys (5-6 years) of Jammu district
4.8.1.9 Classification of types of malnutrition based on Z-scores for urban and
rural girls (5-6 years) of Jammu district
4.8.1.10 Classification of types of malnutrition based on Z-scores for urban
and rural children (3-6 years) of Jammu district
4.8.2 Assessment of nutritional status by 24-hour dietary recall method
4.8.2.1 Mean nutrient intake of the children by structured 24 hour dietary
recall method
4.8.2.2 Percentage of children (3-6 years) meeting recommended daily
allowance (RDA)
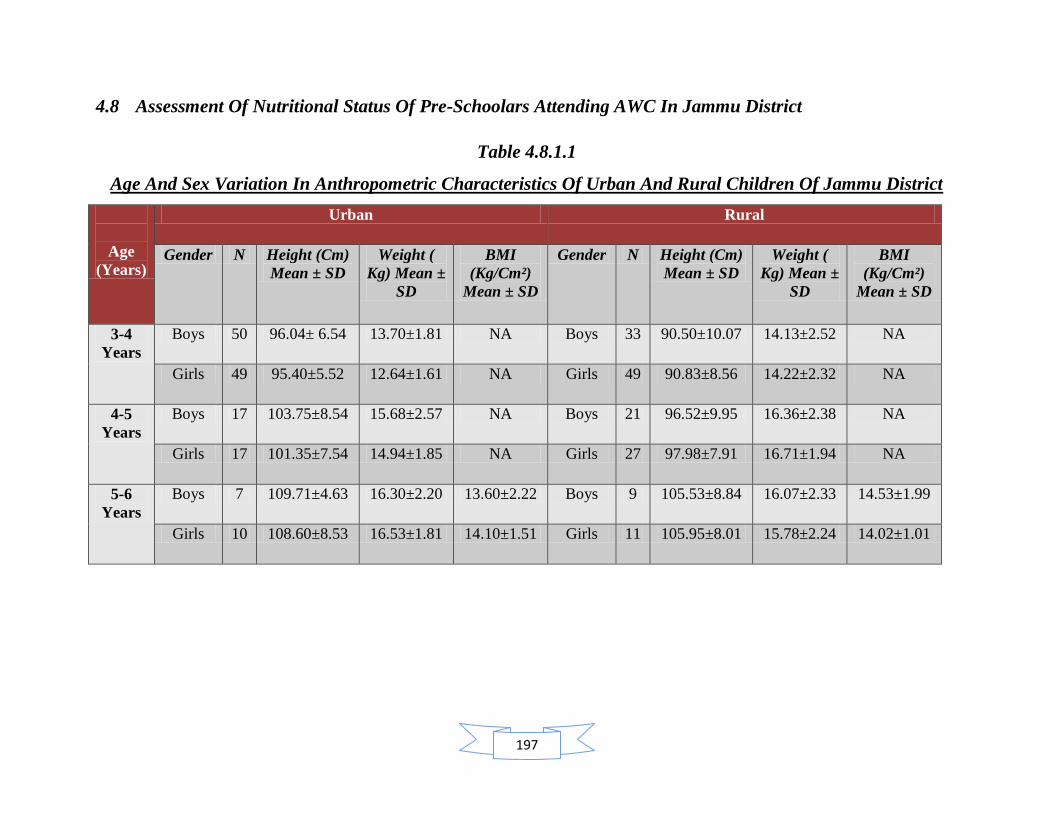
197
4.8 Assessment Of Nutritional Status Of Pre-Schoolars Attending AWC In Jammu District
Table 4.8.1.1
Age And Sex Variation In Anthropometric Characteristics Of Urban And Rural Children Of Jammu District
Age
(Years)
Urban Rural
Gender N Height (Cm)
Mean ± SD
Weight (
Kg) Mean ±
SD
BMI
(Kg/Cm²)
Mean ± SD
Gender N Height (Cm)
Mean ± SD
Weight (
Kg) Mean ±
SD
BMI
(Kg/Cm²)
Mean ± SD
3-4
Years
Boys 50 96.04± 6.54 13.70±1.81 NA Boys 33 90.50±10.07 14.13±2.52 NA
Girls 49 95.40±5.52 12.64±1.61 NA Girls 49 90.83±8.56 14.22±2.32 NA
4-5
Years
Boys 17 103.75±8.54 15.68±2.57 NA Boys 21 96.52±9.95 16.36±2.38 NA
Girls 17 101.35±7.54 14.94±1.85 NA Girls 27 97.98±7.91 16.71±1.94 NA
5-6
Years
Boys 7 109.71±4.63 16.30±2.20 13.60±2.22 Boys 9 105.53±8.84 16.07±2.33 14.53±1.99
Girls 10 108.60±8.53 16.53±1.81 14.10±1.51 Girls 11 105.95±8.01 15.78±2.24 14.02±1.01
198
4.8.1 Assessment Of Nutritional Status By Anthropometric Measurements
It was indicated from the table 4.8.1.1 that mean height of urban children (boys and girls)
aged between 3-6 years was found to be higher than the mean height of rural children
(boys and girls) of same age groups.
Similarly, the mean weight of rural children (boys and girls) aged between 3- 5 years was
found to be higher than the mean weight of urban children (boys and girls) of same age
group. Within the age group of 5-6 years, it was found that the mean weight of urban
children (boys and girls) was higher than the mean weight of rural children (boys and
girls) of same age group.
Within the age group of 5-6 years, it was found that the mean BMI of rural boys was
found to be higher than the mean BMI of urban boys while the mean BMI of rural girls
was found to be higher than the mean BMI of urban girls
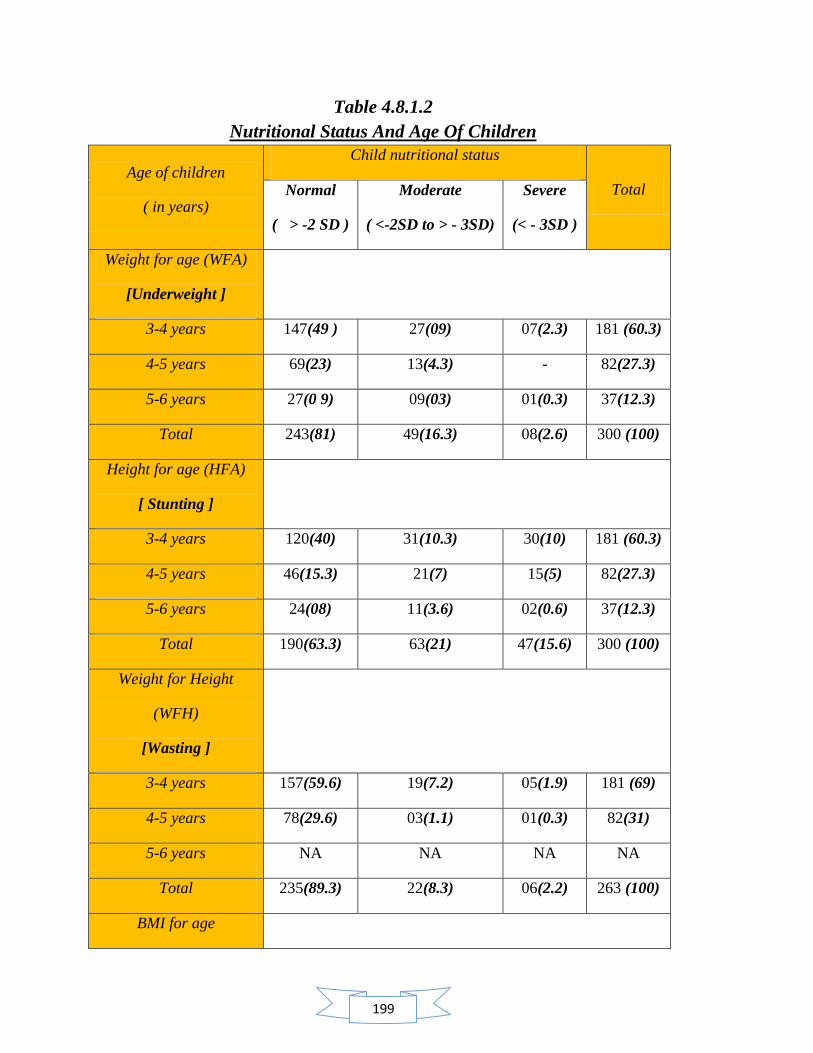
199
Table 4.8.1.2
Nutritional Status And Age Of Children
Age of children
( in years)
Child nutritional status
Total Normal
( > -2 SD )
Moderate
( <-2SD to > - 3SD)
Severe
(< - 3SD )
Weight for age (WFA)
[Underweight ]
3-4 years 147(49 ) 27(09) 07(2.3) 181 (60.3)
4-5 years 69(23) 13(4.3) - 82(27.3)
5-6 years 27(0 9) 09(03) 01(0.3) 37(12.3)
Total 243(81) 49(16.3) 08(2.6) 300 (100)
Height for age (HFA)
[ Stunting ]
3-4 years 120(40) 31(10.3) 30(10) 181 (60.3)
4-5 years 46(15.3) 21(7) 15(5) 82(27.3)
5-6 years 24(08) 11(3.6) 02(0.6) 37(12.3)
Total 190(63.3) 63(21) 47(15.6) 300 (100)
Weight for Height
(WFH)
[Wasting ]
3-4 years 157(59.6) 19(7.2) 05(1.9) 181 (69)
4-5 years 78(29.6) 03(1.1) 01(0.3) 82(31)
5-6 years NA NA NA NA
Total 235(89.3) 22(8.3) 06(2.2) 263 (100)
BMI for age
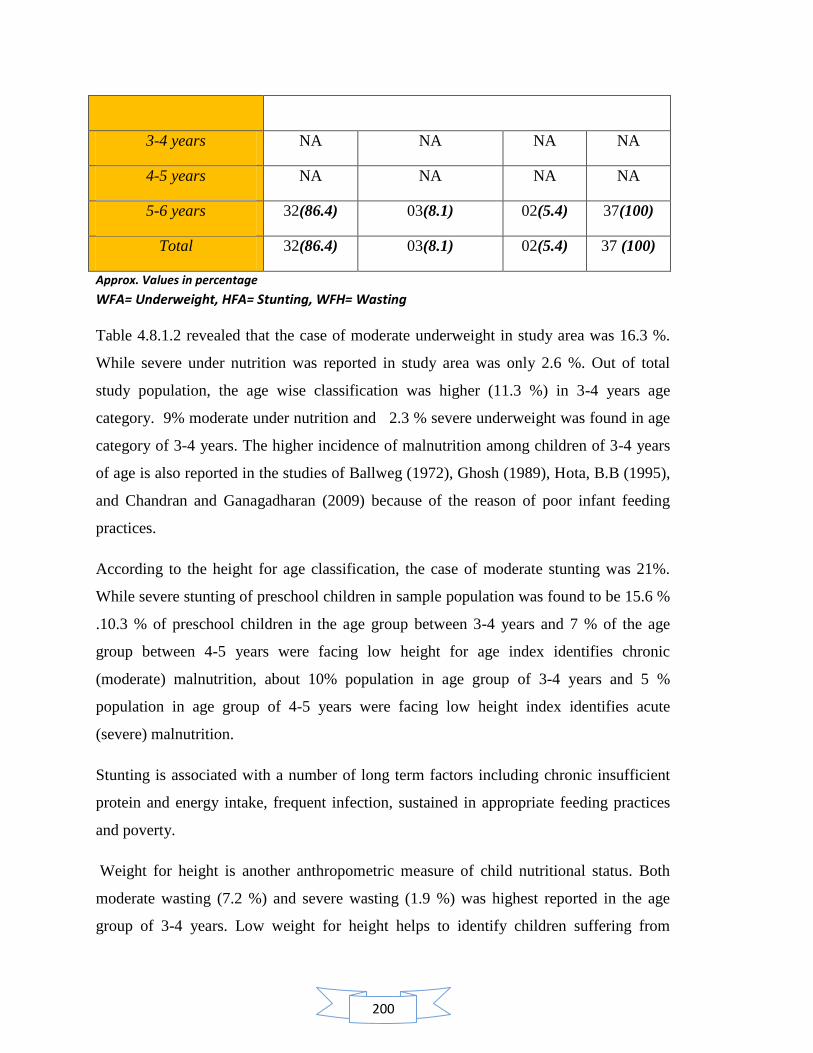
200
3-4 years NA NA NA NA
4-5 years NA NA NA NA
5-6 years 32(86.4) 03(8.1) 02(5.4) 37(100)
Total 32(86.4) 03(8.1) 02(5.4) 37 (100)
Approx. Values in percentage
WFA= Underweight, HFA= Stunting, WFH= Wasting
Table 4.8.1.2 revealed that the case of moderate underweight in study area was 16.3 %.
While severe under nutrition was reported in study area was only 2.6 %. Out of total
study population, the age wise classification was higher (11.3 %) in 3-4 years age
category. 9% moderate under nutrition and 2.3 % severe underweight was found in age
category of 3-4 years. The higher incidence of malnutrition among children of 3-4 years
of age is also reported in the studies of Ballweg (1972), Ghosh (1989), Hota, B.B (1995),
and Chandran and Ganagadharan (2009) because of the reason of poor infant feeding
practices.
According to the height for age classification, the case of moderate stunting was 21%.
While severe stunting of preschool children in sample population was found to be 15.6 %
.10.3 % of preschool children in the age group between 3-4 years and 7 % of the age
group between 4-5 years were facing low height for age index identifies chronic
(moderate) malnutrition, about 10% population in age group of 3-4 years and 5 %
population in age group of 4-5 years were facing low height index identifies acute
(severe) malnutrition.
Stunting is associated with a number of long term factors including chronic insufficient
protein and energy intake, frequent infection, sustained in appropriate feeding practices
and poverty.
Weight for height is another anthropometric measure of child nutritional status. Both
moderate wasting (7.2 %) and severe wasting (1.9 %) was highest reported in the age
group of 3-4 years. Low weight for height helps to identify children suffering from
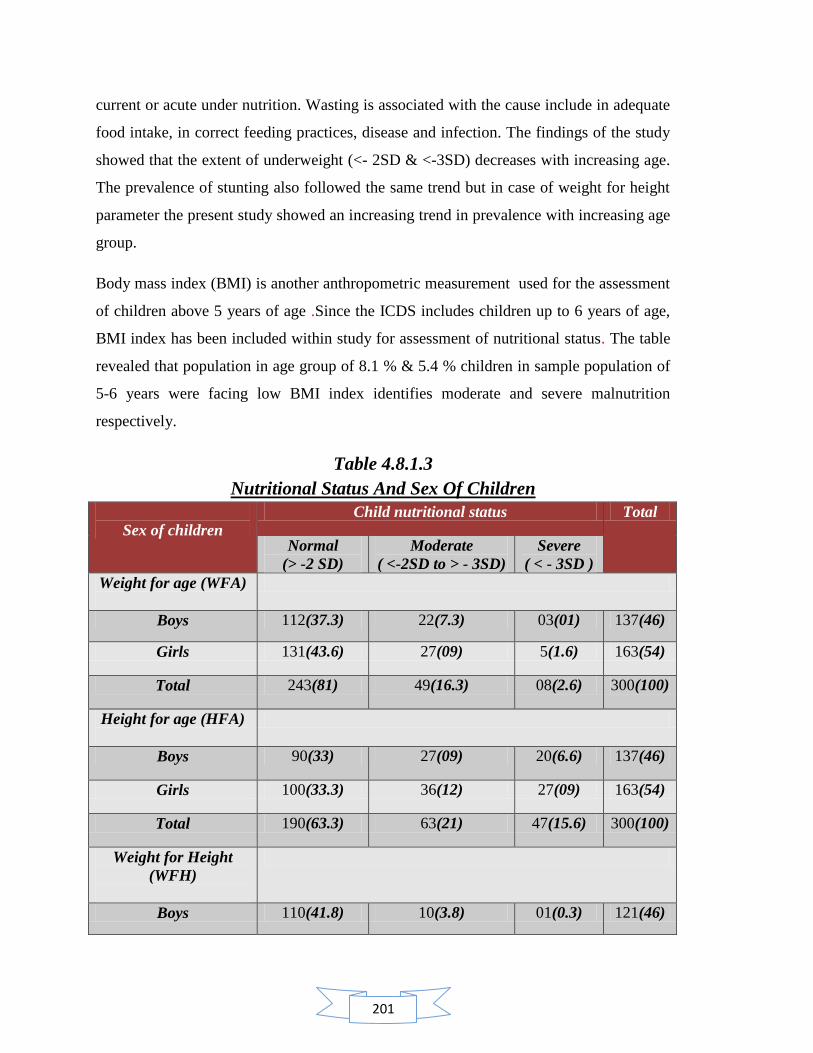
201
current or acute under nutrition. Wasting is associated with the cause include in adequate
food intake, in correct feeding practices, disease and infection. The findings of the study
showed that the extent of underweight (<- 2SD & <-3SD) decreases with increasing age.
The prevalence of stunting also followed the same trend but in case of weight for height
parameter the present study showed an increasing trend in prevalence with increasing age
group.
Body mass index (BMI) is another anthropometric measurement used for the assessment
of children above 5 years of age .Since the ICDS includes children up to 6 years of age,
BMI index has been included within study for assessment of nutritional status. The table
revealed that population in age group of 8.1 % & 5.4 % children in sample population of
5-6 years were facing low BMI index identifies moderate and severe malnutrition
respectively.
Table 4.8.1.3
Nutritional Status And Sex Of Children
Sex of children
Child nutritional status Total
Normal
(> -2 SD)
Moderate
( <-2SD to > - 3SD)
Severe
( < - 3SD )
Weight for age (WFA)
Boys 112(37.3) 22(7.3) 03(01) 137(46)
Girls 131(43.6) 27(09) 5(1.6) 163(54)
Total 243(81) 49(16.3) 08(2.6) 300(100)
Height for age (HFA)
Boys 90(33) 27(09) 20(6.6) 137(46)
Girls 100(33.3) 36(12) 27(09) 163(54)
Total 190(63.3) 63(21) 47(15.6) 300(100)
Weight for Height
(WFH)
Boys 110(41.8) 10(3.8) 01(0.3) 121(46)
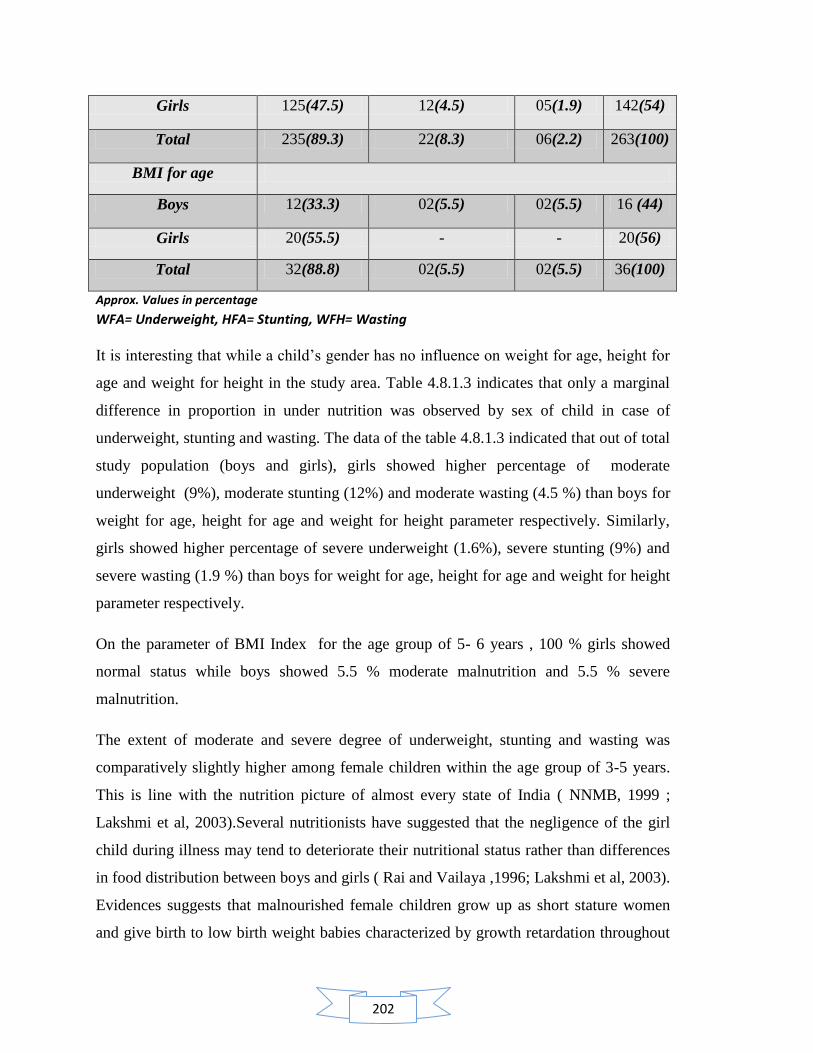
202
Girls 125(47.5) 12(4.5) 05(1.9) 142(54)
Total 235(89.3) 22(8.3) 06(2.2) 263(100)
BMI for age
Boys 12(33.3) 02(5.5) 02(5.5) 16 (44)
Girls 20(55.5) - - 20(56)
Total 32(88.8) 02(5.5) 02(5.5) 36(100)
Approx. Values in percentage
WFA= Underweight, HFA= Stunting, WFH= Wasting
It is interesting that while a child‘s gender has no influence on weight for age, height for
age and weight for height in the study area. Table 4.8.1.3 indicates that only a marginal
difference in proportion in under nutrition was observed by sex of child in case of
underweight, stunting and wasting. The data of the table 4.8.1.3 indicated that out of total
study population (boys and girls), girls showed higher percentage of moderate
underweight (9%), moderate stunting (12%) and moderate wasting (4.5 %) than boys for
weight for age, height for age and weight for height parameter respectively. Similarly,
girls showed higher percentage of severe underweight (1.6%), severe stunting (9%) and
severe wasting (1.9 %) than boys for weight for age, height for age and weight for height
parameter respectively.
On the parameter of BMI Index for the age group of 5- 6 years , 100 % girls showed
normal status while boys showed 5.5 % moderate malnutrition and 5.5 % severe
malnutrition.
The extent of moderate and severe degree of underweight, stunting and wasting was
comparatively slightly higher among female children within the age group of 3-5 years.
This is line with the nutrition picture of almost every state of India ( NNMB, 1999 ;
Lakshmi et al, 2003).Several nutritionists have suggested that the negligence of the girl
child during illness may tend to deteriorate their nutritional status rather than differences
in food distribution between boys and girls ( Rai and Vailaya ,1996; Lakshmi et al, 2003).
Evidences suggests that malnourished female children grow up as short stature women
and give birth to low birth weight babies characterized by growth retardation throughout

203
the growing period, there by perpetuating a vicious cycle through generations ( Lakshmi
et al, 2003 ; Wikipedia, 2012 ) .
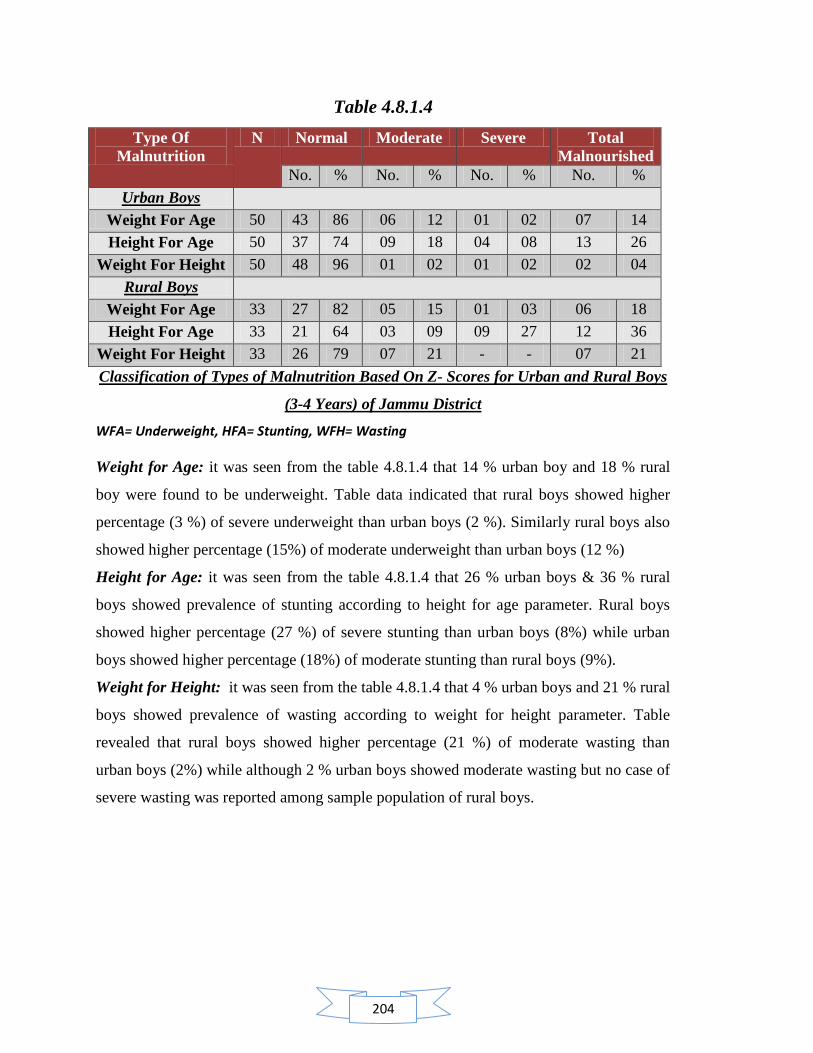
204
Table 4.8.1.4
Type Of
Malnutrition
N Normal Moderate Severe Total
Malnourished
No. % No. % No. % No. %
Urban Boys
Weight For Age 50 43 86 06 12 01 02 07 14
Height For Age 50 37 74 09 18 04 08 13 26
Weight For Height 50 48 96 01 02 01 02 02 04
Rural Boys
Weight For Age 33 27 82 05 15 01 03 06 18
Height For Age 33 21 64 03 09 09 27 12 36
Weight For Height 33 26 79 07 21 - - 07 21
Classification of Types of Malnutrition Based On Z- Scores for Urban and Rural Boys
(3-4 Years) of Jammu District
WFA= Underweight, HFA= Stunting, WFH= Wasting
Weight for Age: it was seen from the table 4.8.1.4 that 14 % urban boy and 18 % rural
boy were found to be underweight. Table data indicated that rural boys showed higher
percentage (3 %) of severe underweight than urban boys (2 %). Similarly rural boys also
showed higher percentage (15%) of moderate underweight than urban boys (12 %)
Height for Age: it was seen from the table 4.8.1.4 that 26 % urban boys & 36 % rural
boys showed prevalence of stunting according to height for age parameter. Rural boys
showed higher percentage (27 %) of severe stunting than urban boys (8%) while urban
boys showed higher percentage (18%) of moderate stunting than rural boys (9%).
Weight for Height: it was seen from the table 4.8.1.4 that 4 % urban boys and 21 % rural
boys showed prevalence of wasting according to weight for height parameter. Table
revealed that rural boys showed higher percentage (21 %) of moderate wasting than
urban boys (2%) while although 2 % urban boys showed moderate wasting but no case of
severe wasting was reported among sample population of rural boys.
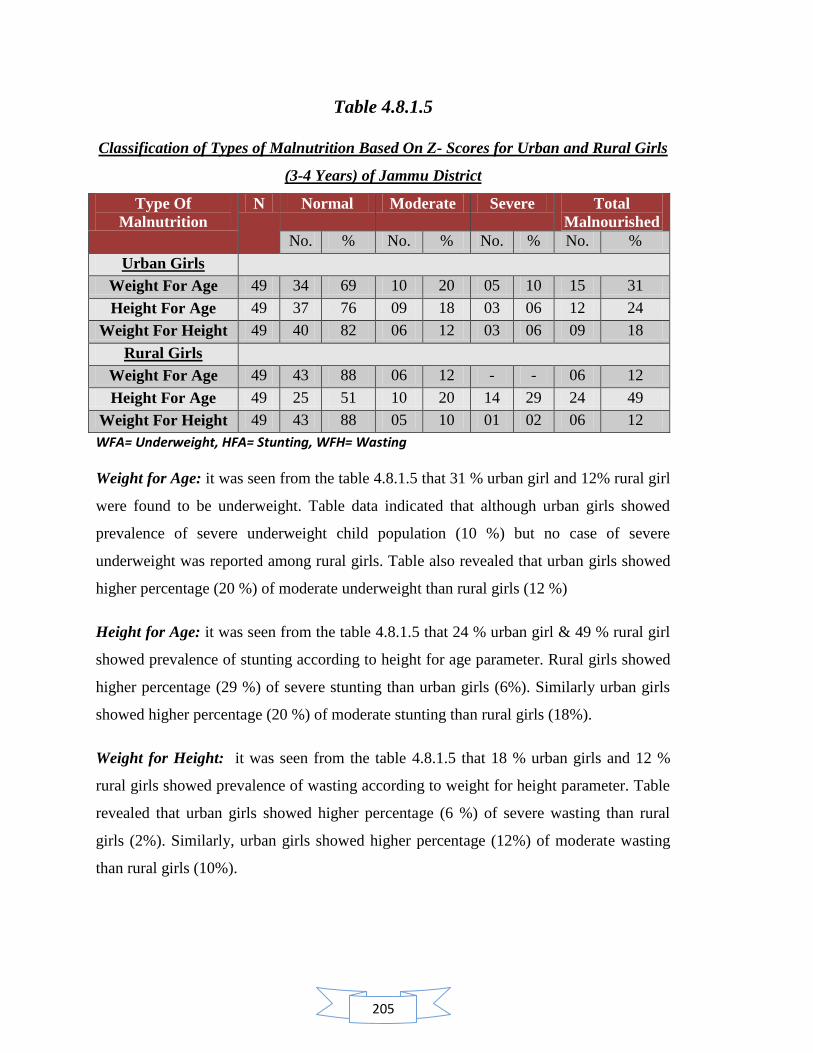
205
Table 4.8.1.5
Classification of Types of Malnutrition Based On Z- Scores for Urban and Rural Girls
(3-4 Years) of Jammu District
Type Of
Malnutrition
N Normal Moderate Severe Total
Malnourished
No. % No. % No. % No. %
Urban Girls
Weight For Age 49 34 69 10 20 05 10 15 31
Height For Age 49 37 76 09 18 03 06 12 24
Weight For Height 49 40 82 06 12 03 06 09 18
Rural Girls
Weight For Age 49 43 88 06 12 - - 06 12
Height For Age 49 25 51 10 20 14 29 24 49
Weight For Height 49 43 88 05 10 01 02 06 12
WFA= Underweight, HFA= Stunting, WFH= Wasting
Weight for Age: it was seen from the table 4.8.1.5 that 31 % urban girl and 12% rural girl
were found to be underweight. Table data indicated that although urban girls showed
prevalence of severe underweight child population (10 %) but no case of severe
underweight was reported among rural girls. Table also revealed that urban girls showed
higher percentage (20 %) of moderate underweight than rural girls (12 %)
Height for Age: it was seen from the table 4.8.1.5 that 24 % urban girl & 49 % rural girl
showed prevalence of stunting according to height for age parameter. Rural girls showed
higher percentage (29 %) of severe stunting than urban girls (6%). Similarly urban girls
showed higher percentage (20 %) of moderate stunting than rural girls (18%).
Weight for Height: it was seen from the table 4.8.1.5 that 18 % urban girls and 12 %
rural girls showed prevalence of wasting according to weight for height parameter. Table
revealed that urban girls showed higher percentage (6 %) of severe wasting than rural
girls (2%). Similarly, urban girls showed higher percentage (12%) of moderate wasting
than rural girls (10%).
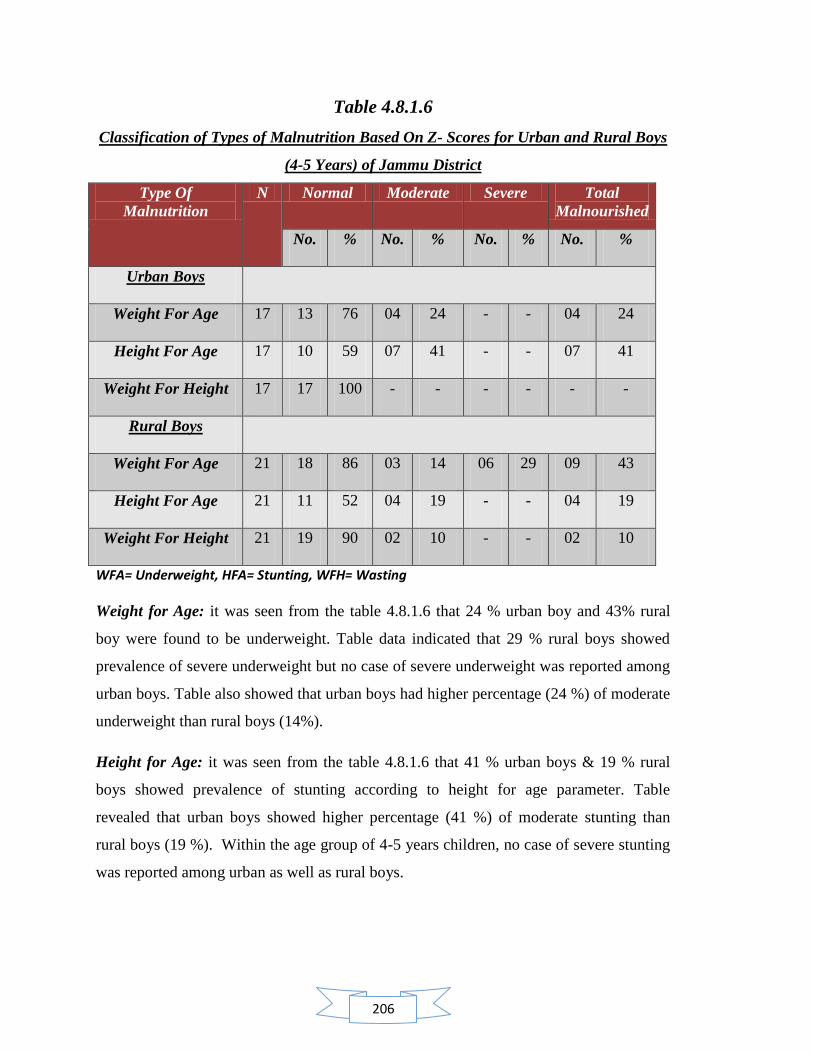
206
Table 4.8.1.6
Classification of Types of Malnutrition Based On Z- Scores for Urban and Rural Boys
(4-5 Years) of Jammu District
Type Of
Malnutrition
N Normal Moderate Severe Total
Malnourished
No. % No. % No. % No. %
Urban Boys
Weight For Age 17 13 76 04 24 - - 04 24
Height For Age 17 10 59 07 41 - - 07 41
Weight For Height 17 17 100 - - - - - -
Rural Boys
Weight For Age 21 18 86 03 14 06 29 09 43
Height For Age 21 11 52 04 19 - - 04 19
Weight For Height 21 19 90 02 10 - - 02 10
WFA= Underweight, HFA= Stunting, WFH= Wasting
Weight for Age: it was seen from the table 4.8.1.6 that 24 % urban boy and 43% rural
boy were found to be underweight. Table data indicated that 29 % rural boys showed
prevalence of severe underweight but no case of severe underweight was reported among
urban boys. Table also showed that urban boys had higher percentage (24 %) of moderate
underweight than rural boys (14%).
Height for Age: it was seen from the table 4.8.1.6 that 41 % urban boys & 19 % rural
boys showed prevalence of stunting according to height for age parameter. Table
revealed that urban boys showed higher percentage (41 %) of moderate stunting than
rural boys (19 %). Within the age group of 4-5 years children, no case of severe stunting
was reported among urban as well as rural boys.

207
Weight for Height: it was seen from the table 4.8.1.6 that although 10 % rural boys
showed prevalence of wasting according to weight for height parameter in form of
moderate wasting but no case of malnourishment was found among urban boys.
Table 4.8.1.7
Classification of Types of Malnutrition Based On Z- Scores for Urban and Rural Girls
(4-5 Years) of Jammu District
Type Of
Malnutrition
N Normal Moderate Severe Total
Malnourished
No. % No. % No. % No. %
Urban Girls
Weight For Age 17 13 76 04 24 - - 04 24
Height For Age 17 13 576 01 06 03 18 04 24
Weight For Height 17 16 94 01 06 - - 01 06
Rural Girls
Weight For Age 27 25 93 02 07 - - 02 07
Height For Age 27 12 45 09 33 06 22 15 56
Weight For Height 27 26 96 - - 01 04 01 04
WFA= Underweight, HFA= Stunting, WFH= Wasting
Weight for Age: it was seen from the table 4.8.1.7 that 24 % urban girl and 7 % rural girl
were found to be underweight. Table data indicated that although no case of severe
underweight was reported among urban as well as rural girls. Table also revealed that
urban girls showed higher percentage (24%) of moderate underweight than rural girls
(7 %)
Height for Age: it was seen from the table 4.8.1.7 that 24 % urban girl & 56 % rural girl
showed prevalence of stunting according to height for age parameter. Rural girls showed
higher percentage (22 %) of severe stunting than urban girls (18%). Similarly rural girls
showed higher percentage (33%) of moderate stunting than urban girls (6%).
Weight for Height: it was seen from the table 4.8.1.7 that 6 % urban girls and 4 % rural
girls showed prevalence of wasting according to weight for height parameter. Table
revealed that 1% rural girls showed severe wasting but no case of severe wasting was
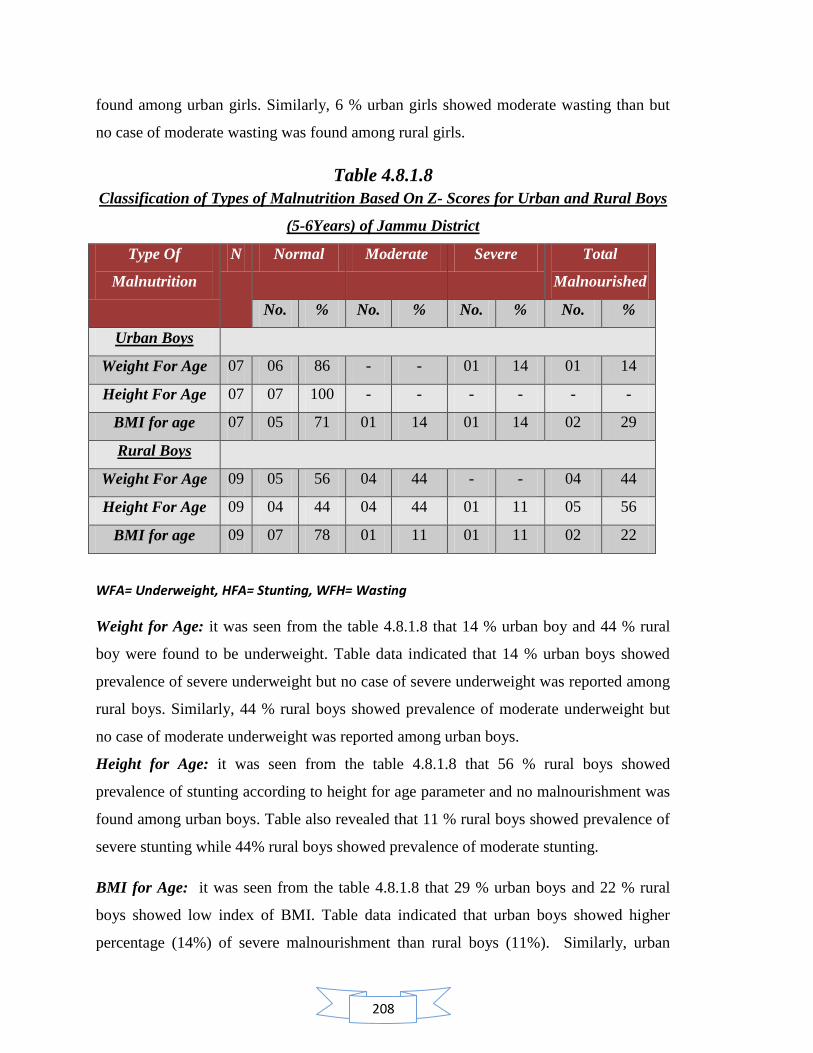
208
found among urban girls. Similarly, 6 % urban girls showed moderate wasting than but
no case of moderate wasting was found among rural girls.
Table 4.8.1.8
Classification of Types of Malnutrition Based On Z- Scores for Urban and Rural Boys
(5-6Years) of Jammu District
Type Of
Malnutrition
N Normal Moderate Severe Total
Malnourished
No. % No. % No. % No. %
Urban Boys
Weight For Age 07 06 86 - - 01 14 01 14
Height For Age 07 07 100 - - - - - -
BMI for age 07 05 71 01 14 01 14 02 29
Rural Boys
Weight For Age 09 05 56 04 44 - - 04 44
Height For Age 09 04 44 04 44 01 11 05 56
BMI for age 09 07 78 01 11 01 11 02 22
WFA= Underweight, HFA= Stunting, WFH= Wasting
Weight for Age: it was seen from the table 4.8.1.8 that 14 % urban boy and 44 % rural
boy were found to be underweight. Table data indicated that 14 % urban boys showed
prevalence of severe underweight but no case of severe underweight was reported among
rural boys. Similarly, 44 % rural boys showed prevalence of moderate underweight but
no case of moderate underweight was reported among urban boys.
Height for Age: it was seen from the table 4.8.1.8 that 56 % rural boys showed
prevalence of stunting according to height for age parameter and no malnourishment was
found among urban boys. Table also revealed that 11 % rural boys showed prevalence of
severe stunting while 44% rural boys showed prevalence of moderate stunting.
BMI for Age: it was seen from the table 4.8.1.8 that 29 % urban boys and 22 % rural
boys showed low index of BMI. Table data indicated that urban boys showed higher
percentage (14%) of severe malnourishment than rural boys (11%). Similarly, urban

209
boys showed higher percentage (14%) of moderate malnourishment than rural boys
(11%).
Table 4.8.1.9
Classification of Types of Malnutrition Based On Z- Scores for Urban and Rural Girls
(5-6 Years) of Jammu District
Type Of
Malnutrition
N Normal Moderate Severe Total
Malnourished
No. % No. % No. % No. %
Urban Girls
Weight For Age 10 08 80 02 20 - - 02 20
Height For Age 10 08 80 01 10 01 10 02 20
BMI for age 10 09 90 01 10 - - 01 10
Rural Girls
Weight For Age 11 08 73 03 27 - - 03 27
Height For Age 11 05 45 06 55 - - 06 55
BMI for age 11 11 100 - - - - - -
WFA= Underweight, HFA= Stunting, WFH= Wasting
Weight for Age: it was seen from the table 4.8.1.9 that 20 % urban girl and 27% rural
girls were found to be underweight. Table data indicated that 27 % rural girls showed
higher percentage of moderate underweight than urban girls (20%). No case of severe
underweight was reported among urban as well as rural girls.
Height for Age: it was seen from the table 4.8.1.9 that 20 % urban girl and 27 % rural
girls showed prevalence of stunting according to height for age parameter. Table also
revealed that 10 % urban girls showed prevalence of severe stunting while no case of
severe stunting was found among rural girls. Similarly, rural girls showed higher
percentage (55%) of moderate stunting than urban girls (10 %).
BMI for Age: it was seen from the table 4.8.1.9 that 10 % urban girls showed low index
of BMI and no case of malnourishment was found among rural girls. Table data indicated
that 10 % urban girls showed prevalence of moderate malnourishment and no case of
severe malnourishment was found among urban girls.
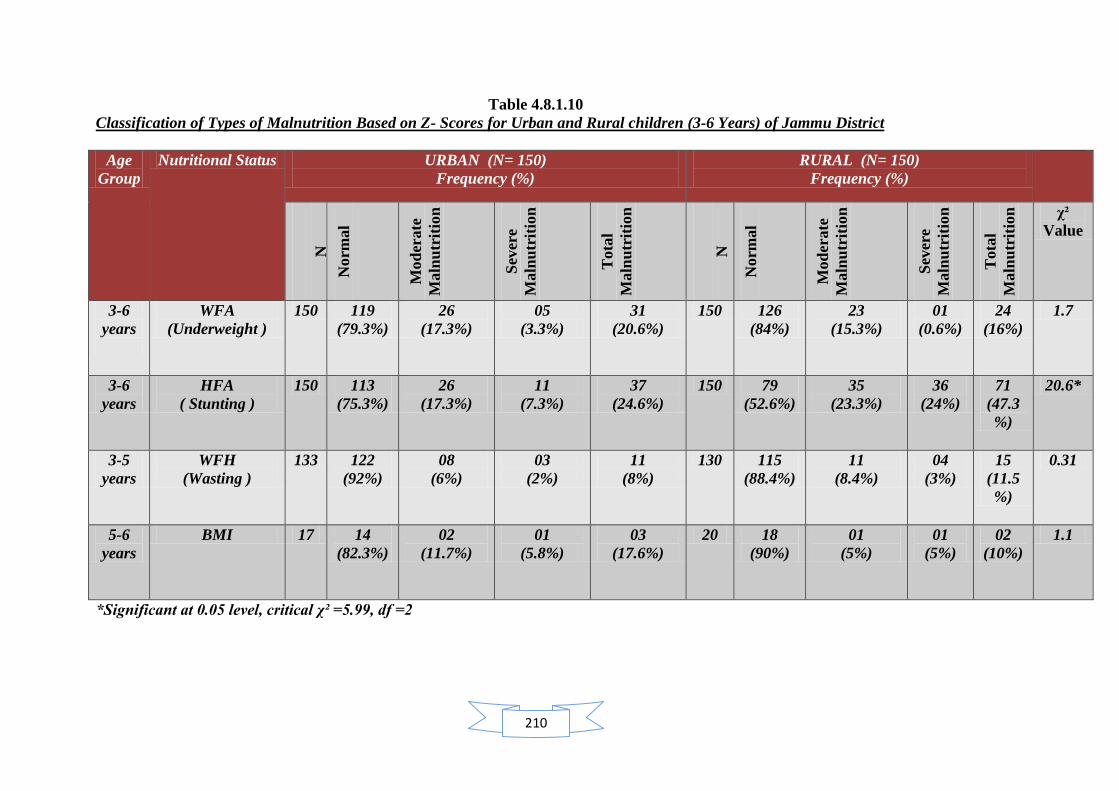
210
Table 4.8.1.10
Classification of Types of Malnutrition Based on Z- Scores for Urban and Rural children (3-6 Years) of Jammu District
Age
Group
Nutritional Status URBAN (N= 150)
Frequency (%)
RURAL (N= 150)
Frequency (%)
N
Norm
al
Mod
erate
Maln
utr
itio
n
Sev
ere
Maln
utr
itio
n
Tota
l
Maln
utr
itio
n
N
Norm
al
Mod
erate
Maln
utr
itio
n
Sev
ere
Maln
utr
itio
n
Tota
l
Maln
utr
itio
n
χ²
Value
3-6
years
WFA
(Underweight )
150 119
(79.3%)
26
(17.3%)
05
(3.3%)
31
(20.6%)
150 126
(84%)
23
(15.3%)
01
(0.6%)
24
(16%)
1.7
3-6
years
HFA
( Stunting )
150 113
(75.3%)
26
(17.3%)
11
(7.3%)
37
(24.6%)
150 79
(52.6%)
35
(23.3%)
36
(24%)
71
(47.3
%)
20.6*
3-5
years
WFH
(Wasting )
133 122
(92%)
08
(6%)
03
(2%)
11
(8%)
130 115
(88.4%)
11
(8.4%)
04
(3%)
15
(11.5
%)
0.31
5-6
years
BMI 17 14
(82.3%)
02
(11.7%)
01
(5.8%)
03
(17.6%)
20 18
(90%)
01
(5%)
01
(5%)
02
(10%)
1.1
*Significant at 0.05 level, critical χ² =5.99, df =2
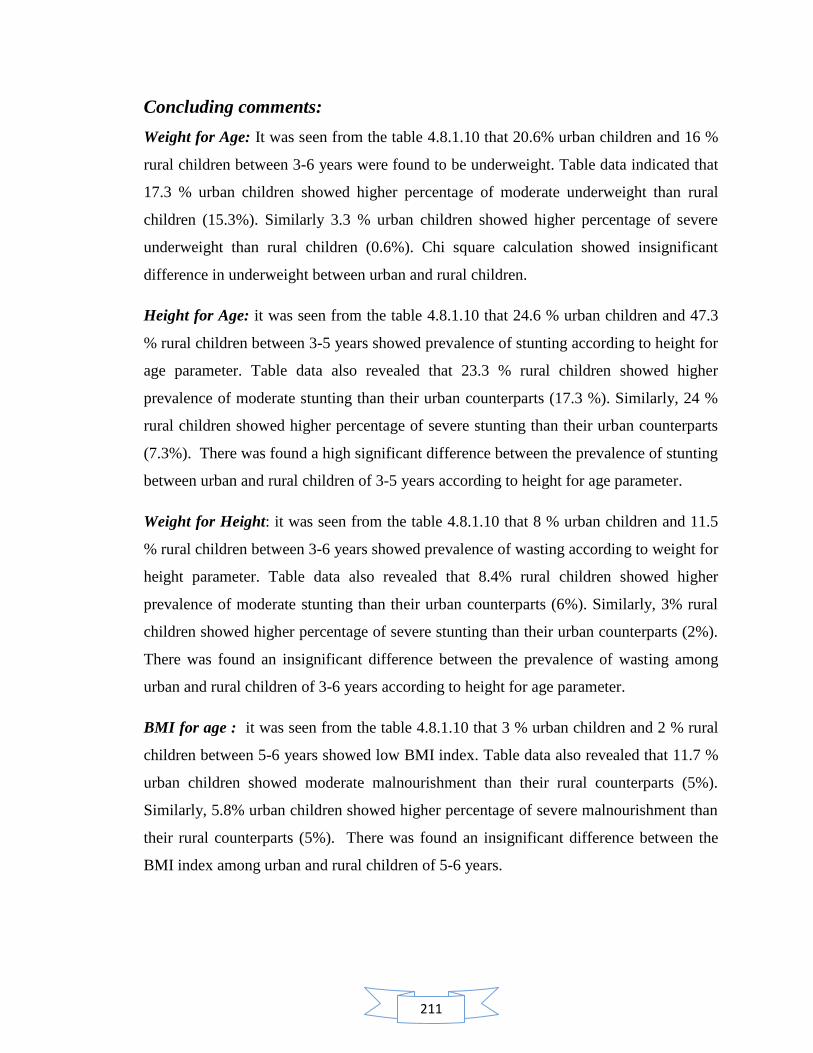
211
Concluding comments:
Weight for Age: It was seen from the table 4.8.1.10 that 20.6% urban children and 16 %
rural children between 3-6 years were found to be underweight. Table data indicated that
17.3 % urban children showed higher percentage of moderate underweight than rural
children (15.3%). Similarly 3.3 % urban children showed higher percentage of severe
underweight than rural children (0.6%). Chi square calculation showed insignificant
difference in underweight between urban and rural children.
Height for Age: it was seen from the table 4.8.1.10 that 24.6 % urban children and 47.3
% rural children between 3-5 years showed prevalence of stunting according to height for
age parameter. Table data also revealed that 23.3 % rural children showed higher
prevalence of moderate stunting than their urban counterparts (17.3 %). Similarly, 24 %
rural children showed higher percentage of severe stunting than their urban counterparts
(7.3%). There was found a high significant difference between the prevalence of stunting
between urban and rural children of 3-5 years according to height for age parameter.
Weight for Height: it was seen from the table 4.8.1.10 that 8 % urban children and 11.5
% rural children between 3-6 years showed prevalence of wasting according to weight for
height parameter. Table data also revealed that 8.4% rural children showed higher
prevalence of moderate stunting than their urban counterparts (6%). Similarly, 3% rural
children showed higher percentage of severe stunting than their urban counterparts (2%).
There was found an insignificant difference between the prevalence of wasting among
urban and rural children of 3-6 years according to height for age parameter.
BMI for age : it was seen from the table 4.8.1.10 that 3 % urban children and 2 % rural
children between 5-6 years showed low BMI index. Table data also revealed that 11.7 %
urban children showed moderate malnourishment than their rural counterparts (5%).
Similarly, 5.8% urban children showed higher percentage of severe malnourishment than
their rural counterparts (5%). There was found an insignificant difference between the
BMI index among urban and rural children of 5-6 years.
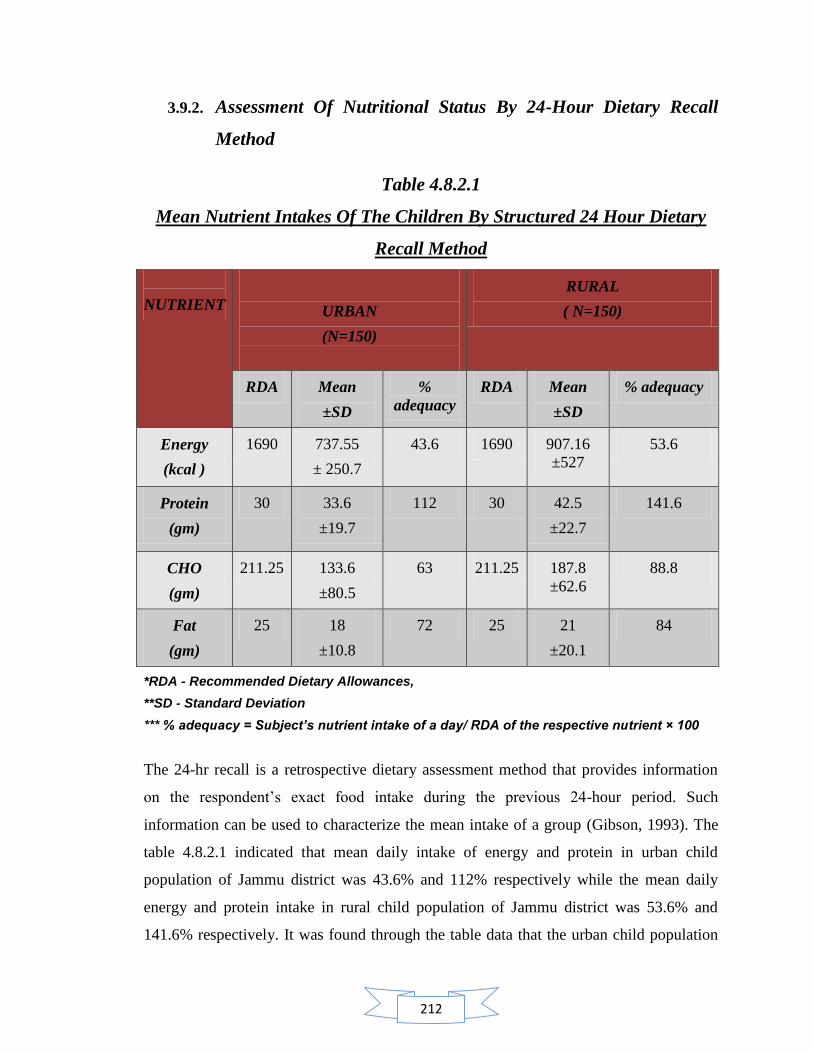
212
3.9.2. Assessment Of Nutritional Status By 24-Hour Dietary Recall
Method
Table 4.8.2.1
Mean Nutrient Intakes Of The Children By Structured 24 Hour Dietary
Recall Method
NUTRIENT
URBAN
(N=150)
RURAL
( N=150)
RDA Mean
±SD
%
adequacy
RDA Mean
±SD
% adequacy
Energy
(kcal )
1690 737.55
± 250.7
43.6 1690 907.16
±527
53.6
Protein
(gm)
30 33.6
±19.7
112 30 42.5
±22.7
141.6
CHO
(gm)
211.25 133.6
±80.5
63 211.25 187.8
±62.6
88.8
Fat
(gm)
25 18
±10.8
72 25 21
±20.1
84
*RDA - Recommended Dietary Allowances,
**SD - Standard Deviation
*** % adequacy = Subject’s nutrient intake of a day/ RDA of the respective nutrient × 100
The 24-hr recall is a retrospective dietary assessment method that provides information
on the respondent‘s exact food intake during the previous 24-hour period. Such
information can be used to characterize the mean intake of a group (Gibson, 1993). The
table 4.8.2.1 indicated that mean daily intake of energy and protein in urban child
population of Jammu district was 43.6% and 112% respectively while the mean daily
energy and protein intake in rural child population of Jammu district was 53.6% and
141.6% respectively. It was found through the table data that the urban child population
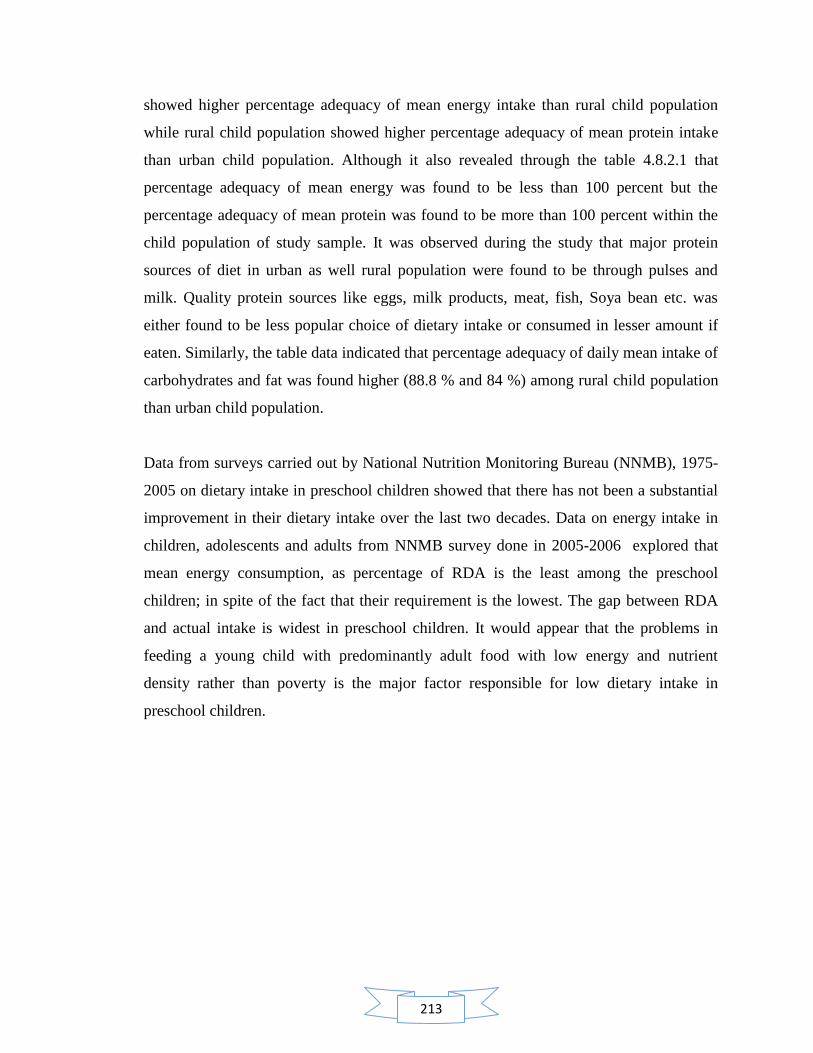
213
showed higher percentage adequacy of mean energy intake than rural child population
while rural child population showed higher percentage adequacy of mean protein intake
than urban child population. Although it also revealed through the table 4.8.2.1 that
percentage adequacy of mean energy was found to be less than 100 percent but the
percentage adequacy of mean protein was found to be more than 100 percent within the
child population of study sample. It was observed during the study that major protein
sources of diet in urban as well rural population were found to be through pulses and
milk. Quality protein sources like eggs, milk products, meat, fish, Soya bean etc. was
either found to be less popular choice of dietary intake or consumed in lesser amount if
eaten. Similarly, the table data indicated that percentage adequacy of daily mean intake of
carbohydrates and fat was found higher (88.8 % and 84 %) among rural child population
than urban child population.
Data from surveys carried out by National Nutrition Monitoring Bureau (NNMB), 1975-
2005 on dietary intake in preschool children showed that there has not been a substantial
improvement in their dietary intake over the last two decades. Data on energy intake in
children, adolescents and adults from NNMB survey done in 2005-2006 explored that
mean energy consumption, as percentage of RDA is the least among the preschool
children; in spite of the fact that their requirement is the lowest. The gap between RDA
and actual intake is widest in preschool children. It would appear that the problems in
feeding a young child with predominantly adult food with low energy and nutrient
density rather than poverty is the major factor responsible for low dietary intake in
preschool children.
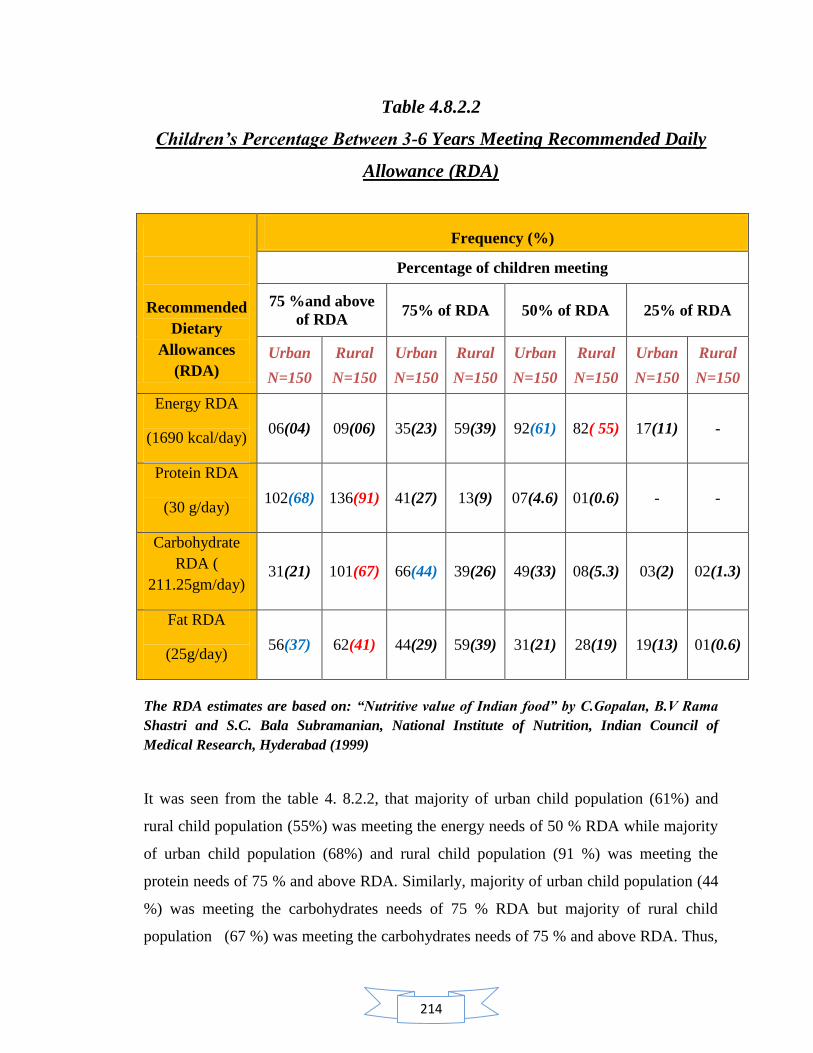
214
Table 4.8.2.2
Children’s Percentage Between 3-6 Years Meeting Recommended Daily
Allowance (RDA)
Recommended
Dietary
Allowances
(RDA)
Frequency (%)
Percentage of children meeting
75 %and above
of RDA 75% of RDA 50% of RDA 25% of RDA
Urban
N=150
Rural
N=150
Urban
N=150
Rural
N=150
Urban
N=150
Rural
N=150
Urban
N=150
Rural
N=150
Energy RDA
(1690 kcal/day) 06(04) 09(06) 35(23) 59(39) 92(61) 82( 55) 17(11) -
Protein RDA
(30 g/day) 102(68) 136(91) 41(27) 13(9) 07(4.6) 01(0.6) - -
Carbohydrate
RDA (
211.25gm/day) 31(21) 101(67) 66(44) 39(26) 49(33) 08(5.3) 03(2) 02(1.3)
Fat RDA
(25g/day) 56(37) 62(41) 44(29) 59(39) 31(21) 28(19) 19(13) 01(0.6)
The RDA estimates are based on: “Nutritive value of Indian food” by C.Gopalan, B.V Rama
Shastri and S.C. Bala Subramanian, National Institute of Nutrition, Indian Council of
Medical Research, Hyderabad (1999)
It was seen from the table 4. 8.2.2, that majority of urban child population (61%) and
rural child population (55%) was meeting the energy needs of 50 % RDA while majority
of urban child population (68%) and rural child population (91 %) was meeting the
protein needs of 75 % and above RDA. Similarly, majority of urban child population (44
%) was meeting the carbohydrates needs of 75 % RDA but majority of rural child
population (67 %) was meeting the carbohydrates needs of 75 % and above RDA. Thus,

215
cereal consumption and other carbohydrates food consumption was found more in
frequency in rural child population than urban child population both in terms of quantity
and quality. Table 4.8.2.2 also indicated that majority of urban child population (37 %)
and rural child population (41%) was meeting the fat need of 75 % and above RDA.
Thus, the table indicated that rural child population was closer in meeting higher needs of
nutrients like protein, carbohydrates and fats as per recommended dietary allowances
(RDA) than urban child population. Energy needs was fulfilled up to only 50 % of RDA
in both population, urban as well as rural.
Time trends in intra familial distribution of food indicate that while the proportion of
families where both the adults and preschool children have adequate food has remained at
about 30% over the last 20 years, the proportion of families with inadequate intake has
come down substantially. However, the proportion of families where the preschool
children receive inadequate intake while adults have adequate intake has nearly doubled.
This is in spite of the fact that the RDA for preschool children forms a very small
proportion (on an average 1300 kcal/day) of the family‘s total intake of around 11000
kcal/day (assuming a family size of 5). These data confirm that in the last decade more
than poverty, poor young child feeding and caring practices are responsible for
inadequate dietary intake in preschool children. (National nutrition monitoring bureau,
2005)
Concluding comments: On the basis of findings of table 4.8.2.1 and 4.8.2.2, the study
revealed that in spite of higher percentage adequacy of nutrient intake by rural children,
they were significantly reported to be more malnourished for stunting (HFA) in
comparison to urban preschool children.
216
Contents:
4.9 Evaluation of the final output and expected output of nutritional services at
anganwadi centers
4.9.1 Evaluation of actual output and expected output of nutritional services
at anganwadi centre
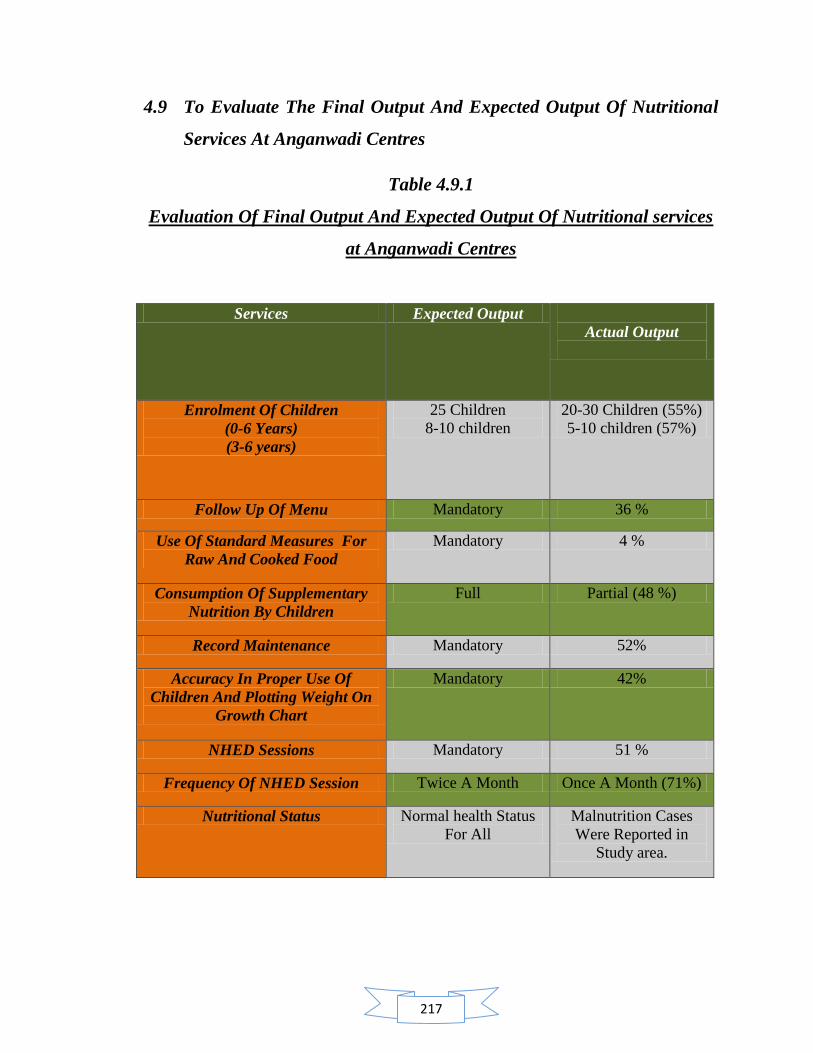
217
4.9 To Evaluate The Final Output And Expected Output Of Nutritional
Services At Anganwadi Centres
Table 4.9.1
Evaluation Of Final Output And Expected Output Of Nutritional services
at Anganwadi Centres
Services Expected Output
Actual Output
Enrolment Of Children
(0-6 Years)
(3-6 years)
25 Children
8-10 children
20-30 Children (55%)
5-10 children (57%)
Follow Up Of Menu Mandatory 36 %
Use Of Standard Measures For
Raw And Cooked Food
Mandatory 4 %
Consumption Of Supplementary
Nutrition By Children
Full Partial (48 %)
Record Maintenance Mandatory 52%
Accuracy In Proper Use Of
Children And Plotting Weight On
Growth Chart
Mandatory 42%
NHED Sessions Mandatory 51 %
Frequency Of NHED Session Twice A Month Once A Month (71%)
Nutritional Status Normal health Status
For All
Malnutrition Cases
Were Reported in
Study area.
218
The table 4.10.1 revealed that there is huge difference between the expected output and
actual output of nutritional services. Every anganwadi centre is entitled to enroll 25
children (0-6 years) from its area. The present study revealed that majority anganwadi
centres had enrolment of 20-30 children (55%) in the age group of 0-6 years while 5-10
children ( 57 %) in the age group of 3-6 years. Follow of menu is a mandatory practice
expected among anganwadi workers but the study finding revealed that only 36 %
anganwadi workers followed official menu. Use of standard measure for both raw and
cooked food is another mandatory practice expected from anganwadi workers but the
study data revealed that the implementation of use of standard measures for both raw and
cooked food was the most neglected one as only 4 % anganwadi workers were found to
practice the implementation of these services. Consumption of full meal of
supplementary nutrition by children attending anganwadi centre is another mandatory
parameter expected to be fulfilled by anganwadi workers as she received a formal
training for handling children at anganwadi centre. But in spite of trained status of
majority (72%) of anganwadi workers, the food consumption of supplementary nutrition
by children was reported to be partial (48%). Accuracy in proper use of children and
plotting weight on growth chart are important parameters of growth monitoring for
malnutrition. Anganwadi workers are expected to be accurate and skill full for these
practices as they receive a formal training for execution of these services. The findings of
the study indicated that 42% anganwadi workers were accurate for both of these services.
Similarly, anganwadi centres are mandated to conduct Nutrition and Health Education
sessions twice a month with the community of its respective area. The study findings
revealed that 51 % anganwadi workers conducted nutrition and health education (NHED)
sessions at their respective centres. Majority (71%) of them had conducted Nutrition and
Health Education sessions for once a month.
On the basis of interactions with officers from social welfare department, it figured that
the department of social welfare works for free hand improvement policy in reference to
targets of nutritional status. It aims for the maximum improvement on yearly basis and
thus directs the efforts of the programme towards the attainment of normal health status
of all beneficiaries. CDPO‘s and supervisors are expected to provide the needed guidance
to anganwadi workers to improve the implementation of nutritional services and
219
nutritional status of beneficiaries at anganwadi centres. The study revealed that in urban
zone of study area 20.6% (WFA) , 24.6 % (HFA) , 8% (WFH) and 17.6% (BMI)
preschool children (3-6 years) were reported to be malnourished either moderately or
severely Similarly, in rural zone of study area 16% (WFA) , 47.3% (HFA) , 11.5 %
(WFH) and 10 % (BMI) preschool children (3-6 years) were reported to be
malnourished either moderately or severely. The study found that the percentage
adequacy of nutrient intake in urban zone of study area by preschool children was 43.6%
(Energy), 112 % (Protein), 63 % (Carbohydrates) and 72 % (Fats). Similarly, the
percentage adequacy of nutrient intake in rural zone of study area by preschool children
was 53.6% (Energy), 141.6 %( Praotein), 88 %( Carbohydrates) and 84 %( Fats). Thus,
the study revealed that in spite of higher percentage adequacy of nutrient intake by rural
children, they were reported to be more malnourished for stunting ( HFA) and wasting
(WFA) in comparison to urban preschool children.
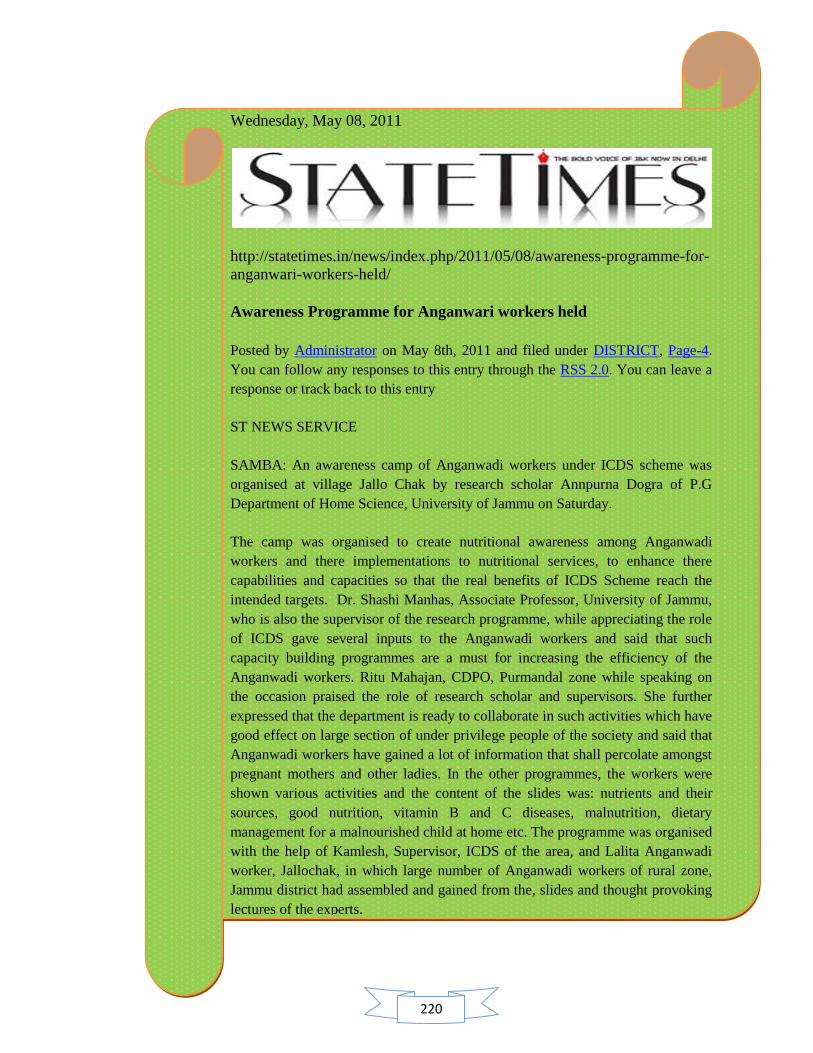
220
Wednesday, May 08, 2011
http://statetimes.in/news/index.php/2011/05/08/awareness-programme-for-
anganwari-workers-held/
Awareness Programme for Anganwari workers held
Posted by Administrator on May 8th, 2011 and filed under DISTRICT, Page-4.
You can follow any responses to this entry through the RSS 2.0. You can leave a
response or track back to this entry
ST NEWS SERVICE
SAMBA: An awareness camp of Anganwadi workers under ICDS scheme was
organised at village Jallo Chak by research scholar Annpurna Dogra of P.G
Department of Home Science, University of Jammu on Saturday.
The camp was organised to create nutritional awareness among Anganwadi
workers and there implementations to nutritional services, to enhance there
capabilities and capacities so that the real benefits of ICDS Scheme reach the
intended targets. Dr. Shashi Manhas, Associate Professor, University of Jammu,
who is also the supervisor of the research programme, while appreciating the role
of ICDS gave several inputs to the Anganwadi workers and said that such
capacity building programmes are a must for increasing the efficiency of the
Anganwadi workers. Ritu Mahajan, CDPO, Purmandal zone while speaking on
the occasion praised the role of research scholar and supervisors. She further
expressed that the department is ready to collaborate in such activities which have
good effect on large section of under privilege people of the society and said that
Anganwadi workers have gained a lot of information that shall percolate amongst
pregnant mothers and other ladies. In the other programmes, the workers were
shown various activities and the content of the slides was: nutrients and their
sources, good nutrition, vitamin B and C diseases, malnutrition, dietary
management for a malnourished child at home etc. The programme was organised
with the help of Kamlesh, Supervisor, ICDS of the area, and Lalita Anganwadi
worker, Jallochak, in which large number of Anganwadi workers of rural zone,
Jammu district had assembled and gained from the, slides and thought provoking
lectures of the experts.
221
4.10 Intervention Programme
An intervention program is a social programme designed to help with conditions that are
recurrent in society and help to identify problems and try to prevent future cases as early
as possible. These are a kind of revolving programme that apply the principle of ―those
that went before us‖ with information on tell-tale signs about the said condition, what to
do if these signs arise and where to find the best possible help if need be. There are many
kinds of intervention programs, some behavioral, others developmental, psychological
and even social. These are either preventive, for conditions which have yet to arise, or
remedial, for existing conditions. (http://interventionprogram.com/what-is-an-
intervention-program) Thus, intervention programs are those programs whose purpose is
to help and take control of a problem while it is still in its infancy. These are designed to
try to achieve results at the earliest available opportunity. Keeping in view, the findings
of the study, the intervention programme was designed specifically to improve the level
of nutritional awareness with the target of ultimately improving the knowledge regarding
importance of proper implementation of the nutritional services at anganwadi centers and
utilization of available resources in a much better way to achieve expected targets.
4.10.1: Major areas (issues) covered for intervention programme: On the basis of the
finding of study, major problematic areas were identified for which intervention
programme could be designed. Following were the major problematic areas explored by
the findings of study:
Lacking areas explored by the study under implementation of nutritional services at
anganwadi centers
Follow up of menu was found only up to 36 %.
Use of standard measure for distribution of cooked food was 5 %.
Use of standard measure for both raw and cooked food was 4 %. Majority of
anganwadi workers were using standard measure for raw food only.
At 8 %anganwadi centers of study area, food consumption by children at
anganwadi centre was found to be nil.
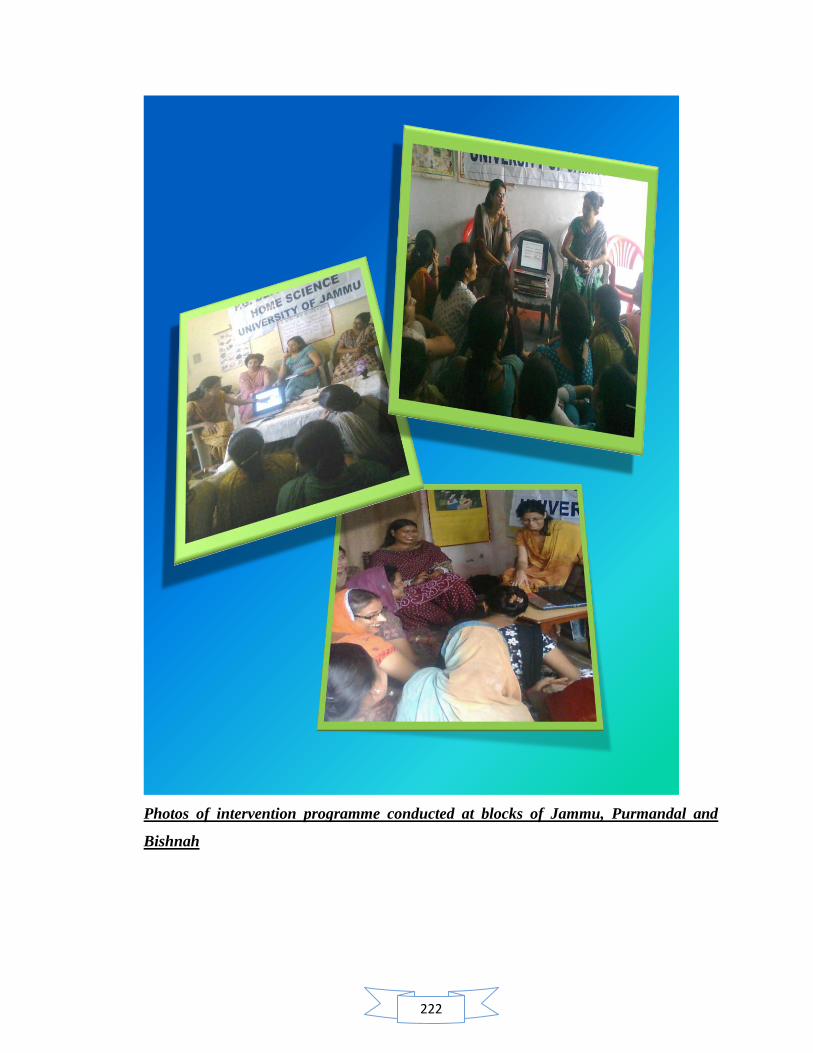
222
Photos of intervention programme conducted at blocks of Jammu, Purmandal and
Bishnah
223
19 % centers were not using any scale for weighing of children.
Record maintenance found at anganwadi centre was 52%.
Accuracy in plotting weight on growth chart was 49%.
Accuracy in proper use of weighing scale was 57 %.
Accuracy in both skills i.e. plotting weight on growth chart and proper use of
weighing scale was 42 %.
51% anganwadi centers were conducting independent NHED session while 13 %
anganwadi centers were not conducting any NHED session.
Lacking areas explored by the study regarding nutritional awareness among
anganwadi workers
Majority (73 %) of anganwadi workers were medium aware while 16 % were
highly aware.
48 % were aware for caloric requirement of supplementary food of pre schoolars
in ICDS.
57 % were aware of caloric requirement of supplementary food for
malnourished children in ICDS.
25 % were familiar with energy food while only 20 % were familiar with
protective food.
RDA‘s were not clear to anganwadi workers. 13 % were familiar with full form
of RDA while only 8 % were familiar with Recommended Dietary Allowances
for preschool children.
Only 3 % were familiar with calorie per nutrient.
49 % of anganwadi workers were familiar with type of malnutrition
40 % had clarity regarding diarrhea.
Only 21% and 38 % anganwadi workers were aware regarding deficiency
diseases, Beri beri and Scurvy respectively. Awareness regarding vitamin B and
C deficiency diseases, their symptoms and sources of these vitamins was found
very poor.
224
Thus, need was found on areas for conducting intervention programs:
1. Importance of proper implementation of nutritional services and its effect
2. Awareness among anganwadi workers regarding nutrition and nutritional services
at anganwadi centre
4.10. 2: Conducting intervention programme: On the basis of findings of the study,
total 6 intervention programs were conducted (2 per block). These program were
conducted in Jammu block, Purmandal block and Bishnah block with a group of 20-25
anganwadi workers, their supervisors and CDPO‘s. A power point presentation and
informal discussion method was used for the intervention programme. An attempt was
made to aware anganwadi workers on current information of nutrition knowledge and
basic concepts of nutrition covered under ICDS with the help of diagrammatic and text
slides. After presenting the power point presentation on nutritional awareness, a group
discussion was organized where the lacking areas of implementation of nutritional
services in reflection of nutrition knowledge provided through power point presentation,
was discussed with anganwadi workers. The whole programme aimed at increasing the
awareness among anganwadi workers regarding the nutritional knowledge and
importance of proper implementation of nutritional services, with the active participation
of anganwadi workers in intervention programme through group discussion method.
During the process of intervention the anganwadi workers were encouraged to ask
questions for clarity of their doubts related to above mentioned areas. In this way lot of
misconception was clarified regarding nutrition myths and facts. Use of local language,
Dogri was preferred to make them understand the concept on different issues covered in
the intervention programme. Stories from the field were shared with them to make them
understand the actual scenario of implementation of nutritional services and their impact
on actual output, thus motivating them towards the attempt of perfection in their
execution of services.
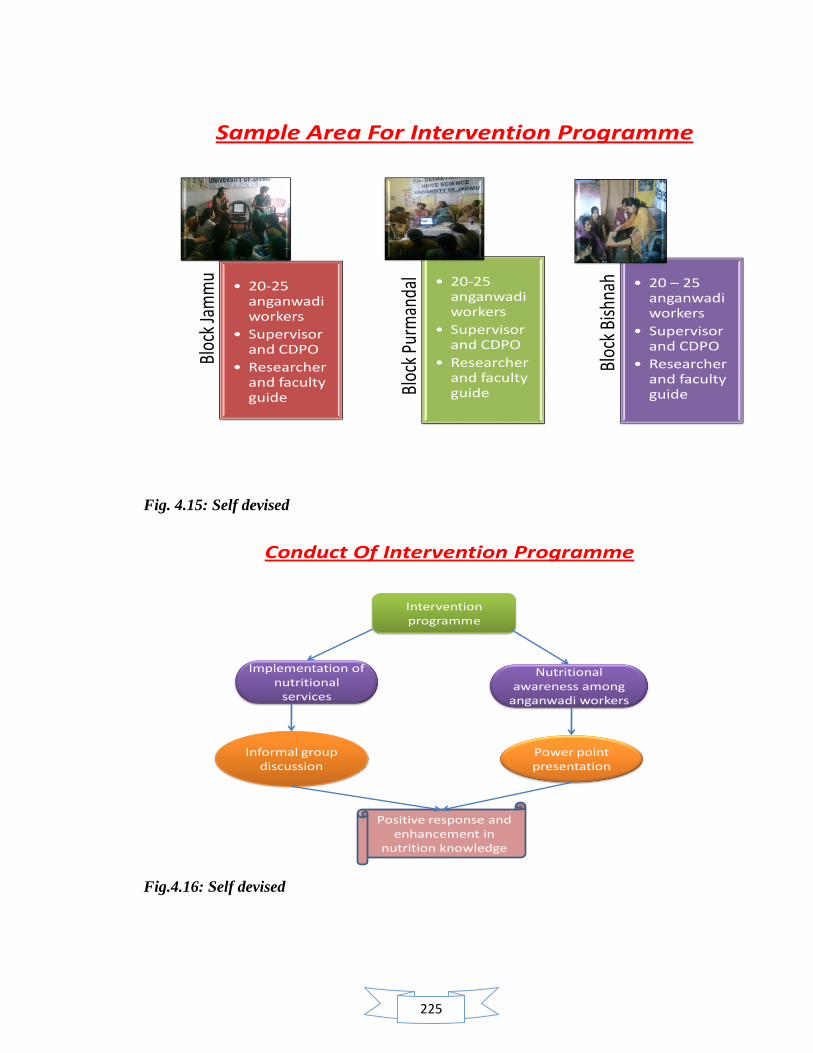
225
Sample Area For Intervention Programme
Bloc
k Ja
mm
u
• 20-25 anganwadi workers
• Supervisor and CDPO
• Researcher and faculty guide Bl
ock
Purm
anda
l • 20-25 anganwadi workers
• Supervisor and CDPO
• Researcher and faculty guide
Bloc
k Bi
shna
h • 20 – 25 anganwadi workers
• Supervisor and CDPO
• Researcher and faculty guide
Fig. 4.15: Self devised
Conduct Of Intervention Programme
Intervention programme
Implementation of nutritional
services
Nutritional awareness among
anganwadi workers
Informal group discussion
Power point presentation
Positive response and enhancement in
nutrition knowledge
Fig.4.16: Self devised
226
4.10.3: Communication approaches adopted during the programme: Communication
is a process of transferring information from one entity to another. However, it is not just
a process. It's an art of first listening or reading the information, comprehending it,
processing it and then transferring it. There is a huge amount of effort that goes into
communication. Gesticulations, voice modulation, body language and the spoken
language are some of the important aspects of communication. If the other person is
unable to comprehend any of these factors, then the process fails.
Types of Communication and Their Importance: Communication is the root of all
events, daily interaction, social affairs and anything that requires the purpose of human
dealings. We have technology to enhance the idea of communication by making it
simpler, faster, effective and convenient, no matter where you are on the globe. There are
four kinds of communication which we will overview that Make up the vital parts of this
process. These are...
Verbal: We do it every day; be it with our help at home, babysitters, neighbors, dog
walkers, colleagues, children, friends, family, partners, and store owners - we are
constantly in a state of communication. Whether to-the-point or elaborate, our messages
are sent across to one another in a manner that is understandable, vague or distorted.
Verbal communication is also handwritten or emailed, and is streaming in and out of
countries and within states every single day.
Non Verbal: Not everything we convey to another is done verbally, where our actions
and expressions speak for us on several occasions. We use body language and our facial
expressions to portray a feeling, be it a happy, sad or angry one.
Formal: In workplaces and other environment that are constantly communicating through
email, reports and other sorts of messages, there is a formal flow how it is written where
that air of casualness is absent. There is a system that is followed, be it while writing or
typing out the message or when conversing with superiors and others either in person or
over the phone. There is a professional stiffness that is commanded and needed in order
to maintain a level of respect, precision and clarity. The hierarchy in a company also
follows a chain of command that is practiced when it comes to who communicates to
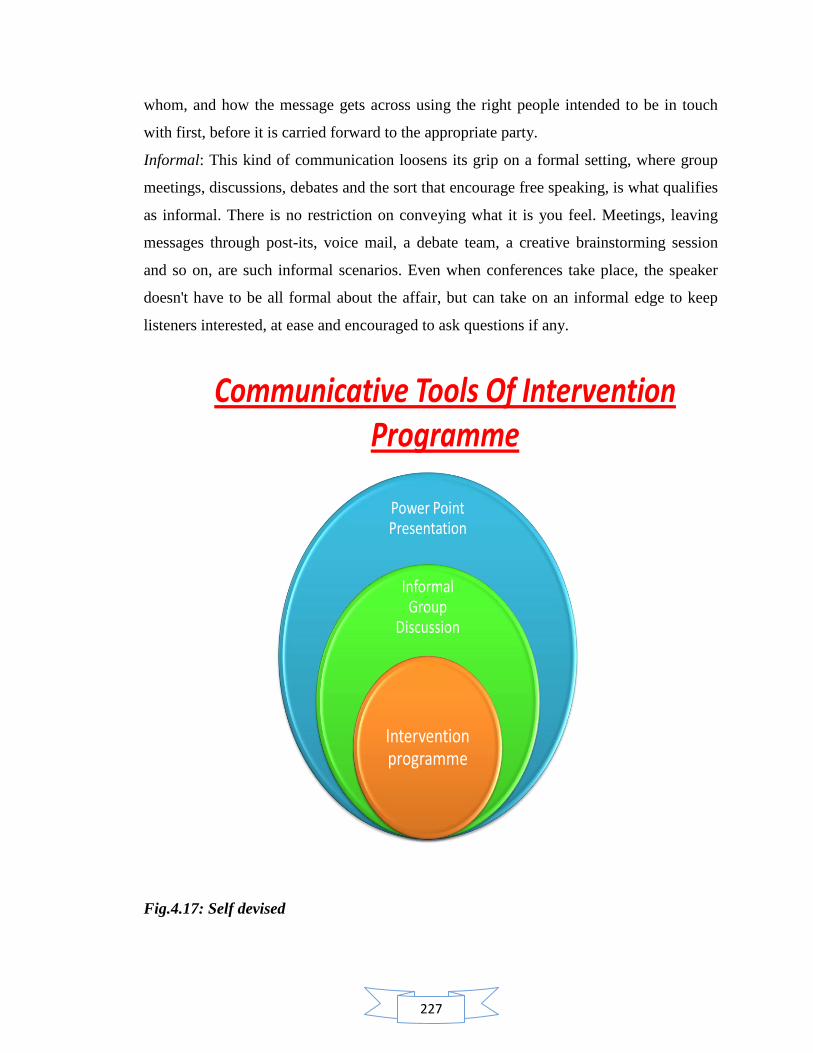
227
whom, and how the message gets across using the right people intended to be in touch
with first, before it is carried forward to the appropriate party.
Informal: This kind of communication loosens its grip on a formal setting, where group
meetings, discussions, debates and the sort that encourage free speaking, is what qualifies
as informal. There is no restriction on conveying what it is you feel. Meetings, leaving
messages through post-its, voice mail, a debate team, a creative brainstorming session
and so on, are such informal scenarios. Even when conferences take place, the speaker
doesn't have to be all formal about the affair, but can take on an informal edge to keep
listeners interested, at ease and encouraged to ask questions if any.
Communicative Tools Of Intervention Programme
Power Point Presentation
Informal Group
Discussion
Intervention programme
Fig.4.17: Self devised
228
Keeping in mind the objective and target audience, following two communication tools
were adopted for conducting intervention programme:
1. PowerPoint Presentation: Power point presentation was prepared on following
topics after identifying the problematic areas for nutritional awareness among
anganwadi workers.
General Health and Nutrition: in this section, food and sources of
nutrients, balanced diets were discussed.
Deficiency Diseases: in this section, functions of vitamin B and C, their
deficiency diseases and food sources of vitamin B and C was discussed.
Protein Energy Malnutrition: in this section, Protein energy malnutrition,
its causes and dietary malnutrition was discussed.
Recipe Modification for Dietary Needs Of Malnourished Children: in
this section management of mild, moderate and severe degree of
malnutrition through recipe modification was discussed.
During the study, it was found that even if the anganwadi workers were familiar with the
concept of health and balanced diet, the specific knowledge regarding the functions of
food and its nutrient sources was not clear among them. Thus, this lack of knowledge was
a big hindrance during the counseling of nutrition and health education (NHED) sessions
and during the guidance of management of malnutrition at home for a mother of a
malnourished child. Due to this incomplete knowledge, the anganwadi workers were not
skilled enough to provide a good guidance to beneficiaries when it is about the
availability of food options at beneficiarie‘s budget and modification of recipe as per the
need of counseling. PowerPoint presentation for intervention was designed by keeping all
these findings and observations of study. After interacting on theoretical knowledge of
food, its sources, deficiency diseases of vitamin B and C, management of malnutrition,
recipe modification, as per need of malnutrition, was discussed with them. Different
recipies like Shakti Ahar, Besan Paniri, and Sooji Kheer etc were shared with them.
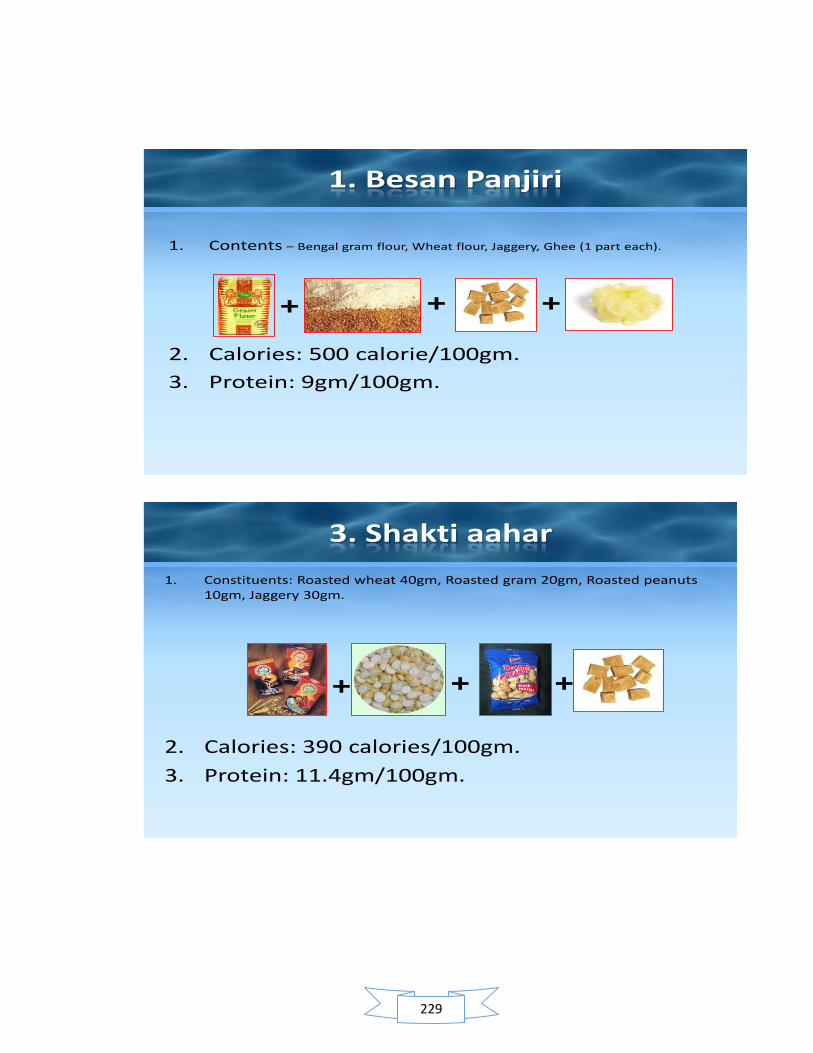
229
1. Besan Panjiri
1. Contents – Bengal gram flour, Wheat flour, Jaggery, Ghee (1 part each).
2. Calories: 500 calorie/100gm.
3. Protein: 9gm/100gm.
+ + +
3. Shakti aahar
1. Constituents: Roasted wheat 40gm, Roasted gram 20gm, Roasted peanuts 10gm, Jaggery 30gm.
2. Calories: 390 calories/100gm.
3. Protein: 11.4gm/100gm.
+ + +
230
2. Informal Group Discussion: For importance of proper implementation of
nutritional services and queries regarding nutrition awareness informal group
discussion was organized. The objective of the discussion was to establish an
open interaction with anganwadi workers and to solve their queries spontaneously
after the conduct of power point presentation. Through this discussion, the field
experiences regarding the quality of implementation of nutritional services like
supplementary nutrition, growth monitoring and nutrition health and education
(NHED) sessions, were shared. It was found that anganwadi workers had lots of
misconceptions and unawareness regarding the use of standard measures for raw
and cooked food. They were not aware about the importance of weighing food
and thus were not found focused for the achievement of targets of supplementary
nutrition. Thus, with the help of findings of study and examples from the stories
of field, an effort was made to make them more concerned regarding the
importance of weighing food before and after preparation of supplementary food.
Similar form of unawareness was found regarding the other nutritional services
like growth monitoring and nutrition and health education (NHED).Therefore,
importance of right techniques of weighing a child and registering the weight data
on growth monitoring register was discussed with them. Since the findings of the
study revealed the fact that majority of anganwadi workers were conducting
unorganized and unstructured NHED sessions, useful tips on conducting a NHED
session were also shared and discussed with them. During the discussion,
anganwadi workers showed enthusiasm towards the information regarding food
and its sources, nutritive value of various foods, recommended dietary allowances
(RDA‘s) for beneficiaries and recipies for management of malnutrition and
dietary counseling sessions of NHED. Best efforts were made to solve their
queries spontaneously and to provide them updated and current nutrition
information. Since the observations made during the study also revealed that
majority of anganwadi workers were not polished enough with their
communicative skills and nutrition knowledge regarding the management of
231
malnutrition and deficiency diseases, useful information and tips on these topics
were discussed and shared with them. Modification of day to day recipies in
reference to management of malnutrition at home and cure of deficiency diseases
were discussed. Overall, a positive rapport with anganwadi workers was
established at the end of the discussion. Anganwadi workers showed great zeal for
gaining such specific information regarding nutrition and requested for conduct of
more such sessions in near future during their training and referral courses.
4.10.4: Feedback /Concluding comments: A positive response and active participation
by anganwadi workers was achieved through these intervention programmes. A great
enthusiasm was noticed among them after attending intervention programme as the group
collectively wished for the need of more such specialized nutrition based programme in
near future. Anganwadi workers showed satisfaction with the gain of nutrition knowledge
they received through intervention programme and were open for more queries. Overall,
anganwadi workers showed positive response for the programme and were imparted with
new information on nutrition myths and facts through intervention programme.
232
Chapter 5
High lights of the study
233
Chapter 5: High Lights of the Study
5.1 Effect of improper execution of nutrition practices applicable at
anganwadi centre.
5.2 Improper implementation of nutritional services affecting
nutritional targets to be achieved
5.3 Nutritional status of preschoolers attending anganwadi centres
at urban and rural zone of Jammu district.
5.4 Dietary intake of majority population in terms of RDA
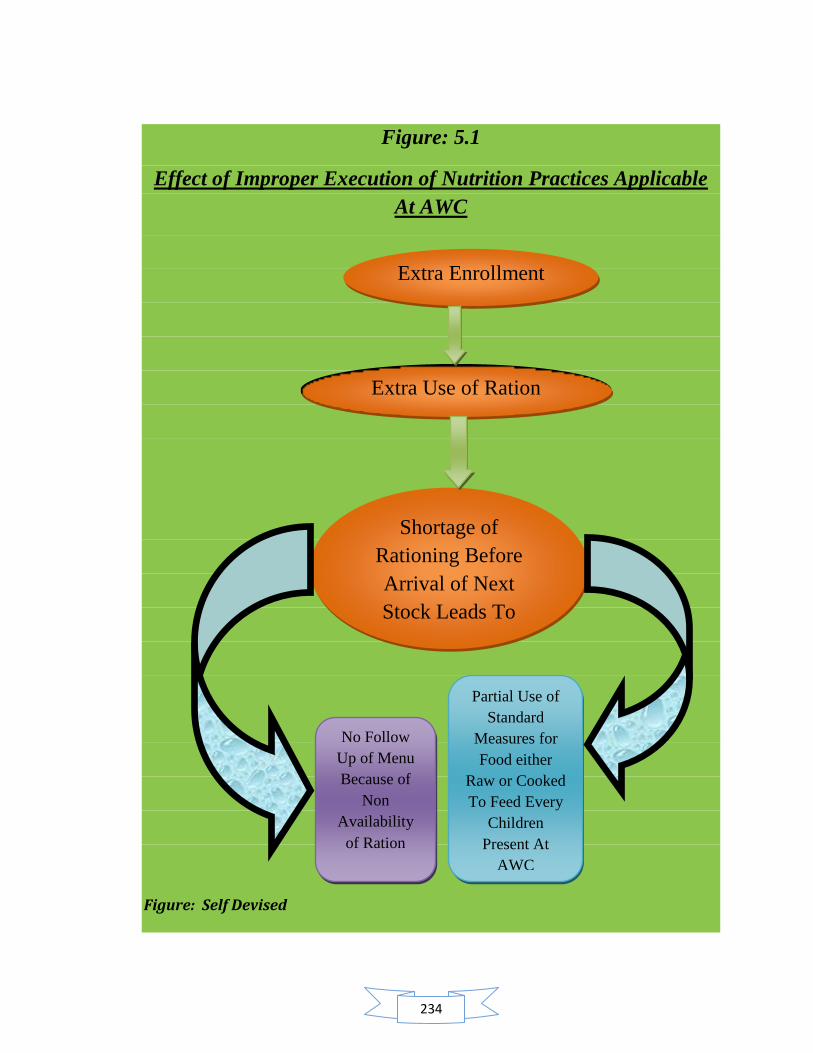
234
Figure: 5.1
Effect of Improper Execution of Nutrition Practices Applicable
At AWC
Figure: Self Devised
Extra Enrollment
Extra Use of Ration
Shortage of
Rationing Before
Arrival of Next
Stock Leads To
No Follow
Up of Menu
Because of
Non
Availability
of Ration
Partial Use of
Standard
Measures for
Food either
Raw or Cooked
To Feed Every
Children
Present At
AWC
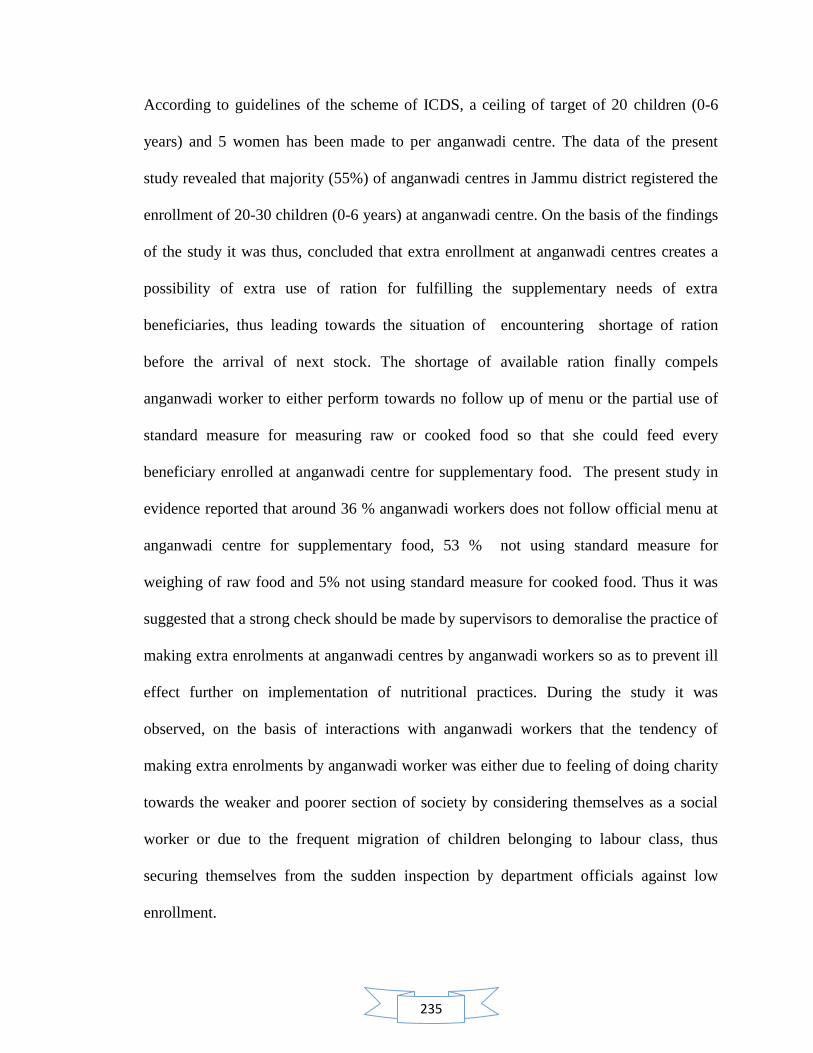
235
According to guidelines of the scheme of ICDS, a ceiling of target of 20 children (0-6
years) and 5 women has been made to per anganwadi centre. The data of the present
study revealed that majority (55%) of anganwadi centres in Jammu district registered the
enrollment of 20-30 children (0-6 years) at anganwadi centre. On the basis of the findings
of the study it was thus, concluded that extra enrollment at anganwadi centres creates a
possibility of extra use of ration for fulfilling the supplementary needs of extra
beneficiaries, thus leading towards the situation of encountering shortage of ration
before the arrival of next stock. The shortage of available ration finally compels
anganwadi worker to either perform towards no follow up of menu or the partial use of
standard measure for measuring raw or cooked food so that she could feed every
beneficiary enrolled at anganwadi centre for supplementary food. The present study in
evidence reported that around 36 % anganwadi workers does not follow official menu at
anganwadi centre for supplementary food, 53 % not using standard measure for
weighing of raw food and 5% not using standard measure for cooked food. Thus it was
suggested that a strong check should be made by supervisors to demoralise the practice of
making extra enrolments at anganwadi centres by anganwadi workers so as to prevent ill
effect further on implementation of nutritional practices. During the study it was
observed, on the basis of interactions with anganwadi workers that the tendency of
making extra enrolments by anganwadi worker was either due to feeling of doing charity
towards the weaker and poorer section of society by considering themselves as a social
worker or due to the frequent migration of children belonging to labour class, thus
securing themselves from the sudden inspection by department officials against low
enrollment.
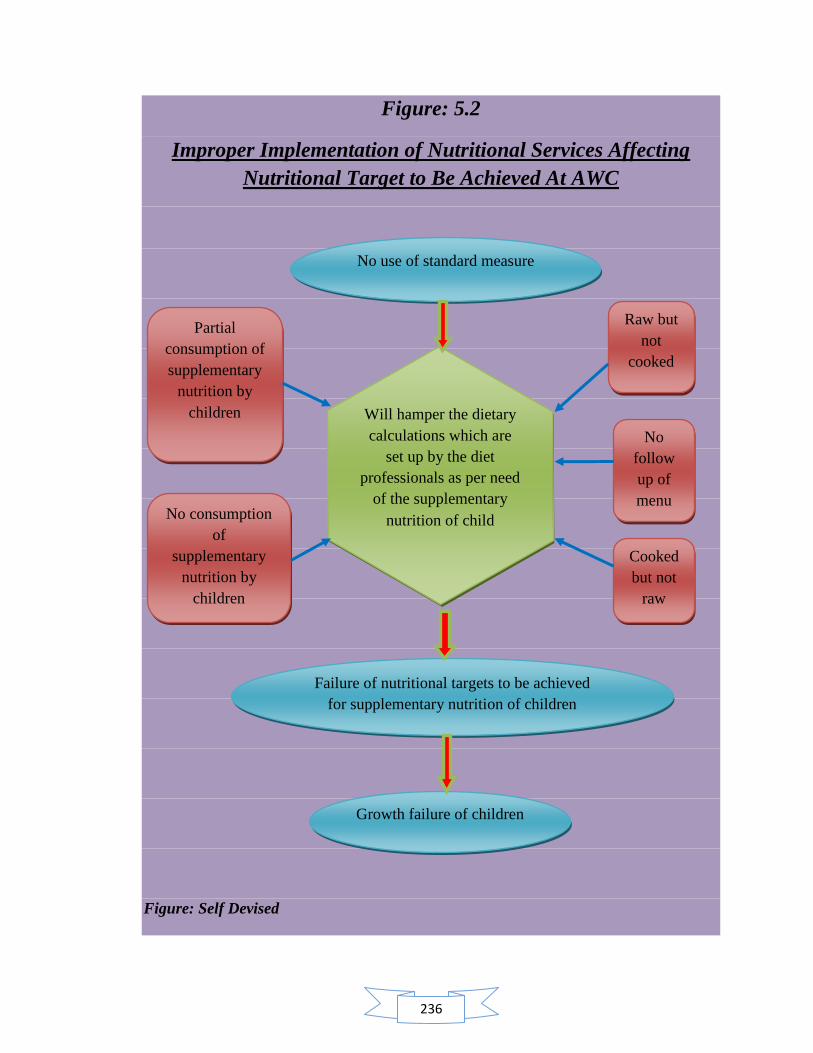
236
Figure: 5.2
Improper Implementation of Nutritional Services Affecting
Nutritional Target to Be Achieved At AWC
Figure: Self Devised
No use of standard measure
No consumption
of
supplementary
nutrition by
children
Failure of nutritional targets to be achieved
for supplementary nutrition of children
Raw but
not
cooked
Partial
consumption of
supplementary
nutrition by
children
Cooked
but not
raw
Will hamper the dietary
calculations which are
set up by the diet
professionals as per need
of the supplementary
nutrition of child
Growth failure of children
No
follow
up of
menu
237
Approximately 60 million children are underweight in India. Given its impact on health,
education and productivity, persistent under nutrition is a major obstacle to human
development and economic growth in the country, especially among the poor and the
vulnerable, where the prevalence of malnutrition is highest. The progress in reducing the
proportion of undernourished children in India over the past decade has been modest and
slower than what has been achieved in other countries with comparable socioeconomic
indicators. (Michele Gragnolati et al, 2005). India‘s main early child development and
nutrition intervention, the Integrated Child Development Services (ICDS) programme,
has expanded steadily across the country during the 30 years of its existence. It is well-
designed and well-placed to address many of the underlying causes of under nutrition in
India. However, it faces a range of implementation difficulties that prevent it from fully
realizing it‘s potential. (Michele Gragnolati et al, 2005, National Advisory, 2011). The
ICDS programme provides single ration of 500 calories and 12-15 grams of protein to
normal children enrolled at anganwadi centre and for severely malnourished children at
anganwadi centre, there is a provision of support of supplementary nutrition for 800
calories and 20-25 grams of protein. The study reported that 43 % anganwadi workers
were not using standard measures for raw as well as cooked food, 36 % anganwadi
workers were not following official menu for supplementary food, 48 % anganwadi
workers were making effort for partial consumption of food by children while 8 %
anganwadi workers stated that children do not prefer eating at anganwadi centres and
thus take their ration home for consumption. Thus, these findings of present study
strongly indicated that improper implementation of nutritional services in any form
contributes towards the hampering of dietary calculations which are set up by the diet
238
professionals as per the need of the supplementary nutrition of child. Failure of those
nutritional targets which are desired to be achieved for supplementary nutrition of
children ultimately leads to the growth failure of children resulting in a bigger
contribution towards existing prevalence rate of malnutrition. Thus, the study highlighted
the fact of shifting focus on the need of improving quality of implementation of
nutritional services by anganwadi workers in order to achieve the nutritional targets of
supplementary nutrition, finally aiming at the efforts of reducing the malnutrition burden
of the country. According to report of UNICEF 2010, India stills contribute to 21 % of
child death burden of the world. Therefore, the study suggested for the need of improving
the quality of implementation of nutritional services through improved and enhanced
training programmes, frequent interactions between anganwadi workers and supervisors/
CDPO,s and referral trainings at regular intervals for the upgraded information and
current awareness of anganwadi workers.
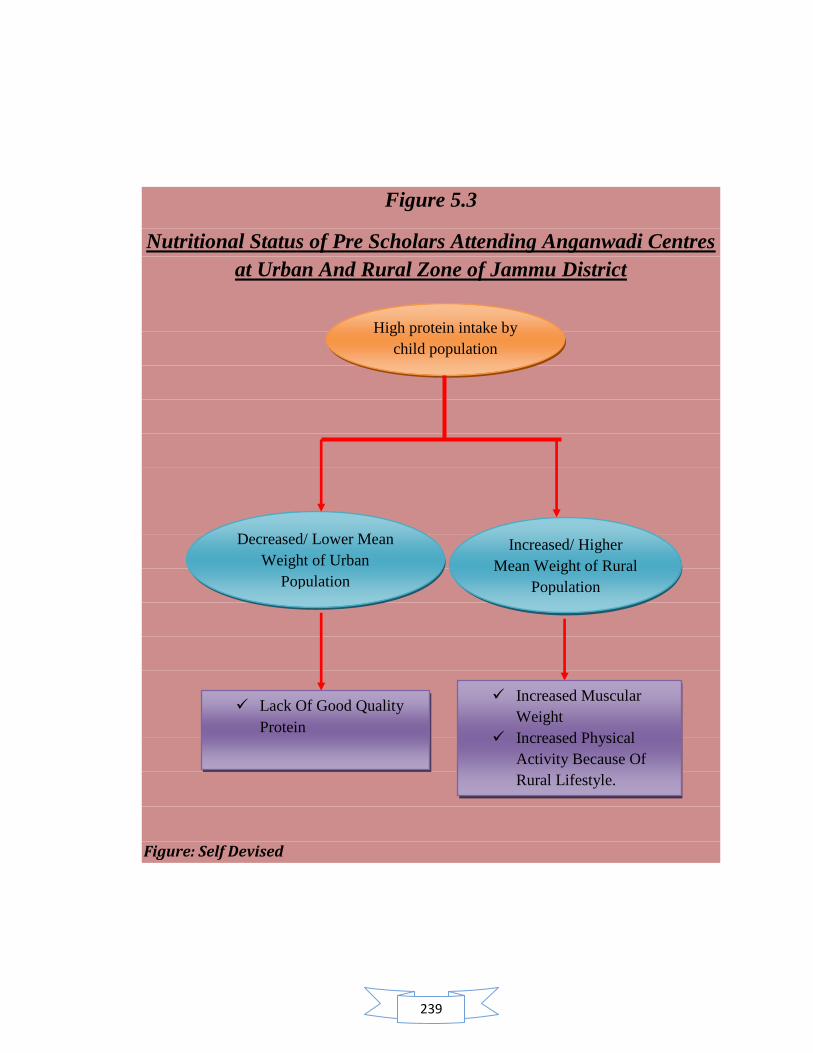
239
Figure 5.3
Nutritional Status of Pre Scholars Attending Anganwadi Centres
at Urban And Rural Zone of Jammu District
Figure: Self Devised
High protein intake by
child population
Increased/ Higher
Mean Weight of Rural
Population
Decreased/ Lower Mean
Weight of Urban
Population
Lack Of Good Quality
Protein
Increased Muscular
Weight
Increased Physical
Activity Because Of
Rural Lifestyle.
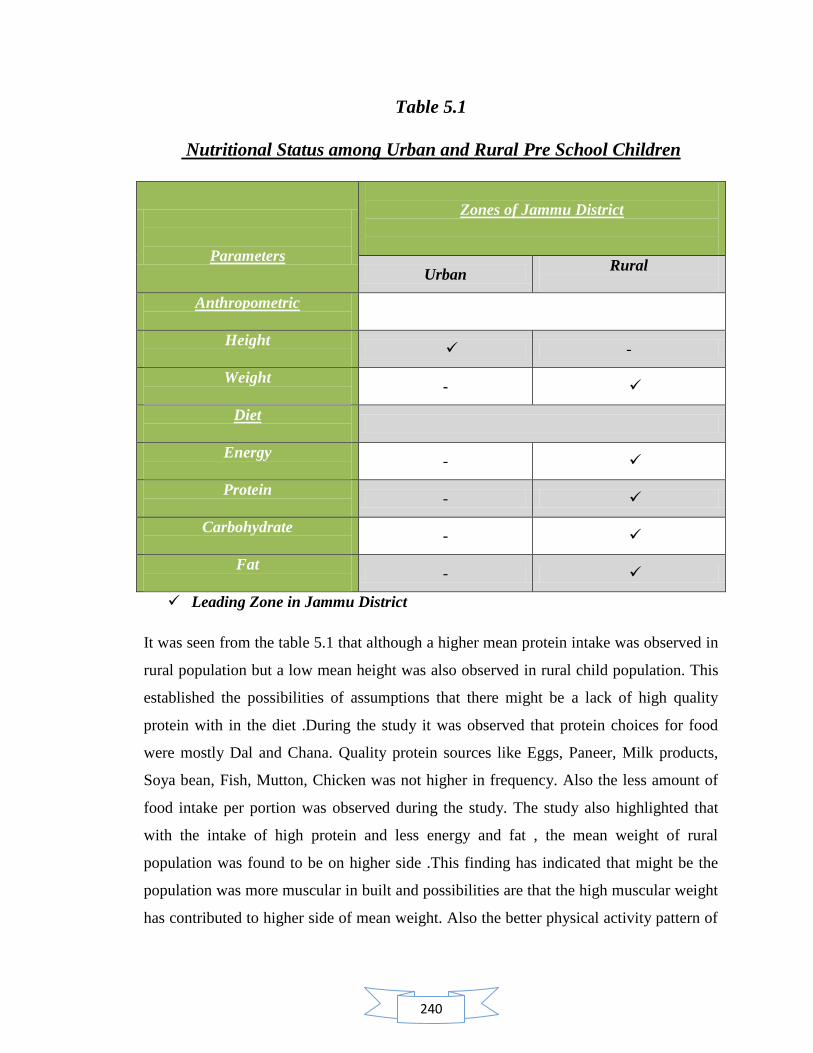
240
Table 5.1
Nutritional Status among Urban and Rural Pre School Children
Parameters
Zones of Jammu District
Urban Rural
Anthropometric
Height
-
Weight
-
Diet
Energy
-
Protein
-
Carbohydrate
-
Fat
-
Leading Zone in Jammu District
It was seen from the table 5.1 that although a higher mean protein intake was observed in
rural population but a low mean height was also observed in rural child population. This
established the possibilities of assumptions that there might be a lack of high quality
protein with in the diet .During the study it was observed that protein choices for food
were mostly Dal and Chana. Quality protein sources like Eggs, Paneer, Milk products,
Soya bean, Fish, Mutton, Chicken was not higher in frequency. Also the less amount of
food intake per portion was observed during the study. The study also highlighted that
with the intake of high protein and less energy and fat , the mean weight of rural
population was found to be on higher side .This finding has indicated that might be the
population was more muscular in built and possibilities are that the high muscular weight
has contributed to higher side of mean weight. Also the better physical activity pattern of
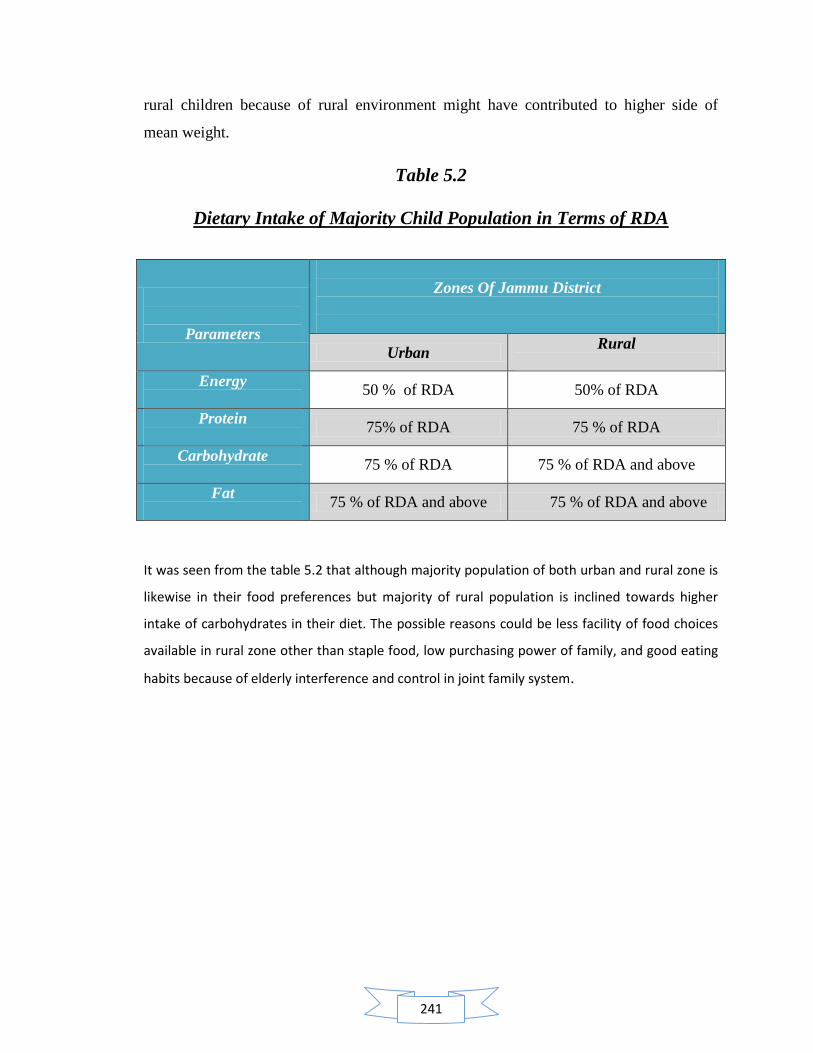
241
rural children because of rural environment might have contributed to higher side of
mean weight.
Table 5.2
Dietary Intake of Majority Child Population in Terms of RDA
It was seen from the table 5.2 that although majority population of both urban and rural zone is
likewise in their food preferences but majority of rural population is inclined towards higher
intake of carbohydrates in their diet. The possible reasons could be less facility of food choices
available in rural zone other than staple food, low purchasing power of family, and good eating
habits because of elderly interference and control in joint family system.
Parameters
Zones Of Jammu District
Urban Rural
Energy
50 % of RDA 50% of RDA
Protein
75% of RDA 75 % of RDA
Carbohydrate
75 % of RDA 75 % of RDA and above
Fat
75 % of RDA and above 75 % of RDA and above
242
Chapter 6
Conclusion and Summary
243
Chapter 6: Conclusion and Summary
6.1 Conclusion
6.2 Recommendations
244
CONCLUSION AND SUMMARY
The Integrated Child Development Services (ICDS) programme is a globally recognized
community based early child care programme, which addresses the basic interrelated
needs of young children, expectant and nursing mothers and adolescent girls across the
life cycle, in a holistic manner. ICDS in India is a response to the challenge of breaking a
vicious cycle of malnutrition, impaired development, morbidity and mortality in young
children, working in convergence with other flagship programmes such as National Rural
Health Mission, Sarva Shiksha Abhiyaan and others. The ICDS is perhaps one of the
better concerned programmes, yet on travels around country, one realizes that there is a
huge gap between what is expected of the programme and the ground situation. What is
even more worrying is that even the existing centres do not function effectively and that
corruption, mismanagement and callousness seem to permeate even the ICDS programme
(Ramachandran 2005). Integrated Child Development Services Scheme covers all the 140
ICDS blocks of Jammu & Kashmir. As on March 2007, a total of 18772 Anganwadi
Centres (AWCs) were sanctioned in the state and out of which 18043 (96 percent) were
operational. In Jammu and Kashmir, under the scheme, a total number of 368060 eligible
children (6-72 months age) and 90215 pregnant and lactating women are getting benefits
for various services. (Evaluation report on ICDS, J & K; 2009). But in spite of the
ongoing direct nutrition interventions like ICDS, India still contributes to about 21
percent of the global burden of child deaths before their fifth birthday (UNICEF; 2007).
Thus the present study was taken up with the objectives of assessing the nutritional
awareness among anganwadi workers and to study the influence of their knowledge for
improved performance at anganwadi, assessing the implementation of nutritional services
provided to pre- schoolars (3-6 yrs), assessing the nutritional status of pre- schoolars (3-6
yrs) attending anganwadi centers, studying Comparison for the level of nutritional
awareness among anganwadi workers and their implementation to nutritional services
between rural and urban zone of Jammu district, and studying the evaluation of the final
output and expected output of nutritional services at anganwadi centers.
245
The present study was conducted in urban and rural zone of Jammu district. Under rural
zone, Bishnah block and Purmandal block were selected for sample locale while under
urban zone Jammu block was studied as sample locale. 50 Anganwadi workers and 150
preschool children (3-6 years) from each zone of rural and urban areas were selected as
respondents. Total sample size of respondents for the study was 400. Multi stage
sampling technique was adopted for sample selection. Samples were randomly selected
for the purpose. In order to collect data, the tools used were observation method, self
devised interview schedule, anthropometric measurements and 24- hour dietary recall
sheet. After conducting a pre testing on 10 % population of study sample and making
minor modifications in the design of tools, the final data of the study was collected during
the month of October 2009-April 2010. Data was collected by visits made to anganwadi
centers. The data obtained was coded and tabulated. Analysis of the data was done
qualitatively and quantitatively.
The results of the study revealed that majority 44% of anganwadi workers were young
workers up to the age group of 33 years. Majority of them under study area were non
graduates (59%) and 72 % had work experience of around 20-30 years. Majority (78%)
of anganwadi workers were reported to be trained. The study also revealed that majority
anganwadi centres had enrollment of 20-30 children (55%) in the age group of 0-6 years
while 5-10 children ( 57 %) in the age group of 3-6 years. The physical infrastructure of
anganwadi centres under study reflected that majority of anganwadi centres had pacca
buildings (65%), with congested indoor space (55%) while non congested (50%) outdoor
space. Majority of anganwadi centres had storage space within the main room (92%) and
separate space for cooking (54%) was also available to them. Majority of anganwadi
centres were found to be well ventilated (89%), had hygienic conditions. In Majority of
anganwadi centres, electricity (61%) and toilet facility (69%) was not available. All the
anganwadi centres had drinking water facility.
The study revealed that execution of nutritional practices which were applicable at
anganwadi centres was not satisfactory as the majority of anganwadi workers in urban
(58%) and rural (48%) projects were using standard measure only for distribution of raw
food. Follow up of menu was another unsatisfactory parameter. Both, urban (36%) as
246
well as rural (36%) anganwadi workers were following the official menu for making
supplementary nutrition. Reasons further explored for not following the menu were found
to be non availability of ration at anganwadi centre. It was also found that anganwadi
workers were not disciplined enough to follow guidelines for the execution of
supplementary nutrition. There was found an irregularity among anganwadi workers
regarding the use of standard measures to achieve fixed quantity of nutrition. In urban
projects the study revealed that majority (52%) of anganwadi workers were using
standard measure only for raw food. The implementation of nutritional target at
anganwadi centers in rural project was more disappointing as majority (50%) of
anganwadi workers were completely ignoring the use of standard measures to achieve
fixed quantity of nutrition. It was observed during the entire study in both urban and rural
projects that anganwadi workers were distributing the cooked food among children with
mere experience and choice of their own intellect. Anganwadi workers were usually
following the criteria of feeding the child on the basis of child‘s own intake capacity of
food rather than the actual need of supplementation fixed under ICDS for children. Thus
a low interest for taking the efforts for feeding the full fixed meal to child by anganwadi
workers was observed during the study. The study revealed that in urban projects
majority (52%) of anganwadi workers reported for partial consumption of supplementary
nutrition while in rural projects full consumption of meals by children was reported.
During the study it, was observed that children were either taking their ration home along
with them or were partially consuming the food for the sake of demonstration in presence
of outside visitor. It was also observed that majority of children in urban as well as rural
projects were bringing their own Tiffin meals and were consuming it at anganwadi
centres. When served the supplementary food by anganwadi workers, they tend to reject
eating and preferred to take their ration home because of the satiety feeling of the Tiffin
meal they already had around 11-12 pm. Anganwadi workers were also not keeping a
track of consumption of food by children who were taking the ration home. Anganwadi
workers and anganwadi helpers, both were found not making efforts for feeding the child
or motivating him/her to consume the meal. It was also found to be a general practice
among anganwadi workers to serve the child twice in his/her Tiffin box: once for partial
eating at anganwadi centre and secondly when the child is about to leave for home. No
247
criterion was found as to how much is to be served to a child under supplementary
nutrition. She was found to be practicing her own choice and intellect and avoiding the
fixed guidelines of ICDS for supplementary nutrition. Majority (81%) of anganwadi
workers had Salter scale while remaining 19 % did not had a weighing scale at
anganwadi centre.
The study explored that majority (73 %) of anganwadi workers had medium awareness
regarding nutrition. Majority of them had a clear concept about health (84%) and
balanced diet (86%). Majority of them had awareness regarding the caloric need of pre
schoolars for supplementary nutrition in ICDS (48%) and caloric need of malnourished
child for supplementary nutrition (57%) . 13 % anganwadi workers were familiar with the
full form of term RDA (recommended dietary allowances) and 8 % workers were aware
about the RDA‘s of preschool children. The study revealed that awareness regarding
functions of food, sources of nutrients and nutritive value of food was not very much
clear among anganwadi workers. Anganwadi workers had fair knowledge about energy
foods (25%), body building foods (56%), and protective food (20 %). Majority of them
had knowledge about pulses as a source of protein (77%) and importance of protein for
preschool children (80 %) but only 3 % were familiar with number of calories present in
1 gm protein. The study revealed that 54% anganwadi workers recognized malnutrition
as major cause of death among children below five and 60% were familiar with the
number of grades of malnutrition but only 49% were familiar with the names of types of
malnutrition when given the choices of four options. 63% recognized the names of types
of malnutrition in true and false format. The study revealed that awareness regarding the
deficiency diseases was good except for vitamin B (21%) and vitamin C. (38 %).
Majority of anganwadi workers had awareness regarding the deficiency diseases but
when further asked for suggestions for the cure of those deficiency diseases, a limited
knowledge was found among them.
The study revealed that in urban zone of study area 20.6%, 24.6 %, 8% and 17.6%
preschool children (3-6 years) were reported to be malnourished either moderately or
severely for the parameters of weight for age (WFA), height for age (HFA), weight for
height (WFH) and body mass index (BMI) respectively. Similarly, in rural zone of study
248
area 16%, 47.3%, 11.5 % and 10 % preschool children (3-6 years) were reported to be
malnourished either moderately or severely for the parameters of weight for age (WFA),
height for age (HFA), weight for height (WFH) and body mass index (BMI) respectively.
The study found that the percentage adequacy of nutrient intake in urban zone of study
area by preschool children was 43.6%, 112 %, 63% and 72 % for energy, protein,
carbohydrates and fats respectively. Similarly, the percentage adequacy of nutrient intake
in rural zone of study area by preschool children was 53.6%, 141.6 %, 88% and 84 % for
energy, protein, carbohydrates and fats respectively.
The study data indicated that there is huge difference between the expected output and
actual output of nutritional services. Every anganwadi centre is entitled to enroll 25
children (0-6 years) from its area. The present study revealed that majority anganwadi
centres had enrolment of 20-30 children (55%) in the age group of 0-6 years while 5-10
children ( 57 %) in the age group of 3-6 years. Follow of menu is a mandatory practice
expected among anganwadi workers but the study finding revealed that only 36 %
anganwadi workers followed official menu. Use of standard measure for both raw and
cooked food is another mandatory practice expected from anganwadi workers but the
study data revealed that the implementation of use of standard measures for both raw and
cooked food was the most neglected one as only 4 % anganwadi workers were found to
practice the implementation of these services. Consumption of full meal of
supplementary nutrition by children attending anganwadi centre is another mandatory
parameter expected to be fulfilled by anganwadi workers as she received a formal
training for handling children at anganwadi centre. But in spite of trained status of
majority (72%) of anganwadi workers, the food consumption of supplementary nutrition
by children was reported to be partial (48%). Accuracy in proper use of children and
plotting weight on growth chart are important parameters of growth monitoring for
malnutrition. Anganwadi workers are expected to be accurate and skillful for these
practices as they receive a formal training for execution of these services. The findings of
the study indicated that 42% anganwadi workers were accurate for both of these services.
Similarly, anganwadi centres are supposed to conduct NHED sessions twice a month
with the community of its respective area. The study findings revealed that 51 %
anganwadi workers conducted nutrition and health education (NHED) sessions at their
249
respective centres. Majority (71%) of them had conducted NHED sessions for once a
month.
On the basis of interactions with officers from social welfare department, it figured out
that the department of social welfare works for free hand improvement policy in
reference to targets of nutritional status. It aims for the maximum improvement on yearly
basis and thus directs the efforts of the programme towards the attainment of normal
health status of all beneficiaries. CDPO‘s and supervisors are expected to provide the
needed guidance to anganwadi workers to improve the implementation of nutritional
services and nutritional status of beneficiaries at anganwadi workers.. The study revealed
that in urban zone of study area, 20.6%, 24.6 %, 8% and 17.6% preschool children (3-6
years) were reported to be malnourished either moderately or severely for the parameters
of weight for age (WFA), height for age (HFA), weight for height (WFH) and body mass
index (BMI) respectively. Similarly, in rural zone of study area 16%, 47.3%, 11.5 % and
10 % preschool children (3-6 years) were reported to be malnourished either moderately
or severely for the parameters of weight for age (WFA), height for age (HFA), weight for
height (WFH) and body mass index (BMI) respectively. The study found that the
percentage adequacy of nutrient intake in urban zone of study area by preschool children
was 43.6%, 112 %, 63% and 72 % for energy, protein, carbohydrates and fats
respectively. Similarly, the percentage adequacy of nutrient intake in rural zone of study
area by preschool children was 53.6%, 141.6 %, 88% and 84 % for energy, protein,
carbohydrates and fats respectively. Thus, the study revealed that in spite of higher
percentage adequacy of nutrient intake by rural children, they were reported to be more
malnourished in comparison to urban preschool children for the parameters of height for
age (HFA), weight for height (WFH).
On the basis of findings of the study, total 6 intervention programs were conducted (2 per
block). These programmes were conducted in Jammu block, Purmandal block and
Bishnah block with a group of 20-25 anganwadi workers, their supervisors and CDPO‘s.
A power point presentation and informal discussion method was used for the intervention
programme. A positive response and active participation by anganwadi workers was
achieved through these intervention programs. A great enthusiasm was noticed among
250
them after attending intervention programme as the group collectively wished for the
need of more such specialized nutrition based programme in near future. Anganwadi
workers showed satisfaction with the gain of nutrition knowledge they received through
intervention programme and were open for more queries. Overall, anganwadi workers
showed positive response for the programme and were imparted with new information on
nutrition myths and facts through intervention programme.
RESEARCH QUESTIONS
What is the extent of proper use of standard measures for weighing the raw
and cooked food served to pre schoolars at anganwadi centre?
Answer: The findings of the study showed that the majority of anganwadi workers in
urban and rural projects were using standard measure only for distribution of raw food
while very few anganwadi workers in urban and rural projects were using standard
measure for distribution of cooked food. It was found through observations during study
that anganwadi workers were not disciplined enough to follow guidelines for the
execution of supplementary nutrition. Further it was revealed by the study that there was
an irregularity among anganwadi workers regarding the use of standard measures to
achieve fixed quantity of nutrition. It was found that majority (49%) of anganwadi
workers were using standard measure only for raw food while 1% anganwadi workers
were using it only for cooked food. A prominent section (43%) of anganwadi workers
were completely ignoring the use of standard measures for achieving the fixed quantity of
nutrition while only 4 % anganwadi workers among entire sample were using standard
measures for both raw as well as cooked food and thus were implementing the nutritional
guidelines of ICDS for the achievement of nutritional target. It was observed during the
entire study in both urban and rural projects that anganwadi workers were distributing the
cooked food among children with mere experience and choice of their own intellect.
Anganwadi workers were usually following the criteria of feeding the child on the basis
of child‘s own intake capacity of food rather than the actual need of supplementation
fixed under ICDS for children. Thus a low interest for taking the efforts for feeding the
full fixed meal to child by anganwadi workers was observed during the study.

251
What is the extent of accuracy of proper use of weighing scale and plotting
weight on growth chart?
Answer: The findings of the study revealed that majority of anganwadi workers had
accuracy in proper use of weighing scale at anganwadi centre but the accuracy in plotting
weight on growth chart was found to be low. Calculation of chi square further revealed
insignificant difference between anganwadi centres from urban and rural zone for
accuracy in plotting weight on growth chart and accuracy in proper use of weighing scale
at anganwadi centre. On Further exploration through the findings of the study, it was
revealed that although majority (42%) of anganwadi workers were accurate in using
weighing scale as well as growth chart but there was a next higher prominent population
(34 %) of anganwadi workers with in the sample population who were not trained enough
for the proper execution of growth monitoring either by proper use of weighing scale or
growth chart. The remaining percentage of sample population was also not up to mark
with execution skills of growth monitoring as 8 % anganwadi workers were accurate in
plotting weight on growth chart but were found to be inaccurate with proper use of
weighing scale. Similarly 14 % of anganwadi workers had accuracy in using weighing
scales but were found to be inaccurate for the use of growth chart. During the study, it
was found that although the anganwadi workers were trained for execution of weighing
scale but in general practice, an ignorant approach was observed as only half of the
sample population was found for accurate handling of weighing scale. Anganwadi
workers were not taking precautionary measures like correction of zero error in weighing
scale before weighing of child, removal of maximum clothing and accessories from
child‘s body before weighing and maintaining a minimum gap of two hours of diet intake
before weighing. Thus, efficiency of handling of the weighing scale used at anganwadi
centre for growth monitoring was found to be affected. It was found that there was lack
of knowledge regarding the use of weighing scale but in spite of that anganwadi workers
were not found motivated enough for discussing their queries with supervisors. Rather
they preferred to practice with limited knowledge. Similarly, for judging the accuracy of
skills for plotting the weight on growth chart these workers were observed for putting a
right mark on growth chart and making a right starting point for coding child data of
weight and height.
252
What is the extent of conducting nutrition and health education sessions at
anganwadi centre?
Answer: The table indicated that majority of sample population of anganwadi workers
were conducting independent Nutrition and Health Education session while 36 % were
organizing it with Mahila Mandals .There was found a section of anganwadi workers who
were not organizing any Nutrition and Health Education session at anganwadi centers.
Calculation of chi square further revealed insignificant difference between anganwadi
centers from urban and rural zone for services of nutrition and health education at
anganwadi centre. During the study it was observed that the anganwadi workers who
were organizing Nutrition and Health Education sessions with Mahila Mandal were
interacting with the few members of Mahila Mandal on various topics like breast feeding,
immunization, diet for pregnant woman, education of girl child, pulse polio drops, winter
care for kids, safe drinking water etc., ranging from Nutrition and Health Education
topics to Mahila Mandal. It was observed during the study that the Nutrition and Health
Education sessions organized at anganwadi centers, whether independent or mixed
session with Mahila Mandal, were all unstructured and unplanned in nature. No pre
planning for the conduction of these sessions by anganwadi worker was found.
The findings of the study further highlighted that majority (71%) of anganwadi workers
were organizing Nutrition and Health Education session for once a month only while 9 %
were doing the same for twice a month. 20 % anganwadi workers were completely
ignoring the conduction of Nutrition and Health Education session. During the study, it
was observed that many of the anganwadi workers were even not aware of mandatory
guidelines of organizing two independent sessions of Nutrition and Health Education in a
month. It was also observed that anganwadi workers were not confident and motivated
enough of personating themselves as a nutrition and health educator for these sessions.
They also reported the non cooperation of community for these sessions and thus found
helpless enough to conduct the sessions within the schedule.
253
Is there any influence of awareness on the implementation of nutritional
services?
Answer: It has been analyzed by the study that there is positive influence of nutrition
awareness on implementation of nutritional services at anganwadi centre. For every
percent increase in nutritional awareness, positive implementation of nutrition services at
anganwadi centre increases by 0.055. Nutrition awareness significantly predicted
implementation of nutrition services.
What is the extent regarding nutritional awareness among anganwadi workers?
Answer: All put together, the study highlighted that majority (73%) of anganwadi
workers had medium awareness regarding nutrition. 16 % of anganwadi workers had
scored for high awareness of nutrition. The reason observed were less interactions
between supervisors/CDPO‘s and anganwadi workers, less visits by supervisors to rural
anganwadi centres because of their location in far flung areas and low confidence and
motivation among anganwadi workers to seek guidance from supervisor regarding any
query. Calculation of chi square further revealed insignificant difference between
nutritional awareness among anganwadi centers from urban and rural zone of Jammu
district.
Is the increasing level of knowledge playing any significant role in quantitative
and qualitative participation for nutritional services?
Answer: The study concluded that majority (73%) of anganwadi worker in the sample
locale have shown medium awareness level. On the basis of the findings of the study, it is
evident that majority of anganwadi workers with high awareness level have participated
in implementation of nutritional services in both zone of sample locale. Anganwadi
workers with low awareness level showed least participation in the implementation of
nutritional services while anganwadi workers with medium awareness level have
participated in between the line. With the help of regression analysis, it has been
established by the study in advance that awareness does have a positive influence on the
implementation of the services. Thus study depicted that there is scope of improving the
training quality of anganwadi workers with medium awareness and converting them into
254
a highly aware worker in order to improve the quality of implementation of nutritional
services. This effort, in result, will lead to successful achievement of nutritional targets of
ICDS. The comparison between urban and rural zone showed that urban anganwadi
workers with high awareness level showed better participation for implementation of
nutritional services in comparison to rural anganwadi workers with high awareness.
Is there any case of malnutrition existing in the sample child population of the
study?
Answer: Cases of malnutrition were reported in all age groups of the sample population.
There was found a significant difference in nutritional status between the urban and rural
children on the parameters of height for age, weight for height and body mass index.
Are the children of sample consuming a one day diet as per the RDA’s?
Answer: The results of the study revealed that majority of child population in urban and
rural zone of sample area were consuming 50% of RDA‘s of Energy. It was also reported
that majority of child population of urban and rural children of sample area were
consuming 75% and above of RDA‘s for protein and fats. The study further highlighted
that in spite of higher percentage adequacy of nutrient intake by rural children, they were
significantly reported to be more malnourished for stunting (HFA) in comparison to
urban preschool children.
Is there any existing difference between the expected and final output of
nutritional services at anganwadi centre?
Answer: There is a huge difference between the expected and final output of nutritional
services at anganwadi centre. An astonishing difference was reported for use of standard
measure for raw and cooked food at anganwadi centers. Only 4 % anganwadi workers
were using standard measure for raw and cooked food against mandatory practice.
Similarly an extensive difference was reported for follow up menu, consumption of
supplementary nutrition by children, record maintenance, accuracy in proper use of
children and plotting weight on growth chart and conduct of NHED sessions against
mandatory practice.
255
Conclusion:
The present study shows that in spite of the fact that most (72 %) of the anganwadi
workers in study area were trained and had a high range (20-30 years) of work experience
,it was found that performance as well as awareness among anganwadi workers regarding
the importance of implementation of nutritional services was not satisfactory. Although
the anganwadi workers were mostly familiar with the knowledge for various nutritional
services of ICDS but the provision of these services, their importance for the programme
was not clear to them, also the implementation part of these services was immensely
lacking in aspect of effective utilization of these services by the beneficiaries and for
beneficiaries. The study concluded that chaos and irregularities at work place was the
common practice among anganwadi workers. The study concluded that although the
knowledge was sufficient among anganwadi workers but the quality knowledge was one
of the neglected features among job profile of anganwadi worker. Their nutritional
knowledge regarding the role of supplementary nutrition and ICDS norms was not up to
the mark as expected from a trained worker and hence an utmost need of regular quality
training as well as on spot training programme was strongly felt. The study also suggests
that the quality of training being provided to anganwadi workers at training centers
should be strictly scrutinized as it is the first step towards the achievements of goals of
ICDS.
256
RECOMMENDATIONS
This study suggests the following measure to fill the gaps and overcome the barriers for
successful implementation of ICDS programme:
Regular visits by the supervisors or health functionaries to the anganwadi centre
for guiding and helping the anganwadi worker could provide repeated on-the-job
training, and frequent and regular interaction between supervisors and anganwadi
workers is actually beneficial for the improved knowledge and thus performance
of anganwadi worker.
Frequency and quality of training for anganwadi workers should be improved and
proper implementation of skills should be ensured. Every anganwadi worker
should receive a minimum of three month‘s induction training. She should also be
enrolled in a programme of continuous learning.
Anganwadi workers need to be trained in the holistic care of young children by
the qualified trainers from government or non-government organizations.
National and state agencies in partnership with NGOs should develop appropriate
training modules to ensure standard quality training which can be further adapted
to suit local conditions. Training of ICDS functionaries should emphasize more
on important functions like growth monitoring, health and nutrition education.
The content of the training course for anganwadi workers also needs thorough
analysis.
Offering regular health and nutrition counseling should become an important
activity of the anganwadi centre. Nutrition Education to mother for practices
regarding feeding the child should be the strongest component.
Expanding the ICDS team so that work load of anganwadi worker could be
decreased and focus attention on nutrition can be achieved. Option to consider
would include the :
I. Appointment of an additional anganwadi worker
II. Recruitment of youth volunteers who could be paid a stipend; and
257
III. Any other possibility that might involve the engagement of the local
community and NGOs.
Adequate and timely release of funds should be provided to the anganwadi centers
to cater the growing financial needs of Infrastructure, Materials, Food and other
suitable expenditure.
Increasing the pay scales and facilities to anganwadi worker for increasing job
satisfaction and hence job performance.
Regular and proper monitoring of children is critical for prevention and ensuring
early detection of child malnutrition. The weight of children should be recorded
every month and height every year. This information along with other
developmental milestones should be shared at monthly meetings with parents.
Wherever possible, active, panchayats and other local community based
organizations should be involved and associated with the monitoring of children‘s
progress. For growth monitoring to be useful, it is important that every anganwadi
centre has a functioning weighing scale, that these machines are regularly
serviced and that anganwadi workers are properly trained to weigh and measure
young children
Special and immediate action should be taken for the care of severely
malnourished children- by identifying and referring them without delay to
nutrition rehabilitation centres (NRCs) set up under the national rural health
mission (NRHM). Anganwadi workers should ensure that ASHAs and link
workers (in urban areas) counsel the parents and provide extra nutrition to the
child.
Monitoring and evaluation should be regular and frequency should be enhanced.
Rigorous Monitoring by Authorities and Stakeholders should be ensured.
Governments ought to invest appropriately in systematic research to improve
knowledge and understanding of factors affecting nutrition. Concurrent
monitoring of ICDS should throw up signals for initiating corrective actions. Like
with MGNREGA, social audits, independent monitoring and evaluations should
be made integral to the functioning of ICDS.

258
REFERENCES
259
REFERENCES
BOOKS AND JOURNALS
Agarwal D.K., Agarwal, K.N., Satya, K. and Agarwal, S. (1998). Weight gain during
pregnancy: a key factor in prenatal and infant mortality. Indian Pediatrics,
35(8),733-744.
Agarwal, S., Agarwal, A., Bansal, A.K., Agarwal, D.K., and Agarwal, K.N. (2002).
Birth weight patterns in rural undernourished pregnant women. Indian
Pediatrics, 39, 244-253.
Alderman, H. (2005). Linkages between poverty reduction strategies and child nutrition:
an Asian perspective. Economic and Political Weekly. Forthcoming.
Alderman, H., Behrman, J., Lavy, V., and Menon, R. (2001). Child health and school
enrollment: a longitudinal analysis. Journal of Human Resources, 36(1), 185-
205.
Alderman, H., Hentschel, J,. and Sabates, R. (2003). With the help of one’s neighbors:
externalities in the production of nutrition in Peru. Social Science and Medicine
56, 2019-2031.
Allen, L.H. (1994). Nutritional influences on linear growth: a general review. European
Journal of Clinical Nutrition 48, S75-S89.
Anitha, C., and Begum, K. (2008). Nutritional status of beneficiaries of ICDS in Mysore
district: a situational analysis. Mysore: Karnataka State Open University,
Department of Studies in Foods and Nutrition, P.9.
Ballweg, J.A. (1972). Family characteristics and Nutrition problems of preschool
children in food Parisian. Journal of Tropical pediatrics and environment health,
Vol.230.
Barker, D.J.P., Forsèn, T., Uutela, A., Osmond, C., and Eriksson, J.G. (2001). Size at
birth and resilience to effects of poor living conditions in adult life: longitudinal
study. British Medical Journal, 323, 1-5.
260
Barman, N.R. (2001).Functioning of anganwadi centre under ICDS scheme: an
evaluative study: Jorhat, Assam. National Institute of Public Cooperation and
Child Development. DCWC Research Bulletin, October-December 2008, XIII
(4) 87.
Bhalani, K.D. and Kotecha, P.V. (2002).Nutritional status and gender differences in the
children of less than five years of age attending ICDS in Vadodara city. Indian
Journal of Community Medicine, 27(3), 124-129.
Bharti, S., Arora, S., and Bedi, T. (2003). Evaluation of nutrition services provided to
pre-schoolers at anganwadi centres (urban slums of Jammu city). Jammu
University, Department of Home Science, p.3.
Bhasin, S.K., Bhatia, V., Kumar, P., and Aggrawal, O.P. (2001). Long term nutritional
effects of ICDS. Indian Journal of Pediatrics, 68(3), 211-216.
Bhasin, S.K., Kumar, R., Singh, S., Dubey, K.K., and Kapil, U. (1995). Knowledge of
Anganwadi workers about growth monitoring in Delhi. Indian Journal of
Pediatrics, 32(1), 73-6.
Bhownick, P.K., and Samita, M. (2001).Mortality and Morbidity Pattern in Children 0-6
yrs attending ICDS West Bengal. Three decades of ICDS: an appraisal, New
Delhi: NIPCCD, p.30.
Black, R.E., Morris, S. S., and Bryce, J. (2003). Where and why are 10 million children
dying every year? Lancet, 361, 2226-34.
Bouis, H., and Hunt, J. (1999). Linking food and nutrition security: past lessons and
future opportunities. Asian Development Review, 17(1 & 2), 168-213.
Calder, P.C., and Jackson, A.A. (2000). Under nutrition, infection and immune function.
Nutritional Research Reviews,13, 3-29.
Caulfied, L., Onis, M., Blossner, M., and Black, R.E. (2004). Under-nutrition as an
underlying cause of child deaths associated with diarrhea, pneumonia, malaria,
and measles. American Journal of Clinical Nutrition, 80,193-198.
Centre for North East Studies and Policy Research, Guwahati. (2006). Functioning of
Anganwadi Centres in Assam and Meghalaya. Research on ICDS: An Overview
(1996-2008), 3,157.
261
Chanadran and Gangadharan (2009). Nutritional status of preschool children: a socio-
economic study of rural areas of Kasaragod district in Kerela. Phd thesis,
Kannur University, Kerala. Retrieved from http:// shodhganga.inflibnet.
ac.in/handle/10603/2588.
Chattopadhyay, D. (1999).Knowledge and skills of anganwadi workers in Hooghly
district, West Bengal. Indian Journal of Community Medicine, 29(3),7-9.
Collins, W.J. and Thomasson, M.A. (2002). Exploring the racial gap in infant mortality
rates, 1920-1970. Vanderbilt University, Department of Economics, Working
Paper No. 02-W01.
Daniels, M., and Adair, L. (2004). Growth in young Filipino children predicts schooling
trajectories through high school. Journal of Nutrition, 134, 1439-1446.
Dash, N.C. (2006). Impact assessment/ evaluation of ICDS programme in the state of
Orissa. Bhubaneswar: Centre for Rural Development, DCWC Research
Bulletin, April – June 2008, XII (2), 70.
Datta, V. (2001).Factors affecting job performance of anganwadi workers: a study of
three districts of Maharashtra. Mumbai: Tata Institute of Social Sciences,
DCWC Research Bulletin, July - September 2008, XII (3), 158.
Datta,U. (2004). The functioning of anganwadi centers in urban slums of Delhi. National
Institute Of Health and Family Welfare, p.2-4.
Davey,A., Davey,S., and Datta,U. (2005). Perception regarding quality of services in
urban ICDS blocks in Delhi. Indian Journal of Public Health, July-September
2008, 52 (3), 156-8. Retrieved from http://www.ncbi.nlm.nih.gov/pubmed/
19189840
Devi, P.V., and Padmavati, T.V.N. (2006). Effect of nutrition and health education to
rural women on the awareness, practices and nutritional status of ICDS
children. Journal of Research ANGRAU.
Dongre, A.R., Deshmukh, P.R., and Garg, B.S. (2008).Perceived responsibilities of
Anganwadi workers and malnutrition in rural Wardha. Online Journal of Health
and Allied Sciences, 7 (1).
Engle, P.L., and Zeitlin, M. (1996). Active feeding behavior compensates for low child
demand among Nicaraguan one-year-olds. Journal of Nutrition, 126, 1808-16.
262
Engle, P.L., Lhotska, L., and Armstrong, H. (1997).The care initiative: assessment,
analysis, and action to improve care for nutrition. UNICEF, New York.
Esrey, S.A., Potash, J.B., Roberts, L., and Shiff, C. (1990). Health benefits from
improvements in water supply and sanitation: survey and analysis of the
literature on selected diseases. WASH Technical Report No. 66. Arlington:
Water and Sanitation for Health Project (WASH).
Forum for organized resource conservation and enhancement (FORCES), New Delhi.
(2007). ICDS in Delhi: a reality check. National Institute of Public Cooperation
and Child Development, DCWC Research Bulletin, January - June 2009, XIII (1
& 2), 36.
Gadkar,V.D. (2006). Situational analysis of anganwadi workers training centres in
Jharkhand. National Institute of Public Cooperation and Child Development,
Regional Centre Lucknow, p.90.
George, K.A., Kumar, N.S., Lal, J.J., and Sreedevi, R. (2000). Anaemia and nutritional
status of pre-school children in Kerala. Indian Journal of Pediatrics, 67(8), 575-
78.
Ghosh,S. (1989). Constraints to improved child feeding, 14th International congress,
Seoul, Korea, p.187-227.
Gittelsohn, J., Shanka,r A.V., West, K.P., Faruque, F., Gnywali ,T., and Pradhan,
E.K., (1998). Child feeding and care behaviors are associated with
xerophthalmia in rural Nepalese households. Social Science Medicine, 47, 477-
86.
Glewwe, P., Jacoby, H., and King, E. (2001).Early childhood nutrition and academic
achievement: a longitudinal analysis. Journal of Public Economics, 81(3), 345-
368.
Gopaldas, T., Christian, P.S., Abbi, R.D., and Gujral, S. (1990). Does growth
monitoring work as it ought in countries of low literacy? Journal of Tropical
Pediatric, 36, 322-27.
Gordon, J.E., Guzman, M.A., Ascoli, W., and Scrimshaw, N.S. (1964). Acute diarrhoeal
disease in less developed countries: patterns of epidemiological behaviour in
rural Guatemalan villages. Bulletin of the World Health Organization 31, 9-20.
263
Gordon, K.L., and Dunleavy, M. (2001). Environmental health in India: priorities in
Andhra Pradesh. South Asia Region, Environment and Social Development
Unit. Washington, D.C. The World Bank.
Gragnolati, M., Shekar, M., Gupta, M.D., Bredenkamp, C., and Lee Y.K. (2005).
India’s undernourished children: a call for reform and action. Health, Nutrition
and Population (HNP) Discussion Paper. The World Bank, Washington DC.
Grantham, M., and Ani, C.C. (2001). Under nutrition and mental development. Nestlè
Nutrition Workshop Series Clinical and Performance Program, Basel: Nestlè
Limited, 5, 1-18.
Gujral,S., Abbi,R., Mujoo,R., and Gopaldas,T.(1992). Determinants of community
health workers' performance in India. Food and nutrition bulletin, 13(4).
Retrieved from http://www.unu.edu/Unupress/food/8F134e/8F134E03.htm
Haryana, Dept. of Economics and Statistics, Chandigarh. (2004). Evaluation study of
ICDS in Haryana 2002-03. DCWC Research Bulletin, January - March 2008,
XII (1), 102.
Horton, S. (1999). Opportunities for investments in nutrition in low-income Asia. Asian
Development Review, 17, 246-273.
Hota, B.B. (1995). National Family Health Survey, 1993, Orissa, Bombay: PRC,
Bhubaneswar and TIPS.
Indian Institute of Development Management, Bhopal. (2008). Evaluation of
anganwadi worker training centres and middle level training centres:
dissemination workshop. DCWC Research Bulletin, April- September 2010,
XIV (2 & 3), 11.
Indian Institute of Management Bangalore, Bangaluru. (2005). Social assessment of
ICDS in Karnataka. DCWC Research Bulletin, January - March 2008, XII (1),
2-15.
Jain, S., and Agrawal, P.L. (2007). Assessment on the impact of nutritional
supplementation to children under ICDS scheme in Gird block, Gwalior, M.P.
Government K.R.G. PG Autonomous College, Department of Home Science,
P.6.
264
Jindal, S. (1999). Incidence of malnutrition and developmental profile of preschool
children in ICDS. GB Pantnagar University of Agriculture and Technology,
Department of Foods and Nutrition, p.184.
Kant, L., Gupta, A., and Mehta, S.P. (1984). Profile of anganwadi worker and
Knowledge about ICDS .Indian Journals of Pediatrics, 51 (4), 401-402.
Kapil, U.,Tendon, M., Pathak, P., and Nayar, D.(1999). Nutrient intake and
consumption of supplementary nutrition by severely malnourished children in
two ICDS projects in Rajasthan state. Indian Journal of Pediatrics, 36(8), 199-
902.
Kumar, A. (2009). Nutritional status assessment of under-five beneficiaries of Integrated
Child Development Services program in rural Karnataka. Australasian Medical
Journal (Online). Retrieved on December 26, 2011http://periodicals.faqs.org/
201007/2142227791.
Kumar, D., Goel, N.K., Mittal, P.C., and Mishra, P. (2006). Influence of infant feeding
practices on nutritional status of under-five children. Indian journal of
pediatrics, 73, 417-421.
Lakshmi, J.A., Khyrunnisa, B., Saraswathi, G., and Jamuna, P. (2003). Nutritional
Status of Rural Preschool Children- Mediating Factors. The Journal of Family
Welfare, December 2003, 49(2).
Lokshin, M., DasGupta, M., Gragnolati, M., and Ivaschenko, O. (2005). Improving
Child Nutrition? The Integrated Child Development Services in India. Institute
of Social Studies. Blackwell Publishing, Garsington Road, Oxford OX4 2DQ,
UK, Development and Change, 36(4), 613–640.
Loyola College of Social Sciences, Thiruvananthapuram.(2006). Supplementary feeding
in ICDS: present system of food purchase, distribution and satisfaction of
beneficiaries. Thiruvananthapuram: LCSS, p.119.
Lucas, A., Fewtrell, M.S., and Cole, T.J. (1999). Fetal origins of adult disease – the
hypothesis revisited. British Medical Journal, 319, 245-9.
MacIntyre, C.R., Kendig, N., Kummer, L., Birago, S., and Graham, N.M. (1997).
Impact of tuberculosis control measures and crowding on the incidence of
265
tuberculous infection in Maryland prisons. Clinical Infectious Diseases, 24(6),
1060-70.
Mahapatra, A., Maria, N., and Munmun, B.K. (2000). Nutritional status of ICDS pre-
school children project for drought affected Kalahandi district of Orissa. Indian
Journal of Medical Research, p.105-108.
Milla, P.J. (1991). Feeding, tasting, and sucking. In: Walker WA, ed. Pediatric
gastrointestinal disease. Philadelphia, Pa, USA: BC Decker, p.217-23.
Mishra, R.N. (2007). Nutritional deprivation among Indian pre-school children: does
rural-urban disparity matter? Ahmadabad: Gujarat Institute of Development
Research. DCWC Research Bulletin, July - September 2008, Vol. XII (3), p.34.
Moe, C.L., Sobsey, M.D., Samsa, G.P.,and Mesolo, V.(1991). Bacterial indicators of
risk of diarrhoeal disease from drinking-water in the Philippines. Bulletin of the
World Health Organization, 69(3), 305-17.
Moorthy, G. (1993). Food and nutrition, Fourth Edition, Arya Publishing House, New
Delhi-05, p.4-5.
Mustaphi, P. (2005). Addressing malnutrition through surveillance and innovative
community based strategies. New Delhi: UNICEF, p.21.
National Council of Economic Research. (1998).Understanding Child Development
Services: Key Lesson Learned. Indian Journal of Social Change, 128(9), 110-
125.
National Institute of Public Cooperation and Child Development. (2005). Anganwadi
workers training centres in Uttar Pradesh. NIPCCD-Regional Centre
Lucknow, p.53.
National Institute of Public Cooperation and Child Development. (2004). A Quick
appraisal of AWTCs in Bihar. NIPCCD- Regional Centre Lucknow, p.165.
Organization for Applied Socio-Economic Systems, New Delhi. (2002). Evaluation of
malnutrition (Grade III and IV) among ICDS children in states of Uttar
Pradesh, Orissa and Rajasthan. New Delhi: OASES, p.65.
Pasupuleti, U.R. and Devi, A.L. (2004). Integrated child development services: a study
of job performance of supervisors. First edition , Discovery Publishing House,
New Delhi -02, ch.1, p.6-7.
266
Pelletier, D.L., and Frongillo, E.A. (2003). Changes in child survival are strongly
associated with changes in malnutrition in developing countries. Journal of
Nutrition, 113,107-119.
Pelletier, D.L., Frongillo, E.A., Schroeder, D.G., and Habicht, J.P. (1995). The effects
of malnutrition on child mortality in developing countries. Bulletin of the World
Health Organization 73: 443-448.
Popkin, B.M., Horton, S., Kim, S.W., Mahal, A., and Shuigao, J. (2001). Trends in diet,
nutritional status, and diet-related non-communicable diseases in China and
India: the economic costs of the nutrition transition. Nutrition Reviews 59(12),
379-390.
Pratinidhi, A.K., Tambe, M.P., and Garad, S.G. (1998). Diet survey of ICDS children in
Pune city. Indian Journal of Community Medicine, 23(4), 152-154.
Premachandran, S., Mridula, B., and Sharma, A. (2009). Dual burden of India
Newsletter Indian Women Scientist Association (IWSA), January-April 2009,
35 (1).
Prinja, S., Verma, R., and Lal, S. (2005). Role of ICDS program in delivery of
nutritional services and functional integration between anganwadi and health
worker in north India. The Internet Journal of Nutrition and Wellness, 2008,
5(2).
Rai, M.K., and Vailaya, J. (1996). The national nutrition scene-an analysis of results of
two national surveys. National Institute of Nutrition, Hyderabad, India.
Ramchandran, V. (2005) Reflection of ICDS. Paper publication in Seminar. Web edition.
Reclaiming Childhood. Seminar no.564, 1-8.
Ray,S.K.(2005). Action for tackling malnutrition: growth monitoring or surveillance?
Indian Journal of Public Health. October-December 2005,49 (4), 214-
7.Retrieved on 26th
December 2010; http://www.ncbi.nlm.nih.gov/pubmed/
16479900
Saiyed, F.and Seshadri, S. (2000). Impact of the integrated package of nutrition and
health services. Indian Journal of Pediatrics, 67(5), 322-8.
Santrock, J.W. (1997). Children, Sixth edition, The McGraw –Hill companies, Unites
States of America, ch.9, p.250.

267
Schurch, B., and Scrimshaw, N.S. (1989). Activity, energy expenditure and energy
requirements of infants and children. Proceedings of an International Dietary
Energy Consultancy Group Workshop held in Cambridge, USA, November 14
to 17, 1989.
Scrimshaw, N.S., Guzmán, M.A., Flore, M., and Gordon, J.E. (1968). Disease
incidence among preschool children under natural village conditions, with
improved diet and medical and public health services. Nutrition and infection
field study in Guatemalan villages, 1959-1964, Archives of Environmental
Health, 16,223-234.
Sethi, D., Cumberland, P., Hudson, M.J., Rodrigues, L.C., Wheeler, J.G., Roberts,
J.A., Tompkins, D.S., Cowden, J.M., and Roderick, P.J. (2001). A study of
infectious intestinal disease in England: risk factors associated with group a
rotavirus in children. Epidemiology and Infection, 126, 63-70.
Sharma, A. (1987). Monitoring social components of integrated child development
services-a pilot project. New Delhi: NIPCCD, p.28-106.
Sharma, B., Mitra, M., Chakrabarty, S., and Bharati, P. (2003). Nutritional status of
preschool children of Rajgond – a tribal population in Madhya Pradesh, India.
Malaysian Journal of Nutrition, 2006, 12(2),147-155.
Sharma, S. (2008). Childhood mortality and health in India. Delhi: Institute of
Economic Growth. National Institute of Public Cooperation and Child
Development, DCWC Research Bulletin, October - December 2008, XIII (4)39.
Singh, B.M., and Vashist, S. (1993). Assessment of training needs of anganwadi
workers in relation to infant feeding. Health and Population- Perspectives and
Issues, 16(1&2), 74-82.
Singh, M.B., Lakshminarayana, J., Fotedar, R., and Anand, P.K. (2006). Childhood
Illness and malnutrition in under 5 children in drought affected desert area of
western Rajasthan, India. Journal of Communicable Diseases, 38 (1), 88-96.
Srilakshmi, B. (2000). Dietitics, Second edition, new age international (P) Limited,
Publishers, New Delhi-02, ch4, p.48-49.
268
Tandon, M., and Kapil, U. (2008). Integrated child development services scheme: need
for reappraisal. Indian Journal of Public Health, July-September, 52(3), 156-
8.Retrived from http://www.ncbi.nlm.nih.gov/pubmed/19189840.
Thakare, M.M., Kurll, B.M., Doibale, M.K., and Goel, N.K. (2007). Knowledge of
anganwadi workers and their problems in an urban ICDS block. Journal of
Medical College Chandigarh, 2011, 1(1), 15-19.
Udani, R.H., Chothani, S., Arora, S., and Kulkarni, C.S. (1980). Evaluation of
knowledge and efficiency of anganwadi workers. Indian Journal of Pediatric,
47,289-92.
Vaid, S., and Vaid, N. (2006). Nutritional status of ICDS and non ICDS children.
Journal of Human Ecology ,18(3) , 207-212.
Verma, J.L., Das,S., Sankar,R., Mannar,M.G,V., Levinson, F.J. and Hamer ,D.H.
(2007). Community level micronutrient fortification of a food supplement in
India: a controlled trial in preschool children aged 36-66 months. American
Journal of Clinical Nutrition, 85, 1127-33.
NEWSPAPER REPORTS /OTHER REPORTS
Bredenkamp, C., and Akin, J.S. (2004). India’s integrated child development services
scheme: meeting the health and nutritional needs of children, adolescent girls
and women?. Background report for India Nutrition AAA report. Washington,
DC: The World Bank.
Gragnolati, M. (2005). Nutritional status during infancy and early childhood. Report by
National Institute of Nutrition, ch 6.5, p.164-165.
Mishra, V.K., and Retherford, R.D. (2000). Women’s education can improve child
nutrition in India. Report No.15. National Family Health Survey-India.
International Institute of Population Sciences, Mumbai.
National Institute of Public Cooperation and Child Development. (2009). Data tables
on ICDS, National Institute of Public Cooperation and Child Development
(NIPCCD), New Delhi. Retrieved from http:// wcd.nic.in/icdsdatatables.htm.
National Nutrition Monitoring Bureau. (2005). Annual Reports, National Institute of
Nutrition, Hyderabad, India.

269
National Council of Applied Economic Research, New Delhi. (2001). Concurrent
evaluation of Integrated Child Development Services. New Delhi: NCAER,
National Report Vol. (1 & 2), p.200.
National Nutrition Monitoring Bureau. (2000). Diet and Nutritional Status of Rural
Population. NNMB Technical Report No. 21. National Institute Of Nutrition,
Hyderabad, India.
National Nutrition Monitoring Bureau. (1999).Annual Reports, National Institute of
Nutrition, Hyderabad, India.
Programme Evaluation Organization. (2009). Evaluation report on ICDS Jammu &
Kashmir. Planning Commission of India, New Delhi.ch 2, p.12, 20.
United Nation International Children Emergency Funds. (2010). Narrowing the gaps
to meet the goals. New York. USA. Retrieved from http://www.unicef.org/
media/files/Narrowing_the_Gaps_to_Meet_the_Goals_090310_2a.pdf
United Nation International Children Emergency Funds. (2007). Progress for
children report - a statistical review December 2007. Retrieved from
http://www.unicef.org/india/media_3766.htm
United Nation International Children Emergency Funds. (1998). The state of the
world’s children 1998: Focus on Nutrition. New York: Oxford University Press.
World Health Organization, (1995). Physical status: the use and interpretation of
anthropometry. Report of a WHO Expert Committee. WHO Technical Report
series 854. Geneva: World Health Organization.
World Health Organization (1948). Constitution of the world health organization. Basic
documents, 45th
edition, supplement, October 2006; pp-1. Retrieved from
http://www.who.int/governance/eb/who_constitution_en.pdf
National Nutrition Monitoring Bureau. (2005-06). Annual Reports, National Institute of
Nutrition, Hyderabad, India.
Hulshof, K. (2009, December 10). Child undernutrition in India is a human rights issue.
The Hindu online edition. Retrieved from http; // http://www.hindu.com/2009/
12/10/stories/2009121051270900.htm
WEBSITES LINKS MINISTRY OF WOMAN AND CHILD DEVELOPMENT http://wcd.nic.in/
270
NATIONAL INSTITUTE OF NUTRITION http://www.ninindia.org/
NATIONAL INSTITUTE OF PUBLIC COOPERATION AND CHILD
DEVELOPMENT http://nipccd.nic.in/
SHODHGANGA http://shodhganga.inflibnet.ac.in/
UNITED NATION INTERNATIONAL CHILDREN EMERGENCY FUND
http://www.unicef.org/india/
WIKIPEDIA http://en.wikipedia.org/wiki/Main_Page
WORLD HEALTH ORGANIZATION http://www.whoindia.org/en/index.htm

271
ANNEXURE
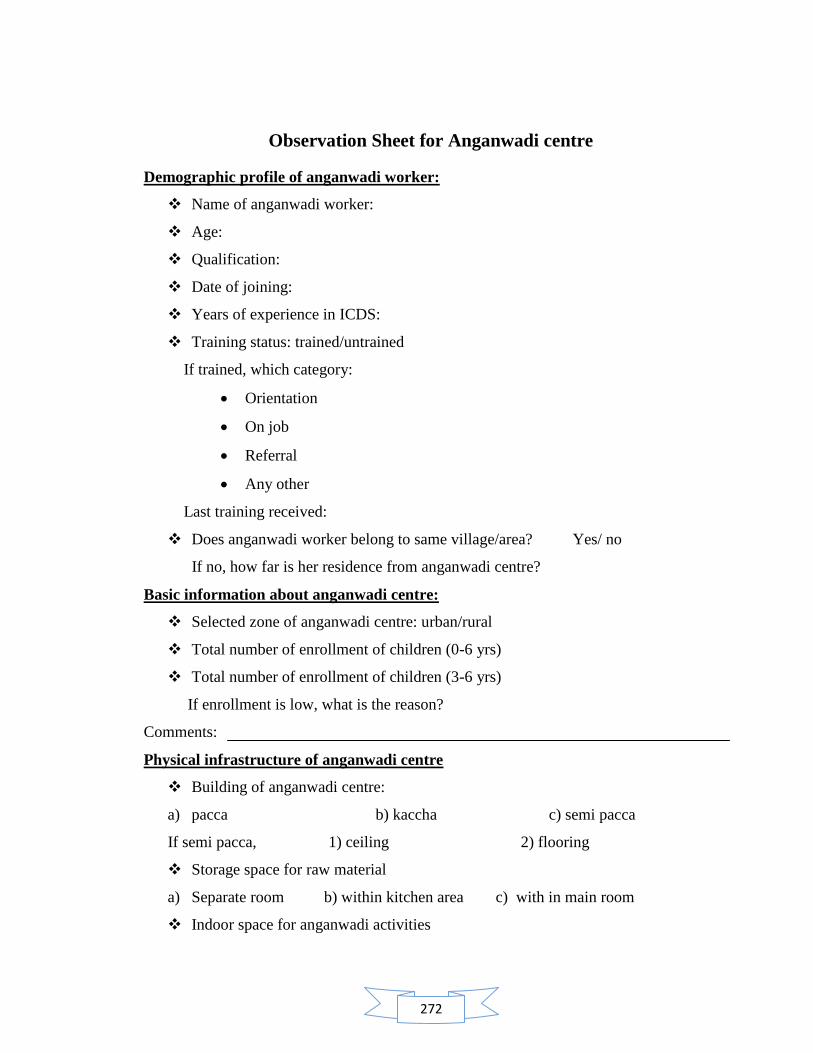
272
Observation Sheet for Anganwadi centre
Demographic profile of anganwadi worker:
Name of anganwadi worker:
Age:
Qualification:
Date of joining:
Years of experience in ICDS:
Training status: trained/untrained
If trained, which category:
Orientation
On job
Referral
Any other
Last training received:
Does anganwadi worker belong to same village/area? Yes/ no
If no, how far is her residence from anganwadi centre?
Basic information about anganwadi centre:
Selected zone of anganwadi centre: urban/rural
Total number of enrollment of children (0-6 yrs)
Total number of enrollment of children (3-6 yrs)
If enrollment is low, what is the reason?
Comments:
Physical infrastructure of anganwadi centre
Building of anganwadi centre:
a) pacca b) kaccha c) semi pacca
If semi pacca, 1) ceiling 2) flooring
Storage space for raw material
a) Separate room b) within kitchen area c) with in main room
Indoor space for anganwadi activities
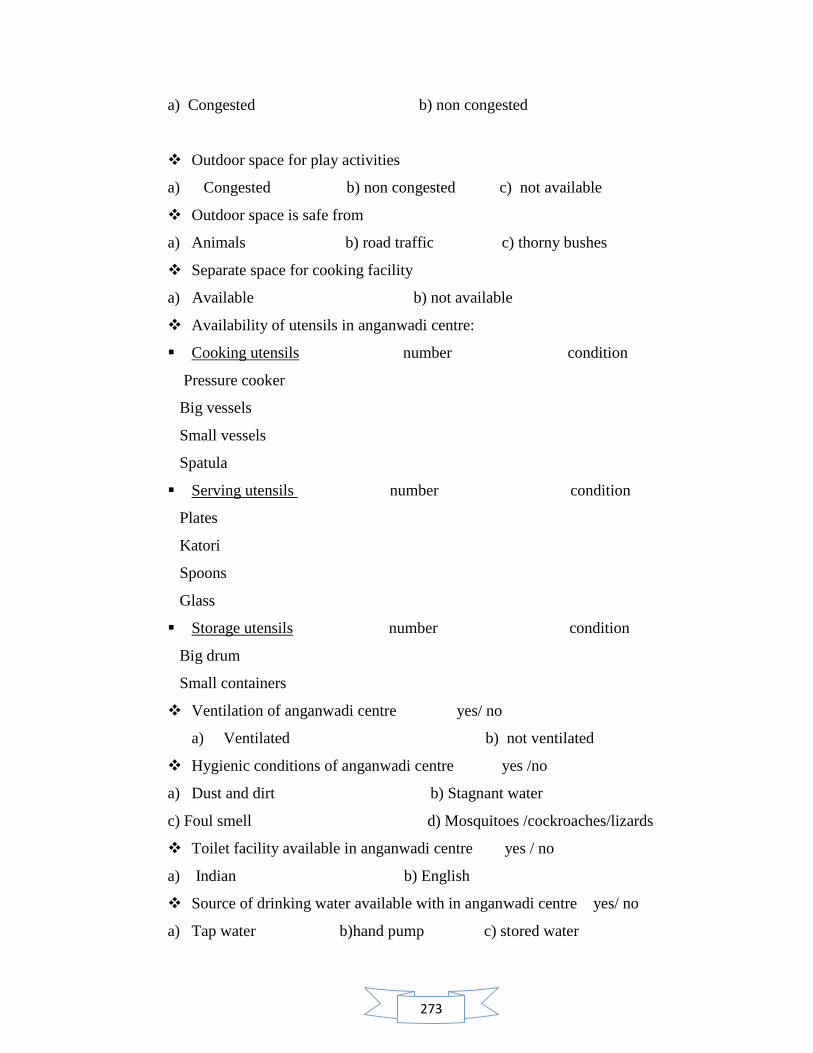
273
a) Congested b) non congested
Outdoor space for play activities
a) Congested b) non congested c) not available
Outdoor space is safe from
a) Animals b) road traffic c) thorny bushes
Separate space for cooking facility
a) Available b) not available
Availability of utensils in anganwadi centre:
Cooking utensils number condition
Pressure cooker
Big vessels
Small vessels
Spatula
Serving utensils number condition
Plates
Katori
Spoons
Glass
Storage utensils number condition
Big drum
Small containers
Ventilation of anganwadi centre yes/ no
a) Ventilated b) not ventilated
Hygienic conditions of anganwadi centre yes /no
a) Dust and dirt b) Stagnant water
c) Foul smell d) Mosquitoes /cockroaches/lizards
Toilet facility available in anganwadi centre yes / no
a) Indian b) English
Source of drinking water available with in anganwadi centre yes/ no
a) Tap water b)hand pump c) stored water
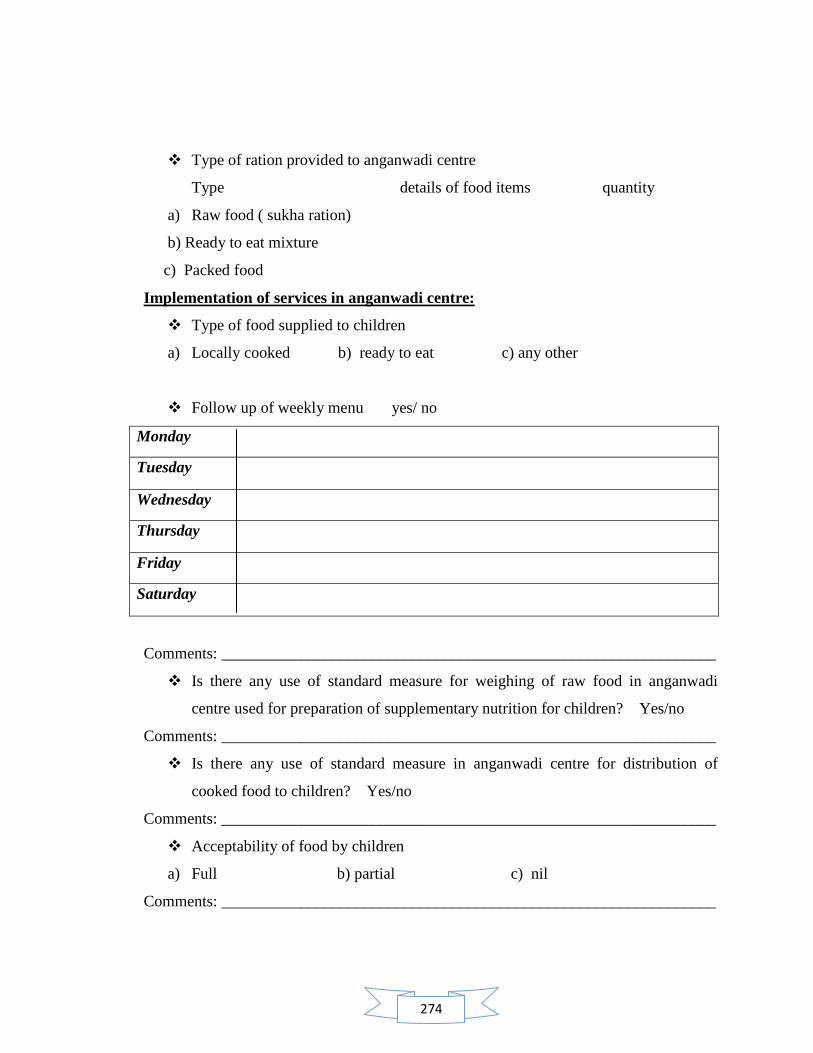
274
Type of ration provided to anganwadi centre
Type details of food items quantity
a) Raw food ( sukha ration)
b) Ready to eat mixture
c) Packed food
Implementation of services in anganwadi centre:
Type of food supplied to children
a) Locally cooked b) ready to eat c) any other
Follow up of weekly menu yes/ no
Monday
Tuesday
Wednesday
Thursday
Friday
Saturday
Comments: ______________________________________________________________
Is there any use of standard measure for weighing of raw food in anganwadi
centre used for preparation of supplementary nutrition for children? Yes/no
Comments: ______________________________________________________________
Is there any use of standard measure in anganwadi centre for distribution of
cooked food to children? Yes/no
Comments: ______________________________________________________________
Acceptability of food by children
a) Full b) partial c) nil
Comments: ______________________________________________________________

275
Quality of food served to children:
Name of the dish:
Parameters Grades
Poor Good Excellent
Appearance
Aroma
Palatability
Texture
Comments: ______________________________________________________________
Is record and maintenance register are properly maintained? Yes/no
Types Of Records Daily Weekly Monthly 2 Month Quarterly More
Is there accuracy in plotting the weight on growth charts by the anganwadi
centre? Yes/no
Comments: ______________________________________________________________
What type of scale being used in anganwadi centre for weight records?
a) Salter scale b) any other scale c) none
Does anganwadi worker use d it properly? Yes/no
Comments: ______________________________________________________________
Does anganwadi worker organize counseling sessions with mothers under
nutrition education program? Yes/no
If yes, a) what is the frequency? ______________________________________
b) Topic of last meeting? ____________________________________________

276
Interview Schedule for Anganwadi Worker
1) What do you understand by health?
A. A state of Physical well being
B. A state of Social well being
C. A state of Physical and Mental well being both
D. A state of complete physical, mental and social well being and not merely the
absence of disease or infirmity.
Comments: ______________________________________________________________
2) What do you understand by balanced diet?
A. Intake of adequate amount of cereals and pulses
B. Intake of adequate amount of cereals and pulses and fruits
C. Intake of adequate amount of cereals and pulses and vegetables
D. Intake of different types of foods in such quantities and proportion that the need
for all nutrients is adequately met.
Comments: ______________________________________________________________
3) Energy giving foods are
A. Carbohydrates, fats C. Proteins, minerals
B. Vitamins, minerals D. Water, roughage
Comments: ______________________________________________________________
4) Body building foods are
A. Proteins, minerals C. Carbohydrates, fats
B. Vitamins, minerals D. Water, roughage
Comments: ______________________________________________________________
5) Protective foods are
A. Water, roughage C. Proteins, minerals
B. Carbohydrates, fats D. Vitamin, minerals
Comments: ______________________________________________________________
6) What is RDA?
A. Revised dietary allowance C. Recommended dietary allowance
B. Revised disease allowance D.Recommended duplicate allowance
Comments: ______________________________________________________________

277
7) One gm proteins contain
A. 6 kcal C. 5 kcal
B. 8 kcal D.4 kcal
Comments: ___________________________________________________________
8) Pulses are rich source of
A. Carbohydrates C. Vitamins
B. Protein D. Fats
Comments: ______________________________________________________________
9) Cereals and millets are rich source of
A. Carbohydrates C. Vitamins
B. Protein D. Fats
Comments: ______________________________________________________________
10) Proteins are mainly important for children because
A. It provides energy to body
B. It provides growth and repair of body
C. It provides protection to body
D. None of the above
Comments: ______________________________________________________________
11) RDA for pre school children are
A. 1240 kcal,22 gm protein,25 gm fat
B. 1690 kcal,30 gm protein,25 gm fat
C. 1950 kcal,41 gm protein,25 gm fat
D. 1650 kcal, 25 gm protein, 15 gm fat.
Comments: ______________________________________________________________
12) Major cause of death among children below five
A. Diarrhea C. Dehydration
B. Malnutrition D. None
Comments: ______________________________________________________________
13) In how many grades malnutrition is categorized
A. 2 C. 4
B. 3 D. 5

278
Comments: ______________________________________________________________
14) Two types of malnutrition are
A. Marasmus and kwashiorkor C. Grade 1 and grade 2
B. High malnutrition and low malnutrition D .Acute and chronic
Comments: ______________________________________________________________
15) Diarrhea is categorized into how many types
A. 4 C. 2
B. 5 D. 3
Comments: ______________________________________________________________
16) When should be the appropriate time to add adequate supplements in baby‘s diet
along with breast milk?
a) 4 months c) 8 months
b) 6 months d) 5 months
17) How much nutritional requirement does anganwadi centre fulfills for the
children of 3-6 yrs under ICDS project?
a) 200 kcal c) 300 kcal
b) 5ookcal d) 600kcal
18) How much nutritional requirement does anganwadi centre fulfills for the
malnourished children of 3-6 yrs under ICDS project?
a) 150 kcal c) 300 kcal
b) 600kcal d) 500 kcal
Check list for nutritional deficiency disorders and its symptoms
Kwashiorkor and Marasmus are two diseases occur due to PEM
a) True b) False
Comments: ______________________________________________________________
Deficiency of vitamin A can cause weakness of eyesight.
a) True b) False
Comments: ______________________________________________________________
Anaemia occurs due to deficiency of iron and folic acid
a) True b) False
Comments: ______________________________________________________________

279
Goiter occurs due to deficiency of iodine in diet
a) True b) False
Comments: ______________________________________________________________
Paleness of nails and eyes is the symptom of anaemia
a) True b) False
Comments: ______________________________________________________________
Night blindness occurs due to deficiency of vitamin A
a) True b) False
Comments: ______________________________________________________________
Beriberi is deficiency disease occurs due to deficiency of vitamin B ( Thiamin)
a) True b) False
Comments: ______________________________________________________________
Scurvy is deficiency disorder which occurs due to deficiency of vitamin C
a) True b) False
Comments: ______________________________________________________________
Bleeding gums is a symptom of vitamin C deficiency in body
a) True b) False
Comments: ______________________________________________________________
Growth failure ,thin and dry hairs ,discoloration of hairs, wrinkled skin and bony
structure, low body weight etc are symptoms of PEM
a) True b) False
Comments: ______________________________________________________________

280
Assessment Of Nutritional Status Of Preschool Children
Name of child:
Sex of child: Male / Female
Age of child (yrs):
Height of child (in cms):
Weight of child (in kgs):
Ideal weight:
24-Hour Dietary Recall Sheet
Meal Meal time Menu Quantity
Early morning
Breakfast
Mid morning
Lunch
Mid noon
Dinner
Bed time
Total calories:
Carbohydrates:
Proteins:
Fats:

281
PUBLICATIONS

282
Publications are attached on extra files as:
1. Annpurna Dogra Publication 1 Thesis
2. Annpurna Dogra Publication 2 Thesis