nutrition for children on dialysis - annual dialysis...
TRANSCRIPT

Nutrition Management of Children on Dialysis
Rosanne J Woloschuk, RD Children’s Hospital Colorado
ADC 2016
Seattle, WA

No Disclosures

Learning Objectives
Review current practice guidelines for nutritional management of pediatric dialysis patients
Discuss strategies for achieving nutritional goals
Gain appreciation for the numerous nutritional challenges faced by caregivers of children on dialysis

Nutrition Goals for Children on Dialysis
Promote normal growth and development
Achieve and maintain optimal nutritional status
Reduce risk of malnutrition, metabolic abnormalities, uremic toxicity and the consequences

Phases of Growth
Fetal Infant Childhood Pubertal
From: Conception to birth
Birth-18 mos 18 mos-12 yrs Onset of puberty
% of total growth 30% 15% 40% 15%
Dependent on:
Nutrition Placenta
Nutrition Good health
Growth hormone Thyroid hormone Good health
Growth hormone Testosterone Estrogen Good Health
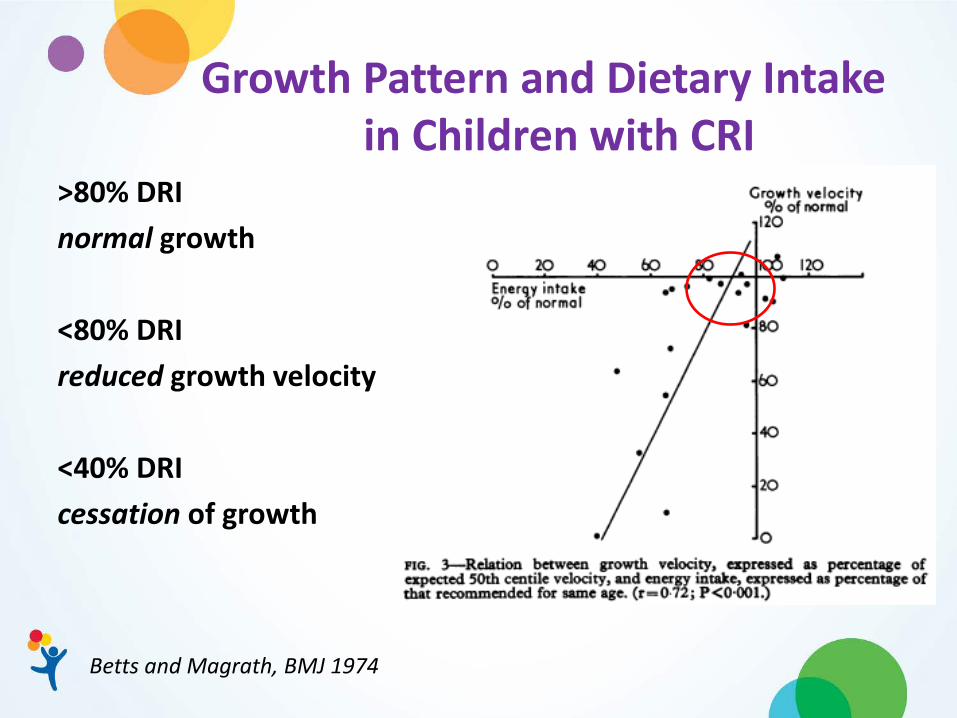
Growth Pattern and Dietary Intake in Children with CRI
>80% DRI normal growth <80% DRI reduced growth velocity <40% DRI cessation of growth
Betts and Magrath, BMJ 1974

Growth in Children with CRI Dating from Infancy
Betts and Magrath, BMJ 1974
Decreased: Energy Protein Vitamin D Associated with: Anorexia Vomiting Metabolic Disorders

Indications for Nutrition Intervention Neonates with Low Birth Wt (<2500 gm) or Birth Wt
z-score below -2 SD (<3%ile) Polyuria, Inability to concentrate urine Impaired ability to ingest or tolerate oral feedings Increased metabolic requirements Documented inadequate intake or intolerance of
nutrients Acute wt loss of > 10% BMI <5% for Ht Age or > 85% (overweight) Inadequate Wt gain, Lt or Ht below – 2SD (3%ile), or
decrease in usual growth percentile Abnormal nutrition related biochemistry

Frequency of Nutrition Assessment
NFK KDOQI Clinical Practice Guideline for Nutrition in Children with CKD: 2008 Update

Additional Factors
Medical – other conditions that may affect nutrition status and care
Socio-economic, Contextual poverty Psychological factors Medications

Plotting Growth
WHO “Growth Standards”
Birth to 2yrs
CDC Reference Curves
2 yrs +
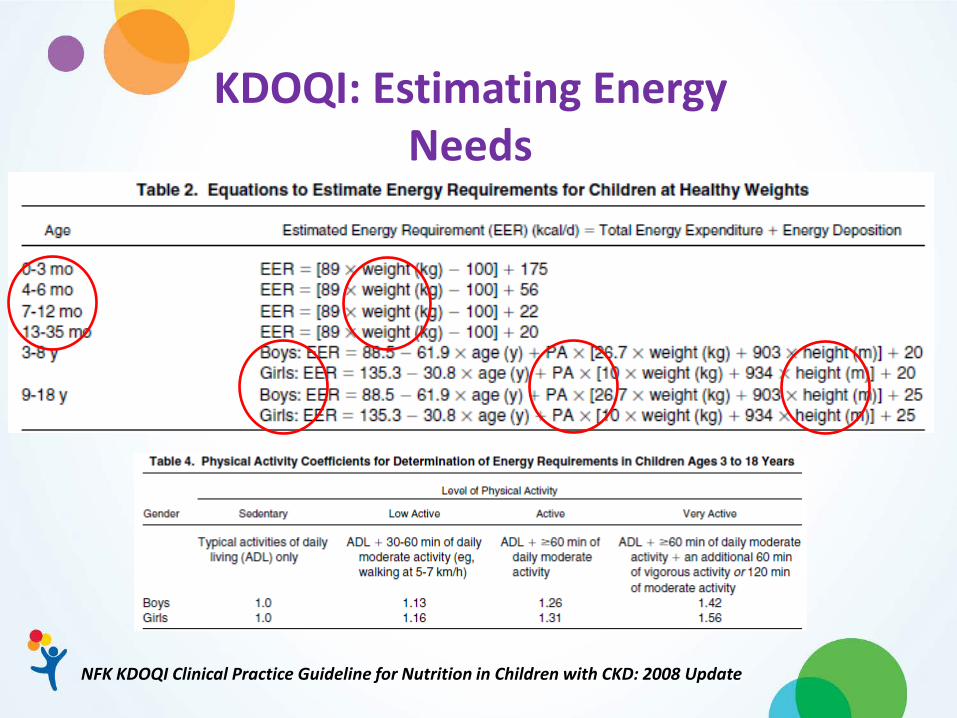
KDOQI: Estimating Energy Needs
NFK KDOQI Clinical Practice Guideline for Nutrition in Children with CKD: 2008 Update

KDOQI: Protein Recommendations
NFK KDOQI Clinical Practice Guideline for Nutrition in Children with CKD: 2008 Update
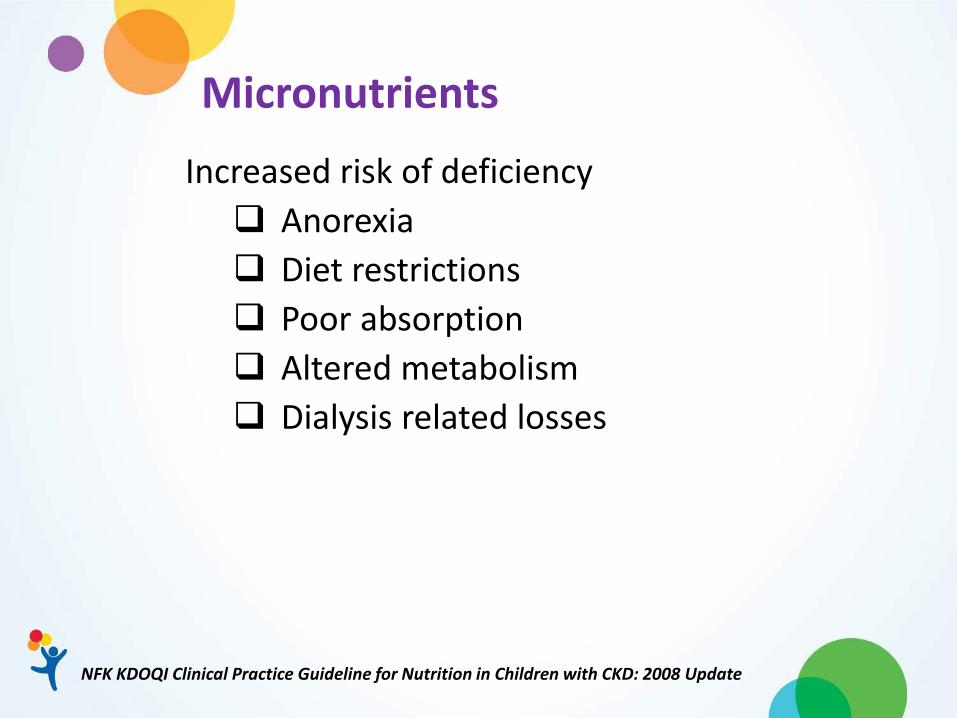
Micronutrients Increased risk of deficiency Anorexia Diet restrictions Poor absorption Altered metabolism Dialysis related losses
NFK KDOQI Clinical Practice Guideline for Nutrition in Children with CKD: 2008 Update

Micronutrients Fat and Water Soluble Vitamins Zinc Copper Supplement if intake low, signs of
deficiency, or low blood levels Recommend water soluble vitamin for
dialysis patients – intake from diet and supplement should not exceed UL
NFK KDOQI Clinical Practice Guideline for Nutrition in Children with CKD: 2008 Update

Vitamin D
Replete as needed Once replete check annually
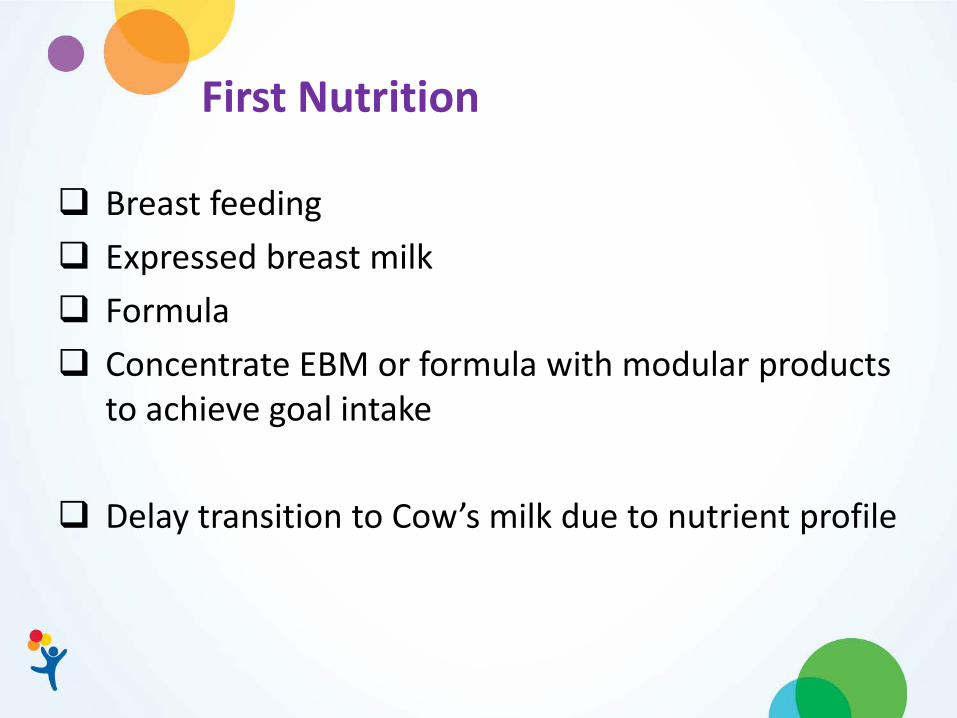
First Nutrition
Breast feeding Expressed breast milk Formula Concentrate EBM or formula with modular products
to achieve goal intake Delay transition to Cow’s milk due to nutrient profile

Feeding Challenges CHALLENGES: Nausea vomiting GI dysmotility, GERD Unwillingness to eat Feeding disorders
INTERVENTIONS: Formula manipulations Prokinetics, acid
blocking meds, PPI Positioning, small,
frequent, thick feeds Feeding specialists (OT,
ST, psychiatrist) Tube feeding,
continuous feeds, j-tube feeding, fundoplication
Ruley, Ped Neph, 1989; Ravelli, Arch Dis Child, 1992

Nutrient Content Comparison per 100 kcal
Source (kcal/oz) mL Pro(g) Na(mg) K(mg) Ca (mg) P(mg)
Human Milk (20) 142 1.5 25 75 46 20
Similac PM 60/40 (20)
147 2.2 23 80 56 28
Renastart (30) 100 1.6 50 23 22 57
Suplena (54) 56 2.5 44 63 59 40
Nepro (54) 56 4.5 59 59 59 40
Renalcal (60) 50 1.7 4 3 3 5
Cow’s Milk 159 5.1 79 248 200 148

Modular Products

Macronutrients
NFK KDOQI Clinical Practice Guideline for Nutrition in Children with CKD: 2008 Update

Managing Potassium and Phosphorus In Formula Fed Patients
Potassium Bunchman et al, Ped Neph 1991 – Pretreating with SPS Hobbs et al, JRN 2010 – Managing hyperkalemia in Infant using Adult Renal Formulas Thompson et al, JRN 2013 – Pretreatment of formula and EBM with SPS
Phosphorus Ferrara et al, Ped Neph 2004 – Pretreat of EBM with Sevelamer Raaijmakers et al, Perit Dial Int 2013 – Pretreatment of EBM and cow’s milk with Sevelamer
Both Taylor et al, Ped Neph 2015 – Pretreatment of renal formulas alters profile

Tube Feeding Indications: Oral supplementation
Routes: NG/ G/ GJ
Encourage: Regular non-nutritive sucking and oral
stimulation for infants Optimal daytime oral intake with O/N
feeds in children

Nutrition Support Study IPPN (International Pediatric PD Network) 2007-2009 To analyze growth in infants on PD <2 yrs - 150 infants: 32 % NG 25% PEG 22% oral supplements 21% no supplemental feeding PEG /NG had significantly higher Ht and BMI
SDS Ht velocity was greater in the enterally-fed
infants
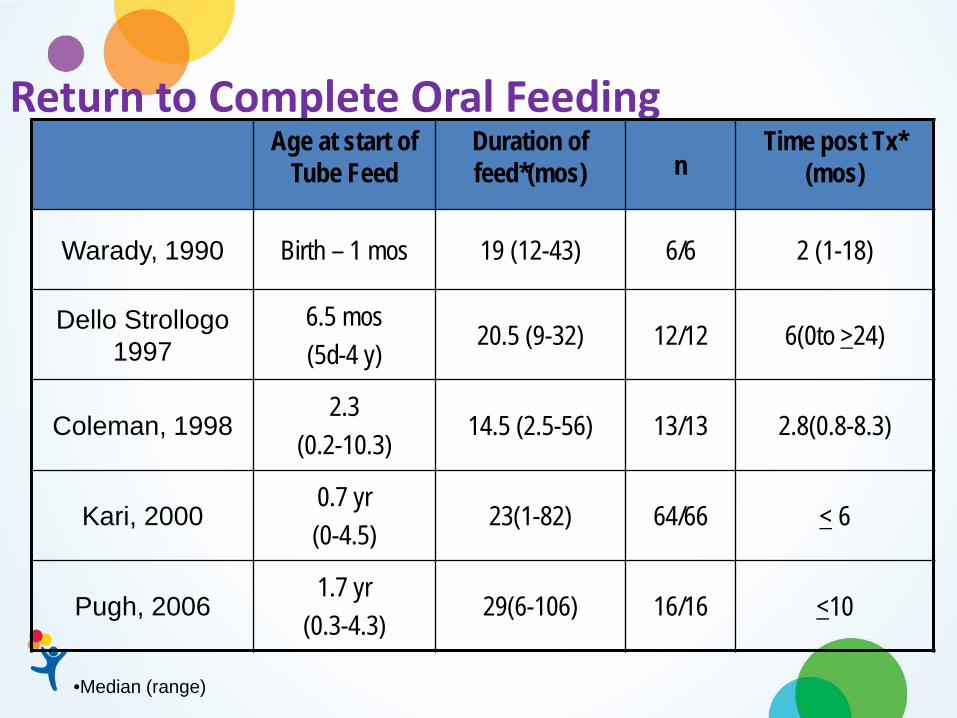
Return to Complete Oral Feeding Age at start of
Tube Feed Duration of feed*(mos) n
Time post Tx* (mos)
Warady, 1990 Birth – 1 mos 19 (12-43) 6/6 2 (1-18)
Dello Strollogo 1997
6.5 mos (5d-4 y)
20.5 (9-32) 12/12 6(0to >24)
Coleman, 1998 2.3
(0.2-10.3) 14.5 (2.5-56) 13/13 2.8(0.8-8.3)
Kari, 2000 0.7 yr (0-4.5)
23(1-82) 64/66 < 6
Pugh, 2006 1.7 yr
(0.3-4.3) 29(6-106) 16/16 <10
•Median (range)

Oral Supplements
Intradialytic Parenteral Nutrition IDPN: Allows augmentation of inadequate
nutritional intake for malnourished children on HD, unable to meet requirements orally or through tube feeding
IV – via venous drip chamber during HD Amino acids Dextrose Lipids

Intradialytic Parenteral Nutrition IDPN + PO 100-150% energy requirements ↑ weight ↑ BMI ↑%ideal body weight ↑ oral caloric intake albumin unchanged
Adverse events: hyperglycemia, lipid intolerance hypophosphatemia
Krause, JRN 2002; Goldstein, Pediatr Nephrol 2002; Orellana, JRN 2005

Oral Diet Modifications
“Renal” Diet – individualize to the patient Fluids Sodium Potassium Calcium Phosphorus (Protein)

Fluids Output Urine Insensible losses Ultrafiltration
Input 80% fluids are
pourable 20% are from foods Liquid at room
temperature High fluid content
Infant formulas ~90% Pediatric and adult
formulas ~70-85%
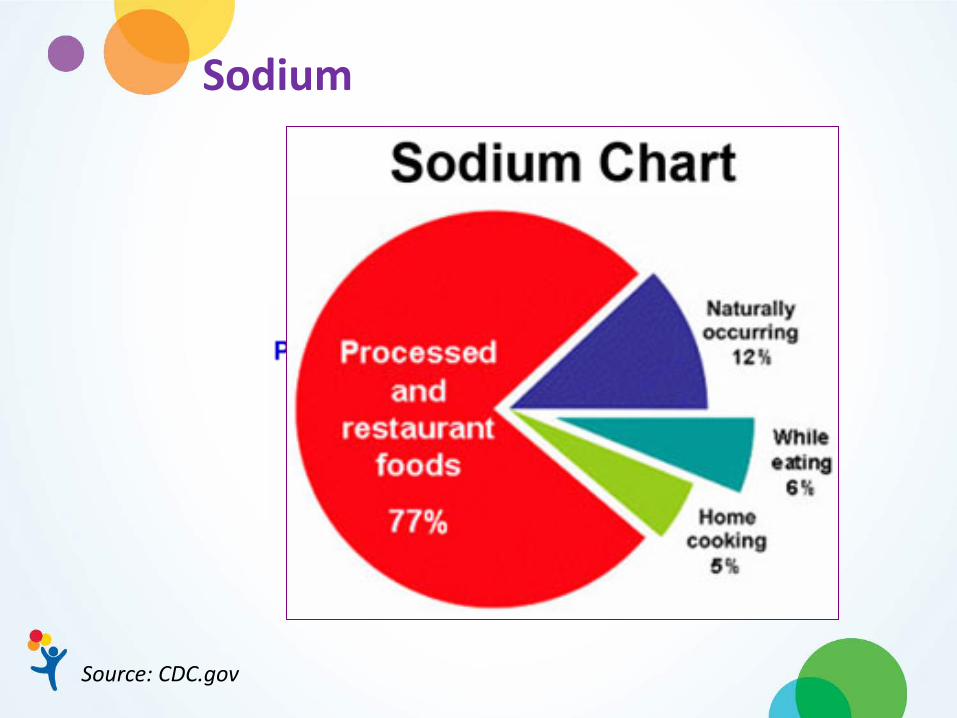
Sodium
Source: CDC.gov

Sodium
Source: US census data

Sodium Intake – Preschool Age
Source: CDC.gov, 2013
1300 mg 1900 mg

Sodium Intake – School Age

Sodium
Replaced packaged/processed foods with fresh foods
Limit restaurant foods Replace salt with herbs and spices in food
preparation Avoid the salt shaker at the table Read food labels – choose foods that are low in
sodium – less than 140 mg/serving Consider sodium provided by medications

Sodium
Source: niddk.nih.gov – NKDEP

Potassium Excretion maintained until GFR <15 ml/min/1.73 m2 Increased risk of hyperkalemia: acidosis urinary obstruction K+ - sparing diuretic ACEI beta blockers Rhabdomyolysis, hemolysis
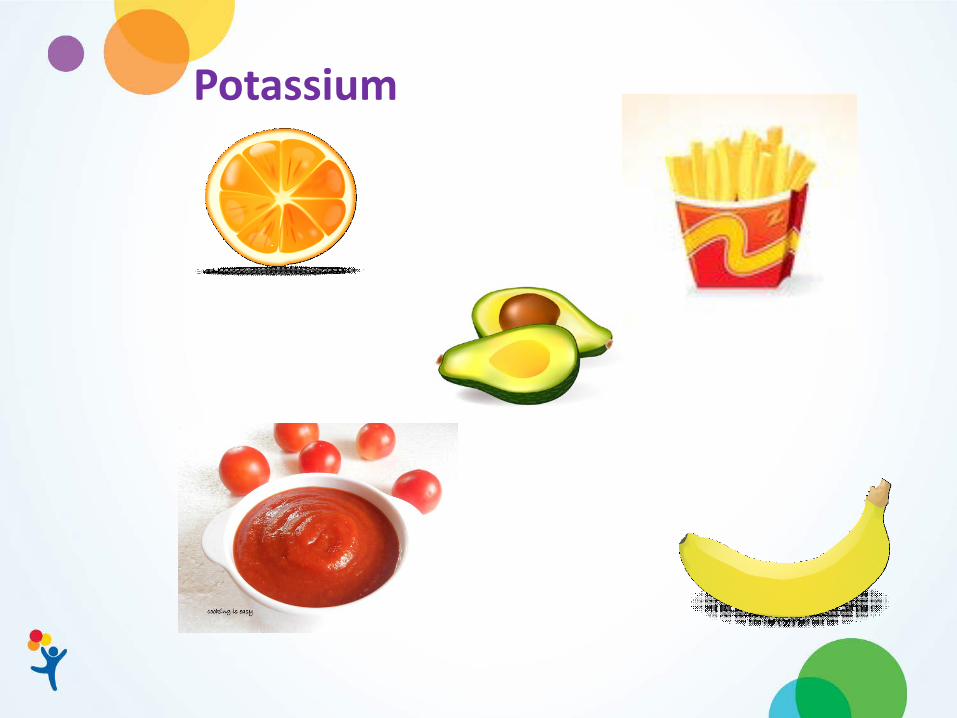
Potassium

Calcium
NFK KDOQI Clinical Practice Guideline for Nutrition in Children with CKD: 2008 Update

Calcium Intake
Consider Calcium burden from diet, formulas, medications
Supplement to DRI if dietary intake is suboptimal – carbonate, acetate, lactate, gluconate salts.
Binder % Elemental Ca Elemental Ca (mg)
mg Phos Bound
Calcium Acetate (667 mg)
25 167 45 (27 mg per 100 mg Ca)
Calcium Carb (1250 mg)
40 500 39 (8 mg per 100 mg Ca)
ASPEN Pediatric Nutrition Support Core Curriculum, 2nd ed., Chapter – Renal Disease

Phosphorus
NFK KDOQI Clinical Practice Guideline for Nutrition in Children with CKD: 2008 Update
Phosphorus
Natural component of food 80% of DRI (1000-1200mg/d) provided by: milk and milk products meat, poultry, fish whole grains Limited removal through dialysis
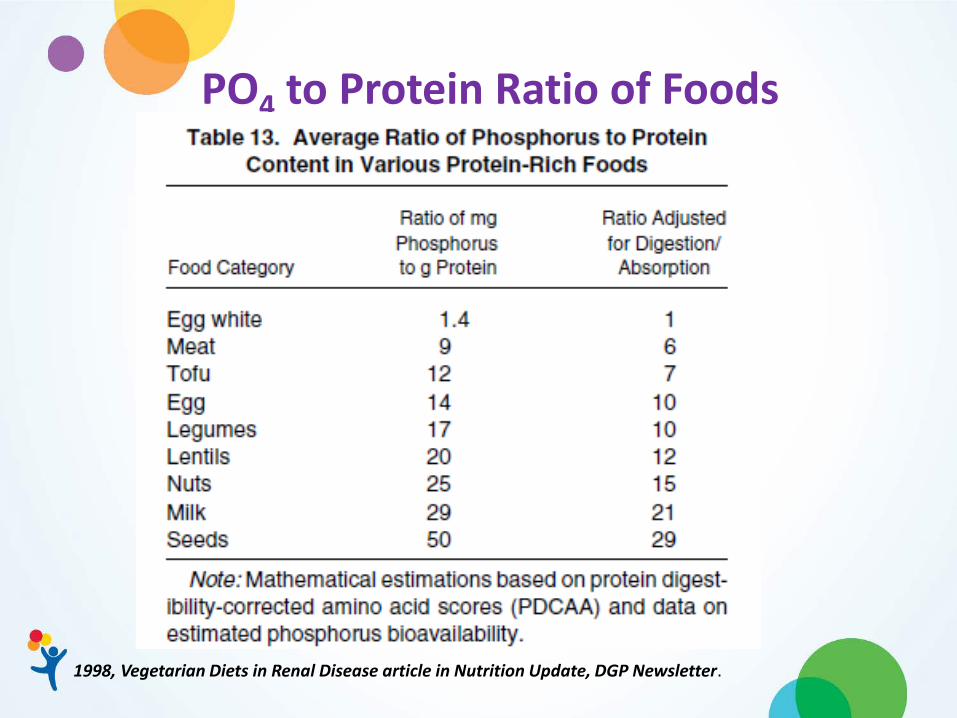
PO4 to Protein Ratio of Foods
1998, Vegetarian Diets in Renal Disease article in Nutrition Update, DGP Newsletter.

Phosphorus Bioavailability
Adema et al, JRN 2014

Phosphorus Additives in food manufacturing – several functions
Foods with PHOS based food additives are nearly
70% higher in phosphorus content compared to their natural version
May contribute as much as 1000 mg/d to intake The added phosphorus content is not accounted for
in data bases.
Benini et al, JRN 2011; Sullivan et al, JRN 2007; Uribarri and Calvo, Semin Dial 2003

Phosphorus Low phosphorus infant feedings (Breast milk, PM
60/40, Suplena) and Delay introduction of cow’s milk, use non-dairy substitutes
Limit: intake of highly bioavailable forms of phosphorus – dairy foods, some protein foods, foods containing added phosphorus
Adjust binder dose, timing to content of
meals/snacks/ TF
Read ingredient lists for “PHOS” based additives
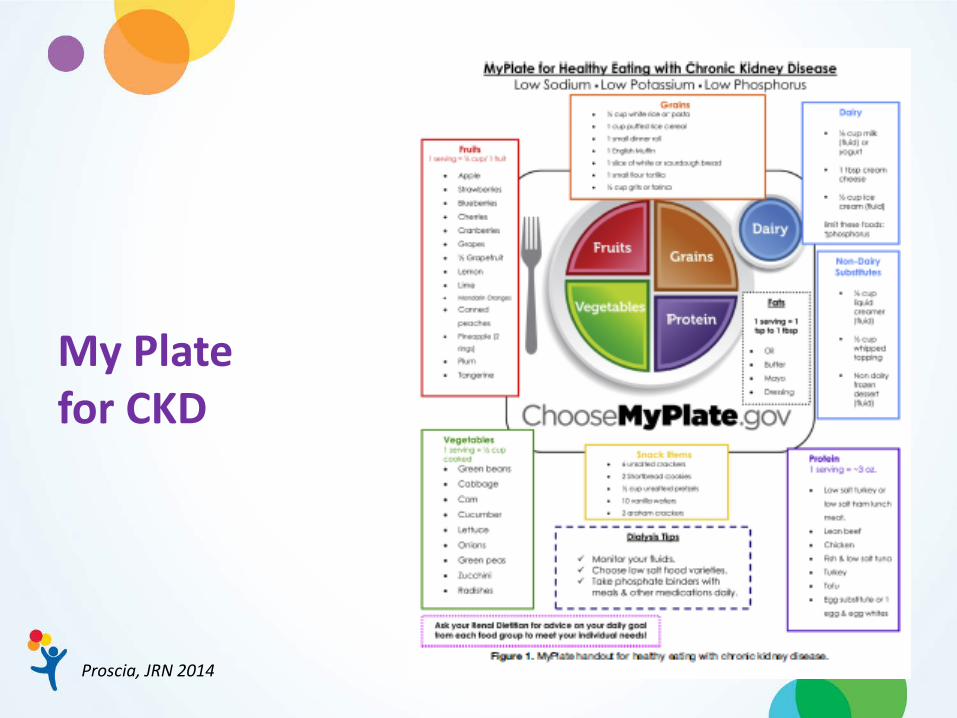
My Plate for CKD
Proscia, JRN 2014

Diet Prescription
Restrict only when clearly needed Individualize for:
age, stage of development food preferences
As liberal as possible! - restrict further depending on response
Less restricted if RRF, on PD or daily HD

Education and Support Initiate nutrition education at start of nutrition
interventions, first introduction of solid foods Frequent Re-Education Creative Strategies Identify preferred learning style(s) Variety of teaching styles and tools Utilize incentive programs – building on skills Involve the team through every step
