provision of home dialysis by freestanding renal dialysis ... fileprovision of home dialysis by...
TRANSCRIPT
Provision of Home Dialysis by Freestanding Renal Dialysis Facilities Michael Kendix, Ph.D.
This article explores home dialysis provision among freestanding renal facilities by examining whether they provide continuous ambulatory peritoneal dialysis (CAPD), continuous cycling peritoneal dialysis (CCPD), and home hemodialysis. These modalities require fewer visits to a dialysis center, which may be beneficial for patients living long distances from facilities. A negative association was found between the number of facilities per square mile and the probability of provision of the home modalities. Secondly, facilities with a higher percent of black patients were less likely to provide the home modalities. Thirdly, facilities with larger numbers of patients were more likely to provide the home modalities.
INTRODUCTION
In 1992 there were 157,354 dialysis patients with end stage renal disease (ESRD), 145,399 of whom were covered by the Medicare program (Health Care Financing Administration, 1994). There are two types of dialysis—hemodialysis and peritoneal dialysis. Patients undergoing hemodialysis are attached to a machine for 3 to 4 hours, approximately three or four times a week. The patienf's blood is fed into the machine, which purifies the blood and returns it to the patient. The second type of dialysis is peritoneal dialysis, where the peritoneal cavity is filled with dialyzing fluids and the patient's blood is purified as it passes through the peritoneal membrane. This process is continuous and the dialyzing fluid is replaced every few hours. During
The author is with the Office of Research and Demonstrations, Health Care Financing Administration (HCFA). The views expressed are those of the author and do not necessarily reflect those of HCFA.
1992, most patients in the ESRD program underwent outpatient hemodialysis. However, a significant minority (28,896 of 157,354) used other dialysis modalities, namely, home hemodialysis, home or outpatient intermittent peritoneal dialysis (IPD), CAPD, and CCPD. The less common modalities, which are referred to as "minority" modalities in this article, have various advantages and disadvantages relative to outpatient hemodialysis. For example, CAPD and CCPD do not require patients to visit a dialysis center three times per week, thus providing more freedom. Weighed against this is the increased risk of infection associated with CAPD and CCPD (Nolph, Lindblad, and Novak, 1988). These minority modalities are, therefore, suitable and preferable for some patients, while being disadvantageous to others. Ideally, physicians should be able to select from the complete range of modalities in order to pick the modality appropriate for their patients' circumstances. This article links patient-level data from the HCFA ESRD Program Management and Medical Information System (PMMIS) to facility data from the ESRD Statistical Cost Report Forms and the ESRD Facility Survey, to explore the determinants of modality provision among freestanding renal dialysis facilities, by examining whether they provide CAPD, CCPD, and home hemodialysis.1
1 This is not a complete list of modalities, however; patients using the other modalities, namely, home or outpatient IPD, constitute only 0.25 percent of all ESRD patients (Health Care Financing Administration, 1994). In addition, there are problems with the ESRD Statistical Cost Report data for these modalities. In June 1989, freestanding facilities were instructed by HCFA to record CCPD and CCPD training on the home IPD and outpatient IPD training lines, respectively, of the ESRD Statistical Cost Report Form; therefore, it is impossible to distinguish these modalities (home peritoneal and CCPD) using the Cost Report data. Given the low incidence of IPD and these reporting problems, this article does not consider home or outpatient IPD in any detail.
HEALTH CARE FINANCING REVIEW/Winter 1995/Volume 17, Number 2 105
The purpose of this article is to provide information about the use of these various modalities and to discuss issues relating to their provision. Apart from the minor exception of home IPD, CAPD and CCPD have grown fastest of all modalities, especially the latter (Health Care Financing Administration, 1994). The high growth rate of CAPD and CCPD, which in 1992 accounted for about 90 percent of the minority modalities, gives further motivation for examining the determinants of their provision.
This article applies standard neoclassical economic ideas about firm behavior to freestanding renal dialysis facilities. A facility is assumed to decide whether to provide a modality, based on its self-interest. The primary objective of most, and the sole objective of many, facilities is profit maximization. However, facilities are constrained by several considerations in their efforts to increase profits. First, facilities are constrained by the extant level of technology, which restricts the level and intensity of patient services that can be provided, given the availability of machines and staff. Second, a facility is bound to provide a certain quality of service to its patients. Thus, although a facility could lower costs by reducing the length of a dialysis session, it must also maintain the health of its patients. This must be done not only because there are generally accepted standards of medical practice for dialysis, but also out of self-interest, since facilities need to maintain their patient base. The factors that determine whether a dialysis modality is provided are a combination of facility and patient characteristics. The patient characteristics affect the feasibility and appropriateness of alternative dialysis modalities, for example, income, race, age, and patients' health. The facility characteristics affect the potential profitability of providing a dial
ysis modality; for example, facility size and area characteristics (location). The hypotheses discussed later are based on these assumptions.
The analysis considers a number of hypotheses related to modality provision. First, patients who must travel longer distances to a dialysis facility—for example, in rural areas, where a single facility serves a larger geographic area—face higher time and travel costs for outpatient services. Thus, it is expected that these patients are more likely to prefer home modalities, which require fewer visits to a dialysis center.
Second, facilities in high-wage areas may be discouraged from the provision of modalities requiring labor-intensive services such as training. Because patients undergoing CAPD, CCPD, and home hemodialysis require an initial period of training, higher wages may reduce the provision of these particular modalities. Although reimbursement rates are adjusted to account for variations in local costs, and facilities receive extra compensation for training sessions, this adjustment is imperfect and may not compensate the facilities completely. Thus, the level of health care workers' wages is expected to be negatively associated with the probability of provision, reflecting high training costs.
Third, the intensity of competition in the market place may influence a facility owner's decision to provide the minority modalities. Research has been conducted examining the effect of competition in the dialysis industry, for example, Held and Pauly (1983) and Farley (1993). Because the Federal Government sets the reimbursement rates and pays for the industry's services to Medicare beneficiaries, firms must compete for patients using means other than price competition. One method is to offer a wider range of modal-
106 HEALTH CARE FINANCING REVIEW/Winter 1995/Volume 17, Number 2
ities in order to attract as many patients as possible.
Fourth, there is a substantial literature examining the hypothesis that black persons have less access to non-renal medical services. For the purposes of this article, it is of interest as to whether facilities with a higher percentage of black patients are less likely to provide the minority modalities. Because variables measuring race are often proxies for socioeconomic status, the analysis also includes a control variable for income.
Fifth, there may be scale effects associated with the provision of minority modalities. In other words, if there are a large number of patients, a firm's average cost of provision may be lower, that is, economies of scale.
Finally, Griffiths et al. (1994) have shown that the profit versus non-profit status of a facility is an important factor in determining productivity and the output of dialysis services. The analysis in this article controls for the possibility that a facility's ownership category (profit versus non-profit status) affects the decision to provide the various modalities. Griffiths et al. (1994), Dor, Held, and Pauly (1992), and Held and Pauly (1983) also control for another dimension of ownership, namely, whether the facility is owned by a chain. This analysis also attempts to control for the effect of chain membership, that is, the effect of ownership where a single firm owns a number of dialysis facilities. One would expect that for-profit facilities would tend to provide more of the lower-cost modalities, but there is no definitive evidence that demonstrates which modalities are cheaper to provide. Consequently, we have no a priori beliefs regarding the directional impact of either for-profit or chain membership on the probability of offering the minority modalities.
DATA AND METHODS
Data Sources
Three primary data bases were used for this article. The information reported by renal dialysis centers on the ESRD Statistical Cost Report Forms is a rich data source. Each dialysis facility is required to submit annually an ESRD Statistical Cost Report, which contains costs, broken down by category, for example, drugs, supplies, and salaries. Most important for this article, however, these data contain the number of dialysis and training sessions for home hemodialysis. A number of researchers have utilized the information in these reports, for example, Held and Pauly (1983), Dor, Held, and Pauly (1992), Farley (1993), and Griffiths et al. (1994). There is not, however, any research using these data to investigate the determinants of facilities' modality provision.
The second primary data base used in this article was the ESRD Facility Survey Data. Some of these data are contained in the Statistical Cost data base; however, there are important additional data, in particular, the number of patients in each facility and the number of patients who received dialysis and training for CCPD and CAPD. The third primary data base is the HCFA ESRD PMMIS, which contains data on individual patients who receive dialysis services. These data were used to calculate case-mix control variables; for example, the age, race, and gender composition of facilities' patients. This article also used data from the Health Resources and Services Administration (HRSA) Area Resource File (ARF), primarily U.S. Census and U.S. Department of Labor data, to calculate area characteristics variables such as per capita income.
HEALTH CARE FINANCING REVIEW/Winter 1995/Volume 17, Number 2 107
DATA LIMITATIONS
Researchers who have used the ESRD Statistical Cost Report data previously cited have found several anomalies, large outliers, and inconsistencies. Further, a HCFA memorandum outlines the various problems with the ESRD Statistical Cost Report data, for example, extreme outliers for cost per treatment and the calculation of CAPD and CCPD patient weeks of treatment (Health Care Financing Administration, 1993). Specifically, facilities are asked to report the number of "patient weeks" of CAPD treatment, that is, the number of patients multiplied by the number of weeks during the year in which they were using CAPD. In order to determine those data that were misreported or improperly coded, a number of preliminary cross-checks were conducted. First, a detailed description of the variables' distribution was obtained to locate outliers. Second, the data from the ESRD Statistical Cost Report were cross-checked with the ESRD Facility Survey data. The data from the ESRD Statistical Cost Report and the ESRD Facility Survey were from 1992 (the most recent full sample available). A total of 274 observations was dropped, leaving a sample size for this analysis of 1,195 freestanding facilities. A list of variable definitions and the criteria for dropping observations is provided in the Technical Note.
Assumptions Used in This Study
The provision of three modalities other than outpatient hemodialysis was considered, namely, CAPD, CCPD, and home hemodialysis. Of these, CAPD is by far the most common, with 20,872 patients, although there has been a significant rapid increase in the use of CCPD (Health Care Financing Administration, 1994). To determine whether a facility provided home
hemodialysis, the ESRD Statistical Cost Report data were searched for evidence of home hemodialysis and hemodialysis training. If a facility reported having at least one session for either training or dialysis, the facility was counted as providing the modality. In the case of CCPD and CAPD, the ESRD Facility Survey data set was used, because the ESRD Statistical Cost Report frequently misreported data for CAPD and did not distinguish between home IPD and CCPD. Any facility that reported CCPD or CAPD patients either in training or undergoing dialysis was counted as providing that modality. Although there is not a one-to-one correspondence between training and dialysis services for any modality, it seems reasonable to assume that evidence of the former is reason for believing in the existence of the latter. The correlation coefficients show relatively modest levels of correspondence between the provision of training and dialysis for CAPD (0.22), home hemodialysis (0.38), and CCPD (0.18). It appears, however, that in the case of CAPD and CCPD, the presence of training implies the presence of dialysis. For example, of the 21 facilities providing CCPD training, only 1 showed no CCPD dialysis; however, of the 399 facilities providing CCPD dialysis, 379 did not provide training. Similarly, for CAPD, 67 facilities provided training, of which 64 provided dialysis. In the case of home hemodialysis, the situation is less clear cut. Training sessions were recorded by 105 facilities, but only 57 of those facilities reported home hemodialysis sessions. In summary, the levels of deemed provision were 599 facilities providing CAPD, 400 facilities providing CCPD, and 205 providing home hemodialysis. All the facilities in the sample provided outpatient hemodialysis.
It should be noted that there are data indicating which modalities a facility is approved to provide. Although these data
108 HEALTH CARE FINANCING REVIEW/Winter 1995/Volume 17, Number 2

give some insight into facilities' potential modality provision, the analysis in this article focuses on actual modalities provided. As previously discussed, the ARF was used to provide information about area characteristics. Metropolitan Statistical Area (MSA) characteristics were created by aggregating up from the county level, so that all the facilities located in a particular MSA were assigned the same MSA characteristics. The 265 facilities located outside MSAs were assigned characteristics according to their county location. Clearly, there are alternative geographical delineations that could be used to calculate area characteristics; for example, ZIP code or State. Given the covariates used to measure area characteristics, the MSA was chosen because it appeared to be the best measure for most of the covariates, in most areas of the country. The variables taken from the ARF included per capita income, labor force, members of labor force who were unemployed, and land area.
Methods
The probability of providing the home modalities was modeled using separate multivariate logistic regressions for CAPD, CCPD, and home hemodialysis. We found that 98 percent of facilities providing CCPD also provided CAPD; however, only 65 percent of facilities that provided CAPD also provided CCPD. Given CCPD's relatively low use rate and its high growth rate, it would appear that CCPD is in a catch-up phase of usage, relative to CAPD. The catch-up process may be such that facilities offering CAPD are starting to offer CCPD, as technological development of the latter modality lowers costs. The set of facilities offering CCPD was almost a proper subset of the facilities offering CAPD; consequently, the analysis proceeded along the following lines with respect to the CAPD
and CCPD logits. First, a logit was run on the entire sample, estimating the probability that a facility provided CAPD. Because providing CAPD appears to be a necessary condition for providing CCPD, the sample for the CCPD logit regression was confined to facilities that provided CAPD (599 facilities). The results of this CCPD logit, therefore, represent estimates of the probability of providing CCPD, conditional on the facility providing CAPD.
In contrast to the linkages between CAPD and CCPD, there are distinct technological differences between home hemodialysis and CAPD or CCPD. Thus, we believe that the assumption of mutual independence between home hemodialysis and CAPD or CCPD is reasonable.
The hypothesis relating home modality provision to time and travel cost was tested by including a variable measuring the number of dialysis facilities per square mile in the MSA for non-rural areas or county for those facilities located in a rural area.2 Second, the HCFA wage index was used to control for the hypothesized relationship between high health care workers' wages and a lower probability of modality provision. Third, the Herfindahl index was used as a measure of market competitiveness for the MSA or county.3 A Herfindahl index value of one indicates a single facility (a local monopoly) and a value close to zero indicates a large number of small producers (a more competitive market). The idea that
2 Hospital-based facilities were included in the calculation of facilities per square mile. 3 The Herfindahl Index is the sum of squares of each facility's market share in the MSA or county. A facility's market share was measured as the proportion of patients associated with it. We included hospital-based facilities in calculating this index, though the hospital-based observations are excluded from the logit analysis. There are other measures of market competition and concentration; however, other researchers who have conducted analysis relevant to market concentration have used the Herfindahl index, for example, Farley (1993) and Held and Pauly (1983). A detailed discussion of the different measures of market power is in Farley (1993).
HEALTH CARE FINANCING REVIEW/Winter 1995/Volume 17, Number 2 109
increased competition raises the probability of provision implies a negative coefficient for this covariate. The hypothesis that there is a negative association between the probability of providing a modality and the presence of black patients is tested here by including the percent of facility patients who are black. The scale effects are measured by including the number of patients and the number of patients squared as covariates.
In addition to the idea that larger facilities may benefit from economies of scale with respect to the number of patients, it is possible that there are economies of scale for chains, with respect to the number of facilities owned and operated by the chain. An examination of the distribution of chain size (number of facilities owned by the same firm) revealed three distinct categories that were then applied to the analysis. Dummy variables are, therefore, included to indicate facilities that are owned by large chains, medium-size chains, and small chains. The large chain category contained the three largest chains, the medium chain category included the next four largest chains, and the small chain category contained all the other facilities belonging to chains.
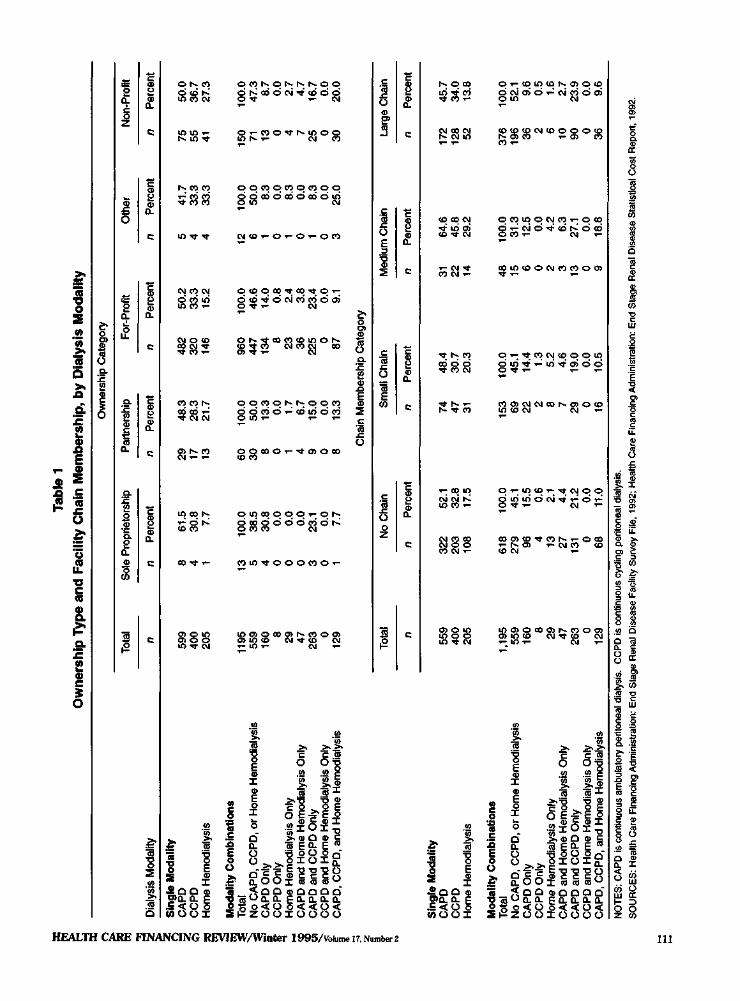
Table 1 shows the provision of the minority modalities by chain and ownership category. These data show that a larger proportion of facilities belonging to medium-size chains, provide CAPD, CCPD, and home hemodialysis. Large chain members provide CAPD and home hemodialysis less often. It is important to note that providing a modality does not signify the extent of modality use, merely that the modality is used in a facility during 1992, the year of this study. Table 1 also shows cross-tabulations between ownership category and the provision of the minority modalities. The lower part of Table 1 provides a breakdown of the com
binations of the minority modalities provided, by ownership and chain category. The most popular pairwise combination of modalities is CAPD and CCPD, reflecting either production complementarities, or a common set of generating causes, or a combination of both.
A set of dummy variables was included to account for variations in ownership status. A larger proportion of sole proprietorship facilities provide CAPD. For-profit corporations and sole proprietorships provide home hemodialysis less frequently than other ownership types. Although these cross-tabulations do not control for variations in other factors, they nevertheless provide a useful overview of the relationship between ownership categories, chain membership, and modality provision.
It is possible that a facility's case mix may affect the probability of offering certain modalities. In particular, patients who are sicker may be less able to perform self-dialysis modalities such as CAPD and CCPD. It has been shown that dialysis patients whose precipitating cause of renal failure was diabetes have higher mortality rates (Held, Pauly, and Diamond, 1987). In order to adjust for this source of variation in case mix, the percent of patients with diabetes as a precipitating cause of renal failure was included as a covariate in the model. Studies that have examined the production of dialysis services (Griffiths et al., 1994) or variations in treatment of ESRD patients (Deber et al., 1985) have controlled for case-mix effects arising from variations in patients' age, gender, and duration of ESRD. The following analysis, therefore, includes covariates that measure the average age of the patients attending a facility, the percent of male patients, and the patients' average duration of ESRD. Also, geographic variation in economic well-being was accounted for by including the unemployment rate and per
110 HEALTH CARE FINANCING REVIEW/Winter 1995/Volume 17, Number 2
Tabl
e 1
Ow
ners
hip
Typ
e an
d F
acili
ty C
hain
Mem
bers
hip,
by
Dia
lysi
s M
odal
ity
Dia
lysi
s M
odal
ity
Sin
gle
Mo
dal
ity
CA
PD
C
CP
D
Hom
e H
emod
ialy
sis
Mo
dal
ity
Co
mb
inat
ion
s T
otal
N
o C
AP
D, C
CP
D, o
r H
ome
Hem
odia
lysi
s C
AP
D O
nly
CC
PD
Onl
y H
ome
Hem
odia
lysi
s O
nly
CA
PD
and
Hom
e H
emod
ialy
sis
Onl
y C
AP
D a
nd C
CP
D O
nly
CC
PD
and
Hom
e H
emod
ialy
sis
Onl
y C
AP
D,
CC
PD
, and
Hom
e H
emod
ialy
sis
Tot
al
n 599
400
205
1195
55
9 16
0 8 29
47
263 0
129
Tot
al
n
559
400
205
1,19
5 55
9 16
0 8 29
47
263 0
129
Sol
e P
ropr
ieto
rshi
p
n P
erce
nt
8 4 1 13
5 4 0 0 0 3 0 1
61.5
30
.8
7.7
100.
0 38
.5
30.8
0.
0 0.
0 0.
0 23
.1
0.0
7.7
No
Cha
in
n P
erce
nt
322
52.1
20
3 32
.8
108
17.5
618
100.
0 27
9 45
.1
96
15.5
4
0.6
13
2.1
27
4.4
131
21.2
0
0.0
68
11.0
Ow
ners
hip
Cat
egor
y
Par
tner
ship
n 29
17
13
60
30 8 0 1 4 9 0 8
Per
cent
48.3
28
.3
21.7
100.
0 50
.0
13.3
0.
0 1.
7 6.
7 15
.0
0.0
13.3
For
-Pro
fit
n 482
320
146
960
447
134 8 23
36
225 0 87
Per
cent
50.2
33
.3
15.2
100.
0 46
.6
14.0
0.
8 2.
4 3.
8 23
.4
0.0
9.1
Cha
in M
embe
rshi
p C
ateg
ory
Sm
all C
hain
n 74
47
31
153 69
22 2 8 7 29 0 16
Per
cent
48.4
30
.7
20.3
100.
0 45
.1
14.4
1.
3 5.
2 4.
6 19
.0
0.0
10.5
Oth
er
n P
erce
nt
5 41
.7
4 33
.3
4 33
.3
12
100.
0 6
50.0
1
8.3
0 0.
0 1
8.3
0 0.
0 1
8.3
0 0.
0 3
25.0
Med
ium
Cha
in
n 31
22
14
48
15
6 0 2 3 13 0 9
Per
cent
64.6
45
.8
29.2
100.
0 31
.3
12.5
0.
0 4.
2 6.
3 27
.1
0.0
18.8
Non
-Pro
fit
n
75
55
41
150 71
13
0 4 7 25
0 30
Per
cent
50.0
36
.7
27.3
100.
0 47
.3
8.7
0.0
2.7
4.7
16.7
0.
0 20
.0
Larg
e C
hain
n
172
128 52
376
196
36 2 6 10
90 0 36
Per
cent
45.7
34
.0
13.8
100.
0 52
.1
9.6
0.5
1.6
2.7
23.9
0.
0 9.
6
NO
TES
: CAP
D is
con
tinuo
us a
mbu
lato
ry p
erito
neal
dia
lysi
s. C
CPD
is c
ontin
uous
cyc
ling
perit
onea
l dia
lysi
s.
SO
UR
CE
S: H
ealth
Car
e Fi
nanc
ing
Adm
inis
tratio
n: E
nd S
tage
Ren
al D
iseas
e Fa
cility
Sur
vey
File
, 199
2; H
ealth
Car
e Fi
nanc
ing
Adm
inis
tratio
n: E
nd S
tage
Ren
al D
isea
se S
tatis
tical
Cos
t Rep
ort,
1992
.
TIT
capita income for the MSA or county. Finally, there is a large literature demonstrating the importance of geographic variation in practice patterns (Wennberg and Gittlesohn, 1973), so a set of dummy variables was included for the U.S. Census Divisions. The summary statistics for all the variables used in this analysis are provided in Table 2.
Odds ratios were calculated for the discrete and continuous covariates. In the case of the dummy variable (discrete) covariates, the calculation was performed by exponentiating the estimated coefficient. The calculations for the continuous covariates were performed by multiplying the difference between the maximum and minimum values of the covariate by its coefficient estimate, and then exponentiating the result; that is, the odds ratio equals exp [beta* (maximum value minus minimum value)]. This calculation measures the odds for a facility whose covariate's value is the maximum, relative to a facility whose covariate's value is the minimum.
RESULTS
The logistic regression results, reported in Table 2, were satisfactory in terms of fit (McFadden's pseudo R-squared) and the level of significance of some of the important covariates. Note that the results of the CCPD logit are estimates using the subset of firms that provide CAPD. Thus, the parameters in the CCPD logit can be loosely interpreted as measures of the impact of the covariates, conditional on the event that the facility provided CAPD.
The results supported the hypothesis that areas with a small number of facilities per square mile (facility density) are more likely to provide minority modalities. The relative odds across the interquartile range for MSA/county population density is 0.07 for CAPD, 0.05 for home hemodialysis, and
0.13 for CCPD. These results indicate that the odds of modality provision for a facility in the area with the highest facility concentration are between 85 and 97 percent of those in the area with the lowest facility concentration. The indicators of an area's economic well-being were mostly not significant. The exception was the positive association between per capita income and the provision of CAPD.
There is substantial support for the hypothesis that facilities with high percentages of black persons are less likely to provide the minority modalities. The percentage of black patients is negative and significant in all the logits. The relative odds of provision falls by between 1 and 2 percent for every 1 percent increase in the percent of black patients. As discussed, this result agrees with other studies that have found evidence of reduced access to health services for black persons (Ford et al., 1989; Mayer and McWhorter, 1989). One explanation for the finding in this article is that outpatient hemodialysis entails a high time cost. Consequently, patients with higher time costs are more likely to prefer other modalities. In particular, those patients who earn high wages would prefer to sacrifice less time visiting dialysis facilities and therefore may prefer CAPD or CCPD.
The estimated parameter for the HCFA wage index was negative in all the logistic regressions, but significant only in the CAPD logit. Hence, there is limited evidence to support the hypothesis that areas with higher health care worker wages deter the provision of CAPD, and possibly CCPD, because it is contingent upon the provision of CAPD. It may be the case, therefore, that reimbursement rate schedules are not providing a reasonable return to facilities located in high wage cost areas.
Contrary to expectations, the Herfindahl index was positive and significant in the CAPD equation, suggesting that more
112 HEALTH CARE FINANCING REVIEW/Winter 1995/Volume 17, Number 2
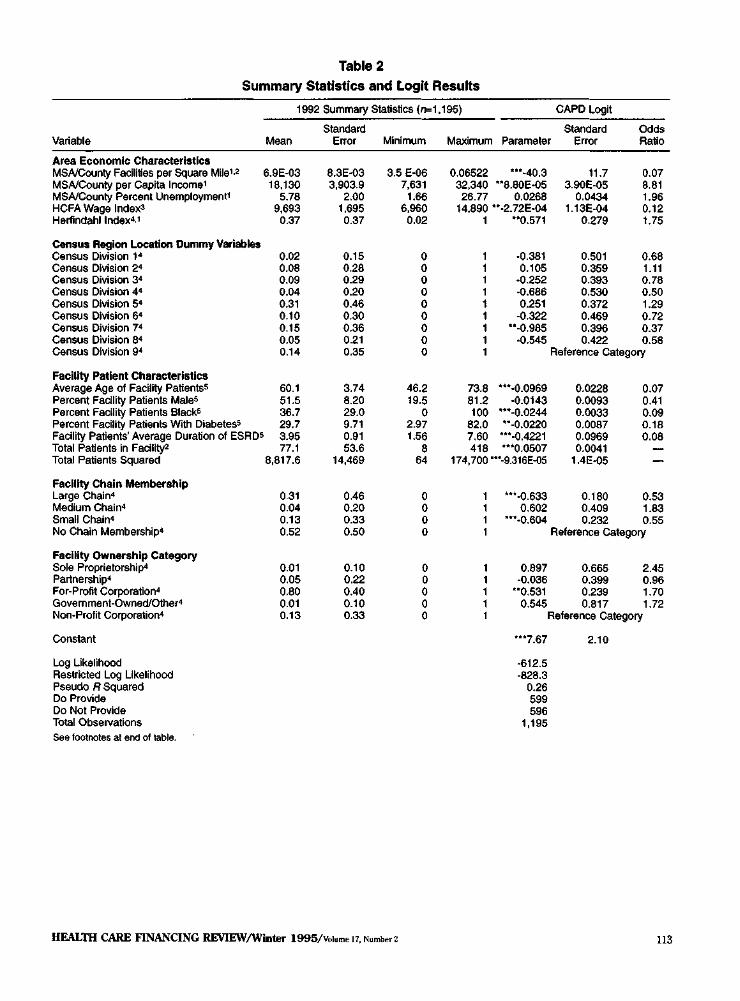
Table 2
Summary Statistics and Logit Results
Variable
Area Economic Characteristics MSA/County Facilities per Square Mile1,2
MSA/County per Capita Income1
MSA/County Percent Unemployment1
HCFA Wage Index3
Herfindahl Index4,1
Census Region Location Dummy Variables Census Division 14
Census Division 24
Census Division 34
Census Division 44
Census Division 54
Census Division 64
Census Division 74
Census Division 84
Census Division 94
Facility Patient Characteristics Average Age of Facility Patients5
Percent Facility Patients Male5
Percent Facility Patients Black5
Percent Facility Patients With Diabetes5
Facility Patients' Average Duration of ESRD5
Total Patients in Facility2
Total Patients Squared
Facility Chain Membership Large Chain4
Medium Chain4
Small Chain4
No Chain Membership4
Facility Ownership Category Sole Proprietorship4
Partnership4
For-Profit Corporation4
Government-Owned/Other4
Non-Profit Corporation4
Constant
Log Likelihood Restricted Log Likelihood Pseudo R Squared Do Provide Do Not Provide Total Observations
1992 Summary Statistics (n=1,195)
Mean
6.9E-03 18,130
5.78 9,693
0.37
0.02 0.08 0.09 0.04 0.31 0.10 0.15 0.05 0.14
60.1 51.5 36.7 29.7 3.95 77.1
8,817.6
0.31 0.04 0.13 0.52
0.01 0.05 0.80 0.01 0.13
Standard Error
8.3E-03 3,903.9
2.00 1,695 0.37
0.15 0.28 0.29 0.20 0.46 0.30 0.36 0.21 0.35
3.74 8.20 29.0 9.71 0.91 53.6
14,469
0.46 0.20 0.33 0.50
0.10 0.22 0.40 0.10 0.33
Minimum
3.5 E-06 7,631
1.66 6,960
0.02
0 0 0 0 0 0 0 0 0
46.2 19.5
0 2.97 1.56
8 64
0 0 0 0
0 0 0 0 0
Maximum
0.06522 32,340 26.77
Parameter
***-40.3 **8.80E-05
0.0268 14,890 **-2.72E-04
1
73.8 81.2 100
82.0 7.60 418
**0.571
-0.381 0.105
-0.252 -0.686 0.251
-0.322 **-0.985
-0.545
CAPD Logit
Standard Error
11.7 3.90E-05
0.0434 1.13E-04
0.279
0.501 0.359 0.393 0.530 0.372 0.469 0.396 0.422
Odds Ratio
0.07 8.81 1.96 0.12 1.75
0.68 1.11 0.78 0.50 1.29 0.72 0.37 0.58
Reference Category
***-0.0969 -0.0143
***-0.0244 **-0.0220
***-0.4221 ***0.0507
174,700 ***-9.316E-05
1 1 1 1
1 1 1 1 1
***-0.633 0.602
***-0.604 1
0.897 -0.036
**0.531 0.545
0.0228 0.0093 0.0033 0.0087 0.0969 0.0041
1.4E-05
0.180 0.409 0.232
0.07 0.41 0.09 0.18 0.08
— —
0.53 1.83 0.55
Reference Category
0.665 0.399 0.239 0.817
2.45 0.96 1.70 1.72
Reference Category
***7.67
-612.5 -828.3
0.26 599 596
1,195
2.10
See footnotes at end of table.
HEALTH CARE FINANCING REVIEW/Winter 1995/Volume 17, Number 2 113
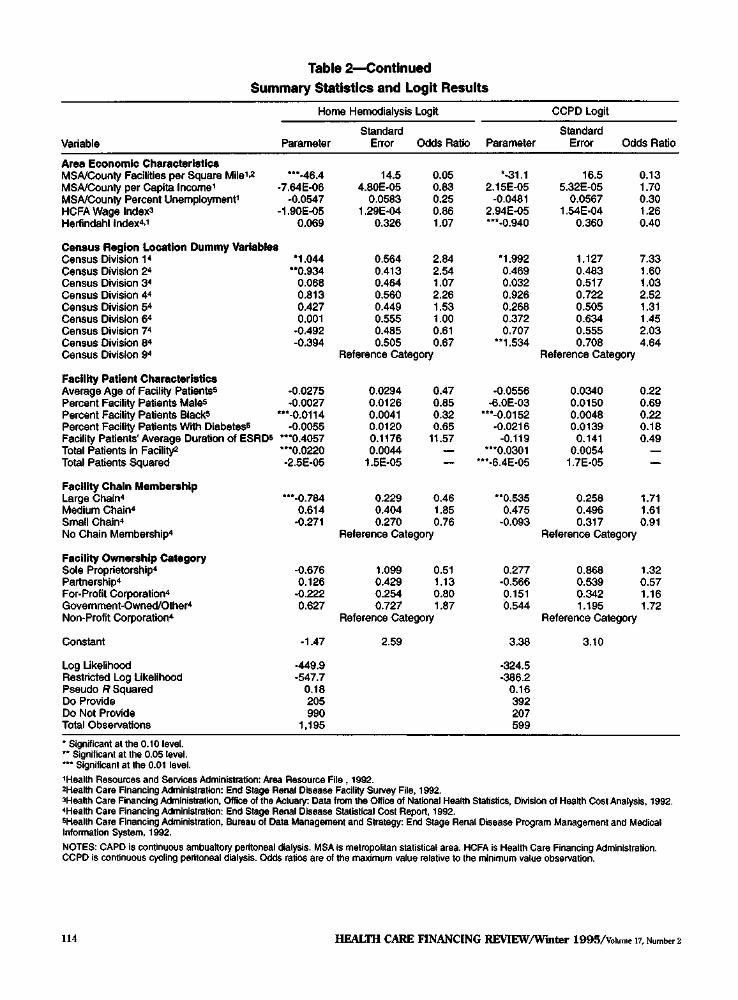
Table 2—Continued
Summary Statistics and Logit Results
Variable
Area Economic Characteristics MSA/County Facilities per Square Mile1,2
MSA/County per Capita Income1
MSA/County Percent Unemployment1
HCFA Wage lndex3
Herfindahl Index4,1
Census Region Location Dummy Variables Census Division 1 4
Census Division 24
Census Division 34
Census Division 44
Census Division 54
Census Division 64
Census Division 74
Census Division 84
Census Division 94
Facility Patient Characteristics Average Age of Facility Patients5
Percent Facility Patients Male5
Percent Facility Patients Black5
Percent Facility Patients With Diabetes5
Facility Patients' Average Duration of ESRD5
Total Patients in Facility2
Total Patients Squared
Facility Chain Membership Large Chain4
Medium Chain4
Small Chain4
No Chain Membership4
Facility Ownership Category Sole Proprietorship4
Partnership4
For-Profit Corporation4
Government-Owned/Other4
Non-Profit Corporation4
Constant
Log Likelihood Restricted Log Likelihood Pseudo R Squared Do Provide Do Not Provide Total Observations
Home Hemodialysis Logit
Parameter
***-46.4 -7.64E-06
-0.0547 -1.90E-05
0.069
t
*1.044 **0.934
0.068 0.813 0.427 0.001
-0.492 -0.394
-0.0275 -0.0027
***-0.0114 -0.0055
***0.4057 ***0.0220 -2.5E-05
***-0.784 0.614
-0.271
-0.676 0.126
-0.222 0.627
-1.47
-449.9 -547.7
0.18 205 990
1,195
Standard Error
14.5 4.80E-05
0.0583 1.29E-04
0.326
0.564 0.413 0.464 0.560 0.449 0.555 0.485 0.505
Odds Ratio
0.05 0.83 0.25 0.86 1.07
2.84 2.54 1.07 2.26 1.53 1.00 0.61 0.67
Reference Category
0.0294 0.0126 0.0041 0.0120 0.1176 0.0044
1.5E-05
0.229 0.404 0.270
0.47 0.85 0.32 0.65
11.57 — —
0.46 1.85 0.76
Reference Category
1.099 0.429 0.254 0.727
0.51 1.13 0.80 1.87
Reference Category
2.59
Parameter
*-31.1 2.15E-05
-0.0481 2.94E-05 ***-0.940
*1.992 0.469 0.032 0.926 0.268 0.372 0.707
**1.534
-0.0556 -6.0E-03
***-0.0152 -0.0216
-0.119 ***0.0301
***-6.4E-05
**0.535 0.475
-0.093
0.277 -0.566 0.151 0.544
3.38
-324.5 -386.2
0.16 392 207 599
CCPD Logit
Standard Error
16.5 5.32E-05
0.0567 1.54E-04
0.360
1.127 0.483 0.517 0.722 0.505 0.634 0.555 0.708
Odds Ratio
0.13 1.70 0.30 1.26 0.40
7.33 1.60 1.03 2.52 1.31 1.45 2.03 4.64
Reference Category
0.0340 0.0150 0.0048 0.0139
0.141 0.0054
1.7E-05
0.258 0.496 0.317
0.22 0.69 0.22 0.18 0.49
— —
1.71 1.61 0.91
Reference Category
0.868 0.539 0.342 1.195
1.32 0.57 1.16 1.72
Reference Category
3.10
* Significant at the 0.10 level. ** Significant at the 0.05 level. *** Significant at the 0.01 level. 1Health Resources and Services Administration: Area Resource File , 1992. 2Health Care Financing Administration: End Stage Renal Disease Facility Survey File, 1992. 3Health Care Financing Administration, Office of the Actuary: Data from the Office of National Health Statistics, Division of Health Cost Analysis, 1992. 4Health Care Financing Administration: End Stage Renal Disease Statistical Cost Report, 1992. 5Health Care Financing Administration, Bureau of Data Management and Strategy: End Stage Renal Disease Program Management and Medical Information System, 1992. NOTES: CAPD is continuous ambualtory peritoneal dialysis. MSA is metropolitan statistical area. HCFA is Health Care Financing Administration. CCPD is continuous cycling peritoneal dialysis. Odds ratios are of the maximum value relative to the minimum value observation.
114 HEALTH CARE FINANCING REVIEW/Winter 1995/Volume 17, Number 2
concentrated markets are likely to produce CAPD. However, the sign of this covariate was negative and significant in the CCPD logit
The effect of chain size varied in both significance and sign across modalities. The reference category for chain size is firms that do not belong to a chain. First, for CAPD provision, the logits show a significant negative effect of small chain membership (odds ratio 0.55) and large chain membership (odds ratio 0.53). Second, for CCPD provision, there is a significant positive effect of large chain membership (odds ratio 1.71). Third, for home hemodialysis provision, there is a significant negative effect of large chain membership (odds ratio 0.46). On balance, chain membership appears to be negatively associated with the provision of minority modalities. The simple cross tabulations presented in Table 1 are mostly in concert with the logit results. The positive sign for large chain members providing CCPD is interesting. It suggests that the group of large chain members providing CAPD have a higher probability of providing CCPD. Somewhat surprising, however, is that whereas small and large chain members are less likely to provide CAPD, their medium-size counterparts do not have this tendency.
The results produced some support for the hypothesis that ownership category has an impact on the probability of provision for CAPD, but not the other minority modalities. The reference category for ownership is non-profit corporations. The for-profit corporation dummy variable was positive and significant for CAPD (odds ratio 1.7). This result is important because for-profit corporations comprise 80 percent of the total sample of facilities. Furthermore, because most large chain members are also part of for-profit corporations, the results show the importance of delineating between both chain membership and own
ership category. In a set of unreported estimations, the for-profit facilities were grouped together, creating a single dummy variable indicator. These results also showed highly significant and positive associations between for-profit organizations and the probability of providing CAPD.
The number of patients was highly significant and positive in all the logit equations, which strongly supports the hypothesis that facilities with a larger patient base have a higher probability of providing these modalities, albeit at a decreasing rate, due to the negative coefficient on "total patients squared." The strength of this relationship suggests that facility size is of fundamental importance and implies that there are substantial economies of scale associated with the provision of the minority modalities.
Finally, a set of logistic regressions was run to assess the specification's sensitivity to including the previously deleted observations. There were 1,425 facilities for which data were available for all the variables in the logit equation, and identical logits were estimated. With two exceptions, there were no major differences in the results. First, the percent of black patients was significant at the 11-percent level in the home hemodialysis (compared with the 3 percent level in the results previously discussed). The coefficient was only 0.008 compared with 0.01 in the previous results. Second, in the home hemodialysis logit, the medium-sized chain dummy variable was significant at the 7-percent level compared with 15-percent level in the previous results, and the coefficient increased to 0.67 from 0.61.
DISCUSSION
The consistent positive association between low facility density areas and the probability of providing the minority modalities suggests that patients' personal
HEALTH CARE FINANCING REVIEW/Winter 1995/Volume 17, Number 2 115

circumstances may be helping to drive facilities' decisions about services. Although a patient's physician is responsible for recommending a modality, it appears that the physician is likely to take into account the patient's situation regarding travel time and general quality of life. The implication is that, in certain geographic locations and where medically appropriate, policymakers should encourage the provision of modalities that do not require the patient's frequent attendance at a facility. One possibility is to encourage provision in areas where facilities are sparse, by adjusting the reimbursement rates for CAPD, CCPD, and home hemodialysis in these areas.5
The results regarding the provision of services to facilities with higher concentrations of black persons is concomitant with many other studies that suggest that black persons are underserved by the health services industry. It should be noted, however, that, although the results in this article are fairly strong, they are based on aggregate data and may suffer from the ecological fallacy. In other words, the results produced in this article do not prove that black persons per se are underserved, only that facilities with higher concentrations of black persons offer fewer alternatives. This result is supported by findings in other ESRD studies; for example, it has been shown that of those patients surviving 1 year or more after ESRD diagnosis, 84 percent of black persons undergo outpatient dialysis, compared with 70 percent of white persons (1987-91 cohort) (Health Care Financing Administration, 1994). Although there are age and income differences between black and white persons (for example, in 1992 black ESRD patients 5 Reimbursement rates for CCPD, CAPD (Method 1), home hemodialysis, and peritoneal dialysis are equal to three times the outpatient hemodialysis rate, for each week that a patient receives services. In special situations, exceptions to these rates are granted by HCFA.
had an average age of 56.6 compared with 60.9 for white ESRD patients), the results in this article concur with the findings from other data. Policymakers should, therefore, be alerted to the potential lack of services offered to black communities. As discussed, with respect to areas with low facility density, a new set of incentives might be developed that encourages an increased range of modalities where appropriate.
The aforementioned comments notwithstanding, there are a number of possible explanations for the inverse relationship between the percent of black patients and the reduced probability of providing the minority modalities. First, because black persons generally earn lower wages, the amount of wages foregone due to attending a dialysis facility is less, which implies that black persons would prefer outpatient hemodialysis. A countervailing effect, however, arises from the idea that because black persons are more likely to be in a lower income group, they need to earn every dollar they can and would benefit from the improved mobility accompanying the minority modalities. While the inclusion of the MSA/county per capita income variable controls somewhat for this countervailing effect, this is a very imperfect control because the per capita income variable is highly aggregated. This lost wages argument should hold across genders, because males tend to earn higher wages; however, the percent of males variable is not significant in any of the logits. Ordinarily, arguments pertaining to foregone wages are less relevant for the Medicare population, because most are of retirement age. This is not the case for the ESRD program, however, where the average is significantly less than 65 years.
A second important issue relating to black persons' low rate of use of CAPD and CCPD is their risk of infection. Korbet, Vonesh, and Firanek (1993) found a twofold
116 HEALTH CARE FINANCING REVIEW/Winter 1995/Volume 17, Number 2
increase in the rate of peritonitis for black persons compared with white persons. Farias et al. (1994) found that the time to an initial episode of peritonitis for white persons was 50 percent longer than for black persons. Given these findings, there may be sound medical reasons for not prescribing CAPD or CCPD for black patients.
Another possible explanation for black persons using the minority modalities with less frequency is that the living accommodations of many black persons may be inadequate to house the machinery and supplies needed for these modalities. In theory, the income variable should control for this; however, as discussed, the latter is an imperfect control.
The average age variable is negative and significant in the CAPD and home hemodialysis logits, and shows that a 1-year increase in the average age of the facility's patients decreases the relative odds of providing CAPD by 10 percent and home hemodialysis by 3 percent. Because elderly persons tend to be retired and have lower earnings potential, this finding supports the hypothesis of lower time costs lowering the probability of using the non-hemodialysis modalities. However, there may be other factors determining elderly persons' modality choice, for example, using CAPD or CCPD requires some degree of self-sufficiency. Given the lack of significance of the males variable, the low-wage hypothesis is not entirely satisfactory. In particular, it should be noted that some studies have found no relationship between work participation and use of CAPD, for example, Tucker et al. (1991). Consequently, the result for black persons may be due to other factors, aside from low market wages.
The results for chain membership do not support the hypothesis of economies of scale with respect to the provision of the minority modalities within chains. In fact,
the data seem to suggest the reverse, namely that chain membership lowers the probability of providing the minority modalities. Because the logits control for ownership status (non-profit, for-profit etc.) and facility density, this result is somewhat puzzling. One possible interpretation is that the ownership of a chain may standardize the modalities they offer throughout the chain leaving little room for single members of the chain to adjust the type of modalities offered, for example, due to variations in local conditions. Because hemodialysis is the mainstay of virtually all facilities, managers of individual chains may be encouraged to remain, somewhat exclusively, with this modality. One policy recommendation is to increase large chains' awareness of the demand for, and benefits associated with, CAPD, CCPD, and home hemodialysis. In making such recommendations, however, one should be aware that there is no conclusive evidence demonstrating the cost effectiveness of the minority modalities versus outpatient hemodialysis. Studies investigating this issue have been unable to reach any definitive conclusions.6
Additionally, the data suggest that facilities owned by medium-size chains run counter to this trend. One possible explanation for this is that these medium-sized organizations are attempting to gain market share, even though they incur higher costs in the short run by providing CAPD, and, particularly, CAPD training. They may view expansion as necessary for survival, given the tendency toward concentration in the dialysis industry.
Researchers have found evidence of non-price competition among dialysis facilities—for example, Farley (1993). However, the logit results reported here did not produce consistent evidence that facilities compete by offering the minority 6 Examples of these studies are by Held et al. (1992) and Stason and Barnes (1985).
HEALTH CARE FINANCING REVIEW/Winter 1995/Volume 17, Number 2 117
modalities. Indeed, the results produced evidence of a positive association between the Herfindahl index and the provision of CAPD. One possible explanation for this is that training is more expensive than regular dialysis and, though the facility receives extra compensation for training, this may not cover the cost differential. Consequently, facility owners may view training as an investment in a patient who will stay with the facility after training. If there are only a few facilities in the local market area, the patient is more likely to remain with the facility where he has trained. If there is a large number of competing facilities, trained patients may be lured away from facilities. Therefore, there is less incentive for a facility to offer CAPD training in competitive market areas and, consequently, there would be a lower number of patients using CAPD. Another possible explanation is that, if a facility makes more money from CAPD and it has a monopoly, it might use its market power to increase the use of CAPD.
Clearly, there is a correspondence between areas with low facility density and reduced market competitiveness (a lower Herfindahl index). Separating these issues is, therefore, problematic and the weak results for the Herfindahl index may be due to multicollinearity; the correlation coefficient between facility density and the Herfindahl index is -0.51. Because the analysis needs to control simultaneously in the logit regressions for market competitiveness and facility density, the strategy of including both covariates, while recognizing the associated problems, seems reasonable given the available data.
Another interesting result was the higher probability of CAPD offering associated with for-profit corporations. It is intuitively plausible that CAPD costs facilities less per patient, because only supplies and training are required as the main inputs. The profit-
oriented facilities are likely to be sensitive to the relative profit potential across the various modalities, hence their propensity to produce more CAPD services.
Finally, there is very strong evidence suggesting that larger facilities are more likely to offer minority modalities. This result is reasonable, given that there are the usual fixed costs associated with producing any different type of service. This is especially the case because the minority modalities only account for a small proportion of total dialysis services; thus a facility needs to be fairly large in order to be able to cover these fixed costs.
Despite the findings of this article, the data and analyses have a number of weaknesses. First, only freestanding facilities were included and hospital-based facilities were excluded. The data for hospital-based facilities may be valuable in other studies, but they are not necessarily appropriate here. Aside from the data problems associated with measuring hospitals' resource use and output of services, there is the additional problem that hospitals' choice of modalities offered may be based on an entirely different set of criteria. An in-depth study of hospital-based facilities is, therefore, reserved as a topic for future research. It should be noted that hospital-based facilities provide more of the minority modalities. In the sample of freestanding facilities used for this article, 14.6 percent of patients used minority modalities, compared with 18.4 percent of all dialysis patients from all facilities (Health Care Financing Administration, 1994).
Second, the problem of the ecological fallacy discussed earlier in reference to the percent of black patients attending a facility applies to some of the other covariates. Implicit in the logit models is the assumption that, given the covariates, a facility's patients have no special desire to use any particular modality. Ideally, the analysis
118 HEALTH CARE FINANCING REVIEW/Winter 1995/Volume 17, Number 2
would be improved if one could find controls for all possible sources of variation in modality offerings. Unfortunately, data limitations prevent this and one must admit the possibility of specification bias due to omitted variables. Nevertheless, future work will aim to perform analyses at the level of the individual patient, which will provide more information about factors determining dialysis modality choice.
Third, the logistic regressions estimate only the probability that a facility provides a modality, not the quantity of that modality provided. Consequently, the dependent variable for a facility serving a single patient is recorded the same as for a facility serving 100 patients. The production of dialysis services has been investigated by a number of authors and these investigators have faced an output aggregation problem due to the multi-output production of services; however, modeling multi-output production in dialysis facilities is beyond the scope of this article.
Finally, the statistical analysis has been conducted under the assumption that the probability of providing either CAPD or CCPD is independent of the probability of providing home hemodialysis. In conclusion, although the results presented in this article are not definitive, they suggest recommendations to be considered by policymakers:
• There is a need for increased information and awareness regarding the relative costs and benefits of different dialysis modalities. Although physicians are aware of these issues, patients should also be encouraged to educate themselves about the available options. Improved quality of life outcomes are likely to result in situations where physicians and patients understand the advantages and disadvantages of each modality.
• Facility owners need to be presented with appropriate incentives to provide
the whole range of modalities. Because most firms are for-profit organizations, they are likely to respond rapidly to changes in reimbursement rates. In order to determine which modalities are under-utilized, more work needs to be done to assess their costs and appropriateness, including quality of life changes associated with each modality.
TECHNICAL NOTE
Variable Definitions and Sources
• CAPD and CCPD: Facilities reporting any patients undergoing CAPD or CAPD training during 1992 were counted as providing CAPD. The same is true for CCPD. (HCFA ESRD Facility Survey, 1992)
• Home Hemodialysis: Facilities reporting positive numbers of dialysis sessions for home hemodialysis or hemodialysis training during 1992 were counted as providing this modality. (HCFA ESRD Statistical Cost Report, 1992)
• MSA/County Facilities per Square Mile (Facility Density): The number of freestanding and hospital-based facilities in the MSA (or county for locations not contained in MSA's) in 1992, divided by square miles of land area. (HCFA ESRD Facility Survey, 1992 [for the number of facilities]; County and City Data Book, 1983 [for land area; land area taken from the Area Resource File, 1992])
• MSA/County per Capita Income: Per capita income in the MSA (or county for locations not contained in MSA's) in 1990. (U.S. Census, 1990; data were obtained from the Area Resource File, 1992)
• MSA/County Percent Unemployment: Number of persons aged 16 or over unemployed in the MSA (or county for locations not contained in MSAs) divided by the number of persons aged 16 or over in the civilian labor force during
HEALTH CARE FINANCING REVIEW/Winter 1995/Volume 17, Number 2 119
1990. (Department of Labor, Bureau of Labor Statistics, 1990; data were obtained from the Area Resource File, 1992)
• HCFA Wage Index: 1991 Index. (HCFA Office of the Actuary, 1992)
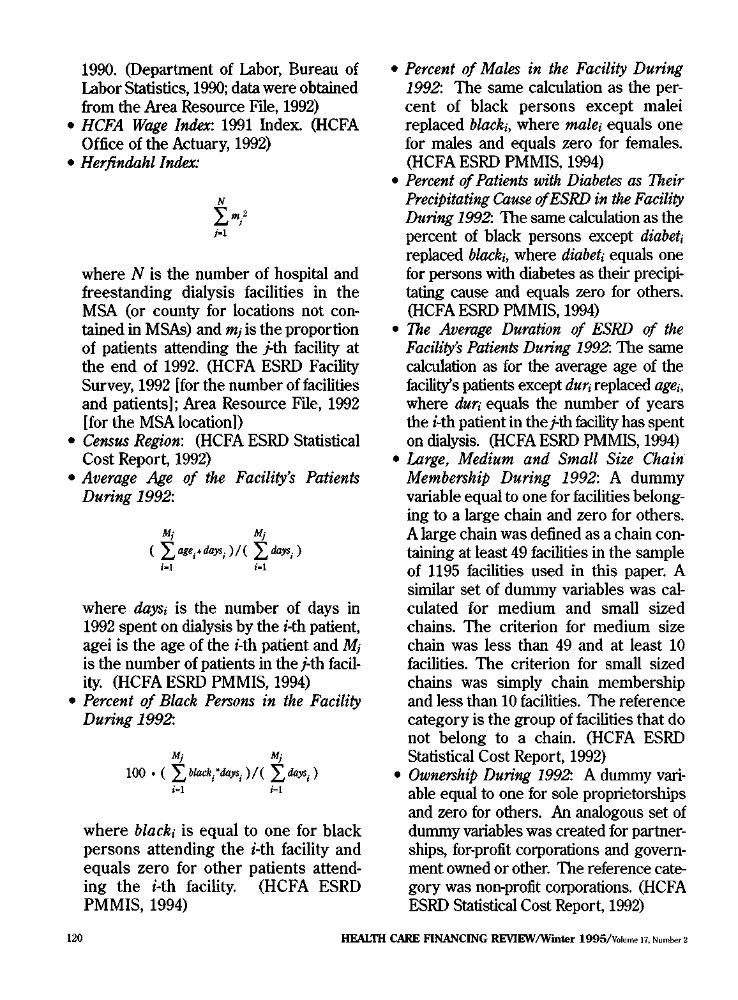
• Herfindahl Index:
where N is the number of hospital and freestanding dialysis facilities in the MSA (or county for locations not contained in MSAs) and mj is the proportion of patients attending the j-th facility at the end of 1992. (HCFA ESRD Facility Survey, 1992 [for the number of facilities and patients]; Area Resource File, 1992 [for the MSA location])
• Census Region: (HCFA ESRD Statistical Cost Report, 1992)
• Average Age of the Facility's Patients During 1992:
where daysi is the number of days in 1992 spent on dialysis by the i-th patient, agei is the age of the i-th patient and Mj
is the number of patients in the j-th facility. (HCFA ESRD PMMIS, 1994)
• Percent of Black Persons in the Facility During 1992:
where blacki is equal to one for black persons attending the i-th facility and equals zero for other patients attending the i-th facility. (HCFA ESRD PMMIS, 1994)
• Percent of Males in the Facility During 1992: The same calculation as the percent of black persons except malei replaced blacki, where malei equals one for males and equals zero for females. (HCFA ESRD PMMIS, 1994)
• Percent of Patients with Diabetes as Their Precipitating Cause of ESRD in the Facility During 1992: The same calculation as the percent of black persons except diabeti replaced blacki, where diabeti equals one for persons with diabetes as their precipitating cause and equals zero for others. (HCFA ESRD PMMIS, 1994)
• The Average Duration of ESRD of the Facility's Patients During 1992: The same calculation as for the average age of the facility's patients except duri replaced agei, where duri equals the number of years the i-th patient in the j-th facility has spent on dialysis. (HCFA ESRD PMMIS, 1994)
• Large, Medium and Small Size Chain Membership During 1992: A dummy variable equal to one for facilities belonging to a large chain and zero for others. A large chain was defined as a chain containing at least 49 facilities in the sample of 1195 facilities used in this paper. A similar set of dummy variables was calculated for medium and small sized chains. The criterion for medium size chain was less than 49 and at least 10 facilities. The criterion for small sized chains was simply chain membership and less than 10 facilities. The reference category is the group of facilities that do not belong to a chain. (HCFA ESRD Statistical Cost Report, 1992)
• Ownership During 1992: A dummy variable equal to one for sole proprietorships and zero for others. An analogous set of dummy variables was created for partnerships, for-profit corporations and government owned or other. The reference category was non-profit corporations. (HCFA ESRD Statistical Cost Report, 1992)
120 HEALTH CARE FINANCING REVIEW/Winter 1995/Volume 17. Number 2
• Total Patients at the End of 1992: Total number of patients attending the facility at the end of 1992. (HCFA ESRD Facility Survey, 1992)
Discarded Observations
Data for the 601 reporting hospital-based dialysis facilities were not used for this article. A total of 1,469 freestanding dialysis facilities reported data, of which 259 were dropped from the analysis due to the following criteria. The number of observations satisfying each criterion are shown in parentheses.
• Average cost per treatment was more than $281 or less than $50. Average cost is total cost assigned to all dialysis modalities divided by the number of treatments reported by the facility. Source: HCEA: ESRD Statistical Cost Report (41 observations).
• Reporting days less than 360. Source: HCFA ESRD Statistical Cost Report (162 observations).
• Salaries plus benefits per full-time equivalent employee, less than $10,000 or exceeding $150,000. Source: HCFA ESRD Statistical Cost Report (71 observations).
• Total patients per full-time equivalent employee exceeding, less than 1 or exceeding 34. Source: HCFA: Renal Facility Survey (for total patients); HCFA ESRD Statistical Cost Report (for full-time equivalents) (44 observations).
• Outpatient hemodialysis patients per regular use dialysis machine, less than one. Source: from the HCFA: Renal Facility Survey (for patients); HCFA ESRD Statistical Cost Report (for dialysis machines) (32 observations).
• Outpatient treatments per full-time equivalent employee, not exceeding 50. Source: HCFA: ESRD Statistical Cost Report (39 observations).
• Outpatient hemodialysis treatment and training sessions, not exceeding 50. Source: HCFA ESRD Statistical Cost Report (29 observations).
• Number of regular dialysis machines per backup machine, not exceeding one. Source: HCFA: ESRD Statistical Cost Report (six observations).
• Number of full-time equivalent M.D.s, greater than or equal to seven. Source: HCFA: ESRD Statistical Cost Report (10 observations).
• Number of full-time equivalent Registered Nurses, greater than or equal to 60. Source: HCFA: ESRD Statistical Cost Report (two observations).
• Number of full-time equivalent Licensed Professional Nurses, greater than or equal to 57. Source: HCFA ESRD Statistical Cost Report (two observations).
• Number of full-time equivalent Nurses' Aides, greater than or equal to 37. Source: HCFA: ESRD Statistical Cost Report (three observations).
• Number of full-time equivalent technicians, greater than or equal to 80. Source: HCFA ESRD Statistical Cost Report (two observations).
• Number of full-time equivalent social workers, greater than or equal to 10. Source: HCFA: ESRD Statistical Cost Report (four observations).
• Number of regular use hemodialysis machines greater than or equal to 69. Source: HCFA ESRD Statistical Cost Report (four observations).
• Number of facilities reporting zero supply costs. Source: HCFA: ESRD Statistical Cost Report (10 observations).
• Number of backup hemodialysis machines greater than or equal to 17. Source: HCFA: ESRD Statistical Cost Report (four observations).
• Facilities located in Puerto Rico. Source: HCFA ESRD Statistical Cost Report (15 observations).
HEALTH CARE FINANCING REVIEW/Winter 1995/Volume 17, Number 2 121
ACKNOWLEDGMENTS
The author would like to thank Yen-Pin Chiang, Steve Clauser, Dan Driscoll, Paul Eggers, Marian Gornick, Joel Greer, Robert Kaestner, Jim Lubitz, and three anonymous referees for their helpful comments. All remaining errors are the responsibility of the author.
REFERENCES
Deber, R. B., Blidner, I. N., Carr, L. M., and Barnsley, J. M.: The Impact of Selected Patient Characteristics on Practitioners' Treatment Recommendations for End-Stage Renal Disease. Medicare Care 23(2): 95-109, February 1985. Dor, A., Held, P. J., and Pauly, M. V.: The Medicare Cost of Renal Dialysis. Medical Care 30(10): 879-91, October 1992. Farias, M. G., Soucie, J. M., McClellan, W., and Mitch, W. E.: Race and the Risk of Peritonitis: An Analysis of Factors Associated With the Initial Episode. Kidney International 46(5): 1392-6, November 1994.
Farley, Donna O.: Effects of Competition on Dialysis Facility Service Levels and Patient Selection. Doctoral Dissertation, Rand Graduate School, 1993. Ford, E., Cooper, R., Castaner, A., et al.: Coronary Arteriography and Coronary Bypass Survey Among Whites and Other Racial Groups Relative to Hospital Based Incidence Rates for Coronary Artery Disease: Findings for the National Hospital Discharge Survey. American Journal of Public Health 79(4): 43740, April 1989.
Griffiths, R. I., Powe, N. R., Gaskin, D. J., et al.: The Production of Dialysis by For-Profit versus Not-For-Profit Freestanding Renal Dialysis Facilities. Health Services Research 29(4):473-86, 1994. Health Care Financing Administration.: Need to Improve Submission of Hospital and Independent Renal Cost Report Data Through the Hospital Cost Report Information System (HCRIS) and the Independent Renal Dialysis Information System (IRDIS). Transmittal Number A-93-2, HCFA Pub. 60 A, August 1993.
Health Care Financing Administration, Bureau of Data Management and Strategy: Health Care Financing Research Report. End Stage Renal Disease, 1992. HCFA Publication Number 03359, 1994. Held, P. J., and Pauly, M. V.: Competition and Efficiency in the End Stage Renal Disease Program. Journal of Health Economics 2:95-118, 1983.
Held, P. J., Pauly, M. V., and Diamond, L.: Survival Analysis of Patients Undergoing Dialysis. Journal of the American Medical Association 257(5):645-50, February 6, 1987.
Held, P. J., Turenne, M. N., Bovbjerg, R. R., et al: Cost Effectiveness of ESRD Treatment Modalities. Final report submitted to HCFA Prepared by The Urban Institute, contract number 500-90-0050, April 30, 1992.
Korbet, S. M., Vonesh, E. E., and Firanek, C. A: A Retrospective Assessment of Risk Factors for Peritonitis Among an Urban CAPD Population. Peritoneal Dialysis International 13(2):126-31, 1993.
Mayer, W.J., and McWhorter, W H.: Black/White Differences in Non-Treatment of Bladder Cancer Patients and Implications for Survival. American Journal of Public Health, 79, 7724, 1989. Nolph, K. D., Lindblad, A., and Novak, J.W.: Current Concept; Continuous Ambulatory Peritoneal Dialysis. The New England Journal of Medicine 318:1595-1600, June 16, 1988. Stason, W. B., and Barnes, B. A: The Effectiveness and Costs of Continuous Ambulatory Peritoneal Dialysis (CAPD). Health Technology Case Study 35, Office of Technology Assessment. September 1985.
Tucker, C. M., Ziller, R. C., Smith, W. R., et al.: Quality of Life of Patients on In-Center Hemodialysis Versus Continuous Ambulatory Peritoneal Dialysis. Peritoneal Dialysis International 11(4):341-6, 1991. Wennberg, J., and Gittlesohn, A.: Small Area Variations in Health Care Delivery. Science, 182:1102-08, December 14, 1973.
Reprint Requests: Michael Kendix, Ph.D., Office of Research and Demonstrations, Health Care Financing Administration, 7500 Security Boulevard, C-3-24-07, Baltimore, Maryland 21244-1850.
HEALTH CARE FINANCING REVIEW/Winter 1995/Volume 17, Number 2 122