nuclear hybrid energy system: molten salt energy storage · inl/ext-13-31768 revision 0 nuclear...
TRANSCRIPT
The INL is a U.S. Department of Energy National Laboratory operated by Battelle Energy Alliance
INL/EXT-13-31768 Revision 0
Nuclear Hybrid Energy System: Molten Salt Energy Storage
INL Summer 2013 Michael Green, Piyush Sabharwall, Michael George Mckellar, and Su-Jong Yoon Georgia Tech Cal Abel and Bojan Petrovic Massachusetts Institute of Technology Daniel Curtis
November 2013

DISCLAIMER This information was prepared as an account of work sponsored by an
agency of the U.S. Government. Neither the U.S. Government nor any agency thereof, nor any of their employees, makes any warranty, expressed or implied, or assumes any legal liability or responsibility for the accuracy, completeness, or usefulness, of any information, apparatus, product, or process disclosed, or represents that its use would not infringe privately owned rights. References herein to any specific commercial product, process, or service by trade name, trade mark, manufacturer, or otherwise, does not necessarily constitute or imply its endorsement, recommendation, or favoring by the U.S. Government or any agency thereof. The views and opinions of authors expressed herein do not necessarily state or reflect those of the U.S. Government or any agency thereof.
INL/EXT-13-31768 Revision 0
Nuclear Hybrid Energy System: Molten Salt Energy Storage
INL Summer 2013 Michael Green, Piyush Sabharwall, Michael George Mckellar, and Su-Jong Yoon
Georgia Tech
Cal Abel and Bojan Petrovic
Massachusetts Institute of Technology Daniel Curtis
3
Idaho National Laboratory Idaho Falls, Idaho 83415
http://www.inl.gov
Prepared for the U.S. Department of Energy
Under DOE Idaho Operations Office Contract DE-AC07-05ID14517

Originating Organization [optional]
Nuclear Hybrid Energy System: Molten Salt Energy Storage
INL/EXT-13-31768 Revision 0
November 2013
Approved by:
Name Title [optional]
Date
Name Title [optional]
Date
Name Title [optional]
Date
Name Title [optional]
Date

v
ABSTRACT
Effective energy use is a main focus and concern in the world today because of the growing demand for energy. The nuclear hybrid energy system (NHES) is a valuable technical concept that can potentially diversify and leverage existing energy technologies. This report considers a particular NHES design that combines multiple energy systems including a nuclear reactor, energy storage system (ESS), variable renewable generator (VRG), and additional process heat applications. Energy storage is an essential component of this particular NHES because its design allows the system to produce peak power while the nuclear reactor operates at constant power output. Many energy storage options are available, but this study mainly focuses on a molten salt ESS. The primary purpose of the molten salt ESS is to enable the nuclear reactor to be a purely constant heat source by acting as a heat storage component for the reactor during times of low demand, and providing additional capacity for thermo-electric power generation during times of peak electricity demand. This report will describe the rationale behind using a molten salt ESS and identify an efficient molten salt ESS configuration that may be used in load following power applications. Several criteria are considered for effective energy storage and are used to identify the most effective ESS within the NHES. Different types of energy storage are briefly described with their advantages and disadvantages. The general analysis to determine the most efficient molten salt ESS involves two parts: thermodynamic, in which energetic and exergetic efficiencies are considered; and economic. Within the molten salt ESS, the two-part analysis covers three major system elements: molten salt ESS designs (two-tank direct and thermocline), the molten salt choice, and the different power cycles coupled with the molten salt ESS. Analysis models are formulated and analyzed to determine the most effective ESS. The results show that the most efficient idealized energy storage system is the two-tank direct molten salt ESS with an Air-Brayton combined cycle using LiF-NaF-KF as the molten salt, and the most economical is the same design with KCl-MgCl2 as the molten salt. With energy production being a major worldwide industry, understanding the most efficient molten salt ESS boosts development of an effective NHES with cheap, clean, and steady power.

vi

vii
CONTENTS
ABSTRACT ............................................................................................................................................ v
ACRONYMS ......................................................................................................................................... ix
1. INTRODUCTION ......................................................................................................................... 1
2. MOTIVATIONS: LOW CARBON ENERGY FUTURE ............................................................... 2
3. NUCLEAR HYBRID ENERGY SYSTEM (NHES) ...................................................................... 5
4. ENERGY STORAGE CRITERIA AND DESCRIPTIONS ............................................................ 5
4.1 Mechanical Energy Storage ................................................................................................. 6
4.2 Chemical Energy Storage .................................................................................................... 6
4.3 Electrical Energy Storage .................................................................................................... 6
4.4 Thermal Energy Storage ...................................................................................................... 7
4.4.1 Potential Applications ....................................................................................................... 7
5. MOLTEN SALT ENERGY STORAGE SYSTEM (ESS) .............................................................. 7
5.1 Two-Tank Direct System ..................................................................................................... 9
5.2 Thermocline System .......................................................................................................... 10
6. MOLTEN SALT CHOICES AND ADDITIONAL DESIGN FACTORS ..................................... 11
7. THERMODYNAMIC ANALYSIS ............................................................................................. 12
7.1 Power Cycle Analysis ........................................................................................................ 12 7.1.1 Rankine Cycle ...................................................................................................... 12 7.1.2 Brayton Cycle ....................................................................................................... 13 7.1.3 Air-Brayton Combined Cycle ................................................................................ 14
7.2 ESS System Energetic Efficiencies Analysis ...................................................................... 14
7.3 Power Cycle Exergetic Efficiencies Analysis ..................................................................... 19
8. ECONOMIC ANALYSIS ........................................................................................................... 21
9. RESULTS ................................................................................................................................... 22
9.1 Thermodynamic ................................................................................................................ 22 9.1.1 Energetic Efficiencies ........................................................................................... 22 9.1.2 Exergetic Efficiencies ........................................................................................... 24
9.2 Economic .......................................................................................................................... 24
10. CONCLUSION ........................................................................................................................... 25
11. REFERENCES............................................................................................................................ 26
viii
FIGURES Figure 1. NHES schematic. ...................................................................................................................... 5
Figure 2. Nuclear renewable energy diagram with a nuclear power plant [1]. .......................................... 7
Figure 3. The NHES system with a molten salt ESS attached. .................................................................. 8
Figure 4. Molten salt loop diagram. ........................................................................................................ 8
Figure 5. Power cycle loop diagram with associated working fluids. ........................................................ 9
Figure 6. Combustion turbine placement in molten salt ESS..................................................................... 9
Figure 7. A two-tank direct molten salt ESS attached to a Rankine power cycle. .................................... 10
Figure 8. A thermocline molten salt ESS attached to a Rankine power cycle. ......................................... 11
Figure 9. Schematic diagram of the subcritical steam Rankine power cycle. ........................................... 13
Figure 10. Schematic diagram of the Brayton gas cycle. ........................................................................ 13
Figure 11. Schematic diagram of the Air-Brayton combined cycle. ........................................................ 14
Figure 12. Schematic diagrams of the molten salt ESS. .......................................................................... 15
Figure 13. Basic diagram of a heat exchanger’s inlets and outlets. .......................................................... 19
Figure 16. Comparison of thermal efficiency of the ESS according to the power cycles. ........................ 23
Figure 17. Cost comparison results. ....................................................................................................... 24
TABLES Table 1. Different energy storage systems within their specific types. ...................................................... 6
Table 2. The advantages and disadvantages of different molten salt ESS units. ...................................... 11
Table 3. The molten salt properties with three chosen salts highlighted for the analysis. ......................... 12
Table 4. Percentages of irreversibility within specific components. ........................................................ 24
Table 5. Cost comparison of three different molten salts. ....................................................................... 24
ix
ACRONYMS ESS Energy Storage System
ERCOT Electricity Reliability Council of Texas
HTSE High Temperature Steam Electrolysis
IHX Heat exchanger
NHES Nuclear hybrid energy system
REFPROP ASME thermodynamic properties database
Subscripts
a actual
gen Generated
in Into the system
in1 Hot fluid inlet
in2 Cold fluid inlet
initial Initial condition of the system
ise Isentropic
min Minimum value
ms Molten salt
out Out of the system
out1 Hot fluid outlet
overall Over the entire system
0 Ambient condition of the system
s Isentropic
st Steam

x

1
Nuclear Hybrid Energy System: Molten Salt Energy Storage
1. INTRODUCTION The world needs alternative energy sources to meet the growing energy demand and relieve global
warming worsened by fossil energy sources. Nuclear power is an effective alternative energy source because of its high-energy density and stability. This makes it an abundant source of base load power production. However, the challenges in nuclear power involve high capital costs, load following in fluctuating power grids, and public perception. Renewable energy sources are another potential clean energy source but face challenges from their intermittent nature and high costs. To overcome limitations of renewable and nuclear energy technologies, the U.S. is working on developing more efficient energy systems. Nuclear hybrid energy systems (NHES) are a solution to these challenges and the overarching energy needs. These innovative energy systems could enable the transition to sustainable energy production by facilitating economical deployment of a non-fossil energy source, such as a combined nuclear-renewable energy system [1].
The NHES design considered in this report is composed of several systems including a nuclear reactor, a renewable energy source, additional process heat applications, and energy storage. This conceptual NHES uses a high-temperature nuclear reactor. With this high-temperature reactor, the NHES is capable of using a portion of the thermal energy for process heat applications such as production of hydrogen using High Temperature Steam Electrolysis (HTSE). This design would greatly reduce the carbon foot print, making a more environmental friendly system. Concerns with this type of integrated system include energy production, efficiency, and cost. A solution to making such a system robust, efficient, and cost- effective would be to integrate an efficient energy storage system (ESS) within the NHES. With this ESS, the NHES will operate in a dynamic manner that could respond to changing energy demands.
Each type of ESS—mechanical, chemical, electrical, and thermal—is suited for a specific process and has advantages and disadvantages. An ESS’s main objective within a NHES is to store excess energy produced during off-peak hours, make integration of highly-variable renewable energy sources possible, and stabilize grid demand fluctuations. The NHES with an effective ESS has the potential to increase revenues from the nuclear plant by storing energy when power prices are low and generating increased electrical power when prices are high. This report will discuss different kinds of energy storage but will focus on molten salt thermal energy.
This report analyzes two different configurations for the molten salt energy storage system—two-tank direct and thermocline. Each of these configurations has associated advantages and disadvantages. The comparative study includes a thermodynamic and economic analysis. The thermodynamic analysis determines the energetic and exergetic efficiencies and the power cycle choice for the molten salt ESS. The economic analysis compares the different molten salt ESS units. These analyses provide information for selecting an effective and efficient molten salt energy storage system, determined by the molten salt type, system design, and design specifications.

2
2. MOTIVATIONS: LOW CARBON ENERGY FUTURE Demand for energy resources, particularly electricity, developed regular and predictable patterns as
both the supply of and demand for energy grew throughout the 20th century. The demand pattern of electricity is particularly important, since electricity can only be economically stored in small quantities compared with daily usage of populated and industrialized areas where the most interesting demand patterns appear. As electricity generation technologies developed to meet this demand, certain technologies took on particular roles in meeting instantaneous electricity demand. As their use spread in the 1950s and 60s, nuclear power plants promptly became the generator of choice for base load, or the amount of demand present at all times and all seasons. Coal generators also often serve base load, with the more expensive or more flexible units serving the additional intermediate load that occurs during daylight hours. Natural gas-fired turbines have become the generator of choice for peaks in demand, generally found in the middle of the day and the early evening, since fuel costs dominate their overall variable cost. Diesel engines and oil-fired plants also serve peaks in demand when needed with very high variable cost. Renewable generation remains dominated by hydroelectric facilities, which are only available in certain regions, but intermittent renewables like wind and solar photovoltaics (PV) have grown rapidly in the first part of the 21st century [2].
Currently there is no combination of very-low-carbon generation technologies available that can precisely meet instantaneous electricity demand without either substantial waste of energy (curtailing renewables) or substantial increases in cost (load-following nuclear) [3].
Studies show that relatively modest use of intermittent renewables, far from the levels that would be needed for a future very-low-carbon electricity system, already impose substantial strains on our ability to meet instantaneous demand. Figure 1 shows one of the results of a recent study at the National Renewable Energy Laboratory (NREL), which indicated that solar PV use at 10% of total electricity, combined with policies requiring the dispatch of renewables in preference to any other technology, could substantially disrupt both the market and the physical dispatch of electricity in California [4]. The over-generation observed near noon in the right-most case would both eliminate the state’s normally large imports, and would require that the state find remote markets in which to sell excess electricity.
Figure 1. Hierarchy of generators serving a typical spring electricity demand pattern in California [5].
-5,000
0
5,000
10,000
15,000
20,000
25,000
30,000
35,000
PV Penetration and Hour
Gene
ratio
n (M
W)
PV
GasTurbinePumpedStorageHydro
CombinedCycleImports
Coal
Nuclear
Wind
Geo
Exports
Base 2% 6% 10% (no PV)
3
Nuclear hybrid energy systems with thermal energy storage could stabilize an electricity system facing this situation in two ways:
1. First, the system could reduce or shut down its electricity output during periods of very high renewable output and corresponding low electricity prices, and instead direct its thermal power to the storage system.
2. Second, energy from the storage system could be used to meet the very steep increase in net demand (total demand minus intermittent renewable generation) found in the afternoon of the right-most case in Figure 1.
Studying the details of the market, including the demand pattern, the existing mix of dispatchable generators, and both existing and planned intermittent renewables, would be necessary to select a proper ratio between the size of the heat source (in this case, the high temperature reactor) and the storage system (in this case, the molten salt system). The operator of the NHES would also need to size the power conversion system to meet the ramps in demand found when intermittent renewable output decreases while demand is increasing.
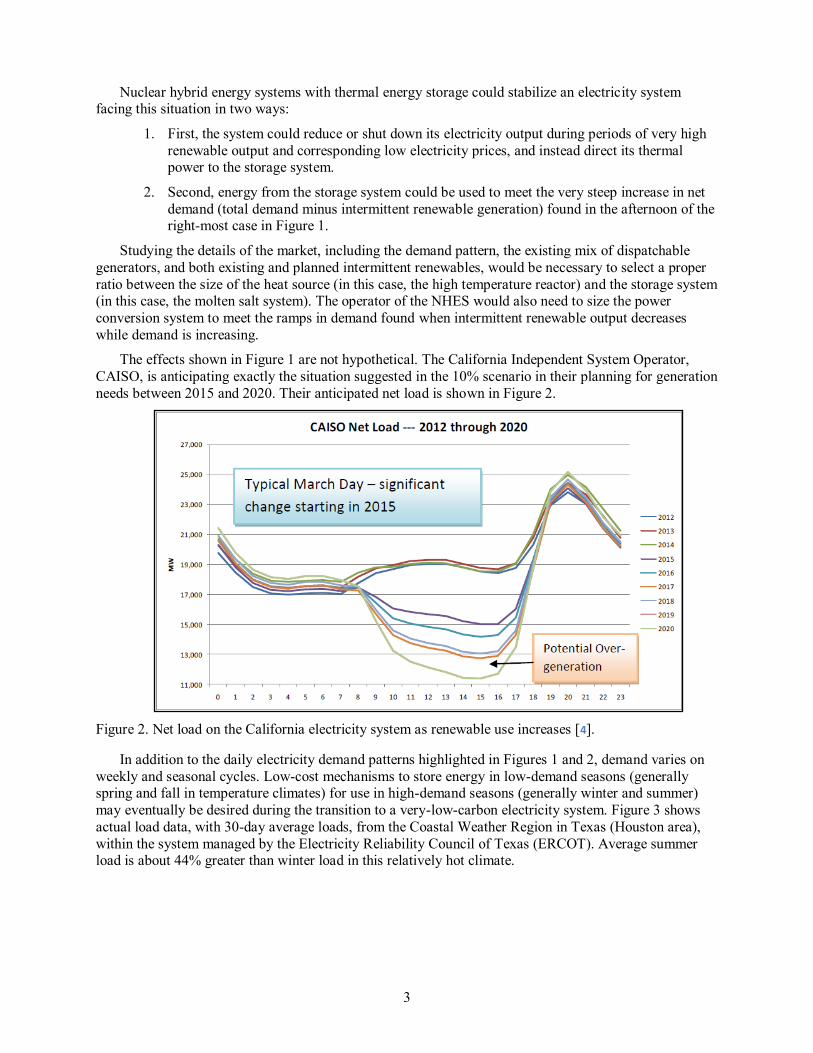
The effects shown in Figure 1 are not hypothetical. The California Independent System Operator, CAISO, is anticipating exactly the situation suggested in the 10% scenario in their planning for generation needs between 2015 and 2020. Their anticipated net load is shown in Figure 2.
Figure 2. Net load on the California electricity system as renewable use increases [4].
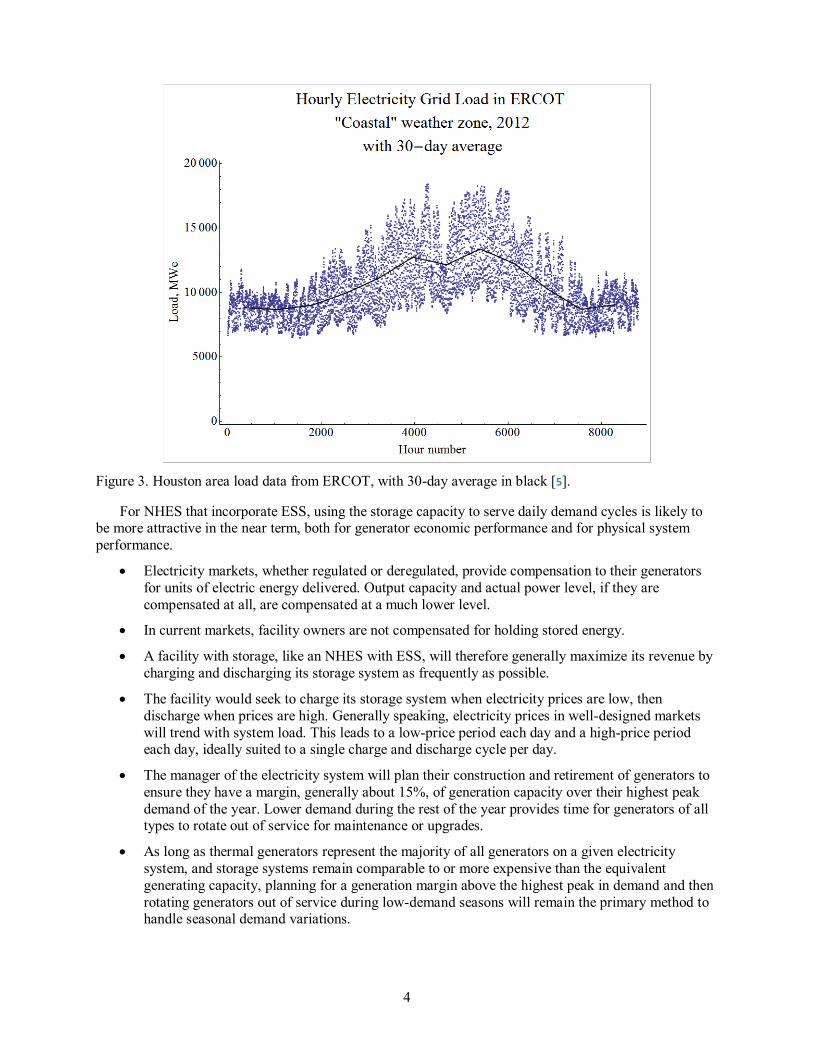
In addition to the daily electricity demand patterns highlighted in Figures 1 and 2, demand varies on weekly and seasonal cycles. Low-cost mechanisms to store energy in low-demand seasons (generally spring and fall in temperature climates) for use in high-demand seasons (generally winter and summer) may eventually be desired during the transition to a very-low-carbon electricity system. Figure 3 shows actual load data, with 30-day average loads, from the Coastal Weather Region in Texas (Houston area), within the system managed by the Electricity Reliability Council of Texas (ERCOT). Average summer load is about 44% greater than winter load in this relatively hot climate.
4
Figure 3. Houston area load data from ERCOT, with 30-day average in black [5].
For NHES that incorporate ESS, using the storage capacity to serve daily demand cycles is likely to be more attractive in the near term, both for generator economic performance and for physical system performance.
Electricity markets, whether regulated or deregulated, provide compensation to their generators for units of electric energy delivered. Output capacity and actual power level, if they are compensated at all, are compensated at a much lower level.
In current markets, facility owners are not compensated for holding stored energy.
A facility with storage, like an NHES with ESS, will therefore generally maximize its revenue by charging and discharging its storage system as frequently as possible.
The facility would seek to charge its storage system when electricity prices are low, then discharge when prices are high. Generally speaking, electricity prices in well-designed markets will trend with system load. This leads to a low-price period each day and a high-price period each day, ideally suited to a single charge and discharge cycle per day.
The manager of the electricity system will plan their construction and retirement of generators to ensure they have a margin, generally about 15%, of generation capacity over their highest peak demand of the year. Lower demand during the rest of the year provides time for generators of all types to rotate out of service for maintenance or upgrades.
As long as thermal generators represent the majority of all generators on a given electricity system, and storage systems remain comparable to or more expensive than the equivalent generating capacity, planning for a generation margin above the highest peak in demand and then rotating generators out of service during low-demand seasons will remain the primary method to handle seasonal demand variations.
5
Therefore, where necessary, the molten salt energy storage system considered here is assumed to charge and discharge once per day. The authors recommend continuing work to quantify the dynamics of various possible charge/discharge cycles of NHES with ESS, particularly in deregulated electricity markets with high renewable penetration.
3. NUCLEAR HYBRID ENERGY SYSTEM (NHES) The NHES design in this report is a combination of several systems. The systems included in the
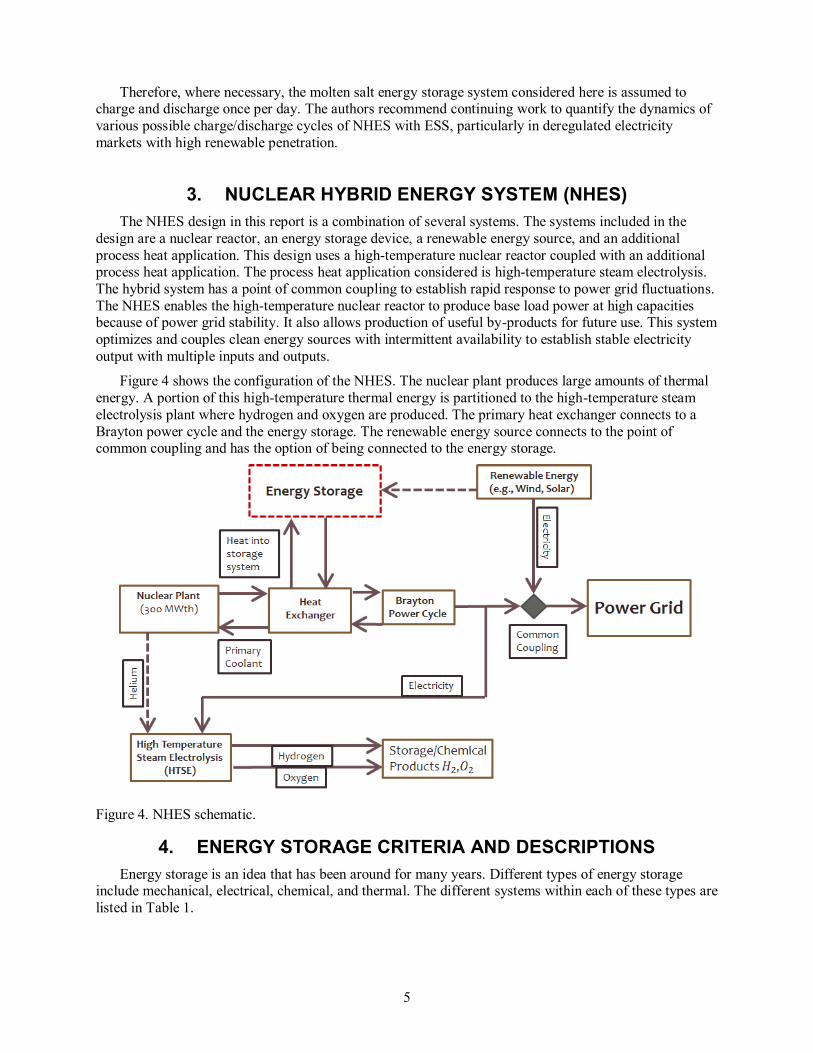
design are a nuclear reactor, an energy storage device, a renewable energy source, and an additional process heat application. This design uses a high-temperature nuclear reactor coupled with an additional process heat application. The process heat application considered is high-temperature steam electrolysis. The hybrid system has a point of common coupling to establish rapid response to power grid fluctuations. The NHES enables the high-temperature nuclear reactor to produce base load power at high capacities because of power grid stability. It also allows production of useful by-products for future use. This system optimizes and couples clean energy sources with intermittent availability to establish stable electricity output with multiple inputs and outputs.
Figure 4 shows the configuration of the NHES. The nuclear plant produces large amounts of thermal energy. A portion of this high-temperature thermal energy is partitioned to the high-temperature steam electrolysis plant where hydrogen and oxygen are produced. The primary heat exchanger connects to a Brayton power cycle and the energy storage. The renewable energy source connects to the point of common coupling and has the option of being connected to the energy storage.
Figure 4. NHES schematic.
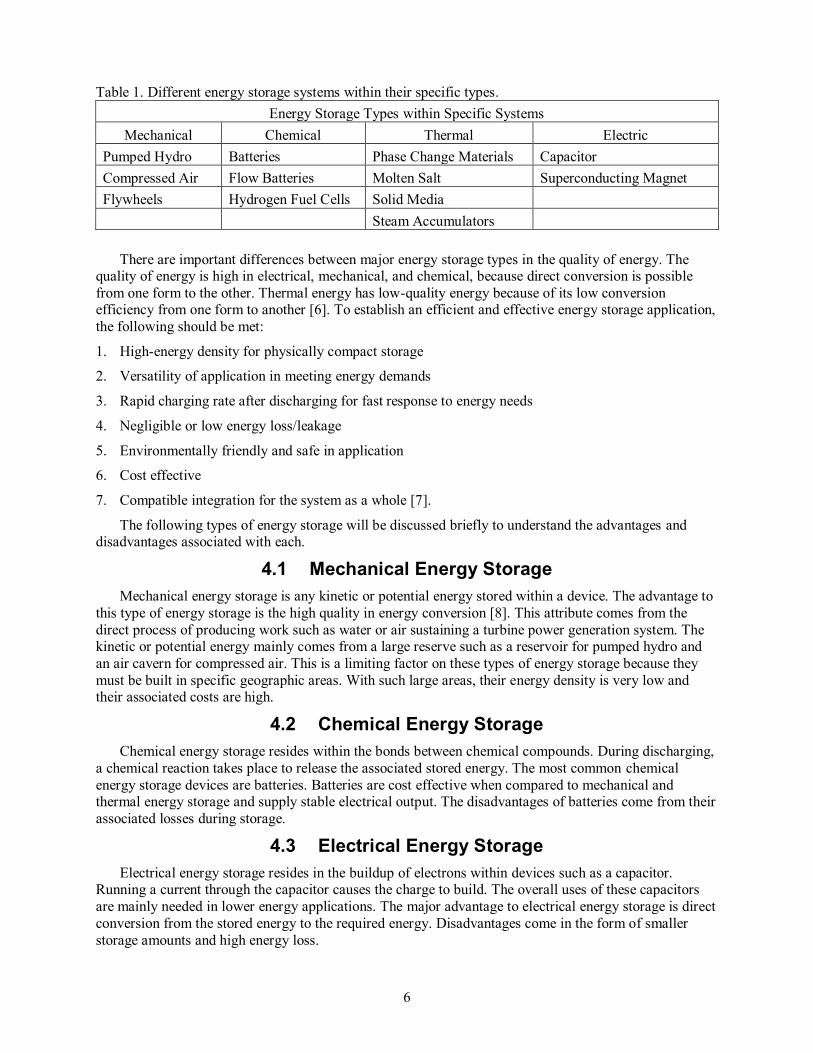
4. ENERGY STORAGE CRITERIA AND DESCRIPTIONS Energy storage is an idea that has been around for many years. Different types of energy storage
include mechanical, electrical, chemical, and thermal. The different systems within each of these types are listed in Table 1.
6
Table 1. Different energy storage systems within their specific types. Energy Storage Types within Specific Systems
Mechanical Chemical Thermal Electric Pumped Hydro Batteries Phase Change Materials Capacitor Compressed Air Flow Batteries Molten Salt Superconducting Magnet Flywheels Hydrogen Fuel Cells Solid Media Steam Accumulators
There are important differences between major energy storage types in the quality of energy. The
quality of energy is high in electrical, mechanical, and chemical, because direct conversion is possible from one form to the other. Thermal energy has low-quality energy because of its low conversion efficiency from one form to another [6]. To establish an efficient and effective energy storage application, the following should be met:
1. High-energy density for physically compact storage
2. Versatility of application in meeting energy demands
3. Rapid charging rate after discharging for fast response to energy needs
4. Negligible or low energy loss/leakage
5. Environmentally friendly and safe in application
6. Cost effective
7. Compatible integration for the system as a whole [7].
The following types of energy storage will be discussed briefly to understand the advantages and disadvantages associated with each.
4.1 Mechanical Energy Storage Mechanical energy storage is any kinetic or potential energy stored within a device. The advantage to
this type of energy storage is the high quality in energy conversion [8]. This attribute comes from the direct process of producing work such as water or air sustaining a turbine power generation system. The kinetic or potential energy mainly comes from a large reserve such as a reservoir for pumped hydro and an air cavern for compressed air. This is a limiting factor on these types of energy storage because they must be built in specific geographic areas. With such large areas, their energy density is very low and their associated costs are high.
4.2 Chemical Energy Storage Chemical energy storage resides within the bonds between chemical compounds. During discharging,
a chemical reaction takes place to release the associated stored energy. The most common chemical energy storage devices are batteries. Batteries are cost effective when compared to mechanical and thermal energy storage and supply stable electrical output. The disadvantages of batteries come from their associated losses during storage.
4.3 Electrical Energy Storage Electrical energy storage resides in the buildup of electrons within devices such as a capacitor.
Running a current through the capacitor causes the charge to build. The overall uses of these capacitors are mainly needed in lower energy applications. The major advantage to electrical energy storage is direct conversion from the stored energy to the required energy. Disadvantages come in the form of smaller storage amounts and high energy loss.
7
4.4 Thermal Energy Storage Thermal energy storage is energy stored in the form of heat. It can be stored in well-insulated fluids
or solids. The two types of thermal energy storage include sensible heat and latent heat. Sensible heat is heat stored within a single phase media while latent heat is heat stored within the phase change properties of the material. Thermal energy storage is usually attached to another power cycle to convert the thermal energy to electrical energy. The main disadvantage is the low efficiency of the conversion process from thermal to electrical energy. Since the NHES generates large amounts of thermal energy, a thermal ESS consideration becomes advantageous [6].
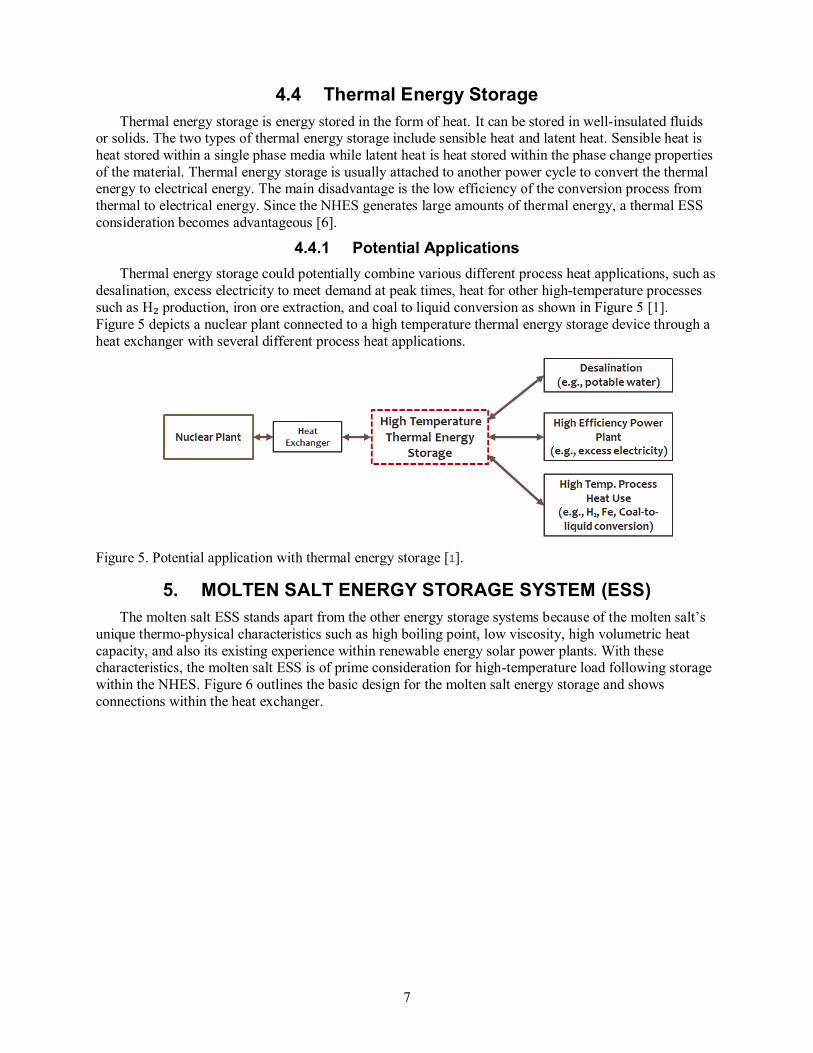
4.4.1 Potential Applications Thermal energy storage could potentially combine various different process heat applications, such as
desalination, excess electricity to meet demand at peak times, heat for other high-temperature processes such as H₂ production, iron ore extraction, and coal to liquid conversion as shown in Figure 5 [1]. Figure 5 depicts a nuclear plant connected to a high temperature thermal energy storage device through a heat exchanger with several different process heat applications.
Figure 5. Potential application with thermal energy storage [1].
5. MOLTEN SALT ENERGY STORAGE SYSTEM (ESS) The molten salt ESS stands apart from the other energy storage systems because of the molten salt’s
unique thermo-physical characteristics such as high boiling point, low viscosity, high volumetric heat capacity, and also its existing experience within renewable energy solar power plants. With these characteristics, the molten salt ESS is of prime consideration for high-temperature load following storage within the NHES. Figure 6 outlines the basic design for the molten salt energy storage and shows connections within the heat exchanger.

8
Figure 6. The NHES system with a molten salt ESS attached.
The primary design of a molten salt ESS is a two-loop system that consists of the molten salt loop and power production loop. The molten salt loop receives the necessary heat from a secondary coolant loop within the NHES. The molten salt is stored during off-peak hours. When the load from the power grid is increased, the molten salt flows from the storage tank(s) to the power cycle heat exchanger. The heat is transferred to the power cycle loop and the cooled molten salt is returned to the storage tank. Figure 7 shows the molten salt loop diagram.
Figure 7. Molten salt loop diagram.
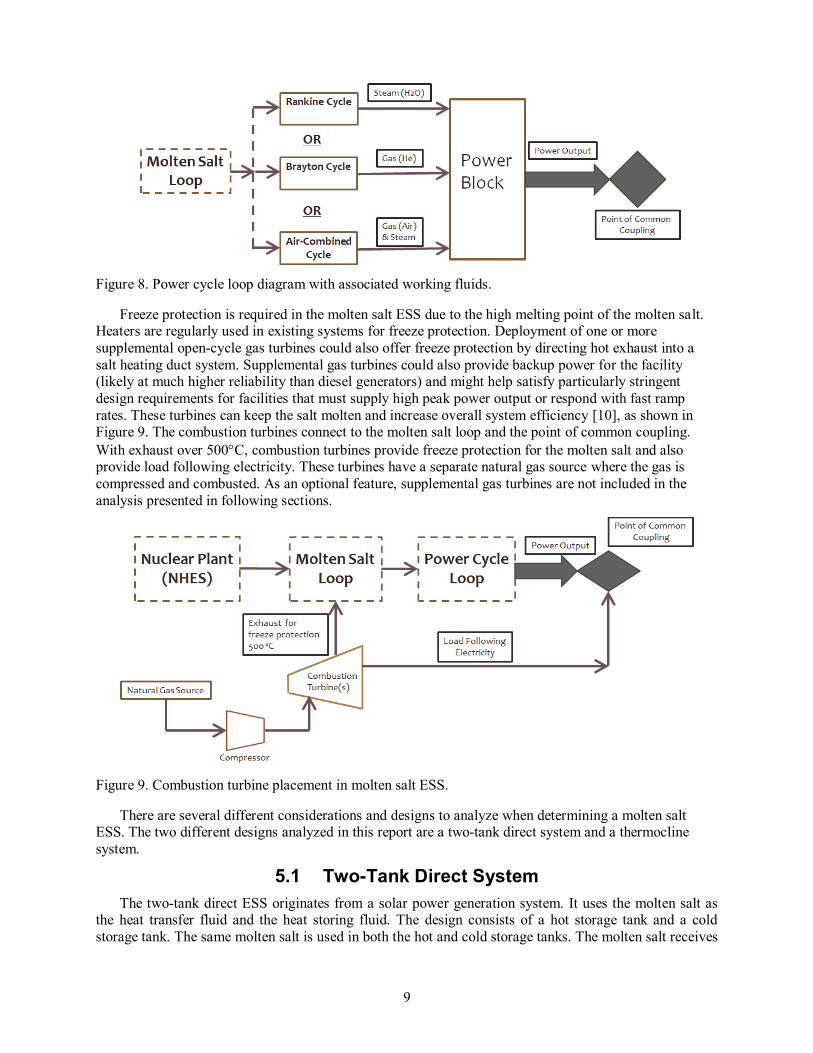
The power cycle loop consists of one of the three chosen power cycles for this report, Rankine, Brayton, or Air-Brayton combined cycle, with the necessary power output interconnected into a common coupling point in the NHES. The differences between the power cycles will be discussed later in this report. Other potential power cycles were not considered for this study. Each power cycle uses different working fluids to generate power within a power block. The Brayton cycle considers helium as the working fluid. Figure 8 shows each individual power cycle loop attached to the molten salt loop. The associated working fluids considered for analysis are included.
9
Figure 8. Power cycle loop diagram with associated working fluids.
Freeze protection is required in the molten salt ESS due to the high melting point of the molten salt. Heaters are regularly used in existing systems for freeze protection. Deployment of one or more supplemental open-cycle gas turbines could also offer freeze protection by directing hot exhaust into a salt heating duct system. Supplemental gas turbines could also provide backup power for the facility (likely at much higher reliability than diesel generators) and might help satisfy particularly stringent design requirements for facilities that must supply high peak power output or respond with fast ramp rates. These turbines can keep the salt molten and increase overall system efficiency [10], as shown in Figure 9. The combustion turbines connect to the molten salt loop and the point of common coupling. With exhaust over 500C, combustion turbines provide freeze protection for the molten salt and also provide load following electricity. These turbines have a separate natural gas source where the gas is compressed and combusted. As an optional feature, supplemental gas turbines are not included in the analysis presented in following sections.
Figure 9. Combustion turbine placement in molten salt ESS.
There are several different considerations and designs to analyze when determining a molten salt ESS. The two different designs analyzed in this report are a two-tank direct system and a thermocline system.
5.1 Two-Tank Direct System The two-tank direct ESS originates from a solar power generation system. It uses the molten salt as the heat transfer fluid and the heat storing fluid. The design consists of a hot storage tank and a cold storage tank. The same molten salt is used in both the hot and cold storage tanks. The molten salt receives
10
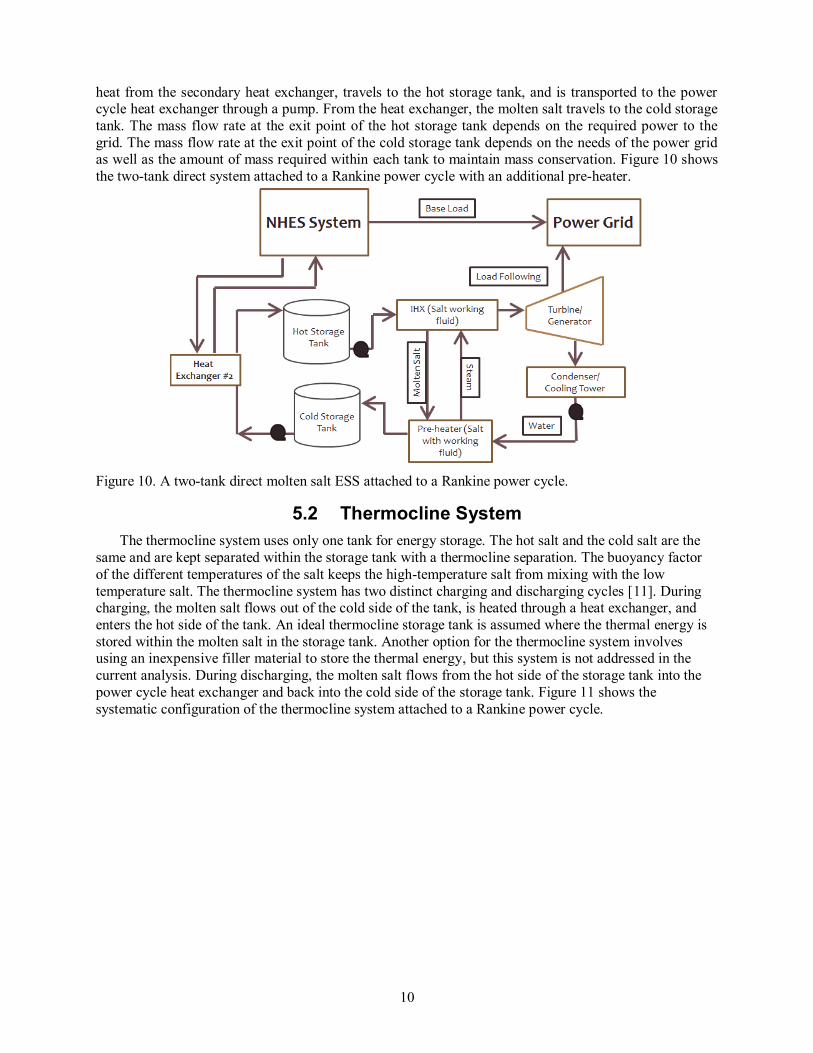
heat from the secondary heat exchanger, travels to the hot storage tank, and is transported to the power cycle heat exchanger through a pump. From the heat exchanger, the molten salt travels to the cold storage tank. The mass flow rate at the exit point of the hot storage tank depends on the required power to the grid. The mass flow rate at the exit point of the cold storage tank depends on the needs of the power grid as well as the amount of mass required within each tank to maintain mass conservation. Figure 10 shows the two-tank direct system attached to a Rankine power cycle with an additional pre-heater.
Figure 10. A two-tank direct molten salt ESS attached to a Rankine power cycle.
5.2 Thermocline System The thermocline system uses only one tank for energy storage. The hot salt and the cold salt are the
same and are kept separated within the storage tank with a thermocline separation. The buoyancy factor of the different temperatures of the salt keeps the high-temperature salt from mixing with the low temperature salt. The thermocline system has two distinct charging and discharging cycles [11]. During charging, the molten salt flows out of the cold side of the tank, is heated through a heat exchanger, and enters the hot side of the tank. An ideal thermocline storage tank is assumed where the thermal energy is stored within the molten salt in the storage tank. Another option for the thermocline system involves using an inexpensive filler material to store the thermal energy, but this system is not addressed in the current analysis. During discharging, the molten salt flows from the hot side of the storage tank into the power cycle heat exchanger and back into the cold side of the storage tank. Figure 11 shows the systematic configuration of the thermocline system attached to a Rankine power cycle.
11
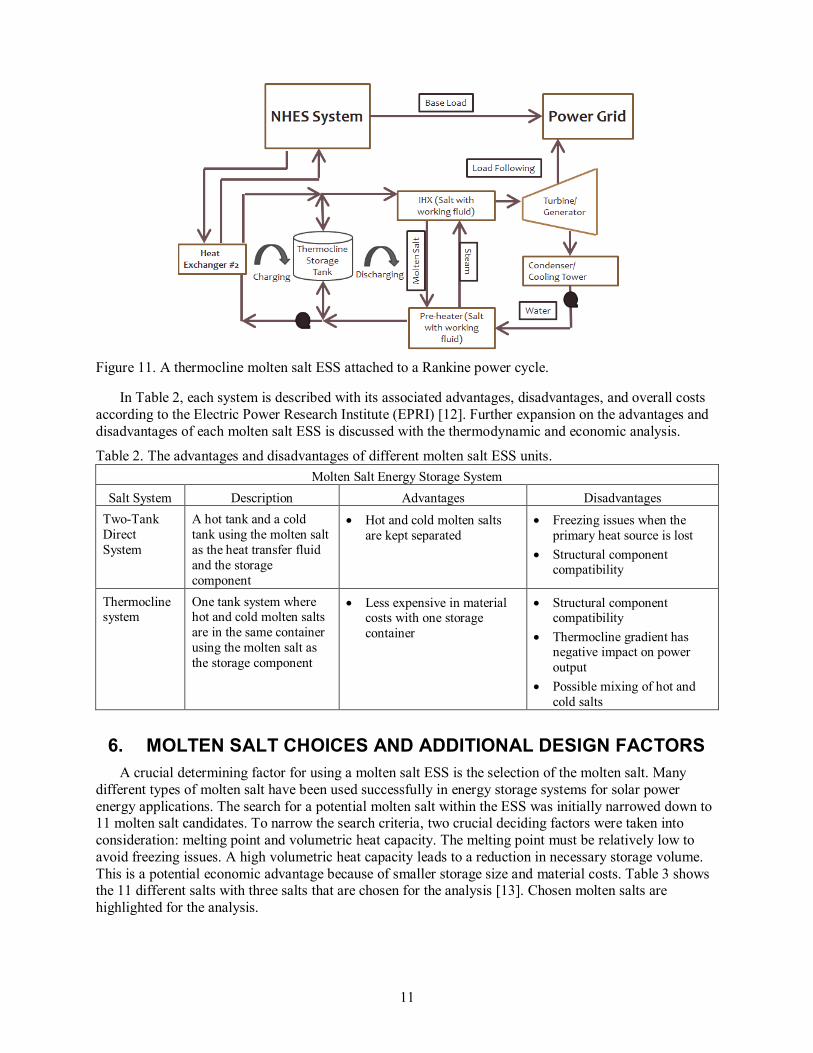
Figure 11. A thermocline molten salt ESS attached to a Rankine power cycle.
In Table 2, each system is described with its associated advantages, disadvantages, and overall costs according to the Electric Power Research Institute (EPRI) [12]. Further expansion on the advantages and disadvantages of each molten salt ESS is discussed with the thermodynamic and economic analysis.
Table 2. The advantages and disadvantages of different molten salt ESS units. Molten Salt Energy Storage System
Salt System Description Advantages Disadvantages Two-Tank Direct System
A hot tank and a cold tank using the molten salt as the heat transfer fluid and the storage component
Hot and cold molten salts are kept separated
Freezing issues when the primary heat source is lost
Structural component compatibility
Thermocline system
One tank system where hot and cold molten salts are in the same container using the molten salt as the storage component
Less expensive in material costs with one storage container
Structural component compatibility
Thermocline gradient has negative impact on power output
Possible mixing of hot and cold salts
6. MOLTEN SALT CHOICES AND ADDITIONAL DESIGN FACTORS A crucial determining factor for using a molten salt ESS is the selection of the molten salt. Many
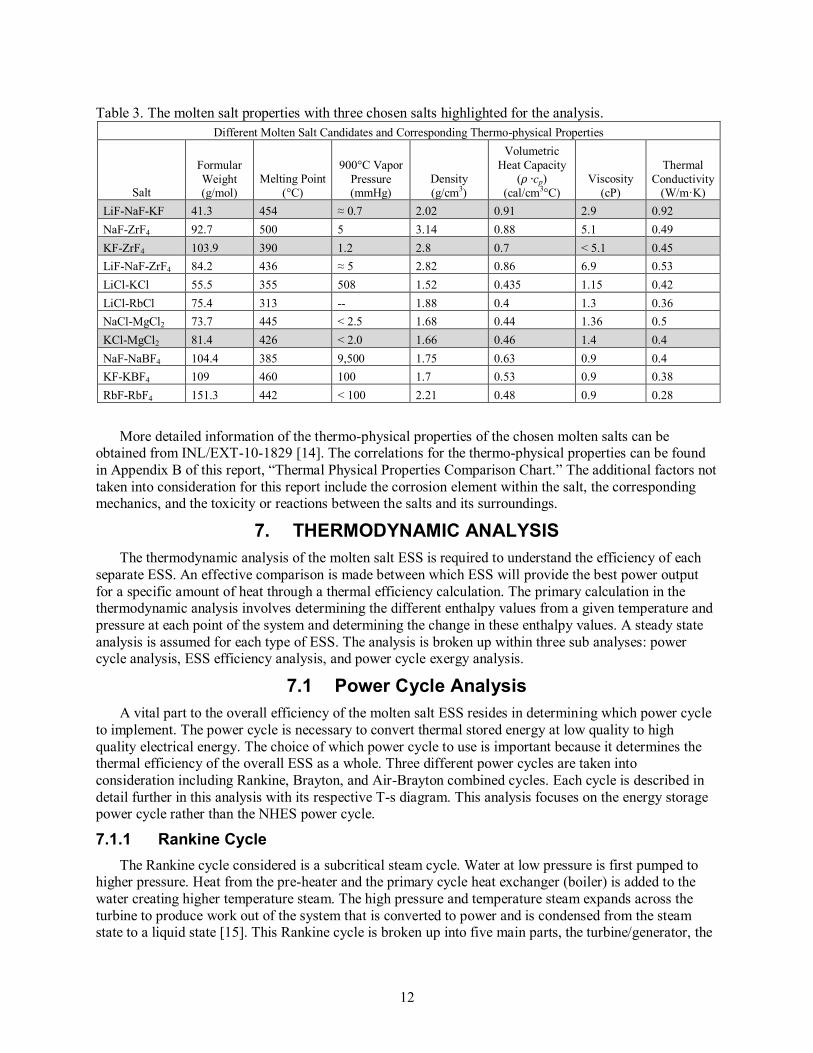
different types of molten salt have been used successfully in energy storage systems for solar power energy applications. The search for a potential molten salt within the ESS was initially narrowed down to 11 molten salt candidates. To narrow the search criteria, two crucial deciding factors were taken into consideration: melting point and volumetric heat capacity. The melting point must be relatively low to avoid freezing issues. A high volumetric heat capacity leads to a reduction in necessary storage volume. This is a potential economic advantage because of smaller storage size and material costs. Table 3 shows the 11 different salts with three salts that are chosen for the analysis [13]. Chosen molten salts are highlighted for the analysis.
12
Table 3. The molten salt properties with three chosen salts highlighted for the analysis.
Different Molten Salt Candidates and Corresponding Thermo-physical Properties
Salt
Formular Weight (g/mol)
Melting Point (°C)
900°C Vapor Pressure (mmHg)
Density (g/cm3)
Volumetric Heat Capacity
( cp) (cal/cm3°C)
Viscosity (cP)
Thermal Conductivity
(W/m·K) LiF-NaF-KF 41.3 454 ≈ 0.7 2.02 0.91 2.9 0.92 NaF-ZrF4 92.7 500 5 3.14 0.88 5.1 0.49 KF-ZrF4 103.9 390 1.2 2.8 0.7 < 5.1 0.45 LiF-NaF-ZrF4 84.2 436 ≈ 5 2.82 0.86 6.9 0.53 LiCl-KCl 55.5 355 508 1.52 0.435 1.15 0.42 LiCl-RbCl 75.4 313 -- 1.88 0.4 1.3 0.36 NaCl-MgCl2 73.7 445 < 2.5 1.68 0.44 1.36 0.5 KCl-MgCl2 81.4 426 < 2.0 1.66 0.46 1.4 0.4 NaF-NaBF4 104.4 385 9,500 1.75 0.63 0.9 0.4 KF-KBF4 109 460 100 1.7 0.53 0.9 0.38 RbF-RbF4 151.3 442 < 100 2.21 0.48 0.9 0.28
More detailed information of the thermo-physical properties of the chosen molten salts can be
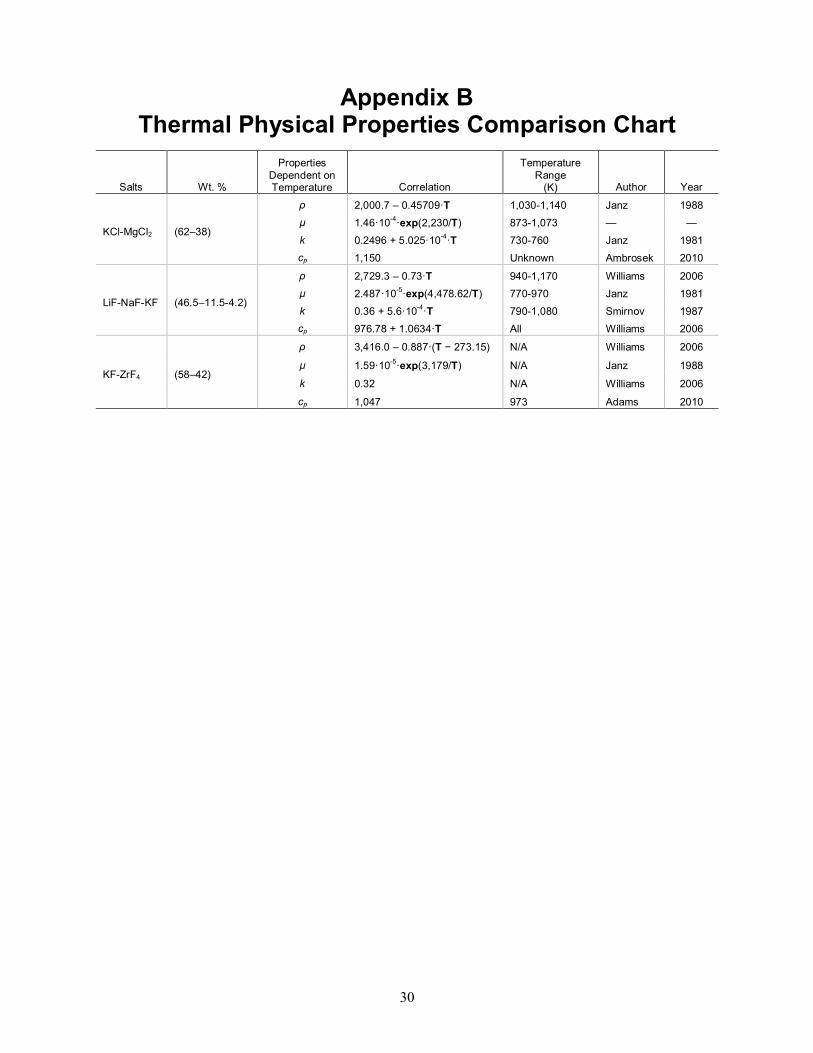
obtained from INL/EXT-10-1829 [14]. The correlations for the thermo-physical properties can be found in Appendix B of this report, “Thermal Physical Properties Comparison Chart.” The additional factors not taken into consideration for this report include the corrosion element within the salt, the corresponding mechanics, and the toxicity or reactions between the salts and its surroundings.
7. THERMODYNAMIC ANALYSIS The thermodynamic analysis of the molten salt ESS is required to understand the efficiency of each
separate ESS. An effective comparison is made between which ESS will provide the best power output for a specific amount of heat through a thermal efficiency calculation. The primary calculation in the thermodynamic analysis involves determining the different enthalpy values from a given temperature and pressure at each point of the system and determining the change in these enthalpy values. A steady state analysis is assumed for each type of ESS. The analysis is broken up within three sub analyses: power cycle analysis, ESS efficiency analysis, and power cycle exergy analysis.
7.1 Power Cycle Analysis A vital part to the overall efficiency of the molten salt ESS resides in determining which power cycle
to implement. The power cycle is necessary to convert thermal stored energy at low quality to high quality electrical energy. The choice of which power cycle to use is important because it determines the thermal efficiency of the overall ESS as a whole. Three different power cycles are taken into consideration including Rankine, Brayton, and Air-Brayton combined cycles. Each cycle is described in detail further in this analysis with its respective T-s diagram. This analysis focuses on the energy storage power cycle rather than the NHES power cycle.
7.1.1 Rankine Cycle The Rankine cycle considered is a subcritical steam cycle. Water at low pressure is first pumped to
higher pressure. Heat from the pre-heater and the primary cycle heat exchanger (boiler) is added to the water creating higher temperature steam. The high pressure and temperature steam expands across the turbine to produce work out of the system that is converted to power and is condensed from the steam state to a liquid state [15]. This Rankine cycle is broken up into five main parts, the turbine/generator, the

13
condenser, the pump, the pre-heater, and the vaporizer, respectively. Figure 12 depicts an ideal Rankine cycle diagram with its associated T-s diagram.
(a) The Rankine power cycle diagram with a water pre-heater (b) The associated T-s diagram
Figure 12. Schematic diagram of the subcritical steam Rankine power cycle.
7.1.2 Brayton Cycle The Brayton cycle is a gas cycle. The gas considered in this analysis is helium. The gas at high
pressure expands across a turbine to produce power. The low-pressure gas flows through a gas cooler to reduce the amount of compression needed. The gas is then compressed and heated by the compressor and heat exchanger. The high temperature and pressure gas then flows to the turbine, completing the cycle. The compressor and turbine share a common shaft. Figure 13 depicts an ideal Brayton cycle with its respective T-s diagram.
(a) The Brayton cycle diagram (b) The associated T-s diagram
Figure 13. Schematic diagram of the Brayton gas cycle.

14
7.1.3 Air-Brayton Combined Cycle The Air-Brayton combined cycle consists of a top side Brayton cycle with air as the working fluid
and a bottoming Rankine steam cycle that uses high-temperature excess heat from the Brayton cycle to produce additional steam for power generation. Filtered air is compressed to a higher temperature and pressure. The high pressure and temperature air is then passed through the molten salt heat exchanger. The air then expands across the turbine producing power. The hot exhaust air is sent into a heat recovery steam generator in connection with the bottoming Rankine steam cycle to produce additional steam in the same Rankine cycle [16]. The low temperature air exhaust is discharged into the atmosphere. Figure 14 depicts the ideal Air-Brayton combined cycle and the corresponding T-s diagram.
(a) The Air-Brayton combined cycle (b) The associated T-s diagram
Figure 14. Schematic diagram of the Air-Brayton combined cycle.
7.2 ESS System Efficiency Analysis The thermodynamic analysis of the ESS efficiency analysis is formulated in an excel spreadsheet. The
spreadsheet is designed to take input temperatures and associated pressures and determine the thermal efficiency of the respective molten salt ESS design and power cycle. Each sheet in excel uses property calculations from an NIST thermodynamic data base, REFPROP, to determine the enthalpy and entropy values associated with a given temperature and pressure [17]. With these values, the corresponding efficiencies are calculated for each system [18]. According to the temperature of the salt, a certain percentage of the high heat exhaust from the combustion turbines will be added to the system. Each design has a specific starting thermal energy of 300 MWth, and different stages of the analysis are distinguished by temperature, pressure, and mass flow rates. The pressure of the molten salt remains constant for each of the systems at atmospheric pressure. Figure 15 shows the analysis diagram for each of the molten salt energy storage systems with a Rankine power cycle that has an additional water pre-heater heat exchanger. The inlet and outlet conditions of each component of the systems are described with a specific number starting at one from the primary heat exchanger. The different working fluids are shown for the molten salt loop and the power cycle loop.

15
(a) The model for a two-tank direct molten salt ESS
(b) The model for a thermocline molten salt ESS
Figure 15. Schematic diagrams of the molten salt ESS.
16
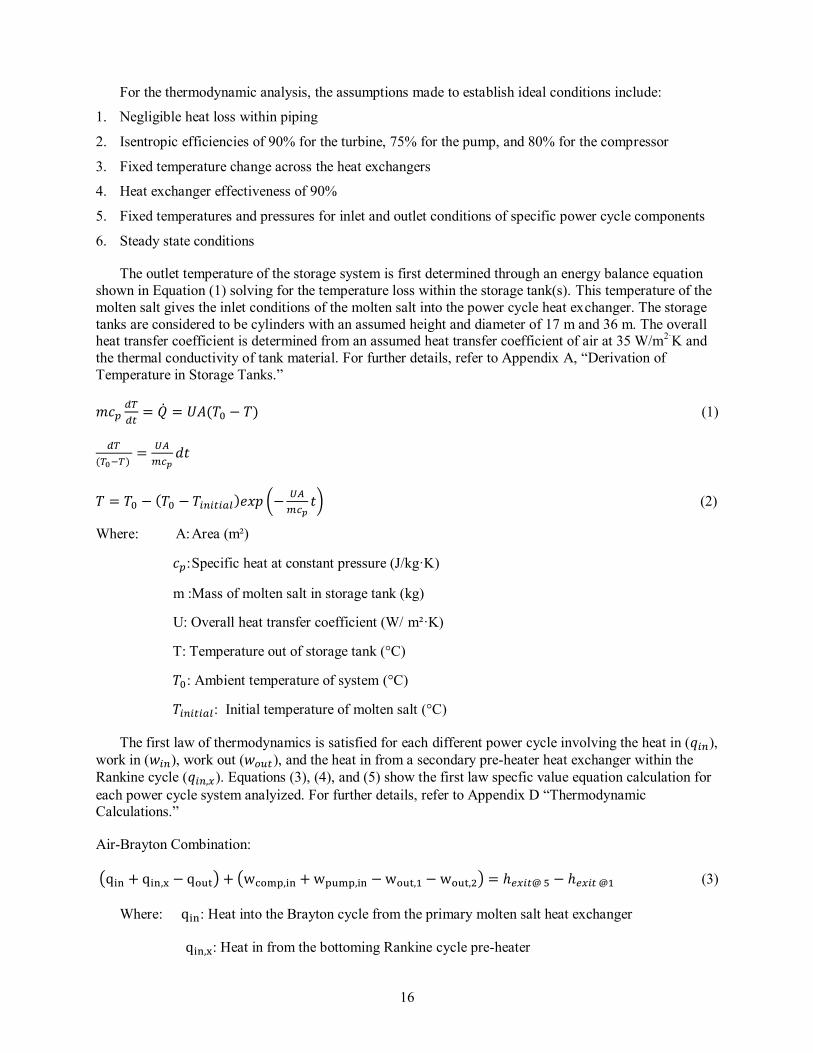
For the thermodynamic analysis, the assumptions made to establish ideal conditions include:
1. Negligible heat loss within piping
2. Isentropic efficiencies of 90% for the turbine, 75% for the pump, and 80% for the compressor
3. Fixed temperature change across the heat exchangers
4. Heat exchanger effectiveness of 90%
5. Fixed temperatures and pressures for inlet and outlet conditions of specific power cycle components
6. Steady state conditions
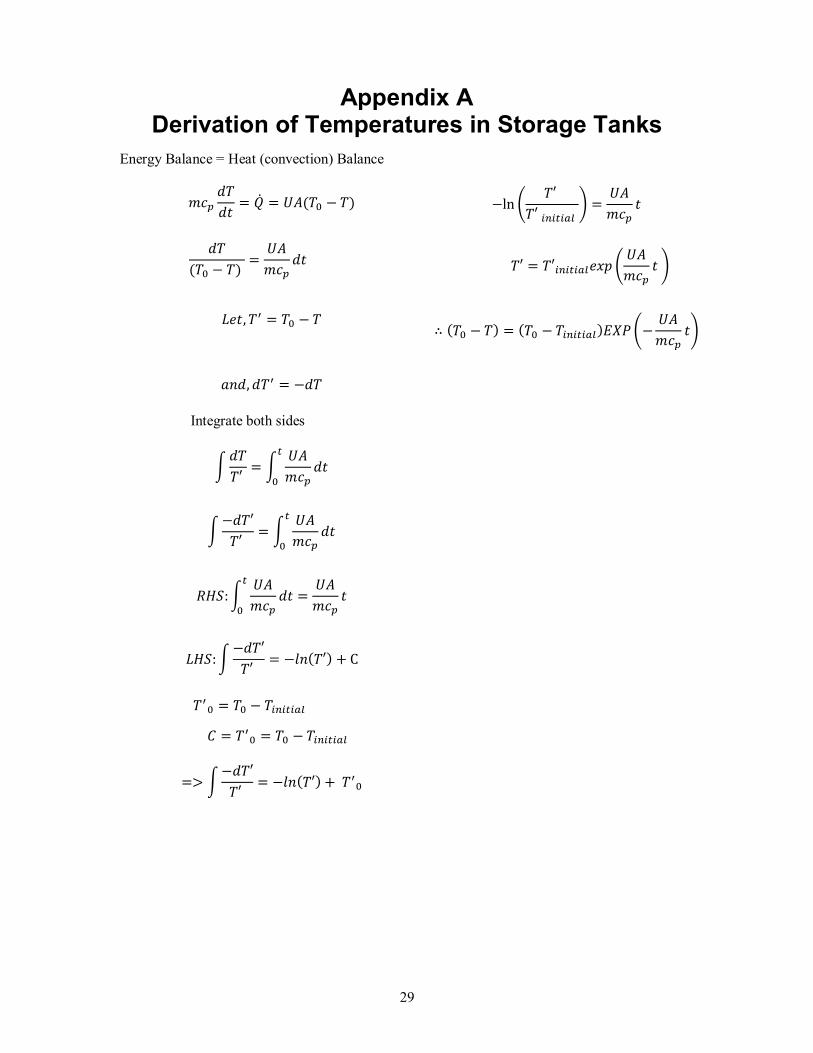
The outlet temperature of the storage system is first determined through an energy balance equation shown in Equation (1) solving for the temperature loss within the storage tank(s). This temperature of the molten salt gives the inlet conditions of the molten salt into the power cycle heat exchanger. The storage tanks are considered to be cylinders with an assumed height and diameter of 17 m and 36 m. The overall heat transfer coefficient is determined from an assumed heat transfer coefficient of air at 35 W/m2·K and the thermal conductivity of tank material. For further details, refer to Appendix A, “Derivation of Temperature in Storage Tanks.”
(1)
(
) (2)
Where: A: Area (m²)
: Specific heat at constant pressure (J/kg·K)
m :Mass of molten salt in storage tank (kg)
U: Overall heat transfer coefficient (W/ m²·K)
T: Temperature out of storage tank (°C)
: Ambient temperature of system (°C)
: Initial temperature of molten salt (°C)
The first law of thermodynamics is satisfied for each different power cycle involving the heat in ( ), work in ( ), work out ( ), and the heat in from a secondary pre-heater heat exchanger within the Rankine cycle ( ). Equations (3), (4), and (5) show the first law specfic value equation calculation for each power cycle system analyized. For further details, refer to Appendix D “Thermodynamic Calculations.”
Air-Brayton Combination:
( ) ( ) (3)
Where: : Heat into the Brayton cycle from the primary molten salt heat exchanger
: Heat in from the bottoming Rankine cycle pre-heater

17
: Heat out of the bottoming Rankine cycle condenser
: Work into the Brayton cycle from the compressor
: Work into the bottoming Rankine cycle from a pump
: Work out of the Bryaton cycle turbine
: Work out of the bottoming Rankine cycle turbine
: Enthalpy out of the system
: Enthalpy into the system
Brayton:
(4)
For the net system, enthalpy change is
Where: : Heat into the cycle from the molten salt heat exchanger
: Heat out of the cycle through a gas cooler
: Work into the cycle from the compressor
: Work out of the cycle from the turbine
: Enthalpy out of the system
: Enthalpy into the system
Rankine:
(5)
For the net system, enthalpy change is
Where: : Heat into the cycle from the molten salt heat exchanger
: Heat into the cycle from the pre-heater
: Heat out of the cycle from the condenser
: Work into the cycle from the pump
: Work out of the cycle from the turbine
: Enthalpy out of the system
: Enthalpy into the system
18
The turbine, pump, and compressor provide work into or out of the power cycle system. The actual work produced by the components is determined through using asssumed isentropic efficiencies of the specific components. Equations (6),(7),(8) show the use of the isentropic efficiencies in determineing the actual work.
(6)
(7)
(8)
Power to the grid is the determing factor for the needed mass flow rates of the molten salt and the power cycle working fluid in the thermodynamic analysis of the molten salt ESS. An assumed power need is first determined for the system in megawatts thermal. The needed mass flow rate of the steam or gas across the turbine can be calculated with the assumed power need and the heat into the system. The net work of the system is the actual work provided by the turbine out of the system from the actual work put into the system from the pump.
{ }
(9)
Where: : Needed power in megawatt thermal : Needed mass flow rate for power generation
: Heat into the system
With the inlet and outlet conditions of each of the components of the power cycle, the molten salt temperatures at specific points are found. The first temperature calculated is the temperature out of the molten salt/power cycle heat exchanger. This is accomplished by using an assumed effectiveness in the heat exchanger of 90% to calculate the outlet temperature of the molten salt side [19].
Effectiveness:
(10)
Where : Hot fluid inlet temperature
: Cold fluid inlet temperature
: Hot fluid outlet temperature
: Hot Fluid inlet specific heat
: Minimum specific heat
In each cycle considered, the specific heat of the hot fluid is less than the specific heat of the cold fluid, cp,h = cp,min, and the effectiveness ( ) is determined as:
(11)
19
From Equation (11), the outlet temperature of the molten salt side is determined as:
( ) (12)
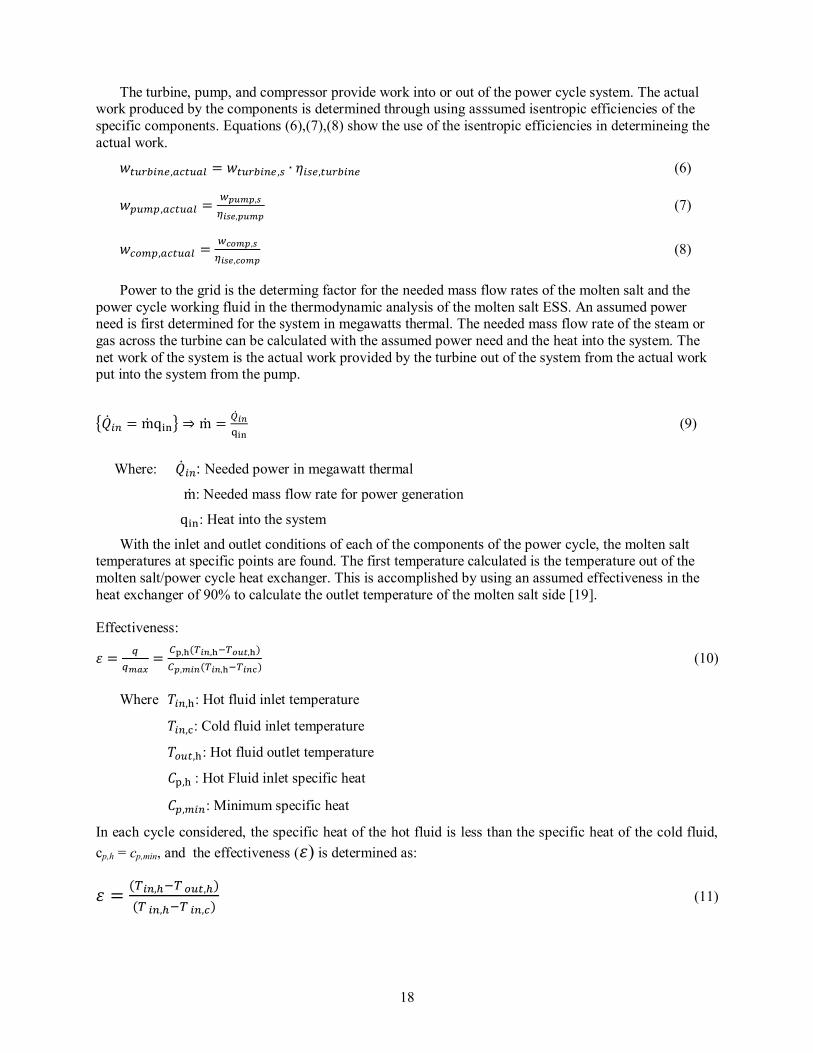
Figure 16 depicts the basic block diagram of the molten salt/power cycle heat exchanger with its associated inlets and outlets.
Figure 16. Basic diagram of a heat exchanger’s inlets and outlets.
With all of the corresponding temperature determinations, the mass flow rate of the molten salt is calculated through an energy balance equation from the heat exchanger. The amount of energy into the heat exchanger ( ) equals the amount of energy out of the heat exchanger ( ).
(13)
(14)
(15)
Mass flow rate, temperature, and pressure are determined for each part of the system. The overall thermal efficiency of the system is found by using the thermal efficiency equation for the power cycle.
Overall Efficiency:
(16)
This same procedure is followed to determine the efficiency and mass flow rates of each system analyzed. Comparisons are made between each system to determine which has the higher overall thermal efficiency.
7.3 Power Cycle Exergy Analysis The power cycle exergy analysis determines the overall usefulness of the energy in the molten salt
energy storage power cycle system. Each component of the molten salt ESS power cycle experiences losses during the power generation process. To understand how each of the associated components of the molten salt ESS power cycle design contributes to the usefulness of the energy, the total available energy in, available energy out, and the available energy change are determined. This analysis focuses on a Rankine power cycle within a two-tank molten salt ESS with KF-ZrF4 as the molten salt, but can similarly be used for other power cycle systems. The available energy per unit mass in the molten salt and the water pump or compressor is found using the exergy per unit mass flow rate equation [18]. The kinetic energy

20
and potential energy terms are ignored. For more detailed calculations, refer to Appendix E, “Exergy Calculations.”
(17)
Where h: Enthalpy of the specific system
: Enthalpy of the ambient state
: Temperature of the ambient state
s: Entropy of the specific system
: Entropy of the ambient state
V: Velocity
g: Acceleration due to gravity
z: Elevation of the system relative to a reference level
: The exergy per unit mass flow rate of the system
The properties of the dead state, also referred as ambient state, are = 27°C; P = 0.1013 MPa. The corresponding entropy and enthalpy values are determined through the REFPROP fluid properties calculator [17]. The same dead state is considered in each part of the system. The enthalpy in the molten salt (ms) can be found by the temperature and the specific heat of the specific molten salt while the entropy can be found through the specific heat and temperature correlation. The entropy in and the entropy out of the system are calculated for the different components of the power cycle system [20].
(18)
(
) (19)
The amount of power generation needed from the molten salt energy storage device determines the mass flow rate of the steam in the turbine ( ). This mass flow rate determines the mass flow rate of the molten salt needed from the energy storage device ( ). The mass flow rate of the salt multiplied by the exergy flowing gives the total exergy ( ). Potential energy and kinetic energy terms are assumed to be negligible.
(
) (20)
The available power out of the power cycle is the amount of power out of the molten salt, turbine, and condenser combined. These values for the available power are found using the total exergy equation. The available power change is calculated using a variation of the total exergy equation and the exergy destroyed equation. The exergy destroyed represents the lost work potential of the system and is also called irreversibility or lost work [18]. The exergy destroyed calculation is made for certain components of the power cycle system including the turbine [21].
(21)
The available power change by the heat exchanger and pre-heater is calculated with the difference of exergy destroyed between the molten salt and the steam.
( ) ( ) (22)

21
The available power change by the pump is calculated by multiplying the mass flow rate of the steam by the exergy per unit mass equation added to the work of the pump.
((( ) ( )) ) (23)
The available power change by the turbine is calculated using the entropy change from the inlet and the outlet of the turbine.
( ( )) (24)
With the available power change, the percentages of irreversibility are determined using the available power change within the specific component and the total available power into the system.
(25)
Where: : , , or
: The total available energy into the power cycle
Once the irreversibility in each desired component is determined, the overall 2nd law efficiency is determined with the net power out of the system and the available power into the system.
(26)
(27)
8. ECONOMIC ANALYSIS The economic analysis is needed to determine the cost implication of each system. Economics are a
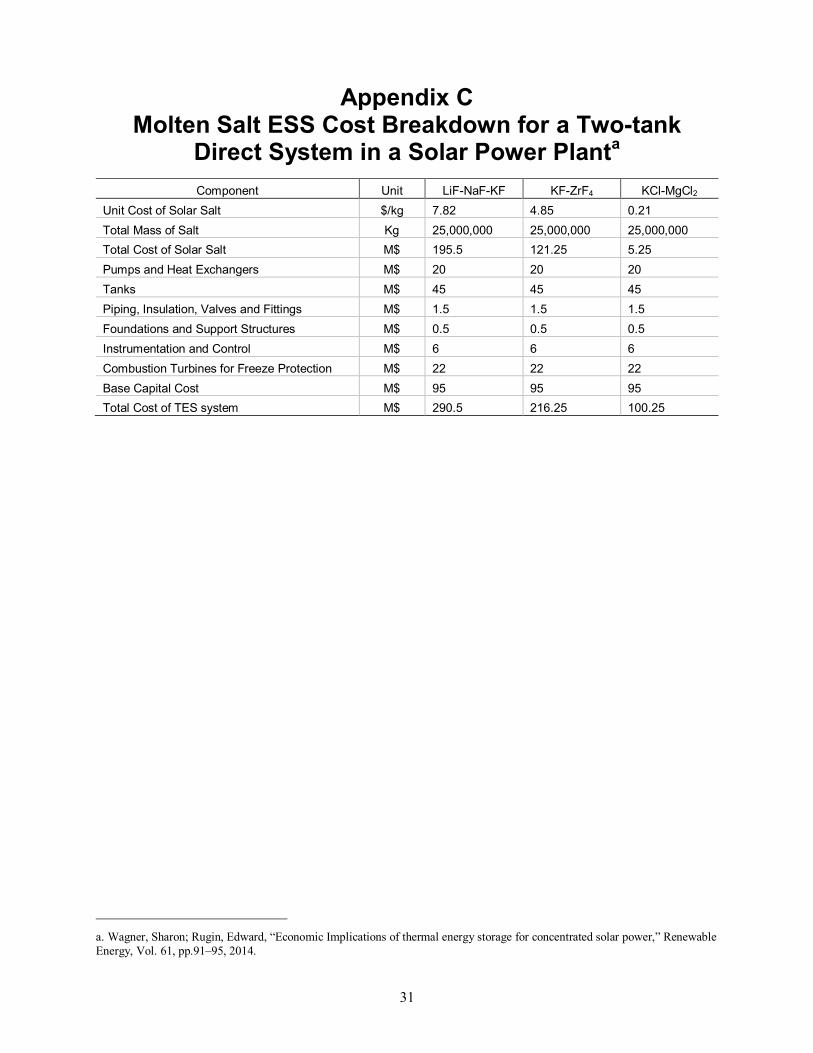
driving force in determining whether a specific system is worth pursuing forward. The analysis to determine overall cost of the molten salt ESS stems from economic analysis on solar power molten salt energy storage is found in reference [22]. The report determines the total capital cost of implementing a molten salt energy storage system within a solar power plant. The report analyzed an indirect two-tank system. The natural gas-fired heater component was replaced by the combustion turbines with the same assumed fixed costs. The cost breakdown of the report’s analysis can be seen in Appendix C, “Molten Salt ESS Cost Breakdown for a Two-tank Direct System in a Solar Power Plant.” Only the molten salt energy storage costs were taken into consideration. To determine the base capital cost of the molten salt ESS, the cost of each component in Appendix C within the ESS, excluding the salt, is summed. The total capital cost is determined by adding the total cost of the salt to the base capital cost. With two different molten salt energy storage systems taken into consideration, the most feasible system is determined through the cost comparison between the two types of energy storage systems. The total capital cost of the thermocline system is determined using the aforementioned two-direct capital cost with the reduction of half the cost for the storage tanks, the molten salt, and the piping/insulation.
The primary source of determining the cost comparison between molten salts comes from the overall unit cost of each salt. Out of the three salts analyzed, each has a large range in unit price. The mass of salt in kilograms is determined for each system for comparison from the Andasol Solar Plant specifications [23]. With the total mass and the cost per unit mass of the salt, the overall cost for each salt type is determined. This value is added onto the base capital cost of the thermal ESS and comparisons are made.

22
9. RESULTS The results for the overall analysis are broken into two different parts: economic and thermodynamic.
Each analysis result determines one system that is either most efficient or cost effective. The parameters set for the thermodynamic results involve isentropic efficiencies within the pumps, compressors, and turbines.
9.1 Thermodynamic The results for the thermodynamic analysis are broken into two sub sections, energetic efficiencies
and exergetic efficiencies. The energetic efficiencies section compares the two different molten salt ESS units, the differences between each salt type, and the differences in the power cycle design. Each of these topics within the energetic efficiencies section compares the thermal efficiencies of the specific systems. The exergetic efficiencies section determines the quality of the energy and the irreversibility within several components of the power cycle design. The current analysis focuses on the Rankine power cycle within the two-tank direct molten salt ESS. The percentages of irreversibility were determined for the turbine, water pump, heat exchanger, and the pre-heater heat exchanger.
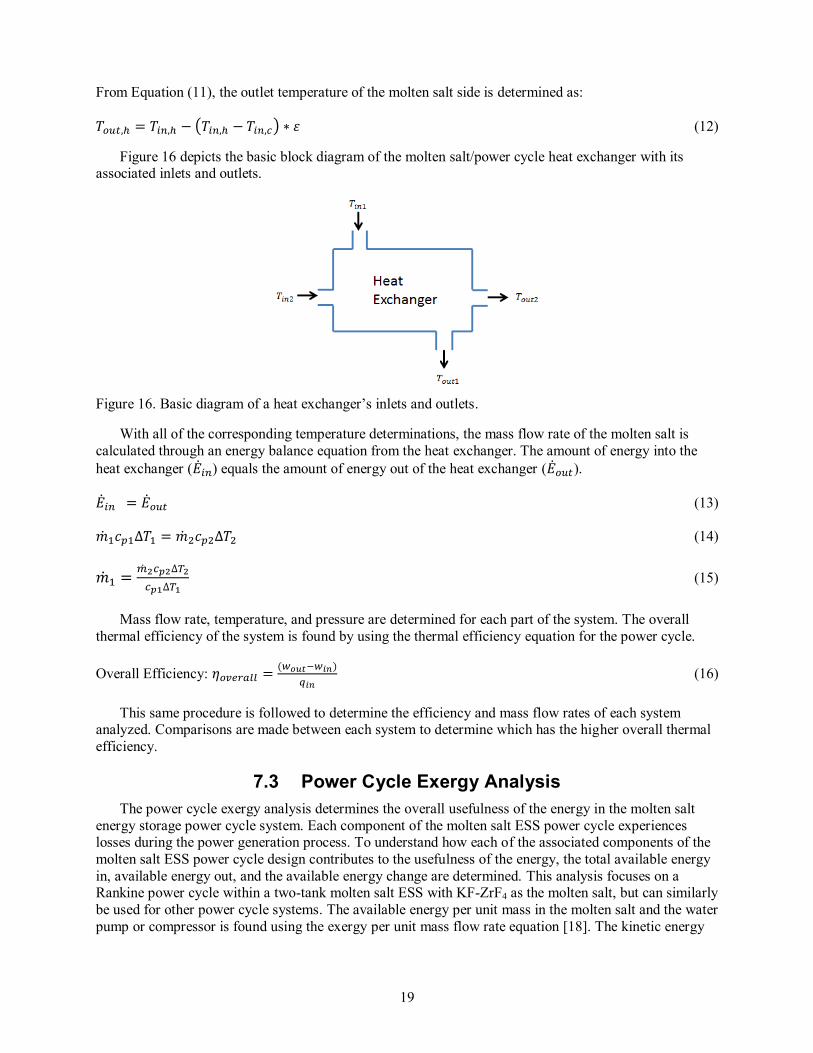
9.1.1 Energetic Efficiencies The first set of results compares the differences in salt types within the different power cycle systems
(see Figure 17). Since the temperature out of the storage tank is an important parameter in determining the efficiency of the system, the results are shown in of Figure 17a. Each of the three salts has similar outlet storage temperatures and efficiencies, but a pattern is established with these three graphs. Even though the thermal efficiencies are almost the same, the pattern concludes that LiF-NaF-KF produces the highest thermal efficiency within the power cycle, assuming no losses to the surrounding by the system. LiF-NaF-KF produces the highest thermal efficiency due to its high volumetric heat capacity, resulting in a lower rate of heat loss within the storage container(s).
23
(a) The results for the temperature out of the molten salt energy storage tank.
(b) The results for the Air-Brayton combined cycle thermal efficiencies with different molten salts
(c) The results for the Rankine cycle thermal efficiencies with (d) The results for the Brayton cycle thermal efficiencies with different molten salts different molten salts Figure 17. Comparison of the thermal efficiency of each power cycle according to the working fluids.
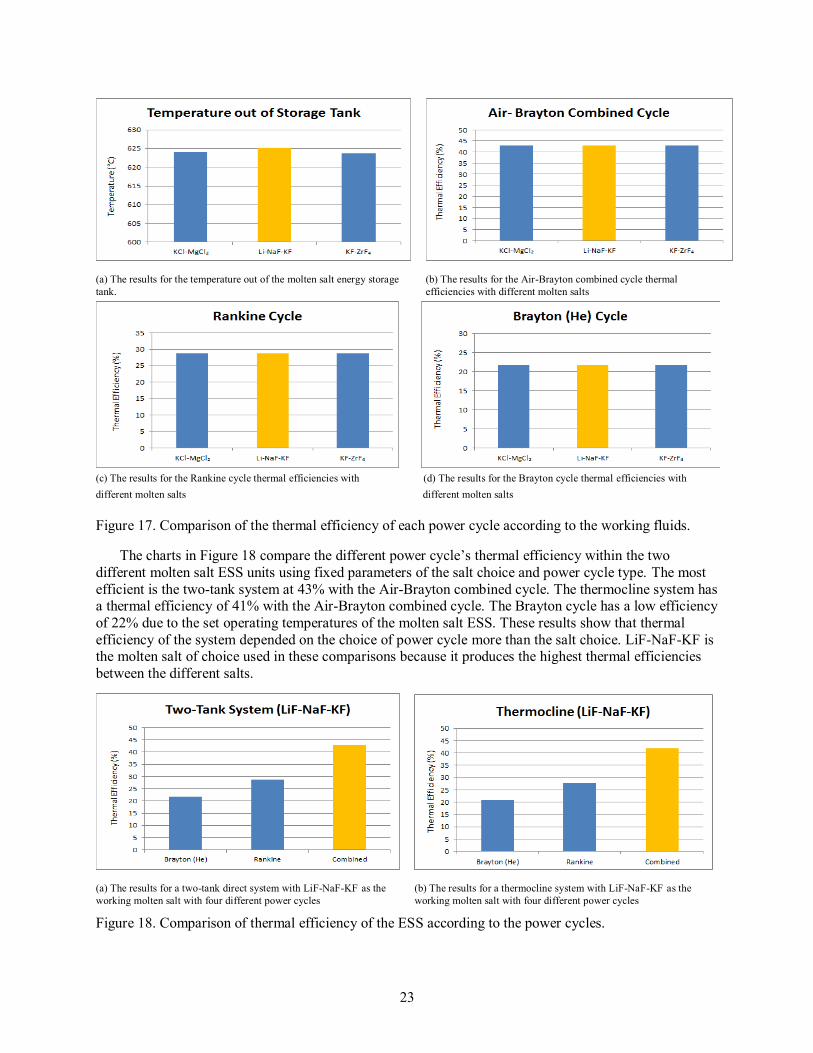
The charts in Figure 18 compare the different power cycle’s thermal efficiency within the two different molten salt ESS units using fixed parameters of the salt choice and power cycle type. The most efficient is the two-tank system at 43% with the Air-Brayton combined cycle. The thermocline system has a thermal efficiency of 41% with the Air-Brayton combined cycle. The Brayton cycle has a low efficiency of 22% due to the set operating temperatures of the molten salt ESS. These results show that thermal efficiency of the system depended on the choice of power cycle more than the salt choice. LiF-NaF-KF is the molten salt of choice used in these comparisons because it produces the highest thermal efficiencies between the different salts.
(a) The results for a two-tank direct system with LiF-NaF-KF as the working molten salt with four different power cycles
(b) The results for a thermocline system with LiF-NaF-KF as the working molten salt with four different power cycles
Figure 18. Comparison of thermal efficiency of the ESS according to the power cycles.

24
9.1.2 Exergetic Efficiencies Table 4 gives the specific percentages for the irreversibility of specific components within a Rankine
power cycle. The second law efficiency of the system was 28.7%, assuming no losses to the surrounding by the system. For more detailed calculations within the percentages of the irreversiblity values, see Appendix E, “Exergy Calculations.”
Table 4. Percentages of irreversibility within specific components. Percentages of Irreversibility within Components Values Percentages (%)
Turbine 0.1230 12.30 Water Pump 0.0087 0.87 Heat Exchanger 0.1911 19.11 Pre-heater 0.1516 15.16
9.2 Economic The results in the economic analysis determined which storage system and molten salt type is most
economically beneficial. The comparison of the total capital cost of the two-tank direct molten salt ESS and the thermocline ESS in millions is displayed in part (a) of Figure 19. The thermocline molten salt ESS has the lowest capital cost. The thermocline system is determined to be the most economical choice. The unit cost of salt is the main factor in determining which molten salt choice is the most economic. In Table 5, the unit cost of the three molten salts is compared in $/kg and $/L [13]. The total capital cost within the two-tank direct molten salt ESS of each of the three molten salts is displayed in part (b) of Figure 19. The lowest costing salt is KCl-MgCl2.
Table 5. Cost comparison of three different molten salts.
Cost of Molten Salt Comparison (2006) [13] Salt Type Raw Material Cost ($/kg) Cost/Volume ($/L at 700C)
LiF-NaF-KF 7.82 15.79 KF-ZrF4 4.85 13.58 KCl-MgCl2 0.21 0.35
(a) The cost comparison of the two different molten salt ESS units (b) Salt cost comparison in a two-tank direct system.
Figure 19. Cost comparison results.
25
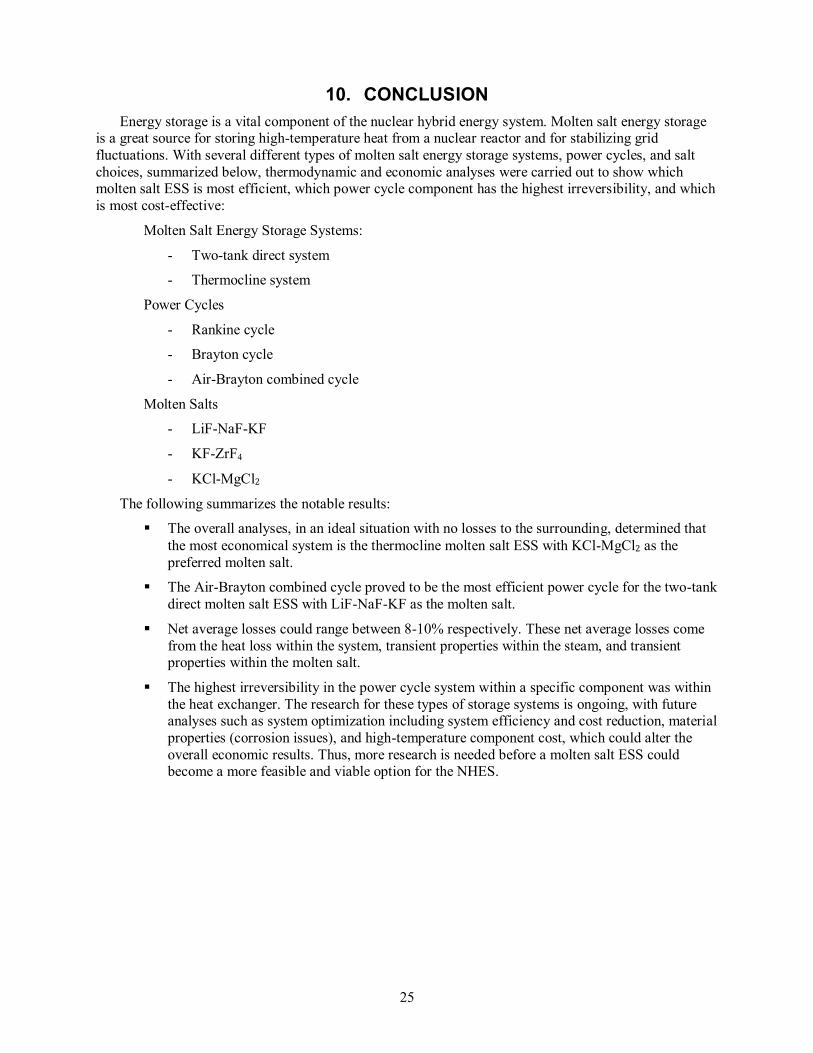
10. CONCLUSION Energy storage is a vital component of the nuclear hybrid energy system. Molten salt energy storage
is a great source for storing high-temperature heat from a nuclear reactor and for stabilizing grid fluctuations. With several different types of molten salt energy storage systems, power cycles, and salt choices, summarized below, thermodynamic and economic analyses were carried out to show which molten salt ESS is most efficient, which power cycle component has the highest irreversibility, and which is most cost-effective:
Molten Salt Energy Storage Systems:
- Two-tank direct system
- Thermocline system
Power Cycles
- Rankine cycle
- Brayton cycle
- Air-Brayton combined cycle
Molten Salts
- LiF-NaF-KF
- KF-ZrF4
- KCl-MgCl2
The following summarizes the notable results:
The overall analyses, in an ideal situation with no losses to the surrounding, determined that the most economical system is the thermocline molten salt ESS with KCl-MgCl2 as the preferred molten salt.
The Air-Brayton combined cycle proved to be the most efficient power cycle for the two-tank direct molten salt ESS with LiF-NaF-KF as the molten salt.
Net average losses could range between 8-10% respectively. These net average losses come from the heat loss within the system, transient properties within the steam, and transient properties within the molten salt.
The highest irreversibility in the power cycle system within a specific component was within the heat exchanger. The research for these types of storage systems is ongoing, with future analyses such as system optimization including system efficiency and cost reduction, material properties (corrosion issues), and high-temperature component cost, which could alter the overall economic results. Thus, more research is needed before a molten salt ESS could become a more feasible and viable option for the NHES.
26
11. REFERENCES 1. Petrovic, B., “NuRenew, Hybrid Nuclear (LSCR)-Renewable (CSP) Energy Park,” HES-2012,
Salt Lake City, Utah, April 3–4, 2012.
2. Energy Information Administration (EIA), “Short-Term Energy Outlook,” retrieved on 20 July 2014 from http://www.eia.gov/forecasts/steo/report/renew_co2.cfm, 2014.
3. Forsberg, C., and M. Golay, “Challenges for Zero-Carbon Nuclear-Renewable Energy Futures,” Proceedings of the 2014 Annual Meeting of the American Nuclear Society, June 15-19, 2014; Reno, Nevada; Paper 9787, 2014.
4. Denholm, P., R. Margolis, and J. Milford, Production Cost Modeling for High Levels of Photovoltaics Penetration, NREL/TP-581-42305, 2008.
5. California ISO, “Flexible Resource Adequacy Criteria and Must-Offer Obligation” Market and Infrastructure Policy Straw Proposal, retrieved on 20 July 2014 from http://www.caiso.com/Documents/StrawProposal%E2%80%93FlexibleResourceAdequacyCriteriaMustOfferObligation.pdf , 2012.
6. Electricity Reliability Council of Texas (ERCOT), “Historical RTM Load Zone and Hub Prices,” retrieved from http://mis.ercot.com/misapp/GetReports.do?reportTypeId=13061&report Title=Historical%20RTM%20Load%20Zone%20and%20Hub%20Prices&showHTMLView=&mimicKey, 2014.
7. Garg, H. P., S C. Mullick, and A. K. Bhargava, Solar Thermal Energy Storage, D. Reidel Publishing Company, Dordrecht, Holland, pp. 9–16, 1985.
8. Bragg-Sitton, S., R. Boardman, M. Mckellar, H. Garcia, R. Wood, P. Sabharwall, and C. Rabiti, “Value Proposition for Load-Following Small Modular Reactor Hybrid Energy Systems,” Idaho National Laboratory, May 2013.
9. El-Wakil, M. M., Powerplant Technology,The McGraw-Hill Companies, 2002, pp. 672–708.
10. Abel, C. and B., Petrovic, , “Energy Storage: Improving Fast Reactor Economics,” Georgia Institute of Technology, Atlanta, GA, ANS 2013 Annual Meeting.
11. Yang, Z., and S. Garimella, “Thermal Analysis of Solar Thermal Energy Storage in a Molten-salt Thermocline,” www.sciencedirect.com, Solar Energy Vol. 84 Issue 6, pp. 974–985, June 2010.
12. Program on Technology Innovation: Evaluation of Concentrating Solar Thermal Energy Storage Systems, EPRI, Palo Alto, CA, 2009.
13. Williams, D. F., Assessment of Candidate Molten Salt Coolants for the NGNP/NHI Heat-Transfer Loop, ORNL/TM-2006/69, Oak Ridge National Laboratory, June 2006.
14. Sohal, M., M. Ebner, P. Sabharwall, and P. Sharpe, Engineering Database of Liquid Salt Thermophysical and Thermochemical Properties, INL/EXT-10-18297 Idaho National Laboratory, 2010.
15. Sabharwall, P., E. S. Kim, M. L. McKellar, N. Anderson, and M. Patterson, Process Heat Exchanger Options for the Advanced High Temperature Reactor, INL/EXT-11-21584, Idaho National Laboratory, June 2011.
16. Forsberg, C., L. Hu, F. Peterson, and K. Sridharan, Fluoride-Salt-Cooled High-Temperature Reactors (FHRs) for Base-Load and Peak Electricity, Grid Stabilization, and Process Heat, CANES, MIT, pp. 27–30, January 2013.
27
17. National Institute of Standards and Technology-NIST, Reference Fluid Thermodynamic and Transport Properties-REFPROP, U.S. Department of Commerce, http://www.nist.gov/srd/nist23.cfm, April 2013.
18. Boles, M., and Y. Cengel, Thermodynamic, an Engineering Approach, McGraw Hill Education (India), Private Limited, New Delhi, pp. 503–510, 553–558, 582–585, 2011.
19. Kays, W. M., and A. L. London, Compact Heat Exchangers Third Edition, Krieger Publishing Company, Malabar, Florida, pp. 16, 1984.
20. Anderson, N. A., and P. Sabharwall, “Molten Salt Mixture Properties for Use with Relap5 for HTRs,” Nuclear Technology, Vol. 178, pp. 335–340, June 2012.
21. Manfrida, G., S. Kemble, F. Buffa, and A. Milazzo, “Exergy and Exergoeconomic Model of a Ground-Based CAES Plant for Peak-Load Energy Production,” Energies 2013, pp. 1050-1067, 2013.
22. Wagner, S., and E. Rugin, “Economic Implications of Thermal Energy Storage for Concentrated Solar Power,” Renewable Energy, Vol. 61, pp. 91–95, 2014.
23. NREL, “Concentrating Solar Power Projects Andasol-1,” http://www.nrel.gov/csp/solarpaces/project_detail.cfm/projectID=3, January 2013.

28
29
Appendix A Derivation of Temperatures in Storage Tanks
Energy Balance = Heat (convection) Balance
Integrate both sides
(
)
(
)
(
)
∫
∫
∫
∫
∫
∫
∫
30
Appendix B Thermal Physical Properties Comparison Chart
Salts Wt. %
Properties Dependent on Temperature Correlation
Temperature Range
(K) Author Year
KCl-MgCl2 (62–38)
ρ 2,000.7 – 0.45709·T 1,030-1,140 Janz 1988 μ 1.46·10-4·exp(2,230/T) 873-1,073 — — k 0.2496 + 5.025·10-4·T 730-760 Janz 1981 cp 1,150 Unknown Ambrosek 2010
LiF-NaF-KF (46.5–11.5-4.2)
ρ 2,729.3 – 0.73·T 940-1,170 Williams 2006 μ 2.487·10-5·exp(4,478.62/T) 770-970 Janz 1981 k 0.36 + 5.6·10-4·T 790-1,080 Smirnov 1987 cp 976.78 + 1.0634·T All Williams 2006
KF-ZrF4 (58–42)
ρ 3,416.0 – 0.887·(T − 273.15) N/A Williams 2006
μ 1.59·10-5·exp(3,179/T) N/A Janz 1988
k 0.32 N/A Williams 2006
cp 1,047 973 Adams 2010
31
Appendix C Molten Salt ESS Cost Breakdown for a Two-tank
Direct System in a Solar Power Planta Component Unit LiF-NaF-KF KF-ZrF4 KCl-MgCl2
Unit Cost of Solar Salt $/kg 7.82 4.85 0.21 Total Mass of Salt Kg 25,000,000 25,000,000 25,000,000 Total Cost of Solar Salt M$ 195.5 121.25 5.25 Pumps and Heat Exchangers M$ 20 20 20 Tanks M$ 45 45 45 Piping, Insulation, Valves and Fittings M$ 1.5 1.5 1.5 Foundations and Support Structures M$ 0.5 0.5 0.5 Instrumentation and Control M$ 6 6 6 Combustion Turbines for Freeze Protection M$ 22 22 22 Base Capital Cost M$ 95 95 95 Total Cost of TES system M$ 290.5 216.25 100.25
a. Wagner, Sharon; Rugin, Edward, “Economic Implications of thermal energy storage for concentrated solar power,” Renewable Energy, Vol. 61, pp.91–95, 2014.
32
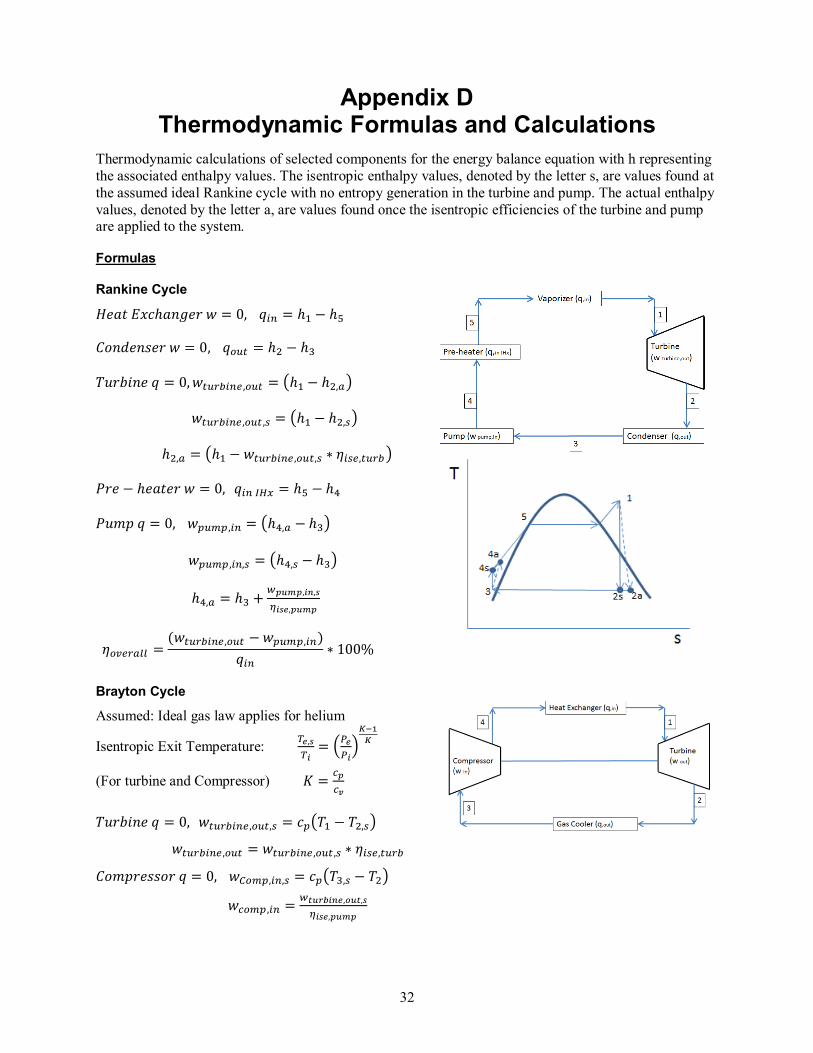
Appendix D Thermodynamic Formulas and Calculations
Thermodynamic calculations of selected components for the energy balance equation with h representing the associated enthalpy values. The isentropic enthalpy values, denoted by the letter s, are values found at the assumed ideal Rankine cycle with no entropy generation in the turbine and pump. The actual enthalpy values, denoted by the letter a, are values found once the isentropic efficiencies of the turbine and pump are applied to the system.
Formulas
Rankine Cycle
( )
( )
( )
( )
( )
Brayton Cycle
Assumed: Ideal gas law applies for helium
Isentropic Exit Temperature:
(
)
(For turbine and Compressor)
( )
( )
33
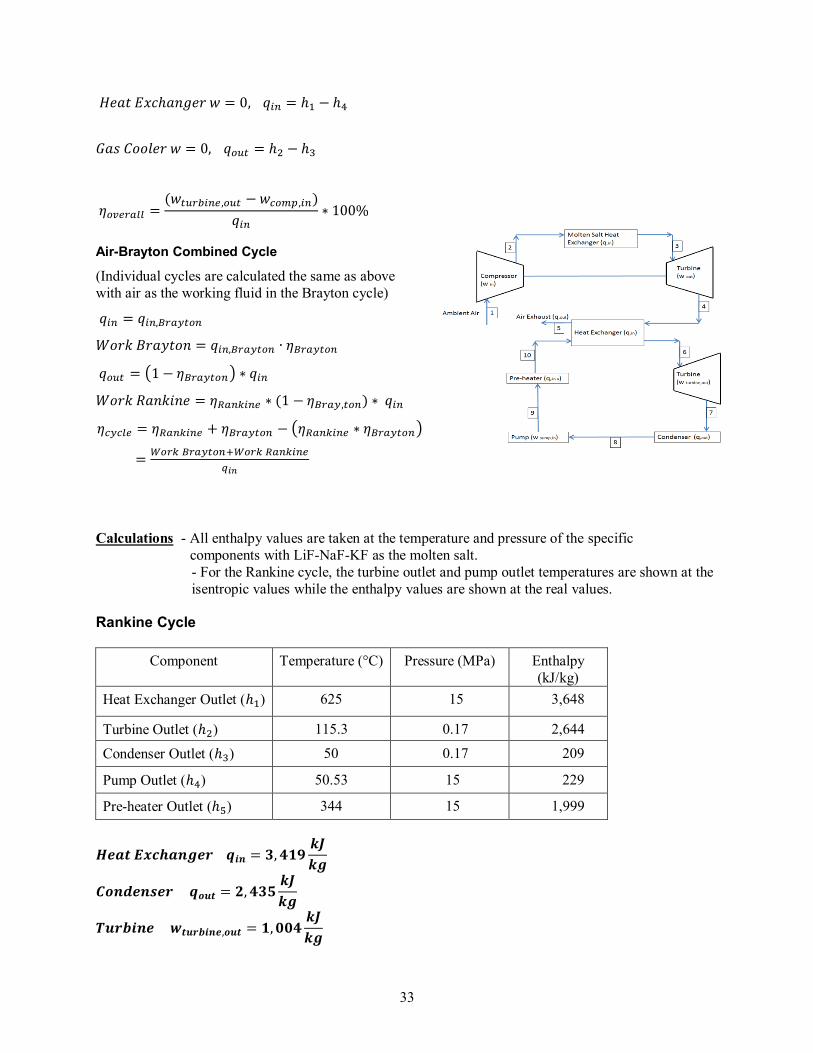
Air-Brayton Combined Cycle
(Individual cycles are calculated the same as above with air as the working fluid in the Brayton cycle)
( )
( )
Calculations - All enthalpy values are taken at the temperature and pressure of the specific components with LiF-NaF-KF as the molten salt.
- For the Rankine cycle, the turbine outlet and pump outlet temperatures are shown at the isentropic values while the enthalpy values are shown at the real values.
Rankine Cycle
Component Temperature (°C) Pressure (MPa) Enthalpy (kJ/kg)
Heat Exchanger Outlet ( ) 625 15 3,648
Turbine Outlet ( ) 115.3 0.17 2,644
Condenser Outlet ( ) 50 0.17 209
Pump Outlet ( ) 50.53 15 229
Pre-heater Outlet ( ) 344 15 1,999
34
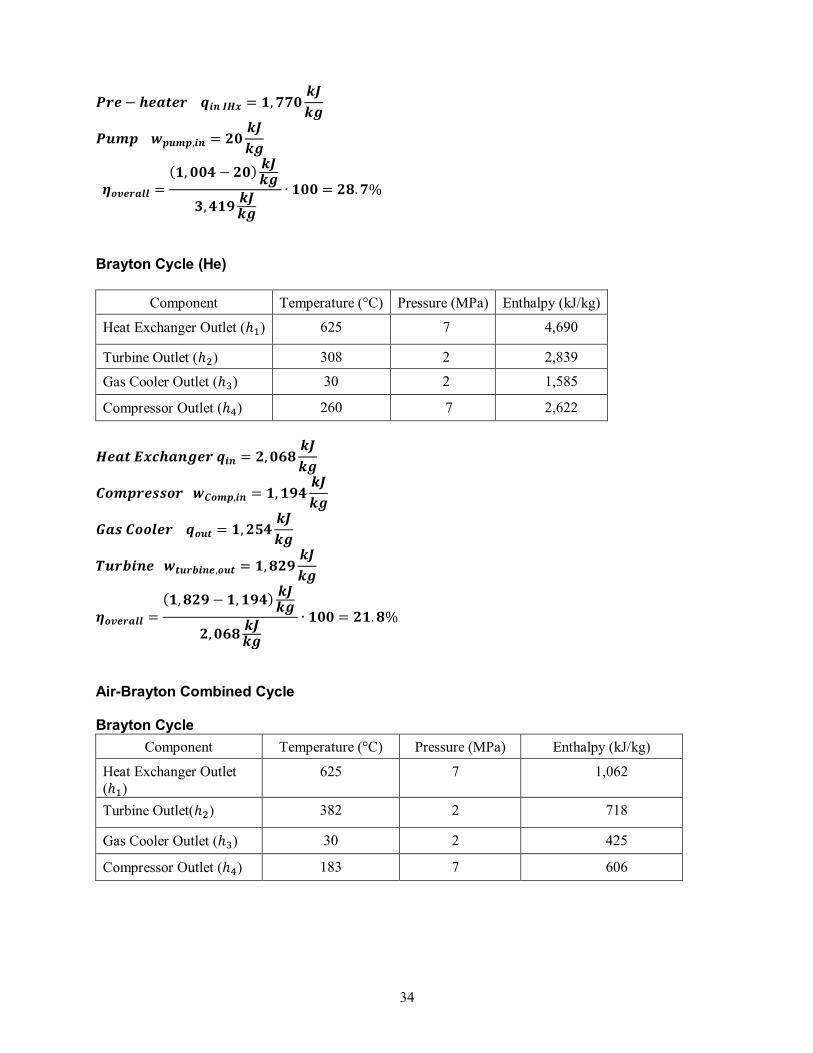
Brayton Cycle (He)
Component Temperature (°C) Pressure (MPa) Enthalpy (kJ/kg)
Heat Exchanger Outlet ( ) 625 7 4,690
Turbine Outlet ( ) 308 2 2,839
Gas Cooler Outlet ( ) 30 2 1,585
Compressor Outlet ( ) 260 7 2,622
Air-Brayton Combined Cycle Brayton Cycle
Component Temperature (°C) Pressure (MPa) Enthalpy (kJ/kg)
Heat Exchanger Outlet ( )
625 7 1,062
Turbine Outlet( ) 382 2 718
Gas Cooler Outlet ( ) 30 2 425
Compressor Outlet ( ) 183 7 606

35
Rankine Cycle
Component Temperature (°C) Pressure (MPa) Enthalpy (kJ/kg)
Heat Exchanger Outlet ( ) 312 5 1,207
Turbine Outlet( ) 40.6 0.0076 1,005
Condenser Outlet( ) 30 0.0076 334
Pump Outlet ( ) 30.11 5 132
Pre-heater Outlet ( ) 190 5 368
(
)
36
Appendix E Exergy Calculations
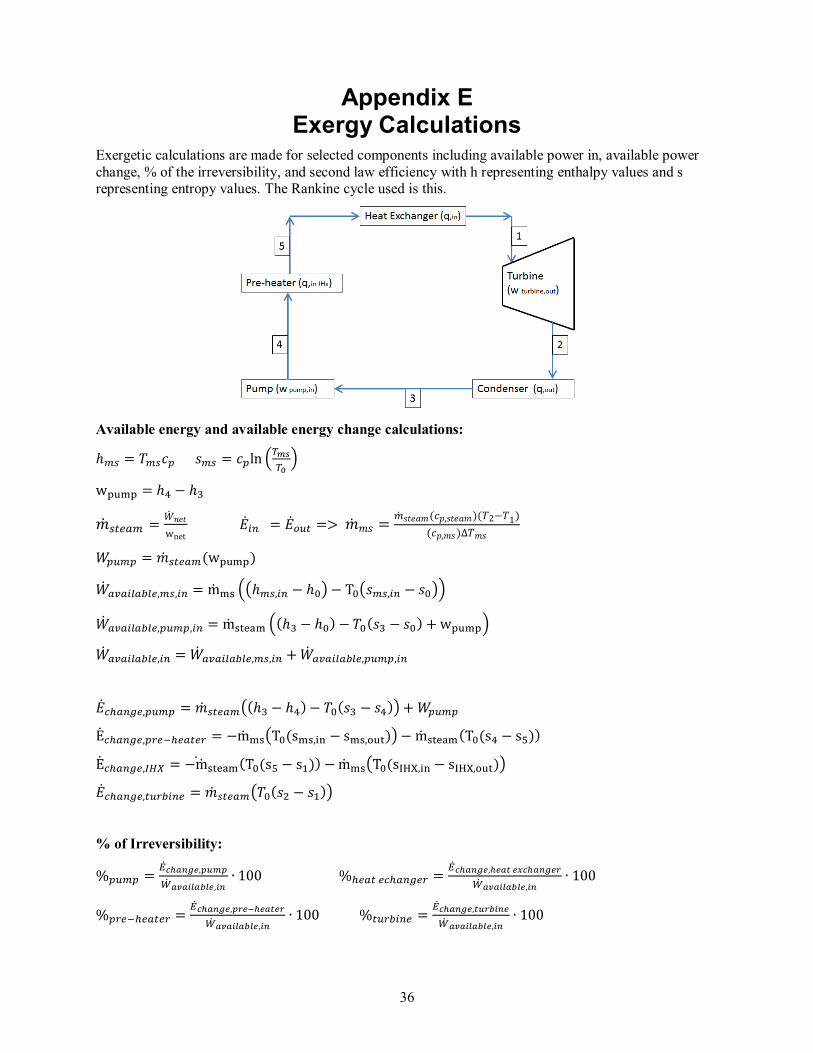
Exergetic calculations are made for selected components including available power in, available power change, % of the irreversibility, and second law efficiency with h representing enthalpy values and s representing entropy values. The Rankine cycle used is this.
Available energy and available energy change calculations:
(
)
(( ) ( ))
( )
( )
( )
( )
( )
% of Irreversibility:
37
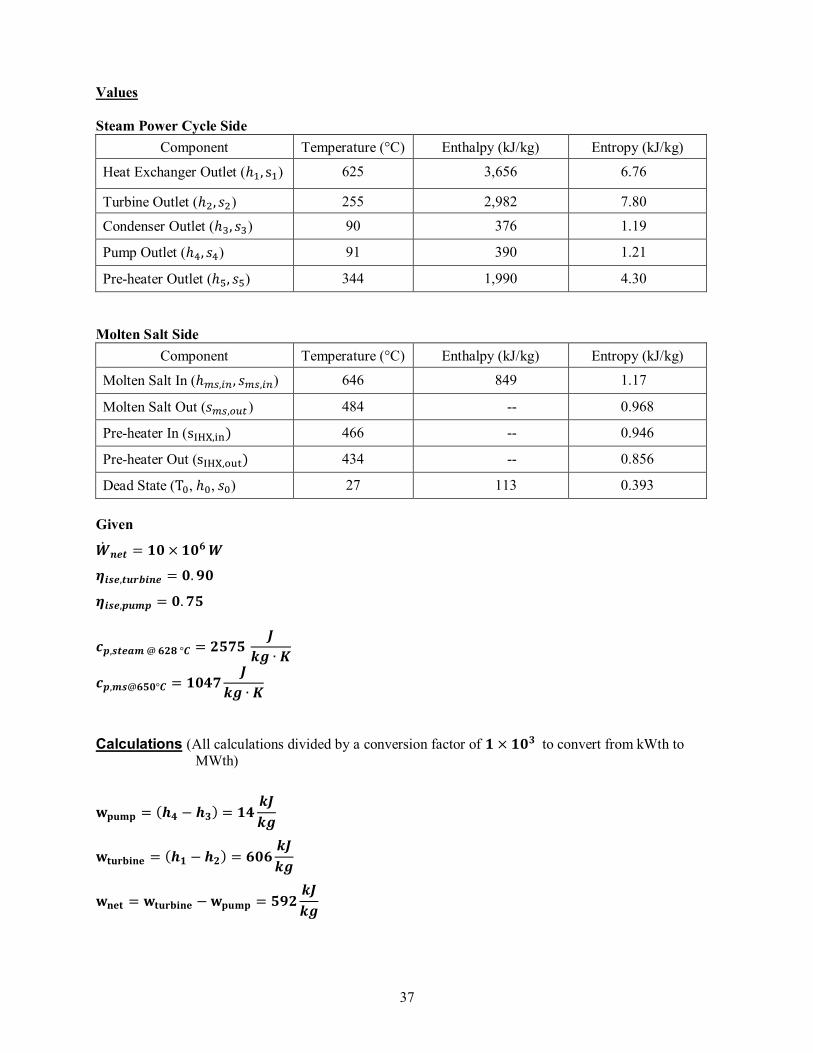
Values Steam Power Cycle Side
Component Temperature (°C) Enthalpy (kJ/kg) Entropy (kJ/kg)
Heat Exchanger Outlet ( ) 625 3,656 6.76
Turbine Outlet ( ) 255 2,982 7.80
Condenser Outlet ( ) 90 376 1.19
Pump Outlet ( ) 91 390 1.21
Pre-heater Outlet ( ) 344 1,990 4.30 Molten Salt Side
Component Temperature (°C) Enthalpy (kJ/kg) Entropy (kJ/kg)
Molten Salt In ( ) 646 849 1.17
Molten Salt Out ( ) 484 -- 0.968
Pre-heater In ( 466 -- 0.946
Pre-heater Out ( 434 -- 0.856
Dead State ( , , ) 27 113 0.393 Given
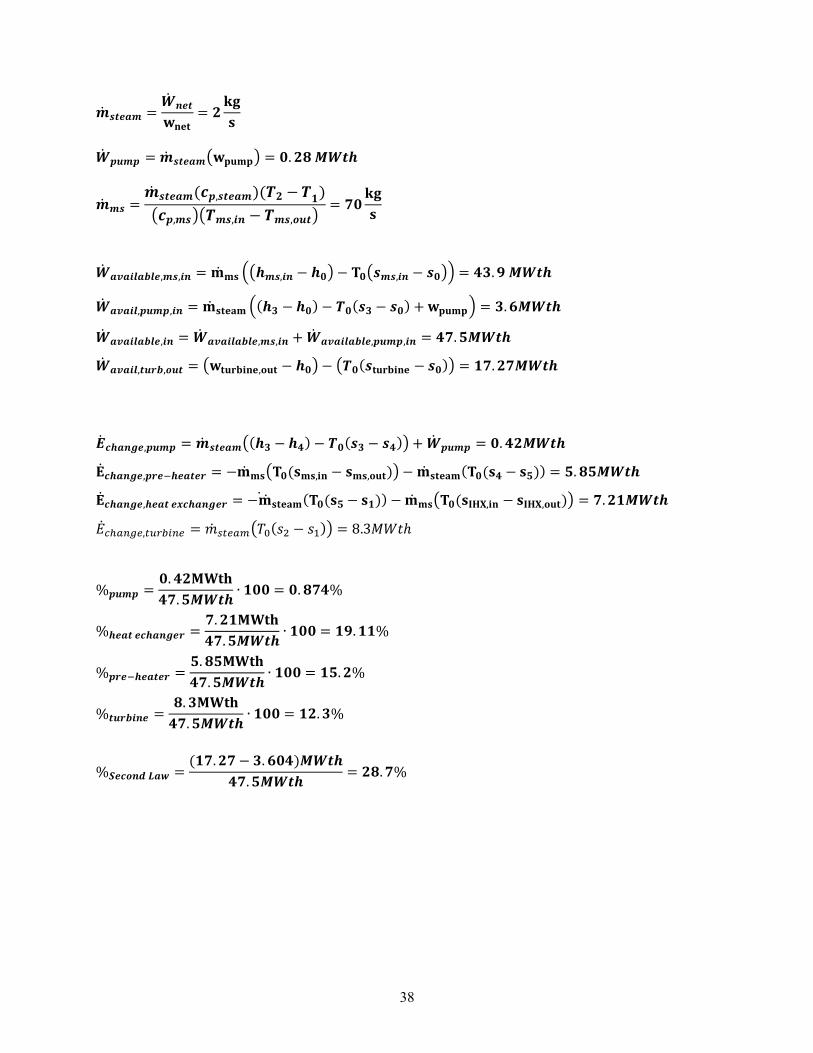
Calculations (All calculations divided by a conversion factor of to convert from kWth to
MWth)
38
( )
( )( )
(( ) ( ))
( )
( ) ( )
( )
( )
( )
( )

39
Appendix F Andasol 1 Power Plant
Configuration and Information (www.nrel.gov)
Andasol 1 is the first parabolic trough power plant in Europe and the first in the world with storage. A two-tank indirect thermal storage system holds 28,500 tons of molten salt and the reservoir can generate power for up to 7.5 hours at full load.
As of January 25, 2013
Plant Configuration Solar-Field Aperture Area: 510,120 m²
Solar-Field Inlet Temperature: 293 °C Solar-Field Outlet Temperature: 393 °C
Solar-Field Temperature Difference: 100 °C
Power Block Turbine Capacity (Gross): 50.0 MW
Output Type: Steam Rankine Power Cycle Pressure: 100.0 bar
Cooling Method: Wet cooling Cooling Method Description: Cooling towers
Turbine Efficiency: 38.1% @ full load Annual Solar-to-Electricity Efficiency (Gross): 16%
Fossil Backup Type: HTF heater Backup Percentage: 12%
Thermal Storage Storage Type: two-tank indirect
Storage Capacity: 7.5 hour(s) Thermal Storage Description: 28,500 tons of molten salt. 60% sodium nitrate, 40%
potassium nitrate. 1,010 MWth. Tanks are 14 m high and 36 m in diameter.