evaluation of interfacial energy between molten fe and fe
TRANSCRIPT

ISIJ International, Vol. 61 (2021), No. 9
© 2021 ISIJ2381
* Corresponding author: E-mail: [email protected]
© 2021 The Iron and Steel Institute of Japan. This is an open access article under the terms of the Creative Commons Attribution-NonCommercial-NoDerivs license (https://creativecommons.org/licenses/by-nc-nd/4.0/).
ISIJ International, Vol. 61 (2021), No. 9, pp. 2381–2390
https://doi.org/10.2355/isijinternational.ISIJINT-2020-696
1. Introduction
Non-metallic inclusions cause significant damage (e.g., surface and internal defects) to various steel products and lead to compromised strength and fatiguing. Therefore, there is high demand for the development of manufacturing techniques for highly refined steel.1,2) Oxides, such as Al2O3, MgO, and MgO·Al2O3, are common primary non-metallic inclusions generated during the steelmaking process. Al2O3 inclusions form as Al is added to deoxidize molten iron or steel, while the MgO and Mg content of molten iron or steel tends to increase due to the erosion of refractories. MgO·Al2O3 inclusions subsequently form via reactions between Al or Al2O3 inclusions with Mg or MgO.3,4)
Non-metallic inclusions can be effectively removed by facilitating collision, agglomeration, and coalescence of inclusions, to form coarse inclusions that are easily removed via flotation.2,5) The agglomeration and coalescence of inclu-sions can be better controlled and estimated by understand-ing the wetting behavior between the inclusions and molten iron or steel, such as the interfacial energy and the contact angle.2,6) Sasai previously reported that the cavity bridge force drives agglomeration between Al2O3 inclusions in Al-
Evaluation of Interfacial Energy between Molten Fe and Fe-18%Cr-9%Ni Alloy and Non-Metallic Inclusion-Type Oxides
Tomoki FURUKAWA, Noritaka SAITO* and Kunihiko NAKASHIMA
Department of Materials Science and Engineering, Kyushu University, 744, Motooka, Nishi-ku, Fukuoka, 819-0395 Japan.
(Received on November 13, 2020; accepted on March 22, 2021; J-STAGE Advance published date: August 25, 2021)
The contact angles between three non-metallic inclusion-type oxide substrates, viz. Al2O3, MgO, and MgO·Al2O3, and molten Fe and molten Fe-based stainless steel (Fe–Cr–Ni alloy) were measured using the sessile drop method in Ar atmosphere at 1 873 K. The contact angles between molten Fe and oxide sub-strates ranged between 111° and 117°, while that between molten Fe–Cr–Ni alloy and substrates ranged between 103° and 105°. The angles between the alloy and each of the substrates were smaller than the corresponding values for Fe, which was attributed to the superior wettability of molten Fe–Cr–Ni alloy on the substrates. The wettability of the molten materials is related to the interfacial tension between the molten metals and each substrate. Thus, the interfacial tension between the molten metals and the non-metallic substrates was quantitatively evaluated using Young’s equation and the measured contact angles; the interfacial tension for molten Fe ranged from 1.862 to 2.781 N·m−1, while that for molten Fe–Cr–Ni alloy ranged from 1.513 to 2.286 N·m−1. Owing to the higher reactivity between molten Fe–Cr–Ni alloy and the substrates, the interfacial tension and energy between them were lower than those between molten Fe and the substrates.
KEY WORDS: wettability; interfacial energy; contact angle; non-metallic inclusion; sessile drop method.
deoxidized molten steel; it is expressed as follows:2)
F R P RA S Fe Fe, 42� �� � �� � � �42 � ................ (1)
R
P r 2 PFe Fe Fe Fe Fe / Al O Fe
4
2 0.53 9 8 cos 2 3
�
� �� � � �� � � �� �� � � �� �/
.......................................... (2)where FA,S is the agglomeration force (i.e., the cavity bridge force), R4 is the radius of the neck of the cavity bridge, σFe is the surface tension of molten iron, r is the radius of a spherical inclusion, ΔPFe is the pressure difference between the cavity bridge and molten steel obtained from the Laplace relation, and θFe/Al2O3 is the contact angle between the Al-deoxidized molten steel and Al2O3. Equations (1) and (2) use σFe as the surface tension for Al-deoxidized steel. Further, Eqs. (1) and (2) demonstrate that the contact angle between molten steel and Al2O3 is required for estimating the agglomeration force between the particles. Kitayama et al. proposed an anisotropic Ostwald ripening model for completely faceted crystals in the liquid phase; Eqs. (3) and (4) are the shape evolution equations for the (100) and (001) facets, respectively:7)
Recent Progress in Inclusion/ Precipitate Engineering

ISIJ International, Vol. 61 (2021), No. 9
© 2021 ISIJ 2382
da
dt
V
RT
DK
D K a r a ca
a
�� �
� ����
���
� 2 1 1
1 ................ (3)
dc
dt
V
RT
DK
D K c r cc
c
�� �
����
���
� 2 2
1
................... (4)
where a is the mean (100) facet distance, c is the mean (001) facet distance, σ is the interfacial energy between the crystal surface and liquid phase, V is the molar volume, D is the diffusion constant, Ka is the interfacial reaction constant in the [100] direction, Kc is the interfacial reac-tion constant in the [001] direction, and r1 is the radius of a spherical particle. A faceted crystal with (100) and (001) facets is schematically shown in Fig. 1. Equations (3) and (4) indicate that the interfacial energy between the crystal and liquid phases is important for estimating grain growth in the liquid phase. Thus, both the contact angle and interfacial energy are crucial parameters in the control and estimation of particle conditions.
The wettability between inclusions and molten iron or steel has been widely investigated.8–20) However, the values of interfacial energy and contact angle reported in these studies cannot be compared because the studies were con-ducted under different experimental conditions (e.g., tem-perature, atmosphere, and crystal orientation). For example, molten Fe and Al2O3 were investigated by Ogino et al., who reported a contact angle of 128° in H2 atmosphere at 1 873 K.11) However, Nakashima et al. studied the same materials and reported a contact angle of 120° in Ar atmosphere at the same temperature.8) Thus, the experimental conditions have an obvious effect on the contact angle. Consequently, the wettability between inclusions and molten metals or alloys should be investigated under the same conditions.
This study aimed to investigate the wettability of three typical non-metallic inclusion-type oxides, viz. Al2O3, MgO, and MgO·Al2O3 substrates, with respect to molten Fe and molten SUS304, which is a typical high-alloy steel (Fe-18%Cr-9%Ni), under the same experimental conditions. The contact angle and interfacial energy between the non-metallic substrates and metallic materials were evaluated, and the interfacial conditions were investigated.
2. Experimental
2.1. MaterialsThe wetting tests were conducted using pure Fe (99.95%+
purity, Nilaco, Tokyo, Japan) and SUS304 (Hikari, Osaka,
Japan) as a Fe–Cr–Ni alloy, and non-metallic inclusion-type oxides, viz. Al2O3 (poly crystal, 99.9% purity, Nikkato, Osaka, Japan), MgO (poly crystal, 99.6% purity, Nikkato, Osaka, Japan), and MgO·Al2O3 (poly crystal, 99.99% purity, Dalian Keri Material Technology, Dalian, China) substrates. The chemical composition of SUS304 is sum-marized in Table 1.
The metal samples were cut into small pieces using a dia-mond saw (Isomet4000, BUEHLER, Lake Bluff, IL, USA). Each metallic sample (2 g) was weighed and immersed in an aqueous solution of H2O/HCl (1:1) for 10 s right before per-forming the wetting test to remove any surface oxide layer.
One surface each of the Al2O3 and MgO substrates was polished using a 35 μm diamond disc and diamond pastes with decreasing grain size (9, 6, and 1 μm) with an auto-matic polisher (AutoMet250, BUEHLER, Lake Bluff, IL, USA). The substrates were also polished using 0.025 μm colloidal silica. The MgO·Al2O3 substrates were polished during production, and thus, were not polished in the labora-tory. Each substrate was washed sequentially by ultrasonic cleaning in soap water, ultrapure water, 2-propanol, and acetone for 15 min right before the wetting test.
The mean roughness (Ra) was estimated using a surface roughness measurement device (SURFCOM 1500DX-3DF, Tokyo Seimitsu, Tokyo, Japan); the mean roughness values of the Al2O3, MgO, and MgO·Al2O3 substrates were 0.078, 0.38, and 0.011 μm, respectively. In a previous experimental study, Ogino et al. reported that a surface roughness below 30 μm does not influence the contact angle of the Fe/Al2O3 wetting couple.11) Thus, the low surface roughness of the substrates in this study was assumed to not influence the contact angle.
2.2. Wetting TestsThe experimental wetting furnace consisted of a graphite
stage, graphite heating elements, and sapphire windows (Fig. 2). The wetting tests were conducted using the falling-drop method, where the falling-drop section of the furnace consisted of a graphite crucible, an alumina crucible, and an alumina push stick. Illustrations of the molten metal before and after it was pushed out of the crucible and onto the substrate are shown in Fig. 3. A substrate was positioned horizontally on the graphite stage, and a 2 g metallic sample was placed in the alumina crucible just above the substrate. The alumina crucible was inside a graphite crucible. The furnace was evacuated from ambient atmosphere to 30 Pa and filled with Ar gas at 1 atm; this procedure was repeated thrice. The furnace was heated to 1 873 K at 15 K/min at an Ar gas flow rate of 0.5 L/min. The metal was pushed out of the crucible and onto the substrate using an alumina push stick above the alumina crucible. The metal and substrate couple was held at 1 873 K for 1 h, after which the furnace
Fig. 1. Illustration of a faceted crystal with (100) and (001) facets.
Table 1. Chemical composition of SUS304 (mass%).
C Si Mn P S Ni Cr
Max. 0.08 1.00 2.00 0.045 0.030 10.50 20.00
Min. – – – – – 8.00 18.00
Ave. 0.06 0.53 1.66 0.031 0.024 8.58 18.44

ISIJ International, Vol. 61 (2021), No. 9
© 2021 ISIJ2383
min after the metal was ejected, and at 10 min intervals when the coupled sample was held at 1 873 K. The oxygen partial pressure in the furnace was estimated as 10 −15 atm by a ZrO2 oxygen sensor, which was based on the redox reaction of Ni.
2.3. CharacterizationThe metal and substrate samples were observed using
scanning electron microscopy with energy dispersive spec-troscopy (SEM-EDS; SUPERSCAN SS-550, Shimadzu, Kyoto, Japan) at an accelerating voltage of 15.0 kV. The metal samples were also analyzed at 1 μm from the metal/substrate interface using an electron probe micro analyzer (EPMA-1720, Shimadzu, Kyoto, Japan) at an accelerat-ing voltage of 15.0 kV. The dissolved oxygen content, O, inside the metal samples was detected using inert gas fusion extraction infrared absorption analysis (ONH836, LECO, Tokyo, Japan).
The contact angles were determined using the curve-fitting method, where the error was expected to be within the range of ±1%. The surface and interfacial tensions are balanced at the triple phase of liquid, solid, and gas; their relationship is expressed using the following equation:
� � � �SV SL LV� � cos ........................ (5)
where σSV is the surface tension of the oxide, σSL is the interfacial tension between molten metal and oxide, σLV is the surface tension of the molten metal, and θ is the contact angle between the molten metal and oxide. The interfacial energies between the molten Fe-based metals and non-metallic inclusion-type oxides were calculated using Eq. (5); the contact angle determined 5 s after the molten material was dropped onto the substrate was used to evaluate the wetting behavior before and after the organization of the interface.
3. Results and Discussion
3.1. Wetting BehaviorThe images of the wetting couples during the wetting tests
revealed that each molten metal was covered with an oxide surface layer during the latter part of the test (Figs. 4 to 9). The contact angles 5 s after the molten metal was dropped onto
Fig. 2. Schematic of the ultra-high-temperature wetting furnace. (Online version in color.)
Fig. 3. Schematic of the falling-drop region of the wetting fur-nace. (Online version in color.)
Fig. 4. Sessile drop images of the Fe/Al2O3 wetting couple. (Online version in color.)
was switched off and cooled to room temperature. A digital camera was used to capture images through the sapphire window; the images were captured at 5 s, 1 min, and 5

ISIJ International, Vol. 61 (2021), No. 9
© 2021 ISIJ 2384
Fig. 5. Sessile drop images of the Fe–Cr–Ni alloy/Al2O3 wetting couple. (Online version in color.)
Fig. 6. Sessile drop images of the Fe/MgO wetting couple. (Online version in color.)
Fig. 7. Sessile drop images of the Fe–Cr–Ni alloy/MgO wetting couple. (Online version in color.)
the substrate were 114°, 111°, 117°, 105°, 103°, and 103° for Fe/Al2O3 (θFe/Al2O3), Fe/MgO (θFe/MgO), Fe/MgO·Al2O3 (θFe/
MgO·Al2O3), Fe–Cr–Ni alloy/Al2O3 (θFe–Cr–Ni/Al2O3), Fe–Cr–Ni alloy/MgO (θFe–Cr–Ni/MgO), and Fe–Cr–Ni alloy/MgO·Al2O3 (θFe–Cr–Ni/MgO·Al2O3), respectively.
Changes in the contact angle of each wetting couple were observed until the molten metal was covered with an oxide layer (Fig. 10). As the contact angles exceeded 90°, the
wettability of molten Fe and molten Fe–Cr–Ni alloy against each substrate was poor. The contact angles between the substrates and molten Fe–Cr–Ni alloy were smaller than those for molten Fe, indicating that the wettability of molten Fe–Cr–Ni alloy was superior for all oxide substrates. This was attributed to lower interfacial energy between molten Fe–Cr–Ni alloy and each substrate than that for molten Fe.
The images of the wetting couples and the time change

ISIJ International, Vol. 61 (2021), No. 9
© 2021 ISIJ2385
Fig. 8. Sessile drop images of the Fe/MgO·Al2O3 wetting couple. (Online version in color.)
Fig. 9. Sessile drop images of the Fe–Cr–Ni alloy/MgO·Al2O3 wetting couple. (Online version in color.)
Fig. 10. Contact angle of each wetting couple over time.
plot revealed that the Fe/Al2O3 wetting couple had the most stable contact angle (Figs. 4 to 10). The contact angle of Fe/MgO increased over time, while that of Fe/MgO·Al2O3 decreased. The change in the contact angle for Fe–Cr–Ni alloy/Al2O3 was small, and it stabilized after 5 min, while a large decrease and subsequent stabilization after 5 min was observed in Fe–Cr–Ni alloy/MgO. The contact angle of Fe–Cr–Ni alloy/MgO·Al2O3 remained slightly stable initially, but decreased after 10 min.
3.2. Evaluation of Interfacial EnergiesThe interfacial energy was estimated using Young’s Eq.
(5). Takiuchi et al.9) and Ozawa et al.21) have reported that the surface tensions of molten Fe (σFe) and molten SUS304 (σ304) can be calculated using the following equations:
� Fe Oa� � �� �1 900 327 1 96ln .................. (6)
�304 0 3291 1694 1692� � �� � �. T ............... (7)
where aO is the activity of oxygen relative to the 1 mass% standard state in molten Fe. Consequently, the surface ten-sions of molten Fe and molten Fe–Cr–Ni alloy were calcu-lated as 1 897 and 1 633 mN·m −1 at 1 873 K, respectively. The activity of oxygen was determined based on the dis-solution equilibrium of oxygen in molten Fe as follows:22)
1
2
5 8360 3542
2
O O Ka
P TO
O
�� � � � �, log .log ..... (8)
where the oxygen partial pressure (PO2) was 10 −15 atm, and the activity of oxygen in molten Fe was calculated as 9.31×10 −5. In addition, the surface tension of Al2O3 (σAl2O3), MgO (σMgO), and MgO·Al2O3 (σMgO·Al2O3) oxide substrates was estimated as 1 090, 1 708, and 1 919 mN·m −1 at 1 873 K, respectively.23,24) Thus, the interfacial tensions were calculated to be 1 862, 2 388, 2 781, 1 513,

ISIJ International, Vol. 61 (2021), No. 9
© 2021 ISIJ 2386
2 075, 2 286 mN·m −1 for Fe/Al2O3 (σFe/Al2O3), Fe/MgO (σFe/MgO), Fe/MgO·Al2O3 (σFe/MgO·Al2O3), Fe–Cr–Ni alloy/Al2O3 (σFe–Cr–Ni/Al2O3), Fe–Cr–Ni alloy/MgO (σFe–Cr–Ni/MgO), and Fe–Cr–Ni alloy/MgO·Al2O3 (σFe–Cr–Ni/MgO·Al2O3), respec-tively, based on the contact angles measured 5 s after the molten metal was dropped onto the substrate and the sur-face tensions of the metals and oxides estimated. The value of the interfacial tension between molten Fe and Al2O3 (1 862 mN·m −1) was larger than that reported by Ogino et al. (1 680 mN·m −1 at 1 873 K).25) Similarly, the value of the interfacial tension between molten Fe and MgO·Al2O3 (2 781 mN·m −1) was larger than that reported by Fukami et al. (1 530 mN·m −1 at 1 833 K).16) Previously reported interfacial tension values for the other combinations were not found in academic research databases. Overall, the interfacial tension between molten Fe–Cr–Ni alloy and each substrate was smaller than those between molten Fe and substrates. This was attributed to the higher reactivity of molten Fe–Cr–Ni alloy with the substrates.
3.3. Thermodynamic ConsiderationsThe structure of the interface between a molten metal
and a substrate results in interfacial reactions. As interfacial reactions progress, the interfacial tension decreases due to the mass transfer at the interface.26) Because of this, the interfacial energy between molten Fe–Cr–Ni alloy and each substrate was lower, indicating that molten Fe–Cr–Ni alloy was more reactive. In this section, substrate dissolution and Cr2O3 formation are considered to be the possible reactions that led to the reduced interfacial energies of molten Fe–Cr–Ni alloy, by calculating the solubility and the solubil-ity product of Al and Mg composition into molten Fe and molten Fe–Cr–Ni alloy and comparing the solubility and the solubility product into the molten alloy with that into molten Fe. In this case, the local equilibrium, and the local solu-bility and the local solubility product at the molten metal/substrate interface were taken into consideration.
Ogino et al. reported that a molten Fe–Ni alloy exhibited higher reactivity with an Al2O3 substrate than that of molten Fe because the molten Fe–Ni alloy was more reactive with the Al2O3 substrate due to its Ni content.27) Therefore, the degree of substrate dissolution in this study was estimated by thermodynamically calculating the solubility and the solubility product of Al and Mg in molten Fe and molten Fe–Cr–Ni alloy based on the equilibrium reaction between the soluble content (Al or Mg) generated via substrate dis-solution reactions and the O component in the molten metal.
The substrate dissolution reactions into molten metal were as follows:
Al O Al O2 3 2 3� � ........................... (9)
MgO Mg O� � ........................... (10)
MgO Al O Mg Al O� � � �2 3 2 4 ............... (11)
where Eq. (11) is based on Eqs. (9), (10), and the MgO·Al2O3 decomposition reaction into Al2O3 and MgO expressed as follows:
MgO Al O Al O MgO� � �2 3 2 3 ................ (12)
The equilibrium constant values of Eqs. (9)–(11) were
expressed as follows:
K a a Al OAl O Al O92 3 2 3
� � � �� � � �� �� � ............. (13)
K a a Mg OMg O Mg O10 � � � �� � � �� �� � ............ (14)
K a a a Mg Al OMg Al O Mg Al O112 4 2 4
� � � �� � � �� � � �� �� � � ... (15)
where aAl, aMg, and aO are the activity of Al, Mg, and O relative to the 1 mass% standard state in molten Fe, respec-tively; γAl, γMg and γO are the activity coefficient of Al, Mg, and O, respectively; [Al], [Mg], and [O] are the mass per-cent of Al, Mg, and O, respectively; and K is the equilibrium constant. The activity of the solid substrates in Eqs. (13)–(15) was approximated as 1, and the standard Gibbs energy changes (ΔG0) of each equation are summarized in Table 2.
The solubility of Al and Mg from the substrates into the molten Fe was calculated. Al, Mg, and O were assumed to be in an infinite dilution dissolution state in molten Fe. Thus, the activity of Al, Mg, and O were approximated as mass percent of the component in molten Fe, where Eqs. (13)–(15) were rewritten as Eqs. (16)–(18), respectively:
K Al O92 3� � � � � ........................... (16)
K Mg O10 � � �� � ............................ (17)
K Mg Al O112 4� � �� � � � ....................... (18)
Further, the relationship between the standard Gibbs energy change and equilibrium constant in the chemical equilibrium state is expressed as:
�G RT K0 � � ln .......................... (19)
The oxygen analysis results for the metal samples are given in Table 3. The thermodynamic data listed in Table 2 and
Table 2. ΔG0 values for the substrate dissolution reactions and Cr2O3 formation reaction (Henrian activity of 1 mass% standard state in molten Fe is chosen for solute compo-nents).
Chemical reaction ΔG0 J·mol −1
Al O Al O2 3 2 3� � (9) 1 225 000–393.8T34)
MgO Mg O� � (10) 89 960+82.0T1)
MgO Al O Al Mg O� � � �2 3 2 4 (11) 1 334 000–305.5T
MgO Al O Al O MgO� � �2 3 2 3 (12) 18 828+ 6.3T1)
2 3 2 3Cr O r O� �C (22) −843 100+371.8T34)
A Cl O Cr r O Al2 3 2 32 2� � � (23) 381 900–22T
3 2 32 3MgO C� � �Cr r O Mg (24) −573 200+ 617.8T
MgO A C� � � � �l O Cr r O Al Mg2 3 2 38
3
4
32 (25) 209 900+190.2T
Table 3. Dissolved oxygen content O inside the metal samples (mass%).
Al2O3 MgO MgO·Al2O3
Fe 0.00898 0.0111 0.00377
Fe–Cr–Ni alloy 0.00823 0.0121 0.0209

ISIJ International, Vol. 61 (2021), No. 9
© 2021 ISIJ2387
the dissolved oxygen content in Table 3 were used in Eqs. (16)–(19) to estimate the solubility of Al ([Al]) and Mg ([Mg]) and the solubility product of Al and Mg ([Mg][Al]2) at molten Fe/substrate interface as an [Al] of 1.88×10 −4 mass% in Fe/Al2O3, [Mg] of 1.45×10 −5 mass% in Fe/MgO, and [Mg][Al]2 of 2.80×10 −12 (mass%)3 in Fe/MgO·Al2O3.
The solubility of Al or Mg and the solubility product of Al and Mg into the molten Fe–Cr–Ni alloy were estimated by considering the interactions between soluble content in the alloy. The first-order and second-order interaction parameters are summarized in Table 4.28) The activity coef-ficients of Al and Mg were calculated using Eqs. (20) and (21), respectively:
log� Al Alj
AlAle j r Al� � �� � � �2 ................. (20)
log ,�Mg Mgj
MgNi Cre j r� � �� � � �� �Ni Cr ............ (21)
The EPMA point analysis results for the Fe–Cr–Ni alloy samples are given in Table 5. The values from Tables 3–5, and Eqs. (20) and (21) were used to calculate the activ-ity coefficients of Al (γAl), Mg (γMg), and O (γO) and the activity of O (aO) at the alloy/substrate interfaces; a γAl of 2.08 and γO of 0.00728, and aO of 5.99×10⁻⁵ for Fe–Cr–Ni/Al2O3, γMg of 1.07 and γO of 0.0134, and aO of 1.61×10⁻⁴ for Fe–Cr–Ni/MgO, and γMg of 0.0321, γAl of 7.32, and γO of 1.30×10⁻⁵, and aO of 2.72×10⁻⁷ for Fe–Cr–Ni/MgO·Al2O3 were obtained. Further, the values from Table 2, Eqs. (13)–(15), and (19), the calculated activity coefficients of Al, Mg and O, and the activity of oxygen shown above were used to calculate the solubility of Al and Mg and the solubility product of Al and Mg in Fe–Cr–Ni alloy and the following values were obtained: [Al] of 0.166 mass% for Fe–Cr–Ni/Al2O3, [Mg] of 9.37×10⁻⁴ mass% for Fe–Cr–Ni/MgO, and [Mg][Al]2 of 6.07×10⁴ (mass%)3 for Fe–Cr–Ni/MgO·Al2O3.
The solubility of Al and Mg and the solubility product of Al and Mg were higher in molten Fe–Cr–Ni alloy than those in molten Fe, which confirmed the higher reactivity of Fe–Cr–Ni alloy during the substrate dissolution reac-tion. Furthermore, this reaction also contributed to the lower interfacial tension, and in turn, resulted in the lower interfacial energy of molten Fe–Cr–Ni alloy than that of molten Fe.
Soluble Al was measured via EPMA point analysis at the Fe/Al2O3, Fe/MgO·Al2O3, Fe–Cr–Ni alloy/Al2O3, and Fe–Cr–Ni alloy/MgO·Al2O3 interfaces (Table 5), which experimentally confirmed the Al2O3 and MgO·Al2O3 dis-solution reactions. The backscattered-electron (BSE) image of the Fe region in the Fe/MgO couple after the wetting test revealed small inclusion-type particles (Fig. 11). Similarly,
the EPMA point analysis of soluble Mg in Fe–Cr–Ni alloy/MgO, Fe/MgO·Al2O3, and Fe–Cr–Ni alloy/MgO·Al2O3 con-firmed that soluble Mg was generated from the MgO and MgO·Al2O3 substrate dissolution reactions. Therefore, the Al2O3, MgO, and MgO·Al2O3 substrate dissolution reactions were experimentally confirmed.
Shin et al. observed a Cr2O3 product layer between an Fe-19%Cr-10%Ni alloy and an Al2O3 substrate.14) The alloy compositions in the previous and current studies were very similar; therefore, Cr2O3 formation was considered. In molten Fe–Cr–Ni alloy, Cr2O3 formation is expressed as:
2 3 2 3Cr O r O� �C ......................... (22)
Equations (9)–(11) were combined with Eq. (22) to formu-late the Cr2O3 formation reaction with molten Fe–Cr–Ni
Table 4. First- and second-order interaction parameters eij , (ri j ), and {ri j k, }. (Solvent: Fe).
j, ki
Cr Ni Al Mg O C Si Mn (Al) {Ni, Cr}
Al 0.012 −0.0173 0.043 −0.13 −1.98 0.091 0.056 −0.004 −0.001
Mg 0.05 −0.03 −0.12 0 −3 −0.24 −0.088 −0.0009
Cr −0.0003 0.0002 −0.178 −0.114 −0.004 0.0039
O −0.055 0.006 −1.17 −280 −0.2 −0.421 −0.066 −0.021
Table 5. EPMA point analysis of each wetting couple near the interface.
Cr Ni Mg Al O C Si Mn
Fe/Al2O3 – – – 0.059 0 – – –
Fe/MgO – – 0 0 0 – – –
Fe/MgO·Al2O3 – – 0 0.052 1.439 – – –
Fe–Cr–Ni alloy/Al2O3
19.066 8.719 – 0.104 0 2.331 0.455 0.406
Fe–Cr–Ni alloy/MgO 18.561 7.891 0 – 0 2.063 0.408 0.218
Fe–Cr–Ni alloy/MgO·Al2O3
19.341 8.717 0.001 0.030 0 8.386 0.357 0.289
Fig. 11. BSE image of the Fe region in the Fe/MgO wetting cou-ple after the wetting test.
ISIJ International, Vol. 61 (2021), No. 9
© 2021 ISIJ 2388
alloy and each substrate:
A Cl O Cr r O Al2 3 2 32 2� � � ................. (23)
3 2 32 3MgO C� � �Cr r O Mg ................ (24)
MgO A C� � � � �l O Cr r O Al Mg2 3 2 38
3
4
32 ...... (25)
Formation reactions (23)–(25) were supposed to comprise the following phenomena: i) substrate dissolution and oxy-gen dissolution or absorption at the interface expressed in (9)–(11), and ii) Cr and oxygen reaction at the interface shown in (22). The equilibrium constants of Eqs. (23)–(25) are expressed as follows:
K
Al
a
Al
Cr23
2
2�� �� �� .......................... (26)
K
Mg
a
Mg
Cr24
3
2�� �� �� ......................... (27)
KMg
a
Al Mg
Cr
25
2
8
3
�� � � �� � � �� �Al
................. (28)
where the activity of the substrates and Cr2O3 was approxi-mated as 1. The standard Gibbs energy changes (ΔG0) are summarized in Table 2. The first- and second-order interac-tion parameters (Table 4) and EPMA point analysis at the interface (Table 5) were used to calculate the activity coef-ficient (γCr) and activity of Cr (aCr) in molten Fe–Cr–Ni alloy as 0.537 and 10.2 for Fe–Cr–Ni alloy/Al2O3, 0.576 and 10.7 for Fe–Cr–Ni alloy/MgO, and 0.110 and 2.12 for Fe–Cr–Ni alloy/MgO·Al2O3, respectively.
The solubility and the solubility product of Al and Mg with respect to Cr2O3 formation in Fe–Cr–Ni alloy were calculated as: [Al] of 0.873 ppm for Fe–Cr–Ni alloy/Al2O3, [Mg] of 0.170 ppm for Fe–Cr–Ni alloy/MgO, and [Mg][Al]2 of 7.00×10⁻⁴ (ppm)3 for Fe–Cr–Ni alloy/MgO·Al2O3. These values were calculated using Eqs. (19), (26)–(28), the activ-ity of Cr and the activity coefficient of Al and Mg for each metal/substrate couple, and the thermodynamic data given in Table 2. Overall, the Cr2O3 formation and corresponding Cr content in molten Fe–Cr–Ni alloy contributed to its higher reactivity with the substrates than that of pure Fe. This also
reduced the interfacial energy of molten Fe–Cr–Ni alloy than that of molten Fe.
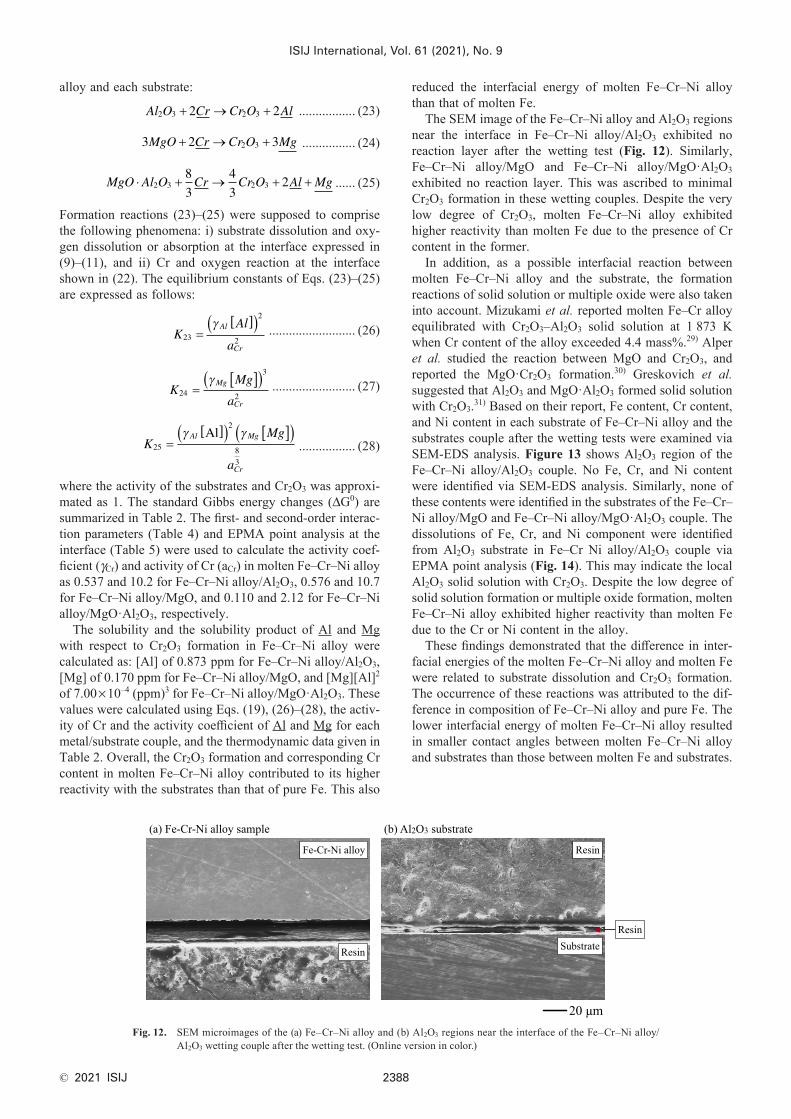
The SEM image of the Fe–Cr–Ni alloy and Al2O3 regions near the interface in Fe–Cr–Ni alloy/Al2O3 exhibited no reaction layer after the wetting test (Fig. 12). Similarly, Fe–Cr–Ni alloy/MgO and Fe–Cr–Ni alloy/MgO·Al2O3 exhibited no reaction layer. This was ascribed to minimal Cr2O3 formation in these wetting couples. Despite the very low degree of Cr2O3, molten Fe–Cr–Ni alloy exhibited higher reactivity than molten Fe due to the presence of Cr content in the former.
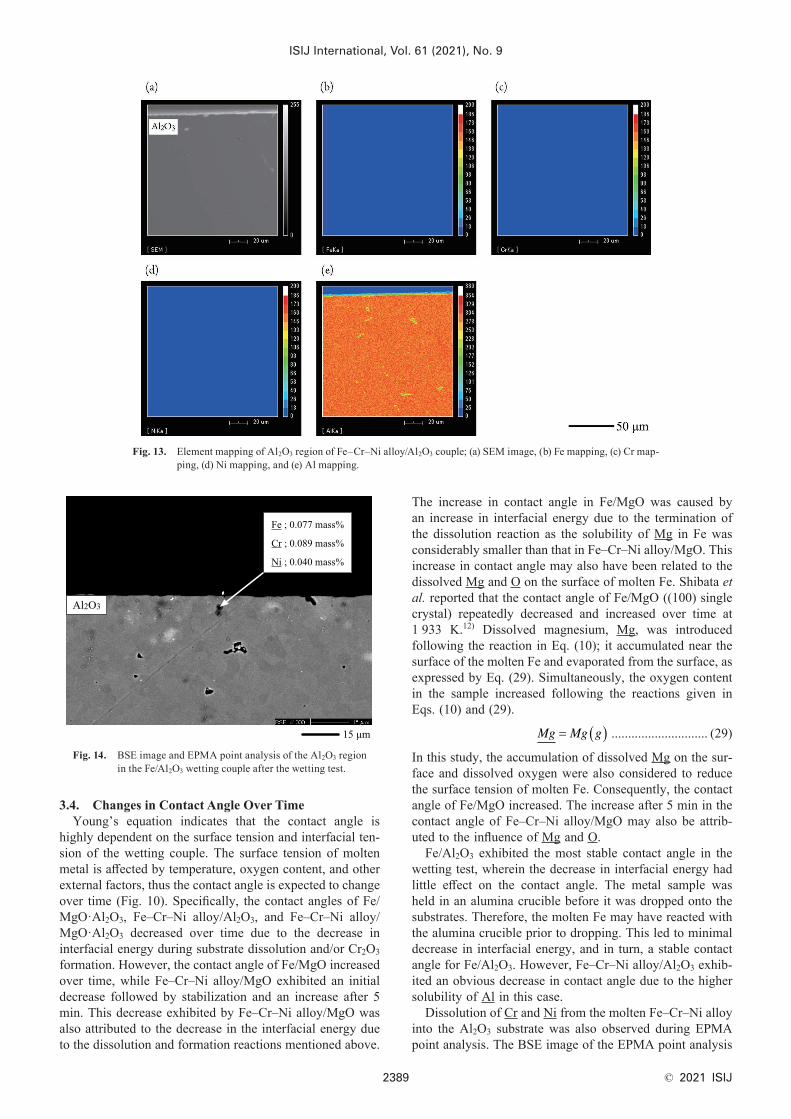
In addition, as a possible interfacial reaction between molten Fe–Cr–Ni alloy and the substrate, the formation reactions of solid solution or multiple oxide were also taken into account. Mizukami et al. reported molten Fe–Cr alloy equilibrated with Cr2O3–Al2O3 solid solution at 1 873 K when Cr content of the alloy exceeded 4.4 mass%.29) Alper et al. studied the reaction between MgO and Cr2O3, and reported the MgO·Cr2O3 formation.30) Greskovich et al. suggested that Al2O3 and MgO·Al2O3 formed solid solution with Cr2O3.31) Based on their report, Fe content, Cr content, and Ni content in each substrate of Fe–Cr–Ni alloy and the substrates couple after the wetting tests were examined via SEM-EDS analysis. Figure 13 shows Al2O3 region of the Fe–Cr–Ni alloy/Al2O3 couple. No Fe, Cr, and Ni content were identified via SEM-EDS analysis. Similarly, none of these contents were identified in the substrates of the Fe–Cr–Ni alloy/MgO and Fe–Cr–Ni alloy/MgO·Al2O3 couple. The dissolutions of Fe, Cr, and Ni component were identified from Al2O3 substrate in Fe–Cr Ni alloy/Al2O3 couple via EPMA point analysis (Fig. 14). This may indicate the local Al2O3 solid solution with Cr2O3. Despite the low degree of solid solution formation or multiple oxide formation, molten Fe–Cr–Ni alloy exhibited higher reactivity than molten Fe due to the Cr or Ni content in the alloy.
These findings demonstrated that the difference in inter-facial energies of the molten Fe–Cr–Ni alloy and molten Fe were related to substrate dissolution and Cr2O3 formation. The occurrence of these reactions was attributed to the dif-ference in composition of Fe–Cr–Ni alloy and pure Fe. The lower interfacial energy of molten Fe–Cr–Ni alloy resulted in smaller contact angles between molten Fe–Cr–Ni alloy and substrates than those between molten Fe and substrates.
Fig. 12. SEM microimages of the (a) Fe–Cr–Ni alloy and (b) Al2O3 regions near the interface of the Fe–Cr–Ni alloy/Al2O3 wetting couple after the wetting test. (Online version in color.)
ISIJ International, Vol. 61 (2021), No. 9
© 2021 ISIJ2389
3.4. Changes in Contact Angle Over TimeYoung’s equation indicates that the contact angle is
highly dependent on the surface tension and interfacial ten-sion of the wetting couple. The surface tension of molten metal is affected by temperature, oxygen content, and other external factors, thus the contact angle is expected to change over time (Fig. 10). Specifically, the contact angles of Fe/MgO·Al2O3, Fe–Cr–Ni alloy/Al2O3, and Fe–Cr–Ni alloy/MgO·Al2O3 decreased over time due to the decrease in interfacial energy during substrate dissolution and/or Cr2O3 formation. However, the contact angle of Fe/MgO increased over time, while Fe–Cr–Ni alloy/MgO exhibited an initial decrease followed by stabilization and an increase after 5 min. This decrease exhibited by Fe–Cr–Ni alloy/MgO was also attributed to the decrease in the interfacial energy due to the dissolution and formation reactions mentioned above.
The increase in contact angle in Fe/MgO was caused by an increase in interfacial energy due to the termination of the dissolution reaction as the solubility of Mg in Fe was considerably smaller than that in Fe–Cr–Ni alloy/MgO. This increase in contact angle may also have been related to the dissolved Mg and O on the surface of molten Fe. Shibata et al. reported that the contact angle of Fe/MgO ((100) single crystal) repeatedly decreased and increased over time at 1 933 K.12) Dissolved magnesium, Mg, was introduced following the reaction in Eq. (10); it accumulated near the surface of the molten Fe and evaporated from the surface, as expressed by Eq. (29). Simultaneously, the oxygen content in the sample increased following the reactions given in Eqs. (10) and (29).
Mg g� � �Mg ............................. (29)
In this study, the accumulation of dissolved Mg on the sur-face and dissolved oxygen were also considered to reduce the surface tension of molten Fe. Consequently, the contact angle of Fe/MgO increased. The increase after 5 min in the contact angle of Fe–Cr–Ni alloy/MgO may also be attrib-uted to the influence of Mg and O.
Fe/Al2O3 exhibited the most stable contact angle in the wetting test, wherein the decrease in interfacial energy had little effect on the contact angle. The metal sample was held in an alumina crucible before it was dropped onto the substrates. Therefore, the molten Fe may have reacted with the alumina crucible prior to dropping. This led to minimal decrease in interfacial energy, and in turn, a stable contact angle for Fe/Al2O3. However, Fe–Cr–Ni alloy/Al2O3 exhib-ited an obvious decrease in contact angle due to the higher solubility of Al in this case.
Dissolution of Cr and Ni from the molten Fe–Cr–Ni alloy into the Al2O3 substrate was also observed during EPMA point analysis. The BSE image of the EPMA point analysis
Fig. 13. Element mapping of Al2O3 region of Fe–Cr–Ni alloy/Al2O3 couple; (a) SEM image, (b) Fe mapping, (c) Cr map-ping, (d) Ni mapping, and (e) Al mapping.
Fig. 14. BSE image and EPMA point analysis of the Al2O3 region in the Fe/Al2O3 wetting couple after the wetting test.

ISIJ International, Vol. 61 (2021), No. 9
© 2021 ISIJ 2390
indicated that the Cr and Ni in the molten Fe–Cr–Ni alloy led to higher reactivity than that of pure Fe (Fig. 14). There-fore, the decrease in contact angle observed for Fe–Cr–Ni alloy/Al2O3 occurred despite the interaction between the Fe–Cr–Ni alloy and alumina crucible.
The changes in contact angle may also have been related to dynamic changes in the interfacial energy due to oxy-gen absorption at the interface. Tanaka et al. proposed a dynamic change model for the interfacial energy between liquid Fe alloy and molten slag.32,33) The model was based on oxygen absorption due to reduction/oxidation reac-tions between the liquid Fe alloy and molten slag, and the decomposition and dissolution of the slag into the liquid Fe alloy. Oxygen was likely produced in the present study via substrate dissolution. Therefore, oxygen absorbed at the metal/substrate interface may have affected the interfacial energies and contact angles. Further, oxygen absorption on the surface of the molten metal has also been highlighted. Dissolved oxygen generated by substrate dissolution or atmospheric dissolution may have accumulated on the molten metal surface because oxygen is an interface active element. Therefore, the change in contact angle may have been affected by the change in surface tension caused by dissolved oxygen on the surface.
4. Conclusion
Wetting tests were conducted between molten Fe and Fe–Cr–Ni alloy, and non-metallic inclusion-type oxides, viz. Al2O3, MgO, and MgO·Al2O3 substrates, in an Ar atmosphere at 1 873 K. The contact angles were measured, and interfacial energies were evaluated for each wetting couple. Furthermore, the wetting samples were observed using SEM, and the composition of metallic samples was determined via EPMA point analysis. The major findings are summarized as follows:
(1) Molten Fe exhibited contact angles of 114°, 111°, and 117° with Al2O3, MgO, and MgO·Al2O3 substrates, respectively, while those of molten Fe–Cr–Ni alloy with the same substrates were 105°, 103°, and 103°, respectively. The difference in contact angles indicated that the wettabil-ity between molten Fe–Cr–Ni alloy and all three substrates was superior to that between molten Fe and the substrates.
(2) The interfacial energies of molten Fe were 1 862, 2 388, and 2 781 mN·m −1 on the Al2O3, MgO, and MgO·Al2O3 substrates, respectively, while those of molten Fe–Cr–Ni alloy were 1 513, 2 075, and 2 286 mN·m −1, respectively. The differences in contact angle were attrib-uted to interfacial energy, and in turn, the interfacial tension; the interfacial energy values calculated by Young’s equation were smaller for molten Fe–Cr–Ni alloy with respect to all three substrates than those for molten Fe.
(3) The differences in interfacial energy were attributed to the higher reactivity of Fe–Cr–Ni alloy with all three substrates than that of pure Fe.
Overall, several factors were considered to contribute to the change in the contact angle, and in turn, the interfacial energy. However, it was difficult to identify the critical factor in the dynamic change of contact angle, and further investigation is required.
REFERENCES
1) J. H. Park and H. Todoroki: ISIJ Int., 50 (2010), 1333. https://doi.org/10.2355/isijinternational.50.1333
2) K. Sasai: ISIJ Int., 54 (2014), 2780. https://doi.org/10.2355/isijinternational.54.2780
3) A. Harada, A. Matsui and S. Nabeshima: Tetsu-to-Hagané, 105 (2019), 1042 (in Japanese).
4) M. Hino: Denki Seiko (Electr. Furn. Steel), 72 (2001), 13 (in Japanese). https://doi.org/10.4262/denkiseiko.72.13
5) K. Sasai: Tetsu-to-Hagané, 104 (2018), 417 (in Japanese). https://doi.org/10.2355/tetsutohagane.TETSU-2018-015
6) M. Nakamoto, T. Tanaka, M. Suzuki, K. Taguchi, Y. Tsukaguchi and T. Yamamoto: ISIJ Int., 54 (2014), 1195. https://doi.org/10.2355/isijinternational.54.1195
7) M. Kitayama, K. Hirao, M. Toriyama and S. Kanzaki: Acta Mater., 46 (1998), 6541. https://doi.org/10.1016/s1359-6454(98)00290-0
8) K. Nakashima, K. Takihira, K. Mori and N. Shinozaki: J. Jpn. Inst. Met. , 55 (1991), 1199 (in Japanese). https://doi.org/10.2320/jinstmet1952.55.11_1199
9) N. Takiuchi, T. Taniguchi, Y. Tanaka, N. Shinozaki and K. Mukai: J. Jpn. Inst. Met., 55 (1991), 180 (in Japanese). https://doi.org/10.2320/jinstmet1952.55.2_180
10) N. Takiuchi, T. Taniguchi, N. Shinozaki and K. Mukai: J. Jpn. Inst. Met., 55 (1991), 44 (in Japanese). https://doi.org/10.2320/jinstmet1952.55.1_44
11) K. Ogino, A. Adachi and K. Nogi: Tetsu-to-Hagané, 59 (1973), 1237 (in Japanese).
12) H. Shibata, Y. Watanabe, K. Nakajima and S. Kitamura: ISIJ Int., 49 (2009), 985. https://doi.org/10.2355/isijinternational.49.985
13) C. Xuan, H. Shibata, S. Sukenaga, P. G. Jönsson and K. Nakajima: ISIJ Int., 55 (2015), 1882. https://doi.org/10.2355/isijinternational.ISIJINT-2014-820
14) M. Shin, J. Lee and J. H. Park: ISIJ Int., 48 (2008), 1665. https://doi.org/10.2355/isijinternational.48.1665
15) P. Shen, L. F. Zhang, H. Zhou, Y. Ren and Y. Wang: Ceram. Int., 43 (2017), 7674. https://doi.org/10.1016/j.ceramint.2017.03.067
16) N. Fukami, R. Wakamatsu, N. Shinozaki and K. Wasai: J. Jpn. Inst. Met., 74 (2010), 650 (in Japanese). https://doi.org/10.2320/jinstmet.74.650
17) J. Choe, H. G. Kim, Y. Kang and J. Lee: Metall. Mater. Trans. B, 45 (2014), 1589. https://doi.org/10.1007/s11663-014-0166-0
18) E. Z. Gao, G. Zou, W. L. Wang, F. J. Ma and X. C. Luo: Metall. Mater. Trans. B, 48 (2017), 1014. https://doi.org/10.1007/s11663-016-0898-0
19) K. Mukai, Z. Li and M. Zeze: Mater. Trans., 43 (2002), 1724. https://doi.org/10.2320/matertrans.43.1724
20) J. Lee, M. Shin, J. H. Park and S. Seetharaman: Ironmak-ing Steelmaking, 37 (2010), 512. https://doi.org/10.1179/030192310X12700328925868
21) S. Ozawa, K. Morohoshi and T. Hibiya: ISIJ Int., 54 (2014), 2097. https://doi.org/10.2355/isijinternational.54.2097
22) The Japan Institute of Metals and Materials: Ferrous Process Metal-lurgy, Maruzen, Tokyo, (2000), 76 (in Japanese).
23) P. Nikolopoulos: J. Mater. Sci., 20 (1985), 3993. https://doi.org/10.1007/BF00552390
24) R. H. Bruce: Science of Ceramics, Proc. 2nd Conf. Held under the Auspices of the British Ceramic Society and the Nederlandse Keramische Vereniging, Vol. 2, ed. by G. H. Stewart, Academic Press, London, (1965), 359.
25) K. Ogino, K. Nogi and Y. Koshida: Tetsu-to-Hagané, 59 (1973), 1380 (in Japanese). https://doi.org/10.2355/tetsutohagane1955.59.10_1380
26) H. Sakao and K. Mukai: Tetsu-to-Hagané, 63 (1977), 513 (in Japanese). https://doi.org/10.2355/tetsutohagane1955.63.3_513
27) K. Ogino, H. Taimatsu and F. Nakatani: J. Jpn. Inst. Met., 46 (1982), 1049 (in Japanese). https://doi.org/10.2320/jinstmet1952.46.11_1049
28) M. Hino and K. Ito: Thermodynamic Data for Steelmaking, Tohoku University Press, Sendai, (2010), 72.
29) Y. Mizukami, T. Miki and M. Hino: ISIJ Int., 52 (2012), 2007. https://doi.org/10.2355/isijinternational.52.2007
30) A. M. Alper, R. N. McNally, R. C. Doman and F. G. Keihn: J. Am. Ceram. Soc., 47 (1964), 30. https://doi.org/10.1111/j.1151-2916.1964.tb14636.x
31) C. Greskovich and V. S. Stubican: J. Am. Ceram. Soc., 51 (1968), 42. https://doi.org/10.1111/j.1151-2916.1968.tb11826.x
32) T. Tanaka, H. Goto, M. Nakamoto, M. Suzuki, M. Hanao, M. Zeze, H. Yamamura and T. Yoshikawa: ISIJ Int., 56 (2016), 944. https://doi.org/10.2355/isijinternational.ISIJINT-2015-654
33) T. Tanaka, H. Goto, M. Nakamoto, M. Suzuki, M. Hanao, M. Zeze, H. Yamamura and T. Yoshikawa: Tetsu-to-Hagané, 106 (2020), 133 (in Japanese). https://doi.org/10.2355/tetsutohagane.TETSU-2019-057
34) The Japan Society for the Promotion of Science, The 19th Commit-tee on Steelmaking: Steelmaking Data Sourcebook, Revised ed., The Japan Society for the Premotion of Science, The 19th committee on the Steelmaking, Tokyo, (1984), 38 (in Japanese).