ntp technical report on the toxicity studies of benzophenone
TRANSCRIPT

National Toxicology Program Toxicity Report Series Number 61
NTP Technical Report
on the Toxicity Studies of
Benzophenone (CAS No. 119-61-9)
Administered in Feed
to F344/N Rats and B6C3F1 Mice
April 2000
U.S. Department of Health and Human Services Public Health Service
National Institutes of Health

FOREWORD
The National Toxicology Program (NTP) is made up of four charter agencies of the U.S. Department of Health and Human Services (DHHS): the National Cancer Institute (NCI), National Institutes of Health; the National Institute of Environmental Health Sciences (NIEHS), National Institutes of Health; the National Center for Toxicological Research (NCTR), Food and Drug Administration; and the National Institute for Occupational Safety and Health (NIOSH), Centers for Disease Control and Prevention. In July 1981, the Carcinogenesis Bioassay Testing Program, NCI, was transferred to the NIEHS. The NTP coordinates the relevant programs, staff, and resources from these Public Health Service agencies relating to basic and applied research and to biological assay development and validation.
The NTP develops, evaluates, and disseminates scientific information about potentially toxic and hazardous chemicals. This knowledge is used for protecting the health of the American people and for the primary prevention of disease.
The studies described in this Toxicity Study Report were performed under the direction of the NIEHS and were conducted in compliance with NTP laboratory health and safety requirements and must meet or exceed all applicable federal, state, and local health and safety regulations. Animal care and use were in accordance with the Public Health Service Policy on Humane Care and Use of Animals.
These studies are designed and conducted to characterize and evaluate the toxicologic potential of selected chemicals in laboratory animals (usually two species, rats and mice). Chemicals selected for NTP toxicology studies are chosen primarily on the bases of human exposure, level of production, and chemical structure. The interpretive conclusions presented in this Toxicity Study Report are based only on the results of these NTP studies. Extrapolation of these results to other species and quantitative risk analyses for humans require wider analyses beyond the purview of these studies. Selection per se is not an indicator of a chemical’s toxic potential.
Listings of all published NTP reports and ongoing studies are available from NTP Central Data Management, NIEHS, P.O. Box 12233, MD E1-02, Research Triangle Park, NC 27709 (919-541-3419). Other information about NTP studies is available at the NTP’s World Wide Web site: http://ntp-server.niehs.nih.gov.

National Toxicology Program Toxicity Report Series
Number 61
NTP Technical Report on the Toxicity Studies of
Benzophenone (CAS No. 119-61-9)
Administered in Feed to F344/N Rats and B6C3F1 Mice
Rajendra S. Chhabra, Ph.D., Study Scientist
April 2000
NIH Publication No. 00-3943
U.S. Department of Health and Human Services Public Health Service
National Institutes of Health

2
CONTRIBUTORS
National Toxicology Program Evaluated and interpreted results and reported findings
R.S. Chhabra, Ph.D., Study Scientist
J.R. Bucher, Ph.D. R.E. Chapin, Ph.D. J. Mahler, D.V.M. C.S. Smith, Ph.D. G.S. Travlos, D.V.M. K.L. Witt, M.S., Integrated Laboratory Systems, Inc.
Battelle Columbus Laboratories Conducted studies and evaluated pathology findings
P.J. Kurtz, Ph.D., Principal Investigator
G.B. Freeman, Ph.D. J.D. Toft II, D.V.M., M.S. J.T. Yarrington, D.V.M., Ph.D.
NTP Pathology Working Group Evaluated slides and prepared pathology report (15 December 1995)
P.K. Hildebrandt, D.V.M., Chairperson PATHCO, Inc.
D. Dixon, D.V.M., Ph.D. National Toxicology Program
J. Mahler, D.V.M. National Toxicology Program
D.E. Malarkey, D.V.M. National Toxicology Program
J.S. Prescott Matthews, D.V.M., Ph.D., Observer Chemical Industry Institute of Toxicology
A. Radovsky, D.V.M., Ph.D. National Toxicology Program
D. Wolf, D.V.M., Ph.D. Chemical Industry Institute of Toxicology
Experimental Pathology Laboratories, Inc. Provided pathology quality assurance
J.F. Hardisty, D.V.M., Principal Investigator
S. Botts, D.V.M., Ph.D.
Environmental Health Research and Testing, Inc. Provided sperm morphology and vaginal cytology evaluations
T. Cocanougher, B.A. D.K. Gulati, Ph.D. S. Russell, B.A.
Analytical Sciences, Inc. Provided statistical analyses
R.W. Morris, M.S., Principal Investigator
D.E. Kendrick., M.S. K.P. McGowan, M.B.A. J.T. Scott, M.S.
Biotechnical Services, Inc. Prepared Toxicity Study Report
S.R. Gunnels, M.A., Principal Investigator
A.M. Macri-Hanson, M.A., M.F.A. E.S. Paal, M.S.J. M.L. Rainer, B.S. W.D. Sharp, B.A., B.S. S.M. Swift, B.S.

3
PEER REVIEW
The draft report on the toxicity studies of benzophenone was evaluated by the reviewers listed below. These reviewers serve as independent scientists, not as representatives of any institution, company, or governmental agency. In this capacity, reviewers determine if the design and conditions of these NTP studies are appropriate and ensure that the Toxicity Study Report presents the experimental results and conclusions fully and clearly.
George Burdock, Ph.D. John M. Cullen, Ph.D., V.M.D. Consultant Department of Microbiology, Parasitology and Pathology Vero Bleach, FL College of Veterinary Medicine
North Carolina State University Raleigh, NC

4
CONTENTS
ABSTRACT . . . . . . . . . . . . . . . . . . . . . . . . . . . . . . . . . . . . . . . . . . . . . . . . . . . . . . . . 5
INTRODUCTION . . . . . . . . . . . . . . . . . . . . . . . . . . . . . . . . . . . . . . . . . . . . . . . . . . . . 7 Physical Properties . . . . . . . . . . . . . . . . . . . . . . . . . . . . . . . . . . . . . . . . . . . . . . . . . . 7 Production, Use, and Human Exposure . . . . . . . . . . . . . . . . . . . . . . . . . . . . . . . . . . . . . 7 Disposition and Metabolism . . . . . . . . . . . . . . . . . . . . . . . . . . . . . . . . . . . . . . . . . . . . 8 Toxicity . . . . . . . . . . . . . . . . . . . . . . . . . . . . . . . . . . . . . . . . . . . . . . . . . . . . . . . . . 8 Developmental and Reproductive Effects . . . . . . . . . . . . . . . . . . . . . . . . . . . . . . . . . . . . 10 Carcinogenicity . . . . . . . . . . . . . . . . . . . . . . . . . . . . . . . . . . . . . . . . . . . . . . . . . . . . 10
Genetic Toxicity . . . . . . . . . . . . . . . . . . . . . . . . . . . . . . . . . . . . . . . . . . . . . . . . . . . 11 Study Rationale and Design . . . . . . . . . . . . . . . . . . . . . . . . . . . . . . . . . . . . . . . . . . . . 11
MATERIALS AND METHODS . . . . . . . . . . . . . . . . . . . . . . . . . . . . . . . . . . . . . . . . . . . 13 Procurement and Characterization of Benzophenone . . . . . . . . . . . . . . . . . . . . . . . . . . . . 13 Preparation and Analysis of Dose Formulations . . . . . . . . . . . . . . . . . . . . . . . . . . . . . . . 13 14-Week Studies . . . . . . . . . . . . . . . . . . . . . . . . . . . . . . . . . . . . . . . . . . . . . . . . . . . 14 Statistical Methods . . . . . . . . . . . . . . . . . . . . . . . . . . . . . . . . . . . . . . . . . . . . . . . . . . 19 Quality Assurance . . . . . . . . . . . . . . . . . . . . . . . . . . . . . . . . . . . . . . . . . . . . . . . . . . 20 Genetic Toxicology . . . . . . . . . . . . . . . . . . . . . . . . . . . . . . . . . . . . . . . . . . . . . . . . . 20
RESULTS . . . . . . . . . . . . . . . . . . . . . . . . . . . . . . . . . . . . . . . . . . . . . . . . . . . . . . . . . . 23 Rats . . . . . . . . . . . . . . . . . . . . . . . . . . . . . . . . . . . . . . . . . . . . . . . . . . . . . . . . . . . 23 Mice . . . . . . . . . . . . . . . . . . . . . . . . . . . . . . . . . . . . . . . . . . . . . . . . . . . . . . . . . . . 33 Genetic Toxicology . . . . . . . . . . . . . . . . . . . . . . . . . . . . . . . . . . . . . . . . . . . . . . . . . 39
DISCUSSION . . . . . . . . . . . . . . . . . . . . . . . . . . . . . . . . . . . . . . . . . . . . . . . . . . . . . . . 41
REFERENCES . . . . . . . . . . . . . . . . . . . . . . . . . . . . . . . . . . . . . . . . . . . . . . . . . . . . . . 47
APPENDIXES
Appendix A Summary of Nonneoplastic Lesions in Rats and Mice . . . . . . . . . . . . . . . . . A-1
Appendix B Clinical Pathology Results . . . . . . . . . . . . . . . . . . . . . . . . . . . . . . . . . . B-1
Appendix C Organ Weights and Organ-Weight-to-Body-Weight Ratios . . . . . . . . . . . . . . C-1
Appendix D Reproductive Tissue Evaluations and Estrous Cycle Characterization . . . . . . . D-1
Appendix E Cytochrome P450 Analysis Results . . . . . . . . . . . . . . . . . . . . . . . . . . . . . E-1
Appendix F Genetic Toxicology . . . . . . . . . . . . . . . . . . . . . . . . . . . . . . . . . . . . . . . F-1
O
C
5
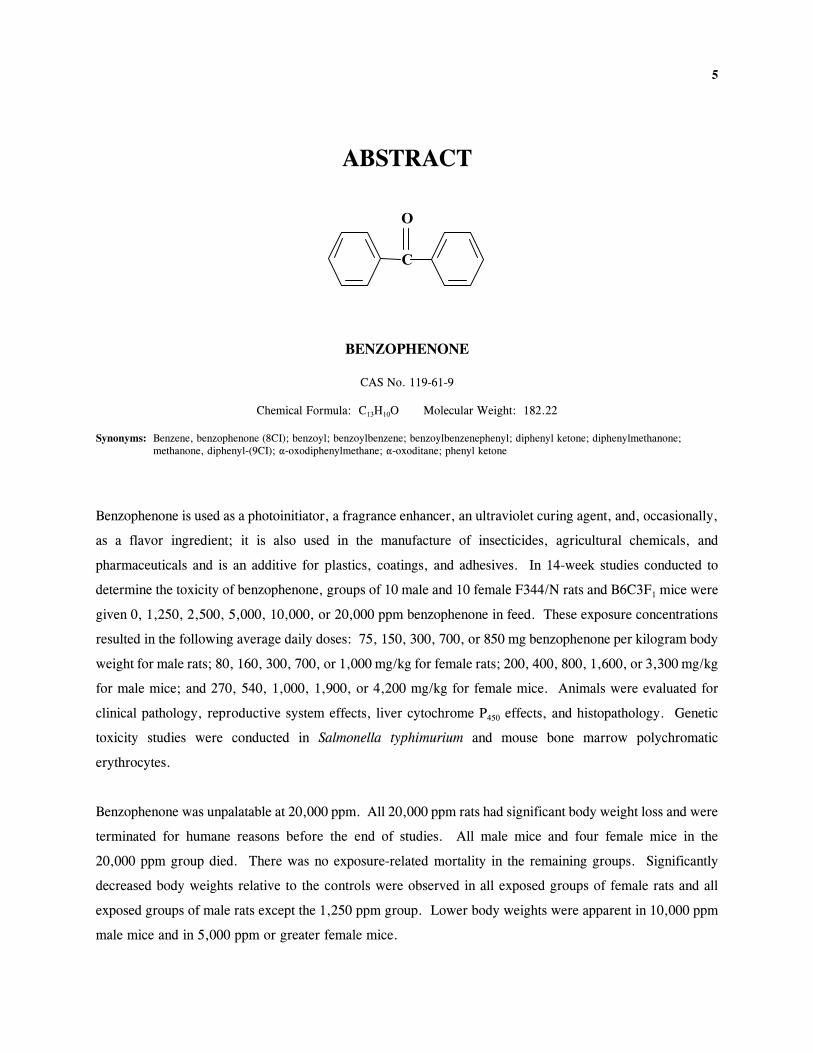
ABSTRACT
BENZOPHENONE
CAS No. 119-61-9
Chemical Formula: C13H10O Molecular Weight: 182.22
Synonyms: Benzene, benzophenone (8CI); benzoyl; benzoylbenzene; benzoylbenzenephenyl; diphenyl ketone; diphenylmethanone; methanone, diphenyl-(9CI); "-oxodiphenylmethane; "-oxoditane; phenyl ketone
Benzophenone is used as a photoinitiator, a fragrance enhancer, an ultraviolet curing agent, and, occasionally,
as a flavor ingredient; it is also used in the manufacture of insecticides, agricultural chemicals, and
pharmaceuticals and is an additive for plastics, coatings, and adhesives. In 14-week studies conducted to
determine the toxicity of benzophenone, groups of 10 male and 10 female F344/N rats and B6C3F1 mice were
given 0, 1,250, 2,500, 5,000, 10,000, or 20,000 ppm benzophenone in feed. These exposure concentrations
resulted in the following average daily doses: 75, 150, 300, 700, or 850 mg benzophenone per kilogram body
weight for male rats; 80, 160, 300, 700, or 1,000 mg/kg for female rats; 200, 400, 800, 1,600, or 3,300 mg/kg
for male mice; and 270, 540, 1,000, 1,900, or 4,200 mg/kg for female mice. Animals were evaluated for
clinical pathology, reproductive system effects, liver cytochrome P450 effects, and histopathology. Genetic
toxicity studies were conducted in Salmonella typhimurium and mouse bone marrow polychromatic
erythrocytes.
Benzophenone was unpalatable at 20,000 ppm. All 20,000 ppm rats had significant body weight loss and were
terminated for humane reasons before the end of studies. All male mice and four female mice in the
20,000 ppm group died. There was no exposure-related mortality in the remaining groups. Significantly
decreased body weights relative to the controls were observed in all exposed groups of female rats and all
exposed groups of male rats except the 1,250 ppm group. Lower body weights were apparent in 10,000 ppm
male mice and in 5,000 ppm or greater female mice.

6 Benzophenone, NTP TOX 61
In rats, the liver and kidney were identified as target organs of benzophenone toxicity. Treatment-related
increases in liver weights were attributed to hypertrophy and/or cytoplasmic vacuolization of hepatocytes.
Increased kidney weights were associated with a spectrum of renal changes in exposed males and females.
Unique lesions observed in animals that died early as well as in survivors were well demarcated, wedge-shaped
areas of prominent tubule dilatation. The lesion occurred in 2,500 ppm or greater males and in 10,000 and
20,000 ppm females. Foci of tubule regeneration were increased relative to the controls in exposed males and
females.
In exposed mice, significant microscopic findings were limited to centrilobular hypertrophy in the liver that
corresponded to increased liver weights. The severity of hepatocyte hypertrophy was exposure-concentration
dependent, with marked severity in all 20,000 ppm animals.
Clinical chemistry analyses confirmed liver toxicity. In rats, increases in serum bile salt concentrations
indicated cholestatic liver disease. On day 22, a 15-fold increase was evident in the 20,000 ppm groups, and
at week 14, a twofold increase was seen in the 10,000 ppm groups. Increases in alanine aminotransferase and
sorbitol dehydrogenase activities were mild in mice; however, more convincing of liver damage were increased
alkaline phosphatase activities and serum bile salt concentrations, especially in 20,000 ppm females.
Biochemical data indicated that benzophenone was a relatively potent inducer of the phenobarbital-type (2B)
cytochrome P450 enzymes. Overall, induction was greater in rats than in mice. The gross (increased organ
weights) and microscopic (hepatocellular hypertrophy) liver changes associated with benzophenone
administration in rats and mice accompanied benzophenone-induced increases in pentoxyresorufin dealkylase
activity.
Benzophenone was not mutagenic in S. typhimurium strain TA98, TA100, TA1535, or TA1537, with or
without S9 activation, and it did not induce micronuclei in bone marrow erythrocytes of male mice administered
benzophenone by intraperitoneal injection.
In conclusion, the liver is the primary target organ of benzophenone toxicity in rats and mice based on increases
in liver weights, hepatocellular hypertrophy, clinical chemistry changes, and induction of liver microsomal
cytochrome P450 2B isomer. The kidney was also identified as a target organ of benzophenone toxicity in rats
only, based on exposure concentration-related increases in kidney weights and microscopic changes. The no-
observed-adverse-effect level for benzophenone was not achieved in these studies.

7
INTRODUCTION
PHYSICAL PROPERTIES
Benzophenone, a white crystal with a geranium- or rose-like odor, is an aryl ketone that is prepared in 66%
yield by a Friedel-Crafts acylation using benzoyl chloride with an excess of benzene in the presence of
anhydrous aluminum chloride (Furia and Bellanca, 1975; Kirk-Othmer, 1978; Merck Index, 1996). Some of
the physical properties of benzophenone are given in Table 1. Benzophenone is photochemically reactive and
is incompatible with strong oxidizing and reducing agents; it may attack some plastics. Decomposition of
benzophenone produces toxic fumes of carbon monoxide and carbon dioxide (Sigma-Aldrich, 1988).
TABLE 1 Physical Properties of Benzophenonea
Molecular weight 182.22
Boiling point 305.4E C
Melting point (") = 49E C; ($) = 26E C
Flash point greater than 110E C
Vapor pressure 1 mm Hg at 108.2E C
Specific gravity d(") = 1.0976 at 50E/50E C; d($) = 1.108 at 23E/40E C
Refractive index 1.60
Log octanol/water partition coefficient 3.18
Solubility Insoluble in water; soluble in organic solvents including alcohol, acetone, ether, acetic acid, chloroform, and benzene
a Merck Index (1996); Hazardous Chemicals Desk Reference (1997); Hansch and Leo (1979)
PRODUCTION, USE, AND HUMAN EXPOSURE
Benzophenone is used primarily as a photoinitiator and fragrance enhancer (Am. Paint Coatings J., 1990;
Chem. Bus. Newsbase, 1991). Production of benzophenone in the United States is estimated to range from
300,000 to 3,000,000 pounds per year (USEPA, 1991), with 100,000 pounds per year used in fragrances
(Opdyke, 1973). Benzophenone is used in the manufacture of insecticides and agricultural chemicals and of
hypnotics, antihistamines, and other pharmaceuticals; as an ultraviolet curing agent in sunglasses and ink; as
an additive in plastics, coatings, and adhesive formulations; and, occasionally, as a flavor ingredient.
Concentrations of benzophenone in food products range from 0.57 ppm in nonalcoholic beverages to 3.27 ppm

8 Benzophenone, NTP TOX 61
in frozen dairy products; it may also be an ingredient in baked goods, soft candy, gelatins, and puddings
(NAS/NRC, 1979).
Because of its high octanol/water partition coefficient and its insolubility in water, benzophenone will partition
in soil and sediment (USEPA, 1984); the adsorption of benzophenone to soil is proportional to the organic
content of the soil (OHMTADS, 1991). Although benzophenone has been identified in the atmosphere, it is
difficult to determine whether its presence is due to its being a direct product of combustion or a secondary
product of atmospheric degradation (Helmig et al., 1989). Leary et al. (1987) found that benzophenone is a
component of emissions from a standard residential oil burner. It has also been detected in surface and ground
water samples, primarily from the discharge of untreated sewage and wastewater into waterways.
Based on the use of benzophenone as an additive in fragrances, cosmetics, toiletries, pharmaceuticals,
insecticides, and flavor ingredients, consumer exposure may be significant. Additionally, surveys by the
National Institute for Occupational Safety and Health (1990) showed that 41,520 workers in the United States
were potentially exposed to benzophenone between 1981 and 1983.
DISPOSITION AND METABOLISM
In rhesus monkeys, percutaneous absorption of benzophenone was found to be 44% and 69% for unoccluded
and occluded sites, respectively (Bronaugh et al., 1990). The primary pathway of benzophenone metabolism
following dietary administration in rabbits was reported to be reduction of the keto group to yield benzhydrol,
which was excreted at concentrations of 41% to 61% of the administered dose as a labile glucuronide in the
urine (Robinson and Williams, 1957; Robinson, 1958). In male Sprague-Dawley rats that received
benzophenone by gavage, 1% of the administered dose was detected as p-hydroxybenzophenone in enzyme-
treated urine samples, but not in unhydrolyzed urine (Stocklinski et al., 1979). No p-hydroxybenzophenone
was detected in the feces.
TOXICITY
Experimental Animals
Median lethal oral, intraperitoneal, and dermal doses (LD50) of benzophenone are given in Table 2; these data
indicate that benzophenone is only slightly toxic.

9 Benzophenone, NTP TOX 61
TABLE 2 Summary of Selected Animal Toxicity Data for Benzophenone
Route of Species Exposure LD50 (mg/kg) Reference
Rat Oral >10,000 Opdyke, 1973 Rat Oral 1,900 Eastman Kodak Company, 1991 Mouse Oral 2,895 (2,441-3,434) Caprino et al., 1976 Mouse Intraperitoneal 727 (634-833) Caprino et al., 1976 Rabbit Dermal 3,535 (2,007-6,226) Opdyke, 1973
Groups of male rats (strain not specified) were fed diets containing 0.1% or 1.0% benzophenone for
10 consecutive days. Feed consumption and body weights were slightly reduced in the 1.0% group. Exposure
concentration-dependent increases in absolute and relative liver weights and relative kidney weight were
observed. Serum alanine aminotransferase activity of rats in the 1.0% group was increased compared to that
of the controls. Mild degenerative effects were observed in the liver and bone marrow of rats in the
1.0% group, suggesting that the liver may be the primary target of the toxic effects of benzophenone and that
the bone marrow may also be targeted (USEPA, 1984).
Benzophenone was administered in feed to Sprague-Dawley rats at concentrations of 20 mg/kg body weight per
day for 90 days or 100 or 500 mg/kg per day for 28 days (Burdock et al., 1991). Decreases in hematocrit
values, erythrocyte counts, and hemoglobin concentrations were observed in females in the 100 and 500 mg/kg
groups; a decrease in hemoglobin concentration was also evident in males in the 500 mg/kg group. Males in
the 100 and 500 mg/kg groups had increased urea nitrogen concentrations; total bilirubin and protein were
increased in males in the 500 mg/kg group and females in the 100 and 500 mg/kg groups. Males and females
exposed to 100 or 500 mg/kg had increased albumin concentrations and absolute and relative liver and kidney
weights. Histopathologic examination of the liver revealed hepatocellular enlargement with associated clumping
of cytoplasmic basophilic material around the central vein in rats in the 100 and 500 mg/kg groups.
Slight skin irritation, evidenced by slight erythema and desquamation and slight to moderate edema, was
observed in guinea pigs that received dermal applications of benzophenone on the abdomen for 24 hours, under
an occlusive wrap, or on the back, uncovered, for 10 days (USEPA, 1984). Additional exposures to
benzophenone failed to exacerbate the irritation, and no evidence of percutaneous absorption was reported. In
a dermal study using the Draize method (Calas et al., 1977), benzophenone was determined to have medium
irritation potential, with a primary cutaneous irritation index of 2.0 in rabbits. Additional experiments were
conducted in guinea pigs to determine skin irritation and contact hypersensitivity induced by benzophenone; in
10 Benzophenone, NTP TOX 61
the open epicutaneous test, the Draize test, the maximization test, and a test with Freund’s complete adjuvant,
benzophenone did not induce allergenicity in guinea pigs.
Acetophenone, which is structurally related to benzophenone, was tested for toxicity and tissue effects in rats
fed diets containing up to 10,000 ppm for 17 weeks. No hematologic changes or gross or microscopic tissue
changes were observed in exposed rats (IRIS, 1991).
Humans
No information on toxic effects of benzophenone in humans was found in a search of the literature (HSDB,
1997).
DEVELOPMENTAL AND REPRODUCTIVE EFFECTS
The developmental and teratogenic effects of benzophenone were studied in Japanese newts. Seven days after
the forelimb was amputated at a position proximal to the elbow, benzophenone was inserted in the anterior part
of the regeneration blastema. No retardation of regeneration was observed, and growth continued normally
in the dosed group (Tsonis and Eguchi, 1982). Up to 10,000 ppm acetophenone administered in feed for
17 weeks caused no growth effects in rats (IRIS, 1991). No data were available in the literature on the
reproductive toxicity of benzophenone.
CARCINOGENICITY
Experimental Animals
The carcinogenicity of benzophenone has been studied in female Swiss mice (Stenbäck and Shubik, 1974) and
New Zealand white rabbits (Stenbäck, 1977). In lifetime studies, animals were administered 5%, 25%, or 50%
benzophenone in acetone topically at dose volumes of 0.02 mL twice per week. Benzophenone was applied
to a 1-inch square area on the dorsal skin between the flanks of mice; for rabbits, the dose was applied to the
inside of the left ear. All mice died by week 110. The incidence of skin neoplasms in dosed mice was similar
to that in the controls (Stenbäck and Shubik, 1974). Benzophenone had no effect on survival rates or on
incidences of neoplasms or nonneoplastic lesions in rabbits after 160 weeks of treatment (Stenbäck, 1977).

11 Benzophenone, NTP TOX 61
Humans
No epidemiologic studies or case reports examining the relationship between exposure to benzophenone and
human cancer were found in the literature (HSDB, 1997).
GENETIC TOXICITY
Benzophenone was not mutagenic in the standard Ames test using various strains of Salmonella typhimurium
(Mortelmans et al., 1986) or in the Escherichia coli pol A assay (Fluck et al., 1976). In addition, negative
results were reported for benzophenone in the mouse lymphoma cell mutagenicity test (CCRIS, 1991). All
three of these in vitro assays were performed with and without liver S9 metabolic activation enzymes.
STUDY RATIONALE AND DESIGN
Benzophenone was nominated by the National Institute of Environmental Health Sciences for toxicity testing
based on the potential for occupational and consumer exposure and the lack of chronic toxicity data.
Assessment of cytochrome P450 content and activity in liver was included in the study design to further
characterize the toxic effects of benzophenone. Feed was chosen as the route of exposure because this mimics
exposure to humans consuming benzophenone as a flavoring agent. Endpoints evaluated during these 14-week
studies included histopathology and clinical pathology in F344/N rats and B6C3F1 mice. The effects of
benzophenone on reproduction were assessed by the evaluation of testicular and spermatozoal parameters and
by characterization of the estrous cycle. In addition, the genetic toxicity of benzophenone was assessed in
studies in S. typhimurium and by determination of the induction of micronuclei in bone marrow cells of mice
receiving intraperitoneal injections of benzophenone.

12 Benzophenone, NTP TOX 61

13
MATERIALS AND METHODS
PROCUREMENT AND CHARACTERIZATION OF BENZOPHENONE
A single lot of benzophenone (lot 06327AZ) was obtained from Aldrich Chemical Company (Milwaukee, WI).
Information on identity and purity were provided by the supplier. The study laboratory confirmed the identity
of the chemical, which consisted of off-white chips, with infrared spectroscopy; the spectrum was consistent
with a literature reference (Aldrich, 1985). Gas chromatographic analyses conducted by the supplier indicated
a purity greater than 99%.
Throughout the 14-week studies, benzophenone was stored in the original plastic jars. Periodic reanalyses
performed by the study laboratory using gas chromatography indicated no degradation of the bulk chemical.
PREPARATION AND ANALYSIS OF DOSE FORMULATIONS
The dose formulations were prepared 1 week before the exposures began and every 4 weeks thereafter.
Benzophenone was ground and sieved to reduce particle size before being stirred manually with feed to prepare
a premix. A blender was then used to combine the premix with the remaining feed. The dose formulations
were stored in plastic bags inside plastic buckets, at room temperature, for up to 4 weeks. Homogeneity studies
of the 1,250 and 20,000 ppm dose formulations and stability studies of the 1,250 ppm dose formulation were
performed by the analytical chemistry laboratory using gas chromatography. Homogeneity was confirmed, and
the stability of the dose formulations was confirmed for at least 5 weeks when stored at !20° C, 5° C, or room
temperature, sealed and protected from ultraviolet light, or 7 days when stored sealed at room temperature,
exposed to ultraviolet light.
Analyses of the dose formulations of benzophenone were conducted at the study laboratory with gas
chromatography. The dose formulations and animal room samples were analyzed initially and after 8 weeks.
All dose formulations analyzed were within 10% of the target concentrations. All but one animal room sample
for rats and one for mice were within 10% of the target concentrations.

14 Benzophenone, NTP TOX 61
14-WEEK STUDIES
Male and female F344/N rats and B6C3F1 mice were obtained from Taconic Laboratory Animals and Services
(Germantown, NY). On receipt, the rats and mice were approximately 5 to 6 weeks old. Animals were
quarantined for 13 to 17 days and were approximately 8 to 9 weeks old on the first day of the studies. Before
the studies began, two male and two female rats and mice were randomly selected for parasite evaluation and
gross observation for evidence of disease. Blood was collected from five male and five female rats and mice
at the beginning of the studies and again 4 weeks after the studies began. The sera were analyzed for antibody
titers to rodent viruses (Boorman et al., 1986; Rao et al., 1989a,b); all results were negative. Additional details
concerning the study design are provided in Table 3.
The exposure concentrations for the 14-week studies were selected based on literature values. In a 28-day
toxicity study in male and female Sprague-Dawley rats administered 0, 10, 100, or 500 mg benzophenone/kg
body weight in feed, benzophenone was toxic at the two highest exposure levels (Burdock et al., 1991). The
exposure levels selected for the current studies took into consideration the absence of toxicity data in mice and
possible strain differences in the expression of toxicity in rats. Therefore, groups of 10 male and 10 female
rats and mice were fed diets containing 0, 1,250, 2,500, 5,000, 10,000, or 20,000 ppm benzophenone for
14 weeks. Rats were housed five per cage and mice were housed individually. NIH-07 open formula meal
(Zeigler Brothers, Inc., Gardners, PA), containing the appropriate concentrations of benzophenone, and water
(Columbus municipal supply) were available ad libitum. Feed consumption by core study animals was recorded
twice per week. Additional details on animal maintenance are provided in Table 3.
Clinical pathology studies were performed on rats designated for clinical pathology testing and on all core study
rats and mice. Ten male and ten female rats and mice per group were evaluated. Blood for hematology and
clinical chemistry evaluations was collected from clinical pathology study rats on days 4 and 22; blood was
collected from core study rats and mice at the end of the studies. The animals were anesthetized with a mixture
of carbon dioxide and oxygen, and blood was withdrawn from the retroorbital sinus. Samples for hematology
analysis were placed in microcollection tubes (Sarstedt, Inc., Nümbrecht, Germany) containing potassium
EDTA; samples for clinical chemistry evaluations were placed in tubes devoid of anticoagulant. The latter
samples were allowed to clot and were then centrifuged, and the serum was removed.
Hematologic determinations were made on a Serono-Baker System 9000 hematology analyzer (Serono-Baker
Diagnostics, Allentown, PA) with reagents obtained from the equipment manufacturer. The parameters that
were evaluated are listed in Table 3. Differential leukocyte counts and morphologic evaluations of blood cells
were conducted using light microscopy and blood smears stained with Wright-Giemsa.

15 Benzophenone, NTP TOX 61
Clinical chemistry variables were measured with a Hitachi 704® chemistry analyzer (Boehringer Mannheim,
Indianapolis, IN). The parameters that were evaluated are listed in Table 3. Reagents were obtained from the
equipment manufacturer.
Vaginal cytology and sperm motility evaluations were performed on core study rats and mice at the end of the
studies. Ten male and ten female rats from the 0, 1,250, 2,500, and 5,000 ppm groups and 10 male and
10 female mice from the 0, 2,500, 5,000, and 10,000 ppm groups were evaluated. The parameters that were
evaluated are listed in Table 3. Methods used were those described in the NTP Statement of Work (NTP,
1991). For the 12 days prior to sacrifice, the vaginal vaults of the females were moistened with saline, if
necessary, and samples of vaginal fluid and cells were stained. Relative numbers of leukocytes, nucleated
epithelial cells, and large squamous epithelial cells were determined and used to ascertain estrous cycle stage
(i.e., diestrus, proestrus, estrus, and metestrus). Male animals were evaluated for sperm motility. The left
testis and left epididymis were isolated and weighed. The tail of the epididymis (cauda epididymis) was then
removed from the epididymal body (corpus epididymis) and weighed. Test yolk (rats) or modified Tyrode’s
buffer (mice) was applied to slides and a small incision was made at the distal border of the cauda epididymis.
The sperm effluxing from the incision were dispersed in the buffer on the slides, and the numbers of motile and
nonmotile spermatozoa were counted for five fields per slide by two observers. Following completion of sperm
motility estimates, each left cauda epididymis was placed in buffered saline solution. Caudae were finely
minced, and the tissue was incubated in the saline solution and then heat fixed at 65E C. Sperm density was
then determined microscopically with the aid of a hemacytometer. To quantify spermatogenesis, the testicular
spermatid head count was determined by removing the tunica albuginea and homogenizing the left testis in
phosphate-buffered saline containing 10% dimethyl sulfoxide. Homogenization-resistant spermatid nuclei were
counted with a hemacytometer.
Complete necropsies were performed on all core study animals. The heart, right kidney, liver, lung, right
testis, and thymus were weighed. Organs and tissues were examined for gross lesions and fixed in 10% neutral
buffered formalin. Tissues to be examined microscopically were trimmed, embedded in paraffin, sectioned,
and stained with hematoxylin and eosin. Complete histopathologic examinations were performed on all control
animals, all animals in the highest exposure groups with at least 60% survival and all higher exposure groups,
and all animals that died early. Table 3 lists the tissues and organs examined microscopically.
Upon completion of the laboratory pathologist’s histopathologic evaluation, the slides, paraffin blocks, and
residual wet tissues were sent to the NTP archives for inventory, slide/block match, and wet tissue audit. The
slides, individual animal data records, and pathology tables were sent to an independent pathology laboratory
where quality assessment was performed. Results were reviewed and evaluated by the NTP Pathology Working

16 Benzophenone, NTP TOX 61
Group (PWG); the final diagnoses represent a consensus of contractor pathologists and the PWG. Details of
these review procedures have been described by Maronpot and Boorman (1982) and Boorman et al. (1985).
Because of the photoinitiating properties of benzophenone (Caprino et al., 1976), special histopathology studies
were conducted to evaluate the potential effects of benzophenone on the eyes of core study rats and mice. Five
males and five females from the control, 10,000 ppm (rats and male mice), and 20,000 ppm (female mice)
groups were randomly selected for evaluation at the end of the studies. The lens, retina, and other ocular
structures were examined microscopically.
Residual liver tissue was collected from randomly selected core rats and mice (five males and five females per
group) after liver sections for histopathologic analyses were prepared. Samples were analyzed for microsomal
cytochrome P450 content and cytochrome P450-mediated dealkylation of ethoxyresorufin and pentoxyresorufin.
Liver samples were divided into two equal portions and weighed. One portion was homogenized in ice-cold
1.15% potassium chloride in a 0.1 M Tris hydrochloride buffer (pH 7.5) and centrifuged. The homogenate
was again centrifuged to remove nuclei and mitochondrial debris. The supernatant was centrifuged in a
refrigerated ultracentrifuge, and the resulting microsomal pellet was resuspended in a microsomal dilution
buffer. The suspensions were frozen at approximately !70° C for 1 week before being analyzed for
alkoxyresorufin dealkylase activities and protein content.
Alkoxyresorufin dealkylase activities were determined with methods derived from Burke et al. (1985), Lubet
et al. (1985), and Rutten et al. (1992). A mixture of Tris hydrochloride assay buffer (pH 7.8), an NADPH-
generating system (NADP, glucose-6-phosphate, magnesium chloride hexahydrate, and glucose-6-phosphate
dehydrogenase), and the microsomal suspension was prewarmed in a spectrofluorometer maintained at
approximately 37° C. The amount of microsomal protein added to the mixture ranged from 0.082 to 1.42 mg.
The enzymatic reaction was initiated with ethoxyresorufin or pentoxyresorufin and was analyzed for resorufin
formation at an excitation wavelength of 530 nm and an emission wavelength of 585 nm. The reaction was
scanned on the spectrofluorometer for approximately 2 to 10 minutes, until a linear reaction was observed.
Enzyme-mediated increases in fluorescence were compared to mean fluorescence values from resorufin standard
curves. Protein values were determined according to a modification of the method of Winsten (1965).
The remaining portion of liver was used to prepare microsomes for the determination of cytochrome P450
content. The liver was homogenized in ice-cold 1.15% potassium chloride in 0.1 M potassium phosphate buffer
(pH 7.4) with 20% glycerol and centrifuged. The homogenate was again centrifuged to remove nuclei and
mitochondrial debris. The supernatant was centrifuged in a refrigerated ultracentrifuge. The resulting

17 Benzophenone, NTP TOX 61
microsomal pellet was resuspended in 1.15% potassium chloride in 0.1 M potassium phosphate buffer (pH 7.4)
with 20% glycerol and again centrifuged in an effort to remove residual hemoglobin; this step was repeated,
and a portion of the resulting microsomal suspension was then used to determine cytochrome P450 content. The
remaining suspension was stored frozen at approximately !70° C for protein determinations.
Cytochrome P450 content was determined with a modification of the carbon monoxide-difference spectrum
method of Omura and Sato (1964). Sodium dithionite was mixed with the microsomal suspension and allowed
to equilibrate for 3 to 5 minutes. Carbon monoxide was then bubbled through the sample (approximately
1 bubble/second) for 20 seconds, and the sample was again allowed to equilibrate for 3 to 5 minutes. The
spectrum difference was then recorded between 400 and 510 nm on a spectrophotometer in the split-beam
mode. The cytochrome P450 content was calculated from the optical density difference (approximately 450 to
480 nm) and the molar extinction coefficient of 91 mM!1cm!1.

18 Benzophenone, NTP TOX 61
TABLE 3 Experimental Design and Materials and Methods in the 14-Week Feed Studies of Benzophenone
Study Laboratory Battelle Columbus Laboratories (Columbus, OH)
Strain and Species F344/N rats B6C3F1 mice
Animal Source Taconic Laboratory Animals and Services (Germantown, NY)
Time Held Before Studies Rats: 13 days (males) or 14 days (females) Mice: 16 days (males) or 17 days (females)
Average Age When Studies Began Rats: Mice:
8 weeks (males and females) 8 weeks (males), 9 weeks (females)
Date of First Exposure Rats: 4 January 1993 (males), 5 January 1993 (females) Mice: 7 January 1993 (males), 8 January 1993 (females)
Duration of Exposure 14 weeks (7 days per week)
Date of Last Exposure Rats: 5 April 1993 (males), 6 April 1993 (females) Mice: 8 April 1993 (males), 9 April 1993 (females)
Necropsy Dates Rats: 5 April 1993 (males), 6 April 1993 (females) Mice: 8 April 1993 (males), 9 April 1993 (females)
Average Age at Necropsy Rats: 21 weeks (males), 21 or 22 weeks (females) Mice: 22 weeks
Size of Study Groups 10 males and 10 females
Method of Distribution Animals were distributed randomly into groups of approximately equal initial mean body weights.
Animals per Cage Rats: Mice:
5 1
Method of Animal Identification Tail tattoo
Diet NIH-07 open formula meal diet (Zeigler Brothers, Inc., Gardners, PA), available ad libitum
Water Columbus Municipal Supply available ad libitum; automatic watering system (Edstrom Industries, Waterford, NJ)
Cages Polycarbonate (Lab Products, Inc., Garfield, NJ)
Bedding Sani-Chip® hardwood chips (P.J. Murphy Forest Products Corp., Montville, NJ); rats changed twice weekly and mice changed once a week
Cage Filters Spun-bonded DuPont 2024 polyester (Snow Filtration Co., Cincinnati, OH)
Animal Room Environment Temperature: 72° ± 3° F Relative humidity: 55% ± 15% Room fluorescent light: 12 hours/day Room air changes: at least 10/hour
Exposure Concentrations 0, 1,250, 2,500, 5,000, 10,000, or 20,000 ppm in feed, available ad libitum
Type and Frequency of Observation Observed twice daily; animals were weighed initially, weekly, and at the end of the studies. Clinical findings were recorded weekly. Feed consumption was recorded two times per week by cage (rats) or by animal (mice).
Method of Sacrifice Anesthetized with CO2:O2

19 Benzophenone, NTP TOX 61
TABLE 3 Experimental Design and Materials and Methods in the 14-Week Feed Studies of Benzophenone
Necropsy A complete necropsy was performed on core study rats and mice. Organs weighed were the heart, right kidney, liver, lung, right testis, and thymus.
Clinical Pathology Blood was collected from the retroorbital sinus of rats and mice. Rats in the clinical pathology study groups were evaluated on days 4 and 22. Core study animals were evaluated at the end of the studies. Hematology: hematocrit; hemoglobin concentration; erythrocyte, reticulocyte, and nucleated erythrocyte counts; mean cell volume; mean cell hemoglobin; mean cell hemoglobin concentration; platelet count; and total leukocyte count and differentials Clinical Chemistry: urea nitrogen, creatinine, total protein, albumin, alanine aminotransferase, alkaline phosphatase, creatine kinase, sorbitol dehydrogenase, and total bile salts
Histopathology A complete histopathologic evaluation was performed on male and female rats and male mice in the 0, 10,000, and 20,000 ppm groups; on female mice in the 0 and 20,000 ppm groups; and on all animals that died early. In addition to gross lesions and tissue masses, the following tissues were examined: adrenal gland, bone and marrow, brain (three sections), clitoral gland, esophagus, eye, gallbladder (mice only), heart, large intestine (cecum, colon, rectum), small intestine (duodenum, jejunum, ileum), kidney, liver (two sections), lung, lymph nodes (mandibular and mesenteric), mammary gland, nose, ovary, pancreas, parathyroid gland, pituitary gland, preputial gland, prostate gland, salivary gland, spleen, stomach (forestomach and glandular stomach), testis (with epididymis and seminal vesicle), thymus, thyroid gland, trachea, urinary bladder, and uterus. Organs examined in the lower exposure groups included the liver, kidney, bone marrow, and testis of rats and the liver of mice.
Sperm Motility and Vaginal Cytology Evaluations
Sperm motility and vaginal cytology evaluations were performed on core study rats in the 0, 1,250, 2,500, and 5,000 ppm groups and mice in the 0, 2,500, 5,000, and 10,000 ppm groups at the end of the studies. Male rats and mice were evaluated for necropsy body and reproductive tissue weights, epididymal spermatozoal data, and spermatogenesis. Females were evaluated for necropsy body weight, estrous cycle length, and the percentage of cycle spent in the various estrous stages.
Ocular Studies Special histopathologic studies were conducted to evaluate the potential effects of benzophenone on the eyes of core study rats and mice. At the end of the 14-week studies, the eye lens, retina, and other ocular structures of five animals per group from the control, 10,000 ppm (rats and male mice), and 20,000 ppm (female mice) groups were examined.
Cytochrome P450 Analyses Liver samples were collected from core study rats and mice (five males and five females per group) and analyzed for cytochrome P450 content and for ethoxyresorufin deethylase and pentoxyresorufin dealkylase activities.
STATISTICAL METHODS
Calculation and Analysis of Lesion Incidences
The incidences of lesions are presented in Appendix A as the numbers of animals bearing such lesions at a
specific anatomic site and the numbers of animals with that site examined microscopically. The Fisher exact
test, a procedure based on the overall proportion of affected animals, was used to determine significance (Gart
et al., 1979).

20 Benzophenone, NTP TOX 61
Analysis of Continuous Variables
Two approaches were employed to assess the significance of pairwise comparisons between exposed and control
groups in the analysis of continuous variables. Organ and body weight data, which have approximately normal
distributions, were analyzed with the parametric multiple comparison procedures of Dunnett (1955) and
Williams (1971, 1972). Hematology, clinical chemistry, cytochrome P450, spermatid, and epididymal
spermatozoal data, which have typically skewed distributions, were analyzed using the nonparametric multiple
comparison methods of Shirley (1977) and Dunn (1964). Jonckheere’s test (Jonckheere, 1954) was used to
assess the significance of the dose-related trends and to determine whether a trend-sensitive test (Williams’ or
Shirley’s test) was more appropriate for pairwise comparisons than a test that does not assume a monotonic
dose-related trend (Dunnett’s or Dunn’s test). If the P value from Jonckheere’s test was greater than or equal
to 0.10, Dunn’s or Dunnett’s test was used rather than Shirley’s or Williams’ test. The outlier test of Dixon
and Massey (1951) was employed to detect extreme values. No value selected by the outlier test was eliminated
unless it was at least twice the next largest value or at most half of the next smallest value. Extreme values
identified by the statistical test were reviewed by NTP personnel before being eliminated from the analysis.
Because vaginal cytology data are proportions (the proportion of the observation period that an animal was in
a given estrous stage), an arcsine transformation was used to bring the data into closer conformance with a
normality assumption. Treatment effects were investigated by applying a multivariate analysis of variance
(Morrison, 1976) to the transformed data to test for simultaneous equality of measurements across exposure
concentrations.
QUALITY ASSURANCE
The 14-week studies were conducted in compliance with United States Food and Drug Administration Good
Laboratory Practices regulations (21 CFR, Part 58). The Quality Assurance Unit of Battelle Columbus
Laboratories performed audits and inspections of protocols, procedures, data, and reports throughout the course
of the studies.
GENETIC TOXICOLOGY
Salmonella typhimurium Mutagenicity Test Protocol
Testing was performed as reported by Mortelmans et al. (1986). Benzophenone was sent to the laboratory as
a coded aliquot from Radian Corporation (Austin, TX) and was incubated with the Salmonella typhimurium
tester strains TA98, TA100, TA1535, and TA1537 either in buffer or S9 mix (metabolic activation enzymes
and cofactors from Aroclor 1254-induced male Sprague-Dawley rat or Syrian hamster liver) for 20 minutes at

21 Benzophenone, NTP TOX 61
37E C. Top agar supplemented with L-histidine and d-biotin was added, and the contents of the tubes were
mixed and poured onto the surfaces of minimal glucose agar plates. Histidine-independent mutant colonies
arising on these plates were counted following incubation for 2 days at 37E C.
Each trial consisted of triplicate plates of concurrent positive and negative controls and of five doses of
benzophenone. The high dose was limited by toxicity. All trials were repeated.
In this assay, a positive response is defined as a reproducible, dose-related increase in histidine-independent
(revertant) colonies in any one strain/activation combination. An equivocal response is defined as an increase
in revertants that is not dose related, is not reproducible, or is not of sufficient magnitude to support a
determination of mutagenicity. A negative response is obtained when no increase in revertant colonies is
observed following chemical treatment. There is no minimum percentage or fold increase required for a
chemical to be judged positive or weakly positive.
Bone Marrow Micronucleus Test Protocol
Preliminary range-finding studies were performed. Factors affecting dose selection included chemical solubility
and toxicity and the extent of cell cycle delay induced by benzophenone exposure; the limiting factor was
toxicity. The standard three-exposure protocol is described in detail by Shelby et al. (1993). Male B6C3F1
mice were injected intraperitoneally three times at 24-hour intervals with benzophenone dissolved in corn oil;
the total dosing volume was 0.4 mL. Solvent control mice were injected with 0.4 mL of corn oil only. The
positive control mice received injections of 25 mg cyclophosphamide/kg. The mice were killed 24 hours after
the third injection, and blood smears were prepared from bone marrow cells obtained from the femurs. Air-
dried smears were fixed and stained; 2,000 polychromatic erythrocytes (PCEs) were scored for the frequency
of micronucleated cells in each of five animals per dose group.
The results were tabulated as the mean of the pooled results from all animals within a treatment group, plus or
minus the standard error of the mean. The frequency of micronucleated cells among PCEs was analyzed by
a statistical software package that tested for increasing trend over dose groups using a one-tailed
Cochran-Armitage trend test, followed by pairwise comparisons between each dosed group and the control
group (ILS, 1990). In the presence of excess binomial variation, as detected by a binomial dispersion test, the
binomial variance of the Cochran-Armitage test was adjusted upward in proportion to the excess variation. In
the micronucleus test, an individual trial was considered positive if the trend test P value was less than or equal
to 0.025 or if the P value for any single dose group was less than or equal to 0.025 divided by the number of
dose groups. A final call of positive for micronucleus induction is preferably based on reproducibly positive
22 Benzophenone, NTP TOX 61
trials (as noted above). Ultimately, the final call is determined by the scientific staff after considering the results
of statistical analyses, the reproducibility of any effects observed, and the magnitudes of those effects.
Evaluation Protocol
These are the basic guidelines for arriving at an overall assay result for assays performed by the National
Toxicology Program. Statistical as well as biological factors are considered. For an individual assay, the
statistical procedures for data analysis have been described in the preceding protocols. There have been
instances, however, in which multiple aliquots of a chemical were tested in the same assay, and differing results
were obtained among aliquots and/or among laboratories. Results from more than one aliquot or from more
than one laboratory are not simply combined into an overall result. Rather, all the data are critically evaluated,
particularly with regard to pertinent protocol variations, in determining the weight of evidence for an overall
conclusion of chemical activity in an assay. In addition to multiple aliquots, the in vitro assays have another
variable that must be considered in arriving at an overall test result. In vitro assays are conducted with and
without exogenous metabolic activation. Results obtained in the absence of activation are not combined with
results obtained in the presence of activation; each testing condition is evaluated separately. The results
presented in the Abstract of this Toxicity Report represent a scientific judgement of the overall evidence for
activity of the chemical in an assay.

23
RESULTS
RATS
One female in the 20,000 ppm group died on day 12 of the study (Table 4). Due to the significantly lower
mean body weight gains of males and females exposed to 20,000 ppm compared to those of the controls, these
rats were removed from the study during week 6; all other rats survived to the end of the study. Body weights
of male rats exposed to 2,500 ppm or greater and female rats in all exposed groups were significantly less than
those of the controls (Table 4 and Figure 1). Clinical findings included thinness and lethargy in male and
female rats in the 20,000 ppm groups and thinness in males in the 10,000 ppm group. Two males in the
20,000 ppm group also had prolapsed penises. Male and female rats exposed to 20,000 ppm consumed less
feed than the controls (Table 4). Feed consumption by other exposed groups was generally similar to that by
the controls; however, no attempts were made to estimate feed spillage.

24
c
Benzophenone, NTP TOX 61
TABLE 4 Survival, Body Weights, and Feed and Compound Consumption of Rats in the 14-Week Feed Study of Benzophenone
Dose (ppm)
Survivala Initial
Mean Body Weightb (g)
Final Change
Final Weight Relative
to Controls (%)
Average Feed Average
Consumptionc Dosec
(g/day) (mg/kg/day)
Male
0 1,250 2,500 5,000
10,000 20,000
10/10 10/10 10/10 10/10 10/10 0/10d
185 ± 3 185 ± 2 187 ± 2 186 ± 3 185 ± 2 185 ± 2
366 ± 7 362 ± 6 339 ± 5** 330 ± 5** 268 ± 5**
—
181 ± 6 177 ± 5 153 ± 4** 144 ± 4** 83 ± 4**
—
99 93 90 73 —
16.2 16.5 16.3 16.3 15.8 6.0
75 155 316 698 839
Female
0 1,250 2,500 5,000
10,000 20,000
10/10 10/10 10/10 10/10 10/10 0/10e
131 ± 2 128 ± 2 128 ± 2 128 ± 2 129 ± 1 129 ± 1
210 ± 3 191 ± 2** 185 ± 2** 177 ± 2** 176 ± 2**
—
79 ± 3 63 ± 2** 57 ± 1** 50 ± 2** 47 ± 2**
—
91 88 84 84 —
10.4 9.8
10.0 9.5
10.8 5.5
77 160 311 708 982
** Significantly different (P#0.01) from the control group by Williams’ test a Number surviving at 14 weeks/number initially in group b Weights and weight changes are given as mean ± standard error.
Average of individual consumption values for weeks 1 to 14 for all animals in the base study. For males and females in the 20,000 ppm groups, consumption values are given for weeks 1 to 6 only.
d Week of death: all died during week 6 e Week of death: one during week 2; nine during week 6

25 Benzophenone, NTP TOX 61
FIGURE 1 Body Weights of Rats Administered Benzophenone in Feed for 14 Weeks

26 Benzophenone, NTP TOX 61
The hematology data for rats are listed in Tables 5 and B1. Because of the mortality and early removal of
20,000 ppm animals, no hematology or clinical chemistry evaluations were performed on these rats at week 14.
On day 4, an exposure concentration-related erythrocytosis, evidenced by increases in hematocrit values,
hemoglobin concentrations, and erythrocyte counts, occurred in the 2,500 ppm or greater male and female rats.
The erythrocytosis was transient and, by day 22, was replaced by evidence of a decreased erythron, as
demonstrated by generally decreased hematocrit values, hemoglobin concentrations, and erythrocyte counts in
the 2,500 ppm or greater groups; this erythron effect also was present at week 14. In exposed male rats, the
anemia was accompanied by increases in reticulocyte counts, suggesting an erythropoietic response. Also, there
were minimal to mild, exposure concentration-related increases in mean cell volume and significant, but
minimal, decreases in mean cell hemoglobin concentration in males, indicating an erythrocytic macrocytosis
and a tendency toward hypochromia. In exposed female rats, however, reticulocyte counts were generally
unaffected and the erythrocytes demonstrated a tendency towards microcytosis and hypochromia, as evidenced
by decreases in mean cell volumes, mean cell hemoglobin concentrations, and mean cell hemoglobin values.
On day 4, minimal, exposure-related increases in platelet counts occurred in the 5,000 ppm or greater male and
female rats. This early increase in platelet counts was transient and, by day 22, was replaced by minimal
decreases; the platelet count decreases persisted through week 14 in 10,000 ppm males and 5,000 and
10,000 ppm females.

27 Benzophenone, NTP TOX 61
TABLE 5 Selected Hematology Data for Rats in the 14-Week Feed Study of Benzophenonea
0 ppm 1,250 ppm 2,500 ppm 5,000 ppm 10,000 ppm 20,000 ppm
Male
n Day 4 10 10 9 10 10 10 Day 22 10 10 10 10 10 10 Week 14 10 10 10 10 10 0
Hematocrit (%) Day 4 44.3 ± 0.4 45.2 ± 0.4 47.9 ± 0.4** 50.0 ± 0.4** 50.7 ± 0.6** 51.4 ± 0.7 ** Day 22 48.1 ± 0.5 47.5 ± 0.4 47.3 ± 0.4 47.2 ± 0.5 47.2 ± 0.7 47.3 ± 0.4 Week 14 50.0 ± 0.6 49.2 ± 0.7 49.9 ± 0.6 49.3 ± 0.7 49.1 ± 0.6
Hemoglobin (g/dL) Day 4 15.4 ± 0.1 15.6 ± 0.1 16.3 ± 0.1** 17.0 ± 0.1** 17.2 ± 0.1** 17.5 ± 0.2** Day 22 16.5 ± 0.1 16.1 ± 0.1* 15.8 ± 0.2** 15.7 ± 0.2** 15.5 ± 0.3** 15.8 ± 0.1** Week 14 16.9 ± 0.2 16.4 ± 0.2 16.4 ± 0.1* 16.1 ± 0.2* 15.8 ± 0.1**
Erythrocytes (106/µL) Day 4 7.44 ± 0.07 7.60 ± 0.09 8.01 ± 0.08** 8.31 ± 0.08** 8.45 ± 0.11** 8.49 ± 0.12** Day 22 8.50 ± 0.09 8.23 ± 0.08 8.12 ± 0.08* 8.00 ± 0.07** 7.97 ± 0.13** 8.35 ± 0.08 Week 14 9.29 ± 0.12 8.93 ± 0.10 8.98 ± 0.11 8.65 ± 0.14** 8.48 ± 0.11**
Platelets (103/µL) Day 4 966.0 ± 11.1 922.3 ± 27.6 955.7 ± 22.0 1,069.5 ± 17.0** 1,087.1 ± 22.0** 1,050.8 ± 23.0** Day 22 784.3 ± 14.7 827.6 ± 14.0 778.6 ± 11.4 793.0 ± 21.1 705.0 ± 15.3** 547.5 ± 15.7** Week 14 750.9 ± 11.1 783.4 ± 18.4 827.0 ± 12.5* 796.5 ± 16.0 717.7 ± 11.5
Female
n Day 4 10 10 10 10 10 10 Day 22 10 10 10 10 9 10 Week 14 10 10 10 10 10 0
Hematocrit (%) Day 4 45.5 ± 0.4 46.2 ± 0.5 48.1 ± 0.5** 50.2 ± 0.4** 51.1 ± 0.3** 51.0 ± 0.5** Day 22 47.5 ± 0.5 47.3 ± 0.4 47.7 ± 0.4 45.8 ± 0.4* 46.4 ± 0.6 44.9 ± 0.7** Week 14 47.1 ± 0.5 47.7 ± 0.6 46.2 ± 0.7 46.2 ± 0.6 45.4 ± 0.4*
Hemoglobin (g/dL) Day 4 15.6 ± 0.1 15.6 ± 0.2 16.3 ± 0.2** 16.9 ± 0.2** 17.3 ± 0.1** 17.2 ± 0.1** Day 22 16.2 ± 0.1 15.7 ± 0.1* 15.6 ± 0.1** 15.2 ± 0.1** 15.2 ± 0.2** 15.1 ± 0.2** Week 14 16.0 ± 0.2 16.1 ± 0.2 15.5 ± 0.2 15.3 ± 0.2* 14.5 ± 0.1**
Erythrocytes (106/µL) Day 4 7.51 ± 0.07 7.50 ± 0.12 7.83 ± 0.10* 8.18 ± 0.09** 8.29 ± 0.08** 8.39 ± 0.07** Day 22 7.83 ± 0.09 7.61 ± 0.06 7.76 ± 0.06 7.46 ± 0.07* 7.58 ± 0.11 7.74 ± 0.12 Week 14 8.07 ± 0.09 8.22 ± 0.12 8.03 ± 0.11 8.08 ± 0.12 7.95 ± 0.09
Platelets (103/µL) Day 4 861.2 ± 13.0 898.3 ± 14.3 876.2 ± 12.1 943.0 ± 14.3** 996.0 ± 23.0** 1,006.2 ± 12.2** Day 22 765.6 ± 21.6 764.4 ± 20.5 778.1 ± 11.5 795.4 ± 8.9 636.6 ± 23.1** 622.3 ± 14.0** Week 14 780.2 ± 18.6 771.1 ± 15.8 788.8 ± 28.6 716.8 ± 13.0* 671.0 ± 11.8**
* Significantly different (P#0.05) from the control group by Dunn’s or Shirley’s test ** P#0.01 a Data are given as mean ± standard error. Statistical tests were performed on unrounded data.

28 Benzophenone, NTP TOX 61
There were several exposure-related alterations in the serum clinical chemistry evaluations for male and female
rats (Tables 6 and B2). On day 4, alanine aminotransferase activities were minimally to mildly increased in
all groups of exposed rats. By day 22 and week 14, this alteration ameliorated and alanine aminotransferase
activity was increased only in the 10,000 ppm females and 20,000 ppm males and females. The activity of
sorbitol dehydrogenase, another marker of hepatocellular leakage, was increased only in the 10,000 ppm
females at week 14. The concentrations of bile salts, a marker of cholestasis or altered hepatic function, was
minimally to markedly increased for all exposed groups at various time points. In contrast, activities of alkaline
phosphatase, another marker of cholestasis, were minimally to mildly decreased for all exposed groups of
animals at all time points. On day 4, total protein concentrations were minimally decreased in the 2,500 ppm
or greater male and female rats. By day 22, the slight hypoproteinemia was replaced by a hyperproteinemia,
demonstrated by increased total protein concentrations. The hyperproteinemia persisted at week 14 in all
groups of exposed females. On day 22 and at week 14, the hyperproteinemia was accompanied by a
hyperalbuminemia, evidenced by increased albumin concentrations. In animals, hyperalbuminemia has not been
associated with increased albumin production but has been used as an indicator of dehydration (Kaneko, 1989);
the hyperproteinemia would be consistent with the hyperalbuminemia. On day 22, there was evidence of a
minimal azotemia, demonstrated by increased urea nitrogen concentrations, in the 10,000 ppm male and
20,000 ppm male and female rats. Considering the dehydration indicated by hyperalbuminemia, the increased
urea nitrogen concentrations would be consistent with a prerenal azotemia (Finco, 1989; Ragan, 1989). In
contrast, creatinine concentration, another marker of renal function, generally decreased minimally with
increasing exposure concentration in the 5,000 ppm or greater male and female rats at all time points. It has
been demonstrated that serum creatinine concentrations are related to muscle mass (Finco, 1989; Ragan, 1989).
In this study, rats in the higher exposure groups weighed less than control animals; thus, the decreases in
creatinine concentration would be consistent with muscle mass differences between the control and exposed
animals.

29 Benzophenone, NTP TOX 61
TABLE 6 Selected Clinical Chemistry Data for Rats in the 14-Week Feed Study of Benzophenonea
0 ppm 1,250 ppm 2,500 ppm 5,000 ppm 10,000 ppm 20,000 ppm
n Day 4 10 10 10 10 10 10 Day 22 10 10 10 10 10 10 Week 14 10 10 10 10 10 0
Male
Alanine aminotransferase (IU/L) Day 4 43 ± 1 52 ± 4** 56 ± 3** 59 ± 3** 63 ± 2** 61 ± 3** Day 22 50 ± 2 41 ± 1 40 ± 2 39 ± 1 50 ± 2 97 ± 4* Week 14 71 ± 5 67 ± 5 55 ± 4 61 ± 4 90 ± 6
Alkaline phosphatase (IU/L) Day 4 1,307 ± 26 1,237 ± 27 1,141 ± 32** 912 ± 18** 847 ± 35** 799 ± 28** Day 22 951 ± 17 798 ± 19** 715 ± 11** 647 ± 14** 725 ± 27** 664 ± 25** Week 14 574 ± 17 473 ± 14** 458 ± 8** 404 ± 11** 485 ± 15**
Sorbitol dehydrogenase (IU/L) Day 4 16 ± 1 21 ± 2 23 ± 2* 18 ± 1 18 ± 1 15 ± 1 Day 22 19 ± 1 16 ± 1* 16 ± 1* 16 ± 1 16 ± 1 10 ± 1** Week 14 30 ± 4 29 ± 3 25 ± 2 27 ± 3 34 ± 3
Bile salts (µmol/L) Day 4 31.3 ± 2.9 Day 22 24.1 ± 2.1
32.2 ± 4.1 28.3 ± 2.5
32.7 ± 3.6 33.3 ± 3.2*b
42.5 ± 3.5 34.2 ± 2.7**
33.1 ± 2.1 70.4 ± 11.0**
29.8 ± 1.7 330.4 ± 26.0**
Week 14 21.5 ± 2.1 24.7 ± 0.9* 27.2 ± 2.7* 29.0 ± 1.4** 52.1 ± 4.2**
Female
Alanine aminotransferase (IU/L) Day 4 36 ± 2 42 ± 2* 48 ± 3** 54 ± 3** 53 ± 3** 59 ± 9** Day 22 37 ± 1 35 ± 1 36 ± 1 35 ± 1 47 ± 1** 95 ± 4** Week 14 48 ± 3 49 ± 2 43 ± 2 47 ± 3 89 ± 11**
Alkaline phosphatase (IU/L) Day 4 1,048 ± 25 925 ± 36** 824 ± 37** 680 ± 22** 599 ± 13** 596 ± 12** Day 22 766 ± 24 585 ± 19** 516 ± 12** 531 ± 15** 635 ± 22 698 ± 35 Week 14 495 ± 15 369 ± 12** 331 ± 11** 333 ± 18** 400 ± 21**
Sorbitol dehydrogenase (IU/L) Day 4 18 ± 1 17 ± 1 15 ± 1 17 ± 1 17 ± 1 24 ± 5 Day 22 20 ± 2 16 ± 1 16 ± 1 15 ± 1 18 ± 2 13 ± 1** Week 14 21 ± 2 22 ± 1 18 ± 1 21 ± 1 43 ± 6**
Bile salts (µmol/L) Day 4 33.0 ± 5.2 53.9 ± 4.9* 58.0 ± 5.9* 49.6 ± 4.5 46.8 ± 6.8 40.3 ± 3.5 Day 22 28.5 ± 3.4 38.9 ± 3.4* 44.8 ± 4.2** 54.1 ± 3.9** 82.5 ± 12.5** 435.4 ± 22.8** Week 14 41.7 ± 4.9 38.5 ± 3.7 44.2 ± 4.0 39.7 ± 2.6 71.0 ± 3.7**
* Significantly different (P#0.05) from the control group by Dunn’s or Shirley’s test ** P#0.01 a Data are given as mean ± standard error. Statistical tests were performed on unrounded data. b n=9
30 Benzophenone, NTP TOX 61
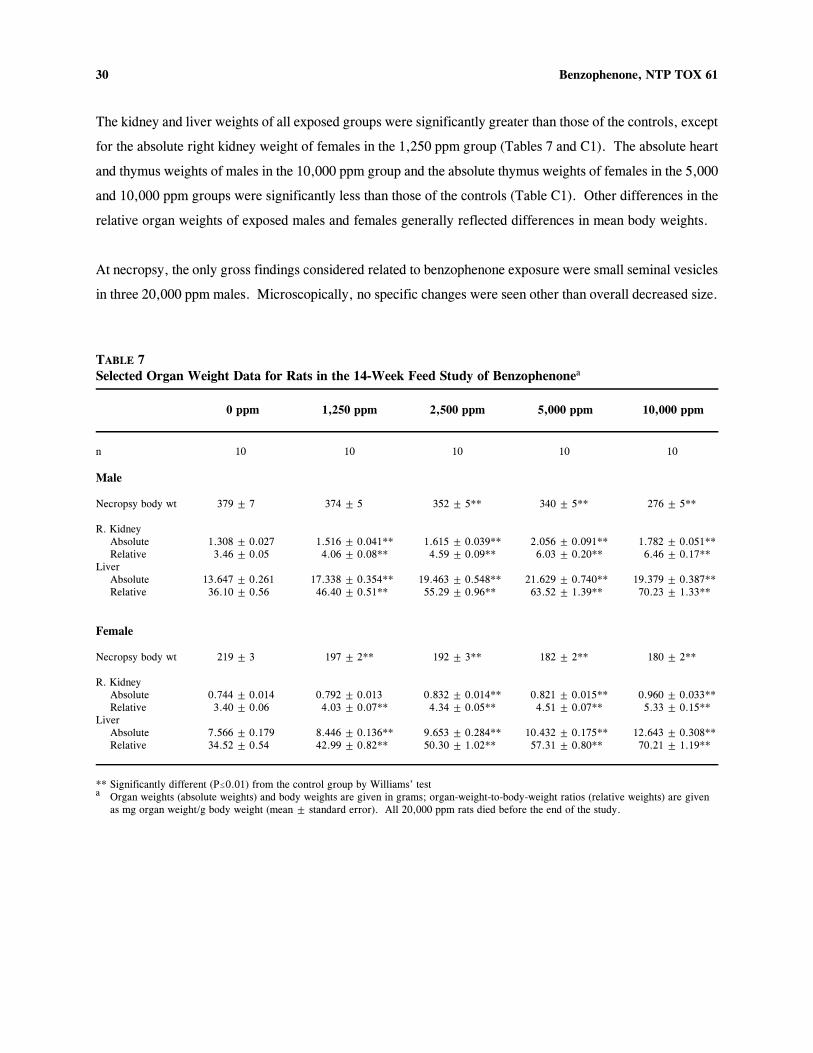
The kidney and liver weights of all exposed groups were significantly greater than those of the controls, except
for the absolute right kidney weight of females in the 1,250 ppm group (Tables 7 and C1). The absolute heart
and thymus weights of males in the 10,000 ppm group and the absolute thymus weights of females in the 5,000
and 10,000 ppm groups were significantly less than those of the controls (Table C1). Other differences in the
relative organ weights of exposed males and females generally reflected differences in mean body weights.
At necropsy, the only gross findings considered related to benzophenone exposure were small seminal vesicles
in three 20,000 ppm males. Microscopically, no specific changes were seen other than overall decreased size.
TABLE 7 Selected Organ Weight Data for Rats in the 14-Week Feed Study of Benzophenonea
0 ppm 1,250 ppm 2,500 ppm 5,000 ppm 10,000 ppm
n 10 10 10 10 10
Male
Necropsy body wt 379 ± 7 374 ± 5 352 ± 5** 340 ± 5** 276 ± 5**
R. Kidney Absolute 1.308 ± 0.027 1.516 ± 0.041** 1.615 ± 0.039** 2.056 ± 0.091** 1.782 ± 0.051** Relative 3.46 ± 0.05 4.06 ± 0.08** 4.59 ± 0.09** 6.03 ± 0.20** 6.46 ± 0.17**
Liver Absolute 13.647 ± 0.261 17.338 ± 0.354** 19.463 ± 0.548** 21.629 ± 0.740** 19.379 ± 0.387** Relative 36.10 ± 0.56 46.40 ± 0.51** 55.29 ± 0.96** 63.52 ± 1.39** 70.23 ± 1.33**
Female
Necropsy body wt 219 ± 3 197 ± 2** 192 ± 3** 182 ± 2** 180 ± 2**
R. Kidney Absolute 0.744 ± 0.014 0.792 ± 0.013 0.832 ± 0.014** 0.821 ± 0.015** 0.960 ± 0.033** Relative 3.40 ± 0.06 4.03 ± 0.07** 4.34 ± 0.05** 4.51 ± 0.07** 5.33 ± 0.15**
Liver Absolute 7.566 ± 0.179 8.446 ± 0.136** 9.653 ± 0.284** 10.432 ± 0.175** 12.643 ± 0.308** Relative 34.52 ± 0.54 42.99 ± 0.82** 50.30 ± 1.02** 57.31 ± 0.80** 70.21 ± 1.19**
** Significantly different (P#0.01) from the control group by Williams’ test a Organ weights (absolute weights) and body weights are given in grams; organ-weight-to-body-weight ratios (relative weights) are given
as mg organ weight/g body weight (mean ± standard error). All 20,000 ppm rats died before the end of the study.

31 Benzophenone, NTP TOX 61
Increased kidney weights were associated with a spectrum of renal changes in exposed rats (Tables 8, A1, and
A2). One change found predominantly in 20,000 ppm animals, which died early, was papillary necrosis
characterized by acute coagulative necrosis of the distal tips of the renal papillae. Unique lesions seen in rats
that died early as well as in survivors were well-demarcated, wedge-shaped areas of prominent tubule dilatation.
These areas were based at the capsular surface and extended deep into the medulla. Within these areas, tubules
were dilated and usually empty, although some contained fine, granular eosinophilic material. The dilated
tubules were lined by epithelial cells with various tinctorial alterations. In male rats, this change was present
at exposure concentrations of 2,500 ppm and higher, while in females it occurred only at 10,000 and
20,000 ppm. Increased incidences and/or severities of focal tubule regeneration was observed in all exposed
groups. Foci of tubule regeneration may be seen as a component of spontaneous chronic nephropathy in control
rats in the 14-week studies. These foci consist of small clusters of tubules with more basophilic cytoplasm and
slightly enlarged and vesicular nuclei. In exposed males and females, the numbers of these foci were increased
relative to controls. Tubules containing eosinophilic protein casts were found in most male rats surviving to
the end of the study and less commonly in females. Based on these findings, a no-effect level for kidney
changes was not reached in rats.
Exposure-related increases in liver weights were attributed to hypertrophy and/or cytoplasmic vacuolization of
hepatocytes. Hypertrophy was characterized by slight increases in the size of centrilobular hepatocytes and was
present in all exposed groups of females. Vacuolization occurred in all exposed groups of males and consisted
of randomly scattered hepatocytes with uniformly sized vacuoles in the cytoplasm imparting a “bubbly”
appearance. These changes were of minimal severity. A change present only in 20,000 ppm males was
minimal hyperplasia of immature bile ductules from portal areas into adjacent sinusoids.
Two lesions were seen primarily in 20,000 ppm rats, which died early, and were considered secondary to
reduced body weight gain and inanition. These were hypocellularity of the bone marrow in males and females
and poorly developed seminiferous tubules in males.
No changes were observed in the microscopic evaluation of the lens, retina, and other ocular structures of the
control or 10,000 ppm rats.

32
c
Benzophenone, NTP TOX 61
TABLE 8 Incidence of Selected Nonneoplastic Lesions in Rats in the 14-Week Feed Study of Benzophenone
0 ppm 1,250 ppm 2,500 ppm 5,000 ppm 10,000 ppm 20,000 ppm
Male
Bone Marrowa 10 10 10 10 10 10 Atrophyb 0 0 0 0 0 10** (3.7)c
Kidney 10 10 10 10 10 10 Mineralization 0 0 0 5* (1.0) 10** (1.1) 0 Papilla, Necrosis 0 0 0 0 2 (1.0) 6** (1.2) Renal Tubule, Protein Casts 0 8** (1.0) 8** (1.0) 9** (1.2) 10** (1.3) 0 Renal Tubule, Dilatation 0 0 6** (1.0) 8** (1.0) 9** (1.3) 8** (1.8) Renal Tubule, Regeneration 10 (1.0) 10 (2.0) 10 (1.5) 10 (2.0) 10 (2.0) 8 (1.6)
Liver 10 10 10 10 10 10 Bile Duct, Hyperplasia 0 0 0 0 0 9** (1.1) Hepatocyte, Hypertrophy 0 0 0 0 5* (1.2) 7** (1.0) Hepatocyte, Vacuolization Cytoplasmic 1 (1.0) 10** (1.0) 10** (1.0) 10** (1.0) 10** (1.4) 10** (1.2)
Female
Bone Marrow 10 10 10 10 10 10 Atrophy 0 0 0 0 2 (1.0) 10** (3.8)
Kidney 10 10 10 10 10 9 Mineralization 10 (1.5) 10 (1.6) 10 (1.6) 10 (1.1) 10 (1.2) 9 (1.2) Papilla, Necrosis 0 0 0 0 0 3 (1.0) Renal Tubule, Protein Casts 0 0 2 (1.0) 0 4* (1.0) 0 Renal Tubule, Dilatation 0 0 0 0 3 (1.0) 5* (1.6) Renal Tubule, Regeneration 3 (1.0) 8* (1.0) 6 (1.0) 6 (1.0) 9** (1.2) 7 (1.6)
Liver 10 10 10 10 10 9 Hepatocyte, Hypertrophy 0 2 (1.0) 8** (1.0) 10** (1.1) 10** (1.0) 7** (1.0) Hepatocyte, Vacuolization Cytoplasmic 0 0 0 9** (1.1) 10** (1.0) 7** (1.1)
* Significantly different (P#0.05) from the control group by the Fisher exact test ** P#0.01 a Number of animals with tissue examined microscopically b Number of animals with lesion
Average severity of lesions in affected animals: 1=minimal, 2=mild, 3=moderate, and 4=marked
There were no significant differences in sperm motility or vaginal cytology parameters between exposed and
control males or females (Tables D1 and D2).
Males and females exposed to 2,500 or 5,000 ppm and females in the 1,250 ppm group had significantly greater
cytochrome P450 concentrations than the controls (Table E1). Pentoxyresorufin dealkylase activities (expressed
as pmol/min per mg protein or per nmol cytochrome P450) were generally significantly greater in exposed rats
than in the controls.
33 Benzophenone, NTP TOX 61
MICE
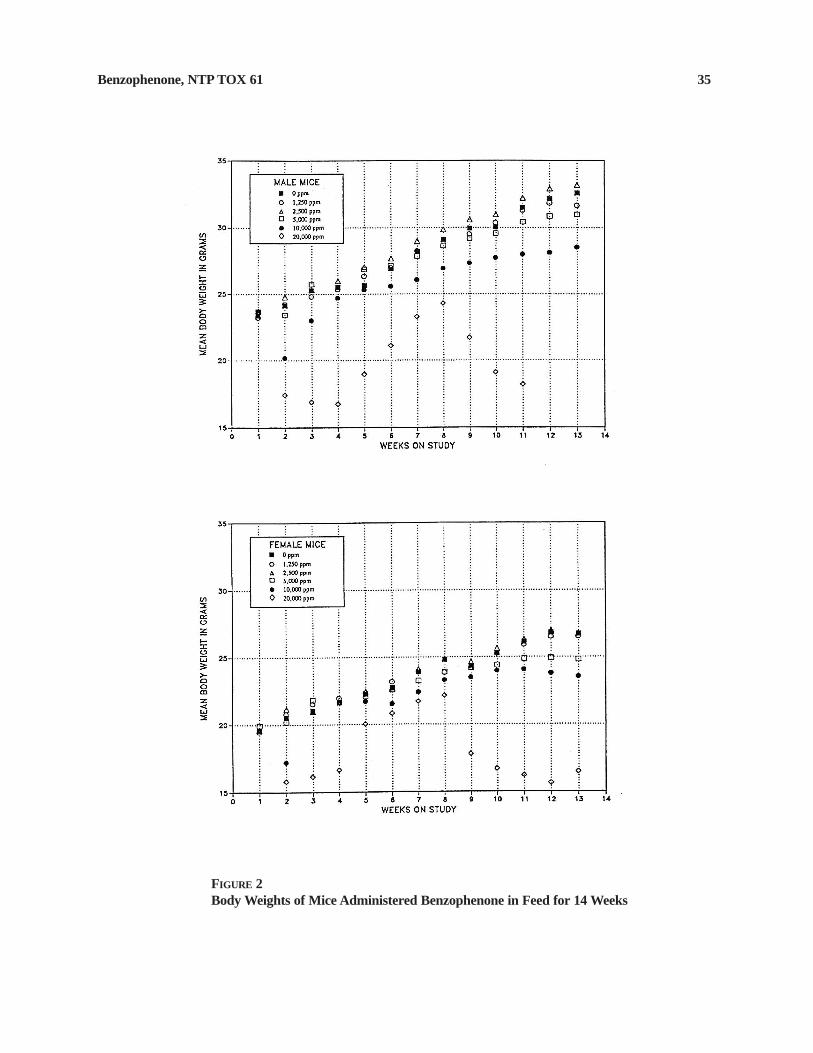
One male in the 1,250 ppm group was accidentally killed on day 26 of the study (Table 9). Four males exposed
to 20,000 ppm died during week 1; one male and one female exposed to 20,000 ppm died during week 2. Due
to the significantly lower mean body weight gains of some males and females exposed to 20,000 ppm compared
to those of the controls, two males were removed from the study during week 10, three males were removed
during week 11, and three females were removed during week 12. Body weights of male mice exposed to
10,000 ppm and female mice exposed to 5,000 ppm or greater were significantly less than those of the controls
(Table 9 and Figure 2). Surviving females in the 20,000 ppm group lost weight during the study. Clinical
findings included thinness and lethargy in male and female mice in the 20,000 ppm groups. Male and female
mice exposed to 20,000 ppm consumed less feed than the controls (Table 9). Spilled feed was observed in the
cages of control and exposed mice, particularly in females. In the two highest exposure groups, spillage might
have been due to impalatibility of the diet.

34
c
Benzophenone, NTP TOX 61
TABLE 9 Survival, Body Weights, and Feed and Compound Consumption of Mice in the 14-Week Feed Study of Benzophenone
Dose (ppm)
Survivala Initial
Mean Body Weightb (g)
Final Change
Final Weight Relative
to Controls (%)
Average Feed Average
Consumptionc Dosec
(g/day) (mg/kg/day)
Male
0 1,250 2,500 5,000
10,000 20,000
10/10 9/10d
10/10 10/10 10/10 0/10e
23.6 ± 0.3 23.2 ± 0.2 23.7 ± 0.2 23.7 ± 0.4 23.3 ± 0.2 23.2 ± 0.3
32.6 ± 0.7 31.7 ± 1.2 33.2 ± 0.8 31.0 ± 0.6 28.5 ± 0.5**
—
8.9 ± 0.6 8.6 ± 1.0 9.5 ± 0.7 7.3 ± 0.4 5.2 ± 0.3**
—
97 102 95 88 —
4.4 4.4 4.6 4.3 4.1 3.4
200 404 786
1,583 3,285
Female
0 1,250 2,500 5,000
10,000 20,000
10/10 10/10 10/10 10/10 10/10 6/10f
19.6 ± 0.1 19.5 ± 0.2 19.6 ± 0.2 19.9 ± 0.2 19.6 ± 0.2 19.7 ± 0.2
26.7 ± 0.5 26.5 ± 0.3 26.8 ± 0.4 24.8 ± 0.3** 23.6 ± 0.2** 16.5 ± 0.3**
7.1 ± 0.5 7.1 ± 0.3 7.2 ± 0.4 4.9 ± 0.3** 4.0 ± 0.1**
!3.3 ± 0.4**
99 100 93 88 62
5.1 4.9 5.0 4.6 4.1 3.8
266 539
1,029 1,898 4,199
** Significantly different (P#0.01) from the control group by Williams’ test a Number surviving at 14 weeks/number initially in group b Weights and weight changes are given as mean ± standard error.
Average of individual consumption values for weeks 1 to 14 for all animals in the base study. For males in the 20,000 ppm group, consumption values are given for weeks 1 to 11 only.
d Week of death: 4 (accidental death) e Week of death: 1, 1, 1, 1, 2, 10, 10, 11, 11, 11 f Week of death: 2, 12, 12, 12
35 Benzophenone, NTP TOX 61
FIGURE 2 Body Weights of Mice Administered Benzophenone in Feed for 14 Weeks

36 Benzophenone, NTP TOX 61
The hematology and clinical chemistry data for mice are listed in Tables B3 and B4. Because of the mortality
and early removal of the 20,000 ppm male mice, no hematology or clinical chemistry evaluations were
performed at week 14 for this group. Similar to the rat study, male mice at week 14 showed evidence of an
anemia in the 5,000 and 10,000 ppm groups, demonstrated by minimal decreases in hematocrit values,
hemoglobin concentrations, and erythrocyte counts. In contrast, female mice in the 5,000, 10,000, and
20,000 ppm groups showed evidence of a minimal erythrocytosis, indicated by increases in hematocrit values,
hemoglobin concentrations, and/or erythrocyte counts. The erythrocytosis would be consistent with
hemoconcentration caused by dehydration and would be supported by the minimal increases in albumin and total
protein concentrations that occurred in various groups of exposed females. Also similar to the rat study, there
was evidence of a hepatic effect in mice. This was evidenced by increases in total bile salt concentrations and
sorbitol dehydrogenase activities in the 2,500 ppm or greater male and all exposed female groups. Alkaline
phosphatase activity also was increased in the 20,000 ppm females.
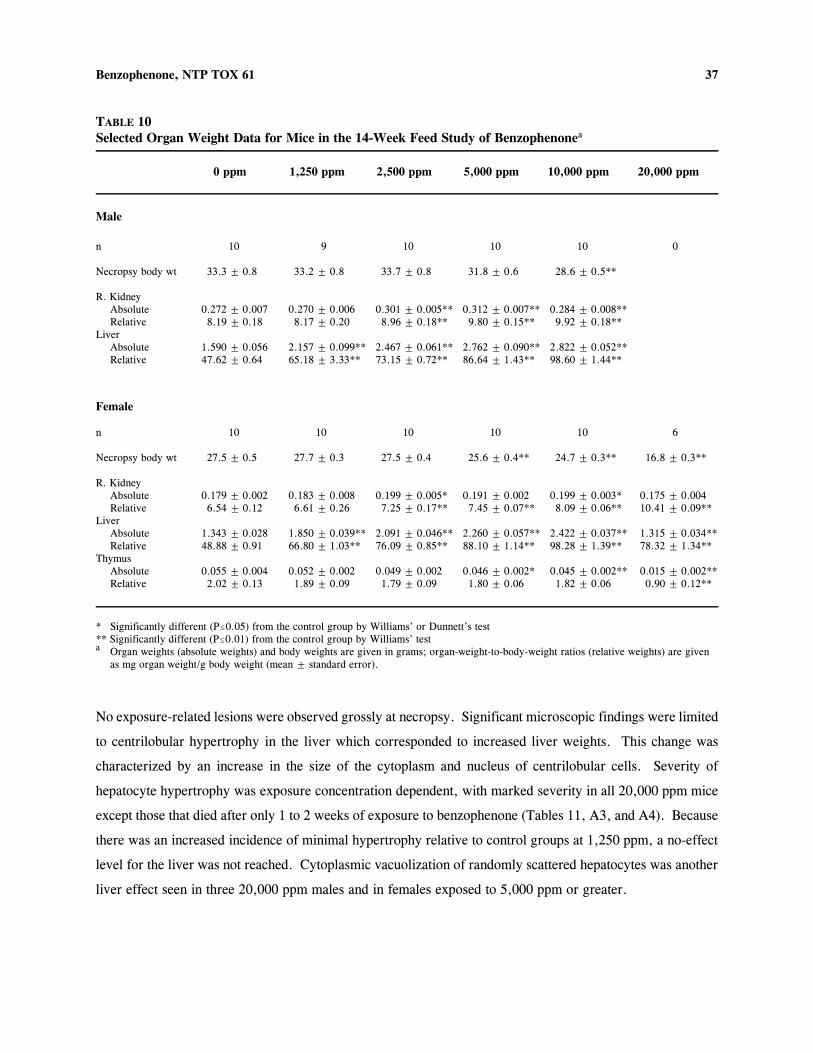
The kidney weights of males exposed to 2,500 ppm or greater and the liver weights of all groups of exposed
males were significantly greater than those of the controls (Tables 10 and C2). The absolute and relative liver
weights of exposed females in all groups except the 20,000 ppm group were also significantly greater than those
of the controls; however, the absolute liver weight of females in the 20,000 ppm group was significantly less
than that of the controls. Exposed females in all groups except the 20,000 ppm group had slightly greater
absolute kidney weights than the controls, and this difference was significant in the 2,500 and 10,000 ppm
groups; females exposed to 2,500 ppm or greater had significantly greater relative kidney weights than the
controls. The absolute and relative thymus weights of females exposed to 20,000 ppm and the absolute thymus
weights of females exposed to 5,000 or 10,000 ppm were significantly less than those of the controls. Other
differences in organ weights between exposed and control mice were considered to reflect the lower body
weights of exposed mice.
37 Benzophenone, NTP TOX 61
TABLE 10 Selected Organ Weight Data for Mice in the 14-Week Feed Study of Benzophenonea
0 ppm 1,250 ppm 2,500 ppm 5,000 ppm 10,000 ppm 20,000 ppm
Male
n 10 9 10 10 10 0
Necropsy body wt 33.3 ± 0.8 33.2 ± 0.8 33.7 ± 0.8 31.8 ± 0.6 28.6 ± 0.5**
R. Kidney Absolute 0.272 ± 0.007 0.270 ± 0.006 0.301 ± 0.005** 0.312 ± 0.007** 0.284 ± 0.008** Relative 8.19 ± 0.18 8.17 ± 0.20 8.96 ± 0.18** 9.80 ± 0.15** 9.92 ± 0.18**
Liver Absolute 1.590 ± 0.056 2.157 ± 0.099** 2.467 ± 0.061** 2.762 ± 0.090** 2.822 ± 0.052** Relative 47.62 ± 0.64 65.18 ± 3.33** 73.15 ± 0.72** 86.64 ± 1.43** 98.60 ± 1.44**
Female
n 10 10 10 10 10 6
Necropsy body wt 27.5 ± 0.5 27.7 ± 0.3 27.5 ± 0.4 25.6 ± 0.4** 24.7 ± 0.3** 16.8 ± 0.3**
R. Kidney Absolute 0.179 ± 0.002 0.183 ± 0.008 0.199 ± 0.005* 0.191 ± 0.002 0.199 ± 0.003* 0.175 ± 0.004 Relative 6.54 ± 0.12 6.61 ± 0.26 7.25 ± 0.17** 7.45 ± 0.07** 8.09 ± 0.06** 10.41 ± 0.09**
Liver Absolute 1.343 ± 0.028 1.850 ± 0.039** 2.091 ± 0.046** 2.260 ± 0.057** 2.422 ± 0.037** 1.315 ± 0.034** Relative 48.88 ± 0.91 66.80 ± 1.03** 76.09 ± 0.85** 88.10 ± 1.14** 98.28 ± 1.39** 78.32 ± 1.34**
Thymus Absolute 0.055 ± 0.004 0.052 ± 0.002 0.049 ± 0.002 0.046 ± 0.002* 0.045 ± 0.002** 0.015 ± 0.002** Relative 2.02 ± 0.13 1.89 ± 0.09 1.79 ± 0.09 1.80 ± 0.06 1.82 ± 0.06 0.90 ± 0.12**
* Significantly different (P#0.05) from the control group by Williams’ or Dunnett’s test ** Significantly different (P#0.01) from the control group by Williams’ test a Organ weights (absolute weights) and body weights are given in grams; organ-weight-to-body-weight ratios (relative weights) are given
as mg organ weight/g body weight (mean ± standard error).
No exposure-related lesions were observed grossly at necropsy. Significant microscopic findings were limited
to centrilobular hypertrophy in the liver which corresponded to increased liver weights. This change was
characterized by an increase in the size of the cytoplasm and nucleus of centrilobular cells. Severity of
hepatocyte hypertrophy was exposure concentration dependent, with marked severity in all 20,000 ppm mice
except those that died after only 1 to 2 weeks of exposure to benzophenone (Tables 11, A3, and A4). Because
there was an increased incidence of minimal hypertrophy relative to control groups at 1,250 ppm, a no-effect
level for the liver was not reached. Cytoplasmic vacuolization of randomly scattered hepatocytes was another
liver effect seen in three 20,000 ppm males and in females exposed to 5,000 ppm or greater.

38 Benzophenone, NTP TOX 61
TABLE 11 Incidence of Liver Lesions in Mice in the 14-Week Feed Study of Benzophenone
0 ppm 1,250 ppm 2,500 ppm 5,000 ppm 10,000 ppm 20,000 ppm
Male
Number Examined Microscopically Inflammation, Chronic Activea
10 5 (1.0)b
10 4 (1.0)
10 8 (1.0)
10 8 (1.0)
10 5 (1.0)
10 1 (1.0)
Centrilobular, Hypertrophy 3 (1.0) 8* (1.0) 10** (2.0) 10** (3.0) 10** (3.0) 10** (3.2) Hepatocyte, Vacuolization Cytoplasmic 0 0 0 0 0 3 (2.0)
Female
Number Examined Microscopically 10 10 10 10 10 10 Inflammation, Chronic Active 8 (1.0) 9 (1.1) 9 (1.0) 9 (1.0) 9 (1.0) 3 (1.0) Centrilobular, Hypertrophy 3 (1.0) 9** (1.0) 10** (2.0) 10** (3.0) 10** (3.0) 10** (4.0) Hepatocyte, Vacuolization Cytoplasmic 0 0 0 2 (1.0) 9** (2.4) 1 (1.0)
* Significantly different (P#0.05) from the control group by the Fisher exact test ** P#0.01 a Number of animals with lesion b Average severity of lesions in affected animals: 1=minimal, 2=mild, 3=moderate, and 4=marked
Depletion of lymphoid cells in the thymus and spleen was observed only in 20,000 ppm mice and was
considered secondary to reduced body weight gain and inanition. Unlike the observations in rats, no
microscopic effects that would account for increased kidney weights were seen in mice.
The testis and epididymis weights of male mice in the 10,000 ppm group were significantly less than those of
the controls. There were no other significant differences in sperm motility or vaginal cytology parameters
between exposed and control males or females (Tables D3 and D4).
Males in all exposed groups except the 10,000 ppm group had significantly greater cytochrome P450
concentrations than the controls (Table E2). Ethoxyresorufin deethylase activities (expressed as pmol/min per
mg protein) and pentoxyresorufin dealkylase activities (expressed as pmol/min per mg protein or per nmol
cytochrome P450) were significantly greater in all groups of exposed male mice than in the controls. For
females, both measurements of ethoxyresorufin deethylase activity were significantly greater in all exposed
groups than in the controls. Pentoxyresorufin dealkylase activities were generally greater in females in all
exposed groups than in the controls; however, the difference for each measurement in the 20,000 ppm group
was not significant.
No changes were observed in the microscopic evaluation of the lens, retina, and other ocular structures of the
control mice, 10,000 ppm males, or 20,000 ppm females.

39 Benzophenone, NTP TOX 61
GENETIC TOXICOLOGY
Benzophenone showed no evidence of mutagenicity in vitro or in vivo. Benzophenone (1 to 1,000 µg/plate) did
not induce mutations in Salmonella typhimurium strain TA98, TA100, TA1535, or TA1537, with or without
induced liver S9 metabolic activation enzymes (Table F1; Mortelmans et al., 1986). Intraperitoneal injections
of 200 to 500 mg benzophenone/kg body weight (three injections at 24-hour intervals) did not induce
micronuclei in bone marrow polychromatic erythrocytes of male B6C3F1 mice (Table F2). A small increase
in the frequency of micronucleated polychromatic erythrocytes was noted in the 400 mg/kg group, but this was
not statistically significant.

40 Benzophenone, NTP TOX 61

41
DISCUSSION
Benzophenone is used to manufacture insecticides, agricultural chemicals, and hypnotics, antihistamines, and
other pharmaceuticals; as an ultraviolet curing agent in sunglasses and ink; as an additive in plastics, coatings,
and adhesive formulations; and, occasionally, as a flavor ingredient. Concentrations of benzophenone in food
products range from 0.57 ppm in nonalcoholic beverages to 3.27 ppm in frozen dairy products; it may also be
an ingredient in baked goods, soft candy, gelatins, and puddings (NAS/NRC, 1979).
The liver, kidney, and hematopoietic system were identified as targets of benzophenone toxicity in rats exposed
to benzophenone in feed for 10 to 90 days (USEPA, 1984; Burdock et al., 1991). In those studies, exposure
concentration-dependent increases in absolute and relative liver weights and relative kidney weight were
observed. Mild degenerative effects were observed in the liver and bone marrow of rats, suggesting that the
liver may be the primary target of the toxic effects of benzophenone and that the bone marrow may also be
targeted. The no-observed-adverse-effect level (NOAEL) was reached at 20 mg/kg (0.05%) in 13-week studies.
In the current studies, benzophenone was unpalatable at 20,000 ppm. All 20,000 ppm rats had significant body
weight loss and were terminated for humane reasons before the end of studies. All male mice and four female
mice in the 20,000 ppm group died. There was no exposure-related mortality in the remaining groups.
Significantly decreased body weights were observed in all exposed groups of male (except 1,250 ppm) and
female rats. Lower body weights were apparent in 10,000 ppm male mice and in 5,000 ppm or greater female
mice.
In rats, pathologic changes in the liver and kidney were discovered upon microscopic observation. Increased
kidney weights were associated with a spectrum of renal changes in exposed male and female rats. One change
found predominantly in 20,000 ppm animals, which died early, was papillary necrosis characterized by acute
coagulative necrosis of the distal tips of the renal papillae. Unique lesions seen in rats that died early as well
as in survivors were well-demarcated, wedge-shaped areas of prominent tubule dilatation. In male rats, this
change was present at exposure concentrations of 2,500 ppm and greater, while in females it occurred only at
10,000 and 20,000 ppm. Foci of tubule regeneration were increased relative to the controls in exposed males
and females. Based on these findings, a NOAEL for kidney changes was not reached in either males or
females. Exposure-related increases in liver weights were attributed to hypertrophy and/or cytoplasmic
vacuolization of hepatocytes.

42 Benzophenone, NTP TOX 61
In mice, significant microscopic findings were limited to centrilobular hypertrophy in the liver, which
corresponded to increased liver weights. The severity of hepatocyte hypertrophy was exposure concentration
dependent, with marked severity occurring in 20,000 ppm mice. Because there were increased incidences of
minimal hypertrophy relative to the control groups at 1,250 ppm, a NOAEL for benzophenone in mice was not
reached.
Hematology results indicated that exposure of rats and mice to benzophenone affected the circulating erythroid
mass. There was evidence of a transient erythrocytosis in exposed rats on day 4. This alteration would be
consistent with hemoconcentration of dehydration. Dehydration as a possible mechanism would be supported
by the early and dramatic body weight decreases in the 10,000 ppm and 20,000 ppm groups. It is generally
thought that rats that do not eat, do not drink. Because there was a marked reduction in body weight gains in
the higher exposure groups, it could be theorized that the exposed animals were not eating properly and, thus,
not drinking properly. The minimal to mild increases in albumin, total protein, and urea nitrogen
concentrations which occurred in exposed animals in various groups on day 22 and at week 14 also would be
consistent with dehydration.
There was evidence of an anemia on day 22 and at week 14 for the rats and at week 14 for the male mice. In
a separate study, Sprague-Dawley rats given 100 and 500 mg benzophenone per kilogram body weight in feed
for 28 days developed decreases of the circulating erythron (Burdock et al., 1991). Also, an anemia has been
described for Wistar rats given a structurally related compound, 2-hydroxy-4-methoxybenzophenone, at
concentrations of 5,000 and 10,000 ppm in the diet for 28 days (Lewerenz et al., 1972). Anemia did not occur,
however, in F344/N rats administered up to 50,000 ppm 2-hydroxy-4-methoxybenzophenone in feed for
13 weeks (NTP, 1992). In the present studies, the evidence indicated that the anemia was of minimal severity
and, though this evidence indicated a biological effect, it would not be considered clinically relevant; the
possibility, however, that dehydration masked the severity of the anemia must be considered. The mechanism
for the anemia is not known. There was evidence of a bone marrow response to the anemia for the male rats
but not for the female rats or the mice. However, the lack of a strong erythroid response could be related to
the minimal severity of the erythron change and, possibly, an erythropoietic suppression related to an altered
nutritional status because of decreased feed intake.
In the rats, transient exposure concentration-related increases in platelet counts occurred in males and females
on day 4. Transient increases in platelet counts could be consistent with a physiologic response resulting from
mobilization of platelets from splenic and/or nonsplenic storage pools. The spleen acts as a reservoir for a
significant portion of the total intravascular platelet mass, and altered or decreased splenic function could also
43 Benzophenone, NTP TOX 61
cause an increased release of platelets from the splenic pool to the circulation (Jain, 1986). Increased platelet
counts have been described for F344/N rats given up to 50,000 ppm 2-hydroxy-4-methoxybenzophenone in feed
for 13 weeks (NTP, 1992). Platelet counts were decreased on day 22 and at week 14 in the present study.
Decreased platelet counts can be related to decreased platelet production, increased platelet consumption,
excessive blood loss, or abnormal distribution (Jain, 1986); the mechanism for the decrease in this study is
unknown. The decrease in platelet counts indicated a biologic effect but was of a mild severity that would not
have been expected to lead to a clinical hemorrhagic diathesis. Thus, it does not appear that hemorrhage related
to decreased platelet counts contributed to the anemia that was observed.
In these rat and mouse studies, treatment-related increases in alanine aminotransferase and/or sorbitol
dehydrogenase activities and bile salt concentrations would indicate a hepatic effect and were consistent with
the histopathologic liver alterations and increases in liver weights. In general, increases in serum activities of
alanine aminotransferase and sorbitol dehydrogenase, considered liver-specific enzymes in rodents, are used
as markers of hepatocellular necrosis or increased cell membrane permeability (Boyd, 1983; Clampitt and Hart,
1978). At the interim time points for rats, however, increases in alanine aminotransferase activity occurred
without concomitant increases in serum sorbitol dehydrogenase activity. Certain compounds can induce
increases in liver alanine aminotransferase activity (Rosen et al., 1959a,b). Thus, compound-induced increases
in liver alanine aminotransferase activity may help explain the increased serum alanine aminotransferse, but not
sorbitol dehydrogenase, activity at the early time points. In rats, similar responses for alanine aminotransferase
and sorbitol dehydrogenase activity also occurred in the 13-week feed study of 2-hydroxy-4-
methoxybenzophenone (NTP, 1992).
Increases in serum bile salt concentration and alkaline phosphatase activity are used as markers of cholestasis.
In the rat study, increased bile salt concentrations occurred, but alkaline phosphatase activity was decreased for
all exposed rats at all time points. Though these findings would appear to be incongruous, similar bile salt
concentration and alkaline phosphatase activity responses have been observed in other subchronic toxicity
studies (Travlos et al., 1996). Bile salt concentrations can be affected by mechanisms other than cholestasis.
For example, altered enterohepatic circulation and impaired hepatocellular function or hepatocellular injury can
elevate circulating bile salt concentrations (Hofmann, 1988). Additionally, circulating alkaline phosphatase in
normal rats is thought to be primarily of intestinal and bone origin (Bianchi-Bosisio Righetti and Kaplan, 1971),
and fasting or feed restriction causes decreases in serum alkaline phosphatase activity (Jenkins and Robinson,
1975). Substantial, treatment-related decreases in mean body weights and body weight gains suggested that
exposed rats did not eat well, which may, in part, explain the decreases in the serum alkaline phosphatase
activity. In the mouse study, treatment-related increases in bile salt concentrations were accompanied by
44 Benzophenone, NTP TOX 61
increased alkaline phosphatase activity in the 20,000 ppm female mice; this is consistent with a cholestatic
effect. In the 13-week feed study of 2-hydroxy-4-methoxybenzophenone, evidence of cholestasis was
demonstrated by increases of serum (-glutamyltransferase activity in rats (NTP, 1992).
The results of the current studies are similar in target organs and/or morphology to those seen in the studies
of 2-hydroxy-4-methoxybenzophenone (NTP, 1992). However, the effects were more prominent at lower
exposure concentrations in the benzophenone studies, suggesting quantitative differences in toxicity between
the congeners. A NOAEL of 6,250 ppm in feed was determined for 2-hydroxy-4-methoxybenzophenone for
rats and mice, while a NOAEL was not established for rats or mice in these benzophenone studies.
The toxication-detoxication of a large number of chemicals is mediated by a group of enzymes referred to as
cytochrome P450-dependent, mixed-function oxidases (Parke and Ioannides, 1990). In rats, 14 weeks of
exposure to benzophenone resulted in increases in cytochrome P450 concentrations in all exposed male and
female groups with survivors. This increase was not exposure concentration related and ranged from 18% to
51% for males and 27% to 42% for females. In mice, the increases in cytochrome P450 concentrations (25%
to 28% in males, 15% to 19% in females) occurred only in the 1,250, 2,500, and 5,000 ppm groups of males
and the 1,250 and 2,500 ppm groups of females. There was induction of a form of cytochrome P450
characteristic of a phenobarbital-type inducer that preferentially increases the concentration of the 2B form of
the enzyme. The weak induction response observed with ethoxyresorufin deethylase activity suggested that
benzophenone was not a polycyclic aromatic hydrocarbon-type inducer of cytochrome P450. The marked
increase in pentoxyresorufin dealkylase activity provided evidence that benzophenone was a relatively potent
inducer of the phenobarbital-type (2B) cytochrome P450. The induction was not as great in mice as it was in
rats. On a per mg protein basis, the increase in pentoxyresorufin dealkylase activity was on the order of 57-
to 99-fold for rats and 9- to 21-fold for mice.
Results of the current studies identified the liver as the primary target organ of benzophenone toxicity. In rats,
liver changes were observed at exposure concentrations greater than or equal to 5,000 ppm, while in mice,
microscopic changes in the liver were observed in all but the 1,250 ppm group. The gross (increased organ
weights) and microscopic (hepatocellular hypertrophy) liver changes associated with benzophenone
administration in males and females were accompanied by benzophenone-induced increases in the activity of
pentoxyresorufin dealkylase, an enzyme linked to the cytochrome P450 2B isomer. Hypertrophy (increases in
cell size) is often attributed in part to induction of metabolic enzymes. Many chemical agents inducing liver
hypertrophy are mainly metabolized by hepatic drug-metabolizing enzymes; stimulation of these enzymes is
usually associated with liver enlargement. These effects are considered to be an overall adaptive response of

45 Benzophenone, NTP TOX 61
the liver to xenobiotic compounds or hyperfunctional liver enlargement (Schulte-Hermann, 1974, 1985; Schulte-
Hermann et al., 1983). Hepatocarcinogens also induce changes such as hypertrophy and enzyme induction
(Schulte-Hermann, 1974). According to Parke and Ioannides (1990), compounds inducing cytochrome P450
enzymes that may react with the compound repeatedly produce oxygen radicals in a process called futile cycling.
Oxygen radicals and oxidative stress have been implicated in all stages of carcinogenesis, that is, initiation,
promotion, and progression (Trush and Kensler, 1991). Furthermore, it has been shown that a linear
correlation exists between a compound’s ability to induce cytochrome P450 2B and its ability to function as a
hepatic tumor promoter in mice. This correlation exists for a number of hepatocarcinogens such as
phenobarbital, lindane, and DDT (Klaunig and Kolaja, 1998). Based on the above information, it may be
speculated that the liver is a likely target site for benzophenone carcinogenicity. However, carcinogenicity
studies are needed to establish benzophenone as a hepatocarcinogen.
In the current studies, the kidney was identified as an additional target organ of benzophenone toxicity in rats.
While the liver is the major organ involved in drug metabolism, the kidneys are also capable of carrying out
extensive oxidation, reduction, hydrolysis, and conjugation reactions (Lash, 1994). In the current studies,
cytochrome P450 was not determined in the kidneys of animals administered benzophenone.
Some notable species and sex differences were observed in the current toxicity studies. The toxicity data
indicated that rats were somewhat more sensitive to the effects of benzophenone exposure than mice. Mice
required higher doses on a mg/kg body weight basis to display benzophenone toxicity. No microscopic effects
similar to those in the kidney of exposed rats were present in mice to account for increased kidney weights.
A NOAEL for liver toxicity was achieved in rats but not in mice. These species differences could be due to
the differences in disposition and metabolism of benzophenone between rats and mice.
The testis and epididymis weights of male mice in the 10,000 ppm group were significantly less than those of
the controls. There were no other significant differences in sperm motility or vaginal cytology parameters
between exposed and control male or female rats or mice. No treatment-related changes of the lens, retina, or
other ocular structures of rats or mice were observed.
In conclusion, the liver is a primary target organ of benzophenone toxicity in rats and mice based on increases
in liver weights, hepatocellular hypertrophy, clinical chemistry changes, and induction of the liver microsomal
cytochrome P450 2B isomer. The kidney was also identified as a target organ of benzophenone toxicity in rats
only, based on exposure concentration-related increases in kidney weights and microscopic changes. The
NOAEL for benzophenone was not achieved in these studies. Benzophenone is not mutagenic in Salmonella

46 Benzophenone, NTP TOX 61
typhimurium with or without metabolic activation. The toxicologic profile of benzophenone is similar to a
number of known nongenotoxic hepatocarcinogens in mice, suggesting that benzophenone is a potential liver
carcinogen.
47
REFERENCES
The Aldrich Library of FT-IR Spectra (1985). 1st ed. (C.J. Pouchert, Ed.), Vol. 2, p. 58A. Aldrich Chemical
Company, Milwaukee, WI.
American Paint and Coatings Journal (1990). Velsicol Chemical to Buy Upjohn Benzophenone Business. Am.
Paint Coatings J. 74, 16.
Bianchi-Bosisio Righetti, A., and Kaplan, M.M. (1971). The origin of the serum alkaline phosphatase in
normal rats. Biochim. Biophys. Acta 230, 504-509.
Boorman, G.A., Montgomery, C.A., Jr., Eustis, S.L., Wolfe, M.J., McConnell, E.E., and Hardisty, J.F.
(1985). Quality assurance in pathology for rodent carcinogenicity studies. In Handbook of Carcinogen Testing
(H.A. Milman and E.K. Weisburger, Eds.), pp. 345-357. Noyes Publications, Park Ridge, NJ.
Boorman, G.A., Hickman, R.L., Davis, G.W., Rhodes, L.S., White, N.W., Griffin, T.A., Mayo, J., and
Hamm, T.E., Jr. (1986). Serological titers to murine viruses in 90-day and 2-year studies. In Complications
of Viral and Mycoplasmal Infections in Rodents to Toxicology Research and Testing (T.E. Hamm, Jr., Ed.),
pp. 11-23. Hemisphere, New York.
Bronaugh, R.L., Wester, R.C., Bucks, D., Maibach, H.I., and Sarason, R. (1990). In vivo percutaneous
absorption of fragrance ingredients in rhesus monkeys and humans. Food Cosmet. Toxicol. 28, 369-373.
Boyd, J.W. (1983). The mechanisms relating to increases in plasma enzymes and isoenzymes in diseases of
animals. Vet. Clin. Pathol. 12, 9-24.
Burdock, G.A., Pence, D.H., and Ford, R.A. (1991). Safety evaluation of benzophenone. Food Chem.
Toxicol. 29, 741-750.
Burke, M.D., Thompson, S., Elcombe, C.R., Halpert, J., Haaparanta, T., and Mayer, R.T. (1985). Ethoxy-,
pentoxy-, and benzyloxyphenoxazones and homologues: A series of substrates to distinguish between different
induced cytochromes P-450. Biochem. Pharmacol. 34, 3337-3345.

48 Benzophenone, NTP TOX 61
Calas, E., Castelain, P.Y., Lapointe, H.R., Ducos, P., Cavelier, C., Duprat, P., and Poitou, P. (1977).
Allergic contact dermatitis to a photopolymerizable resin used in printing. Contact Dermatitis 3, 186-194.
Caprino, L., Togna, G., and Mazzei, M. (1976). Toxicological studies of photosensitizing agents and
photodegradable polyolefins. Eur. J. Toxicol. 9, 99-103.
Chemical Business Newsbase (1991). On-line database maintained by the Royal Society of Chemistry.
Chemical Carcinogenesis Research Information System (CCRIS) (1991). On-line database maintained by the
National Library of Medicine.
Clampitt, R.B., and Hart, R.J. (1978). The tissue activities of some diagnostic enzymes in ten mammalian
species. J. Comp. Pathol. 88, 607-621.
Code of Federal Regulations (CFR) 21, Part 58.
Dixon, W.J., and Massey, F.J., Jr. (1951). Introduction to Statistical Analysis, 1st ed., pp. 145-147.
McGraw-Hill Book Company, Inc., New York.
Dunn, O.J. (1964). Multiple comparisons using rank sums. Technometrics 6, 241-252.
Dunnett, C.W. (1955). A multiple comparison procedure for comparing several treatments with a control.
J. Am. Stat. Assoc. 50, 1096-1121.
Eastman Kodak Company (1991). Benzophenone Toxicity. Table summary of unpublished toxicity studies
conducted by Eastman Kodak Company. Eastman Kodak Company, Rochester, NY.
Finco, D.R. (1989). Kidney function. In Clinical Biochemistry of Domestic Animals, 4th ed. (J.J. Kaneko,
Ed.), pp. 496-542. Academic Press, Inc., San Diego, CA.
Fluck, E.R., Poirier, L.A., and Ruelius, H.W. (1976). Evaluation of a DNA polymerase-deficient mutant of
E. coli for the rapid detection of carcinogens. Chem. Biol. Interact. 15, 219-231.
Furia, T.E., and Bellanca, N. (Eds.) (1975). Fenaroli’s Handbook of Flavor Ingredients, 2nd ed., Vol. 2,
p. 43. CRC Press, Cleveland, OH.

49 Benzophenone, NTP TOX 61
Gart, J.J., Chu, K.C., and Tarone, R.E. (1979). Statistical issues in interpretation of chronic bioassay tests
for carcinogenicity. JNCI 62, 957-974.
Hansch, C., and Leo, A.J. (1979). Substituent Constants for Correlation Analysis in Chemistry and Biology,
p. 275. John Wiley and Sons, New York.
Hazardous Chemicals Desk Reference (1997). 4th ed. (R.J. Lewis, Sr., Ed.), pp. 121-122. Van Nostrand
Reinhold, New York.
Hazardous Substances Data Bank (HSDB) (1997). Maintained, reviewed, and updated on the National Library
of Medicine’s Toxicology Data Network (TOXNET). Available through the MEDLARS System.
Helmig, D., Müller, J., and Klein, W. (1989). Volatile organic substances in a forest atmosphere.
Chemosphere 19, 1399-1412.
Hofmann, A.F. (1988). Bile acids. In The Liver: Biology and Pathobiology (I.M. Arias, W.B. Jakoby,
H. Popper, D. Schachter, and D.A. Shafritz, Eds.), pp. 553-572. Raven Press, Ltd., New York.
IRIS (1991).
Integrated Laboratory Systems (ILS) (1990). Micronucleus Data Management and Statistical Analysis Software,
Version 1.4. ILS, P.O. Box 13501, Research Triangle Park, NC 27707.
Jain, N.C., Ed. (1986). Quantitative and qualitative disorders of platelets. In Schalm’s Veterinary Hematology,
4th ed., pp. 466-486. Lea and Febiger, Philadelphia, PA.
Jenkins, F.P., and Robinson, J.A. (1975). Serum biochemical changes in rats deprived of food or water for
24 h. Proc. Nutr. Soc. 34, 37A.
Jonckheere, A.R. (1954). A distribution-free k-sample test against ordered alternatives. Biometrika 41,
133-145.
Kaneko, J.J. (1989). Serum proteins and the dysproteinemias. In Clinical Biochemistry of Domestic Animals,
4th ed. (J.J. Kaneko, Ed.), pp. 142-165. Academic Press, Inc., San Diego, CA.

50 Benzophenone, NTP TOX 61
Kirk-Othmer Encyclopedia of Chemical Technology (1978). 3rd ed., vol. 3, p. 934. John Wiley and Sons,
New York.
Klaunig, J.E., and Kolaja, K.L. (1998). Chemical-induced hepatocarcinogenesis. In Toxicology of the Liver
(Hewitt, W.R. and Plaa, G.L., Eds.), 2nd ed., p. 93-121. Taylor and Francis, Washington, DC.
Lash, L.H. (1994). Role of renal metabolism in risk to toxic chemicals. Environ. Health Perspect. 102, 75-79.
Leary, J.A., Biemann, K., Lafleur, A.L., Kruzel, E.L., Prado, G.P., Longwell, J.P., and Peters, W.A.
(1987). Chemical and toxicological characterization of residential oil burner emissions: I. Yields and chemical
characterization of extractables from combustion of No. 2 fuel oil at different Bacharach smoke numbers and
firing cycles. Environ. Health Perspect. 73, 223-234.
Lewerenz, H.J., Lewerenz, G., and Plass, R. (1972). Contribution to the toxicology of the UV-absorber,
MOB 2-hydroxy-4-methoxy benzophenone [in German]. Nahrung 16, 133-134.
Lubet, R.A., Mayer, R.T., Cameron, J.W., Nims, R.W., Burke, M.D., Wolff, T., and Guengerich, F.P.
(1985). Dealkylation of pentoxyresorufin: A rapid and sensitive assay for measuring induction of
cytochrome(s) P-450 by phenobarbital and other xenobiotics in the rat. Arch. Biochem. Biophys. 238, 43-48.
Maronpot, R.R., and Boorman, G.A. (1982). Interpretation of rodent hepatocellular proliferative alterations
and hepatocellular tumors in chemical safety assessment. Toxicol. Pathol. 10, 71-80.
The Merck Index (1996). 12th ed. (S. Budavari, Ed.), p. 184. Merck and Company, Rahway, NJ.
Morrison, D.F. (1976). Multivariate Statistical Methods, 2nd ed., pp. 170-179. McGraw-Hill Book Company,
New York.
Mortelmans, K., Haworth, S., Lawlor, T., Speck, W., Tainer, B., and Zeiger, E. (1986). Salmonella
mutagenicity tests: II. Results from the testing of 270 chemicals. Environ. Mutagen. 8, 1-4, 11-27, 39, and 46.
National Academy of Sciences/National Research Council (NAS/NRC) (1979). The 1977 Survey of Industry
on the Use of Food Additives. Vols. 1-3. Committee on GRAS List Survey–Phase III. Food and Nutrition
Board, National Research Council, National Academy of Sciences, Washington, DC.

51 Benzophenone, NTP TOX 61
National Institute for Occupational Safety and Health (NIOSH) (1990). National Occupational Exposure Survey
(1981-1983), unpublished provisional data as of July 1, 1990. NIOSH, Cincinnati, OH.
National Toxicology Program (NTP) (1991). Technical Protocol for Sperm Morphology and Vaginal Cytology
Evaluations in Toxicity Testing for Rats and Mice, 10/31/82 version (updated May 1991). U.S. Department
of Health and Human Services, Public Health Service, National Institutes of Health, Research Triangle
Park, NC.
National Toxicology Program (NTP) (1992). NTP Technical Report on Toxicity Studies of 2-Hydroxy-4-
methoxybenzophenone Administered Topically and in Dosed Feed to F344/N Rats and B6C3F1 Mice. Toxicity
Report Series No. 21. NIH Publication No. 92-3344. U.S. Department of Health and Human Services, Public
Health Service, National Institutes of Health, Research Triangle Park, NC.
Oil and Hazardous Materials-Technical Assistance Data System (OHMTADS) (1991). On-line database
maintained by the U.S. Environmental Protection Agency.
Omura, T., and Sato, R. (1964). The carbon monoxide-binding pigment of liver microsomes. J. Biol. Chem.
239, 2370-2378.
Opdyke, D.L.S. (1973). Monographs on fragrance raw materials. Food Cosmet. Toxicol. 11, 873-874.
Parke, D.V., and Ioannides, C. (1990). Role of cytochromes P-450 in mouse liver tumor production. In
Mouse Liver Carcinogenesis: Mechanisms and Species Comparisons, pp. 215-230. Alan R. Liss, Inc., New
York.
Ragan, H.A. (1989). Markers of renal function and injury. In The Clinical Chemistry of Laboratory Animals
(W.F. Loeb and F.W. Quimby, Eds.), pp. 321-343. Pergamon Press, Inc., New York.
Rao, G.N., Haseman, J.K., and Edmondson, J. (1989a). Influence of viral infections on body weight, survival,
and tumor prevalence in Fischer 344/NCr rats on two-year studies. Lab. Anim. Sci. 39, 389-393.
Rao, G.N., Piegorsch, W.W., Crawford, D.D., Edmondson, J., and Haseman, J.K. (1989b). Influence of
viral infections on body weight, survival, and tumor prevalence of B6C3F1 (C57BL/6N × C3H/Hen) mice in
carcinogenicity studies. Fundam. Appl. Toxicol. 13, 156-164.

52 Benzophenone, NTP TOX 61
Robinson, D. (1958). Studies in detoxication. 74. The metabolism of benzhydrol, benzophenone and
p-hydroxybenzophenone. Biochem. J. 68, 584-586.
Robinson, D., and Williams, R.T. (1957). The metabolism of benzophenone. Biochem. J. 66, 46-47.
Rosen, F., Roberts, N.R., Budnick, L.E., and Nichol, C.A. (1959a). Corticosteroids and transaminase
activity: The specificity of the glutamic pyruvic transaminase response. Endocrinology 65, 256-264.
Rosen, F., Roberts, N.R., and Nichol, C.A. (1959b). Glucocorticosteroids and transaminase activity:
I. Increased activity of glutamic-pyruvic transaminases in four conditions associated with gluconeogenesis.
J. Biol. Chem. 234, 476-480.
Rutten, A.A.J.J.L., Falke, H.E., Catsburg, J.F., Wortelboer, H.M., Blaauboer, B.J., Doorn, L.,
van Leeuwen, F.X.R., Theelen, R., and Rietjens, I.M.C.M. (1992). Interlaboratory comparison of microsomal
ethoxyresorufin and pentoxyresorufin O-dealkylation determinations: Standardization of assay conditions.
Arch. Toxicol. 66, 237-244.
Schulte-Hermann, R. (1974). Induction of liver growth by exogenous stimuli. CRC Crit. Rev. Toxicol. 3,
97-158.
Schulte-Hermann, R. (1985). Tumor promotion in the liver. Arch. Toxicol. 57, 147-158.
Schulte-Hermann, R., Timmermann-Trosiener, I., and Schuppler, J. (1983). Promotion of spontaneous
preneoplastic cells in rat liver as a possible explanation of tumor production by nonmutagenic compounds.
Cancer Res. 43, 839-844.
Shelby, M.D., Erexson, G.L., Hook, G.J., and Tice, R.R. (1993). Evaluation of a three-exposure mouse bone
marrow micronucleus protocol: Results with 49 chemicals. Environ. Mol. Mutagen. 21, 160-179.
Shirley, E. (1977). A non-parametric equivalent of Williams’ test for contrasting increasing dose levels of a
treatment. Biometrics 33, 386-389.
The Sigma-Aldrich Library of Chemical Safety Data (1988). 2nd ed. (R.E. Lenga, Ed.). Sigma-Aldrich
Corporation, Milwaukee, WI.
53 Benzophenone, NTP TOX 61
Stenbäck, F. (1977). Local and systemic effects of commonly used cutaneous agents: Lifetime studies of
16 compounds in mice and rabbits. Acta Pharmacol. Toxicol. 41, 417-431.
Stenbäck, F., and Shubik, P. (1974). Lack of toxicity and carcinogenicity of some commonly used cutaneous
agents. Toxicol. Appl. Pharmacol. 30, 7-13.
Stocklinski, A.W., Ware, O.B., and Obserst, T.J. (1979). Benzophenone metabolism. I. Isolation of
p-hydroxybenzophenone from rat urine. Life Sci. 26, 365-368.
Travlos, G.S., Morris, R.W., Elwell, M.R., Duke, A., Rosenblum, S., and Thompson, M.B. (1996).
Frequency and relationships of clinical chemistry and liver and kidney histopathology findings in 13-week
toxicity studies in rats. Toxicology 107, 17-29.
Trush, M.A., and Kensler, T.W. (1991). An overview of the relationship between oxidative stress and
chemical carcinogenesis. Free Radic. Biol. Med. 10, 201-209.
Tsonis, P.A., and Eguchi, G. (1982). Abnormal limb regeneration without tumor production in adult newts
directed by carcinogens, 20-methylcholanthrene and benzo(a)pyrene. Dev., Growth, Differ. 24, 183-190.
United States Environmental Protection Agency (USEPA) (1984). Information Review; Benzophenone.
Submitted by CRCS, Rockville, MD, in collaboration with Dynamac Corporation Environmental Control
Division, Rockville, MD, to USEPA, TSCA Interagency Testing Committee.
United States Environmental Protection Agency (USEPA) (1991). TSCAPP computer printout: 1983
Production Statistics for Chemicals in the Nonconfidential Initial TSCA Chemical Substances Inventory. Office
of Pesticides and Toxic Substances, Washington, DC.
Williams, D.A. (1971). A test for differences between treatment means when several dose levels are compared
with a zero dose control. Biometrics 27, 103-117.
Williams, D.A. (1972). A comparison of several dose levels with a zero dose control. Biometrics 28, 519-531.
Winsten, S. (1965). Standard Methods of Clinical Chemistry, Vol. 5, p. 1. Academic Press, New York.

54 Benzophenone, NTP TOX 61

A-1
APPENDIX A SUMMARY OF NONNEOPLASTIC LESIONS
IN RATS AND MICE
TABLE A1 Summary of the Incidence of Nonneoplastic Lesions in Male Rats in the 14-Week Feed Study of Benzophenone . . . . . . . . . . . . . . . . . . . . . . . . . . . . . . . . . . A-2
TABLE A2 Summary of the Incidence of Nonneoplastic Lesions in Female Rats in the 14-Week Feed Study of Benzophenone . . . . . . . . . . . . . . . . . . . . . . . . . . . . . . . . . . A-4
TABLE A3 Summary of the Incidence of Nonneoplastic Lesions in Male Mice in the 14-Week Feed Study of Benzophenone . . . . . . . . . . . . . . . . . . . . . . . . . . . . . . . . . . A-6
TABLE A4 Summary of the Incidence of Nonneoplastic Lesions in Female Mice in the 14-Week Feed Study of Benzophenone . . . . . . . . . . . . . . . . . . . . . . . . . . . . . . . . . . A-8
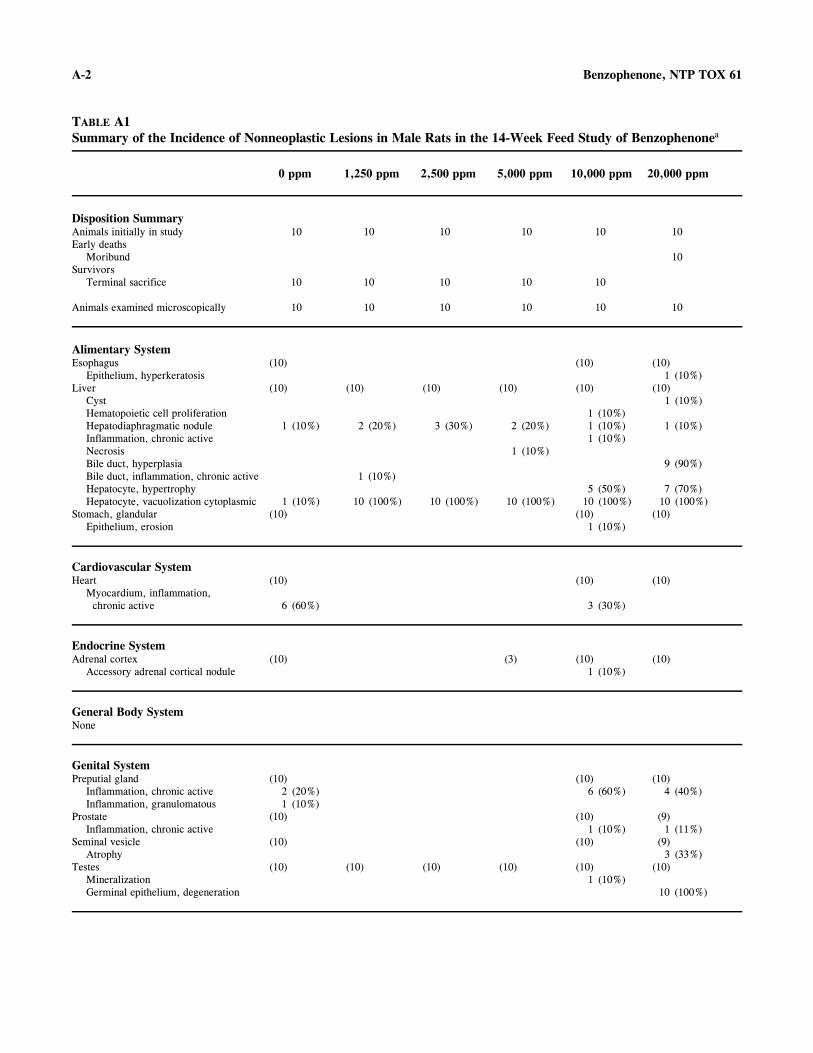
A-2 Benzophenone, NTP TOX 61
TABLE A1 Summary of the Incidence of Nonneoplastic Lesions in Male Rats in the 14-Week Feed Study of Benzophenonea
0 ppm 1,250 ppm 2,500 ppm 5,000 ppm 10,000 ppm 20,000 ppm
Disposition Summary Animals initially in study Early deaths
Moribund Survivors
Terminal sacrifice
10
10
10
10
10
10
10
10
10
10
10
10
Animals examined microscopically 10 10 10 10 10 10
Alimentary System Esophagus
Epithelium, hyperkeratosisLiver
CystHematopoietic cell proliferationHepatodiaphragmatic noduleInflammation, chronic activeNecrosisBile duct, hyperplasiaBile duct, inflammation, chronic activeHepatocyte, hypertrophyHepatocyte, vacuolization cytoplasmic
Stomach, glandular Epithelium, erosion
(10)
(10)
1 (10%)
1 (10%)(10)
(10)
2 (20%)
1 (10%)
10 (100%)
(10)
3 (30%)
10 (100%)
(10)
2 (20%)
1 (10%)
10 (100%)
(10)
(10)
1 (10%) 1 (10%) 1 (10%)
5 (50%) 10 (100%)
(10) 1 (10%)
(10) 1 (10%)
(10) 1 (10%)
1 (10%)
9 (90%)
7 (70%) 10 (100%)
(10)
Cardiovascular System Heart
Myocardium, inflammation, chronic active
(10)
6 (60%)
(10)
3 (30%)
(10)
Endocrine System Adrenal cortex
Accessory adrenal cortical nodule(10) (3) (10)
1 (10%) (10)
General Body System None
Genital System Preputial gland (10) (10) (10)
Inflammation, chronic active 2 (20%) 6 (60%) 4 (40%) Inflammation, granulomatous 1 (10%)
Prostate (10) (10) (9) Inflammation, chronic active 1 (10%) 1 (11%)
Seminal vesicle (10) (10) (9) Atrophy 3 (33%)
Testes (10) (10) (10) (10) (10) (10) Mineralization 1 (10%) Germinal epithelium, degeneration 10 (100%)

A-3 Benzophenone, NTP TOX 61
TABLE A1 Summary of the Incidence of Nonneoplastic Lesions in Male Rats in the 14-Week Feed Study of Benzophenone
0 ppm 1,250 ppm 2,500 ppm 5,000 ppm 10,000 ppm 20,000 ppm
Hematopoietic System Bone marrow (10) (10) (10) (10) (10) (10)
Atrophy 10 (100%)
Integumentary System None
Musculoskeletal System None
Nervous System None
Respiratory System Lung (10) (2) (3) (10) (10)
Inflammation, chronic active 1 (10%) 2 (100%) 3 (100%) 1 (10%) 5 (50%)
Special Senses System None
Urinary System Kidney (10) (10) (10) (10) (10) (10)
Inflammation, chronic active 2 (20%) 3 (30%) 4 (40%) 2 (20%) Mineralization 5 (50%) 10 (100%) Papilla, necrosis 2 (20%) 6 (60%) Renal tubule, accumulation, hyaline droplet 1 (10%)
Renal tubule, casts protein 8 (80%) 8 (80%) 9 (90%) 10 (100%) Renal tubule, dilatation 6 (60%) 8 (80%) 9 (90%) 8 (80%) Renal tubule, regeneration 10 (100%) 10 (100%) 10 (100%) 10 (100%) 10 (100%) 8 (80%) Renal tubule, vacuolization cytoplasmic 1 (10%)
Ureter (2) Transitional epithelium, necrosis 2 (100%)
Urinary bladder (10) (10) (9) Transitional epithelium, hyperplasia 1 (10%)
a Number of animals examined microscopically at the site and the number of animals with lesion

A-4 Benzophenone, NTP TOX 61
TABLE A2 Summary of the Incidence of Nonneoplastic Lesions in Female Rats in the 14-Week Feed Study of Benzophenonea
0 ppm 1,250 ppm 2,500 ppm 5,000 ppm 10,000 ppm 20,000 ppm
Disposition Summary Animals initially in study 10 10 10 10 10 10 Early deaths
Moribund 9 Natural death 1
Survivors Terminal sacrifice 10 10 10 10 10
Animals examined microscopically 10 10 10 10 10 10
Alimentary System Intestine large, cecum (9) (10) (9)
Inflammation, chronic active 1 (11%) Liver (10) (10) (10) (10) (10) (9)
Hepatodiaphragmatic nodule 1 (10%) 4 (40%) 2 (20%) 3 (30%) 1 (10%) 2 (22%) Inflammation, chronic active 3 (30%) Inflammation, granulomatous 2 (20%) 4 (40%) Hepatocyte, hypertrophy 2 (20%) 8 (80%) 10 (100%) 10 (100%) 7 (78%) Hepatocyte, vacuolization cytoplasmic 9 (90%) 10 (100%) 7 (78%)
Mesentery (1) (1) (1) Inflammation, granulomatous 1 (100%) Necrosis 1 (100%) Fat, inflammation, chronic active 1 (100%)
Cardiovascular System Heart (10) (10) (9)
Myocardium, inflammation, chronic active 1 (10%) 1 (11%)
Endocrine System Adrenal cortex (10) (10) (9)
Accessory adrenal cortical nodule 1 (10%) Inflammation 1 (10%)
Thyroid gland (10) (10) (9) Ultimobranchial cyst 2 (20%)
General Body System None
Genital System Clitoral gland (10) (10) (9)
Inflammation, chronic active 4 (40%) 4 (40%) Ovary (10) (2) (1) (10) (9)
Periovarian tissue, cyst 3 (30%) 2 (100%) 1 (100%) Periovarian tissue, inflammation,
chronic active 1 (11%)

A-5 Benzophenone, NTP TOX 61
TABLE A2 Summary of the Incidence of Nonneoplastic Lesions in Female Rats in the 14-Week Feed Study of Benzophenone
0 ppm 1,250 ppm 2,500 ppm 5,000 ppm 10,000 ppm 20,000 ppm
Hematopoietic System Bone marrow (10) (10) (10) (10) (10) (10)
Atrophy 2 (20%) 10 (100%)
Integumentary System None
Musculoskeletal System None
Nervous System None
Respiratory System Lung (10) (1) (5) (10) (9)
Inflammation, chronic active 1 (100%) 5 (100%) 3 (30%) 6 (67%)
Special Senses System None
Urinary System Kidney (10) (10) (10) (10) (10) (9)
Inflammation, chronic active 2 (20%) 2 (20%) Mineralization 10 (100%) 10 (100%) 10 (100%) 10 (100%) 10 (100%) 9 (100%) Papilla, necrosis 3 (33%) Pelvis, inflammation, suppurative 1 (10%) Renal tubule, casts protein 2 (20%) 4 (40%) Renal tubule, dilatation 3 (30%) 5 (56%) Renal tubule, regeneration 3 (30%) 8 (80%) 6 (60%) 6 (60%) 9 (90%) 7 (78%)
Urinary bladder (10) (10) (9) Transitional epithelium, hyperplasia 1 (10%)
a Number of animals examined microscopically at the site and the number of animals with lesion

A-6 Benzophenone, NTP TOX 61
TABLE A3 Summary of the Incidence of Nonneoplastic Lesions in Male Mice in the 14-Week Feed Study of Benzophenonea
0 ppm 1,250 ppm 2,500 ppm 5,000 ppm 10,000 ppm 20,000 ppm
Disposition Summary Animals initially in study Early deaths
Accidental death Moribund Natural deaths
Survivors Terminal sacrifice
10
10
10
1
9
10
10
10
10
10
10
10
6 4
Animals examined microscopically 10 10 10 10 10 10
Alimentary System Liver
Inflammation, chronic active Centrilobular, hypertrophy Hepatocyte, vacuolization cytoplasmic
(10) 5 (50%) 3 (30%)
(10) 4 (40%) 8 (80%)
(10) 8 (80%)
10 (100%)
(10) 8 (80%)
10 (100%)
(10) 5 (50%)
10 (100%)
(10) 1 (10%)
10 (100%) 3 (30%)
Cardiovascular System Heart
Myocardium, mineralization(10) (1) (10) (10)
2 (20%)
Endocrine System None
General Body System None
Genital System None
Hematopoietic System Spleen (10) (1) (10) (10)
Lymphoid follicle, depletion cellular 5 (50%) Thymus (8) (1) (10) (8)
Atrophy 7 (88%)
Integumentary System None
Musculoskeletal System None
Nervous System None

A-7 Benzophenone, NTP TOX 61
TABLE A3 Summary of the Incidence of Nonneoplastic Lesions in Male Mice in the 14-Week Feed Study of Benzophenone
0 ppm 1,250 ppm 2,500 ppm 5,000 ppm 10,000 ppm 20,000 ppm
Respiratory System Lung (10) (1) (10) (10)
Alveolus, hemorrhage, acute 1 (100%) Arteriole, embolus 1 (100%)
Nose (10) (1) (10) (10) Inflammation, chronic active 1 (10%)
Special Senses System None
Urinary System Kidney (10) (1) (10) (10)
Inflammation, chronic active 1 (10%) Renal tubule, regeneration 1 (10%)
a Number of animals examined microscopically at the site and the number of animals with lesion

A-8 Benzophenone, NTP TOX 61
TABLE A4 Summary of the Incidence of Nonneoplastic Lesions in Female Mice in the 14-Week Feed Study of Benzophenonea
0 ppm 1,250 ppm 2,500 ppm 5,000 ppm 10,000 ppm 20,000 ppm
Disposition Summary Animals initially in study Early deaths
Moribund Natural death
Survivors Terminal sacrifice
10
10
10
10
10
10
10
10
10
10
10
3 1
6
Animals examined microscopically 10 10 10 10 10 10
Alimentary System Liver
Inflammation, chronic active Centrilobular, hypertrophy Hepatocyte, vacuolization cytoplasmic
Salivary glands Infiltration cellular, mononuclear cell
(10) 8 (80%) 3 (30%)
(10) 1 (10%)
(10) 9 (90%)
9 (90%)
(10) 9 (90%)
10 (100%)
(10) 9 (90%)
10 (100%) 2 (20%)
(10) 9 (90%)
10 (100%)9 (90%)
(10) 3 (30%)
10 (100%) 1 (10%)
(10)
Cardiovascular System Heart
Myocardium, mineralization(10) (10)
2 (20%)
Endocrine System None
General Body System None
Genital System Ovary
Cyst(10) (1)
1 (100%) (10)
Hematopoietic System Spleen
Lymphoid follicle, depletion cellularThymus
Atrophy
(10)
(10)
(10) 1 (10%)
(7) 5 (71%)
Integumentary System None
Musculoskeletal System None

A-9 Benzophenone, NTP TOX 61
TABLE A4 Summary of the Incidence of Nonneoplastic Lesions in Female Mice in the 14-Week Feed Study of Benzophenone
0 ppm 1,250 ppm 2,500 ppm 5,000 ppm 10,000 ppm 20,000 ppm
Nervous System Brain
Cyst epithelial inclusion(10) 1 (10%)
(10)
Respiratory System Lung
Arteriole, vasculitis, acuteNose
Inflammation, chronic active
(10)
(10)
(1) 1 (100%)
(10)
(10) 5 (50%)
Special Senses System None
Urinary System None
a Number of animals examined microscopically at the site and the number of animals with lesion

A-10 Benzophenone, NTP TOX 61

B-1
APPENDIX B CLINICAL PATHOLOGY RESULTS
TABLE B1 Hematology Data for Rats in the 14-Week Feed Study of Benzophenone . . . . . . . . . . . . . . . B-2 TABLE B2 Clinical Chemistry Data for Rats in the 14-Week Feed Study of Benzophenone . . . . . . . . . . B-5 TABLE B3 Hematology Data for Mice in the 14-Week Feed Study of Benzophenone . . . . . . . . . . . . . . . B-7 TABLE B4 Clinical Chemistry Data for Mice in the 14-Week Feed Study of Benzophenone . . . . . . . . . . B-8

B-2 Benzophenone, NTP TOX 61
TABLE B1 Hematology Data for Rats in the 14-Week Feed Study of Benzophenonea
0 ppm 1,250 ppm 2,500 ppm 5,000 ppm 10,000 ppm 20,000 ppm
Male
n Day 4 10 10 9 10 10 10 Day 22 10 10 10 10 10 10 Week 14 10 10 10 10 10 0
Hematocrit (%) Day 4 44.3 ± 0.4 45.2 ± 0.4 47.9 ± 0.4** 50.0 ± 0.4** 50.7 ± 0.6** 51.4 ± 0.7** Day 22 48.1 ± 0.5 47.5 ± 0.4 47.3 ± 0.4 47.2 ± 0.5 47.2 ± 0.7 47.3 ± 0.4 Week 14 50.0 ± 0.6 49.2 ± 0.7 49.9 ± 0.6 49.3 ± 0.7 49.1 ± 0.6
Hemoglobin (g/dL) Day 4 15.4 ± 0.1 15.6 ± 0.1 16.3 ± 0.1** 17.0 ± 0.1** 17.2 ± 0.1** 17.5 ± 0.2** Day 22 16.5 ± 0.1 16.1 ± 0.1* 15.8 ± 0.2** 15.7 ± 0.2** 15.5 ± 0.3** 15.8 ± 0.1** Week 14 16.9 ± 0.2 16.4 ± 0.2 16.4 ± 0.1* 16.1 ± 0.2* 15.8 ± 0.1**
Erythrocytes (106/µL) Day 4 7.44 ± 0.07 7.60 ± 0.09 8.01 ± 0.08** 8.31 ± 0.08** 8.45 ± 0.11** 8.49 ± 0.12** Day 22 8.50 ± 0.09 8.23 ± 0.08 8.12 ± 0.08* 8.00 ± 0.07** 7.97 ± 0.13** 8.35 ± 0.08 Week 14 9.29 ± 0.12 8.93 ± 0.10 8.98 ± 0.11 8.65 ± 0.14** 8.48 ± 0.11**
Reticulocytes (106/µL) Day 4 0.28 ± 0.02 0.24 ± 0.01 0.22 ± 0.02 0.21 ± 0.01* 0.18 ± 0.01** 0.17 ± 0.01** Day 22 0.13 ± 0.01 0.14 ± 0.01 0.16 ± 0.01 0.17 ± 0.01 0.19 ± 0.01* 0.07 ± 0.01 Week 14 0.14 ± 0.01 0.16 ± 0.01* 0.18 ± 0.01** 0.21 ± 0.01** 0.19 ± 0.01**
Nucleated erythrocytes (103/µL) Day 4 0.01 ± 0.01 0.00 ± 0.00 0.00 ± 0.00 0.00 ± 0.00 0.00 ± 0.00 0.00 ± 0.00 Day 22 0.00 ± 0.00 0.01 ± 0.01 0.00 ± 0.00 0.00 ± 0.00 0.00 ± 0.00 0.02 ± 0.01 Week 14 0.02 ± 0.02 0.01 ± 0.01 0.01 ± 0.01 0.04 ± 0.02 0.02 ± 0.01
Mean cell volume (fL) Day 4 59.6 ± 0.2 59.5 ± 0.2 59.8 ± 0.2 60.1 ± 0.3 60.0 ± 0.2 60.6 ± 0.3* Day 22 56.5 ± 0.1 57.7 ± 0.1** 58.3 ± 0.2** 59.0 ± 0.2** 59.2 ± 0.2** 56.7 ± 0.2** Week 14 53.9 ± 0.2 55.1 ± 0.1** 55.6 ± 0.1** 57.0 ± 0.3** 57.9 ± 0.2**
Mean cell hemoglobin (pg) Day 4 20.6 ± 0.1 20.5 ± 0.2 20.4 ± 0.1 20.4 ± 0.1 20.4 ± 0.2 20.6 ± 0.2 Day 22 19.4 ± 0.1 19.6 ± 0.1 19.5 ± 0.1 19.7 ± 0.1 19.4 ± 0.1 19.0 ± 0.1 Week 14 18.2 ± 0.1 18.3 ± 0.1 18.3 ± 0.1 18.6 ± 0.1 18.6 ± 0.2
Mean cell hemoglobin concentration (g/dL) Day 4 34.7 ± 0.2 34.5 ± 0.2 34.1 ± 0.2 34.0 ± 0.2 34.0 ± 0.2 34.0 ± 0.3 Day 22 34.4 ± 0.1 33.9 ± 0.2* 33.5 ± 0.2** 33.4 ± 0.2** 32.8 ± 0.2** 33.5 ± 0.1** Week 14 33.8 ± 0.2 33.3 ± 0.2* 32.9 ± 0.3** 32.6 ± 0.2** 32.1 ± 0.3**
Platelets (103/µL) Day 4 966.0 ± 11.1 922.3 ± 27.6 955.7 ± 22.0 1,069.5 ± 17.0** 1,087.1 ± 22.0** 1,050.8 ± 23.0** Day 22 784.3 ± 14.7 827.6 ± 14.0 778.6 ± 11.4 793.0 ± 21.1 705.0 ± 15.3** 547.5 ± 15.7** Week 14 750.9 ± 11.1 783.4 ± 18.4 827.0 ± 12.5* 796.5 ± 16.0 717.7 ± 11.5
Leukocytes (103/µL) Day 4 8.56 ± 0.43 7.92 ± 0.42 9.09 ± 0.58 9.53 ± 0.69 9.18 ± 0.41 9.79 ± 0.62 Day 22 7.50 ± 0.55 7.62 ± 0.46 8.08 ± 0.30 7.98 ± 0.42 7.58 ± 0.33 9.51 ± 0.72 Week 14 12.98 ± 0.74 11.43 ± 0.59 10.17 ± 0.57* 11.31 ± 0.59 13.12 ± 0.97
Segmented neutrophils (103/µL) Day 4 1.24 ± 0.14 1.00 ± 0.08 0.93 ± 0.12 1.16 ± 0.13 1.32 ± 0.11 1.31 ± 0.16 Day 22 1.17 ± 0.09 1.17 ± 0.08 1.27 ± 0.16 1.45 ± 0.22 1.43 ± 0.17 1.72 ± 0.24 Week 14 2.05 ± 0.25 1.61 ± 0.13 1.62 ± 0.38* 1.48 ± 0.14 1.83 ± 0.21
Lymphocytes (103/µL) Day 4 7.19 ± 0.35 6.77 ± 0.43 8.09 ± 0.50 8.14 ± 0.59 7.70 ± 0.42 8.35 ± 0.52 Day 22 6.17 ± 0.49 6.29 ± 0.41 6.64 ± 0.33 6.41 ± 0.31 5.96 ± 0.23 7.61 ± 0.63 Week 14 10.64 ± 0.58 9.69 ± 0.54 8.39 ± 0.51 9.57 ± 0.55 10.98 ± 0.83

B-3 Benzophenone, NTP TOX 61
TABLE B1 Hematology Data for Rats in the 14-Week Feed Study of Benzophenone
0 ppm 1,250 ppm 2,500 ppm 5,000 ppm 10,000 ppm 20,000 ppm
Male (continued)
n Day 4 10 10 9 10 10 10 Day 22 10 10 10 10 10 10 Week 14 10 10 10 10 10 0
Monocytes (103/µL) Day 4 0.12 ± 0.03 0.11 ± 0.02 0.06 ± 0.03 0.14 ± 0.05 0.10 ± 0.03 0.10 ± 0.03 Day 22 0.11 ± 0.02 0.09 ± 0.02 0.11 ± 0.02 0.06 ± 0.02 0.13 ± 0.03 0.14 ± 0.03 Week 14 0.21 ± 0.04 0.12 ± 0.03 0.11 ± 0.04 0.20 ± 0.06 0.24 ± 0.03
Eosinophils (103/µL) Day 4 0.01 ± 0.01 0.05 ± 0.02 0.01 ± 0.01 0.09 ± 0.02** 0.06 ± 0.04 0.03 ± 0.02 Day 22 0.04 ± 0.02 0.07 ± 0.02 0.06 ± 0.03 0.06 ± 0.03 0.06 ± 0.03 0.04 ± 0.02 Week 14 0.08 ± 0.04 0.01 ± 0.01 0.05 ± 0.03 0.07 ± 0.02 0.08 ± 0.03
Female
n Day 4 10 10 10 10 10 10 Day 22 10 10 10 10 9 10 Week 14 10 10 10 10 10 0
Hematocrit (%) Day 4 45.5 ± 0.4 46.2 ± 0.5 48.1 ± 0.5** 50.2 ± 0.4** 51.1 ± 0.3** 51.0 ± 0.5** Day 22 47.5 ± 0.5 47.3 ± 0.4 47.7 ± 0.4 45.8 ± 0.4* 46.4 ± 0.6 44.9 ± 0.7** Week 14 47.1 ± 0.5 47.7 ± 0.6 46.2 ± 0.7 46.2 ± 0.6 45.4 ± 0.4*
Hemoglobin (g/dL) Day 4 15.6 ± 0.1 15.6 ± 0.2 16.3 ± 0.2** 16.9 ± 0.2** 17.3 ± 0.1** 17.2 ± 0.1** Day 22 16.2 ± 0.1 15.7 ± 0.1* 15.6 ± 0.1** 15.2 ± 0.1** 15.2 ± 0.2** 15.1 ± 0.2** Week 14 16.0 ± 0.2 16.1 ± 0.2 15.5 ± 0.2 15.3 ± 0.2* 14.5 ± 0.1**
Erythrocytes (106/µL) Day 4 7.51 ± 0.07 7.50 ± 0.12 7.83 ± 0.10* 8.18 ± 0.09** 8.29 ± 0.08** 8.39 ± 0.07** Day 22 7.83 ± 0.09 7.61 ± 0.06 7.76 ± 0.06 7.46 ± 0.07* 7.58 ± 0.11 7.74 ± 0.12 Week 14 8.07 ± 0.09 8.22 ± 0.12 8.03 ± 0.11 8.08 ± 0.12 7.95 ± 0.09
Reticulocytes (106/µL) Day 4 0.17 ± 0.02 0.14 ± 0.01 0.13 ± 0.01* 0.09 ± 0.01** 0.13 ± 0.01** 0.11 ± 0.01** Day 22 0.13 ± 0.01 0.14 ± 0.01 0.13 ± 0.01 0.14 ± 0.01 0.17 ± 0.02 0.13 ± 0.01 Week 14 0.18 ± 0.02 0.18 ± 0.02 0.17 ± 0.02 0.18 ± 0.01 0.20 ± 0.02
Nucleated erythrocytes (103/µL) Day 4 0.01 ± 0.01 0.00 ± 0.00 0.00 ± 0.00 0.00 ± 0.00 0.00 ± 0.00 0.00 ± 0.00 Day 22 0.00 ± 0.00 0.01 ± 0.01 0.00 ± 0.00 0.00 ± 0.00 0.00 ± 0.00 0.01 ± 0.01 Week 14 0.00 ± 0.00 0.00 ± 0.00 0.00 ± 0.00 0.00 ± 0.00 0.00 ± 0.00
Mean cell volume (fL) Day 4 60.6 ± 0.2 61.6 ± 0.4 61.5 ± 0.4 61.4 ± 0.2 61.6 ± 0.2* 60.8 ± 0.4 Day 22 60.7 ± 0.2 62.2 ± 0.3 61.5 ± 0.2 61.5 ± 0.1 61.3 ± 0.3 58.0 ± 0.3* Week 14 58.4 ± 0.3 58.0 ± 0.2 57.5 ± 0.1* 57.2 ± 0.1** 57.1 ± 0.3**
Mean cell hemoglobin (pg) Day 4 20.7 ± 0.1 20.9 ± 0.1 20.9 ± 0.2 20.7 ± 0.1 20.9 ± 0.1 20.5 ± 0.1 Day 22 20.6 ± 0.1 20.7 ± 0.1 20.1 ± 0.1** 20.4 ± 0.1* 20.0 ± 0.2** 19.4 ± 0.1** Week 14 19.9 ± 0.1 19.6 ± 0.1 19.4 ± 0.2** 19.0 ± 0.1** 18.3 ± 0.1**
Mean cell hemoglobin concentration (g/dL) Day 4 34.2 ± 0.2 33.9 ± 0.2 34.0 ± 0.2 33.7 ± 0.1 33.9 ± 0.2 33.7 ± 0.2 Day 22 34.0 ± 0.2 33.3 ± 0.2 32.6 ± 0.1** 33.1 ± 0.1 32.7 ± 0.2** 33.5 ± 0.2 Week 14 34.1 ± 0.2 33.8 ± 0.2 33.7 ± 0.3 33.2 ± 0.2* 32.0 ± 0.1**

B-4 Benzophenone, NTP TOX 61
TABLE B1 Hematology Data for Rats in the 14-Week Feed Study of Benzophenone
0 ppm 1,250 ppm 2,500 ppm 5,000 ppm 10,000 ppm 20,000 ppm
Female (continued)
n Day 4 10 10 10 10 10 10 Day 22 10 10 10 10 9 10 Week 14 10 10 10 10 10 0
Platelets (103/µL) Day 4 861.2 ± 13.0 898.3 ± 14.3 876.2 ± 12.1 943.0 ± 14.3** 996.0 ± 23.0** 1,006.2 ± 12.2** Day 22 765.6 ± 21.6 764.4 ± 20.5 778.1 ± 11.5 795.4 ± 8.9 636.6 ± 23.1** 622.3 ± 14.0** Week 14 780.2 ± 18.6 771.1 ± 15.8 788.8 ± 28.6 716.8 ± 13.0* 671.0 ± 11.8**
Leukocytes (103/µL) Day 4 7.89 ± 0.57 8.22 ± 0.63 9.39 ± 0.58 9.22 ± 0.43 7.80 ± 0.45 8.39 ± 0.71 Day 22 6.74 ± 0.52 6.44 ± 0.41 6.50 ± 0.36 6.62 ± 0.36 5.47 ± 0.34 7.74 ± 0.51 Week 14 10.33 ± 0.87 9.47 ± 0.59 9.24 ± 0.60 8.31 ± 0.27 8.31 ± 0.24
Segmented neutrophils (103/µL) Day 4 1.05 ± 0.12 1.15 ± 0.12 1.15 ± 0.13 1.13 ± 0.13 1.07 ± 0.11 0.97 ± 0.12 Day 22 0.83 ± 0.11 0.89 ± 0.08 0.88 ± 0.07 0.97 ± 0.15 0.84 ± 0.10 1.56 ± 0.12** Week 14 1.89 ± 0.30 1.40 ± 0.12 1.39 ± 0.14 1.21 ± 0.14 1.05 ± 0.07
Lymphocytes (103/µL) Day 4 6.70 ± 0.46 6.92 ± 0.66 8.09 ± 0.52 7.94 ± 0.45 6.63 ± 0.38 7.28 ± 0.61 Day 22 5.78 ± 0.53 5.45 ± 0.35 5.50 ± 0.30 5.50 ± 0.28 4.52 ± 0.27 6.02 ± 0.51 Week 14 8.26 ± 0.65 7.93 ± 0.55 7.62 ± 0.58 6.99 ± 0.28 7.13 ± 0.24
Monocytes (103/µL) Day 4 0.10 ± 0.03 0.12 ± 0.02 0.09 ± 0.02 0.08 ± 0.02 0.08 ± 0.02 0.06 ± 0.02 Day 22 0.08 ± 0.02 0.08 ± 0.02 0.09 ± 0.02 0.10 ± 0.03 0.07 ± 0.01 0.13 ± 0.03 Week 14 0.15 ± 0.03 0.11 ± 0.02 0.18 ± 0.04 0.05 ± 0.02 0.08 ± 0.03
Eosinophils (103/µL) Day 4 0.05 ± 0.02 0.03 ± 0.01 0.05 ± 0.02 0.08 ± 0.02 0.02 ± 0.01 0.09 ± 0.04 Day 22 0.05 ± 0.02 0.03 ± 0.02 0.04 ± 0.02 0.06 ± 0.02 0.04 ± 0.01 0.03 ± 0.02 Week 14 0.03 ± 0.02 0.02 ± 0.01 0.05 ± 0.02 0.06 ± 0.02 0.05 ± 0.02
* Significantly different (P#0.05) from the control group by Dunn’s or Shirley’s test ** P#0.01 a Mean ± standard error. Statistical tests were performed on unrounded data.

B-5 Benzophenone, NTP TOX 61
TABLE B2 Clinical Chemistry Data for Rats in the 14-Week Feed Study of Benzophenonea
0 ppm 1,250 ppm 2,500 ppm 5,000 ppm 10,000 ppm 20,000 ppm
Male
n Day 4 10 10 10 10 10 10 Day 22 10 10 10 10 10 10 Week 14 10 10 10 10 10 0
Urea nitrogen (mg/dL) Day 4 20.3 ± 0.6 20.6 ± 0.6 21.7 ± 0.3 21.9 ± 0.4 22.3 ± 0.6* 22.2 ± 0.5* Day 22 20.5 ± 0.5 20.6 ± 0.4 22.0 ± 0.9 21.5 ± 0.2 24.2 ± 0.6** 31.5 ± 1.5** Week 14 17.9 ± 0.3 17.1 ± 0.3 17.5 ± 0.2 18.2 ± 0.5 18.9 ± 0.6
Creatinine (mg/dL) Day 4 0.60 ± 0.00 0.60 ± 0.00 0.62 ± 0.01 0.58 ± 0.01 0.57 ± 0.02 0.54 ± 0.02**b
Day 22 0.69 ± 0.01 0.66 ± 0.02 0.64 ± 0.02* 0.61 ± 0.01** 0.61 ± 0.01** 0.56 ± 0.02** Week 14 0.70 ± 0.01 0.72 ± 0.01 0.71 ± 0.01 0.66 ± 0.02 0.59 ± 0.01**
Total protein (g/dL) Day 4 6.2 ± 0.0 6.1 ± 0.1 5.8 ± 0.0** 5.9 ± 0.1** 6.1 ± 0.0 6.0 ± 0.1 Day 22 6.9 ± 0.1 7.0 ± 0.1 7.4 ± 0.1* 7.4 ± 0.1* 7.3 ± 0.1* 5.7 ± 0.1 Week 14 7.7 ± 0.1 8.1 ± 0.1 8.4 ± 0.1* 8.1 ± 0.2 7.1 ± 0.1
Albumin (g/dL) Day 4 4.5 ± 0.0 4.4 ± 0.0 4.3 ± 0.0 4.4 ± 0.1 4.6 ± 0.1 4.5 ± 0.1 Day 22 4.9 ± 0.1 4.9 ± 0.0 5.2 ± 0.1* 5.2 ± 0.0* 5.2 ± 0.1* 4.0 ± 0.1 Week 14 5.2 ± 0.0 5.4 ± 0.1 5.6 ± 0.1 5.2 ± 0.1 4.7 ± 0.1*
Alanine aminotransferase (IU/L) Day 4 43 ± 1 52 ± 4** 56 ± 3** 59 ± 3** 63 ± 2** 61 ± 3** Day 22 50 ± 2 41 ± 1 40 ± 2 39 ± 1 50 ± 2 97 ± 4* Week 14 71 ± 5 67 ± 5 55 ± 4 61 ± 4 90 ± 6
Alkaline phosphatase (IU/L) Day 4 1,307 ± 26 1,237 ± 27 1,141 ± 32** 912 ± 18** 847 ± 35** 799 ± 28** Day 22 951 ± 17 798 ± 19** 715 ± 11** 647 ± 14** 725 ± 27** 664 ± 25** Week 14 574 ± 17 473 ± 14** 458 ± 8** 404 ± 11** 485 ± 15**
Creatine kinase (IU/L) Day 4 Day 22
332 ± 40 291 ± 43b
480 ± 90 244 ± 34b
373 ± 93 253 ± 30
273 ± 35 241 ± 47
390 ± 39 215 ± 22
355 ± 72b
187 ± 16 Week 14 147 ± 21 153 ± 25 158 ± 13 112 ± 10 137 ± 14
Sorbitol dehydrogenase (IU/L) Day 4 16 ± 1 21 ± 2 23 ± 2* 18 ± 1 18 ± 1 15 ± 1 Day 22 19 ± 1 16 ± 1* 16 ± 1* 16 ± 1 16 ± 1 10 ± 1** Week 14 30 ± 4 29 ± 3 25 ± 2 27 ± 3 34 ± 3
Bile salts (µmol/L) Day 4 Day 22
31.3 ± 2.9 24.1 ± 2.1
32.2 ± 4.1 28.3 ± 2.5
32.7 ± 3.6 33.3 ± 3.2*b
42.5 ± 3.5 34.2 ± 2.7**
33.1 ± 2.1 70.4 ± 11.0**
29.8 ± 1.7 330.4 ± 26.0**
Week 14 21.5 ± 2.1 24.7 ± 0.9* 27.2 ± 2.7* 29.0 ± 1.4** 52.1 ± 4.2**

B-6 Benzophenone, NTP TOX 61
TABLE B2 Clinical Chemistry Data for Rats in the 14-Week Feed Study of Benzophenone
0 ppm 1,250 ppm 2,500 ppm 5,000 ppm 10,000 ppm 20,000 ppm
Female
n Day 4 10 10 10 10 10 10 Day 22 10 10 10 10 10 10 Week 14 10 10 10 10 10 0
Urea nitrogen (mg/dL) Day 4 22.0 ± 0.6 20.5 ± 0.7 20.2 ± 1.5* 17.0 ± 0.7** 15.6 ± 0.6** 17.0 ± 0.7** Day 22 20.4 ± 0.8 19.2 ± 0.6 19.4 ± 0.6 21.7 ± 0.5 21.5 ± 0.5 29.8 ± 0.9** Week 14 20.0 ± 0.5 18.5 ± 0.7 19.7 ± 0.7 19.1 ± 0.4 19.6 ± 0.6
Creatinine (mg/dL) Day 4 0.62 ± 0.01 0.61 ± 0.01 0.59 ± 0.01b 0.58 ± 0.01* 0.57 ± 0.02* 0.54 ± 0.02** Day 22 0.68 ± 0.01 0.63 ± 0.02* 0.62 ± 0.01** 0.62 ± 0.01** 0.61 ± 0.01** 0.55 ± 0.02** Week 14 0.73 ± 0.03 0.70 ± 0.02 0.69 ± 0.02 0.68 ± 0.02 0.62 ± 0.01**
Total protein (g/dL) Day 4 6.1 ± 0.1 6.0 ± 0.0 5.8 ± 0.1* 5.7 ± 0.0** 5.8 ± 0.1** 5.8 ± 0.1** Day 22 6.4 ± 0.1 6.8 ± 0.1 7.1 ± 0.1* 7.4 ± 0.1** 7.5 ± 0.1** 5.8 ± 0.1 Week 14 7.3 ± 0.2 8.1 ± 0.1** 8.4 ± 0.1** 8.6 ± 0.1** 8.0 ± 0.2**
Albumin (g/dL) Day 4 4.5 ± 0.1 4.4 ± 0.0 4.3 ± 0.0 4.3 ± 0.0 4.4 ± 0.0 4.4 ± 0.1 Day 22 4.7 ± 0.1 5.0 ± 0.1 5.2 ± 0.1* 5.4 ± 0.1** 5.5 ± 0.1** 4.3 ± 0.1 Week 14 5.1 ± 0.1 5.6 ± 0.1** 5.9 ± 0.1** 6.1 ± 0.1** 5.7 ± 0.1**
Alanine aminotransferase (IU/L) Day 4 36 ± 2 42 ± 2* 48 ± 3** 54 ± 3** 53 ± 3** 59 ± 9** Day 22 37 ± 1 35 ± 1 36 ± 1 35 ± 1 47 ± 1** 95 ± 4** Week 14 48 ± 3 49 ± 2 43 ± 2 47 ± 3 89 ± 11**
Alkaline phosphatase (IU/L) Day 4 1,048 ± 25 925 ± 36** 824 ± 37** 680 ± 22** 599 ± 13** 596 ± 12** Day 22 766 ± 24 585 ± 19** 516 ± 12** 531 ± 15** 635 ± 22 698 ± 35 Week 14 495 ± 15 369 ± 12** 331 ± 11** 333 ± 18** 400 ± 21**
Creatine kinase (IU/L) Day 4 342 ± 60b 391 ± 81 303 ± 43 392 ± 40b 389 ± 37 445 ± 75 Day 22 220 ± 31 194 ± 38 191 ± 28 160 ± 23 208 ± 32 178 ± 19 Week 14 196 ± 38 198 ± 39 171 ± 23 125 ± 15 157 ± 22
Sorbitol dehydrogenase (IU/L) Day 4 18 ± 1 17 ± 1 15 ± 1 17 ± 1 17 ± 1 24 ± 5 Day 22 20 ± 2 16 ± 1 16 ± 1 15 ± 1 18 ± 2 13 ± 1** Week 14 21 ± 2 22 ± 1 18 ± 1 21 ± 1 43 ± 6**
Bile salts (µmol/L) Day 4 33.0 ± 5.2 53.9 ± 4.9* 58.0 ± 5.9* 49.6 ± 4.5 46.8 ± 6.8 40.3 ± 3.5 Day 22 28.5 ± 3.4 38.9 ± 3.4* 44.8 ± 4.2** 54.1 ± 3.9** 82.5 ± 12.5** 435.4 ± 22.8** Week 14 41.7 ± 4.9 38.5 ± 3.7 44.2 ± 4.0 39.7 ± 2.6 71.0 ± 3.7**
* Significantly different (P#0.05) from the control group by Dunn’s or Shirley’s test ** P#0.01 a Mean ± standard error. Statistical tests were performed on unrounded data. b n=9
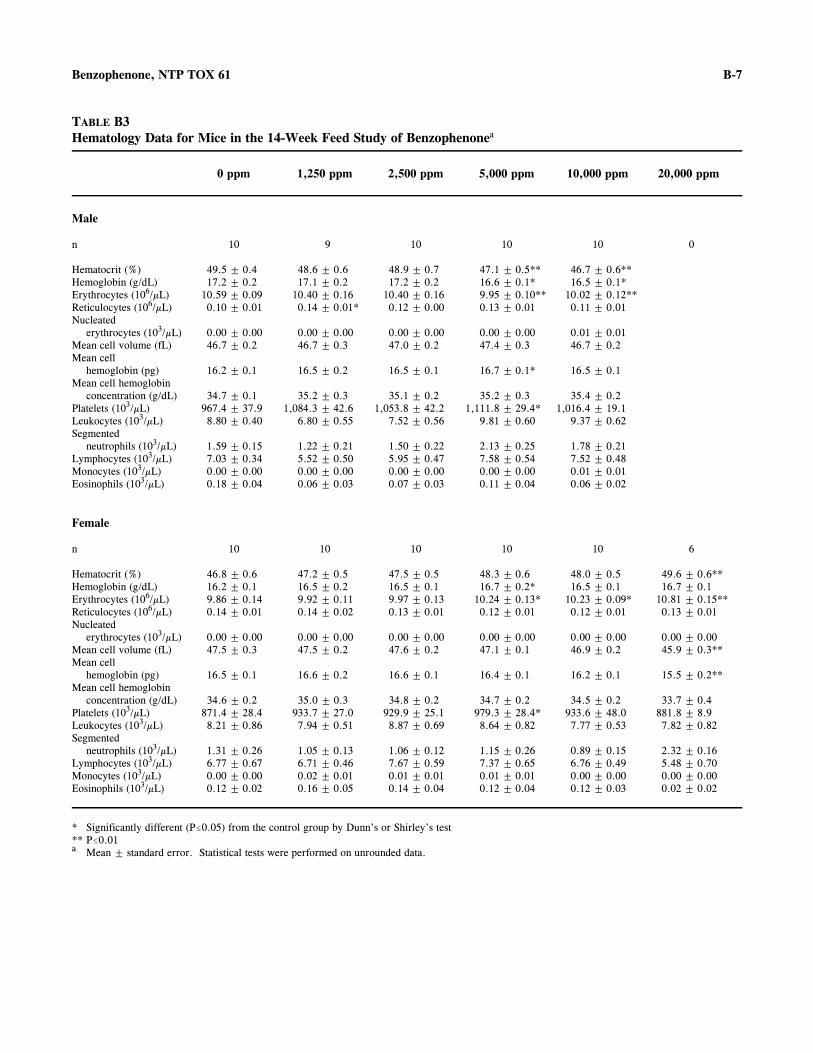
B-7 Benzophenone, NTP TOX 61
TABLE B3 Hematology Data for Mice in the 14-Week Feed Study of Benzophenonea
0 ppm 1,250 ppm 2,500 ppm 5,000 ppm 10,000 ppm 20,000 ppm
Male
n 10 9 10 10 10 0
Hematocrit (%) 49.5 ± 0.4 48.6 ± 0.6 48.9 ± 0.7 47.1 ± 0.5** 46.7 ± 0.6** Hemoglobin (g/dL) Erythrocytes (106/µL) Reticulocytes (106/µL)
17.2 ± 0.2 10.59 ± 0.09 0.10 ± 0.01
17.1 ± 0.2 10.40 ± 0.16 0.14 ± 0.01*
17.2 ± 0.2 10.40 ± 0.16 0.12 ± 0.00
16.6 ± 0.1* 9.95 ± 0.10** 0.13 ± 0.01
16.5 ± 0.1* 10.02 ± 0.12** 0.11 ± 0.01
Nucleated erythrocytes (103/µL) 0.00 ± 0.00 0.00 ± 0.00 0.00 ± 0.00 0.00 ± 0.00 0.01 ± 0.01
Mean cell volume (fL) 46.7 ± 0.2 46.7 ± 0.3 47.0 ± 0.2 47.4 ± 0.3 46.7 ± 0.2 Mean cell
hemoglobin (pg) 16.2 ± 0.1 16.5 ± 0.2 16.5 ± 0.1 16.7 ± 0.1* 16.5 ± 0.1 Mean cell hemoglobin
concentration (g/dL) Platelets (103/µL) Leukocytes (103/µL)
34.7 ± 0.1 967.4 ± 37.9 8.80 ± 0.40
35.2 ± 0.3 1,084.3 ± 42.6
6.80 ± 0.55
35.1 ± 0.2 1,053.8 ± 42.2
7.52 ± 0.56
35.2 ± 0.3 1,111.8 ± 29.4*
9.81 ± 0.60
35.4 ± 0.2 1,016.4 ± 19.1
9.37 ± 0.62 Segmented
neutrophils (103/µL) Lymphocytes (103/µL) Monocytes (103/µL) Eosinophils (103/µL)
1.59 ± 0.15 7.03 ± 0.34 0.00 ± 0.00 0.18 ± 0.04
1.22 ± 0.21 5.52 ± 0.50 0.00 ± 0.00 0.06 ± 0.03
1.50 ± 0.22 5.95 ± 0.47 0.00 ± 0.00 0.07 ± 0.03
2.13 ± 0.25 7.58 ± 0.54 0.00 ± 0.00 0.11 ± 0.04
1.78 ± 0.21 7.52 ± 0.48 0.01 ± 0.01 0.06 ± 0.02
Female
n 10 10 10 10 10 6
Hematocrit (%) 46.8 ± 0.6 47.2 ± 0.5 47.5 ± 0.5 48.3 ± 0.6 48.0 ± 0.5 49.6 ± 0.6** Hemoglobin (g/dL) Erythrocytes (106/µL) Reticulocytes (106/µL)
16.2 ± 0.1 9.86 ± 0.14 0.14 ± 0.01
16.5 ± 0.2 9.92 ± 0.11 0.14 ± 0.02
16.5 ± 0.1 9.97 ± 0.13 0.13 ± 0.01
16.7 ± 0.2* 10.24 ± 0.13* 0.12 ± 0.01
16.5 ± 0.1 10.23 ± 0.09* 0.12 ± 0.01
16.7 ± 0.1 10.81 ± 0.15** 0.13 ± 0.01
Nucleated erythrocytes (103/µL) 0.00 ± 0.00 0.00 ± 0.00 0.00 ± 0.00 0.00 ± 0.00 0.00 ± 0.00 0.00 ± 0.00
Mean cell volume (fL) 47.5 ± 0.3 47.5 ± 0.2 47.6 ± 0.2 47.1 ± 0.1 46.9 ± 0.2 45.9 ± 0.3** Mean cell
hemoglobin (pg) 16.5 ± 0.1 16.6 ± 0.2 16.6 ± 0.1 16.4 ± 0.1 16.2 ± 0.1 15.5 ± 0.2** Mean cell hemoglobin
concentration (g/dL) Platelets (103/µL) Leukocytes (103/µL)
34.6 ± 0.2 871.4 ± 28.4 8.21 ± 0.86
35.0 ± 0.3 933.7 ± 27.0 7.94 ± 0.51
34.8 ± 0.2 929.9 ± 25.1 8.87 ± 0.69
34.7 ± 0.2 979.3 ± 28.4* 8.64 ± 0.82
34.5 ± 0.2 933.6 ± 48.0 7.77 ± 0.53
33.7 ± 0.4 881.8 ± 8.9 7.82 ± 0.82
Segmented neutrophils (103/µL)
Lymphocytes (103/µL) Monocytes (103/µL) Eosinophils (103/µL)
1.31 ± 0.26 6.77 ± 0.67 0.00 ± 0.00 0.12 ± 0.02
1.05 ± 0.13 6.71 ± 0.46 0.02 ± 0.01 0.16 ± 0.05
1.06 ± 0.12 7.67 ± 0.59 0.01 ± 0.01 0.14 ± 0.04
1.15 ± 0.26 7.37 ± 0.65 0.01 ± 0.01 0.12 ± 0.04
0.89 ± 0.15 6.76 ± 0.49 0.00 ± 0.00 0.12 ± 0.03
2.32 ± 0.16 5.48 ± 0.70 0.00 ± 0.00 0.02 ± 0.02
* Significantly different (P#0.05) from the control group by Dunn’s or Shirley’s test ** P#0.01 a Mean ± standard error. Statistical tests were performed on unrounded data.

B-8
c
Benzophenone, NTP TOX 61
TABLE B4 Clinical Chemistry Data for Mice in the 14-Week Feed Study of Benzophenonea
0 ppm 1,250 ppm 2,500 ppm 5,000 ppm 10,000 ppm 20,000 ppm
Male
n 8 6 10 10 10 0
Urea nitrogen (mg/dL) 30.9 ± 1.2 32.2 ± 1.2 29.8 ± 2.0 28.9 ± 3.6 26.0 ± 1.1* Creatinine (mg/dL) Total protein (g/dL) Albumin (g/dL)
0.45 ± 0.02 5.6 ± 0.1 4.0 ± 0.1
0.47 ± 0.03 6.0 ± 0.1* 4.2 ± 0.1
0.45 ± 0.02 6.1 ± 0.1**b
4.2 ± 0.1b
0.50 ± 0.06 6.0 ± 0.1* 4.2 ± 0.1
0.45 ± 0.02 6.2 ± 0.1** 4.6 ± 0.1**
Alanine aminotransferase (IU/L) 94 ± 26b 98 ± 26c 76 ± 9 98 ± 23b 107 ± 12
Alkaline phosphatase (IU/L) 179 ± 5b 174 ± 5c 159 ± 3 169 ± 7 204 ± 8
Creatine kinase (IU/L) 1,171 ± 297 674 ± 345 757 ± 207 645 ± 142c 1,045 ± 214 Sorbitol
dehydrogenase (IU/L) Bile salts (µmol/L)
64 ± 2d
17.0 ± 1.2 88 ± 14b
19.3 ± 3.1e 90 ± 8**
17.9 ± 1.2f 102 ± 10**
24.5 ± 2.4* 124 ± 9**
26.9 ± 1.4**
Female
n 10 10 9 10 10 6
Urea nitrogen (mg/dL) Creatinine (mg/dL)
24.9 ± 1.5 0.47 ± 0.02
23.6 ± 1.0 0.48 ± 0.01b
21.4 ± 1.6 0.46 ± 0.02
21.7 ± 1.5 0.47 ± 0.03b
22.0 ± 0.5 0.45 ± 0.02
15.8 ± 0.8** 0.38 ± 0.02*
Total protein (g/dL) 5.7 ± 0.1 6.1 ± 0.1 6.0 ± 0.1 6.3 ± 0.1* 6.1 ± 0.1 5.0 ± 0.1 Albumin (g/dL) 4.3 ± 0.0 4.6 ± 0.1 4.5 ± 0.0 4.8 ± 0.1** 4.6 ± 0.1 3.7 ± 0.1 Alanine
aminotransferase (IU/L) 57 ± 9 96 ± 15 75 ± 13 80 ± 13 59 ± 5 88 ± 6 Alkaline
phosphatase (IU/L) Creatine kinase (IU/L)
251 ± 4 774 ± 128
260 ± 7 1,269 ± 205b
256 ± 10d
910 ± 145 257 ± 11 801 ± 111f
242 ± 8 826 ± 186
428 ± 21** 584 ± 117
Sorbitol dehydrogenase (IU/L)
Bile salts (µmol/L) 52 ± 2
13.1 ± 0.8f 66 ± 3**
16.6 ± 2.9c 70 ± 3**d
19.6 ± 0.8** 78 ± 4**
17.5 ± 1.8*f 84 ± 5**
21.0 ± 0.9**f 77 ± 4**
35.3 ± 15.2*g
* Significantly different (P#0.05) from the control group by Dunn’s or Shirley’s test ** P#0.01 a Mean ± standard error. Statistical tests were performed on unrounded data. b n=9
n=7 d n=10 e n=5 f n=8 g n=3

C-1
APPENDIX C ORGAN WEIGHTS AND
ORGAN-WEIGHT-TO-BODY-WEIGHT RATIOS
TABLE C1
TABLE C2
Organ Weights and Organ-Weight-to-Body-Weight Ratios for Rats in the 14-Week Feed Study of Benzophenone . . . . . . . . . . . . . . . . . . . . . . . . . . . . . . . . . Organ Weights and Organ-Weight-to-Body-Weight Ratios for Mice in the 14-Week Feed Study of Benzophenone . . . . . . . . . . . . . . . . . . . . . . . . . . . . . . . . .
C-2
C-3

C-2 Benzophenone, NTP TOX 61
TABLE C1 Organ Weights and Organ-Weight-to-Body-Weight Ratios for Rats in the 14-Week Feed Study of Benzophenonea
0 ppm 1,250 ppm 2,500 ppm 5,000 ppm 10,000 ppm
n 10 10 10 10 10
Male
Necropsy body wt 379 ± 7 374 ± 5 352 ± 5** 340 ± 5** 276 ± 5**
Heart Absolute 1.103 ± 0.029 1.125 ± 0.025 1.049 ± 0.022 1.104 ± 0.023 0.893 ± 0.019** Relative 2.91 ± 0.04 3.01 ± 0.04 2.98 ± 0.05 3.25 ± 0.07** 3.24 ± 0.08**
R. Kidney Absolute 1.308 ± 0.027 1.516 ± 0.041** 1.615 ± 0.039** 2.056 ± 0.091** 1.782 ± 0.051** Relative 3.46 ± 0.05 4.06 ± 0.08** 4.59 ± 0.09** 6.03 ± 0.20** 6.46 ± 0.17**
Liver Absolute 13.647 ± 0.261 17.338 ± 0.354** 19.463 ± 0.548** 21.629 ± 0.740** 19.379 ± 0.387** Relative 36.10 ± 0.56 46.40 ± 0.51** 55.29 ± 0.96** 63.52 ± 1.39** 70.23 ± 1.33**
Lung Absolute 1.849 ± 0.074 1.694 ± 0.072 1.636 ± 0.062* 1.569 ± 0.044** 1.358 ± 0.023** Relative 4.90 ± 0.21 4.53 ± 0.17 4.65 ± 0.14 4.62 ± 0.11 4.92 ± 0.10
R. Testis Absolute 1.410 ± 0.037 1.445 ± 0.023 1.443 ± 0.039 1.464 ± 0.017 1.405 ± 0.026 Relative 3.73 ± 0.09 3.87 ± 0.05 4.10 ± 0.09** 4.32 ± 0.09** 5.09 ± 0.09**
Thymus Absolute 0.345 ± 0.021 0.335 ± 0.015 0.317 ± 0.013 0.323 ± 0.016 0.232 ± 0.008** Relative 0.91 ± 0.05 0.90 ± 0.05 0.90 ± 0.03 0.95 ± 0.05 0.84 ± 0.03
Female
Necropsy body wt 219 ± 3 197 ± 2** 192 ± 3** 182 ± 2** 180 ± 2**
Heart Absolute 0.698 ± 0.021 0.704 ± 0.016 0.666 ± 0.018 0.675 ± 0.017 0.665 ± 0.016 Relative 3.18 ± 0.07 3.58 ± 0.09** 3.47 ± 0.06** 3.72 ± 0.11** 3.70 ± 0.08**
R. Kidney Absolute 0.744 ± 0.014 0.792 ± 0.013 0.832 ± 0.014** 0.821 ± 0.015** 0.960 ± 0.033** Relative 3.40 ± 0.06 4.03 ± 0.07** 4.34 ± 0.05** 4.51 ± 0.07** 5.33 ± 0.15**
Liver Absolute 7.566 ± 0.179 8.446 ± 0.136** 9.653 ± 0.284** 10.432 ± 0.175** 12.643 ± 0.308** Relative 34.52 ± 0.54 42.99 ± 0.82** 50.30 ± 1.02** 57.31 ± 0.80** 70.21 ± 1.19**
Lung Absolute 1.350 ± 0.067 1.106 ± 0.036** 1.149 ± 0.033** 1.040 ± 0.027** 1.102 ± 0.046** Relative 6.17 ± 0.30 5.62 ± 0.17 5.99 ± 0.16 5.72 ± 0.15 6.13 ± 0.24
Thymus Absolute 0.284 ± 0.009 0.250 ± 0.006 0.274 ± 0.015 0.239 ± 0.007** 0.241 ± 0.006** Relative 1.30 ± 0.04 1.27 ± 0.03 1.43 ± 0.08 1.31 ± 0.04 1.34 ± 0.04
* Significantly different (P#0.05) from the control group by Williams’ test ** P#0.01 a Organ weights (absolute weights) and body weights are given in grams; organ-weight-to-body-weight ratios (relative weights) are given as mg
organ weight/g body weight (mean ± standard error). All 20,000 ppm rats died before the end of the study.
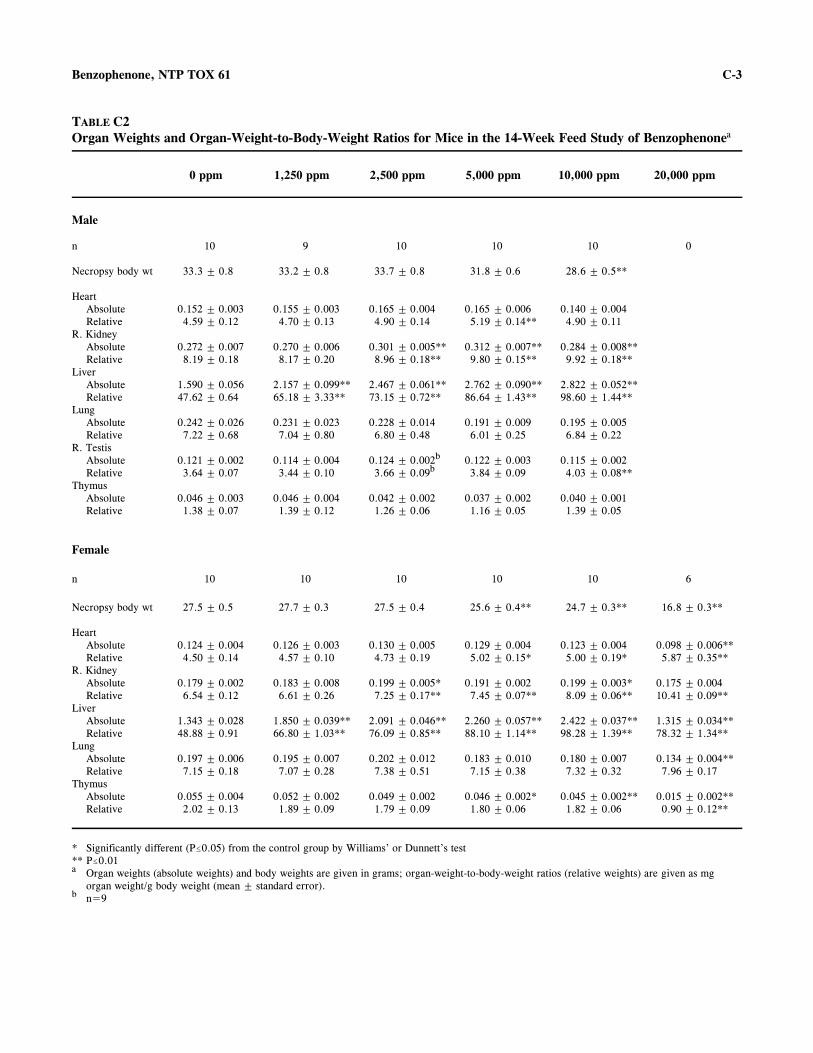
C-3 Benzophenone, NTP TOX 61
TABLE C2 Organ Weights and Organ-Weight-to-Body-Weight Ratios for Mice in the 14-Week Feed Study of Benzophenonea
0 ppm 1,250 ppm 2,500 ppm 5,000 ppm 10,000 ppm 20,000 ppm
Male
n 10 9 10 10 10 0
Necropsy body wt 33.3 ± 0.8 33.2 ± 0.8 33.7 ± 0.8 31.8 ± 0.6 28.6 ± 0.5**
Heart Absolute 0.152 ± 0.003 0.155 ± 0.003 0.165 ± 0.004 0.165 ± 0.006 0.140 ± 0.004 Relative 4.59 ± 0.12 4.70 ± 0.13 4.90 ± 0.14 5.19 ± 0.14** 4.90 ± 0.11
R. Kidney Absolute 0.272 ± 0.007 0.270 ± 0.006 0.301 ± 0.005** 0.312 ± 0.007** 0.284 ± 0.008** Relative 8.19 ± 0.18 8.17 ± 0.20 8.96 ± 0.18** 9.80 ± 0.15** 9.92 ± 0.18**
Liver Absolute 1.590 ± 0.056 2.157 ± 0.099** 2.467 ± 0.061** 2.762 ± 0.090** 2.822 ± 0.052** Relative 47.62 ± 0.64 65.18 ± 3.33** 73.15 ± 0.72** 86.64 ± 1.43** 98.60 ± 1.44**
Lung Absolute 0.242 ± 0.026 0.231 ± 0.023 0.228 ± 0.014 0.191 ± 0.009 0.195 ± 0.005 Relative 7.22 ± 0.68 7.04 ± 0.80 6.80 ± 0.48 6.01 ± 0.25 6.84 ± 0.22
R. Testis Absolute 0.121 ± 0.002 0.114 ± 0.004 0.124 ± 0.002b 0.122 ± 0.003 0.115 ± 0.002 Relative 3.64 ± 0.07 3.44 ± 0.10 3.66 ± 0.09b 3.84 ± 0.09 4.03 ± 0.08**
Thymus Absolute 0.046 ± 0.003 0.046 ± 0.004 0.042 ± 0.002 0.037 ± 0.002 0.040 ± 0.001 Relative 1.38 ± 0.07 1.39 ± 0.12 1.26 ± 0.06 1.16 ± 0.05 1.39 ± 0.05
Female
n 10 10 10 10 10 6
Necropsy body wt 27.5 ± 0.5 27.7 ± 0.3 27.5 ± 0.4 25.6 ± 0.4** 24.7 ± 0.3** 16.8 ± 0.3**
Heart Absolute 0.124 ± 0.004 0.126 ± 0.003 0.130 ± 0.005 0.129 ± 0.004 0.123 ± 0.004 0.098 ± 0.006** Relative 4.50 ± 0.14 4.57 ± 0.10 4.73 ± 0.19 5.02 ± 0.15* 5.00 ± 0.19* 5.87 ± 0.35**
R. Kidney Absolute 0.179 ± 0.002 0.183 ± 0.008 0.199 ± 0.005* 0.191 ± 0.002 0.199 ± 0.003* 0.175 ± 0.004 Relative 6.54 ± 0.12 6.61 ± 0.26 7.25 ± 0.17** 7.45 ± 0.07** 8.09 ± 0.06** 10.41 ± 0.09**
Liver Absolute 1.343 ± 0.028 1.850 ± 0.039** 2.091 ± 0.046** 2.260 ± 0.057** 2.422 ± 0.037** 1.315 ± 0.034** Relative 48.88 ± 0.91 66.80 ± 1.03** 76.09 ± 0.85** 88.10 ± 1.14** 98.28 ± 1.39** 78.32 ± 1.34**
Lung Absolute 0.197 ± 0.006 0.195 ± 0.007 0.202 ± 0.012 0.183 ± 0.010 0.180 ± 0.007 0.134 ± 0.004** Relative 7.15 ± 0.18 7.07 ± 0.28 7.38 ± 0.51 7.15 ± 0.38 7.32 ± 0.32 7.96 ± 0.17
Thymus Absolute 0.055 ± 0.004 0.052 ± 0.002 0.049 ± 0.002 0.046 ± 0.002* 0.045 ± 0.002** 0.015 ± 0.002** Relative 2.02 ± 0.13 1.89 ± 0.09 1.79 ± 0.09 1.80 ± 0.06 1.82 ± 0.06 0.90 ± 0.12**
* Significantly different (P#0.05) from the control group by Williams’ or Dunnett’s test ** P#0.01 a Organ weights (absolute weights) and body weights are given in grams; organ-weight-to-body-weight ratios (relative weights) are given as mg
organ weight/g body weight (mean ± standard error). b n=9

C-4 Benzophenone, NTP TOX 61

D-1
APPENDIX D REPRODUCTIVE TISSUE EVALUATIONS
AND ESTROUS CYCLE CHARACTERIZATION
TABLE D1 Summary of Reproductive Tissue Evaluations in Male Rats in the 14-Week Feed Study of Benzophenone . . . . . . . . . . . . . . . . . . . . . . . . . . . . . . . . . D-2
TABLE D2 Summary of Estrous Cycle Characterization in Female Rats in the 14-Week Feed Study of Benzophenone . . . . . . . . . . . . . . . . . . . . . . . . . . . . . . . . . D-2
TABLE D3 Summary of Reproductive Tissue Evaluations in Male Mice in the 14-Week Feed Study of Benzophenone . . . . . . . . . . . . . . . . . . . . . . . . . . . . . . . . . D-3
TABLE D4 Summary of Estrous Cycle Characterization in Female Mice in the 14-Week Feed Study of Benzophenone . . . . . . . . . . . . . . . . . . . . . . . . . . . . . . . . . D-3

D-2 Benzophenone, NTP TOX 61
TABLE D1 Summary of Reproductive Tissue Evaluations in Male Rats in the 14-Week Feed Study of Benzophenonea
0 ppm 1,250 ppm 2,500 ppm 5,000 ppm
n 10 10 10 10
Weights (g) Necropsy body wt 379 ± 7 374 ± 5 352 ± 5** 340 ± 5** Left cauda epididymis 0.1393 ± 0.0039 0.1327 ± 0.0055 0.1339 ± 0.0037 0.1373 ± 0.0032 Left epididymis 0.4626 ± 0.0060 0.4459 ± 0.0039 0.4484 ± 0.0064 0.4453 ± 0.0038 Left testis 1.4755 ± 0.0266 1.5253 ± 0.0237 1.5054 ± 0.0326 1.5477 ± 0.0191
Spermatid measurements Spermatid heads (107/g testis) 9.63 ± 0.16 9.18 ± 0.19 9.46 ± 0.15 9.37 ± 0.16 Spermatid heads (107/testis) 14.21 ± 0.36 13.98 ± 0.23 14.21 ± 0.25 14.50 ± 0.28 Spermatid count (mean/10-4 mL suspension) 71.05 ± 1.80 69.88 ± 1.16 71.05 ± 1.27 72.48 ± 1.41
Epididymal spermatozoal measurements Motility (%) 66.97 ± 0.76 68.85 ± 1.27 67.80 ± 1.12 66.49 ± 1.22 Concentration (106/g cauda epididymal tissue) 507 ± 29 544 ± 34 529 ± 27 461 ± 20
** Significantly different (P#0.01) from the control group by Williams’ test a Data are presented as mean ± standard error. Differences from the control group are not significant by Dunnett’s test (tissue weights) or Dunn’s
test (spermatid and epididymal spermatozoal measurements).
TABLE D2 Summary of Estrous Cycle Characterization in Female Rats in the 14-Week Feed Study of Benzophenonea
0 ppm 1,250 ppm 2,500 ppm 5,000 ppm
n 10 10 10 10
Necropsy body wt (g) Estrous cycle length (days)
219 ± 3 5.00 ± 0.14b
197 ± 2** 5.40 ± 0.41
192 ± 3** 5.50 ± 0.30
182 ± 2** 6.11 ± 0.48b
Estrous stages (% of cycle) Diestrus 40.0 47.5 44.2 49.2 Proestrus 15.8 16.7 15.0 17.5 Estrus 24.2 18.3 20.0 15.8 Metestrus 19.2 17.5 20.8 17.5 Uncertain diagnoses 0.8 0.0 0.0 0.0
** Significantly different (P#0.01) from the control group by Williams’ test a Necropsy body weight and estrous cycle length data are presented as mean ± standard error. Differences from the control group for estrous cycle
length are not significant by Dunn’s test. By multivariate analysis of variance, exposed females do not differ significantly from the control females in the relative length of time spent in the estrous stages.
b Estrous cycle was longer than 12 days or unclear in 1 of 10 animals.

D-3 Benzophenone, NTP TOX 61
TABLE D3 Summary of Reproductive Tissue Evaluations in Male Mice in the 14-Week Feed Study of Benzophenonea
0 ppm 2,500 ppm 5,000 ppm 10,000 ppm
n 10 10 10 10
Weights (g) Necropsy body wt 33.3 ± 0.8 33.7 ± 0.8 31.8 ± 0.6 28.6 ± 0.5** Left cauda epididymis 0.0147 ± 0.0007 0.0142 ± 0.0009 0.0134 ± 0.0008 0.0124 ± 0.0010 Left epididymis 0.0429 ± 0.0017 0.0440 ± 0.0010 0.0413 ± 0.0013 0.0381 ± 0.0010* Left testis 0.1174 ± 0.0012 0.1207 ± 0.0019 0.1190 ± 0.0020 0.1098 ± 0.0024*
Spermatid measurements Spermatid heads (107/g testis) 20.02 ± 0.50 19.96 ± 0.48 19.50 ± 0.31 21.34 ± 0.64 Spermatid heads (107/testis) 2.35 ± 0.06 2.40 ± 0.04 2.32 ± 0.06 2.34 ± 0.07 Spermatid count (mean/10-4 mL suspension) 73.38 ± 1.72 75.08 ± 1.30 72.58 ± 1.95 73.10 ± 2.15
Epididymal spermatozoal measurements Motility (%) 67.35 ± 0.90 65.23 ± 1.28 67.74 ± 0.87 67.10 ± 0.87 Concentration (106/g cauda epididymal tissue) 832 ± 71 1,049 ± 94 1,070 ± 92 934 ± 76
* Significantly different (P#0.05) from the control group by Dunnett’s test ** Significantly different (P#0.01) from the control group by Williams’ test a Data are presented as mean ± standard error. Differences from the control group for spermatid and epididymal spermatozoal measurements are
not significant by Dunn’s test.
TABLE D4 Summary of Estrous Cycle Characterization in Female Mice in the 14-Week Feed Study of Benzophenonea
0 ppm 2,500 ppm 5,000 ppm 10,000 ppm
n 10 10 10 10
Necropsy body wt (g) 27.5 ± 0.5 27.5 ± 0.4 25.6 ± 0.4** 24.7 ± 0.3** Estrous cycle length (days) 4.10 ± 0.10 4.00 ± 0.00 4.00 ± 0.00 4.15 ± 0.11 Estrous stages (% of cycle)
Diestrus 30.0 28.3 28.3 24.2 Proestrus 20.8 20.8 20.8 22.5 Estrus 26.7 26.7 27.5 29.2 Metestrus 22.5 24.2 23.3 24.2
** Significantly different (P#0.01) from the control group by Williams’ test a Necropsy body weight and estrous cycle length data are presented as mean ± standard error. Differences from the control group for estrous cycle
length are not significant by Dunn’s test. By multivariate analysis of variance, exposed females do not differ significantly from the control females in the relative length of time spent in the estrous stages.

D-4 Benzophenone, NTP TOX 61

E-1
APPENDIX E CYTOCHROME P450 ANALYSIS RESULTS
TABLE E1
TABLE E2
Liver Cytochrome P450 Concentrations and Enzyme Activities for Rats in the 14-Week Feed Study of Benzophenone . . . . . . . . . . . . . . . . . . . . . . . . . . . . . . . . . Liver Cytochrome P450 Concentrations and Enzyme Activities for Mice in the 14-Week Feed Study of Benzophenone . . . . . . . . . . . . . . . . . . . . . . . . . . . . . . . . .
E-2
E-3

E-2 Benzophenone, NTP TOX 61
TABLE E1 Liver Cytochrome P450 Concentrations and Enzyme Activities for Rats in the 14-Week Feed Study of Benzophenonea
0 ppm 1,250 ppm 2,500 ppm 5,000 ppm 10,000 ppm
n 5 5 5 5 5
Male
Cytochrome P450
(nmol/mg protein) 0.704 ± 0.023 0.940 ± 0.024 1.064 ± 0.034** 0.992 ± 0.032** 0.830 ± 0.035 Ethoxyresorufin deethylase
(pmol/min/mg protein) 49.2 ± 3.9 134.5 ± 4.9** 125.3 ± 11.2** 68.8 ± 5.3 66.5 ± 4.3 Ethoxyresorufin deethylase
(pmol/min/nmol cytochrome P450) 70.1 ± 5.5 143.7 ± 7.6** 118.7 ± 12.5* 69.1 ± 4.0 80.2 ± 4.4
Pentoxyresorufin dealkylase (pmol/min/mg protein) 8.8 ± 0.8 628.0 ± 48.9 769.7 ± 32.5** 612.9 ± 110.2* 574.8 ± 108.1
Pentoxyresorufin dealkylase (pmol/min/nmol cytochrome P450) 12.7 ± 1.5 667.5 ± 48.3** 729.4 ± 50.3** 629.5 ± 119.8** 702.9 ± 134.5**
Female
Cytochrome P450
(nmol/mg protein) 0.703 ± 0.025 0.956 ± 0.056* 0.995 ± 0.059** 0.928 ± 0.034* 0.892 ± 0.036 Ethoxyresorufin deethylase
(pmol/min/mg protein) 56.5 ± 2.9 92.9 ± 6.1** 85.0 ± 2.6 79.3 ± 7.0 64.3 ± 7.0 Ethoxyresorufin deethylase
(pmol/min/nmol cytochrome P450) 80.8 ± 5.3 99.8 ± 11.5 86.5 ± 5.4 85.8 ± 8.4 72.3 ± 8.2
Pentoxyresorufin dealkylase (pmol/min/mg protein) 5.4 ± 0.5 307.0 ± 23.0** 383.9 ± 36.5** 534.1 ± 39.3** 515.2 ± 34.3**
Pentoxyresorufin dealkylase (pmol/min/nmol cytochrome P450) 7.7 ± 0.8 324.1 ± 27.9** 395.5 ± 53.7** 576.0 ± 40.4** 579.2 ± 38.1**
* Significantly different (P#0.05) from the control group by Dunn’s test ** Significantly different (P#0.01) from the control group by Dunn’s or Shirley’s test a Mean ± standard error. Statistical tests were performed on unrounded data. All 20,000 ppm rats died before the end of the study.

E-3 Benzophenone, NTP TOX 61
TABLE E2 Liver Cytochrome P450 Concentrations and Enzyme Activities for Mice in the 14-Week Feed Study of Benzophenonea
0 ppm 1,250 ppm 2,500 ppm 5,000 ppm 10,000 ppm 20,000 ppm
Male
n 5 5 5 5 5 0
Cytochrome P450
(nmol/mg protein) 1.082 ± 0.050 1.347 ± 0.040* 1.385 ± 0.042** 1.361 ± 0.057* 1.145 ± 0.039 Ethoxyresorufin deethylase
(pmol/min/mg protein) 300.7 ± 13.3 378.8 ± 23.9* 448.5 ± 32.4** 422.3 ± 31.1** 449.8 ± 50.4** Ethoxyresorufin deethylase
(pmol/min/nmol cytochrome P450) 278.9 ± 12.5 281.2 ± 15.8 326.7 ± 29.5 314.1 ± 32.3 399.9 ± 56.9
Pentoxyresorufin dealkylase (pmol/min/mg protein) 25.5 ± 3.6 352.3 ± 10.0** 454.0 ± 23.0** 503.8 ± 29.4** 524.0 ± 39.4**
Pentoxyresorufin dealkylase (pmol/min/nmol cytochrome P450) 24.0 ± 3.7 262.3 ± 9.6** 330.8 ± 25.9** 370.7 ± 17.9** 458.8 ± 33.9**
Female
n 5 5 5 5 5 5
Cytochrome P450
(nmol/mg protein) 0.924 ± 0.041 1.101 ± 0.006 1.063 ± 0.016 1.014 ± 0.069 0.862 ± 0.062 0.501 ± 0.056 Ethoxyresorufin deethylase
(pmol/min/mg protein) 209.7 ± 12.4 415.0 ± 20.3** 378.9 ± 36.3** 347.0 ± 20.1** 383.1 ± 24.2** 434.7 ± 21.2** Ethoxyresorufin deethylase
(pmol/min/nmol cytochrome P450) 227.7 ± 13.8 376.8 ± 18.4** 356.2 ± 32.1** 358.2 ± 51.2** 454.9 ± 45.1** 895.2 ± 75.6**
Pentoxyresorufin dealkylase (pmol/min/mg protein) 43.5 ± 3.4 385.8 ± 8.5* 451.4 ± 29.5** 481.8 ± 18.2** 349.2 ± 11.9 144.1 ± 15.3
Pentoxyresorufin dealkylase (pmol/min/nmol cytochrome P450) 47.1 ± 2.8 350.3 ± 7.4 425.2 ± 28.6** 486.9 ± 32.5** 418.2 ± 47.4* 303.6 ± 48.0
* Significantly different (P#0.05) from the control group by Dunn’s or Shirley’s test ** P#0.01 a Mean ± standard error. Statistical tests were performed on unrounded data.

E-4 Benzophenone, NTP TOX 61
F-1
APPENDIX F GENETIC TOXICOLOGY
TABLE F1 TABLE F2
Mutagenicity of Benzophenone in Salmonella typhimurium . . . . . . . . . . . . . . . . . . . . . . . . . Induction of Micronuclei in Bone Marrow Polychromatic Erythrocytes of Male Mice Administered Benzophenone by Intraperitoneal Injection . . . . . . . . . . . . . . . .
F-2
F-3
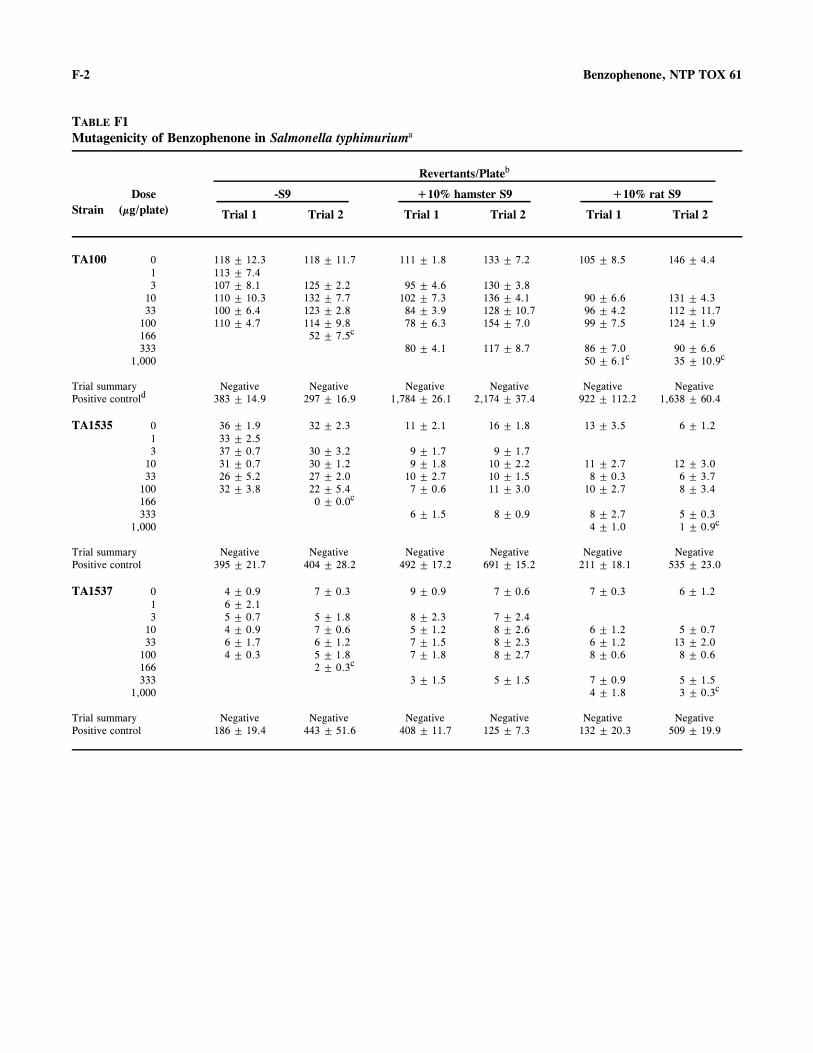
F-2 Benzophenone, NTP TOX 61
TABLE F1 Mutagenicity of Benzophenone in Salmonella typhimuriuma
Revertants/Plateb
Dose -S9 +10% hamster S9 +10% rat S9 Strain (µg/plate) Trial 1 Trial 2 Trial 1 Trial 2 Trial 1 Trial 2
TA100 0 1 3
10 33
100 166 333
1,000
118 ± 12.3 113 ± 7.4 107 ± 8.1 110 ± 10.3 100 ± 6.4 110 ± 4.7
118 ± 11.7
125 ± 2.2 132 ± 7.7 123 ± 2.8 114 ± 9.8 52 ± 7.5c
111 ± 1.8
95 ± 4.6 102 ± 7.3 84 ± 3.9 78 ± 6.3
80 ± 4.1
133 ± 7.2
130 ± 3.8 136 ± 4.1 128 ± 10.7 154 ± 7.0
117 ± 8.7
105 ± 8.5
90 ± 6.6 96 ± 4.2 99 ± 7.5
86 ± 7.0 50 ± 6.1c
146 ± 4.4
131 ± 4.3 112 ± 11.7 124 ± 1.9
90 ± 6.6 35 ± 10.9c
Trial summary Positive controld
Negative 383 ± 14.9
Negative 297 ± 16.9
Negative 1,784 ± 26.1
Negative 2,174 ± 37.4
Negative 922 ± 112.2
Negative 1,638 ± 60.4
TA1535 0 1 3
10 33
100 166 333
1,000
36 ± 1.9 33 ± 2.5 37 ± 0.7 31 ± 0.7 26 ± 5.2 32 ± 3.8
32 ± 2.3
30 ± 3.2 30 ± 1.2 27 ± 2.0 22 ± 5.4 0 ± 0.0c
11 ± 2.1
9 ± 1.7 9 ± 1.8
10 ± 2.7 7 ± 0.6
6 ± 1.5
16 ± 1.8
9 ± 1.7 10 ± 2.2 10 ± 1.5 11 ± 3.0
8 ± 0.9
13 ± 3.5
11 ± 2.7 8 ± 0.3
10 ± 2.7
8 ± 2.7 4 ± 1.0
6 ± 1.2
12 ± 3.0 6 ± 3.7 8 ± 3.4
5 ± 0.3 1 ± 0.9c
Trial summary Positive control
Negative 395 ± 21.7
Negative 404 ± 28.2
Negative 492 ± 17.2
Negative 691 ± 15.2
Negative 211 ± 18.1
Negative 535 ± 23.0
TA1537 0 1 3
10 33
100 166 333
1,000
4 ± 0.9 6 ± 2.1 5 ± 0.7 4 ± 0.9 6 ± 1.7 4 ± 0.3
7 ± 0.3
5 ± 1.8 7 ± 0.6 6 ± 1.2 5 ± 1.8 2 ± 0.3c
9 ± 0.9
8 ± 2.3 5 ± 1.2 7 ± 1.5 7 ± 1.8
3 ± 1.5
7 ± 0.6
7 ± 2.4 8 ± 2.6 8 ± 2.3 8 ± 2.7
5 ± 1.5
7 ± 0.3
6 ± 1.2 6 ± 1.2 8 ± 0.6
7 ± 0.9 4 ± 1.8
6 ± 1.2
5 ± 0.7 13 ± 2.0 8 ± 0.6
5 ± 1.5 3 ± 0.3c
Trial summary Positive control
Negative 186 ± 19.4
Negative 443 ± 51.6
Negative 408 ± 11.7
Negative 125 ± 7.3
Negative 132 ± 20.3
Negative 509 ± 19.9
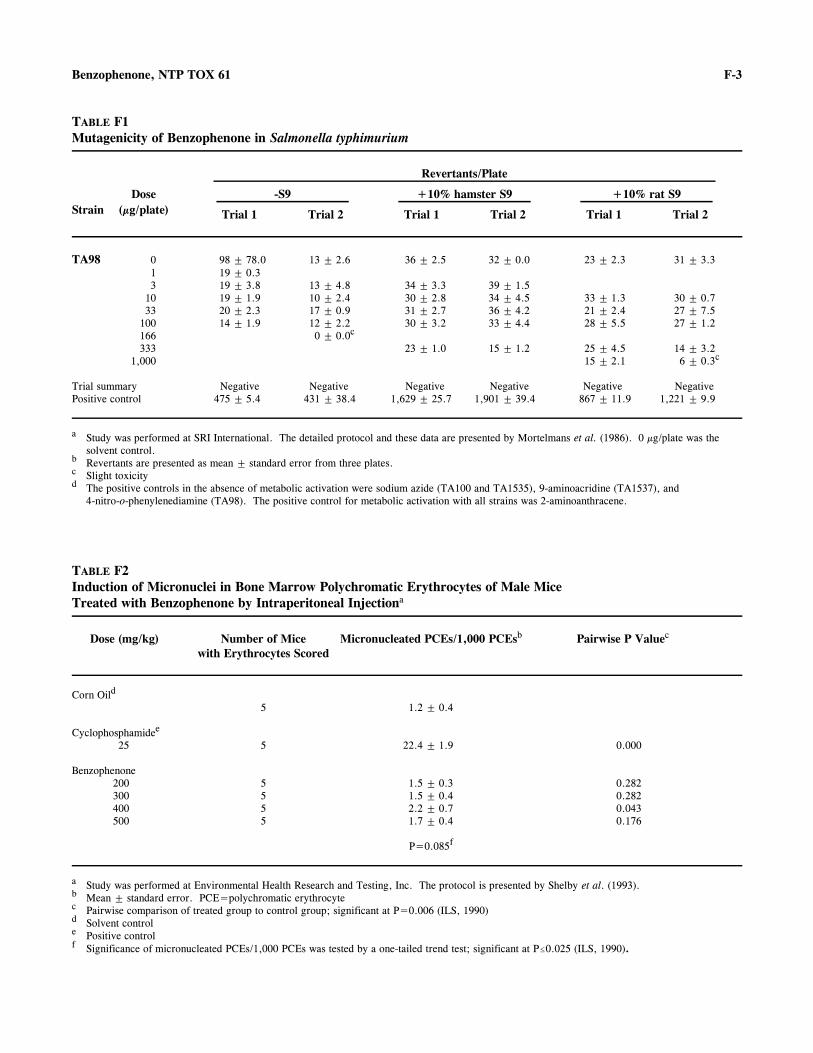
F-3
c
Benzophenone, NTP TOX 61
TABLE F1 Mutagenicity of Benzophenone in Salmonella typhimurium
Revertants/Plate
Strain Dose
(µg/plate) Trial 1
-S9
Trial 2
+10% hamster S9
Trial 1 Trial 2
+10% rat S9
Trial 1 Trial 2
TA98 0 1 3
10 33
100 166 333
1,000
Trial summary Positive control
98 ± 78.0 19 ± 0.3 19 ± 3.8 19 ± 1.9 20 ± 2.3 14 ± 1.9
Negative 475 ± 5.4
13 ± 2.6
13 ± 4.8 10 ± 2.4 17 ± 0.9 12 ± 2.2 0 ± 0.0c
Negative 431 ± 38.4
36 ± 2.5
34 ± 3.3 30 ± 2.8 31 ± 2.7 30 ± 3.2
23 ± 1.0
Negative 1,629 ± 25.7
32 ± 0.0
39 ± 1.5 34 ± 4.5 36 ± 4.2 33 ± 4.4
15 ± 1.2
Negative 1,901 ± 39.4
23 ± 2.3
33 ± 1.3 21 ± 2.4 28 ± 5.5
25 ± 4.5 15 ± 2.1
Negative 867 ± 11.9
31 ± 3.3
30 ± 0.7 27 ± 7.5 27 ± 1.2
14 ± 3.2 6 ± 0.3c
Negative 1,221 ± 9.9
a Study was performed at SRI International. The detailed protocol and these data are presented by Mortelmans et al. (1986). 0 µg/plate was the solvent control.
b Revertants are presented as mean ± standard error from three plates. Slight toxicity
d The positive controls in the absence of metabolic activation were sodium azide (TA100 and TA1535), 9-aminoacridine (TA1537), and 4-nitro-o-phenylenediamine (TA98). The positive control for metabolic activation with all strains was 2-aminoanthracene.
TABLE F2 Induction of Micronuclei in Bone Marrow Polychromatic Erythrocytes of Male Mice Treated with Benzophenone by Intraperitoneal Injectiona
Dose (mg/kg) Number of Mice with Erythrocytes Scored
Micronucleated PCEs/1,000 PCEsb Pairwise P Valuec
Corn Oild
5 1.2 ± 0.4
Cyclophosphamidee
25 5 22.4 ± 1.9 0.000
Benzophenone 200 300 400 500
5 5 5 5
1.5 ± 0.3 1.5 ± 0.4 2.2 ± 0.7 1.7 ± 0.4
0.282 0.282 0.043 0.176
P=0.085f
a Study was performed at Environmental Health Research and Testing, Inc. The protocol is presented by Shelby et al. (1993). b Mean ± standard error. PCE=polychromatic erythrocyte
Pairwise comparison of treated group to control group; significant at P=0.006 (ILS, 1990) d Solvent control e Positive control f Significance of micronucleated PCEs/1,000 PCEs was tested by a one-tailed trend test; significant at P#0.025 (ILS, 1990).
c

F-4 Benzophenone, NTP TOX 61