nsw school education: naplan, measurement and performance
TRANSCRIPT

NSW School Education: NAPLAN, Measurement
and Performance
Briefing Paper No 12/2015
by Tom Gotsis

RELATED PUBLICATIONS
Key Issues for the 56th Parliament, Briefing Book, April 2015
Home Education in NSW, E-brief 7/2013, by Talina Drabsch
The Australian Curriculum, Briefing Paper, 1/2013, by Talina Drabsch
Education, Family and Community Indicators for NSW, Statistical Indicators 8/2012, by Talina Drabsch
ISSN 1325-5142
ISBN 978-0-7313-1941-1
November 2015
© 2015
Except to the extent of the uses permitted under the Copyright Act 1968, no part of this document may be reproduced or transmitted in any form or by any means including information storage and retrieval systems, without the prior consent from the Manager, NSW Parliamentary Research Service, other than by Members of the New South Wales Parliament in the course of
their official duties.

NSW School Education: NAPLAN, Measurement and Performance
by
Tom Gotsis

NSW PARLIAMENTARY RESEARCH SERVICE
Gareth Griffith (BSc (Econ) (Hons), LLB (Hons), PhD), Manager, Politics & Government/Law .......................................... (02) 9230 2356 Daniel Montoya (BEnvSc (Hons), PhD), Senior Research Officer, Environment/Planning ......................... (02) 9230 2003 Lenny Roth (BCom, LLB), Senior Research Officer, Law ....................................................... (02) 9230 2768 Christopher Angus (BA(Media&Comm), LLM(Juris Doctor)), Research Officer, Law .................................................................. (02) 9230 2906 Tom Gotsis (BA, LLB, Dip Ed, Grad Dip Soc Sci) Research Officer, Law .................................................................. (02) 9230 3085 Andrew Haylen (BResEc (Hons)), Research Officer, Public Policy/Statistical Indicators .................. (02) 9230 2484 John Wilkinson (MA, PhD), Research Officer, Economics ...................................................... (02) 9230 2006
Should Members or their staff require further information about this publication please contact the author.
Information about Research Publications can be found on the Internet at:
http://www.parliament.nsw.gov.au/prod/parlment/publications.nsf/V3LIstRPSubject
Advice on legislation or legal policy issues contained in this paper is provided for use in parliamentary debate and for related parliamentary purposes. This paper is not professional legal opinion.

CONTENTS
SUMMARY .......................................................................................................... i
1. Introduction ..................................................................................................... 1
2. Goals and benefits of effective education ....................................................... 2
3. Origins and objectives of NAPLAN ................................................................. 3
4. Policy framework ............................................................................................ 5
5. Main features of NAPLAN .............................................................................. 5
6. Criticisms of NAPLAN..................................................................................... 7
7. NAPLAN and the “high-stakes” debate .......................................................... 8
8. NAPLAN State goals and outcomes ............................................................. 11
9. Demographic, socio-economic and environmental factors ........................... 17
10. Using NAPLAN to identify effective school practices .................................. 28
11. Future directions ......................................................................................... 32
12. Conclusion .................................................................................................. 35


i
SUMMARY
NAPLAN is a standardised test administered to all students in Australia in Years 3, 5, 7 and 9 in the subject domains of reading, numeracy, persuasive writing, grammar and punctuation, and spelling. Every year the taking of NAPLAN examinations and the dissemination of NAPLAN results generates considerable media coverage and community discussion about schools and school education outcomes.
This paper sets out the origins, objectives, main features and policy context of NAPLAN. It then focuses on: what the latest data says about NSW’s current school education performance; how NAPLAN data reveals the effects of demographic and socio-economic variables on educational outcomes; how NAPLAN is being used to direct resources to areas of need; and how it can act as a broad indicator of the effectiveness of educational reform. Critical perspectives on NAPLAN are also discussed.
Benefits of education
One of the objects of the Australian Education Act 2013 (Cth) is for Australia, by 2025, to be placed in the top five highest performing countries in reading, mathematics and science;, and to be considered to have a “high quality and highly equitable” schooling system by international standards. [1] Education is accorded such national significance because its benefits flow to all aspects of industrial and community life. [2] Those benefits include: increased personal and national prosperity; improved social cohesion and political engagement; greater uptake of technological innovation; and even better health. [2]
Introduction of NAPLAN
NAPLAN was introduced in 2008 by the then Minister for Education, Julia Gillard, to drive improvements and increase accountability in school education. [3], [4] To administer NAPLAN within the broader education policy framework, the Australian Curriculum Assessment and Reporting Authority (ACARA) was established. [3], [4]
Criticisms of NAPLAN
NAPLAN has been the subject of widespread criticism. [6] Critics of NAPLAN argue it is: stressful for students; compels teachers to “teach to the test”, rather than promote critical thinking and enjoyment of learning; and diminishes the value of other subjects, such as languages, geography, history, music, drama, physical education and art. [6]
NAPLAN and the “high-stakes” debate
It is sometimes claimed that NAPLAN is a form of “high-stakes” testing. In the United States, high-stakes testing involves high performing schools and teachers being rewarded with extra funding and promotions. [7] In Australia, while NAPLAN could, in theory, be used as an empirical basis for high-stakes testing, in practice it has been used to identify and direct funding towards areas

of socio-economic disadvantage. Most notably, NAPLAN was used to inform the Gonski report into education funding. NSW’s Resource Allocation Model adopts a similar approach. [7]
NAPLAN State goals and outcomes
NAPLAN is a key measure of State education performance. One of NSW’s 12 Premier’s Priorities is to “increase the proportion of NSW students in the top two NAPLAN bands by 8%” for reading and numeracy. [8] Additionally, it is a State Priority to “increase the proportion of Aboriginal and Torres Strait Islander students in the top two NAPLAN bands for reading and numeracy by 30%”. [8]
NSW’s NAPLAN results for reading and numeracy are examined in detail. [8] The 2015 (preliminary) mean scale scores are compared to the 2008 and 2014 results. With the exception of the 2015 Year 3 results for reading, which saw a statistically significant increase when compared to the 2008 results, NSW’s NAPLAN outcomes for reading and numeracy have been statistically stable. [8]
NSW’s 2014 NAPLAN results for reading and numeracy are also presented in terms of demographic and socio-economic factors. [9] For example, the analysis reveals that, in 2014, across all year groups:
In reading female students outperformed male students but that outcome was reversed in numeracy.
In reading and numeracy Indigenous students performed worse than non-Indigenous students.
In reading and numeracy students living in provincial and remote areas performed worse than students living in metropolitan areas.
This paper also discusses studies which found that children in foster care, children with speech and language problems, and children suffering from lead contamination, all had reduced NAPLAN outcomes. [9]
Using NAPLAN to identify effective school practices
NAPLAN data has been used in formal empirical research to identify “high value-add” schools and their distinguishing features; and to identify a positive association between enhanced sporting programs and improved academic outcomes. [10]
NAPLAN data has also been used as a basis of general observations about the effectiveness of school practices. For instance, the introduction of a student wellbeing program in one primary school was followed by improved NAPLAN results; while the introduction of an evidence-based reading program in Victoria’s Western Metropolitan region was followed by improved NAPLAN outcomes across the whole region. [10]
Future directions
NAPLAN is set to undergo a major development with the introduction of online testing. ACARA intends online NAPLAN testing to be implemented in schools

iii
from 2017. There will be an opt-in period of two to three years, meaning that it is anticipated that all schools will be online by 2019. [11]
The development of online testing is expected to dramatically reduce the turnaround time of results, from many months to a few weeks. Online testing is also expected to facilitate the introduction of multi-stage tailored testing, which involves a computer algorithm adjusting the difficulty of a test to match the ability of each student. [11]
These developments will move NAPLAN beyond a purely standardised test; and, by delivering faster and more precise measurement of student proficiency, enhance its overall diagnostic utility. [11]


NSW School Education: NAPLAN, Measurement and Performance
1
1. INTRODUCTION
School education, at its most basic, is the transfer of skills and knowledge from one generation to another. Its importance to the future prosperity of the State is underscored by the fact that in NSW spending on education comprises 21% of total recurrent expenses, second only to health.1
In NSW school education takes many different forms: public, private, religious, secular, co-educational, single-sex, boarding, distance-education, Montessori and Steiner. Moreover, it has recently been advocated that US-style “charter” and “for-profit” schools be established.2 In NSW, as elsewhere, the debate about education operates at several levels. At the individual level, parents ask: “What school is best for my child?” Whereas, at the community level, the more appropriate question is: “Taking the education system as a whole, what policies and practices are likely to result in the best possible educational and socio-economic outcomes?”
In an attempt to inform consideration of that second question, this paper examines the recent performance of the NSW school education system; using as its measure the (preliminary) 2015 results of NSW students in the National Assessment Program — Literacy and Numeracy (NAPLAN) examinations.
NAPLAN has grown in significance as a measure of educational performance. It is now a direct key performance measure for the Premier’s Priority of increasing the proportion of NSW students in the top two NAPLAN bands by 8%;3 and for the State Priority of increasing the proportion of Aboriginal and Torres Strait Islander students in the top two NAPLAN bands for reading and numeracy by 30%.4
International measures are also important, given that the objects of the Australian Education Act 2013 (Cth) expressly include Australia, by 2025, being placed in the top five highest performing countries, based on the performance of school students in reading, mathematics and science;5 and being considered to have a “high quality and highly equitable” schooling system by international standards.6
1 NSW Budget Statement 2015–16, p 5-20.
2 Charter and for-profit schools are effectively a type of public-private partnership, where
schools are publicly funded but privately managed: see T Jha and J Buckingham, Free to choose charter schools: how charter and for profit schools can boost public education, 2015, Centre for Independent Studies; and T Jha and J Buckingham “Charter schools, free schools and school autonomy”(2015) 31(2) Policy 52. 3 NSW Government website: State Priorities, Premier’s Priorities, Education.
4 NSW State Priorities, Better Services.
5 Australian Education Act 2013 (Cth), s 3(1)(a)(i).
6 Australian Education Act 2013 (Cth), s 3(1)(a)(ii).

NSW Parliamentary Research Service
2
The major international measure is the Organisation for Economic Cooperation and Development’s (OECD) triennial Program for International Student Assessment (PISA) examinations, whose latest results (2012)7 recorded a decline in Australia’s and NSW’s performance.8
But it is NAPLAN that is the focus of this paper: its origins and objectives; what the latest data says about NSW’s current educational performance; how NAPLAN data reveals the effects of demographic and socio-economic variables on educational outcomes; how NAPLAN is being used to direct resources to areas of need; and how it can act as a broad indicator of the effectiveness of educational reform. Critical perspectives on NAPLAN are also discussed.
2. GOALS AND BENEFITS OF EFFECTIVE EDUCATION
The goals and benefits of effective education are not easily encapsulated, flowing as they do into all aspects of industrial and community life. As the OECD found in its Survey of Adult Skills:9
If there is one central message emerging from this new survey, it is that what people know and what they do with what they know has a major impact on their life chances. The median hourly wage of workers who can make complex inferences and evaluate subtle truth claims or arguments in written texts is more than 60% higher than for workers who can, at best, read relatively short texts to locate a single piece of information. Those with low literacy skills are also more than twice as likely to be unemployed. The survey also shows that how literacy skills are distributed across a population has significant implications on how economic and social outcomes are distributed within the society. If large proportions of adults have low reading and numeracy skills, introducing and disseminating productivity-improving technologies and work-organisation practices can therefore be hampered. But the impact of skills goes far beyond earnings and employment. In all countries, individuals with lower proficiency in literacy are more likely than those with better literacy skills to report poor health, to believe that they have little impact on political processes, and not to participate in associative or volunteer activities. In most countries, they are also less likely to trust others.
7 The 2015 PISA results will be available in 2016. Australian students also participate in two
other internationally administered exams: Trends in International Mathematics and Science Study (TIMSS) and Progress in International Reading Literacy Study (PIRLS). 8 Treating the results for NSW as if they were “national” results, in 2000 NSW would have
ranked 3rd
in mathematics, 1st
in science and 2nd
in reading; in 2012, while still performing above the OECD national average, NSW would have ranked: 18
th for mathematics, equal 9
th for
science, and 13th
for literacy: State of Education in NSW, Inaugural biennial report–2014, 2014, Centre for Education Statistics and Evaluation, NSW Department of Education and Communities, pp 1 and 25. The actual average PISA scores for NSW for 2000 and 2012 were as follows: in mathematics, NSW scored 540 in 2000 and 509 in 2012; in reading NSW scored 539 in 2000 and 513 in 2012; and in Science NSW scored 553 in 2000 and 526 in 2012. 9 OECD, Skills Outlook 2013: First results from the survey of adult skills, 2013, OECD
Publishing, p 3. Around 166,000 adults aged 16-65 were surveyed in 24 countries and sub-national regions: 22 OECD member countries – Australia, Austria, Belgium (Flanders), Canada, the Czech Republic, Denmark, Estonia, Finland, France, Germany, Ireland, Italy, Japan, Korea, the Netherlands, Norway, Poland, the Slovak Republic, Spain, Sweden, the United Kingdom (England and Northern Ireland), and the United States; and two partner countries Cyprus and the Russian Federation: p 25.

NSW School Education: NAPLAN, Measurement and Performance
3
The OECD has also argued that educational disparities between nations represent an “international achievement gap” that carries long-term economic consequences:10
The international achievement gap in education imposes an invisible yet recurring loss on the economy of [nations]. Using economic modelling to relate cognitive skills – as measured by PISA and other international instruments – to economic growth shows (with some caveats) that even small improvements in the skills of a nation’s labor force can have a large impact on that country’s future well-being.
A study carried out by the OECD … suggests that a modest goal of having the United States boost its average PISA scores by 25 points over the next 20 years — which corresponds to the performance gains that some countries achieved in the first ten years of PISA alone — could add USD 41 trillion to the United States economy over the lifetime of the generation born in 2010.
In NSW the importance of education is legislatively recognised in s 4(c) of the Education Act 1990, which provides that it is a “duty of the State to ensure that every child receives an education of the highest quality”. Moreover, s 6(1) of that Act recognises that the objects of school education include: assisting each child to achieve his or her educational potential; providing children with access to opportunities for further study, work or training; and mitigating educational disadvantages arising from the child’s gender or from geographic, economic, social, cultural, linguistic or other causes.
3. ORIGINS AND OBJECTIVES OF NAPLAN
NAPLAN was established in 2008 after Commonwealth and State education ministers agreed11 to report on progress towards the achievement of national education goals, using key performance measures as the basis for reporting.12 As the then Commonwealth Minister for Education, Julia Gillard, said:13
Earlier this year, the Prime Minister and I called for a new era of transparency in Australian schooling. We argued that to lift performance and direct new resources to where they will make most difference, we need unprecedented rigour and openness in the collection and publication of schools data.
10
OECD, Lessons from PISA 2012 for the United States, Strong Performers and Successful Reformers in Education, 2013, OECD Publishing, p 2. 11
The Adelaide Declaration on National Goals for Schooling in the Twenty-First Century (1999); superseded by the Melbourne declaration on educational goals for young Australians (2008); National Education Agreement: Intergovernmental Agreement on Federal Financial Relations, including Schedule D: Ministerial Council on Education, Employment, Training and Youth Affairs: Measurement Framework for National Key Performance Measures, 2008.
12 ACARA, Why NAP; Standing Council on School Education and Early Childhood.
13 Australian Curriculum Assessment and Reporting Authority Bill 2008 (Cth), Second Reading, Commonwealth Parliamentary Debates (Hansard), House of Representatives, 23 October 2008, p 5 (J Gillard). The Australian Curriculum Assessment and Reporting Act 2008 (Cth) established the Australian Curriculum Assessment and Reporting Authority (ACARA), which is responsible, under ss 6(d) and (e) of the Act, for: facilitating information sharing arrangements between Australian government bodies in relation to the collection, management and analysis of school data; and publishing information relating to school education, including information relating to comparative school performance.

NSW Parliamentary Research Service
4
If we are to identify accurately where the greatest educational need across the Australian community is located and encourage excellence in every school, we need a basis for fair, consistent, and accurate analysis of how different schools are doing. Accurate information on how students and schools are performing tells teachers, principals, parents and governments what needs to be done.
This means publishing the performance of individual schools, along with information that puts that data in its proper context. That context includes information about the range of student backgrounds served by a school and its performance when compared against other ‘like schools’ serving similar student populations.
As other advocates of NAPLAN have argued, the overall objective of NAPLAN is to “drive improvements in student outcomes” and “provide increased accountability”.14
The body responsible for administering NAPLAN, the Australian Curriculum Assessment and Reporting Authority15 (ACARA), said:16
All Australian schools benefit from the outcomes of national testing. Schools can gain detailed information about how they are performing, and they can identify strengths and weaknesses which may warrant further attention. …
At the system level, the NAP provides education ministers with information about the success of their policies and resourcing in priority curriculum areas. The NAP also provides ministers with the capacity to monitor the success of policies aimed at improving the achievement of different student groups, such as Indigenous students.
Without the nationally comparable data about student performance that the NAP provides, States and Territories have only limited information about the achievement of their students in relation to their peers. NAP data provide an additional suite of information, thus enhancing the capacity for evidence-based decision making about policy, resourcing and systemic practices. …
The NAP also performs an accountability function. Australians can expect education resources to be allocated in ways that ensure that all students achieve worthwhile learning during their time at school. The reported outcomes of the NAP enable the Australian public to develop a general national perspective on student achievement and, more specifically, an understanding of how their schools are performing.
14
National Assessment Program (NAP): Why NAP?; D Robertson, “Value of detailed NAPLAN data in improving student outcomes”, 28 August 2015, online opinion ejournal; J Ferrari, “Busting the NAPLAN myths”, 12 May 2014, The Australian; J Anderson, “Using NAPLAN items to develop student’s thinking skills and build confidence”, 2009, 65(4) Australian Mathematics Teacher, pp 17–23; P White and J Anderson, “Teachers use of national test data to focus numeracy instruction”, 2011, conference paper, Mathematics: Traditions and [new] practices, Alice Springs, Mathematics Education Research Group of Australia and the Australian Association of Mathematics Teachers; J Buckingham, “Ignore the Doubters, NAPLAN is important and it’s working”, 5 August 2015, The Drum. 15
Australian Curriculum, Assessment and Reporting Authority Act 2008 (Cth), s 6(b); see also: National Assessment Program: about ACARA.
16 ACARA, Why NAP.

NSW School Education: NAPLAN, Measurement and Performance
5
4. POLICY FRAMEWORK
NAPLAN operates within the education policy framework set out in Table1 and Figure 1. Its position within that framework is underpinned by s 22(1)(b) of the Australian Education Act 2013 (Cth), which makes financial assistance provided by the Commonwealth to a State or Territory under the Act conditional upon support of ACARA and its work, including the administration of NAPLAN.
Table 1: Policy framework: Measurement of school education outcomes *
Adelaide Declaration on National Goals for Schooling in the Twenty-First Century (1999)
Melbourne Declaration on Educational Goals for Young Australians (2008)
Australian Education Act 2013 (Cth)
National Education Agreement (NEA)
National Education Reform Agreement (NERA)
Measurement Framework for Schooling in Australia†
National Report on Schooling in Australia
Related reports: annual Productivity Commission Report on Government Services; biennial Council of Australian Government report, Overcoming Indigenous Disadvantage: Key Indicators; NAPLAN reports; school level data on MySchool website.
* Based on: Measurement Framework for Schooling in Australia, 2015, ACARA, Sydney, pp 2–4.†
Schedule
5 of the Measurement Framework for Schooling in Australia details the measures used to assess the three key schooling indicators of: student participation,
17 student attainment
18 and student achievement.
19
Figure 1: Policy framework: Measurement of school education outcomes20
(i) Melbourne
Declaration
(Education Council)
National goals and
commitments to action
(iii) Measurement
Framework(Education Council
delegated to ACARA)
Sets key performance
measures (KPMs)
(iv) National Report
on Schooling(Education Council
delegated to ACARA)
Reports on 1, 2 & 3
(ii) Australian
Education Act(ii) a. National Education
Agreement (NEA)
(COAG)
(ii) b. National Education
Reform Agreement (NERA)
(COAG)
Reporting/Evaluation/Policy Review
National School Education Policy Framework
Key Policy Documents and Reports
National Curriculum
(ACARA)
National Assessment
Program (ACARA)
Teaching & School
Leadership (AITSL)
Accountability/My
School (ACARA)
Partnerships
National Priorities/Commitments
Equity/Closing the Gap
Policy Formation
(v) Related
Reports
Senior Schooling/
Transitions
Middle Years
Development
17
Enrolment, attendance rate, attendance level, NAPLAN participation, apparent retention rates and participation of young people in Vocational Education and Training.
18 Proportion of the 20–24-year-old population having attained at least Year 12 or equivalent or AQF Certificate II or above; and Proportion of the 20–24-year-old population having attained at least Year 12 or equivalent or AQF Certificate III or above.
19 In literacy, numeracy, science, civics and citizenship, and information and communication technology.
20 Image courtesy of ACARA. See Measurement Framework for Schooling in Australia, 2015, Australian Curriculum, Assessment and Reporting Authority (ACARA), Sydney, p 2 for accompanying commentary.

NSW Parliamentary Research Service
6
5. MAIN FEATURES OF NAPLAN
NAPLAN is a standardised test. Like all standardised tests, rather than being based on material specifically studied by students in their own class, NAPLAN involves all students across Australia taking the same test, which is scored and analysed the same way. As such, it provides a general overview of what students know (or should know) at a particular grade.
NAPLAN is administered each year across Australia to all students in Years 3, 5, 7 and 9. The subject domains tested are reading, numeracy, persuasive writing, grammar and punctuation, and spelling.21 The tests are mainly multiple choice. For each subject raw scores are converted to mean scale scores.22 The scale for each subject spans Year 3 to 9 and ranges, approximately, from 0 to 1000. The scale for each subject is divided into 10 bands, with each year level reported against six of these bands. Each band contains a range of scores and is not a specific point.23
As Figure 2 illustrates, the second lowest band on each scale represents a National Minimum Standard, the minimum performance standards for a given year level, below which students will have difficulty progressing satisfactorily at school without targeted intervention.24
Figure 2: NAPLAN Assessment Scale
21
Three-yearly NAP sample assessments are also conducted in science literacy, civics and citizenship, and information and communication technology (ICT) literacy for selected groups of students in Years 6 and 10.
22 ACARA, National Assessment Program, “How to interpret”. Score equivalence tables for each year detail how raw scores translate to mean scale scores.
23 ACARA, Score equivalence tables.
24 ACARA Standards. See the score equivalence tables for each year for details of which raw scores relate to the National Minimum Standards.

NSW School Education: NAPLAN, Measurement and Performance
7
Student-level results are confidentially made available to the family of each participating student. Schools are provided information on the performance of their students. School-level results are also published on the Myschool website, which can be searched by school name, suburb, town or postcode. National results are available on the NAPLAN website in open-source form or as part of yearly reports.
The school-level data is deliberately presented in such a way as to deter the construction of league school tables. Concerns over the potential adverse effects of such tables remain and were recently expressed by the Senate Standing Committee on Education and Employment’s Inquiry into the effectiveness of NAPLAN; which recommended that ACARA closely monitor the use of NAPLAN results to ensure they assist governments to deliver extra funding to schools and students who need more support, rather than being used to develop league tables.25
6. CRITICISMS OF NAPLAN
At the level of the individual student, the measurement of educational outcomes is commonplace. Essays are marked, tests are scored, reports are written, Higher School Certificates are obtained, and Australian Tertiary Admission Rank (ATAR) scores are generated. While these educational outcomes may be eagerly anticipated, dreaded or treated with indifference, depending on individual circumstances, the need for some form of measurement is largely unquestioned.
The same cannot be said for NAPLAN, which has been the focus of widespread criticism.26 Critics of NAPLAN argue it is: stressful for students; compels teachers to “teach to the test”, rather than promoting critical thinking and a genuine interest in their subject; and diminishes the value of other subjects,
25
Senate Standing Committee on Education and Employment, Effectiveness of National Assessment Program — Literacy and Numeracy, 2014, Parliament House, Canberra, p v.
26 For example, N Dulfer, J Polesel and S Rice, The Experience of Education: The Impacts of
high stakes testing on school students and their families: An educator’s perspective, 2012, The Whitlam Institute and University of Western Sydney; M Wu and D Hornsby, “Inappropriate Uses of NAPLAN results”, 2012, Literacy Educators Coalition; A Scott, Northern Lights: The Positive Policy Example of Sweden, Finland, Denmark and Norway, 2014, Monash University Publishing, Clayton, Victoria, pp 112–114; D Hornsby & M Wu, “Misleading everyone with statistics”, 2012, Literacy Educators Coalition; L Wilson and D Hornsby, “Teaching to the test”, Literacy Educators Coalition; L Wilson, “The NAPLAN view of reading, teachers and learner-readers”, 2012, Literacy Educators Coalition; J Buchanan and B Bartlett, “Exploring NAPLAN spelling data”, 2012, Literacy Educators Coalition; M Hyde and J Cashen, “Your children and NAPLAN”, 2012, Literacy Educators Coalition; R Ewing, “The risks of NAPLAN for the Arts in education”, 2012, Literacy Educators Coalition; R Gill, “Wake up Australia”, 2012, Literacy Educators Coalition; P Cullen, “The age of contempt and absurdity”, 2012, Literacy Educators Coalition; G Latham, D Nevile and C Semple, “Making learning visible”, 2012, Learning Educators’ Coalition. See also: J HeckMan and T Kautz, “Hard Evidence on Soft Skills”, 2012, 19(4) Labour Economics 451–464; and K Robinson and L Aronica, Creative schools: Revolutionizing Education from the Ground up, 2015, Penguin Books, London; and J Coulson, “Just admit it: NAPLAN is a complete failure”, 20 April 2015, The Daily Telegraph.

NSW Parliamentary Research Service
8
such as languages, geography, history, music, drama, physical education and art.
It is further argued that NAPLAN fundamentally changes the very nature of what it means to be a “good teacher” because it values the generation of “good data” over fostering the development of “good people” and life-long learners:27
For Australian teachers, NAPLAN is becoming the most important vehicle for representing their teaching. The more they care about how their teaching is represented the more they attend to the scores used to measure their teaching, and one potential consequence of this is a shift from caring about students to attention to the data. This may constitute a decreasing intensification of the importance of teachers caring for students, or the end of teachers’ capacity to represent themselves as “good teachers” because they care for students. … teaching as pedagogy becomes less important, already we are seeing a return to depersonalising, rote-learning methods of instruction.
These critiques broadly reflect and build upon criticisms of international comparative measures, such as PISA. It is claimed that such statistical analyses lack transparency;28 the tests are not “culture fair”;29 and, by focusing on league tables, they transform education from a journey of personal development into a global competition for economic advantage.30
7. NAPLAN AND THE “HIGH-STAKES” DEBATE
The term “high-stakes testing” implies that an adverse consequence follows poor performance. The adverse consequence may be poorly performing schools missing out on funding that is directed towards better performing schools; poorly performing students missing out on grade progression; or teachers being formally evaluated based solely on the poor test performance of their students.
The approach of the United States to the use of standardised tests has been high-stakes.31 High-performing schools and teachers are rewarded with extra funding and promotions; while low-performing schools and teachers are
27
G Thompson and I Cook, “Manipulating the data: Teaching and NAPLAN in the control society”, 2014, 35(1) Discourse: Studies in the Cultural Politics of Education 129 at 139–140. 28
M Chalabi, “The PISA methodology: do its education claims stack up?”, 3 December 2013, The Guardian; N Shepard, “How PISA testing may be ruining education”, 21 May 2014, Deseret News National. 29
Culture fairness is an issue if questions contain concepts or terms that are not equally familiar to all students taking the exams: See, for example, S Sjoberg, “PISA: Politics, fundamental problems and intriguing results”, 2012, 14 La Revue, Reserches en Education. 30
H Meyer, K Zahedi et al, “Open letter to Andreas Schleicher of OECD: Against too much testing!”, 8 May 2014. 31
A Patty, “NAPLAN-style testing has ‘failed’ US schools”, 2 May 2011, The Sydney Morning Herald. The United States Senate is currently re-considering its use of high-stakes testing in the context of proposing amendments to the No Child Left Behind Act 2001 (US): Senator L Alexander, “Obama Should ‘Stop and Think’ On Over-Testing Problem”, 26 October 2015, Time; Q Mullholland, “The Case Against Standardized Testing”, 14 May 2015, Harvard Political Review.

NSW School Education: NAPLAN, Measurement and Performance
9
effectively punished by reductions in funding and adverse career outcomes. That development is not universally supported,32 with President Obama recently stating:33
When I look back on the great teachers who shaped my life, what I remember isn't the way they prepared me to take a standardized test … [there is] too much testing, and from teachers who feel so much pressure to teach to a test that it takes the joy out of teaching and learning.
In Australia it is sometimes claimed that NAPLAN testing is “high-stakes”;34 with one suggested reason being that the publication of NAPLAN data on the Myschool website, and the media coverage this attracts, has the potential to adversely impact upon a school’s standing and future enrolments.35 The perspective that NAPLAN is high stakes is supported by reports of children being stressed by NAPLAN;36 low-performing students being “removed” from taking NAPLAN exams in order to improve school results;37 and teachers being so fearful of their students performing poorly that they impermissibly help students during NAPLAN exams.38
The issue as to whether NAPLAN is high-stakes is not merely about semantics. Research suggests that genuinely high-stakes testing is counter-productive
32
K Hefling, “Do students take too many tests? Congress to weigh question”, 17 January 2015, PBS Newshour; Q Mullholland, “The Case Against Standardized Testing”, 14 May 2015, Harvard Political Review and L Layton, “Study says standardized testing is overwhelming nation’s schools”, 24 October 2015, The Washington Post. As the Grattan Institute in Australia has said: “There is little indication these tests have improved learning in the United States. Neither PISA nor the National Assessment of Educational Progress has shown any significant change in America’s learning as a consequence of the introduction of high-stakes testing. Using test results to reward or punish teachers and schools will never produce system-wide reform”: P Goss and J Hunter, Targeted Teaching: How better use of data can improve student learning, 2015, Grattan Institute, p 39.
33 L Nelson, “Obama’s flip-flop on standardized tests, explained”, 29 October 2015, Vox Education.
34 J Polesel, N Dulfer and M Turnbull, The experience of education: The impacts of high stakes testing on school students and their families: Literature review, 2012, The Whitlam Institute and University of Western Sydney, p 6.
35 N Dulfer, J Polesel and S Rice, The Experience of Education: The Impacts of high stakes testing on school students and their families: An educator’s perspective, 2012, The Whitlam Institute and University of Western Sydney, p 31.
36 N Dulfer, J Polesel and S Rice, The Experience of Education: The Impacts of high stakes testing on school students and their families: An educator’s perspective, 2012, The Whitlam Institute and University of Western Sydney, pp 17–23.
37 N Dulfer, J Polesel and S Rice, The Experience of Education: The Impacts of high stakes
testing on school students and their families: An educator’s perspective, 2012, The Whitlam Institute and University of Western Sydney, pp 22–23. 38
For example: “Teacher facing sack over NAPLAN cheating”, 20 December 2010, ABC News; “Union unhappy with teacher investigation”, 3 January 2011, ABC News; F Tomazin, “Schools caught cheating on NAPLAN”, 17 February 2013, The Age; “Crackdown on National Assessment Program Literacy and Numeracy classroom cheats”, 27 March 2014, news.com.au; A Caldwell, “NAPLAN cheating cases on the rise”, 18 January 2012, ABC News; B McDougall, “Principals and teachers banned from coaching NAPLAN tests”, 26 March 2014, The Advertiser; and B Hiatt, “Teachers fired as test cheats”, 4 August 2015, The West Australian.
NSW Parliamentary Research Service
10
because it leads to a demoralised teacher workforce:39
[I]dentification of effective teaching is still quite technically difficult: the challenge of disentangling student socio-economic advantage, prior achievement and school background factors from measures of teacher quality have not been overcome.
As a result of misidentifying good teachers as poor ones, high-stakes testing can demoralise teachers, reduce the appeal of the profession, and accelerate teacher attrition. Further, when the tests are designed to identify individual teachers’ performance compared with their peers, teacher collaboration can be undermined.
In theory, NAPLAN could be used as an empirical basis for high-stakes testing in Australia. In practice, however, a critical difference exists between the high-stakes position of the United States and the position in Australia, where NAPLAN is used to identify and direct funding towards areas of socio-economic disadvantage.
Most notably, the “Gonski report” used NAPLAN data to identify the effects of socio-economic disadvantage on educational outcomes and inform a model of funding that promotes greater equity across the school system.40
Further, NSW’s Resource Allocation Model directs additional funding to socio-economically disadvantaged schools using the Family Occupation and Education Index (FOEI); a school-level measure of socio-economic disadvantage that is constructed using a statistical regression model which incorporates school average NAPLAN results.41
In order to “better target school funding to need”, Victoria is presently considering how it can combine Year 5 NAPLAN data with measures of socio-economic disadvantage to provide “equity funding” to select high schools.42
39
P Goss and J Hunter, Targeted Teaching: How better use of data can improve student learning, 2015, Grattan Institute, p 39.
40 D Gonski, K Boston, K Greiner et al, Review of Funding for Schooling: Final Report, 2011,
Department of Education, Employment and Workplace Relations, Canberra, Chapters 3 and 4,
and Recommendation 9 which states: “The Australian Government, in collaboration with the
states and territories and in consultation with the non-government sector, should initially base the per student component of the resource standard on an outcomes benchmark that at least 80 per cent of students in reference schools are achieving above the national minimum standard, for their year level, in both reading and numeracy, across each of the three most recent years of NAPLAN results. …” 41
L Lu and K Rickard, Family Occupation and Education Index (FOEI) 2013, 2014, Centre for Education Statistics and Evaluation, NSW Department of Education and Communities, p 28. The mathematical model is set out at p 27. For a diagram of the construction of FOEI, see Local Schools, Local Decisions—Resource Allocation Model, 2013, NSW Department of Education and Communities and PWC, pp 29–30. For an example of the role of FOEI in identifying areas of socio-economic disadvantage and targeting funding accordingly, see: E Bagshaw, “NSW Education Minister Adrian Piccoli announces record Gonski funding for State’s schools”, 21 October 2015, The Sydney Morning Herald. 42
H Cook, “Andrews government considers plan to tie NAPLAN results to school funding”, 9

NSW School Education: NAPLAN, Measurement and Performance
11
The capacity of such targeted needs-based (or “Gonski”) funding to assist students was vividly illustrated by the Speaker of the NSW Legislative Assembly, Mrs Shelley Hancock MP, when she recounted the experience of students at a local school in her South Coast electorate:43
The principal at Milton Public School, Mr Mark Thomson, wrote to me last week to share how important the Gonski funding has been for his school. The school has been able to employ a support teacher for additional time to help students who are experiencing difficulty with classroom learning as well as employing two Aboriginal education workers to support their Aboriginal students. The school has also been able to implement specialist classes this semester to help stage one students struggling with literacy and numeracy. In fact, another parent wrote to me to share her story and to thank the Government for the difference this class has made to her child. After struggling and becoming disheartened with learning to read, this young man was selected for the new intensive literacy program and as a result he progressed five reading levels in one term. The student was really pleased with his progress and his mother said that it has boosted his confidence with his learning in all of the schoolwork. This is one example of how this funding is making a real difference to the lives of our young people at our schools.
8. NAPLAN STATE GOALS AND OUTCOMES
As noted above (at 1) and illustrated in Figure 3, one of the State’s 12 Premier’s Priorities is to “increase the proportion of NSW students in the top two NAPLAN bands by 8%” for reading and numeracy.44
Figure 3: Premier's Priority NAPLAN goal
August 2015, The Age, quoting a spokesman for Education Minister James Merlino.
43 NSWPD (Proof), 28 October 2015, p 80 (S Hancock).
44 NSW Government, State Priorities, Premier’s Priorities, Education. The previous State Plan (NSW 2021) had a similar goal (Goal 15) but without any specific (quantified) target. See also, S Nicholls, “Mike Baird tears up Barry O’Farrell’s State plan to sharpen focus on performance”, 14 September 2015, The Sydney Morning Herald.

NSW Parliamentary Research Service
12
Additionally, it is a State Priority to “increase the proportion of Aboriginal and Torres Strait Islander students in the top two NAPLAN bands for reading and numeracy by 30%.”45
NSW’s most recent NAPLAN results are presented below.46 Reflecting the approach of the Premier’s Priority and State Priority education goals, this paper focuses on reading and numeracy outcomes. The discussion incorporates preliminary results for 2015 and the indicators of statistical significance detailed in Table 2.
8.1 Year 3
Year 3 NAPLAN mean scale scores for reading, for NSW and Australia, are presented in Table 3. The NSW 2015 results are above, to a statistically significant degree, the 2008 results; but are not statistically different from the 2014 results.
Other statistical indicators include: 95.5% of Year 3 students meeting or exceeding the National Minimum Standard and 49.9% of Year 3 students being placed in the top two NAPLAN bands (Band 5 or 6 and above).47
Year 3 NAPLAN means scale scores for numeracy, for NSW and Australia, are
45
NSW State Priorities, Better Services. This target was not in previous State Plan, NSW 2021. 46
Results are from the ACARA website. 47
ACARA, National Assessment Program, 2015 preliminary results, Achievement of Year 3 students in reading.
Table 2: Indicators of statistical significance — Trend results
▲ Average achievement is substantially above and is statistically significantly different from the base year (or previous year) for this State/Territory.
△ Average achievement is above and is statistically significantly different from the base year (or previous year) for this State/Territory.
■ Average achievement is close to or not statistically different from the base year (or previous year) for this State/Territory.
▽ Average achievement is below and is statistically significantly different from the base year (or previous year) for this State/Territory.
▼ Average achievement is substantially below and is statistically significantly different from the base year (or previous year) for this State/Territory.
Table 3: Year 3 Reading NSW AUS
Mean scale score / (standard deviation)
2008 Final 412.3 400.5
(80.1) (84.5)
2014 Final 422.9 418.3
(84.2) (86.2)
2015 Preliminary 430.3 425.8
(86.6) (87.0)
Nature of the difference: 2008 vs. 2015 △ △
Nature of the difference: 2014 vs. 2015 ■ ■

NSW School Education: NAPLAN, Measurement and Performance
13
presented in Table 4. The NSW 2015 results are not different, to any statistically significant degree, from the 2008 and 2014 results. Other statistical indicators include: 94.8% of Year 3 students meeting or exceeding the National Minimum Standard and 35.5% of Year 3 students being placed in the top two NAPLAN bands (Band 5 or 6 and above).48
Table 4: Year 3 Numeracy NSW AUS
Mean scale score / (standard deviation)
2008 Final 408.9 396.9
(70.6) (70.4)
2014 Final 407.3 401.8
(74.2) (73.0)
2015 Preliminary 401.0 397.8
(76.5) (74.5)
Nature of the difference: 2008 vs. 2015 ■ ■
Nature of the difference: 2014 vs. 2015 ■ ■
8.2 Year 5
Year 5 NAPLAN mean scale scores for reading, for NSW and Australia, are presented in Table 5. The NSW 2015 results are not different to any statistically significant degree from the 2008 and 2014 results. Other statistical indicators include: 93.7% of NSW Year 5 students meeting or exceeding the National Minimum Standard and 34.8% of NSW Year 5 students being placed in the top two bands (Band 7 or 8 and above).49
Table 5: Year 5 Reading NSW AUS
Mean scale score / (standard deviation)
2008 Final
494.7 484.4
(74.9) (76.5)
2014 Final
504.0 500.6
(77.8) (78.0)
2015 Preliminary
500.8 498.2
(79.5) (78.5)
Nature of the difference: 2008 vs. 2015 ■ ■
Nature of the difference: 2014 vs. 2015 ■ ■
48
ACARA, National Assessment Program, 2015 preliminary results, Achievement of Year 3 students in numeracy.
49 ACARA, National Assessment Program, 2015 preliminary results, Achievement of Year 5 students in reading.
NSW Parliamentary Research Service
14
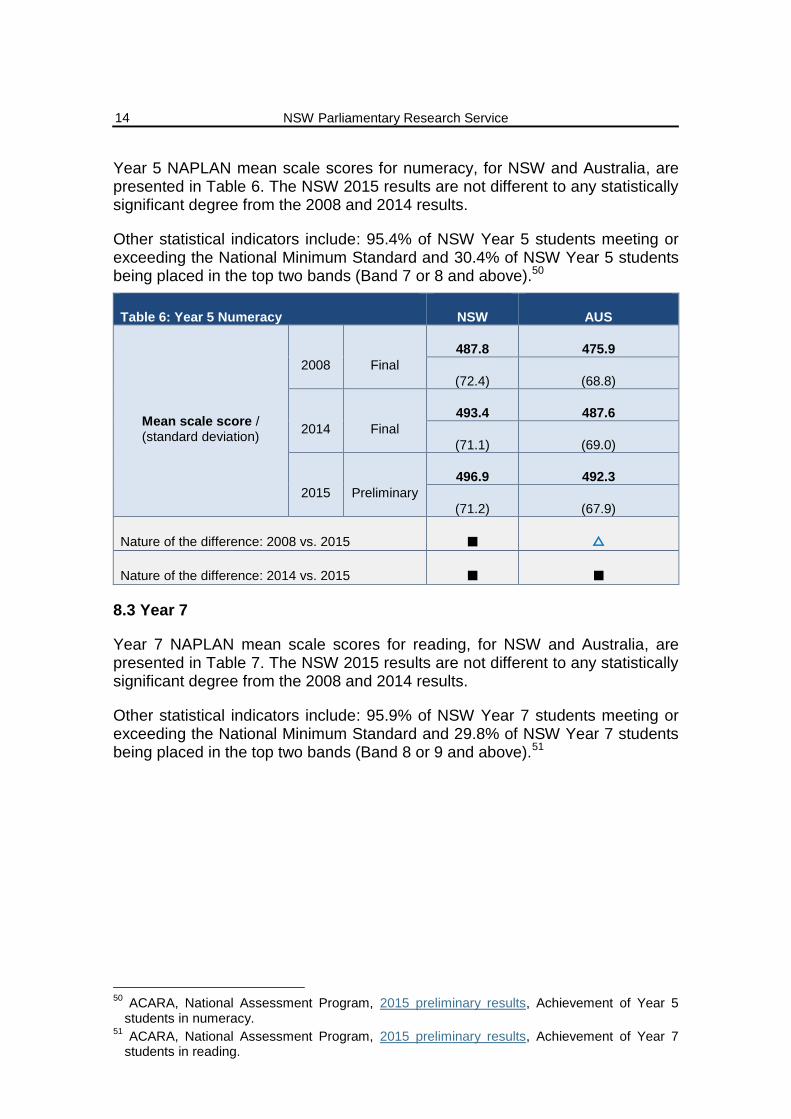
Year 5 NAPLAN mean scale scores for numeracy, for NSW and Australia, are presented in Table 6. The NSW 2015 results are not different to any statistically significant degree from the 2008 and 2014 results.
Other statistical indicators include: 95.4% of NSW Year 5 students meeting or exceeding the National Minimum Standard and 30.4% of NSW Year 5 students being placed in the top two bands (Band 7 or 8 and above).50
Table 6: Year 5 Numeracy NSW AUS
Mean scale score / (standard deviation)
2008 Final
487.8 475.9
(72.4) (68.8)
2014 Final
493.4 487.6
(71.1) (69.0)
2015 Preliminary
496.9 492.3
(71.2) (67.9)
Nature of the difference: 2008 vs. 2015 ■ △
Nature of the difference: 2014 vs. 2015 ■ ■
8.3 Year 7
Year 7 NAPLAN mean scale scores for reading, for NSW and Australia, are presented in Table 7. The NSW 2015 results are not different to any statistically significant degree from the 2008 and 2014 results.
Other statistical indicators include: 95.9% of NSW Year 7 students meeting or exceeding the National Minimum Standard and 29.8% of NSW Year 7 students being placed in the top two bands (Band 8 or 9 and above).51
50
ACARA, National Assessment Program, 2015 preliminary results, Achievement of Year 5 students in numeracy.
51 ACARA, National Assessment Program, 2015 preliminary results, Achievement of Year 7 students in reading.

NSW School Education: NAPLAN, Measurement and Performance
15
Table 7: Year 7 Reading NSW AUS
Mean scale score / (standard deviation.)
2008 Final
542.5 536.5
(69.0) (68.2)
2014 Final
548.3 546.1
(69.9) (69.0)
2015 Preliminary
548.2 545.9
(68.7) (67.8)
Nature of the difference: 2008 vs. 2015 ■ ■
Nature of the difference: 2014 vs. 2015 ■ ■
Year 7 NAPLAN mean scale scores for numeracy, for NSW and Australia, are presented in Table 8. The NSW 2015 results are not different to any statistically significant degree from the 2008 and 2014 results. Other statistical indicators include: 96.3% of NSW Year 7 students meeting or exceeding the National Minimum Standard and 28.2% of NSW Year 7 students being placed in the top two bands (Band 8 or 9 and above).52
8.4 Year 9
Year 9 NAPLAN mean scale scores for reading, for NSW and Australia, are presented in Table 9. The NSW 2015 results are not different to any statistically significant degree from the 2008 and 2014 results. Other statistical indicators
52
ACARA, National Assessment Program, 2015 preliminary results, Achievement of Year 7 students in numeracy.
Table 8: Year 7 Numeracy NSW AUS
Mean scale score / (standard deviation)
2008 Final
551.3 545.0
(78.3) (73.2)
2014 Final
550.3 545.9
(77.7) (73.0)
2015 Preliminary
547.1 542.6
(73.7) (68.3)
Nature of the difference: 2008 vs. 2015 ■ ■
Nature of the difference: 2014 vs. 2015 ■ ■

NSW Parliamentary Research Service
16
include: 92.6% of NSW Year 9 students meeting or exceeding the National Minimum Standard and 22.6% of NSW Year 9 students being placed in the top two bands (Band 9 or 10).53
Table 9: Year 9 Reading NSW AUS
Mean scale score / (standard deviation)
2008 Final
583.1 578.0
(66.9) (67.0)
2014 Final
584.3 580.4
(69.1) (67.6)
2015 Preliminary
582.2 580.4
(69.4) (67.7)
Nature of the difference: 2008 vs. 2015 ■ ■
Nature of the difference: 2014 vs. 2015 ■ ■
Year 9 NAPLAN mean scale scores for numeracy, for NSW and Australia, are presented in Table 10. The NSW 2015 results are not different, to any statistically significant degree, from the 2008 and 2014 results. Other statistical indicators include: 96% of NSW Year 9 students meeting or exceeding the National Minimum Standard and 26.7% of NSW Year 9 students being placed in the top two bands (Band 9 or 10).54
Table 10: Year 9 numeracy NSW AUS
Mean scale score/ (S.D.)
2008 Final
591.4 582.2
(75.1) (70.2)
2014 Final
594.3 587.8
(77.2) (70.9)
2015 Preliminary
596.3 591.7
(72.9) (67.3)
Nature of the difference: 2008 vs. 2015 ■ ■
Nature of the difference: 2014 vs. 2015 ■ ■
53
ACARA, National Assessment Program, 2015 preliminary results, Achievement of Year 9 students in reading.
54 ACARA, National Assessment Program, 2015 preliminary results, Achievement of Year 9 students in numeracy.

NSW School Education: NAPLAN, Measurement and Performance
17
8.5. Summary
For the key subject domains of reading and numeracy, NSW NAPLAN results have remained statistically stable; with the exception of Year 3 reading results, which showed a statistically significant improvement when compared to the 2008 results. While stable results imply consistency,55 for the subject domains of reading and numeracy the State has set itself the goals of increasing the proportion of students in the top two NAPLAN bands by 8%; and increasing the proportion of Aboriginal and Torres Strait Islander students in the top two NAPLAN bands by 30%.56
9. DEMOGRAPHIC, SOCIO-ECONOMIC AND ENVIRONMENTAL FACTORS
Finalised (pre-2015) NAPLAN data for can be analysed on the basis of:
sex;
Indigenous status;
language background other than English (LBOTE);
“geolocation” — metropolitan, provincial, remote and very remote;57
Indigenous by geolocation;58
non-Indigenous by geolocation;59
parental education — Bachelor (or above), Diploma, Certificate, Year 12, Year 11 (or below), or Not stated; and
parental occupation — Group 1 (senior management and qualified professionals), Group 2 (Other business managers and associate professionals), Group 3 (Tradespeople, clerks, skilled office, sales/service staff), Group 4 (Machine operators, hospitality staff, assistants, labourers), Not in paid work, or Not stated.
The results obtained by manipulating these variables are not causal; they are merely correlational. But the results can be used to identify areas of particular need — or points of intervention — that may usefully be addressed by targeted policies or allocation of resources.60
55
J Buckingham, “Ignore the doubters, NAPLAN is important and it’s working”, 5 August 2015, The Drum.
56 NSW Government, State Priorities, Premier’s Priorities, Education and NSW Government, State Priorities, Better Services. NSW Department of Education and Communities initiatives designed to meet NAPLAN based education State goals include: the Early Action for Success 2014 Implementation Plan and Literacy and Numeracy Action Plan.
57 NAPLAN data is classified using the MCEECDYA (Ministerial Council for Education Early Childhood Development and Youth Affairs) geographic location classification system. See also: R Jones, Geolocation and Coding Index, 2004.
58 The data for Indigenous by geolocation is not presented because, in some year groups, there were no students or less than 30 students in the “very remote” category.
59 The data for non-Indigenous by geolocation is not presented because, in some year groups, there were no students or less than 30 students in the “very remote” category.
60 The impact of socio-economic factors on school education in Australia was recently highlighted in: S Lamb, J Jackson, A Walstab and S Huo, Educational opportunity in Australia 2015, 2015, Centre for International Research on Education Systems, Victoria University, for

NSW Parliamentary Research Service
18
The data in Figures 4–15 detail the 2014 reading and numeracy outcomes of all tested year groups in NSW in relation to sex, Indigenous status, LBOTE status, geolocation, parental education and parental occupation.61
9.1 Sex
Figure 4 reveals that in NSW in 2014 female students outperformed male students in reading in each tested year group. Across all tested year groups, female students scored an average of 520.67 and male students scored an average of 509.27.
Figure 5 illustrates that in NSW in 2014 male students outperformed female students in numeracy in all tested year groups. Across all tested year groups, male students scored an average of 515.9 and female students scored an average of 506.52.
the Mitchell Institute, Melbourne; see also T Jacks, “Quarter of Australian students drop out, new report reveals”, 26 October 2015, The Sydney Morning Herald.
61 The figures are based on official NAPLAN Results. Standard deviations have been omitted.
417.8 498.4 543.4 577.5
428.2 509.8 553.3 591.4
Mean scale score
200
400
600
800
Year 3 Year 5 Year 7 Year 9
Figure 4: NSW 2014 NAPLAN results: reading by sex
Male Female
410
498.6 554.9
600.1
404.5
487.9 545.5
588.2
Mean scale score
100
200
300
400
500
600
700
Year 3 Year 5 Year 7 Year 9
Figure 5: NSW 2014 NAPLAN results: numeracy by sex
Male Female

NSW School Education: NAPLAN, Measurement and Performance
19
9.2 Indigenous status
Figure 6 reveals that in NSW in 2014 non-Indigenous students outperformed Indigenous students in reading in each tested year group. Across all tested year groups, Indigenous students scored an average of 455.05 and non-Indigenous students scored an average of 518.12.
Figure 7 reveals that in NSW in 2014, in every tested year group, non-Indigenous students outperformed Indigenous students in numeracy. Across all tested year groups, Indigenous students scored an average of 450.45 and non-Indigenous students scored an average of 514.7.
9.3 Language Background Other Than English (LBOTE)
Figure 8 reveals that in NSW in 2014 there was a varying effect of language background on the reading results of NSW students. Across Years 3 and 5 non-LBOTE students scored an average of 463.95 and LBOTE students scored an average of 461.3; while, in Years 7 and 9, that outcome was reversed, with
355.2
440.4 495.4
529.2
426.6
507.3 551.1
587.5
Mean scale score
100
200
300
400
500
600
700
Year 3 Year 5 Year 7 Year 9
Figure 6: NSW 2014 NAPLAN results: reading by Indigenous status
Indigenous Non-Indigenous
348.1
433 489.2
531.5
410.6
496.6 553.6
598
Mean scale score
100
200
300
400
500
600
700
Year 3 Year 5 Year 7 Year 9
Figure 7: NSW 2014 NAPLAN results: numeracy by Indigenous status
Indigenous Non-Indigenous

NSW Parliamentary Research Service
20
LBOTE students scoring an average of 569.35 and non-LBOTE students scoring an average of 564.65. Overall, across all tested year groups LBOTE students scored an average of 515.3 and non-LBOTE students scored an average of 514.3.
Figure 9 reveals that in NSW in 2014, in every tested year group, LBOTE students outperformed non-LBOTE students in numeracy. Across all tested year groups, LBOTE students scored an average of 523.77 and non-LBOTE students scored an average of 505.92.
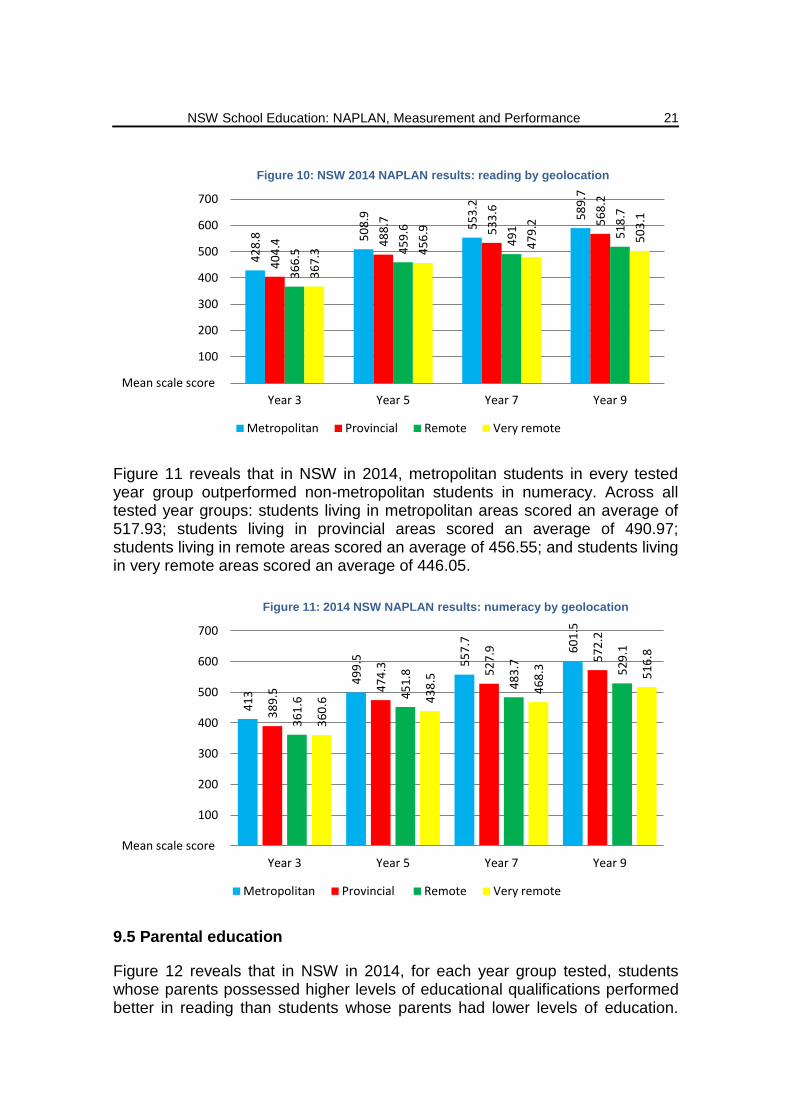
9.4 Geolocation
Figure 10 reveals that in NSW in 2014 metropolitan students outperformed non-metropolitan students in reading in each tested year group. Across all tested year groups, metropolitan students scored an average of 520.15; students living in provincial areas scored an average of 498.72; students living in remote areas scored an average of 458.95; and students living in very remote areas scored an average of 451.62.
421.4
501.2 549.4
589.3
423.1
504.8 547.3
582
Mean scale score
100
200
300
400
500
600
700
Year 3 Year 5 Year 7 Year 9
Figure 8: NSW 2014 NAPLAN results: reading by LBOTE status
LBOTE (Language Background Other Than English) Non-LBOTE
410.3
503 568.1
613.7
405.6
488.9 542.9
586.3
Mean scale score
100
200
300
400
500
600
700
Year 3 Year 5 Year 7 Year 9
Figure 9: NSW 2014 NAPLAN results: numeracy by LBOTE status
LBOTE (Language Background Other Than English) Non-LBOTE
NSW School Education: NAPLAN, Measurement and Performance
21
Figure 11 reveals that in NSW in 2014, metropolitan students in every tested year group outperformed non-metropolitan students in numeracy. Across all tested year groups: students living in metropolitan areas scored an average of 517.93; students living in provincial areas scored an average of 490.97; students living in remote areas scored an average of 456.55; and students living in very remote areas scored an average of 446.05.
9.5 Parental education
Figure 12 reveals that in NSW in 2014, for each year group tested, students whose parents possessed higher levels of educational qualifications performed better in reading than students whose parents had lower levels of education.
42
8.8
50
8.9
55
3.2
58
9.7
40
4.4
48
8.7
53
3.6
56
8.2
36
6.5
45
9.6
49
1
51
8.7
36
7.3
45
6.9
47
9.2
50
3.1
Mean scale score
100
200
300
400
500
600
700
Year 3 Year 5 Year 7 Year 9
Figure 10: NSW 2014 NAPLAN results: reading by geolocation
Metropolitan Provincial Remote Very remote
41
3 4
99
.5
55
7.7
60
1.5
38
9.5
47
4.3
52
7.9
57
2.2
36
1.6
45
1.8
48
3.7
52
9.1
36
0.6
43
8.5
46
8.3
51
6.8
Mean scale score
100
200
300
400
500
600
700
Year 3 Year 5 Year 7 Year 9
Figure 11: 2014 NSW NAPLAN results: numeracy by geolocation
Metropolitan Provincial Remote Very remote

NSW Parliamentary Research Service
22
Based on the highest level of education of either parent/guardian, across all tested year groups:62
students with a parent/guardian educated to a Bachelor degree (or higher) level scored an average of 553.5;
students with a parent/guardian educated to a Diploma level scored an average of 515.65;
students with a parent/guardian educated to a Certificate level scored an average of 493.35;
students with a parent/guardian educated to a Year 12 level scored an average of 495.15; and
students with a parent/guardian educated to a Year 11 (or below) level scored an average of 461.65.
Figure 13 reveals that in NSW in 2014, in every tested year group, students with parents possessing higher levels of educational qualifications performed better in numeracy than students with parents possessing lower levels of educational qualifications. Based on the highest level of educational qualification of either parent/guardian, across all tested year groups:63
students with a parent/guardian educated to a Bachelor degree (or
62
Excluding those NSW students in the “not stated” category: 4% of Year 3 students; 5% of Year 5 students; 6% of Year 7% students; and 8% of Year 9 students. Figure 8 also excludes the “not stated” category.
63 Excluding those NSW students in the “not stated” category: 4% of Year 3 students; 5% of Year 5 students; 6% of Year 7 students; and 8% of Year 9 students. Figure 13 also excludes the “not stated” category.
46
2.5
54
3.7
58
5.3
62
2.5
42
2.3
50
4.3
54
8
58
8
39
8.3
48
1.1
52
8.3
56
5.7
39
5.4
48
1.5
53
1.9
57
1.8
35
9.6
44
8.5
50
0.2
53
8.3
Mean scale score
100
200
300
400
500
600
700
Year 3 Year 5 Year 7 Year 9
Figure 12: NSW 2014 NAPLAN results: reading by parental education
Bachelor Diploma Certificate Year 12 Year 11 (or below)

NSW School Education: NAPLAN, Measurement and Performance
23
higher) level scored an average of 550.77;
students with a parent/guardian educated to a Diploma level scored an average of 511.1;
students with a parent/guardian educated to a Certificate level scored an average of 488.52;
students with a parent/guardian educated to a Year 12 level scored an average of 494.4; and
students with a parent/guardian educated to a Year 11 level (or below) scored an average of 460.2.
9.6 Parental occupation
Figure 14 reveals that in NSW in 2014, for each year group tested, students with a parent/guardian whose occupation category was senior management or qualified professional performed better in reading than students with a parent/guardian in other employment categories. Based on the highest occupational group of either parent/guardian, across all tested year groups:64
students with a parent/guardian employed in senior management or as a qualified professional scored an average of 553.1;
students with a parent/guardian employed as a business manager or as an associate professional scored an average of 527.15;
students with a parent/guardian employed as a tradesperson, clerk,
64
Excluding those NSW students in the “not stated” category: 10% of Year 3 students; 10% of Year 5 students; 9% of Year 7 students; and 13% of Year 9 students. Figure 14 also excludes the “not stated” category.
44
2.2
52
9.7
59
3 63
8.2
40
6.3
49
3 54
8.7
59
6.4
38
5.9
47
1.6
52
5.2
57
1.4
38
3.1
47
6 5
35
.2
58
3.3
35
2.4
44
3.9
49
8.7
54
5.8
Mean scale score
100
200
300
400
500
600
700
Year 3 Year 5 Year 7 Year 9
Figure 13: 2014 NSW NAPLAN results: numeracy by parental education
Bachelor Diploma Certificate Year 12 Year 11 (or below)

NSW Parliamentary Research Service
24
skilled office worker, or sales/service staff, scored an average of 502.07;
students with a parent/guardian employed as a machine operator, hospitality staff, assistant or labourer scored an average of 484.87; and
students with no parent in paid employment in the previous 12 months scored an average of 468.25.
Figure 15 reveals that in NSW in 2014, for each year group tested, students with a parent/guardian whose occupational category was senior management or qualified professional performed better in numeracy than students with a parent/guardian in other occupational categories. Based on the highest occupational group of either parent/guardian, across all tested year groups:65
students with a parent/guardian employed in senior management or as a qualified professional scored an average of 547.65;
students with a parent/guardian employed as a business manager or as an associate professional scored an average of 522.9;
students with a parent/guardian employed as a tradesperson, clerk, skilled office worker, or as sales/service staff, scored an average of 498.82;
students with a parent/guardian employed as a machine operator, hospitality staff, assistant or labourer scored an average of 484.47; and
students with no parent/guardian in paid employment in the previous 12 months scored an average of 465.82.
65
Excluding NSW students in the “not stated” category: 10% of Year 3 students; 10% of Year 5 students; 9% of Year 7 students; and 13% of Year 9 students. Figure 15 also excludes the “not stated” category.
46
3.7
54
4.3
58
4.3
62
0.1
43
7.5
51
7
55
8.6
59
5.5
40
8.3
49
1.1
53
5.4
57
3.5
38
9 47
1.1
52
0.6
55
8.8
36
9.5
45
5.5
50
5.8
54
2.2
Mean scale score
200
400
600
800
Year 3 Year 5 Year 7 Year 9
Figure 14: NSW 2014 NAPLAN results: reading by parental occupation
Group 1: Senior management and qualified professionalsGroup 2: Other business managers and associate professionalsGroup 3: Tradespeople, clerks, skilled office, sales and service staffGroup 4: Machine operators, hospitality staff, assistants, labourersNot in paid work in previous 12 months

NSW School Education: NAPLAN, Measurement and Performance
25
9.7 Children in foster care
The Australian Institute of Health and Welfare (AIHW) linked child protection and NAPLAN data to examine the educational outcomes of children in foster care.66 In particular, it examined the 2013 NAPLAN results of children who were in care at the time of testing. Data was reported on 3,583 children from 6 States and Territories, including 1,901 children (53%) from NSW.67
The AIHW found that the children in foster care had “consistently and considerably” lower National Minimum Standard (NMS) achievement rates than all students in Australia,68 with the rates being “13–39 percentage points lower across assessment domains and year levels”.69 Moreover, the AIHW found that the extent to which children in foster care were outperformed by other students increased in the higher year groups:70
The gap between the NMS achievement rates of the study population and all students in Australia generally rose with increasing year level … across assessment domains, rates were lower among the study population by 13–20
66
Educational Outcomes for children in care: Linking 2013 child protection and NAPLAN data, Australian Institute of Health and Welfare, 2015, Canberra; R Browne, “The foster children that NAPLAN left behind: Australian Institute of Health and Welfare report”, 21 October 2015, Sydney Morning Herald. For research undertaken in Queensland linking NAPLAN and census data, see: Australian Bureau of Statistics, Educational outcomes, experimental estimates, Queensland, 2011.
67 Educational Outcomes for children in care: Linking 2013 child protection and NAPLAN data, Australian Institute of Health and Welfare, 2015, Canberra, p 2.
68 Educational Outcomes for children in care: Linking 2013 child protection and NAPLAN data, Australian Institute of Health and Welfare, 2015, Canberra, p 10.
69 Educational Outcomes for children in care: Linking 2013 child protection and NAPLAN data, Australian Institute of Health and Welfare, 2015, Canberra, p 10 and Table A22.
70 Educational Outcomes for children in care: Linking 2013 child protection and NAPLAN data, Australian Institute of Health and Welfare, 2015, Canberra, p 10 and Table A22.
44
2.4
52
7.7
58
8.3
63
2.2
41
9.8
50
4.4
56
1.7
60
5.7
39
5.5
48
2.4
53
5.3
58
2.1
37
8.6
46
6.6
52
2.8
56
9.9
36
0.3
44
9.9
50
4.2
54
8.9
Mean scale score
200
400
600
800
Year 3 Year 5 Year 7 Year 9
Figure 15: 2014 NSW NAPLAN results: numeracy by parental occupation
Group 1: Senior management and qualified professionalsGroup 2: Other business managers and associate professionalsGroup 3: Tradespeople, clerks, skilled office, sales and service staffGroup 4: Machine operators, hospitality staff, assistants, labourersNot in paid work in previous 12 months

NSW Parliamentary Research Service
26
percentage points for Year 3 students, 13–25 percentage points for Year 5 students, 20–35 percentage points for Year 7 students, and 24–39 percentage points for Year 9 students.
9.8 Students with speech and language problems
Researchers from Charles Sturt University (CSU)71 combined NAPLAN results with data from the Longitudinal Study of Australian Children to assess the academic performance of students with speech and language conditions.72
The study was a longitudinal comparison of the Year 3, 5 and 7 NAPLAN results of two student groups: a group comprised of children with learning and/or speech problems; and a control group comprised of “typical developing” students.73
After accounting for a range of demographic and socio-economic factors, the study found:74
1. Students with speech and language problems were more likely to be excluded from NAPLAN testing than students without these problems.
2. Children with speech and language problems achieved significantly lower scores on every NAPLAN test (reading, writing, spelling, grammar and numeracy) at Years 3, 5 and 7 compared to students without these problems.
3. Students who had both expressive (using) and receptive (understanding) language problems had the poorest NAPLAN outcomes.
71
S McLeod, LJ Harrison and C Wang, NAPLAN outcomes for children identified with speech and language difficulties in early childhood: Second Report – 21 July, 2015, Charles Sturt University; NAPLAN fails children with communication impairment, 28 September 2015, Charles Sturt University.
72 On 25 September 2015 preliminary findings from the CSU study were submitted by Speech Pathology Australia to the Senate Education and Employment References Committee’s Inquiry into the current levels of access and attainment for students with disability in the school system, and the impact on students and families associated with inadequate levels of support.
73 NAPLAN results were analysed for 4,332 children participating in the Longitudinal Study of Australian Children. Of these children, 1,442 children had speech/language problems and 2,890 children had typical speech/language for their age. The children with the speech/language problems were further separated into three sub-groups: children with only expressive problems (N=834); children with only receptive problems (N=159); and children with both receptive and expressive problems (N=449): Submission of Speech Pathology Australia to the Senate’s Education and Employment References Committee Inquiry into the current levels of access and attainment for students with disability in the school system, and the impact on students and families associated with inadequate levels of support. pp 22–23
74 Submission of Speech Pathology Australia to the current Senate Education and Employment References Committee Inquiry into the current levels of access and attainment for students with disability in the school system, and the impact on students and families associated with inadequate levels of support. S McLeod, LJ Harrison and C Wang, NAPLAN outcomes for children identified with speech and language difficulties in early childhood: Second Report – 21 July, 2015, Charles Sturt University; and NAPLAN fails children with communication impairment, 28 September 2015, Charles Sturt University.

NSW School Education: NAPLAN, Measurement and Performance
27
4. Poorer outcomes for children with speech and language problems were observed in each of the States and Territories — with little evidence that the ‘gap’ in outcomes was reduced over time.
5. Most students with speech and language problems had not seen a speech pathologist.
While the study provided national results, it also provided results for each State and Territory. As Table 11 reveals:75
[I]n NSW students with speech/language problems consistently perform more poorly on NAPLAN than their peers on all sub-sets at all year levels …
Students with speech/language problems in NSW are not “catching up” with their peers during primary school and there is no evidence to indicate that they are “closing the gap” in NAPLAN performance throughout primary school — in fact, it would appear on some scales of NAPLAN that the gap is widening between Year 3 and Year 7 (for example, on the subset of writing).
Table 11: NAPLAN mean scale scores for NSW students in the CSU study
Year Group Reading Writing Spelling Grammar Numeracy
3 Typical developing 439.78 447.20 436.58 451.39 431.75
Speech/language problems
412.23 421.16 407.79 413.05 410.76
Mean difference 27.55 26.04 28.79 38.34 20.99
5 Typical developing 523.42 511.59 512.55 535.88 516.02
Speech/language problems
494.73 481.13 489.57 503.22 497.59
Mean difference 28.69 30.46 22.98 32.66 18.43
7 Typical developing 570.76 540.44 570.37 576.34 565.16
Speech/language problems
544.76 507.44 540.63 547.13 546.46
Mean difference 26.00 33.00 29.74 29.21 18.70
9.9 Children suffering from lead contamination
Illustrating its potential to inform research into a broad range of social issues, NAPLAN has been used to investigate the effects of lead contamination on the developmental and educational progress of children living in the mining towns of Broken Hill (NSW), Port Pirie (South Australia) and Mount Isa (Queensland).
Using data from NAPLAN and the Australian Early Development Census, as well as blood tests for lead contamination, researchers from Macquarie University found that higher lead contamination was associated with lower NAPLAN scores in each of the towns.76 The multi-site design of the study
75
Submission of Speech Pathology Australia to the current Senate Education and Employment References Committee Inquiry into the current levels of access and attainment for students with disability in the school system, and the impact on students and families associated with inadequate levels of support, p 29, including Table 3: Mean scores on NAPLAN subsets for NSW students at each testing year.
76 C Dong, M Taylor, L Kristensen and S Zahran, “Environmental contamination in an Australian

NSW Parliamentary Research Service
28
further suggests that it was the lead contamination that was associated with the reduced NAPLAN outcomes, rather than any other variable.
Commenting on the findings in respect of children living in high contamination versus low contamination areas of Broken Hill, the study’s lead author, Professor Mark Taylor, said:77
The difference between children attending schools in areas with the maximum soil lead risks compared to the lower soil lead risk is 20 NAPLAN points, or about 5 per cent.
On 13 February 2015 the NSW Government allocated more than $13 million to address the issue of blood lead levels in children living in Broken Hill.78
10. USING NAPLAN TO IDENTIFY EFFECTIVE SCHOOL PRACTICES
NAPLAN is a new tool for researching what works and what does not work in school education. Due to the many confounding variables existing in dynamic school settings, NAPLAN cannot be used to determine whether any particular initiative “causes” school outcomes to improve. But it may indicate whether new school practices are associated with improved school outcomes. This section presents examples of how NAPLAN has been used in this manner in formal educational research and in more informal evaluations.
10.1 Identifying “high value-add” schools
In October 2015 the NSW Department of Education’s Centre for Education Statistics and Evaluation (CESE) used NAPLAN data to identify key drivers of school improvement.79 As the CESE explains:80
NAPLAN results are a valuable indicator of a school’s performance in any given year and can be used to examine trends in performance over time. CESE has developed a value-added (VA) modelling approach to measure growth in NAPLAN scores at the student and school-level …. This methodology measures growth in NAPLAN scores while accounting for relevant student and school-level characteristics, as well as students’ prior school performance. In
mining community and potential influences on early childhood health and behavioural outcomes”, 2015, 207 Environmental Pollution 345–356. See also: “Toxic metals exposures lower school scores and slow childhood development in Australia’s mining and smelting communities”, 7 October 2015, Macquarie University; MP Taylor, C Dong, L Kristensen and S Zahran, “Australian children exposed to toxic mining metals do worse at school”, 6 October 2015, The Conversation.
77 D Lewis and Z Margolis, “Study shows link between poor school results and environmental contamination in mining towns”, 6 October 2015, ABC News.
78 “NSW Government commits more than $13 million to reduce lead levels at Broken Hill”, 13 February 2015, Environmental Protection Authority, Media Release (Kevin Humphries MP).
79 D Bradford and S Clarke, High Value-add Schools: Key Drivers of School Improvement, 2015, Centre for Education Statistics and Evaluation, Sydney.
80 D Bradford and S Clarke, High Value-add Schools: Key Drivers of School Improvement, 2015, Centre for Education Statistics and Evaluation, Sydney, p 5.

NSW School Education: NAPLAN, Measurement and Performance
29
effect, this model allows for a prediction to be made about the expected level of growth in NAPLAN scores for each school given students’ prior performance and the various school and student characteristics.
The CESE’s NAPLAN-driven modelling enabled it to identify 17 high schools and 20 primary schools which, between 2010 and 2014, achieved improvements in NAPLAN scores that exceeded the predicted growth.81
Of those schools: 19 moved from significantly below average to average or significantly above average: 10 moved from average to above average; and 8 began as above average performers and continued to show significant growth.
The CESE then used a range of qualitative and quantitative data to identify the key characteristics of the high-value schools that facilitated the better than expected improvement in their students’ NAPLAN outcomes. What the study found is that high value-add schools foster cultures of excellence by focusing on:82
effective collaboration amongst teachers;
ongoing participation in and sharing of professional learning;
explicit and effective teaching strategies;
creating an environment that promotes learning and student engagement; and
setting high expectations for achievement.
These factors combined to create schools with:83
a positive institutional culture that emphasises and nurtures personal, academic and professional development and strong engagement among students, teachers and the leadership group.
The CESE study suggests that supporting other schools to adopt the characteristics of high value-add schools will likely assist them to improve their students’ educational outcomes to the greatest possible extent.84
10.2 Student wellbeing programs
Broadmeadows Primary School in Melbourne increased its NAPLAN results after seeking and implementing advice from an educational neuroscientist.
81
D Bradford and S Clarke, High Value-add Schools: Key Drivers of School Improvement, 2015, Centre for Education Statistics and Evaluation, 2015, Sydney, p 5.
82 D Bradford and S Clarke, High Value-add Schools: Key Drivers of School Improvement, 2015, Centre for Education Statistics and Evaluation, 2015, Sydney, p 3.
83 D Bradford and S Clarke, High Value-add Schools: Key Drivers of School Improvement, 2015, Centre for Education Statistics and Evaluation, 2015, Sydney, p 19.
84 D Bradford and S Clarke, High Value-add Schools: Key Drivers of School Improvement, 2015, Centre for Education Statistics and Evaluation, 2015, Sydney, p 19. See also: R Wilson, The role of ‘Poster schools’ in funding a fairer, more cost effective education system, 2014, Checkmate Analytics, Sydney.

NSW Parliamentary Research Service
30
Subsequently, although the school is in the lowest 12th percentile for socio-economic disadvantage, its NAPLAN results were “higher than any other school in the area, and its year three results are above the Victorian State average”.85
Further, while Broadmeadows’ NAPLAN results have increased, the incidence of violence and behavioural problems has declined:86
In 2011, 96 children had to be removed from their classroom, and 254 from the playground, mostly for aggressive behaviour towards teachers and other students. … This year, only one child has been removed from a classroom, and 36 from the playground.
The measures introduced by the school aimed at improving academic outcomes by first improving wellbeing87 include: a breakfast club,88 for children who may not be fed at home; an “emotion wall”, where children can visually and quickly depict if they are upset or have problems at home; exercise programs; and teaching calming and anger management techniques.
10.3 A culture of achievement in both sport and studies
The University of Canberra’s Research Institute of Sport (UCRIS) has found that “fitter schools get better NAPLAN results”.89 In particular, the study found additional well-organised physical education was positively associated with improved NAPLAN scores.90
The study, which used data collected from 757 children in 29 schools, identified two distinct effects that operated independently from any demographic or socio-economic factors. The first was the direct physiological effect of improved fitness on cognitive functioning. The second was the cultural features of a school that valued both sporting and academic achievement. The study found that, statistically, school culture appeared to have a larger effect on the increase in NAPLAN scores than did the direct effects of improved fitness; although, as
85
ABC News, Melbourne school uses neuroscience to boost grades and improve wellbeing of students, 31 August 2015; and ABC 7:30 Report, Neuro-science turning around school results, 31 August 2015.
86 ABC News, Melbourne school uses neuroscience to boost grades and improve wellbeing of students, 31 August 2015; and ABC 7:30 Report, Neuro-science turning around school results, 31 August 2015.
87 See NSW Department of Education and Communities, The Wellbeing Framework for Schools, 2015.
88 See also: R Garner, “Children who eat breakfast before school ‘twice as likely to perform well in tests’”, 17 November 2015, Independent.
89 RD Telford, RB Cunningham, RM Telford, WP Abhayaratna, “Schools with fitter children achieve better literacy and numeracy results: evidence of a school cultural effect.” (2012) 24(1) Pediatr Exerc Sci 45-57 (Erratum in: (2012) Pediatr Exerc Sci 24(4) ii).
90 RD Telford, RB Cunningham, RM Telford, WP Abhayaratna, “Schools with fitter children achieve better literacy and numeracy results: evidence of a school cultural effect.” (2012) 24(1) Pediatr Exerc Sci 45-57 (Erratum in: (2012) Pediatr Exerc Sci 24(4)), pp 52 and 53. See also, E Parkinson, “Dick Telford’s study finds sport can improve NAPLAN scores”, 16 August 2015, Financial Review.

NSW School Education: NAPLAN, Measurement and Performance
31
the authors suggest, “the true explanation might lie somewhere in-between”.91
10.4 Evidence-based reading programs
The Victorian Western Metropolitan region, where many students come from socio-economically disadvantaged backgrounds, dramatically improved its NAPLAN reading results following the introduction of an evidence-based reading program developed by educator Diane Snowball.92 After Ms Snowball trained the school principals in the area, the Western Metropolitan Region became:93
The most improved region in Victorian education history, it went from lowest-performing region in the State in 2008 to third on all year 9 NAPLAN measures in 2012.
As detailed above (at Chapter 8), with the exception of the NAPLAN results for Year 3, NSW’s mean scale scores for reading have been statistically stable. In this context, where there has been no overall improvement in NSW’s reading outcomes, concerns have been expressed about the effectiveness of the NSW Department of Education and Communities’ Reading Recovery program.94
Dr Jennifer Buckingham, Research Fellow at the Centre for Independent Studies, has written that:95
An unpublished evaluation by the NSW Department of Education has revealed the $50 million a year Reading Recovery program – the main early intervention reading program used in NSW public schools – is ineffective for many students.
Numerous studies and evaluations have provided similar findings during the past two decades or more, yet it remains the department's preferred intervention program: about 100,000 NSW students have been enrolled in the program during that period.
Reading specialists have also been voicing their concerns about another NSW reading program – Language, Learning and Literacy (commonly known as L3) –which, like Reading Recovery, has few of the hallmarks of effective evidence-based reading instruction identified in research. In particular, there is an absence of explicit and systematic phonics instruction.
91
RD Telford, RB Cunningham, RM Telford, WP Abhayaratna, “Schools with fitter children achieve better literacy and numeracy results: evidence of a school cultural effect.” (2012) 24(1) Pediatr Exerc Sci 45-57 (Erratum in: (2012) Pediatr Exerc Sci 24(4)), pp 45 and 54–56.
92 See: Victoria State Government, Department of Education and Training, Specialist workshops—Diane Snowball. The program involves six comprehension strategies: (1). prediction/prior knowledge; (2) think aloud; (3) text structure; (4) visual representations; (5) summarisation; and (6) questioning: see D Snowball Teaching Comprehension.
93 F Villella, “Not beyond comprehension: the six easy steps to improving literacy”, 1 September 2015, The Sydney Morning Herald.
94 T Dodd, “$50m Reading Recovery program is ineffective Department study finds”, 6 September 2015, Australian Financial Review.
95 J Buckingham, “Lifting literacy needs more than just money”, 7 September 2015, The Sydney Morning Herald.

NSW Parliamentary Research Service
32
Dr Buckingham further states:96
Reading Recovery and Language, Learning and Literacy are both at odds with the department's own evaluation unit, The Centre for Education Statistics and Evaluation. In 2014, this unit produced an excellent report, What works best: Evidence-based practices to help improve NSW student performance. …The report was … clear about the importance of explicit, sequential and systematic phonics instruction in early reading.
On 2 November 2015 the Media Unit of the Department of Education and Communities advised that:97
The Department’s review of Reading Recovery is still in the process of being completed. The review will include an analysis of performance, cost and effectiveness. Once the review is finalised, a decision about the strategic directions will be determined.
11. FUTURE DIRECTIONS
Discussion concerning the future directions of NAPLAN has centred on the need to improve its diagnostic utility, in order to enhance its capacity to improve student outcomes. In a submission to the Senate Standing Committee on Education and Employment’s 2014 Inquiry into the effectiveness of NAPLAN, ACARA said that providing NAPLAN data to schools, education authorities and parents “may allow improvement to take place” by identifying areas of need and enabling stakeholders to better target resource allocation.98 It added:99
It should be emphasised that NAPLAN is a tool to inform school improvement, not an improver of educational outcomes. It is not the tests that will improve students’ literacy and numeracy skills, but the way students’ results (including school, system and national level results) are used by teachers, schools and systems to identify strengths and weaknesses, particularly in teaching practices and programs, that will improve student outcomes.
After noting evidence suggesting teachers do not receive sufficient training or support to enable them to properly use or analyse NAPLAN data, the Senate
Committee said:100
96
J Buckingham, “Lifting literacy needs more than just money”, 7 September 2015, The Sydney Morning Herald.
97 Correspondence to the author, dated 2 November 2011, from the Media Unit, Communications and Engagement, NSW Department of Education and Communities.
98 Senate Standing Committee on Education and Employment, Effectiveness of National Assessment Program — Literacy and Numeracy, 2014, Parliament House, Canberra, pp7–8.
99 Senate Standing Committee on Education and Employment, Effectiveness of National Assessment Program — Literacy and Numeracy, 2014, Parliament House, Canberra, pp7–8.
100 Senate Standing Committee on Education and Employment, Effectiveness of National Assessment Program — Literacy and Numeracy, 2014, Parliament House, Canberra, p 12. The Grattan Institute has said that the diagnostic value of NAPLAN is diminished by the infrequency of testing, the time taken to obtain results and various methodological limitations. It suggests that, in order for timely and effective pedagogical intervention to occur, NAPLAN results need to be augmented regularly by other, more finely tuned, assessment measures: P Goss and J Hunter, Targeted teaching: How better use of data can improve student learning,

NSW School Education: NAPLAN, Measurement and Performance
33
The committee does not believe that the current administration of NAPLAN leads to it being as effective a diagnostic test as it could be. … [T]he principal consideration is the length of time the results take to be disseminated to the students and teachers. The school year moves at a rapid pace and the turnaround of many months does not allow for meaningful intervention to ensure that students across the spectrum of development are given the appropriate support they require, either to meet minimum standards or to challenge them to reach their full potential.
For this reason, the Senate Committee recommended that ACARA continue investigating moving NAPLAN to an online testing format; with the “highest priority” given to the quick turnaround of test results based on achievable and measurable targets built into the online testing process.101
ACARA has said that online testing for NAPLAN will be implemented in schools from 2017, “with an opt-in period of two to three years, with all schools online by 2019.”102 With respect to the turnaround time for online test results, ACARA has indicated that:103
NAPLAN online will have the ability to return feedback about student performance to parents and teachers more quickly than is currently the case, with timeframes of around two weeks being a realistic option.
Online testing is not only expected to facilitate faster turnaround of results, it is also expected to facilitate the development of multi-stage tailored, or “adaptive”, testing; which involves a computer algorithm adjusting the difficulty of a test to match the ability of each student.104
ACARA’s proposed model of multi-stage tailored testing is illustrated in Figure 16:105
2015, Grattan Institute, pp 13–14
101 Senate Standing Committee on Education and Employment, Effectiveness of National Assessment Program — Literacy and Numeracy, 2014, Parliament House, Canberra, p v. Other recommendations include: ACARA incorporating the needs of students with disabilities or from non-English speaking backgrounds into the development of online testing; and ACARA monitoring NAPLAN data to ensure that it assists governments deliver targeted needs-based funding, rather than be used to create school league tables. See also: ACARA Online assessment research and online assessment. ACARA notes that online testing may enable a move from standardised testing to tailored (or adaptive) testing.
102 National Assessment Program, Managing the Changes, “When will students sit NAPLAN online tests?”
103 National Assessment Program, Managing the Changes, “How long will it take for NAPLAN online results to be issued to schools?”
104 National Assessment Program, NAPLAN online Fact Sheet, August 2015.
105 National Assessment Program, NAPLAN online Fact Sheet, August 2015.

NSW Parliamentary Research Service
34
Figure 16: ACARA’s proposed model of multi-stage tailored testing
The aims of tailored testing, which will move NAPLAN beyond a purely standardised test, are stated to include: delivering more engaging tests to all students, irrespective of ability; allowing more precise measurement of student proficiency across the whole ability range; and assessing a broader knowledge and wider range of curriculum content without increasing test length.106 As the Australian Government’s Department of Education and Training said in its recently released review of ACARA:107
For the immediate future, stakeholders are universally enthusiastic about the potential of online adaptive testing which they see as being transformational in its potential education benefits, bringing significant advantages to governments, schools, parents, teachers and students. As ACARA points out, online testing will align the NAP more closely with practice in schools, as students increasingly work on keyboards and in an online, digital environment. It will also improve the testing experience for students, with tailored tests providing teachers and schools with more targeted and detailed information on their students’ performance. Stakeholders see the benefits of online testing as giving more flexibility to schools, shifting the emphasis from testing to analysis and bringing real benefits for teachers with its adaptive test design (where the test difficulty is adjusted to students’ needs) and timely results. This will enhance the diagnostic function of the tests and so provide more support for teaching and learning in the classroom. … The online NAPLAN testing which is scheduled for introduction from 2017, on an opt-in basis over two to three years, is much anticipated, for its potential educational value and expected efficiencies.
106
National Assessment Program, NAPLAN online Fact Sheet, August 2015. 107
Departmental Report: Review of the Australian Curriculum, Assessment and Reporting Authority, 2015, Australian Government, Department of Education and Training, p 76.

NSW School Education: NAPLAN, Measurement and Performance
35
12. CONCLUSION
NAPLAN and, more generally, the measurement and testing approach it encapsulates have their critics. What is undeniable is the importance placed on such approaches by governments around the world, including in NSW, where NAPLAN is now used as a key measure of State educational performance. Indeed, it is the case that NAPLAN has become a landmark feature of the Australian and NSW education landscape.
NAPLAN has provided a baseline measure of national and State performance; its data has been used to quantify the effects of demographic, socio-economic and even environmental variables on educational outcomes; and it has informed the allocation of additional needs-based school funding.
NAPLAN is also used to promote an evidence-led approach to educational practice. For instance, NAPLAN has been employed to identify the key features of high value-add schools; and to suggest that particular reading, sporting and student wellness programs are associated with improved academic outcomes.
The proposed development of online testing, from 2017 onwards, is expected to enhance the current diagnostic utility of NAPLAN; by enabling results to be returned to schools and parents in a timelier manner and by facilitating the development of tailored testing.